
Modification of Natural Peat for Removal of Copper Ions from Aqueous Solutions


1
Laboratory of Ore-Forming Systems, Sobolev Institute of Geology and Mineralogy SB RAS, 3 Koptug Ave., 630090 Novosibirsk, Russia
2
Laboratory of Hydrogeochemistry and Geoecology, Tomsk Branch of the Trofimuk Institute of Petroleum Geology and Geophysics SB RAS, 4 Academic Ave., 634055 Tomsk, Russia
3
Laboratory of Mechanochemistry, Institute of Solid State Chemistry and Mechanochemistry SB RAS, 18 Kutateladze, 630090 Novosibirsk, Russia
4
Department of Geology and Geophysics, Novosibirsk State University, 1 Pirogova Str., 630090 Novosibirsk, Russia
*
Author to whom correspondence should be addressed.
Water 2022, 14(13), 2114; https://doi.org/10.3390/w14132114
Submission received: 29 May 2022
/
Revised: 26 June 2022
/
Accepted: 29 June 2022
/
Published: 1 July 2022
(This article belongs to the Special Issue Wastewater Treatment via the Adsorption Method)
Abstract
:This study aimed at estimating peat adsorption properties for copper ion removal from aqueous solutions during peat modification. Two peat modifications have been studied using batch tests and quantitatively reproduced with instrumental analysis by using spectrometric, potentiometric, and thermodynamic modeling methods. The first variation—mechanical activation—was carried out in a planetary mill; for the second one—mechanochemical activation—dry sodium percarbonate (Na2CO3·1.5H2O2) was added. The adsorption of copper ions was studied in the concentration range from 10–150 mg/L with an interaction time from 0.25–12 h. Both modifications led to significant changes in the interaction energy in the adsorption layer; thus, the acceptor properties of macromolecules were enhanced from natural peat to mechanically activated peat and mechanochemically activated peat. FTIR spectra, specific surface area characteristics, and sorption experiments show the predominantly chemical nature of copper sorption. Maximum adsorption capacity was determined to be 24.1, 42.1, and 16.0 mg/g for natural peat, mechanically activated peat, and mechanochemically activated peat, respectively. The example of peat mechanochemically oxidized with Na2CO3·1.5H2O2 shows that the improvement in the physicochemical properties (CBET and specific surface area) plays a smaller role in the sorption capacity in relation to copper ions than the presence of phenolic and carboxyl groups, the content of which decreases during oxidation.
1. Introduction
Despite the intention to switch to waste-free and environmentally friendly production, many industries still produce wastes containing toxic and carcinogenic organic and inorganic compounds. Wastewater often contains high concentrations of heavy metals, exceeding permissible standards. In such concentrations, heavy metals exhibit toxic properties and are not biodegradable. On the other hand, environmental regulations now require the treatment of contaminated waters before they can be discharged into receiving waters. The toughening of environmental laws and increased control in the field of nature management has propelled the search for reliable methods of wastewater treatment.
It is suggested that adsorption is one of the best methods, not only because of its simplicity and potential for regeneration but also because it is a cost-effective and environmentally friendly technology for removing heavy metals from wastewater [1,2,3,4,5,6,7,8,9,10]. Various materials have been suggested for use as a sorbent for contaminated water, including clay minerals, zeolites, zero-valent iron, polymers, activated carbon, adsorption resin, and natural organic materials. Recently, great attention has been paid to the sorbents based on natural materials as the cheapest and most effective due to their wide distribution in nature and availability. Among organic materials, peat is a common sorbent due to its availability, low cost, and high sorption effectiveness for the removal of different substances from solutions, including organic compounds and heavy metals [11,12,13,14,15,16,17]. There are numerous studies regarding peat sorption capacity towards dissolved metals, nutrients, suspended solids, oils, etc. [5,13,15,16,18,19,20,21]. Various mechanisms including ion exchange, complexation, chemisorption, and surface adsorption have been proposed by researchers [18,21,22]. It is established that the sorption properties of peat depend on the highly developed porosity and a presence of various functional groups. The polar characteristics imparted by the presence of these functional groups are responsible for binding metal to the peat surface [6,18,23,24]. Humic acids (HA) are the most active components of peat since they comprise the most important component of organic matter for ion exchange, complexation, and other sorption interactions [25,26]. Humic substances in peat form the strong bonds with heavy metals and can be used as an effective geochemical barrier [19,27,28,29].
The development of new cheaper adsorbents with high efficiency based on natural materials become a must for many industries [5,8,9,10,11]. Many papers have been published on the use of modified materials for the removal of heavy metal ions from aqueous media [17,30,31,32]. It is known that mechanochemical treatment in the presence of different reagents (acid–base, redox, and ferments) leads to the change in the contents of physicochemical properties and reactivity of the main components of peats and, in particular, HA [33,34,35,36]. Chemical treatment of biosorbents is normally used to enhance their physico-chemical properties and to improve their sorption capacity. Furthermore, this kind of treatment can improve the properties of sorbents such as wettability and homogeneity and help to address the challenge of treating wastewater, which existing conventional treatment methods are unable to do [6]. There is available data on the possible solid-state mechanochemical reactions in peats leading to particle size reduction and microcomposite formation. They allow for a five-to-seven-time enhancement of water-soluble component extraction, as well as humic acid yield intensification, due to the break of chemical bonds (for example, C-O glycosidic), air oxidation in the process of the mechanical treatment, and increase in the hydrophilic group content in HA [37]. The direction and extent of mechanochemical transformations depend on the physicochemical properties of peat and the nature of chemical reagents in a reaction mixture.
The study aimed at estimating peat adsorption properties for copper ion removal from aqueous solutions during its modification, identifying physical and chemical changes that occur during the mechanochemical treatment of peat with a solid-phase oxidizer—sodium percarbonate and determining the characteristics of peat, the most critical for the sorption. Adsorption isotherm study and thermodynamic modeling have been undertaken to extrapolate and use these properties without significant costs for industrial and scientific needs.
2. Materials and Methods
2.1. Materials
In this study, Ubinskoe peat moss (NP) collected from the forest steppe area in Western Siberia, Russia (55°18.211′ N, 79°42.711′ E) was used as absorbent material. The site consisted of an oligotrophic and acidic Sphagnum peatland (bog). The samples were extracted from a depth of 60 cm, stored in slider bags, and delivered immediately to the laboratory.
2.2. Mechanical and Mechanochemical Treatment
The mechanical activation of peat (sample MAP) was carried out in an AGO-2 laboratory planetary mill with water-cooling. The mass of the ball charge was 200 g, the acceleration of the grinding bodies at the moment of separation from the walls of the grinding chamber was 200 m/s2, the exposure time was 2 min. The mechanochemical activation of peat (sample MCAP) was carried out under the same conditions with the addition to the reaction mixture of 5 wt% dry Na2CO3·1.5H2O2, which had previously shown its effectiveness in the mechanochemical oxidation of HA of brown coal [38,39,40,41].
2.3. Technical, Structural and Morphological Analysis
The moisture content of the analyzed samples was measured gravimetrically by drying at 130 °C to constant weight (weight difference <0.1% for 3 min) on a moisture meter WPS 50 SX (RADWAG, Radom, Poland) using a halogen lamp as a heating element.
The ash content was measured using a muffle furnace at 550 °C according to the TAPPI T 211 om-02 test method.
The structural properties of natural peat (NP), mechanically activated peat (MAP), and mechanochemical activated peat (MCAP) were characterized by X-ray diffraction (XRD) analysis on a D8 Advance powder diffractometer (Bruker, Karlsruhe, Germany) with monochromatic CuKα (wavelength, 1.5406 Å) in the Bragg–Brentano geometry. Step size was 0.0195°. The analysis was conducted in a range of 2θ angles (5–60°) at a voltage of 40 kV and current of 40 mA. The XRD patterns were analyzed using the ICDD PDF-2 database.
The particle morphology of samples (NP, MAP, and MCAP) were studied by scanning electron microscopy (SEM) on a ТМ-1000 microscope (Hitachi, Tokyo, Japan) at an accelerating voltage of 15 kV. A gold coating was deposited on the sample surface to remove the accumulated charge (ion current—30 mA; spray time—40 s).
Determination of the content of functional groups was achieved by means of inverse potentiometric titration using a laboratory pH-meter Anion 4100 (Infraspak-Analyte, Novosibirsk, Russia) combined with a glass pH-electrode (Mettler Toledo, Greifensee, Switzerland), according to the method described [40]. The method was modified and adapted for peat HA.
FTIR-spectra were recorded with a Vector-22 IR-Fourier spectrometer (Bruker, Karlsruhe, Germany) in KBr tablets at a ratio of 150:1 from 400 cm−1 to 4000 cm−1.
The contents of alkali-soluble and water-soluble acids (HA and fulvic acids (FA), respectively) were determined according to GOST (State Standard 9517-94 (ISO 5073:2013).
After the water content measurement, the peat samples were dried at room temperature, homogenized, and passed through a 250-µm mesh sieve. The biomass was then stored in a dry box for future use.
2.4. X-ray Fluorescence Analysis
Analysis of Si, Ca, Al, S, Mg, Fe, and Na was performed by X-ray fluorescence analysis on an X-ray fluorescence spectrometer ARL 9900 XL (Thermo Fisher Scientific, Waltham, MA, USA) at the Institute of Geology and Mineralogy, Siberian Branch, Russian Academy of Sciences (IGM SB RAS).
The copper content in solid samples before and after the experiments was measured by synchrotron radiation X-ray fluorescence mapping with a Si(Li)-detector INCAPentaFET-x3 (Oxford Instruments plc, Abingdon, UK) on Beamline “Local and scanning X-ray fluorescent element analysis” at VERR-3 at the Budker Institute of Nuclear Physics of the Siberian Branch of the Russian Academy of Sciences (BINP SB RAS).
2.5. Inductively Coupled Plasma-Atomic Emission Spectroscopy (ICP-AES)
Solutions before and after interaction with sorbents were analyzed by ICP-AES on an iCAP ProXP Duo spectrometer (Thermo Fisher Scientific, Waltham, MA, USA) at the IGM SB RAS.
2.6. Surface Properties
2.7. Adsorption Experiments and Calculations
Weighed 0.5 ± 0.001 g of peat were mixed with 50 ± 0.01 mL aliquots of the Cu(NO3)2 model solutions that contained 10, 25, 50, 100, and 150 mg/L of copper. The 250-mL batches were placed on a magnetic stirrer for a different period of time (15 min, 30 min, 2 h, 4 h, 8 h, 12 h) at ambient conditions. Following the reaction time, the solid residue was separated from the solution by centrifugation at 7800 rpm for 10 min. The pH, redox potential (ORP), conductivity, and temperature were immediately measured after the experiment. After that, the sorbent was dried in the open air, the suspensions were filtered through 0.45 μm cellulose filters, then acidified with nitric acid, and analyzed.
The results are given in terms of removal percent (R, %) and distribution ratio, and KD (mL/g), which were calculated from the Equations (1) and (2) [44,45]:
where
%R = 100 ∗ (C0 − Ce)/C0,
KD = qe/Ce,
- C0 is initial concentration of copper ions in solution (mmol/L);
- Ce is the equilibration concentration of copper in solution (mmol/L);
- qe is the amount of copper sorbed by peat at equilibrium time (mg/g).
The Langmuir equation is theoretically derived from simple mass-action kinetics, assuming chemisorption [46]. The linearized form of the Langmuir equation has been used to analyze the obtained adsorption results [45,47]:
where
Ce/qe = 1/KL · Q + Ce/Q,
- Ce and qe have the same definition as mentioned above;
- Q is the adsorption maximum (mmol/g);
- KL is a constant related to the intensity of adsorption (L/kg of peat).
The Freundlich isotherm is empirical and has been derived by assuming a heterogeneous surface with a nonuniform distribution of the heat of adsorption over the surface [48]. The linear expression of this isotherm can be written as [45,49]:
where
log qe = log Kf + (1/n) log Ce,
- qe and Ce have the same definition mentioned before;
- Kf and 1/n are positive valued adjustable parameters.
The parameter 1/n is varied between zero and one and it is a measure of the heterogeneity of adsorption sites on the surface of the adsorbent.
2.8. Thermodynamic Calculations
Calculations were performed in the heterophas 5-component system H–O–Cu–N–Ark-COOH at 25 °C and a total pressure of 1 atm by the GIBBS algorithm and UNITHERM database of the “HCh” software [50]. Here, Ark-COOH is a quasi-element with a Gibbs free energy of formation equal to zero. This quasi-element simulated the condensed ring of the corresponding acids (Ark) and peripheral acid groups of different types, mainly carboxyl (–COOH). These elemental structures are assumed to determine total acidity and to provide the formation of complexed compounds of peat HA with the main ions of natural water and heavy metals in particular.
A discrete site-specific nonelectrostatic model of the interactions of a Cu ion with FA and HA, is applied to the experimental data modeling. Copper binding is described with a site density (mmol/g) and two intrinsic equilibrium constants: dissociation of the carboxyl groups (–COOH) and association of the Cu2+ with –COOH.
3. Results and Discussion
3.1. Characterization of Sorbents
Peat is a very heterogeneous material composed with a majority of organic compounds and detrital minerals. Metal(oid) concentrations, pH, and electrical conductivity (EC) detected in natural peat prior to the experiments are presented in Table 1. It is considered that the humidity and the saturated soil water content in Sphagnum peat are the highest. The moisture content of the peat moss is 92.7%, the ash content is 2.2%. At the same time, the bog water pH is 4.0 (slightly acidic). Peat properties reflect the peat-forming environment and the types of peat-forming plant. Among the elemental compositions of peat ash, the major elements Si, Ca, Al, S, Mg, Fe, and Na account for approximately 90% of the total elements of the ash. The content of Cu does not exceed 14 ppb. The content of organic substances in dry matter was observed at 97.8%.
The results of elemental composition (C, H, N, and S), shown in Table 2, indicate significant similarity between the peat with those presented in the literature. The composition of peat varies depending on botanical composition, age, climate, and other environmental factors. Composition of C, H, and N revealed the H/C ratio of 1.5. The H/C ratio is associated with the degree of aromaticity; the lower the ratio, the greater the presence of aromatic compounds. C/N ratio correlates with the humification degree of peat, where a low C/N ratio usually indicates a high humification degree, and vice versa [51]. In our case, the ratio was 91.1.
The surface morphology of the natural peat (NP) and the sorbents obtained after modification (MAP and MCAP) were characterized by scanning electron microscopy (Figure 1). The morphology of the natural peat is represented by the remnants of plant tissues with a large number of conducting vessels and pores (Figure 1a) [30]. X-ray energy dispersive spectroscopy (EDS) data (TM1000 EDS detector (Hitachi, Tokyo, Japan), data not shown) indicate the following elements inherent in the peat composition: Al up to 1.5%, Si up to 1%, and Ca up to 0.51%. A microphotograph of the MAP sample (Figure 1b) shows a characteristic pattern of mechanically processed plant materials with signs of plastic grinding, the structure of the material stratifies, and the particles greatly decrease in size. Small amounts of iron chafing (Fe up to 0.36% (EDS, data not shown)) may occur during mechanical activation. For the MCAP sample (Figure 1c) under mechanochemical activation with Na2CO3·1.5H2O2, the formation of a large number of small particles capable of aggregation on the larger crushed particles of the original peat is observed. The appearance of Na up to 1% in the MCAP sample composition is observed (EDS, data not shown).
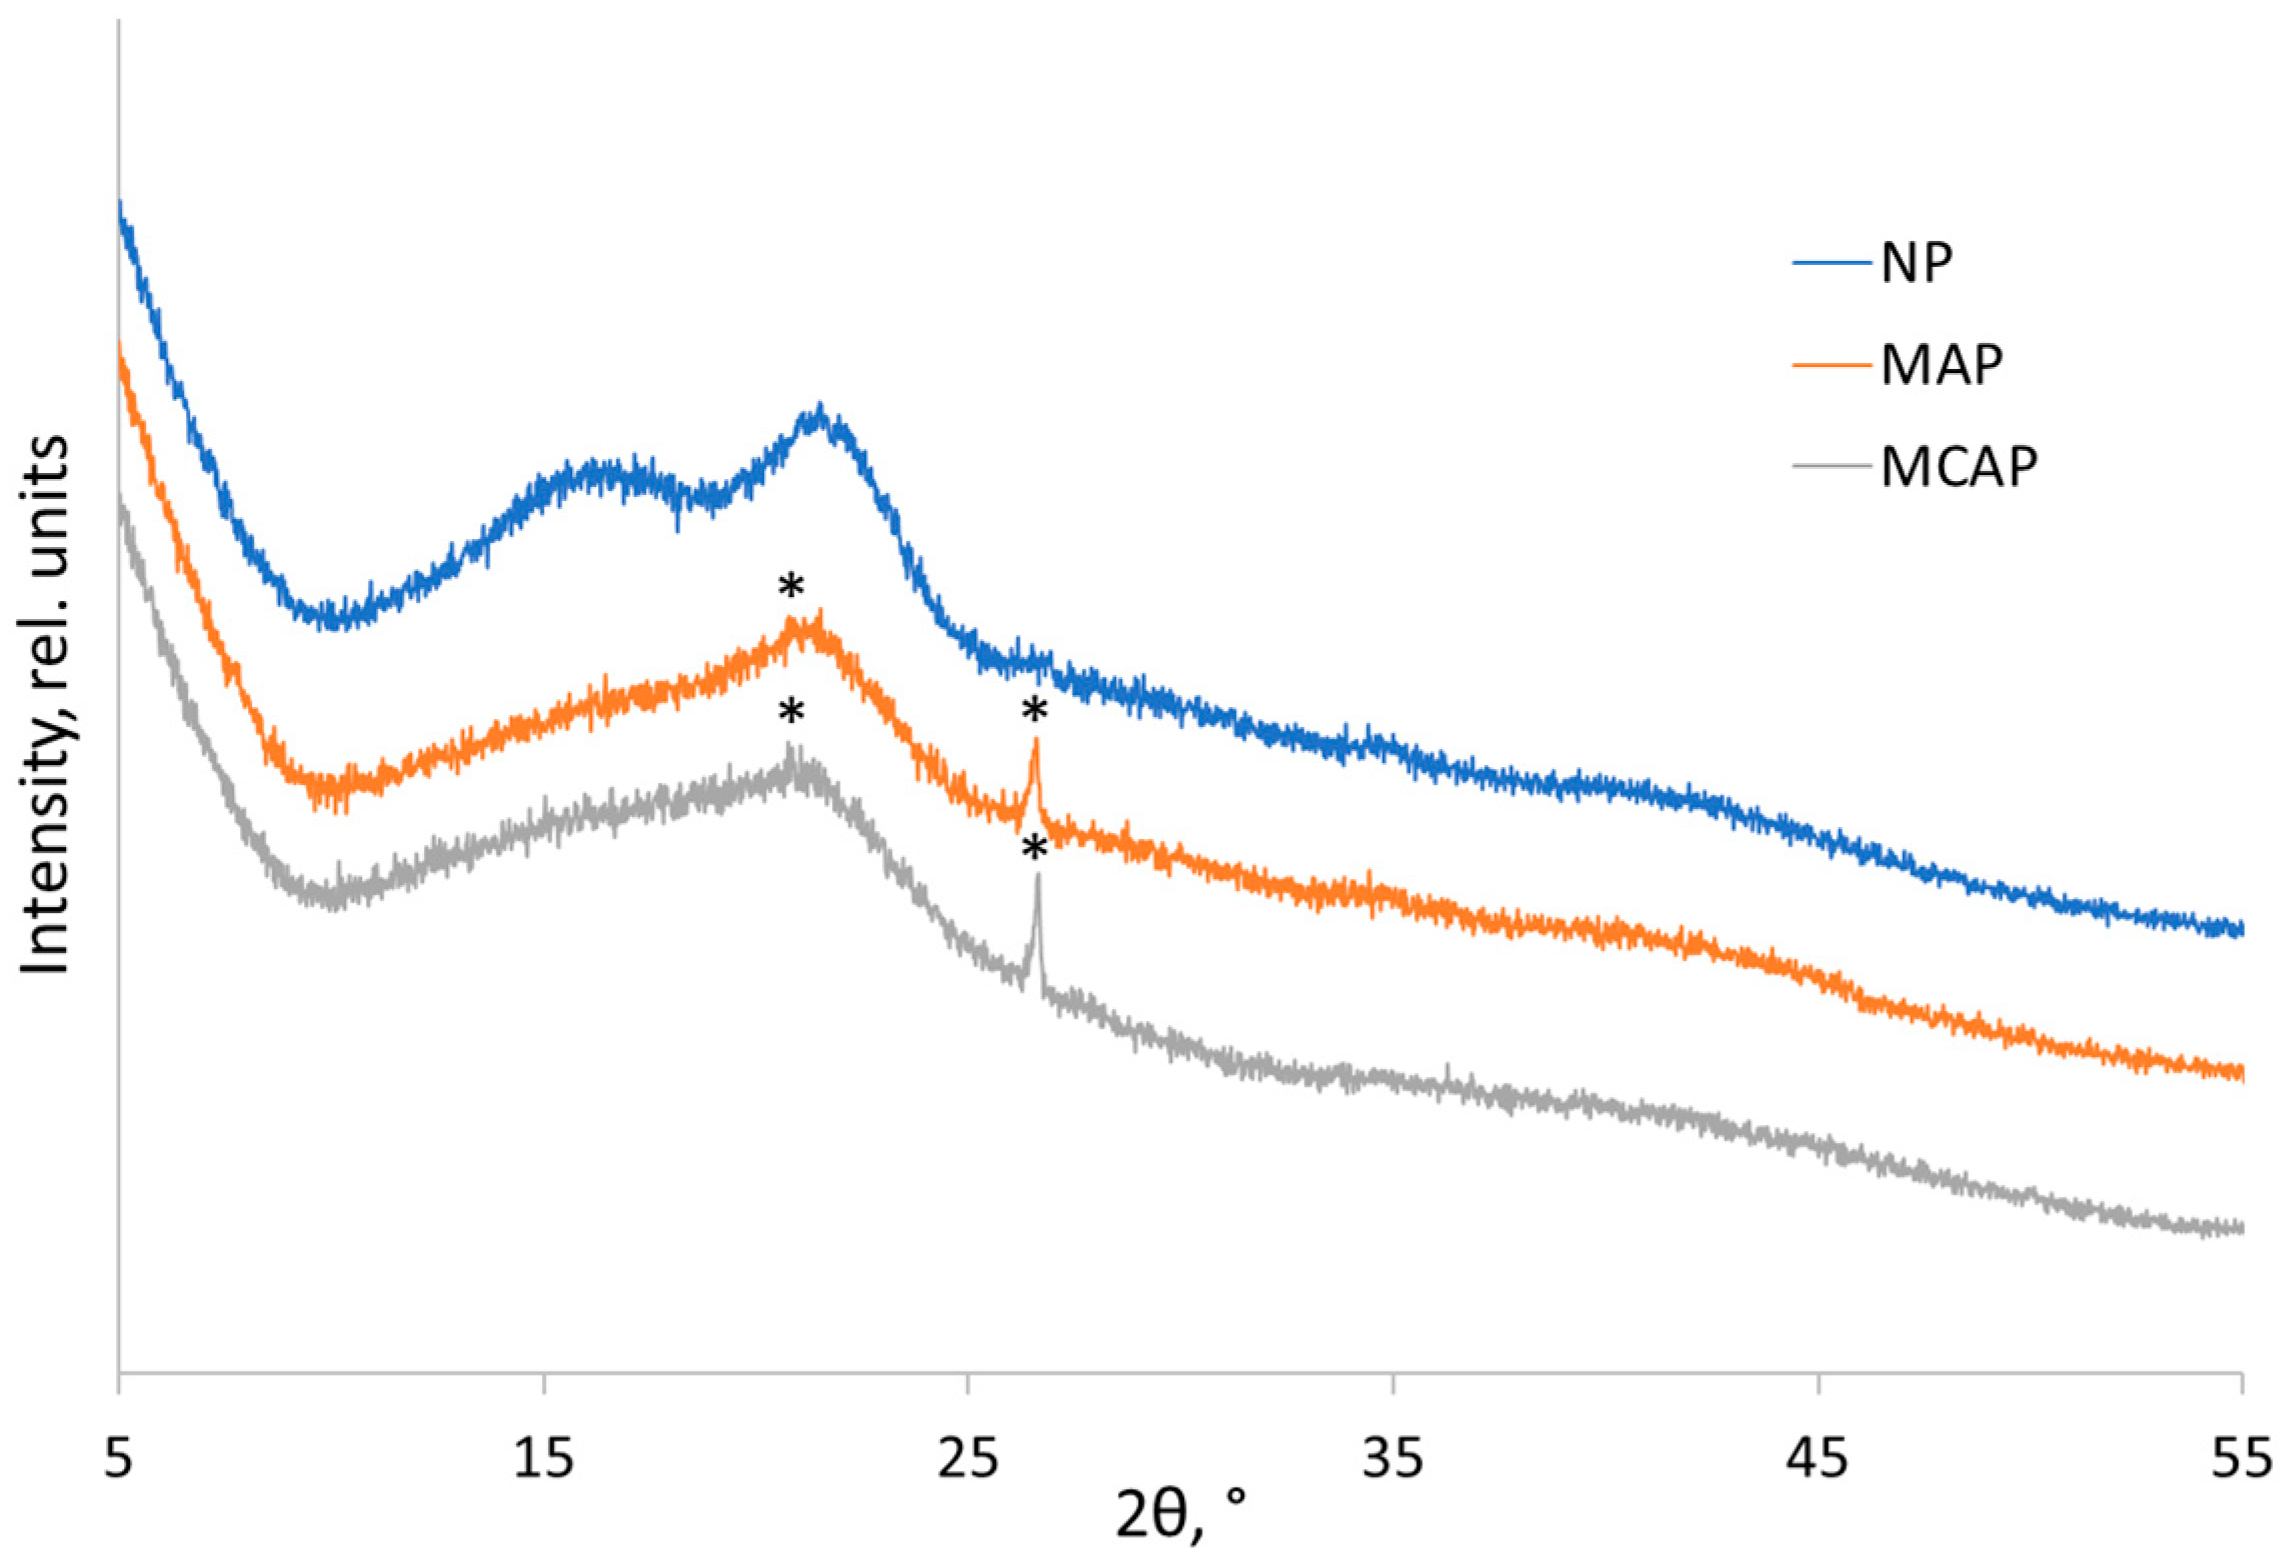
Figure 2 shows the X-ray diffraction patterns of NP, MAP, and MCAP. It is shown that peat has an amorphous-crystalline structure characteristic of plant polymers [32]. Mechanical and mechanochemical influence leads to the amorphization of the peat crystal structure. XRD patterns of MAP and MCAP identified the hexagonal quartz phase in the composition, which may be present in peat samples up to 1%.
As follows from the data presented in Table 3, both modifications of the peat sample led to significant changes in the interaction energy in the adsorption layer from 6.3 to 27.8. Differences in the values of the monolayer capacity and specific surface area indicate variations in the effects of mechanical and mechanochemical treatment of peat. The lowest specific surface area (BET method and Greg and Sing approximation) is a characteristic for the mechanically activated sample. The mechanochemical activation of peat in the presence of an alkaline oxidizing reagent results in increasing specific surface area and monolayer capacity, which may have an effect on the sorption capacity of the obtained sorbent.
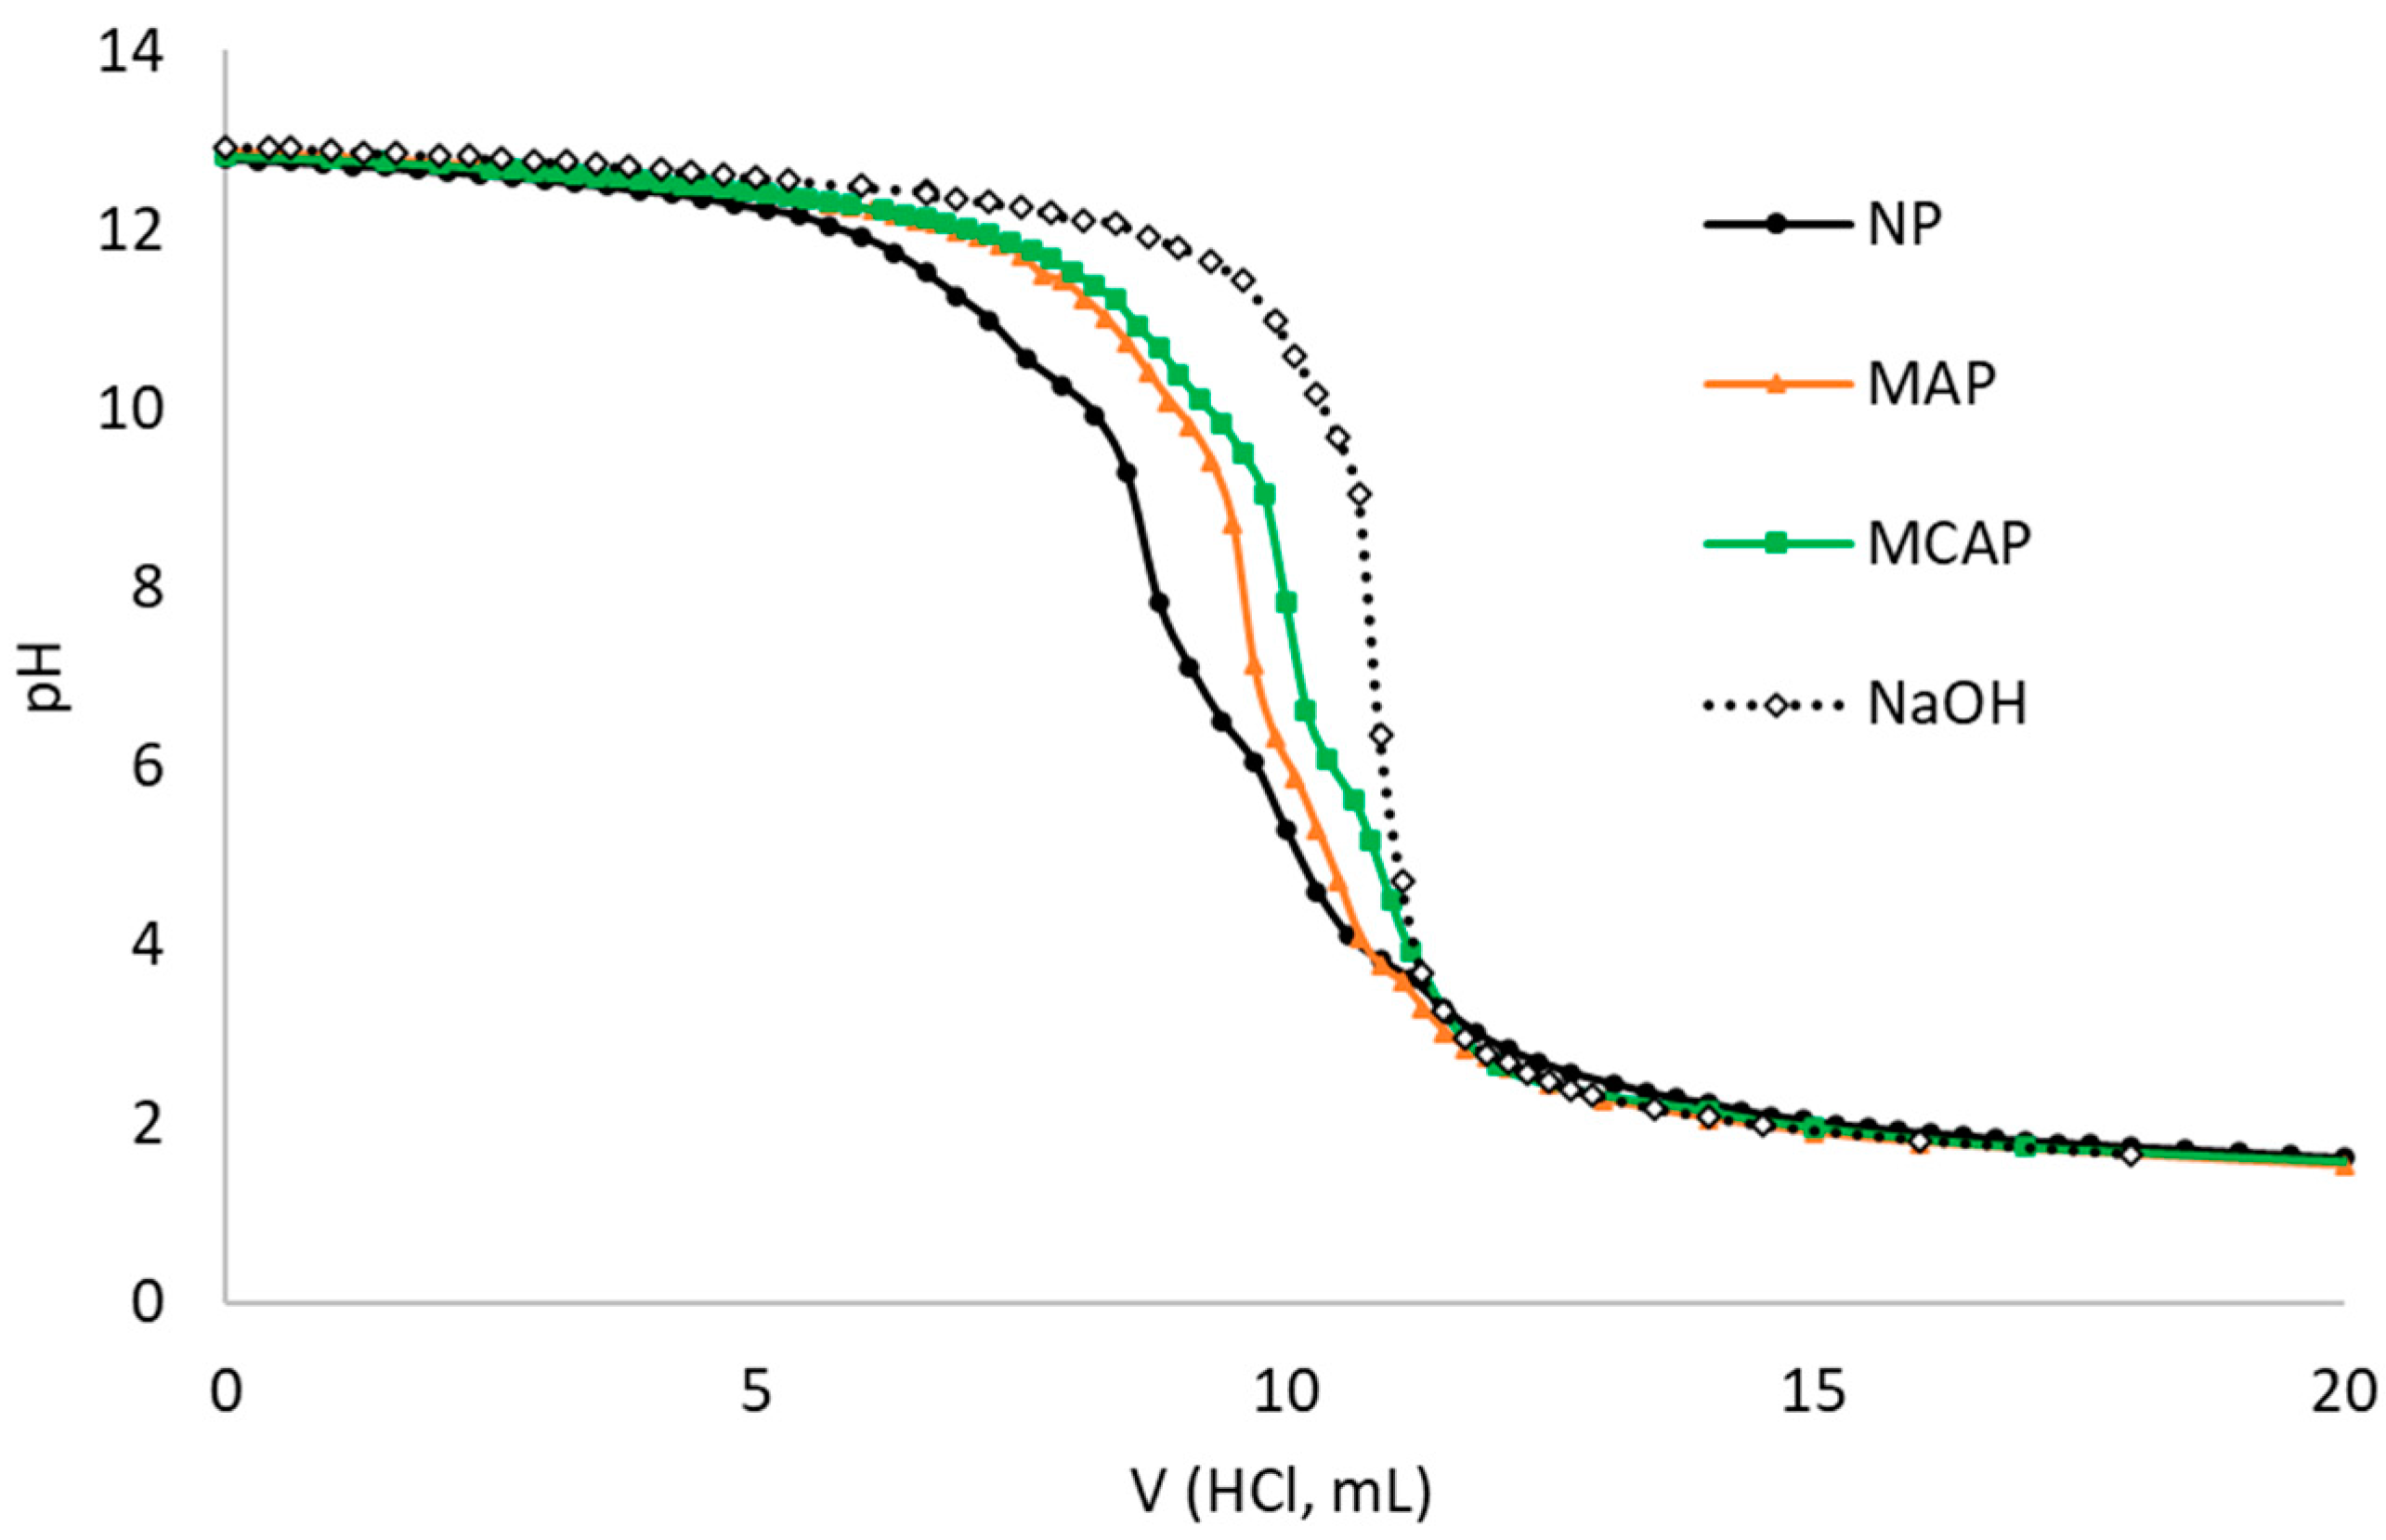
The curves of inverse potentiometric titration of the studied peat samples by 0.1 M HCl solution, as well as the similar curve for a blank sample presented by 0.1 M NaOH are given in Figure 3. In the regions of рН 10–11, рН 6.9–9.5, and рН 2.5–6.0, three titrated groups—phenolic hydroxyls Ph-OH, carboxyl groups at aromatic rings Ar-СОOН, and carboxyl groups in hydrocarbon chains Alk-COOH—were established. By various amounts of acid groups in the study samples, a curve is shifted in the region of the lower values of titrant addition. By the inflection points of the curves, related to the electrode potential drop, neutral points are found corresponding to all the three aforementioned groups. Calculated contents of functional groups are given in Table 4.
According to the potentiometric titration, similar ratios of phenolic and carboxyl groups are determined in all three samples, however, with a decrease in their number from NP to MCAP samples. Therefore, the number of acid groups decreases in the peat composition. Peat becomes more hydrophobic, i.e., acceptor properties of macromolecules are enhanced (reaction capacity with ions), which is consistent with data on the determination of energy characteristics (CBET and am) from Table 3. The solution pH and presence of different background electrolytes effectively influence the adsorption efficacy towards ion adsorption and sorbent zeta-potential [52]. Cations of the inorganic salts can bind with the peat surface and the surface becomes positive (Cu2+). The polarizability of the counter anions, such as NO3−, play a role in the variation of the surface charge of peat samples. The change in the surface charge of peat depending on the concentration of solution ions will be described in our following works.
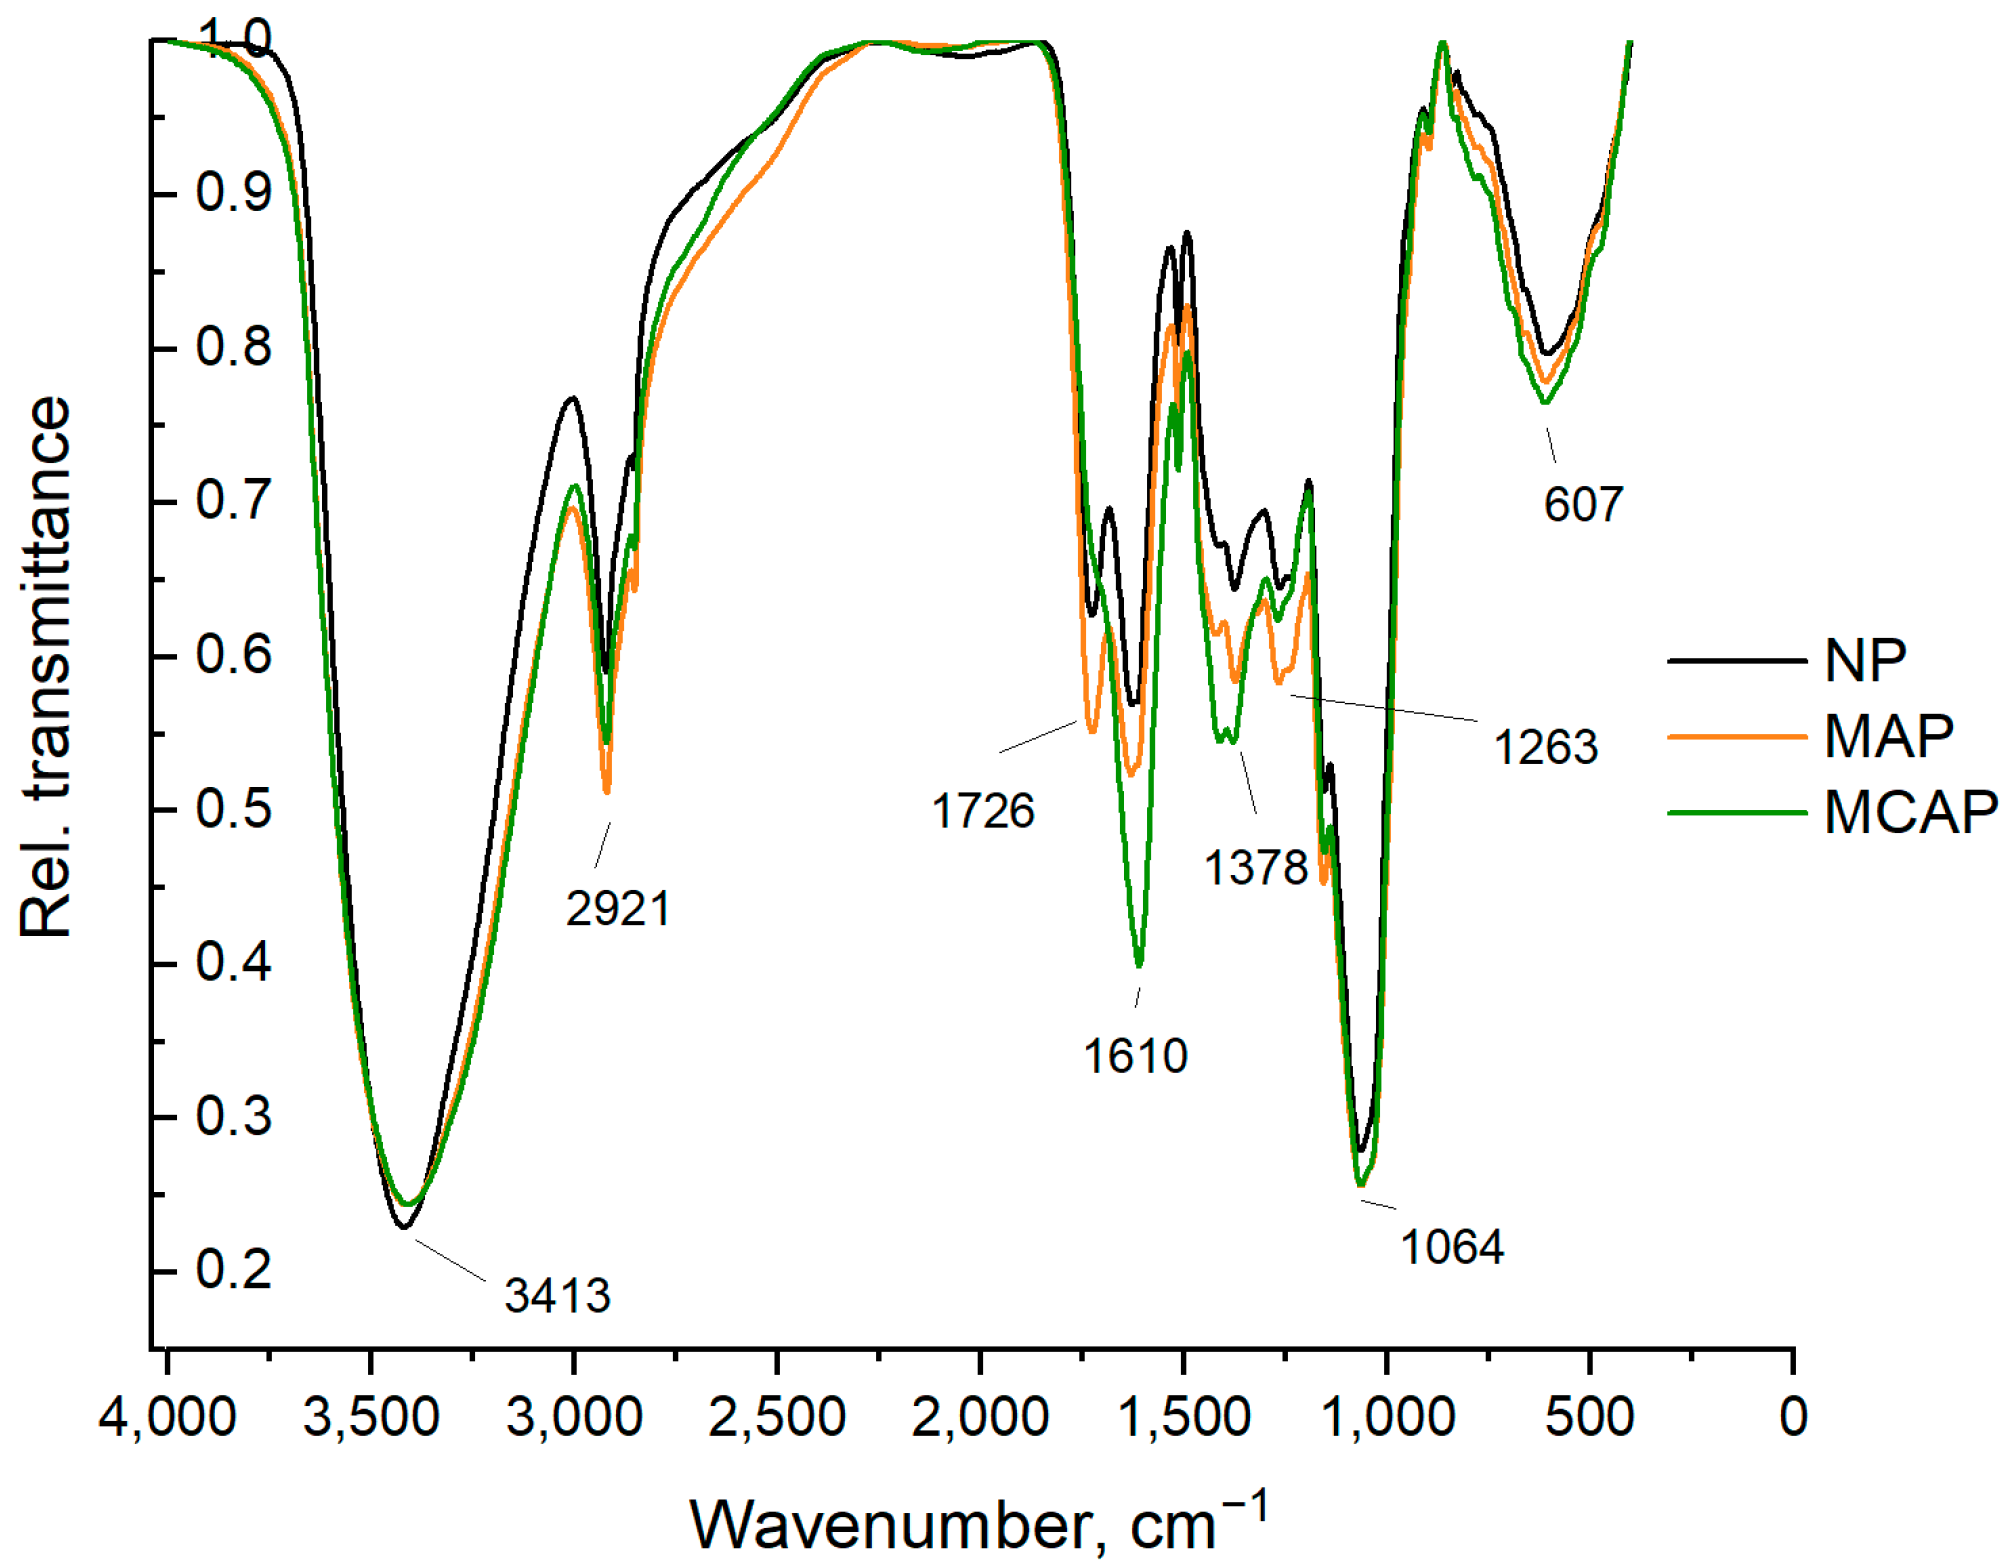
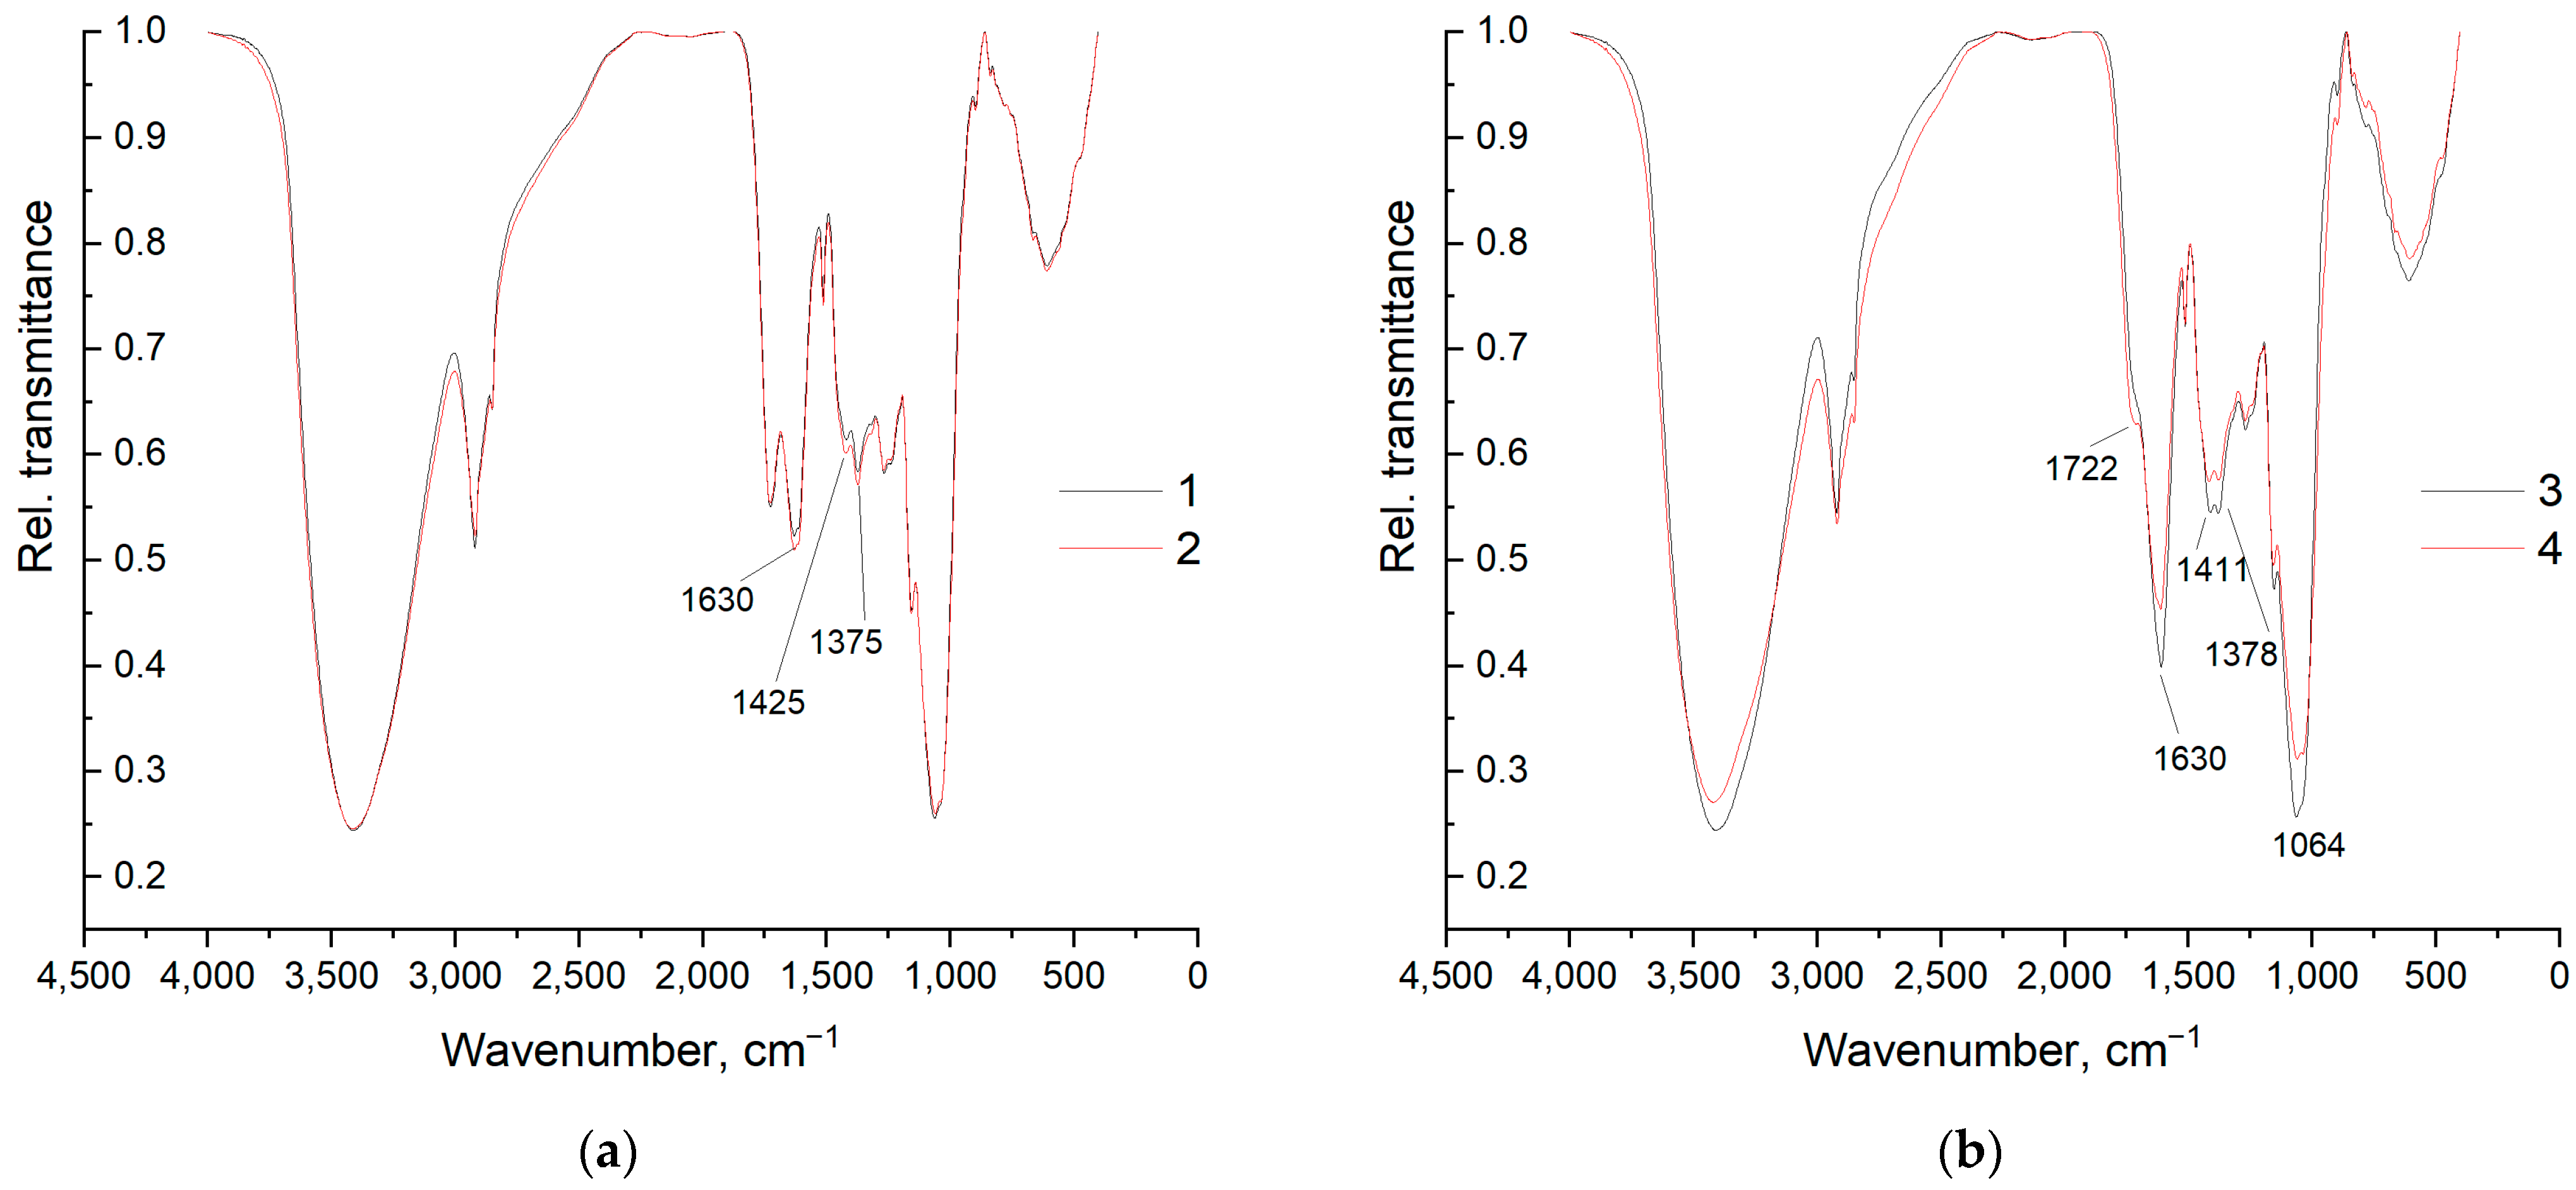
FTIR analysis revealed main functional groups in the composition of peat samples and indicated qualitative changes during the modification of natural peat (Figure 4). A broad absorption band with a maximum area from 3420–3400 cm−1 was assigned to the stretching vibrations of hydroxyl groups involved in intramolecular and intermolecular hydrogen bonds. The bands at 2925 and 2855 cm−1 are ascribed to the asymmetric and symmetric C–H stretching of methylene and methyl (CH2 and CH3) groups.
The band from 1710–1725 cm−1, corresponding to the C=O-stretching vibrations of mainly carboxyl groups and other oxygenated functionalities, usually has high intensity in HA spectra. The band from 1610–1625 cm−1, which refers to the stretching vibrations of the C=C conjugated groups in aromatic structures, including oxygen-containing groups such as quinones, hydroxylquinones, etc., as well as nitrogen-containing heterocycles. This region (1630 cm–1) is also responsible for bending vibrations of the O–H group of adsorbed water. The bands at 1515 cm−1 and 1420 cm−1 are attributed to skeletal vibrations of the lignin aromatic ring. Additionally, the bands at 1420 cm−1 and 1380 cm−1 are attributed to the asymmetric and symmetric bending vibrations of the C–H bond in methoxyl and methyl groups [53].
The band at 1270 cm−1, together with the band at 1235 cm−1, corresponds to skeletal vibrations of the aromatic ring and asymmetric stretching vibrations of the C–O bond in phenolic groups and aromatic ethers. The adsorption band in the area of 1156 cm−1 refers to the hydroxylic groups of alcohols, the bands of 1065 and 1036 cm−1 refer to the stretching vibrations of the C–O bond in the stretching of polysaccharidic structures [54]. For the MAP sample, the absorption bands of the O–H groups are shifted to the area of lower frequencies indicating a distinct intramolecular nature of hydrogen bonds and ordered structure. For the MCAP sample, the band in the area of 1724 cm−1, corresponding to the carboxyl group vibrations, is not separately detected, merging with the band from 1610–1612 cm−1 and presenting on it in the form of a shoulder, which may be partly due to the oxidation during the mechanochemical treatment [55]. Such samples are usually humate, not humic acid. A decrease in absorption in the regions of 1725 and 1260 cm−1, with a simultaneous increase in the area of 1613 and 1418 cm−1, indicates the passage of a chemical reaction of neutralization of acidic groups of HA and their conversion into the form of sodium humate as a result of the mechanochemical treatment of peat with Na2CO3·1.5H2O2.
3.2. Adsorption Experiments
3.2.1. Adsorption Studies of Cu(II) on Natural and Modified Peat
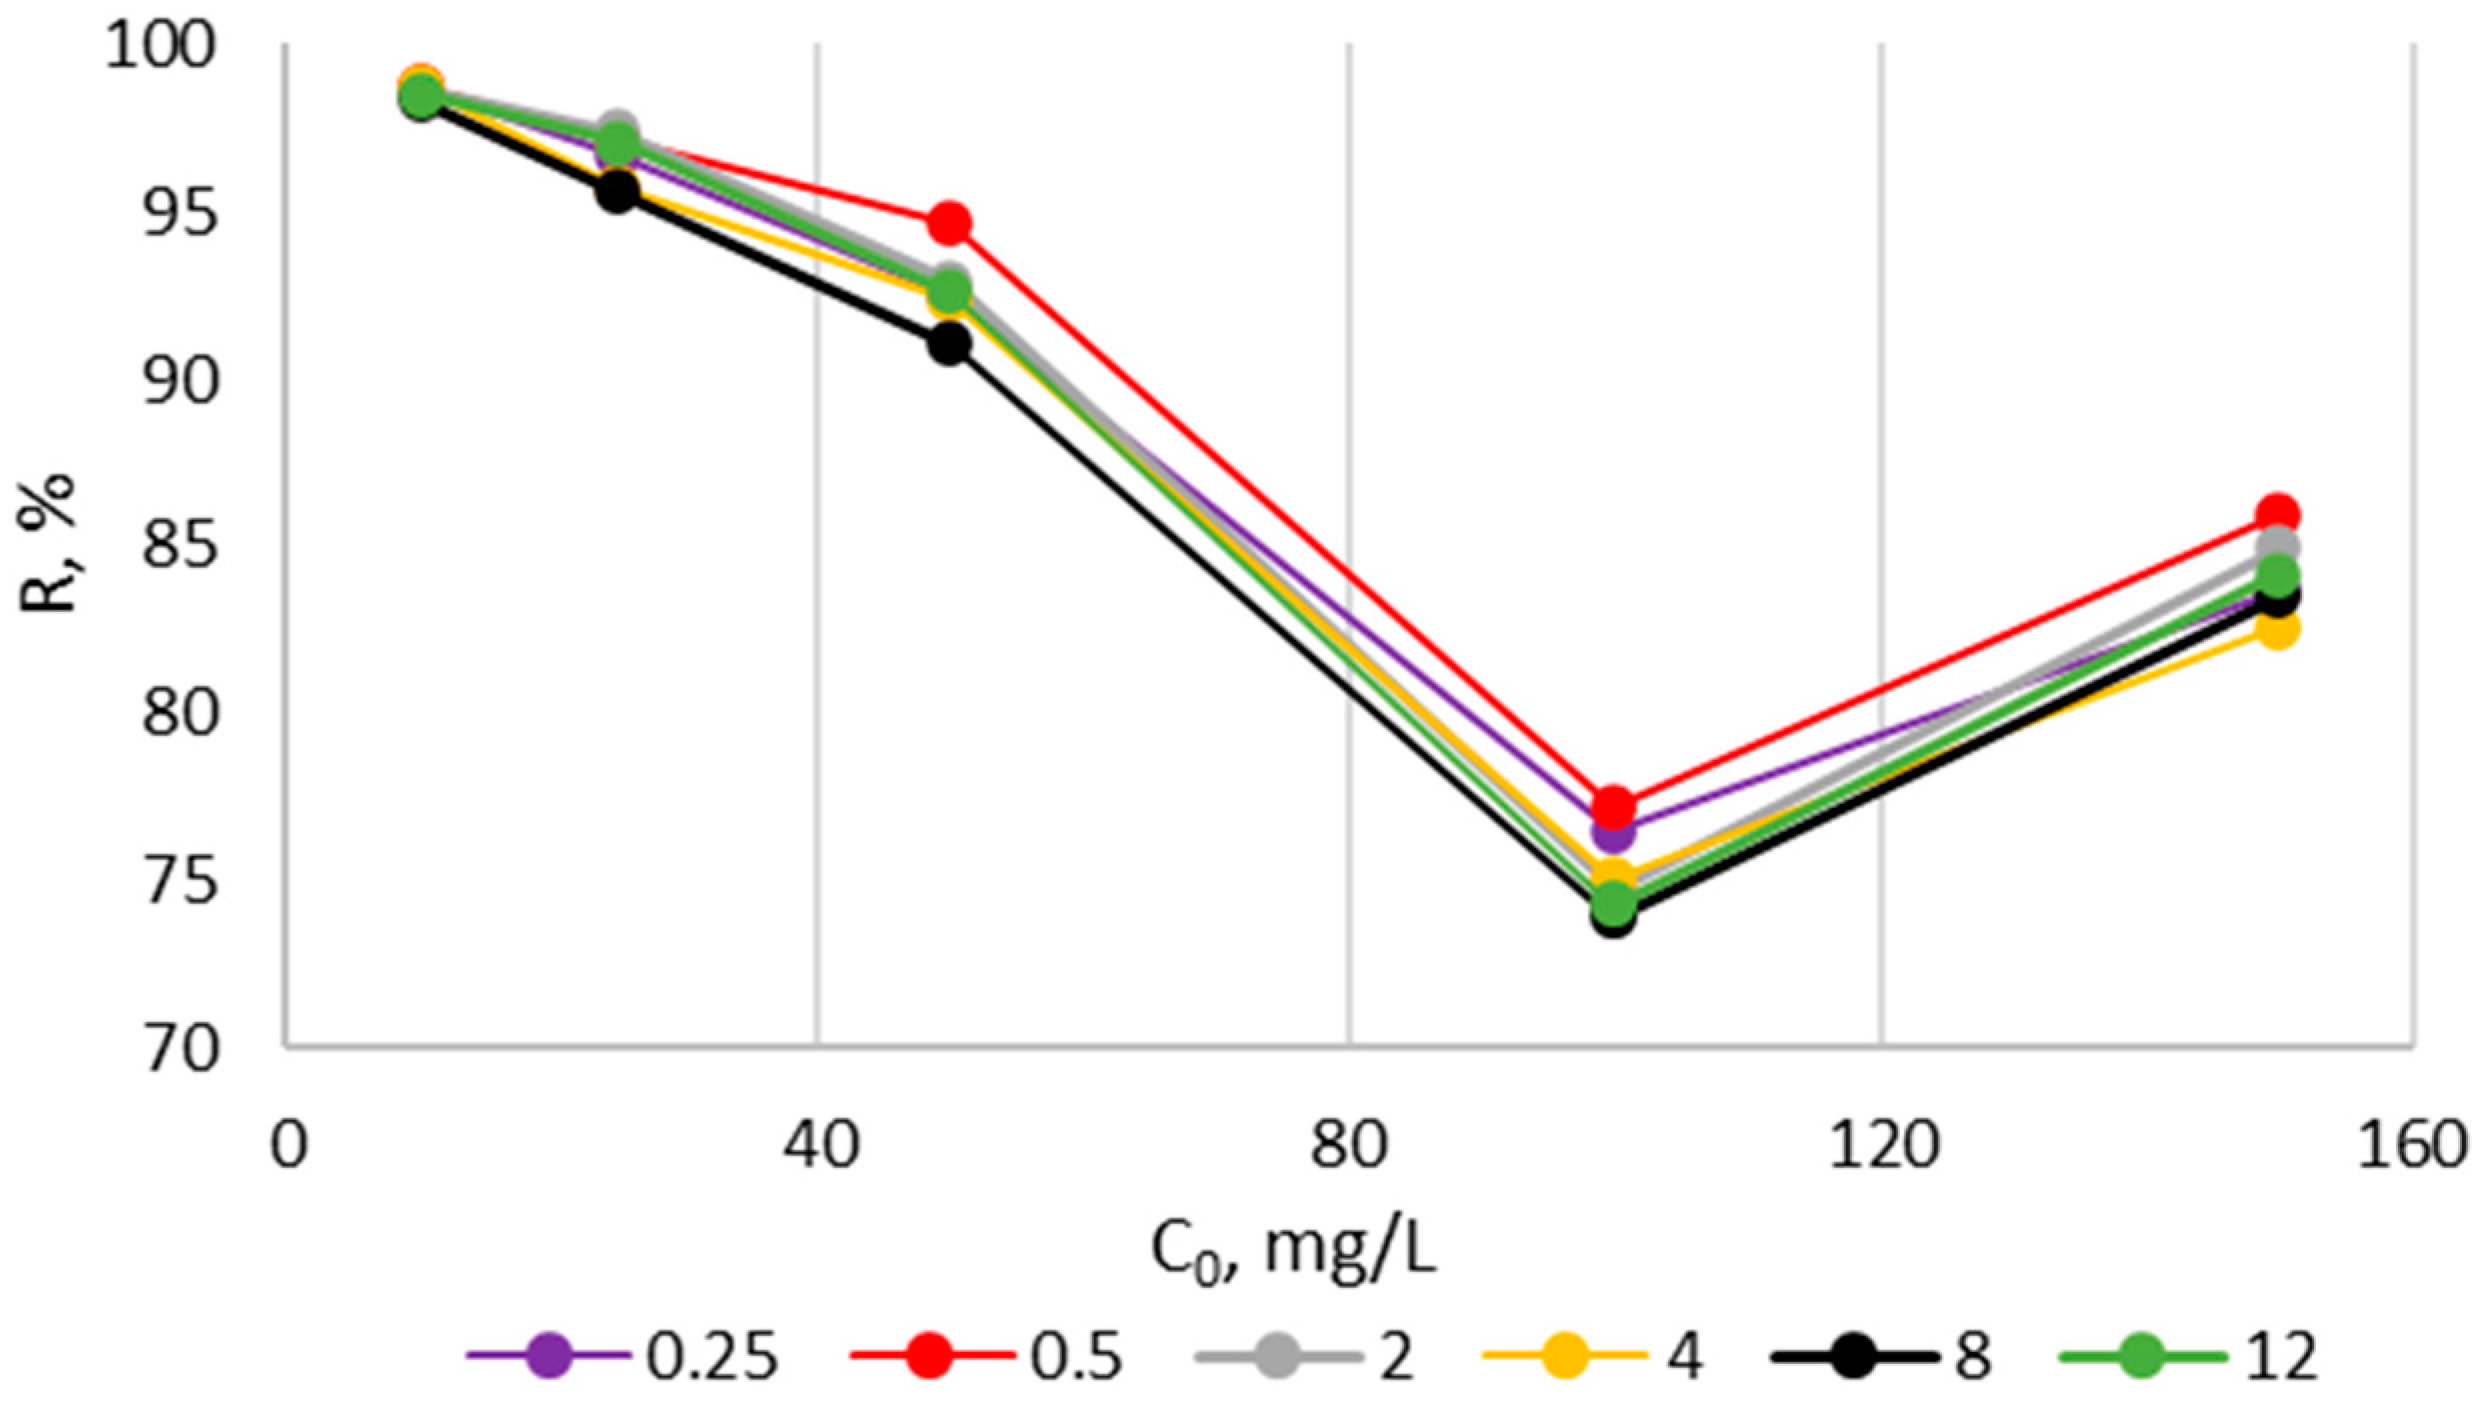
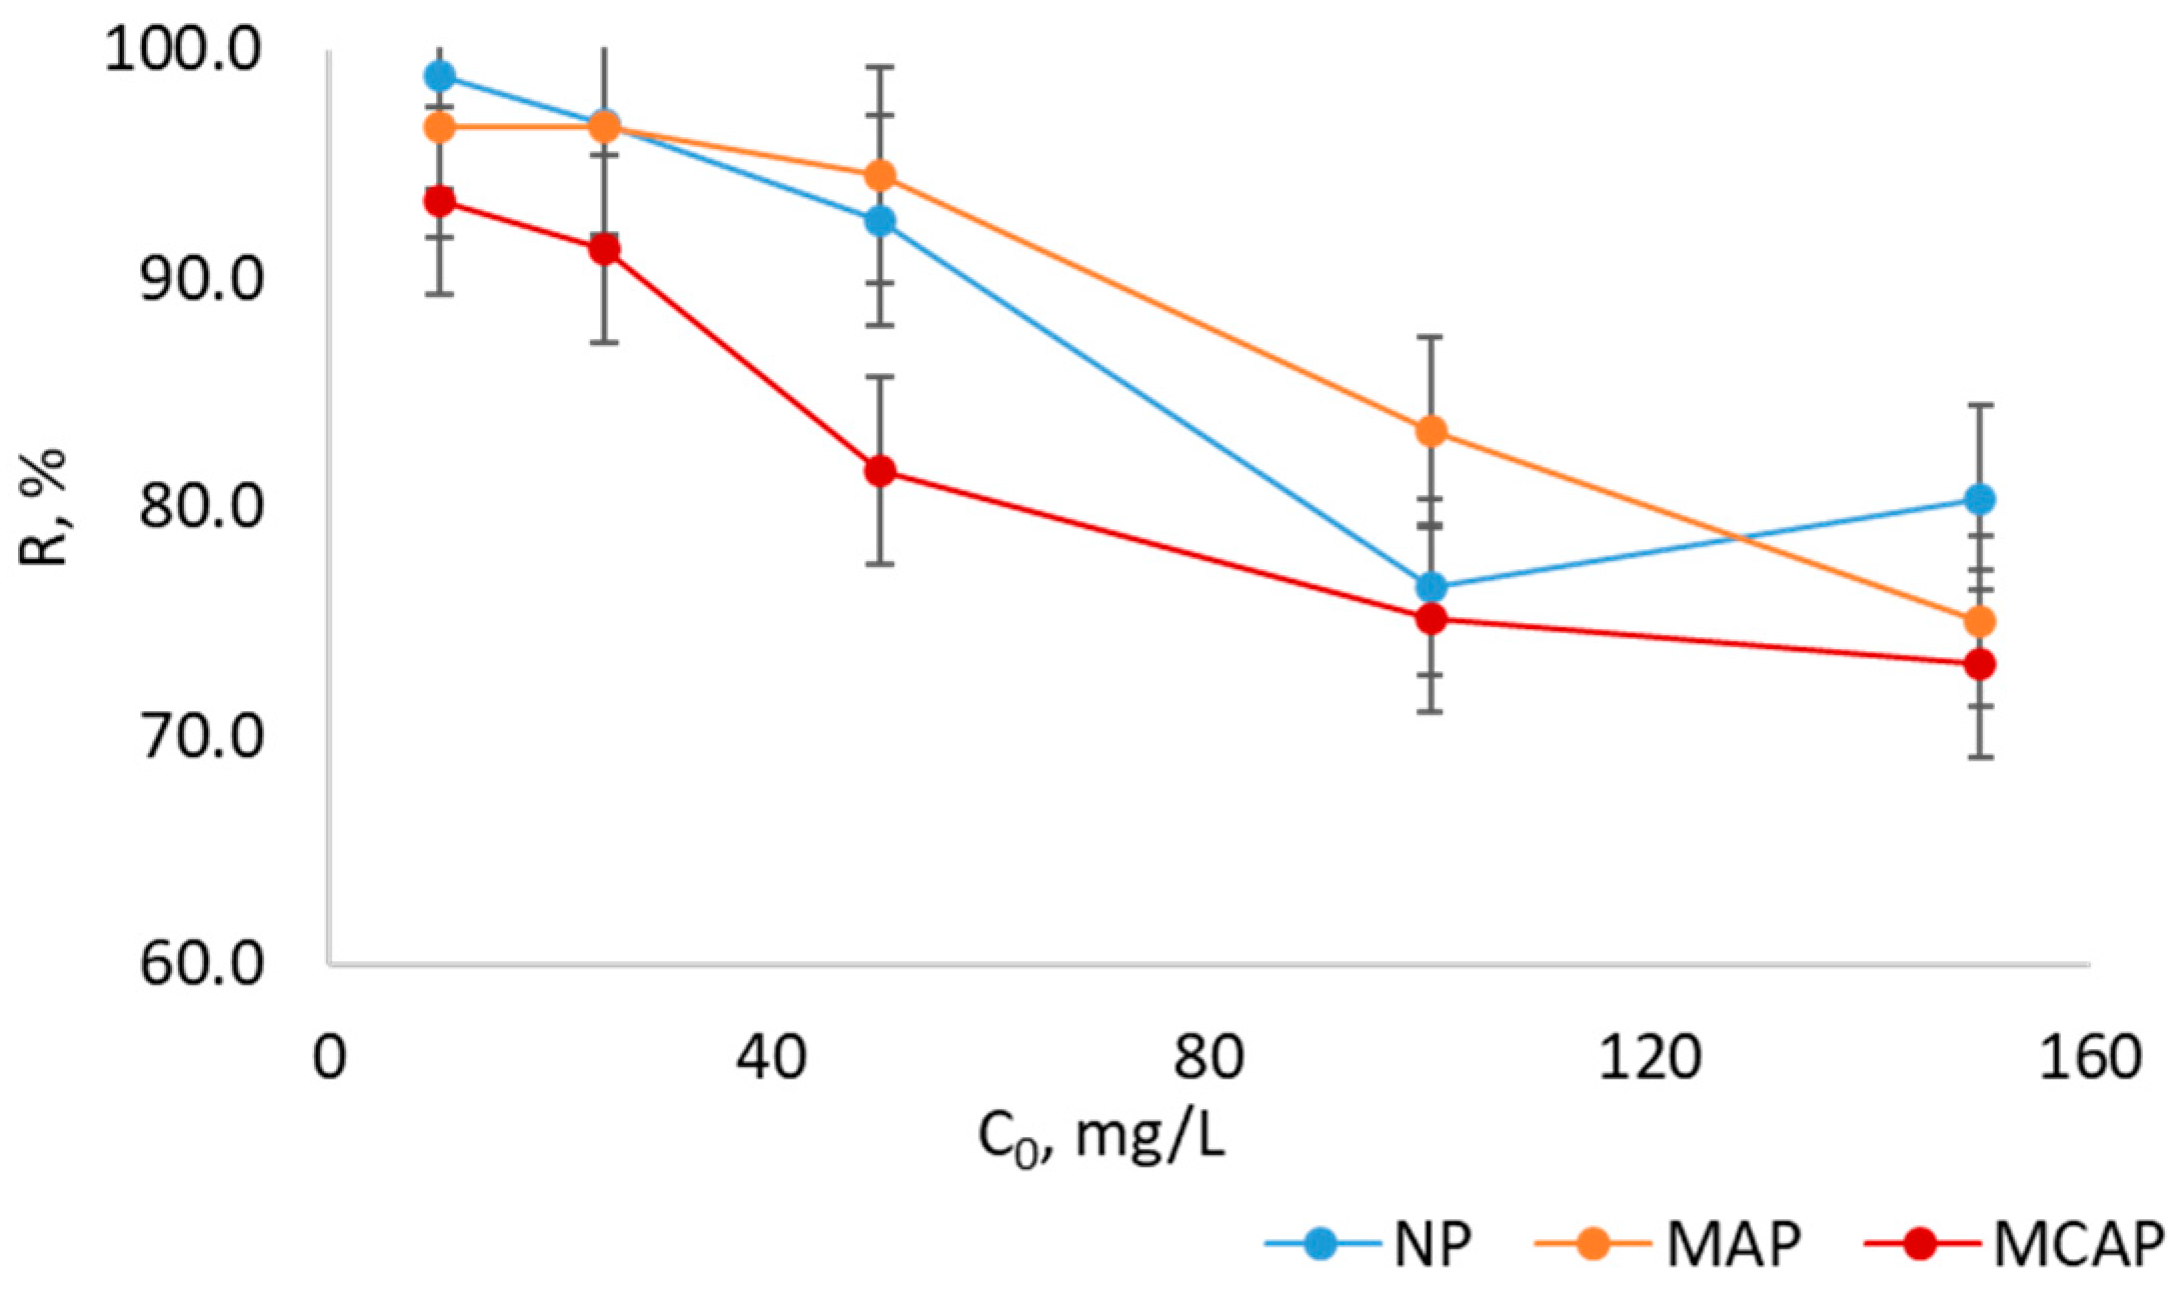
The degree of Cu2+ sorption on the sorbents depends on initial solution concentration (Figure 5). The effect of contact time on the copper ions adsorption on NP is low. The adsorption occurred rapidly within the first 30 min (gray circulars). These results indicated that chemical adsorption rather than intraparticle diffusion was the rate-controlling step [56].
With increasing initial concentration, the removal percent of copper ions decreases from 99% to ~75% due to the reduction in available adsorption sites. To be more precise, a large number of vacant surface sites are available for adsorption at a low concentration, whereas all the active sites are saturated with sorbate ions at a certain point. The increased concentration of metal ions is accompanied by a corresponding decrease in binding such that the total binding is constant when it is at its maximum value [57,58]. This is reflected in the model, which assumes competition of all ions for the same binding sites.
At the initial copper concentration of 150 mg/L (2.36 mmol/L), there is a slight increase in R,% to 84 ± 2%, that can be associated with the formation of a complex with another stoichiometry, for example, according to Equation (5). Precipitation of a solid phase of a CuO type at pH~3.5 according to the thermodynamic calculations should not occur [45,59]:
4(–COOH) + 2Cu2+ = (–COO)4 − Cu20 + 4H+.
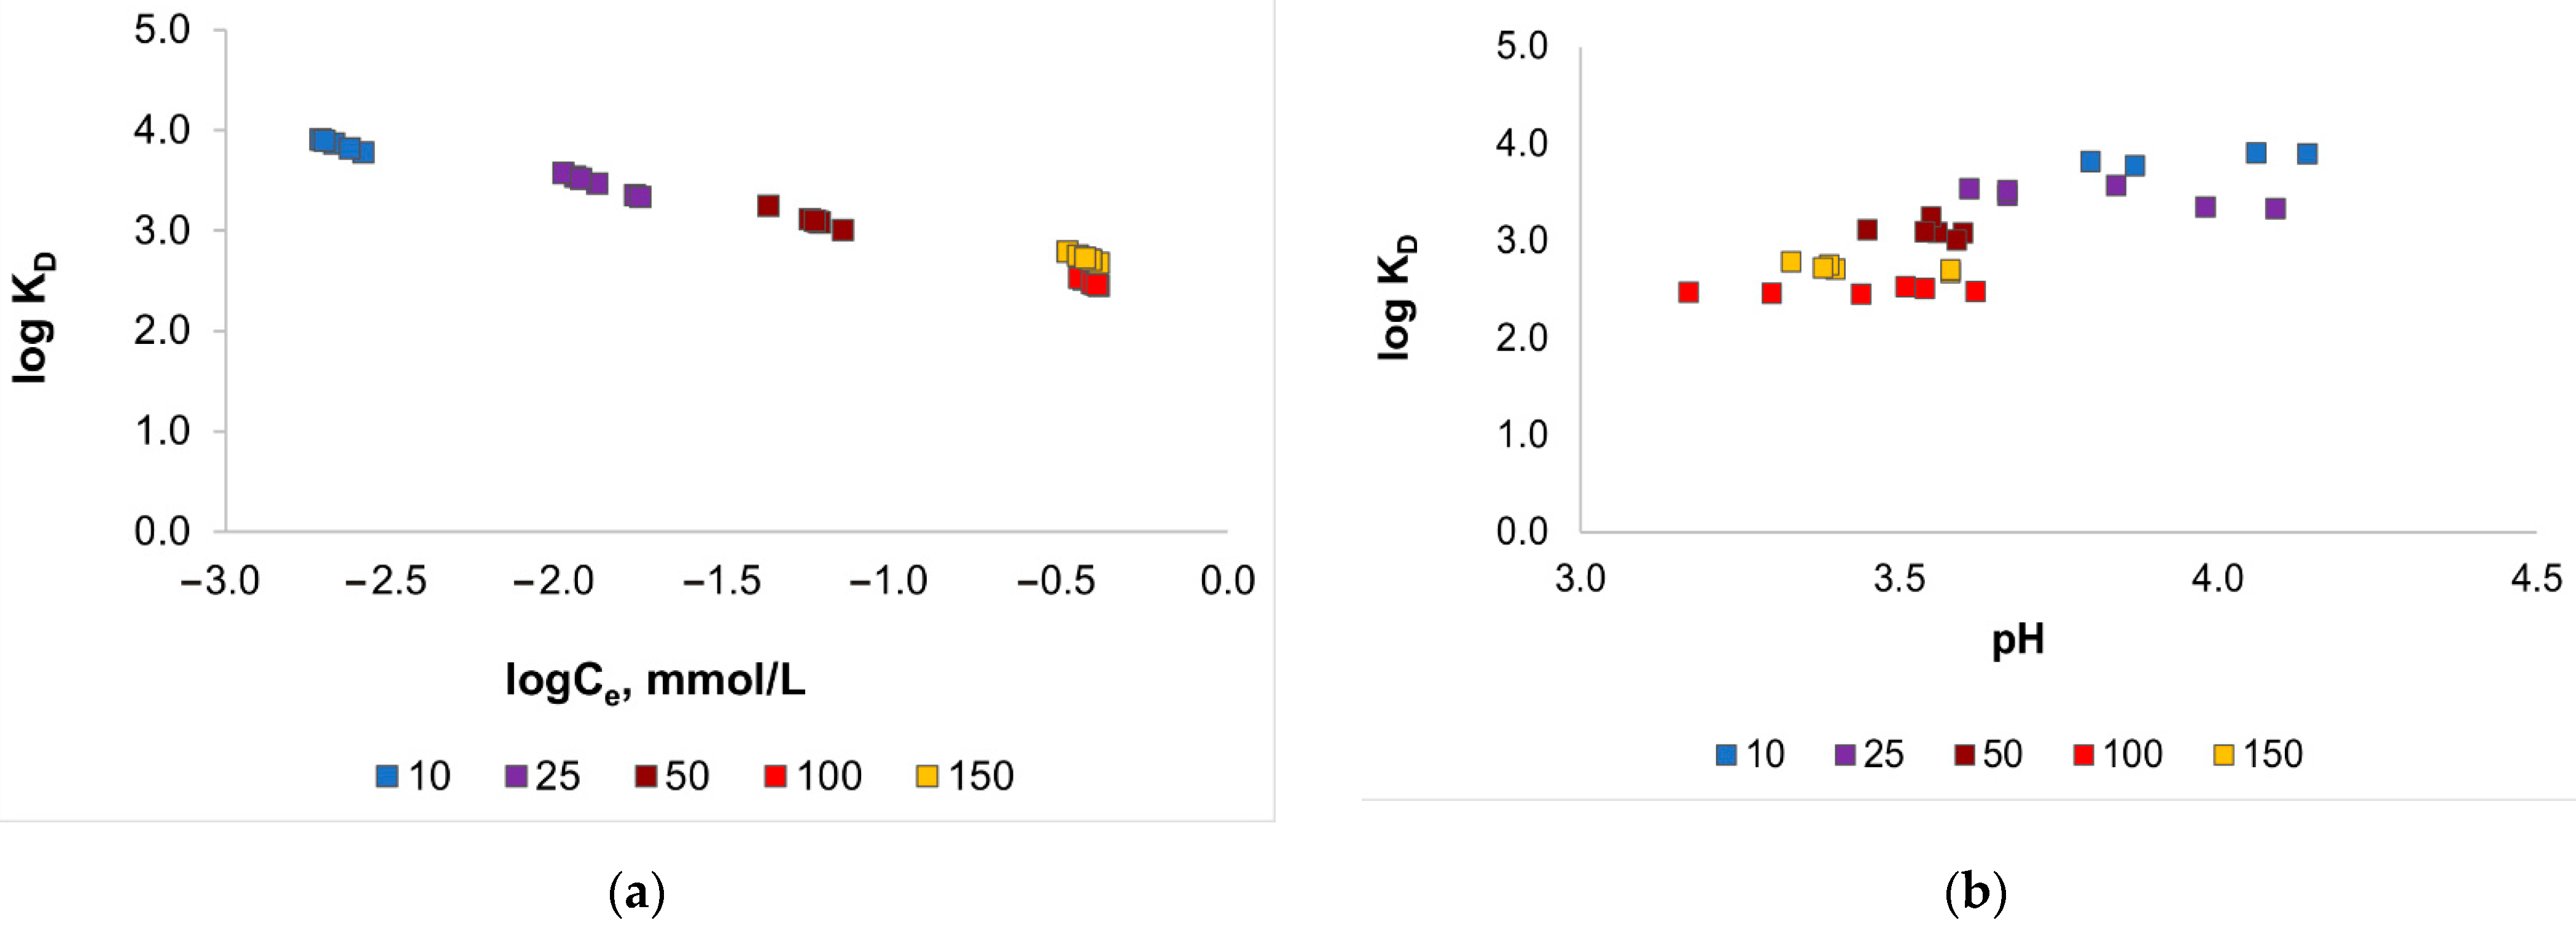
Distribution ratio involves the water-peat ratio in an explicit way according to Equation (2). Figure 6a shows that sorption is most efficient at the lowest Cu concentration (log KD = 3.9), when the metal concentration increases, the ratio drops to log KD = 2.5. Thus, at the constant temperature and water-peat ratio of 100:1, the experimental distribution ratio does not reach constant values in the region up to C0 = 2.36 mmol/L. If the distribution ratio at constant temperature varies, the distribution of components between the solution and peat is not subjected to a linear isotherm. At each point of the experiment, we can only talk about reaching the empirical equilibrium described by reaction Equation (5) and the relative equilibrium constant Kemp (Equation (6)) [45,59]:
Based upon the location of a point set of the same color in Figure 6, this empirical equilibrium is quickly attained, even at the highest concentrations; the time does not exceed 30 min.
Another important parameter affecting the sorption is the solution acidity: the logKD shows an inverse relationship with pH compared with a dependence on increasing concentration (Figure 6b). The equilibrium pH is slightly lower than the initial pH, indicating that H+/Na+ release from carboxylic and phenolic groups during the adsorption process, and negatively charged macromolecules repel each other, making a greater number of active sites available for the adsorption of metal ions [60,61,62]. Distribution ratio increases with increasing pH, while the lower Cu-concentration solutions have pH from 3.7 to 4.2 (blue squares), and higher ones have pH from 3.2 to 3.6 (yellow and red squares). It is known, that the biosorption process is strongly pH-dependent and the level of metal binding is influenced by both H+ ion competition and speciation effects [63,64]. Regular changes of copper concentrations in solution indicate a predominance of sorption affecting the visible change in the solution pH. A graph view (Figure 6b) allows to assume that the reaction Equation (7) is valid. The pH dependence of the metal ions adsorption can be explained by a competitive adsorption of copper and H+ ions [45,59]:
Alk-COOH + Cu2+ = Alk-COOCu+ + H+.
The adsorption of Cu2+ on sorbents is shown in Figure 7. All three peat modifications (NP, MAP, and MCAP) remove copper ions from solutions with approximately the same efficiency. The confidence intervals for the initial and MA peat overlap in most values. Therefore, to analyze the differences in sorption efficiency, we further consider sorption isotherms. The amount of adsorbed Cu ion on MCAP decreased with the increase in Cu2+ concentration. In sum, as confirmed by the sorption constants below, the MCA peat sample shows a worse ability to remove copper ions from solutions.
It was expected that the mechanochemical oxidation of peat using Na2CO3·1.5H2O2 would proceed similarly to the examples described for brown coal. It has long been known that on the surface of brown coal many radicals are formed as a result of mechanical activation [65,66]. In [38] it was shown that the mechanochemical oxidation of brown coal by Na2CO3·1.5H2O2 occurs with the participation of a free radical mechanism and produces new oxygen-containing groups. By potentiometric titration (Table 4), a decrease in the number of Alk-COOH groups from 2.0 to 0.5 mmol/g for mechanochemically oxidized peat was proven. One can conclude that in the case of the mechanochemical treatment of peat with Na2CO3·1.5H2O2, the oxidation of carboxyl groups is more extensive and accompanied by their removal from the structure of organic matter. A similar effect was observed during the mechanochemical oxidation with Na2CO3·1.5H2O2 of chitosan, which is accompanied by deacetylation [67]. In addition, the alkaline component of Na2CO3·1.5H2O2 is also involved in the reaction, so the neutralization of acidic groups of HA occurs, which is reflected in the IR spectra (Figure 4). In the IR spectra of MCAP, the band from 1710–1725 cm−1 is not separately detected, merging with the band from 1610–1612 cm−1. Such samples are sodium humates, not HA. In addition to the data, obtained using potentiometric titration, that account for carboxyl groups in both the salt and acid states, we can conclude that the mechanochemical oxidation of peat with Na2CO3·1.5H2O2 is accompanied by decarboxylation. According to Table 3 and Table 4, physicochemical properties for the MCAP sample were improved (CBET and Sspec), but they did not improve the sorption capacity of this sample with respect to copper ions.
3.2.2. Adsorption Isotherm
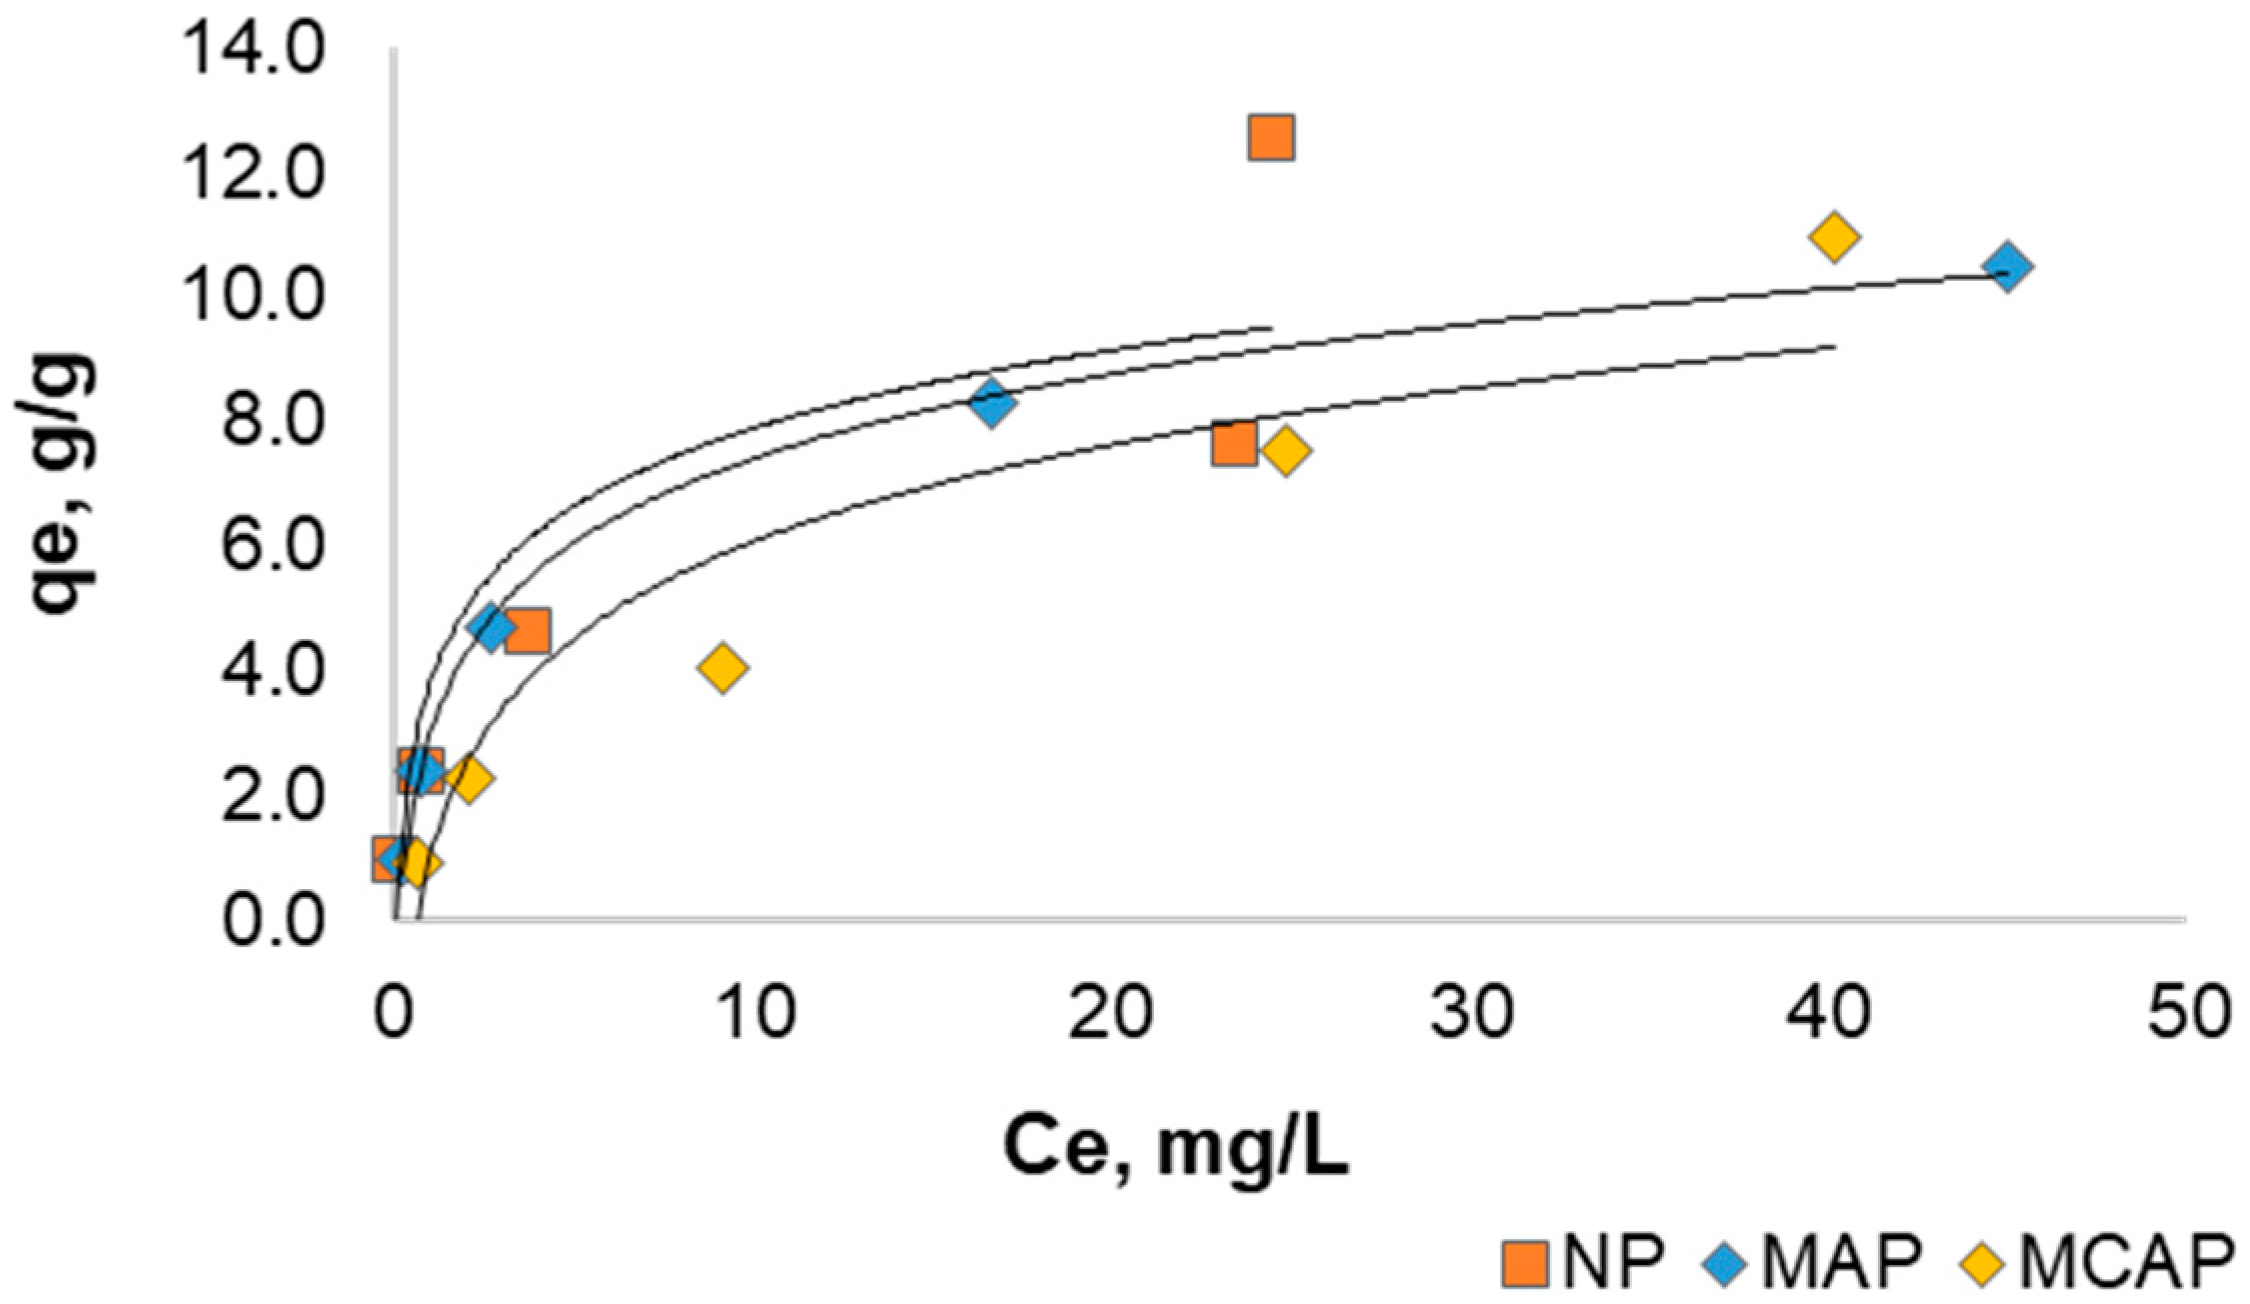
The equilibrium adsorption isotherms of copper ions on peat were built to establish the relationship between the physicochemical parameters of the sorbent and sorption ability. Figure 8 shows the graph obtained for the adsorption of Cu2+ onto NP. This graph indicates an L-type adsorption isotherm, which is characterized by a decreasing slope as the adsorbate concentration increases due to increased coverage of vacant adsorption sites [18,47,68,69]. These results were then analyzed using Langmuir and Freundlich sorption parameters.
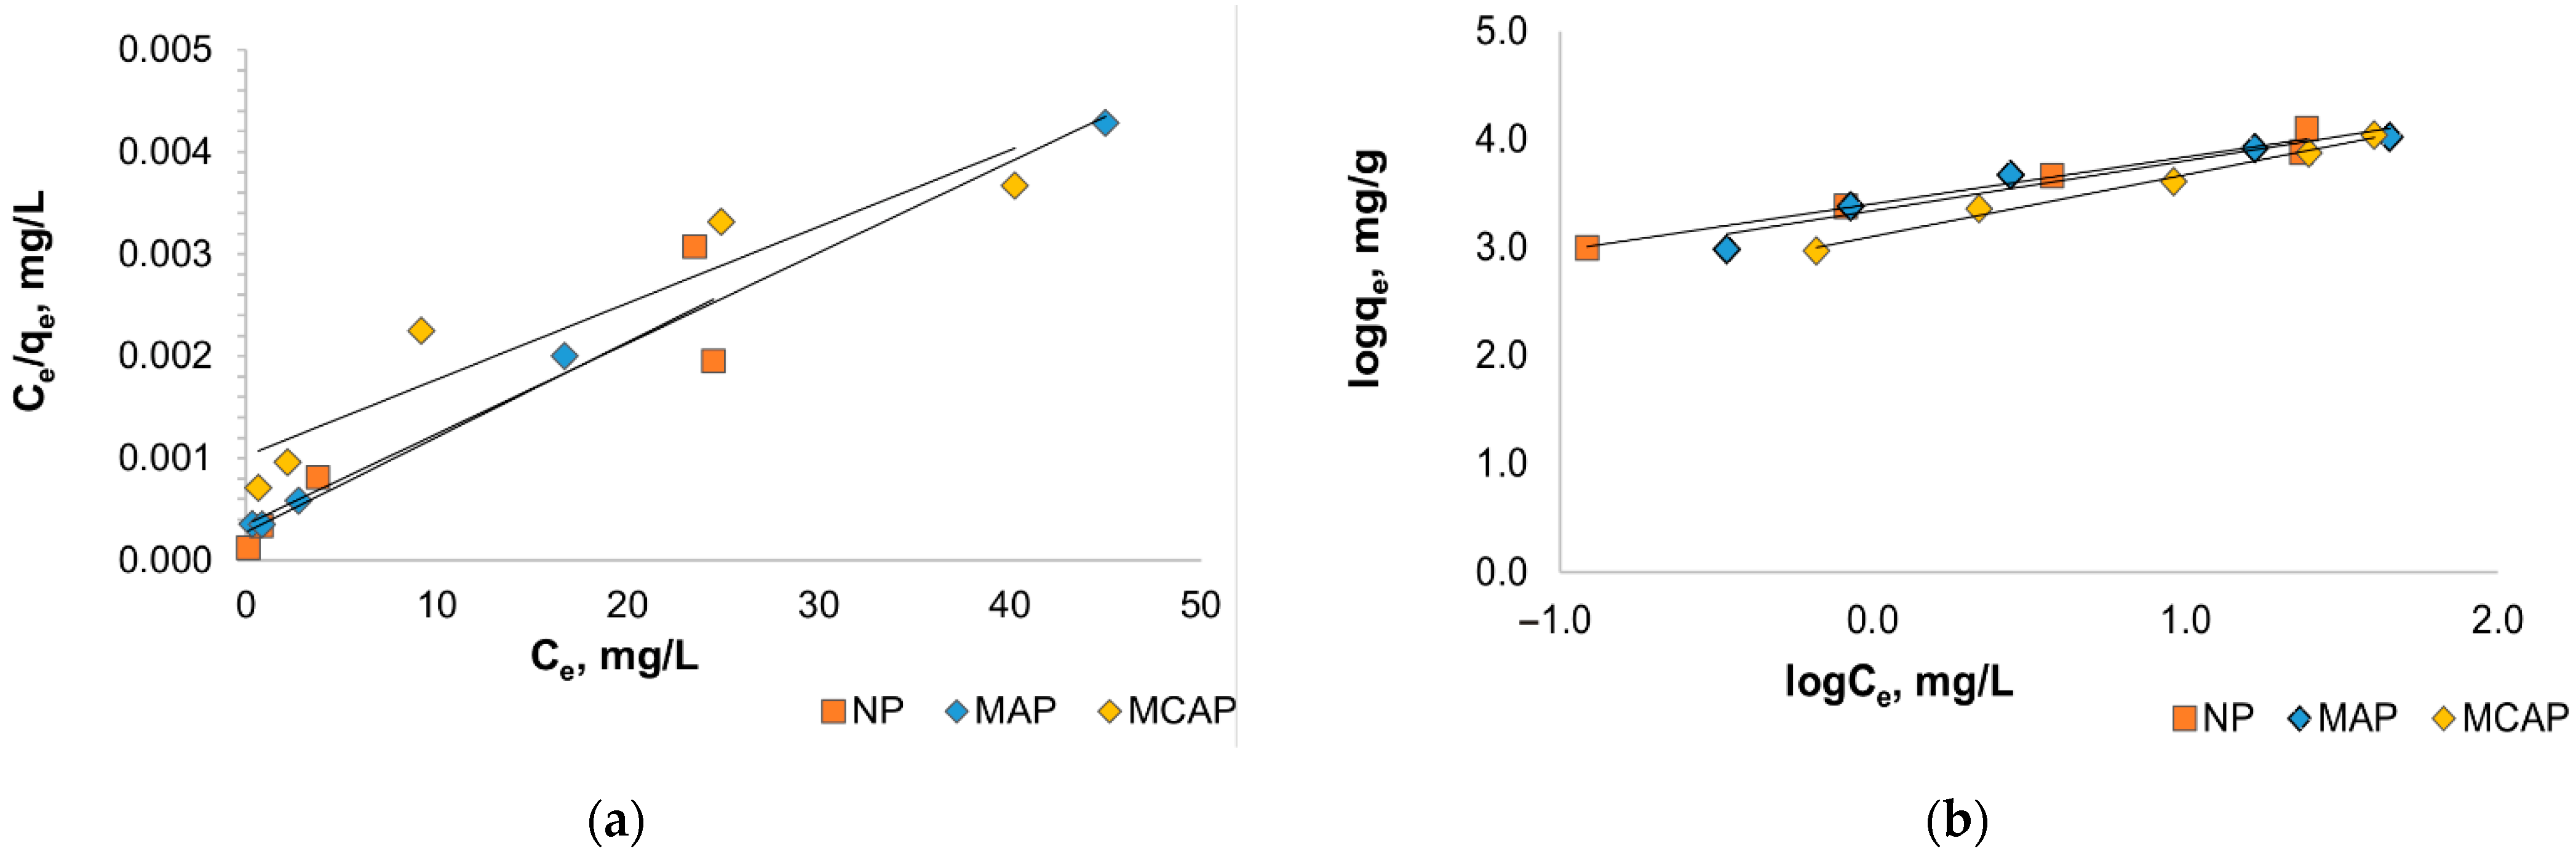
From the slope and intercept of the lines in Figure 9a, the values of Q and KL were estimated and are listed in Table 5. The correlation factor (r2) shows that the linear fit of Ce/qe vs. Ce is the highest for the MAP sample (0.997) over the concentration range from 3–50 mg/L. The Langmuir model assumes that the uptake of ions occurs on a homogenous surface by monolayer adsorption without any interaction between adsorbed molecules; hence, the mechanical treatment of peat moss (MAP) led to the formation of the more uniform sorbent. Maximum Cu2+ adsorption capacity (Q) was determined to be 24.1, 42.1, and 16.0 mg/g for NP, MAP, and MCAP, respectively. The data obtained are well correlated with published data from different previous studies [70,71,72,73,74]. KL is a constant related to the intensity of adsorption and is the highest for the NP (0.3).
From the slope and the intercept of the straight line of log qe vs. log Ce (Figure 9b), the values of Kf and n have been determined and are given in Table 4. The correlation coefficient (r2) demonstrates that the Freundlich model is more suitable than the Langmuir model for the natural peat sample (NP). Therefore, it can be assumed that the process has a surface character [34]. This finding may imply that all groups (Table 4) are responsible for Cu2+ adsorption behavior. The positive contribution of the carboxyl and phenolic groups and the aromatic compounds for adsorbing Cu2+ has been previously reported [57].
3.3. FTIR Spectroscopy Data before and after Experiments
FTIR spectra of two modifications of peat (MAP and MCAP) before and after sorption are shown in Figure 10a,b. A number of adsorption bands exhibited relative intensities, typical to peat-like materials, containing HA. For example, stretching vibrations of hydroxyl groups from 3420–3400 cm−1 and stretching vibrations of aliphatic CH2 and CH3 groups at the 2925 and 2855 cm−1 regions of HA were typical functional groups of the peat. FTIR spectroscopy data did not show HA structure conversion and the occurrence of solid-phase chemical reactions. After Cu2+ adsorption, a peak shift from approximately 3374–3418 cm−1 in HA was observed, and the intensity of the peaks decreased (Figure 10b). The narrowing of the peaks from approximately 1374–1386 cm−1 in HA was observed, which may arise from the formation of hydrogen bonds after Cu2+ adsorption. The peaks from approximately 1599–1633 cm−1 in HA shifted approximately to 7–24 cm−1; the peaks from approximately 1252–1268 cm−1 in HA almost disappeared after the adsorption of Cu2+. The above findings suggested that carboxyl and hydroxyl groups on humic substance (HS) surfaces were involved in Cu2+ adsorption. The crucial role of carboxyl and hydroxyl groups in metal ion binding with HS has also been reported previously [75].
However, for the studied samples, no significant changes in the FTIR spectra before and after the sorption of copper ions were observed. A slight decrease in absorption in the 1430–1375 cm−1 area may indicate a decrease in C–H bonds in peat after the copper sorption. For MCAP, there is an increase in adsorption in the area of 1725 cm−1, which is explained by the transition of a part of sodium humate to the form of HA due the presence of peat in an aqueous solution with pH 3.2–4.6.
3.4. Thermodynamic Modeling
Based on the above-mentioned data set, a mechanism of chemical adsorption with the formation of surface complexes was selected for thermodynamic modeling. Physicochemical modeling of the biosorption process makes it possible to choose such a working technological scheme, at which the minimum consumption of the adsorbent or modifier can be used and the most satisfactory results obtained. In the context of development, a model applied to environmental conditions (wetlands, tailing impoundments), we have to propose a model able to reproduce the copper sorption on native peat, in a pH range from 3–4, which is typical for the specified environments. Between pH 3.2 and 4.1 (Figure 6), despite a high dispersion of points depending on the initial Cu concentration, the totality of log KD values obtained by sorption were comprised between 2.0 and 4.0 mL/g, attesting to a high sorption capacity of native peat.
It has been shown in Table 4 that the total content of sorption positions in natural peat is 15 mmol/g. However, the number of Alk-COOH carboxyl groups easily eliminating the proton at pH 3.5 (dissociating) is only 2 mmol/g. It is most likely that adsorption occurs particularly with the formation of surface complexes by reactions [45,59]:
Alk-COOH = Alk-COO− + H+,
Alk-COO− + Cu2+ = Alk-COOCu+.
Thermodynamic data are presented in Table 6. Further details have been provided in our previous studies [76,77,78]. Some of the parameters were determined experimentally, others were adopted from [59,79]. It should be said that the weighed average log Kdiss (Equation (10)) [45,59] of carboxyl, phenolic, and other groups vary considerably for different samples of HA and FA, while the aqueous samples differ in more positive logarithm values:
where
γ(Cu2+) is the activity coefficient of the Cu aqueous species calculated with the Davies equation.

Table 6.
Retention parameters of the organic component of peat towards Cu2+.
| Natural Peat | log K | Species | Gibbs Free Energy, kCal/mol |
|---|---|---|---|
| Carboxyl sites 2 mmol/g | Cu2+ | +15.675 | |
| Cu2+ 10 ÷ 150 mg/L | Alk-COOH | 0 | |
| Alk-COOH = Alk-COO− + H+ | −3.5 | Alk-COO− | 4.77 |
| Alk-COO− + Cu2+ = Alk-COOCu+ | 3.0 | Alk-COOCu+ | 16.6 |
The activity coefficients of the adsorbed species are unknown, but their ratio is expected to be constant and fixed at 1.
A provident explanation can be made on the reaction dissociation constant (Equation (10)). At pH < 3.5, the presence of HA has a slight impact on copper adsorption, since in this region HA molecules are semi-protonated (Alk-COOH) and cannot bond the metal ion.
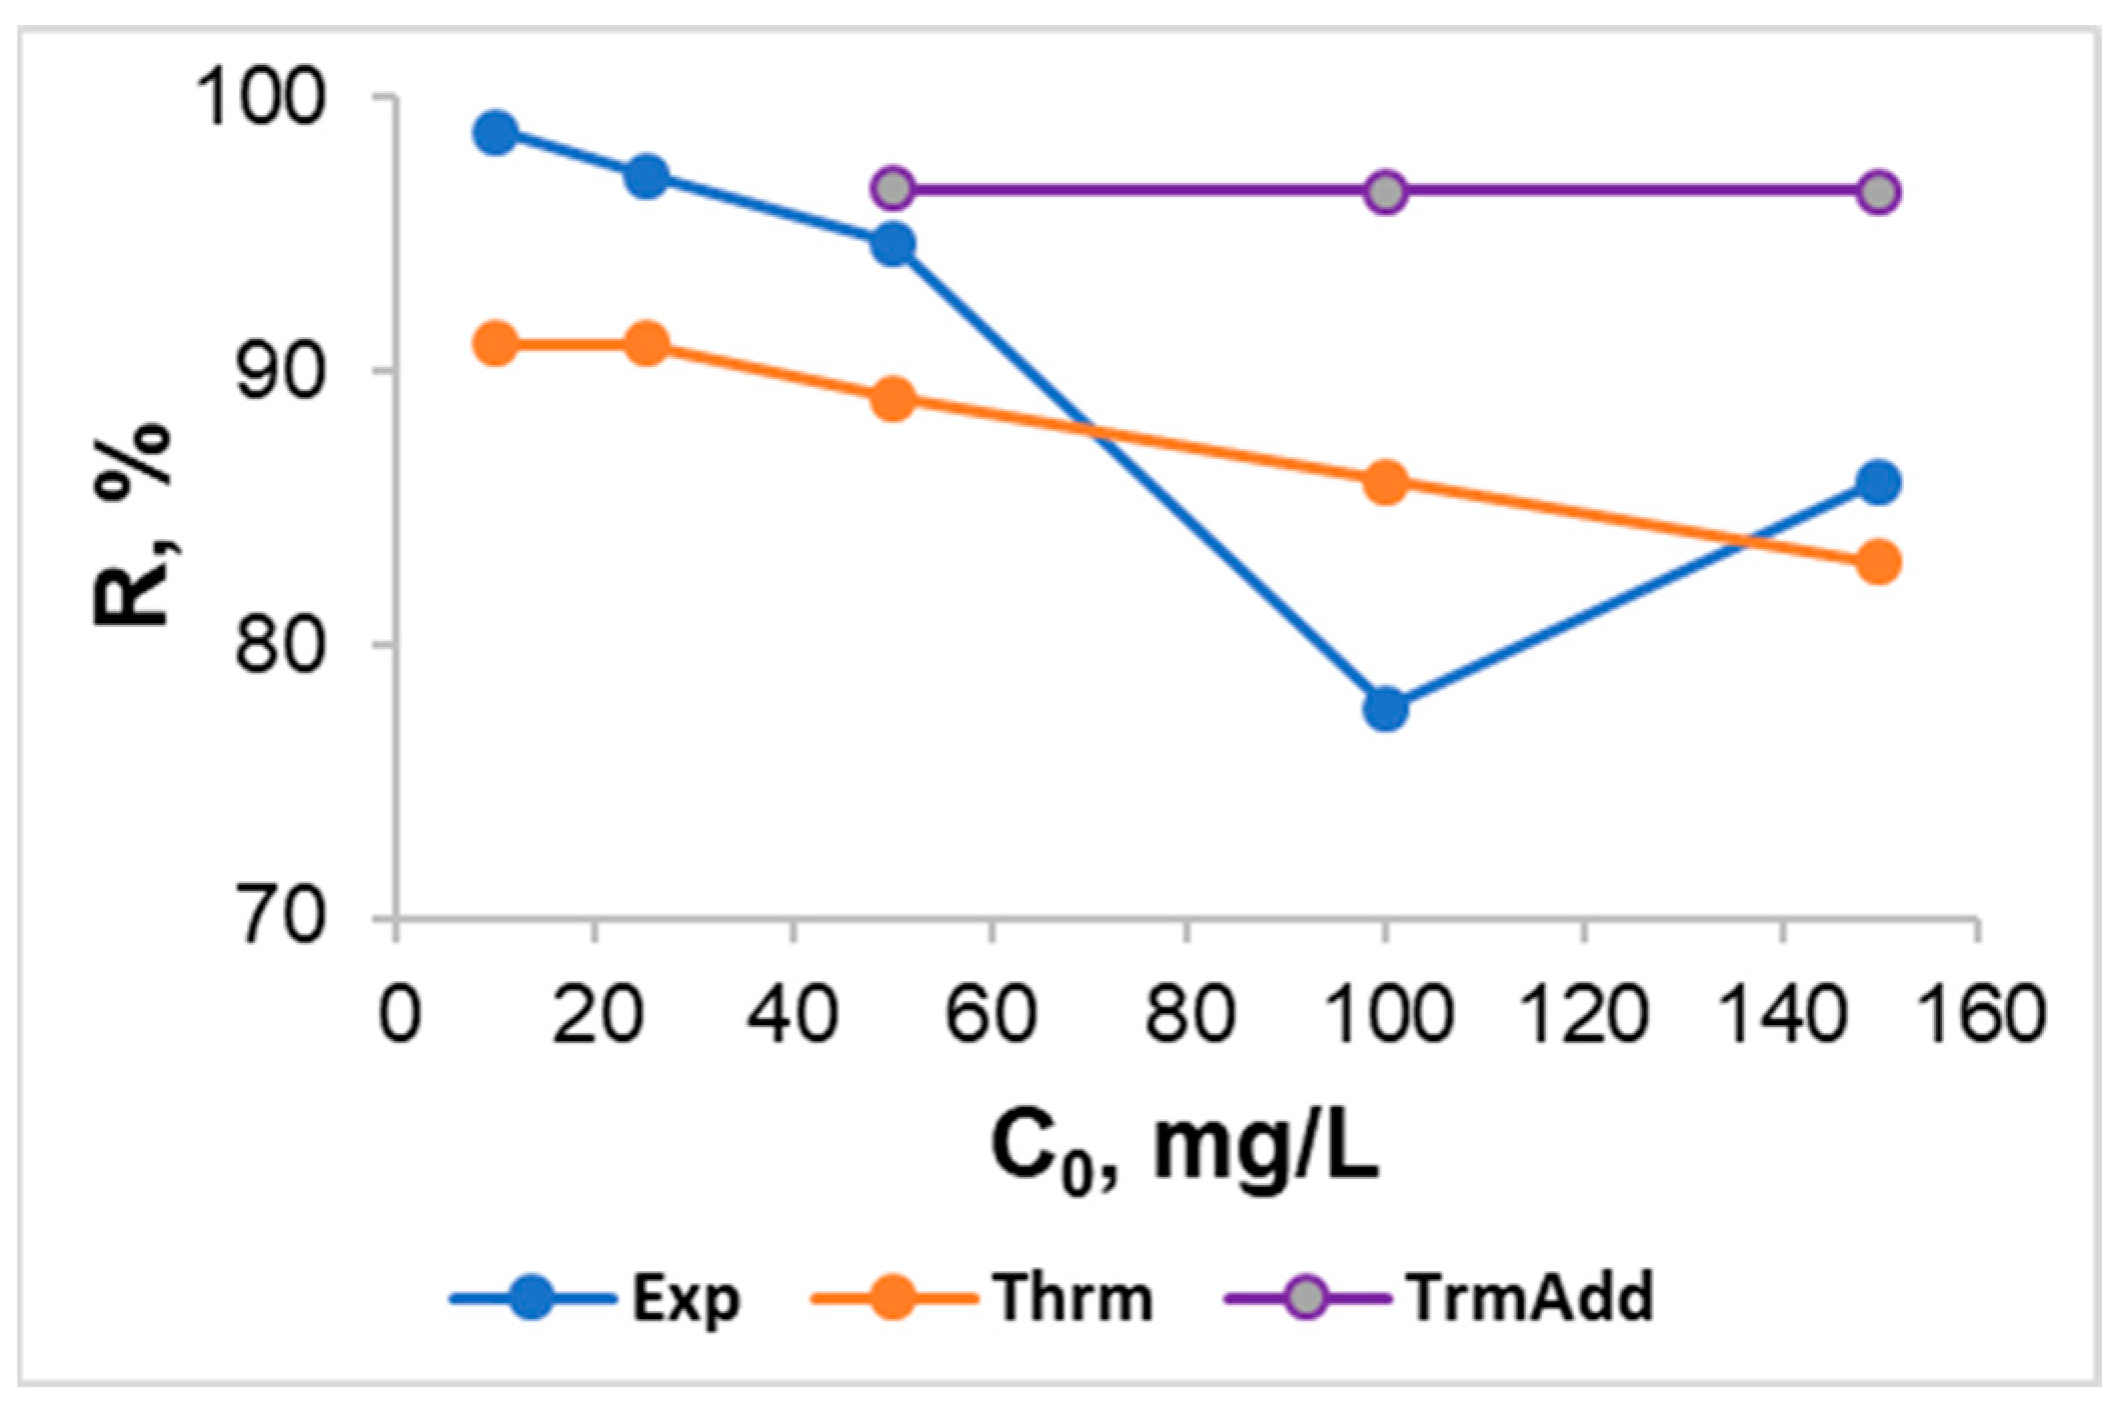
Figure 11 shows the comparison of copper sorption on peat according to the experimental and calculated data depending on the initial content of Cu2+ in the solution. In general, the accepted constants adequately describe the sorption process with an increase in its initial concentrations. Certainly, the sorption curve trend is smoother, and no such strong deflection has been detected in the region of 100 mg/L Cu2+. It is not necessary to optimize the process in the region of low concentrations (1 g of peat/100 mL of solution) due to the sufficient number of sorption positions (dissociated carboxyl groups). At 50, 100, and 150 mg/L of copper, a calculation was made at 2.5 g peat/50 mL solution. It turned out that the sorption of 96% can be attained even in the region of high concentrations. Thus, a nonlinear increase in the removal percent of Cu ions with an increase in the adsorbent concentration is observed.
4. Conclusions
Kinetic and equilibrium studies on copper ion adsorption on three peat modifications—natural peat (NP), mechanically activated (MAP), and mechanochemical activated (MCAP)—were carried out.
The activation of peat enhanced its physicochemical properties (CBET and specific surface area (Sspec)) but led to a decrease in the content of phenolic and carboxyl groups.
The studies showed that equilibrium of copper adsorption was established after 30 min. The thermodynamic modeling showed that under optimized conditions, the removal performance was found to be efficient enough, reaching 96%. A slight increase in the pH of the solution was observed following cooper adsorption. This could be interpreted by reverse hydrolysis reactions, which consume H+, thus, raising the pH.
Freundlich and Langmuir equations were followed and the corresponding constants were established. From these constants, empirical rate equations were derived for the prediction of the adsorption capacity of copper ions at a given time. Adsorption on NP and MCAP was successfully simulated with the Freundlich isotherm equation. The Langmuir model has been shown to fit well for mechanically activated peat. The adsorption capacity increased in the order MCAP–NP–MAP and was found to be 16–24–42 mg/g.
The obtained experimental data provide a prediction of similar sorption capacity of peats in relation to copper ions, but the mechanical modification of peat could be efficiently used for the enhanced removal of cooper from wastewater.
By the example of peat mechanochemically oxidized with Na2CO3·1.5H2O2, it is shown that the improvement of the physicochemical properties (CBET and specific surface area), plays a smaller role in the sorption capacity in relation to copper ions than the presence of phenolic and carboxyl groups, the content of which decreases during oxidation under the studied conditions.
Only one peat type (Sphagnum peat) was tested in the present study. Peat is an extremely heterogeneous material whose structure ranges from fibric to sapric while the relative composition (C, H, N, O) and features depend upon the botanical composition and degree of decomposition [54]; therefore, further studies are needed. In addition, further research will include the development of the present study to address the competition effects of metal co-ions on the biosorption process and extension of the mathematical modeling to polymetallic systems.
Author Contributions
Conceptualization, O.S.; methodology, O.S., T.S., and O.G.; validation, O.S., O.G., and T.S.; formal analysis, O.S., T.S., and E.P.; investigation, O.S., T.S., O.G., and E.P.; resources, O.S., T.S., and E.P.; writing—original draft preparation, O.S. and T.S.; writing—review and editing, O.G., O.S., T.S., and E.P.; visualization, T.S.; supervision, O.S.; funding acquisition, O.S., T.S., and E.P. All authors have read and agreed to the published version of the manuscript.
Funding
This research was funded by the Russian Science Foundation, project No 18-77-10029 (field, experimental, analytical work, mechanical and mechanochemical activation (treatment) of peat), project No 20-77-10084 (physical and chemical properties of peat samples). Design and adaptation of the potentiometric titration technique, determination of functional groups, stractural and morphological properties of samples were supported by the Russian Science Foundation, (project no. 21-13-00046).
Institutional Review Board Statement
Not applicable.
Informed Consent Statement
Not applicable.
Data Availability Statement
The data that support the findings of this study are available from the corresponding author upon reasonable request.
Conflicts of Interest
The authors declare no conflict of interest.
References
- Tomczyk, A.; Boguta, P.; Sokołowska, Z. Biochar efficiency in copper removal from Haplic soils. Int. J. Environ. Sci. Technol. 2019, 16, 4899–4912. [Google Scholar] [CrossRef] [Green Version]
- Lima, J.Z.; Lupion, R.M.; Raimondi, I.M.; Pejon, O.J.; Rodrigues, V.G.S. Sorption efficiency of potentially toxic elements onto low-cost materials: Peat and compost. Sustainability 2021, 13, 12847. [Google Scholar] [CrossRef]
- Raimondi, I.M.; Rodrigues, V.G.; Lima, J.Z.; Marques, J.P.; Vaz, L.A.A.; Vieira, E.M. Assessment of the use of tropical peats as local alternative materials for the adsorption of Pb, Zn and Cd: An equilibrium study. Earth Sci. Res. J. 2021, 25, 29–40. [Google Scholar] [CrossRef]
- Couillard, D. The use of peat in wastewater treatment. Water Res. 1994, 28, 1261–1274. [Google Scholar] [CrossRef]
- Brown, A.P.; Gill, S.A.; Allen, S.J. Metal removal from wastewater using peat. Water Res. 2000, 34, 3907–3916. [Google Scholar] [CrossRef]
- Gogoi, H.; Leiviska, T.; Heiderscheidt, E.; Postila, H.; Tanskanen, J. Removal of metals from industrial wastewater and urban runoff by mineral and bio-based sorbents. J. Environ. Manag. 2018, 209, 316–327. [Google Scholar] [CrossRef]
- Pelinsom Marques, J.; Silvestre Rodrigues, V.G.; Monici Raimondi, I.; Zanin Lima, J. Increase in Pb and Cd adsorption by the application of peat in a tropical soil. Water Air Soil Pollut. 2020, 231, 136. [Google Scholar] [CrossRef]
- Gündoğan, R.; Acemioğlu, B.; Alma, M.H. Copper (II) adsorption from aqueous solution by herbaceous peat. J. Colloid Interface Sci. 2004, 269, 303–309. [Google Scholar] [CrossRef]
- Zhu, S.; Khan, M.A.; Kameda, T.; Xu, H.; Wang, F.; Xia, M.; Yoshioka, T. New insights into the capture performance and mechanism of hazardous metals Cr3+ and Cd2+ onto an effective layered double hydroxide based material. J. Hazard. Mater. 2022, 426, 128062. [Google Scholar] [CrossRef]
- Lee, S.-J.; Park, J.H.; Ahn, Y.-T.; Chung, J.W. Comparison of heavy metal adsorption by peat moss and peat moss-derived biochar produced under different carbonization conditions. Water Air Soil Pollut. 2015, 226, 9. [Google Scholar] [CrossRef]
- Bartczak, P.; Norman, M.; Klapiszewski, L.; Karwanska, N.; Kawalec, M.; Baczynska, M.; Wysokowski, M.; Zdarta, J.; Ciesielczyk, F.; Jesionowski, T. Removal of nickel(II) and lead(II) ions from aqueous solution using peat as a low-cost adsorbent: A kinetic and equilibrium study. Arab. J. Chem. 2018, 11, 1209–1222. [Google Scholar] [CrossRef] [Green Version]
- Leiviskä, T.; Khalid, M.K.; Gogoi, H.; Tanskanen, J. Enhancing peat metal sorption and settling characteristics. Ecotoxicol. Environ. Saf. 2018, 148, 346–351. [Google Scholar] [CrossRef] [PubMed] [Green Version]
- Ho, Y.S.; McKay, G. The kinetics of sorption of divalent metal ions onto sphagnum moss peat. Water Res. 1999, 34, 735–741. [Google Scholar] [CrossRef]
- Carolin, C.F.; Kumar, P.S.; Saravanan, A.; Joshiba, G.J.; Naushad, M. Efficient techniques for the removal of toxic heavy metals from aquatic environment: A review. J. Environ. Chem. Eng. 2017, 5, 2782–2799. [Google Scholar] [CrossRef]
- Nwachukwu, O.I.; Pulford, I.D. Comparative effectiveness of selected adsorbant materials as potential amendments for the remediation of lead-, copper- and zinc-contaminated soil. Soil Use Manag. 2008, 24, 199–207. [Google Scholar] [CrossRef]
- Ong, H.L.; Swanson, V.E. Adsorption of copper by peat, lignite, and bituminous coal. Econ. Geol. 1966, 61, 1214–1231. [Google Scholar] [CrossRef]
- Kasiuliene, A.; Carabante, I.; Bhattacharya, P.; Caporale, A.G.; Adamo, P.; Kumpiene, J. Removal of metal(oid)s from contaminated water using iron-coated peat sorbent. Chemosphere 2018, 198, 290–296. [Google Scholar] [CrossRef]
- Gupta, B.S.; Curran, M.; Hasan, H.; Ghosh, T.K. Adsorption characteristics of Cu and Ni on Irish peat moss. J. Environ. Manag. 2009, 90, 954–960. [Google Scholar] [CrossRef]
- McKay, G.; Porter, J.F. Equilibrium parameters for the sorption of copper, cadmium and zinc ions onto peat. J. Chem. Technol. Biotechnol. 1997, 69, 309–320. [Google Scholar] [CrossRef]
- Allen, S.J.; Whitten, L.J.; Murray, M.; Duggan, O.; Brown, P. The adsorption of pollutants by peat, lignite and activated chars. J. Chem. Technol. Biotechnol. 1997, 68, 442–452. [Google Scholar] [CrossRef]
- Ringqvist, L.; Öborn, I. Copper and zinc adsorption onto poorly humified sphagnum and carex peat. Water Res. 2002, 36, 2233–2242. [Google Scholar] [CrossRef]
- Wang, J.; Guo, X. Adsorption kinetic models: Physical meanings, applications, and solving methods. J. Hazard. Mater. 2020, 390, 122156. [Google Scholar] [CrossRef] [PubMed]
- Bulgariu, L.; Bulgariu, D.; Macoveanu, M. Adsorptive performance of alkaline treated peat for heavy metal removal. Sep. Sci. Technol. 2011, 46, 1023–1033. [Google Scholar] [CrossRef]
- Gautam, R.K.; Mudhoo, A.; Lofrano, G.; Chattopadhaya, M.C. Biomass-derived biosorbents for metal ions sequestration: Adsorbent modification and activation methods and adsorbent regeneration. J. Environ. Chem. Eng. 2014, 2, 239–259. [Google Scholar] [CrossRef]
- Nikishina, M.; Perelomov, L.; Atroshchenko, Y.; Ivanova, E.; Mukhtorov, L.; Tolstoy, P. Sorption of Fulvic Acids and Their Compounds with Heavy Metal Ions on Clay Minerals. Soil Syst. 2022, 6, 2. [Google Scholar] [CrossRef]
- Di Bonito, M.; Lofts, S.; Groenenberg, J.E. Chapter 11—Models of geochemical speciation: Structure and applications. In Environmental Geochemistry: Site Characterization, Data Analysis and Case Histories, 2nd ed.; De Vivo, B., Belkin, H.E., Lima, A., Eds.; Elsevier: Amsterdam, The Netherlands, 2018; Volume 11, pp. 237–305. [Google Scholar] [CrossRef]
- Mehlhorn, J.; Besold, J.; Lezama Pacheco, J.S.; Gustafsson, J.P.; Kretzschmar, R.; Planer-Friedrich, B. Copper mobilization and immobilization along an organic matter and redox gradient—insights from a mofette site. Environ. Sci. Technol. 2018, 52, 13698–13707. [Google Scholar] [CrossRef]
- Zaccone, C.; Cocozza, C.; Cheburkin, A.K.; Shotyk, W.; Miano, T.M. Enrichment and depletion of major and trace elements, and radionuclides in ombrotrophic raw peat and corresponding humic acids. Geoderma 2007, 141, 235–246. [Google Scholar] [CrossRef]
- Singh, N.B.; Nagpal, G.; Agrawal, S. Water purification by using adsorbents: A review. Environ. Technol. Innov. 2018, 11, 187–240. [Google Scholar] [CrossRef]
- Ansone-Bertina, L.; Klavins, M. Sorption of V and VI group metalloids (As, Sb, Te) on modified peat sorbents. Open Chem. 2016, 14, 46–59. [Google Scholar] [CrossRef] [Green Version]
- Gonzalez, A.G.; Pokrovsky, O.S.; Beike, A.K.; Reski, R.; Di Palma, A.; Adamo, P.; Giordano, S.; Angel Fernandez, J. Metal and proton adsorption capacities of natural and cloned Sphagnum mosses. J. Colloid Interface Sci. 2016, 461, 326–334. [Google Scholar] [CrossRef]
- Batista, A.P.S.; Romão, L.P.C.; Arguelho, M.L.P.M.; Garcia, C.A.B.; Alves, J.P.H.; Passos, E.A.; Rosa, A.H. Biosorption of Cr(III) using in natura and chemically treated tropical peats. J. Hazards Mater. 2009, 163, 517–523. [Google Scholar] [CrossRef]
- Gardea-Torresdey, J.L.; Tang, L.; Salvador, J.M. Copper adsorption by esterified and unesterified fractions of Sphagnum peat moss and its different humic substances. J. Hazards Mater. 1996, 48, 191–206. [Google Scholar] [CrossRef]
- Yudina, N.V.; Savel’eva, A.V.; Linkevich, E.V. Changes in the Composition of Humic Acids with Mechanochemical Impact on Peat and Coal. Solid Fuel Chem. 2019, 53, 29–35. [Google Scholar] [CrossRef]
- Savel’eva, A.V.; Yudina, N.V. Mechanochemical modification of peat humic acids. Solid Fuel Chem. 2014, 48, 328–331. [Google Scholar] [CrossRef]
- Gondar, D.; López, R.; Fiol, S.; Antelo, J.M.; Arce, F. Cadmium, lead, and copper binding to humic acid and fulvic acid extracted from an ombrotrophic peat bog. Geoderma 2006, 135, 196–203. [Google Scholar] [CrossRef]
- Mal’tseva, E.V.; Filatov, D.A.; Yudina, N.V.; Chaikovskaya, O.N. Role of modified humic acids from peat in the detoxification of tebuconazole. Solid Fuel Chem. 2011, 45, 62–67. [Google Scholar] [CrossRef]
- Skripkina, T.S.; Bychkov, A.L.; Tikhova, V.D.; Lomovsky, O.I. Mechanochemical solid-phase reactions of humic acids from brown coal with sodium percarbonate. Solid Fuel Chem. 2018, 52, 356–360. [Google Scholar] [CrossRef]
- Skripkina, T.S.; Bychkov, A.L.; Tikhova, V.D.; Smolyakov, B.S.; Lomovsky, O.I. Mechanochemically oxidized brown coal and the effect of its application in polluted water. Environ. Technol. Innov. 2018, 11, 74–82. [Google Scholar] [CrossRef]
- Urazova, T.S.; Bychkov, A.L.; Lomovskii, O.I. Mechanochemical modification of the structure of brown coal humic acids for preparing a sorbent for heavy metals. Russ. J. Appl. Chem. 2014, 87, 651–655. [Google Scholar] [CrossRef]
- Burkova, V.N.; Yudina, N.V.; Maltseva, E.V.; Savelyeva, A.V. Effect of the solid-phase mechanoactivation on functional composition of humic acids from coals. Int. J. Appl. Fund. Res. 2015, 9, 84–87. (In Russian). Available online: https://applied-research.ru/ru/article/view?id=7444 (accessed on 1 July 2022).
- Brunauer, S.; Emmett, P.H.; Teller, E. Adsorption of gases in multimolecular layers. J. Am. Chem. Soc. 1938, 60, 309–319. [Google Scholar] [CrossRef]
- Gregg, S.; Sing, K. Adsorption, Surface Area and Porosity, 2nd ed.; Academic Press: London, UK, 1982; 303p. [Google Scholar]
- Redlich, O.; Peterson, D.L. A useful adsorption isotherm. J. Phys. Chem. 1959, 63, 1024. [Google Scholar] [CrossRef]
- Foo, K.Y.; Hameed, B.H. Insights into the modeling of adsorption isotherm systems: Review. Chem. Eng. J. 2010, 156, 2–10. [Google Scholar] [CrossRef]
- Langmuir, I. The constitution and fundamental properties of solids and liquids. J. Am. Chem. Soc. 1916, 38, 2221–2295. [Google Scholar] [CrossRef] [Green Version]
- Omar, H.A.; Aziz, M.; Shakir, K. Adsorption of U(VI) from dilute aqueous solutions onto peat moss. Radiochim. Acta 2007, 95, 17–24. [Google Scholar] [CrossRef]
- Russel, W.W. The Adsorption of Gases and Vapors. Volume 1: Physical Adsorption (Brunauer, Stephen). Chem. Educ. 1944, 21, 52. [Google Scholar] [CrossRef] [Green Version]
- Freundlich, H.M.F. Ober dies adsorption in Losungen. J. Phys. Chem. 1906, 57, 385–470. [Google Scholar]
- Shvarov, Y.V. HCh: New potentialities for the thermodynamic simulation of geochemical systems offered by Windows. Geochem. Int. 2008, 46, 834–839. [Google Scholar] [CrossRef]
- Zaccone, C.; Plaza, C.; Ciavatta, C.; Miano, T.M.; Shotyk, W. Advances in the determination of humification degree in peat since Achard (1786): Applications in geochemical and paleoenvironmental studies. Earth-Sci. Rev. 2018, 185, 163–178. [Google Scholar] [CrossRef]
- Borthakur, P.; Aryafard, M.; Zara, Z.; David, R.; Minofar, B.; Das, M.R.; Vithanage, M. Computational and experimental assessment of pH and specific ions on the solute solvent interactions of clay-biochar composites towards tetracycline adsorption: Implications on wastewater treatment. J. Environ. Manag. 2021, 283, 111989. [Google Scholar] [CrossRef]
- Zaccone, C.; Cocozza, C.; D’Orazio, V.; Plaza, C.; Cheburkin, A.; Miano, T.M. Influence of extractant on quality and trace elements content of peat humic acids. Talanta 2007, 73, 820–830. [Google Scholar] [CrossRef]
- Zaccone, C.; Miano, T.M.; Shotyk, W. Qualitative comparison between raw peat and related humic acids in an ombrotrophic bog profile. Org. Geochem. 2007, 38, 151–160. [Google Scholar] [CrossRef]
- Cocozza, C.; D’Orazio, V.; Miano, T.M.; Shotyk, W. Characterization of solid and aqueous phases of a peat bog profile using molecular fluorescence spectroscopy, ESR and FT-IR, and comparison with physical properties. Org. Geochem. 2003, 34, 49–60. [Google Scholar] [CrossRef]
- Li, C.-I.; Fan, J.I.; Wang, S.; Zhang, J.-J.; Gao, Q.; Wu, J.-G.; Zhao, L.-P.; Wang, L.-C.; Zheng, L.-R. Adsorption of Cu(II) on humic acids derived from different organic materials. J. Integr. Agric. 2015, 14, 168–177. [Google Scholar] [CrossRef] [Green Version]
- Lim, S.-F.; Lee, A.Y.W. Kinetic study on removal of heavy metal ions from aqueous solution by using soil. Environ. Sci. Pollut. Res. 2015, 22, 10144–10158. [Google Scholar] [CrossRef]
- Schiewer, S.; Volesky, B. Modeling multi-metal ion exchange in biosorption. Environ. Sci. Technol. 1996, 30, 2921–2927. [Google Scholar] [CrossRef]
- Tipping, E. Humic ion-binding model VI: An improved description of the interactions of protons and metal ions with humic substances. Aquat. Geochem. 1998, 4, 3–48. [Google Scholar] [CrossRef]
- Kalmykova, Y.; Strömvall, A.M.; Steenari, B.M. Adsorption of Cd, Cu, Ni, Pb and Zn on Sphagnum peat from solutions with low metal concentrations. J. Hazards Mater. 2008, 152, 885–891. [Google Scholar] [CrossRef]
- Villaverde, P.; Gondar, D.; Antelo, J.; Lopez, R.; Fiol, S.; Arce, F. Influence of pH on copper, lead and cadmium binding by an ombrotrophic peat. Eur. J. Soil Sci. 2009, 60, 377–385. [Google Scholar] [CrossRef]
- Zehra, T.; Lim, L.B.L.; Priyantha, N. Characterization of peat samples collected from Brunei Darussalam and their evaluation as potential adsorbents for Cu(II) removal from aqueous solution. Desalination Water Treat. 2015, 57, 20889–20903. [Google Scholar] [CrossRef]
- Ma, W.; Tobin, J.M. Determination and modelling of effects of pH on peat biosorption of chromium, copper and cadmium. Biochem. Eng. J. 2004, 18, 33–40. [Google Scholar] [CrossRef]
- Gosset, T.; Trancart, J.L.; Thévenot, D.R. Batch metal removal by peat. Kinetics and thermodynamics. Water Res. 1986, 20, 21–26. [Google Scholar] [CrossRef] [Green Version]
- Burdukov, A.P.; Popov, V.I.; Chernetskiy, M.Y.; Dekterev, A.A.; Hanjalić, K. Mechanical activation of micronized coal: Pro-559 spects for new combustion applications. Appl. Therm. Eng. 2015, 74, 174–181. [Google Scholar] [CrossRef]
- Ivanov, A.A.; Maltseva, E.V.; Yudina, N.V. Composition of fulvic acids after the mechanical activation of peats. Solid Fuel Chem. 2016, 50, 7–11. [Google Scholar] [CrossRef]
- Vakili, M.; Qiu, W.; Cagnetta, G.; Huang, J.; Yu, G. Solvent-free mechanochemical mild oxidation method to enhance adsorption properties of chitosan. Front. Environ. Sci. Eng. 2021, 15, 128. [Google Scholar] [CrossRef]
- Ho, Y.S.; Porter, J.F.; McKay, G. Equilibrium isotherm studies for the sorption of divalent metal ions onto peat: Copper, nickel and lead single component systems. Water. Air. Soil Pollut. 2022, 141, 1–33. [Google Scholar] [CrossRef]
- Essington, M.E. Soil and Water Chemistry: An Investigative Approach, 2nd ed.; CRC Press: London, UK, 2021; 656p. [Google Scholar]
- Abat, M.; McLaughlin, M.J.; Kirby, J.K.; Stacey, S.P. Adsorption and desorption of copper and zinc in tropical peat soils of Sarawak, Malaysia. Geoderma 2012, 175–176, 58–63. [Google Scholar] [CrossRef]
- Charazi’nska, S.; Lochy´nski, P.; Burszta-Adamiak, E. Removal of heavy metal ions form acidic electrolyte for stainless steel electropolishing via adsorption using Polish peats. J. Water Process Eng. 2021, 42, 102169. [Google Scholar] [CrossRef]
- Koivula, M.P.; Kujala, K.; Rönkkömäki, H.; Mäkelä, M. Sorption of Pb(II), Cr(III), Cu(II), As(III) to peat, and utilization of the sorption properties in industrial waste landfill hydraulic barrier layers. J. Hazards Mater. 2009, 164, 345–352. [Google Scholar] [CrossRef]
- Liu, Z.-r.; Zhou, L.-m.; Wei, P.; Zeng, K.; Wen, C.-x.; Lan, H.-h. Competitive adsorption of heavy metal ions on peat. J. China Univ. Min. Technol. 2008, 18, 255–260. [Google Scholar] [CrossRef]
- Qin, F.; Wen, B.; Shan, X.-Q.; Xie, Y.-N.; Liu, T.; Zhang, S.-Z.; Khan, S.U. Mechanisms of competitive adsorption of Pb, Cu, and Cd on peat. Environ. Pollut. 2006, 144, 669–680. [Google Scholar] [CrossRef]
- Shi, W.; Lu, C.; He, J.; En, H.; Gao, M.; Zhao, B.; Zhou, B.; Zhou, H.; Liu, H.; Zhang, Y. Nature differences of humic acids fractions induced by extracted sequence as explanatory factors for binding characteristics of heavy metals. Ecotoxicol. Environ. Saf. 2018, 154, 59–68. [Google Scholar] [CrossRef]
- Novikova, S.P.; Gaskova, O.L. Influence of natural fulvic acids on the solubility of sulfide ores (experimental study). Russ. Geol. Geophys. 2013, 54, 509–517. [Google Scholar] [CrossRef]
- Kolpakova, M.N.; Gaskova, O.L.; Naymushina, O.S.; Krivonogov, S.K. Ebeity Lake, Russia: Chemival-organic and mineral composition of water and bottom sediments. Bull. Tomsk Polytech. Univ. 2018, 329, 111–123. [Google Scholar]
- Kolpakova, M.; Gaskova, O.; Borzenko, S.; Krivonogov, S.; Naymushina, O.; Rudaya, N. Distribution profile of chemical elements during the last 13 thousand years from the sediments of maloye Yarovoe lake (Western Siberia, Russia). Water 2020, 12, 3001. [Google Scholar] [CrossRef]
- Takahashi, Y.; Minai, Y.; Ambeb, S.; Makide, Y.; Ambeb, F.; Tominaga, T. Simultaneous determination of stability constants of humate complexes with various metal ions using multitracer technique. Sci. Total Environ. 1997, 98, 61–71. [Google Scholar] [CrossRef]
Figure 1.
SEM images of natural peat (a), mechanically activated peat (b), mechanochemically activated peat (c).
Figure 1.
SEM images of natural peat (a), mechanically activated peat (b), mechanochemically activated peat (c).

Figure 2.
XRD patterns of NP, MAP, and MCAP. * shows the reflections of quartz SiO2 (PDF-2 no. 01-070-3755).
Figure 2.
XRD patterns of NP, MAP, and MCAP. * shows the reflections of quartz SiO2 (PDF-2 no. 01-070-3755).

Figure 3.
Determination of the total amount of charged groups in the peat moss samples by potentiomenric titration within the рН range of 2–13.
Figure 3.
Determination of the total amount of charged groups in the peat moss samples by potentiomenric titration within the рН range of 2–13.

Figure 4.
FTIR spectrum of natural peat (NP), mechanically activated peat (MAP), mechanochemically activated peat (MCAP).
Figure 4.
FTIR spectrum of natural peat (NP), mechanically activated peat (MAP), mechanochemically activated peat (MCAP).

Figure 5.
Removal percent of Cu2+ on NP at pH ~3.5 and water-peat ratio 100:1; contact time is shown at the bottom in hours. Statistical spread in R values amount 3%.
Figure 5.
Removal percent of Cu2+ on NP at pH ~3.5 and water-peat ratio 100:1; contact time is shown at the bottom in hours. Statistical spread in R values amount 3%.

Figure 6.
Distribution ratio KD vs equilibrium copper concentration in solution (a) and pH (b). Squares of different colors indicate the initial copper concentration.
Figure 6.
Distribution ratio KD vs equilibrium copper concentration in solution (a) and pH (b). Squares of different colors indicate the initial copper concentration.

Figure 7.
Removal percent of Cu(II) on three peat modifications at 30 min interaction time, pH 4.6–3.2.
Figure 7.
Removal percent of Cu(II) on three peat modifications at 30 min interaction time, pH 4.6–3.2.

Figure 8.
Equilibrium adsorption isotherms of Cu2+ on natural peat (NP), mechanically activated peat (MAP), mechanochemically activated peat (MCAP).
Figure 8.
Equilibrium adsorption isotherms of Cu2+ on natural peat (NP), mechanically activated peat (MAP), mechanochemically activated peat (MCAP).

Figure 9.
Langmuir (a) and Freundlich (b) isotherms of Cu2+ sorption on natural peat (NP), mechanically activated peat (MAP), mechanochemically activated peat (MCAP).
Figure 9.
Langmuir (a) and Freundlich (b) isotherms of Cu2+ sorption on natural peat (NP), mechanically activated peat (MAP), mechanochemically activated peat (MCAP).

Figure 10.
FTIR spectra of MAP (a) and MCAP (b) before (1, 3) and after (2, 4) copper sorption: initial copper concentration is 150 mg/L, contact time is 30 min, reaction temperature is 25 °C.
Figure 10.
FTIR spectra of MAP (a) and MCAP (b) before (1, 3) and after (2, 4) copper sorption: initial copper concentration is 150 mg/L, contact time is 30 min, reaction temperature is 25 °C.

Figure 11.
Total copper upload according to the experimental and model data depending on the initial content of copper in solution. The symbol TrmAdd refer to the amount of sorbent 2.5 g.
Figure 11.
Total copper upload according to the experimental and model data depending on the initial content of copper in solution. The symbol TrmAdd refer to the amount of sorbent 2.5 g.

Table 1.
Physical and chemical properties of peat, pH, and EC of the water of the Ubinskoe peat bog.
Table 1.
Physical and chemical properties of peat, pH, and EC of the water of the Ubinskoe peat bog.
| Organic Matter Content | Ash | pH | EC | SiO2 | CaO | Al2O3 | SO3 | MgO | Fe2O3 | Na2O | Cu |
|---|---|---|---|---|---|---|---|---|---|---|---|
| % | % | µS/cm | % | ppb | |||||||
| 97.8 | 2.2 | 4.0 | 127.1 | 0.76 | 0.45 | 0.29 | 0.27 | 0.25 | 0.24 | 0.02 | 13.6 |
Table 2.
CHNS analysis for the peat.
| %C | %H | %N | %S | H/C | C/N |
|---|---|---|---|---|---|
| 43.76 | 5.53 | 0.57 | - | 1.50 | 91.1 |
Table 3.
Surface properties of natural peat (NP), mechanically activated peat (MAP), mechanochemically activated peat (MCAP).
Table 3.
Surface properties of natural peat (NP), mechanically activated peat (MAP), mechanochemically activated peat (MCAP).
| Sample | CBET * | am, mol/g | Sspec, m2/g (BET Method) | Sspec, m2/g (Greg and Sing Approximation [43]) |
|---|---|---|---|---|
| NP | 6.3 | 0.96 | 4.2 ± 0.3 | 6.9 ± 0.5 |
| MAP | 18.2 | 0.86 | 3.7 ± 0.3 | 5.9 ± 0.4 |
| MCAP | 27.8 | 1.10 | 4.8 ± 0.3 | 7.0 ± 0.5 |
* CBET is the BET energetic parameter (a dimensionless quantity); am—monolayer capacity (mol/g).
Table 4.
The content of phenolic and carboxyl groups in the peat samples according to reverse potentiometric titration, mmol/g.
Table 4.
The content of phenolic and carboxyl groups in the peat samples according to reverse potentiometric titration, mmol/g.
| Sample | Ph-OH | Ar-COOH | Alk-COOH |
|---|---|---|---|
| NP | 7.7 ± 0.6 | 5.3 ± 0.5 | 2.0 ± 0.3 |
| MAP | 7.0 ± 0.7 | 3.5 ± 0.6 | 1.7 ± 0.4 |
| MCAP | 5.5 ± 0.4 | 2.4 ± 0.5 | 0.5 ± 0.2 |
Table 5.
Isotherm parameters Langmuir and Freundlich sorption for natural peat (NP), mechanically activated peat (MAP), mechanochemically activated peat (MCAP).
Table 5.
Isotherm parameters Langmuir and Freundlich sorption for natural peat (NP), mechanically activated peat (MAP), mechanochemically activated peat (MCAP).
| Isotherm | Sample | Parameters | ||
|---|---|---|---|---|
| Langmuir | Q (mg/g) | KL | r2 | |
| NP | 24.1 | 0.30 | 0.878 | |
| MAP | 42.1 | 0.23 | 0.970 | |
| MCAP | 16.0 | 0.07 | 0.889 | |
| Freundlich | n | Kf | r2 | |
| NP | 2.31 | 30.0 | 0.977 | |
| MAP | 2.16 | 28.2 | 0.930 | |
| MCAP | 1.76 | 22.2 | 0.998 |
Publisher’s Note: MDPI stays neutral with regard to jurisdictional claims in published maps and institutional affiliations. |
© 2022 by the authors. Licensee MDPI, Basel, Switzerland. This article is an open access article distributed under the terms and conditions of the Creative Commons Attribution (CC BY) license (https://creativecommons.org/licenses/by/4.0/).
Share and Cite
MDPI and ACS Style
Shvartseva, O.; Skripkina, T.; Gaskova, O.; Podgorbunskikh, E. Modification of Natural Peat for Removal of Copper Ions from Aqueous Solutions. Water 2022, 14, 2114. https://doi.org/10.3390/w14132114
AMA Style
Shvartseva O, Skripkina T, Gaskova O, Podgorbunskikh E. Modification of Natural Peat for Removal of Copper Ions from Aqueous Solutions. Water. 2022; 14(13):2114. https://doi.org/10.3390/w14132114
Chicago/Turabian StyleShvartseva, Olga, Tatiana Skripkina, Olga Gaskova, and Ekaterina Podgorbunskikh. 2022. "Modification of Natural Peat for Removal of Copper Ions from Aqueous Solutions" Water 14, no. 13: 2114. https://doi.org/10.3390/w14132114
Note that from the first issue of 2016, this journal uses article numbers instead of page numbers. See further details here.