
Stormwater Management in the City of Warsaw: A Review and Evaluation of Technical Solutions and Strategies to Improve the Capacity of the Combined Sewer System


Abstract
:1. Introduction
2. Materials and Methods
2.1. Risk of Flooding from the Vistula River
2.2. Risks Related to Other Watercourses
- Programme and spatial concept for the reconstruction of the Długa estuary [22];
- Construction of the spillway between the Brzezinski Ditch and the Bródnowski Canal;
- Construction of a stormwater drainage system in the catchment area of the U-1 ditch.
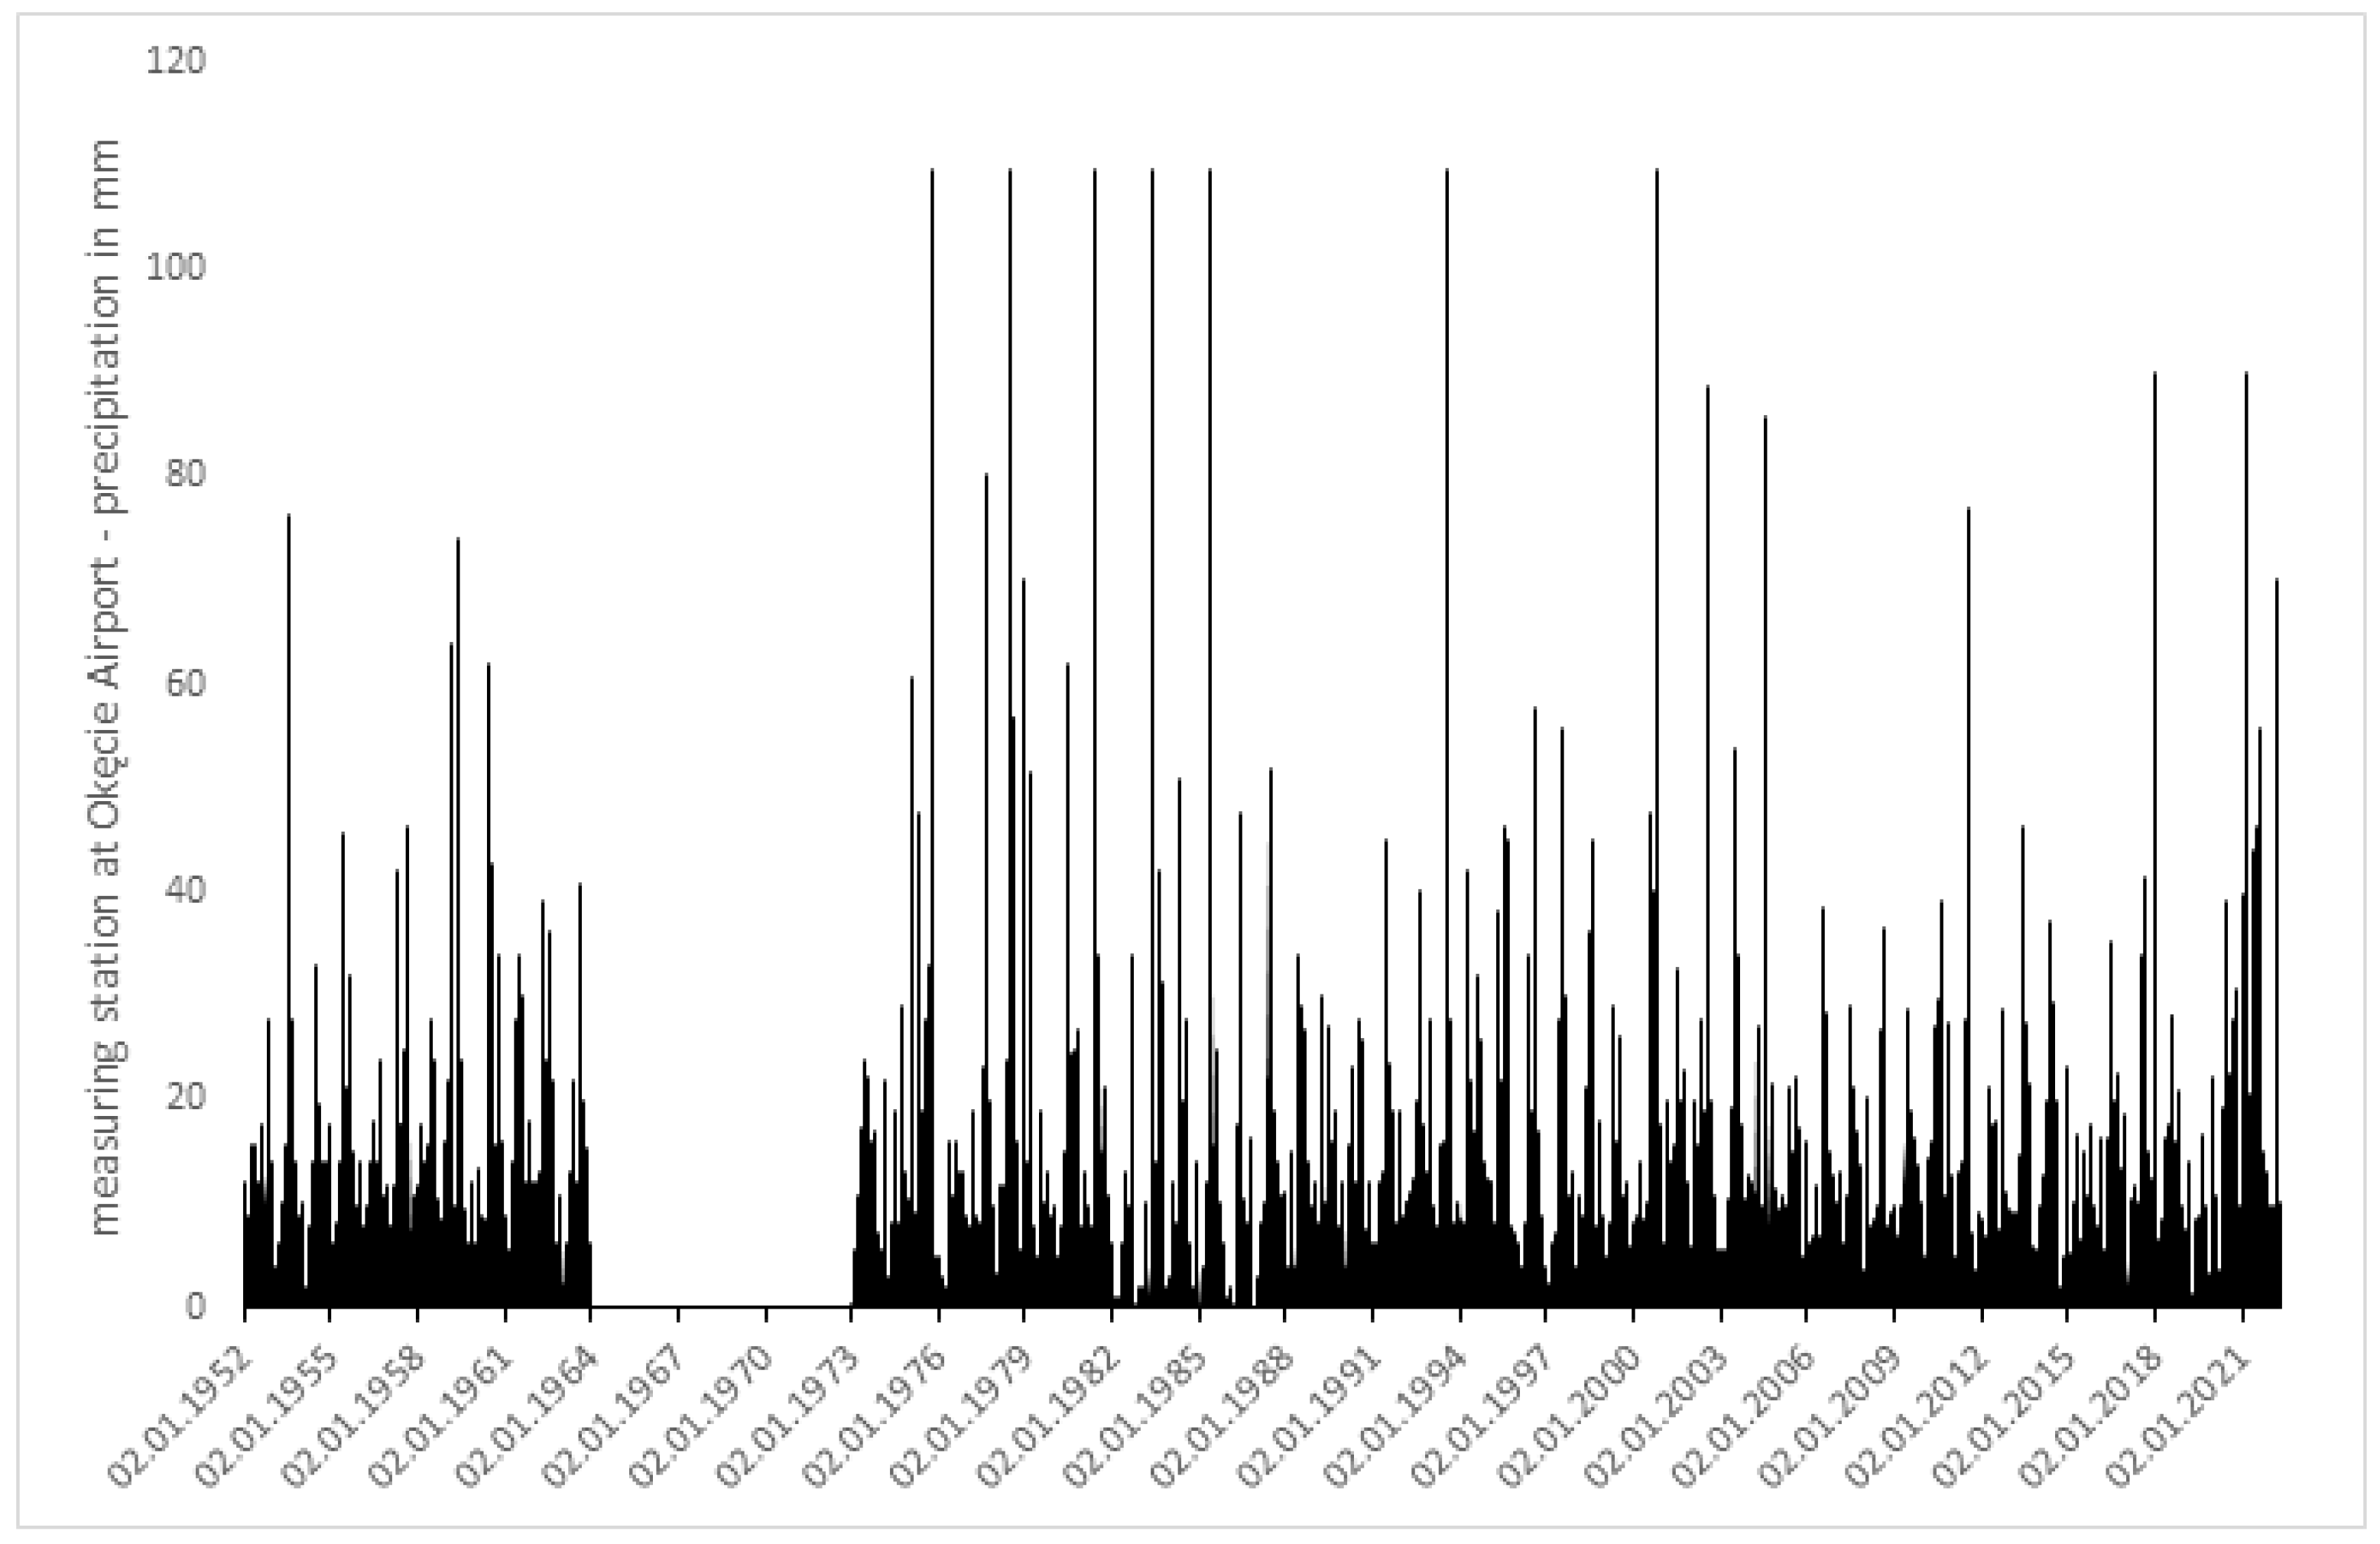
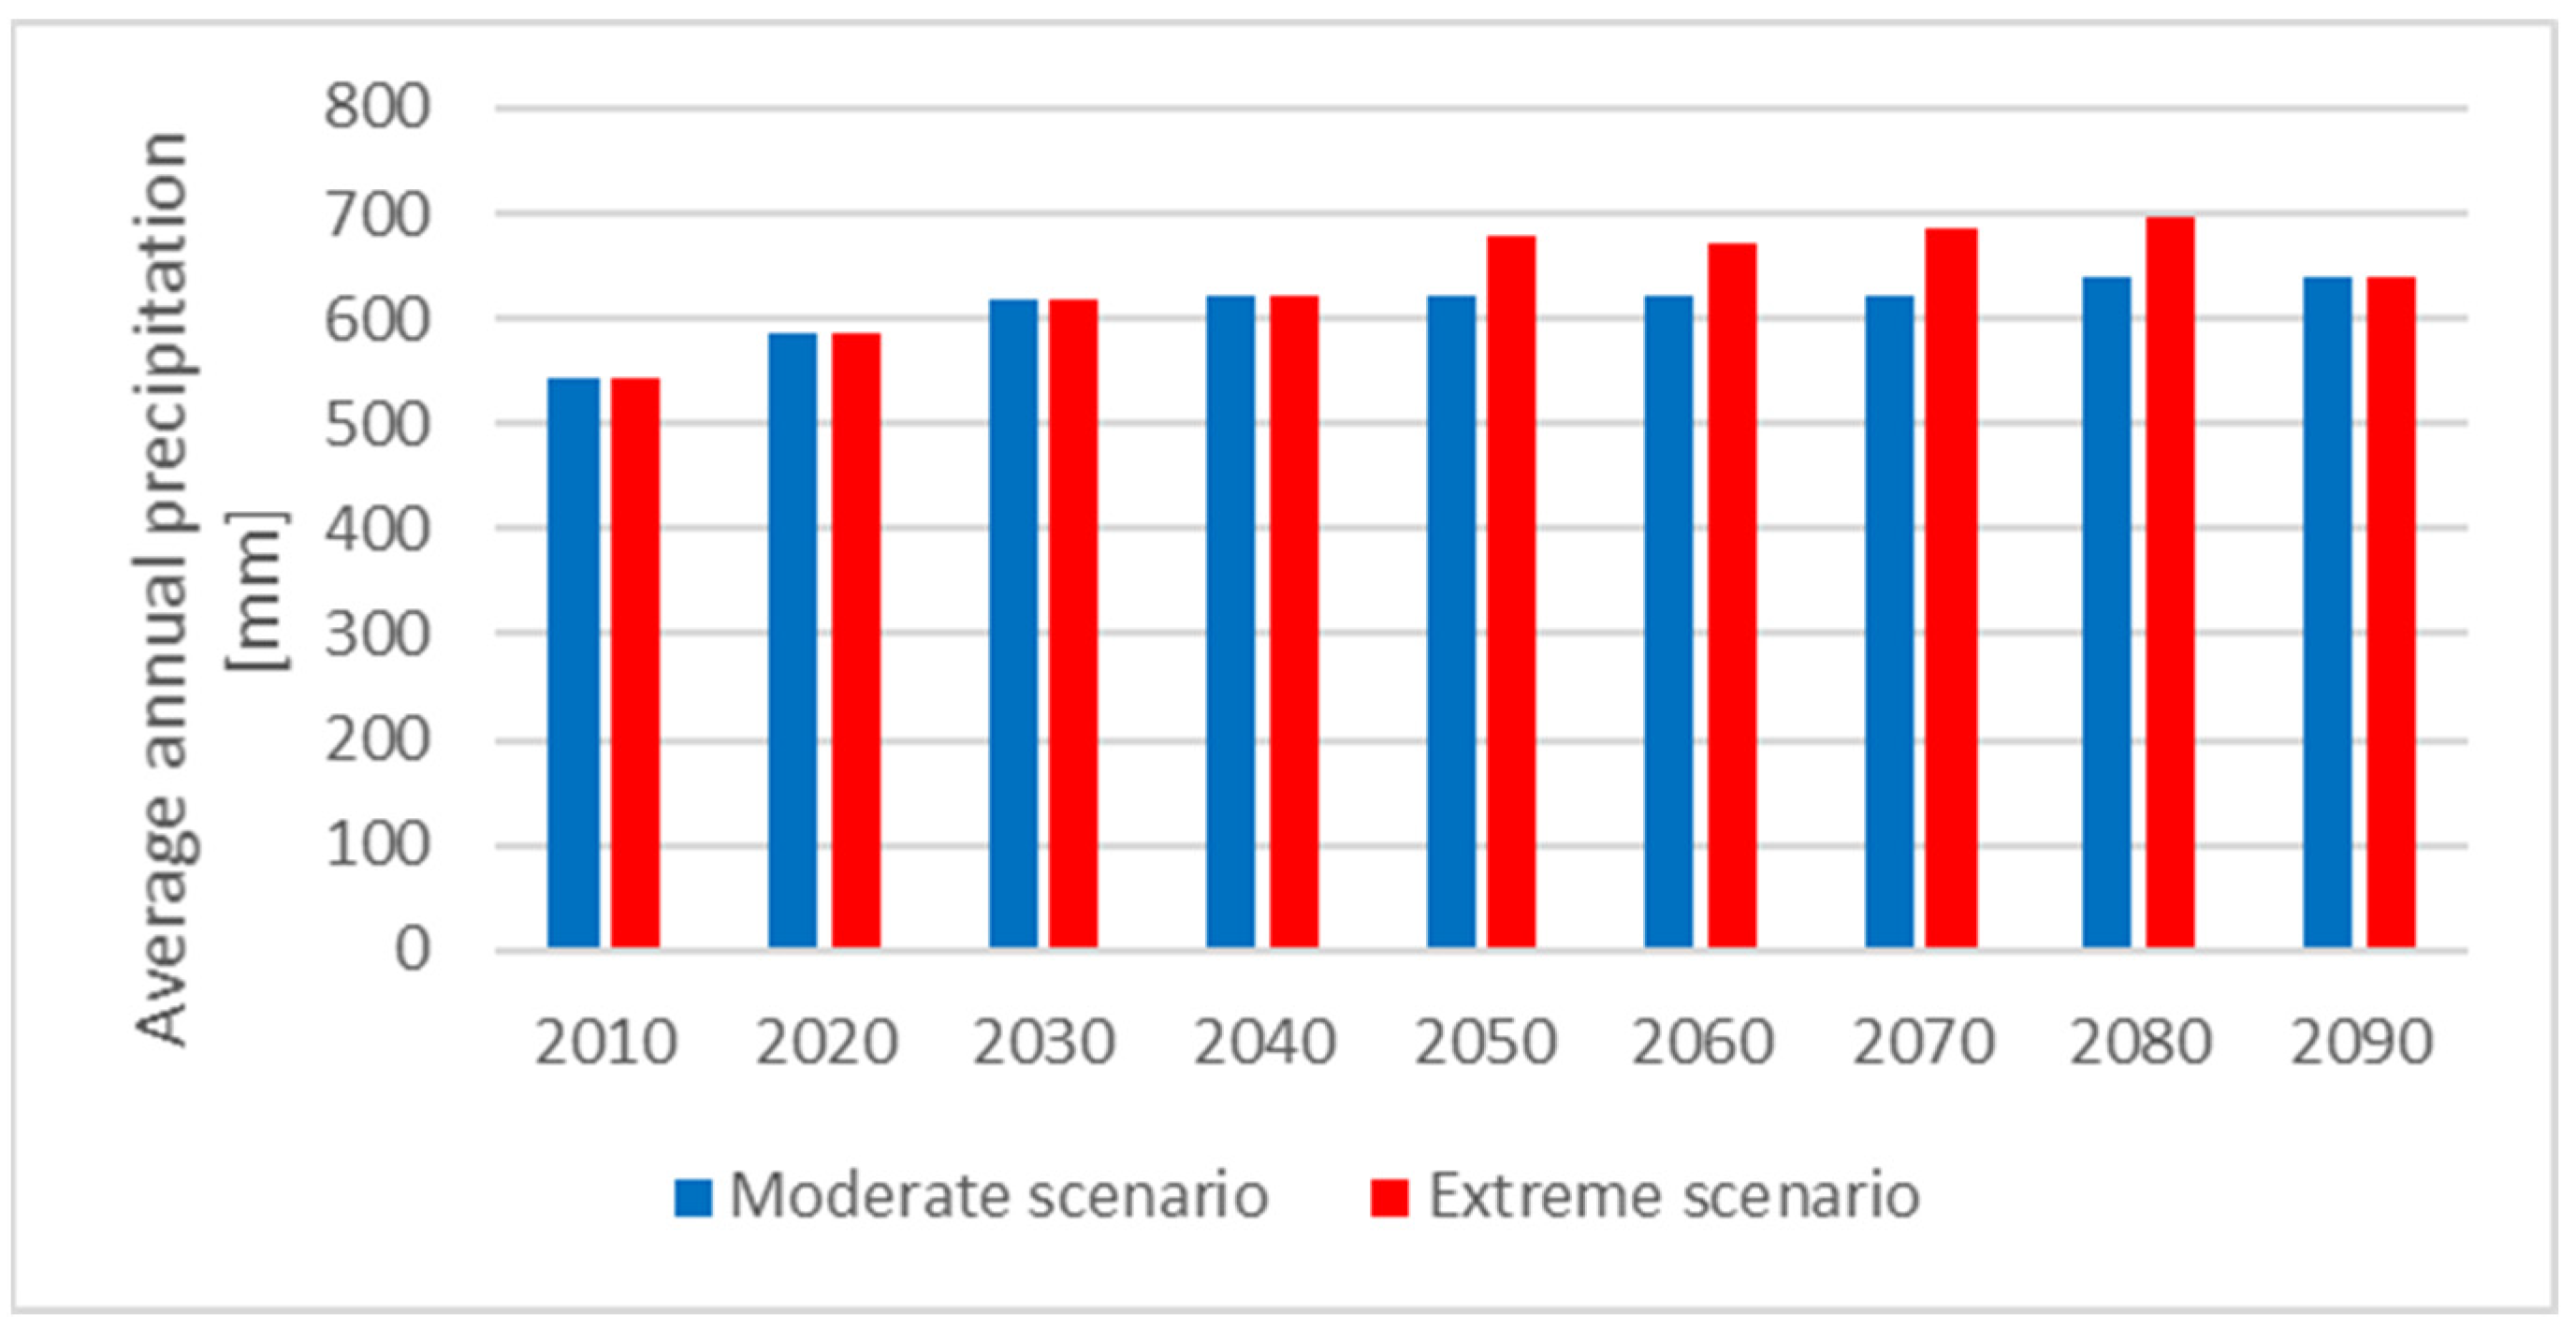
2.3. Climate Change Risk
2.4. Standards for Sewage Systems
2.5. Sustainable Drainage Systems (SuDS) and Water-Sensitive Urban Design (WSUD)
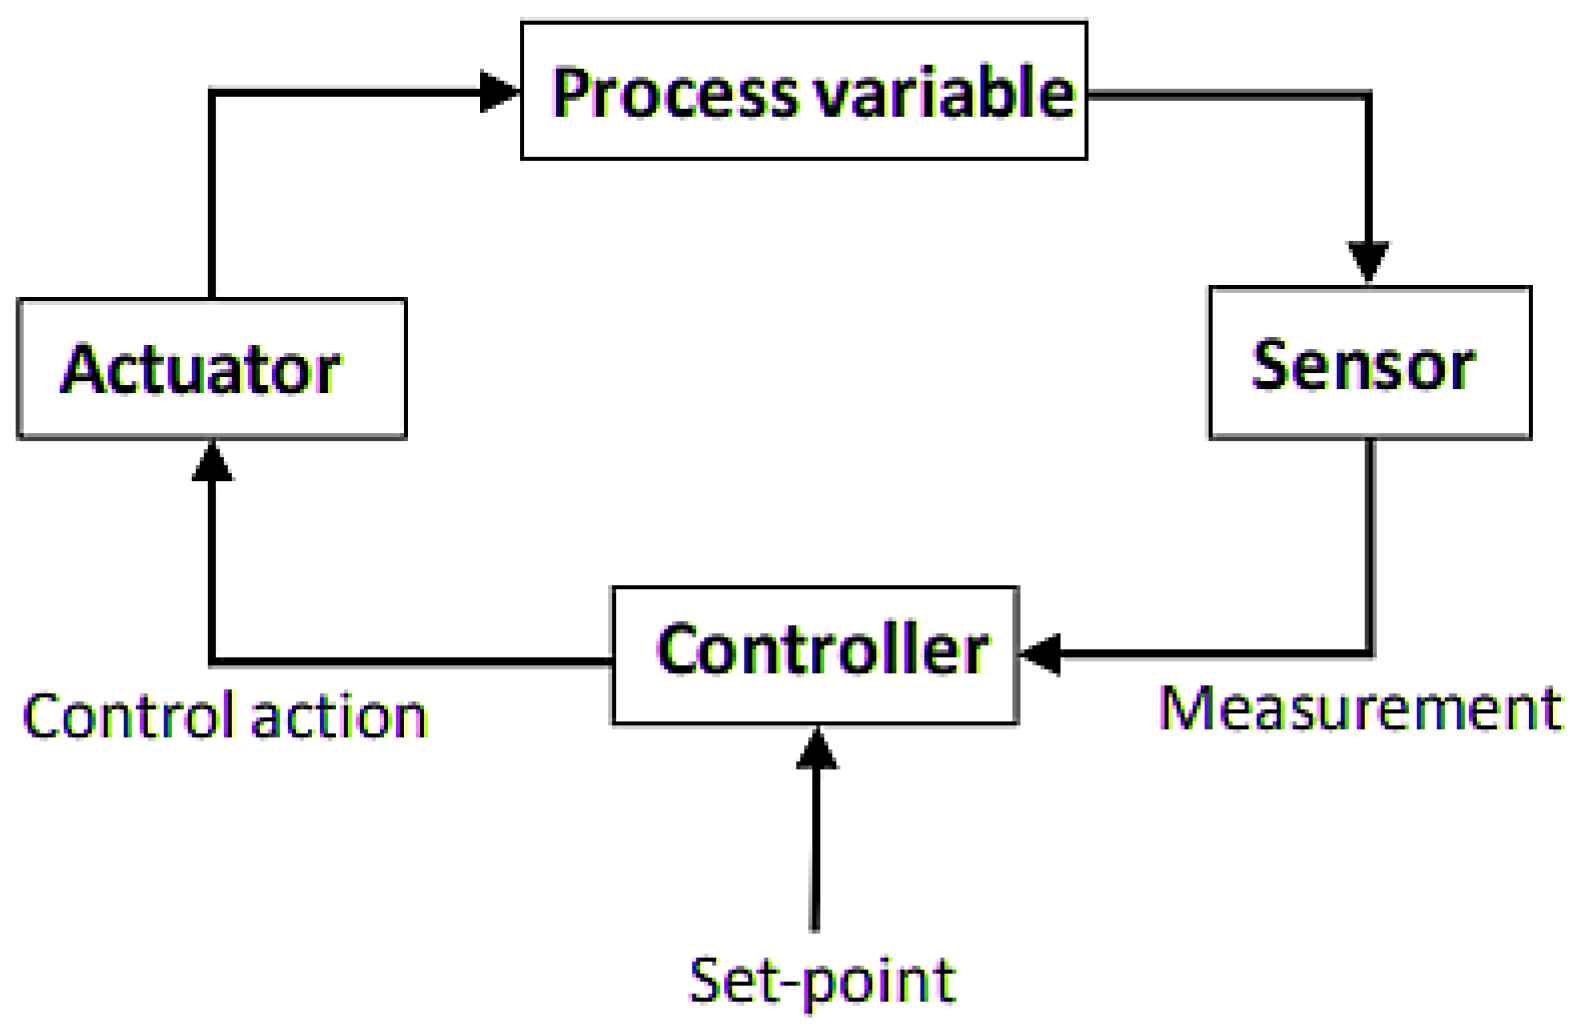
2.6. Real-Time Control (RTC)
Intelligent RTC System for Combined Sewer Network Control in Warsaw
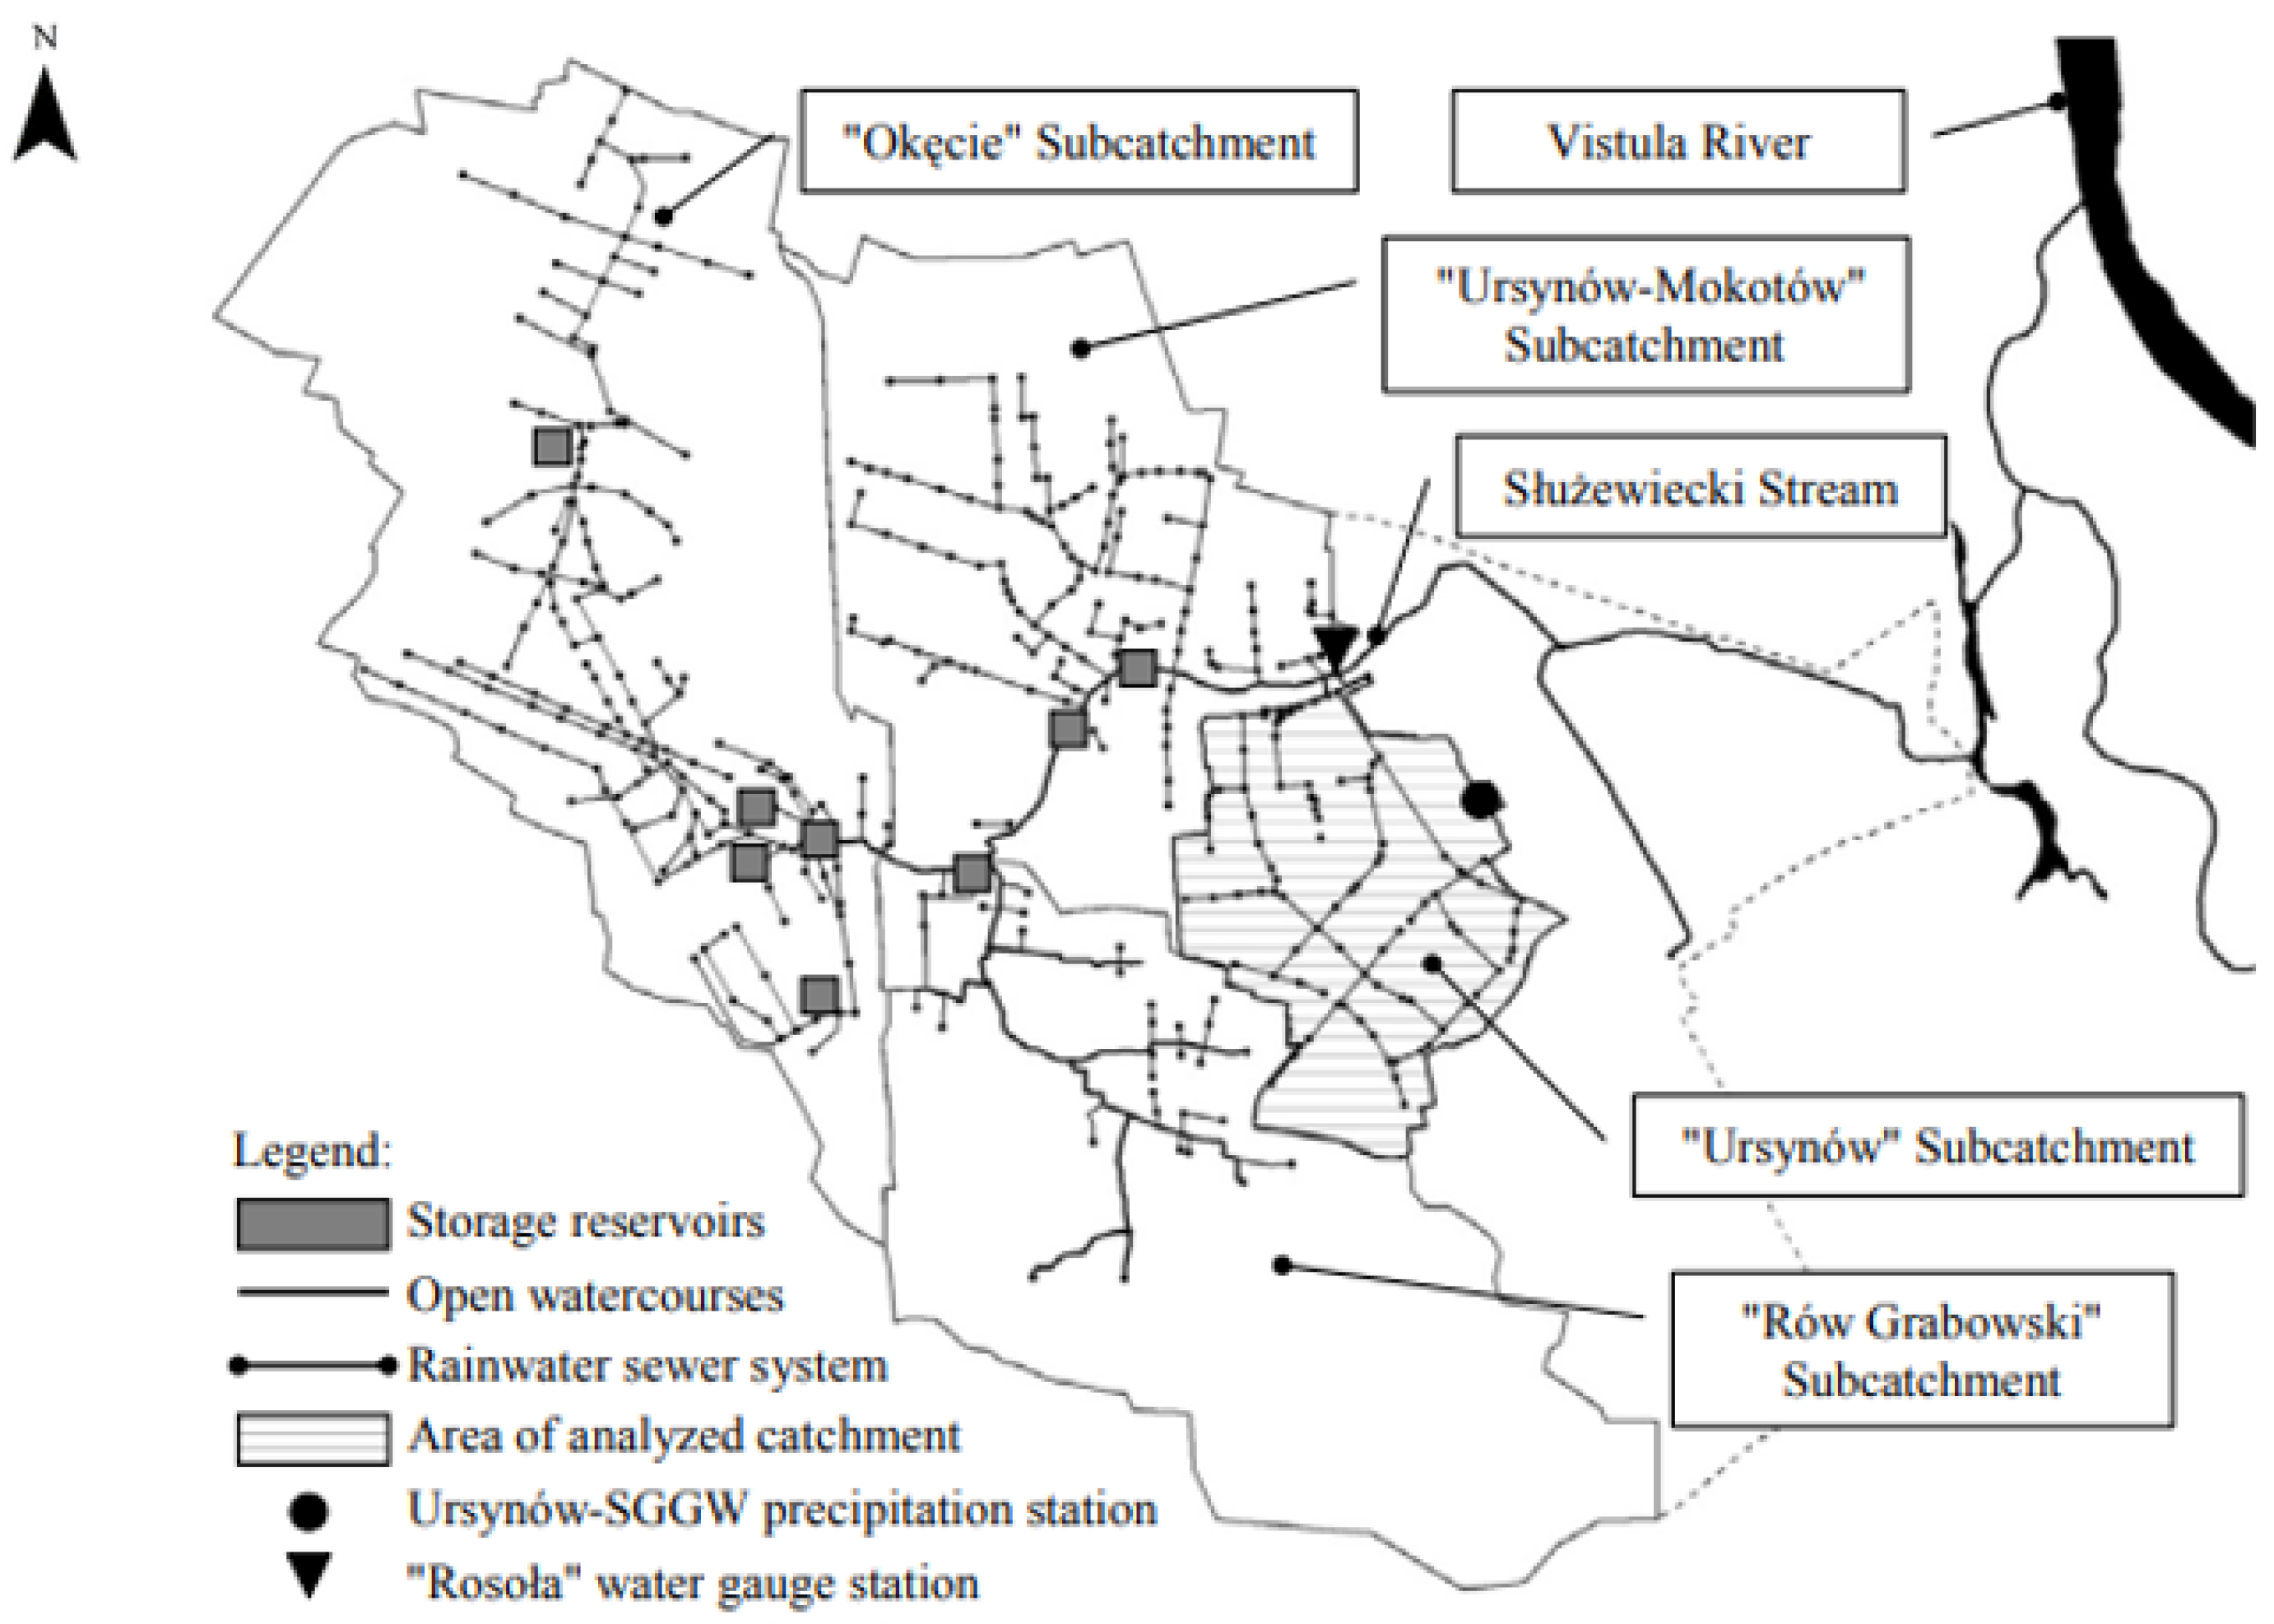
3. Służewiecki Stream
3.1. Historical Background
- Until 1997, the Służewiecki Stream was formally a sewage treatment plant and was managed by the Municipal Water and Sewage Company (MPWiK), which pursued investment goals set by the city [27];
- In 1997, the stream was classified as a “running water” by the Minister of Environment, and until 2017 it was managed by the Marshal of Mazowieckie Voivodeship through the Voivodeship Land Reclamation and Water Management Office (WZMiUW) [18];
3.2. Some Remarks on Proper Stormwater Management
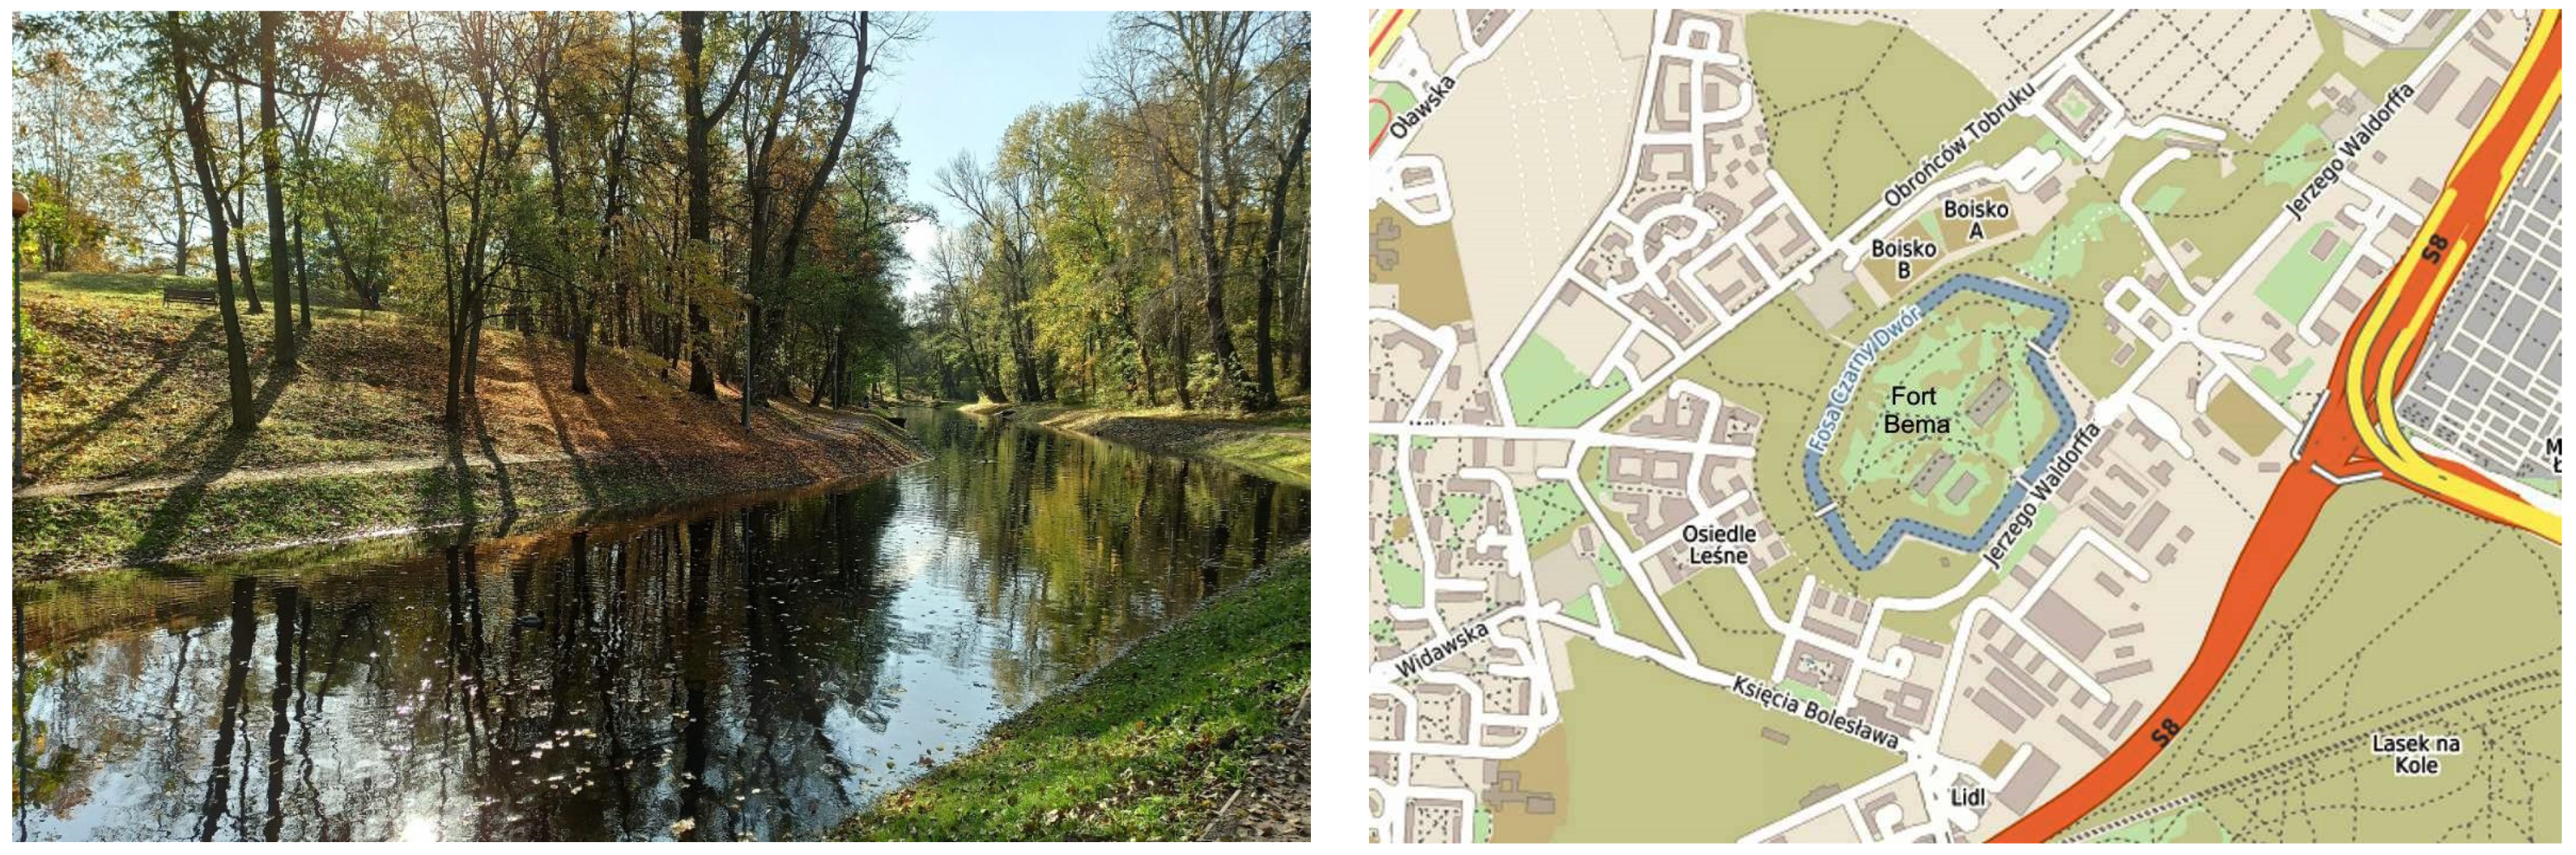
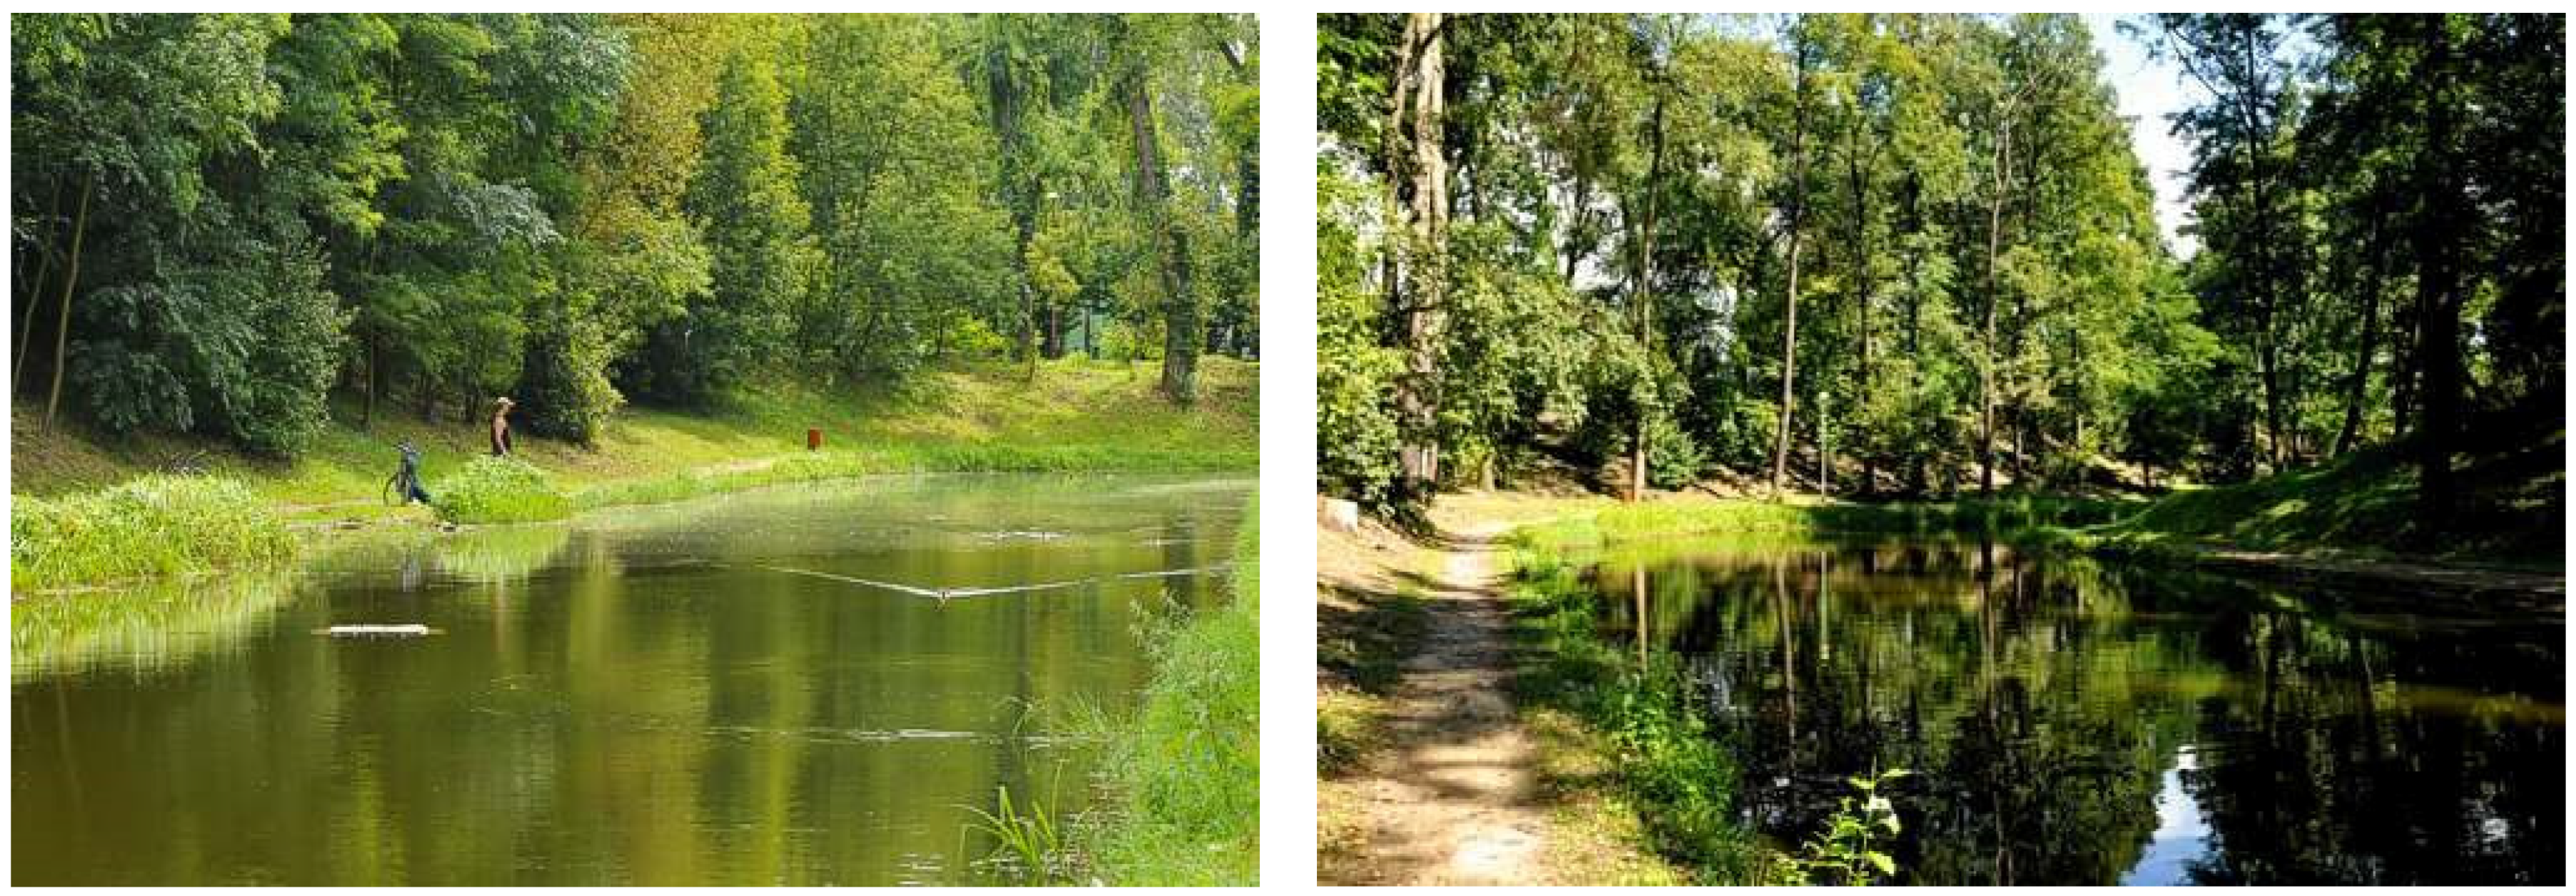
3.2.1. The Fort Bema Housing Complex Example
- ▪
- In the area of the housing estates affected by the ditch revitalisation project, the local spatial development plan was approved by the resolution of the Municipal Council of Warsaw-Bemowo, No. XIX /127/01 of 6 December 2001, in which the revitalisation of the ditch with rainwater from the housing estates is noted as a suitable solution [18,98,99];
- ▪
- The drainage system was constructed by the developer after consultation with the Voivodeship Conservator and the Bemowo Municipal Office, having previously re-planned the stormwater catchment area for 14,980,000 (i.e., 1498 hectares) and reached an agreement with the MPWiK. The realisation of such a scenario was possible because the interests of the state-owned enterprises, the Bemowo municipality and the developer were combined (a new stormwater and storm sewer system, a sewage system, electricity supply and modern road infrastructure were developed at a significantly lower price per usable area than the construction of comparable infrastructure elsewhere in Warsaw) [99].
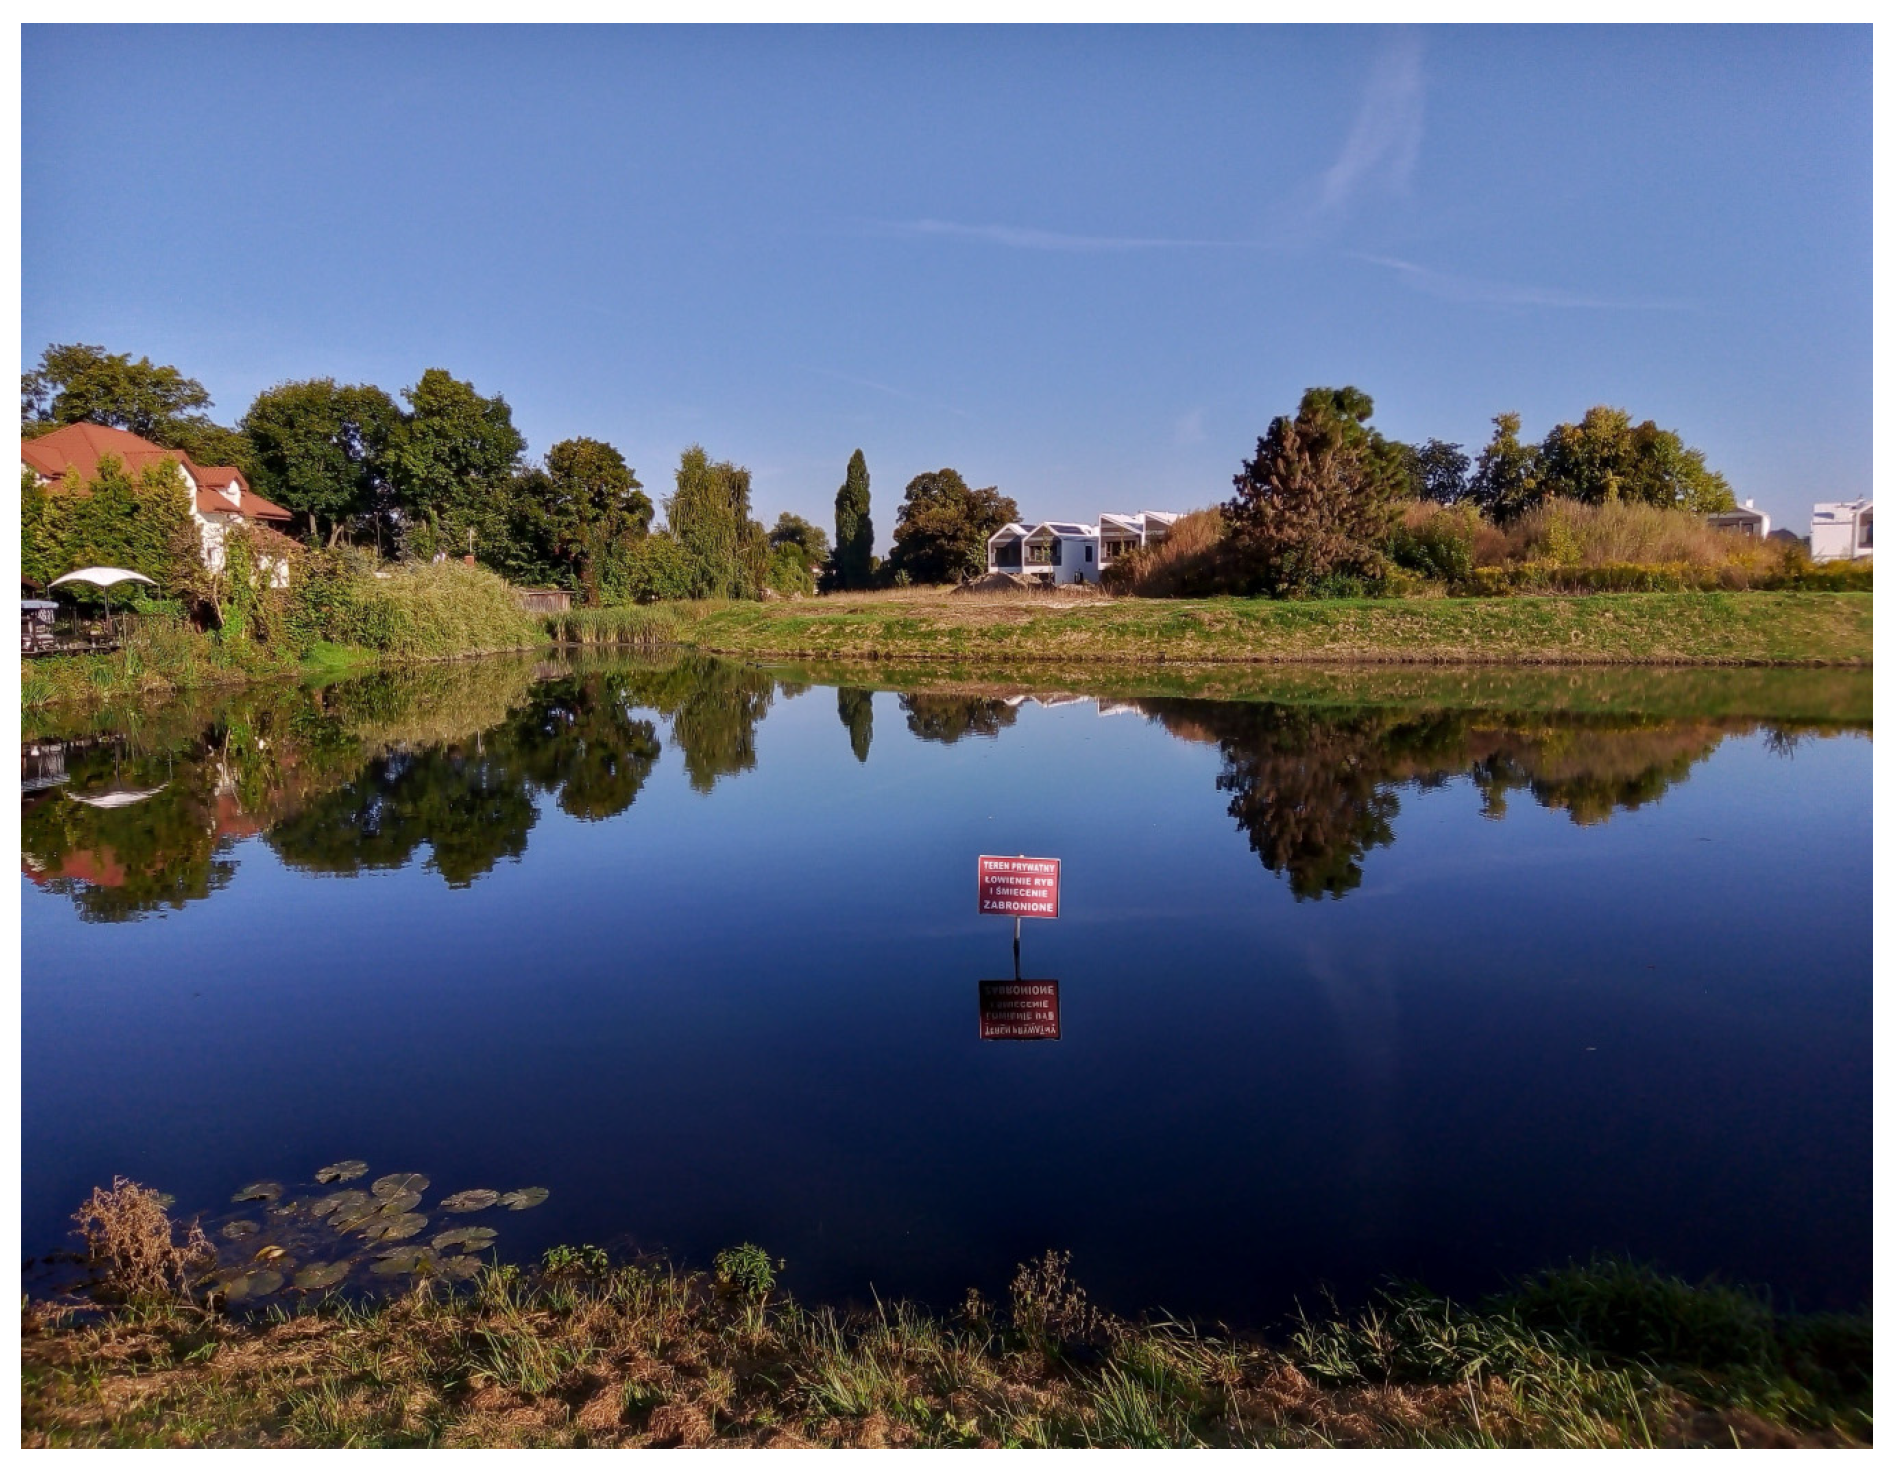
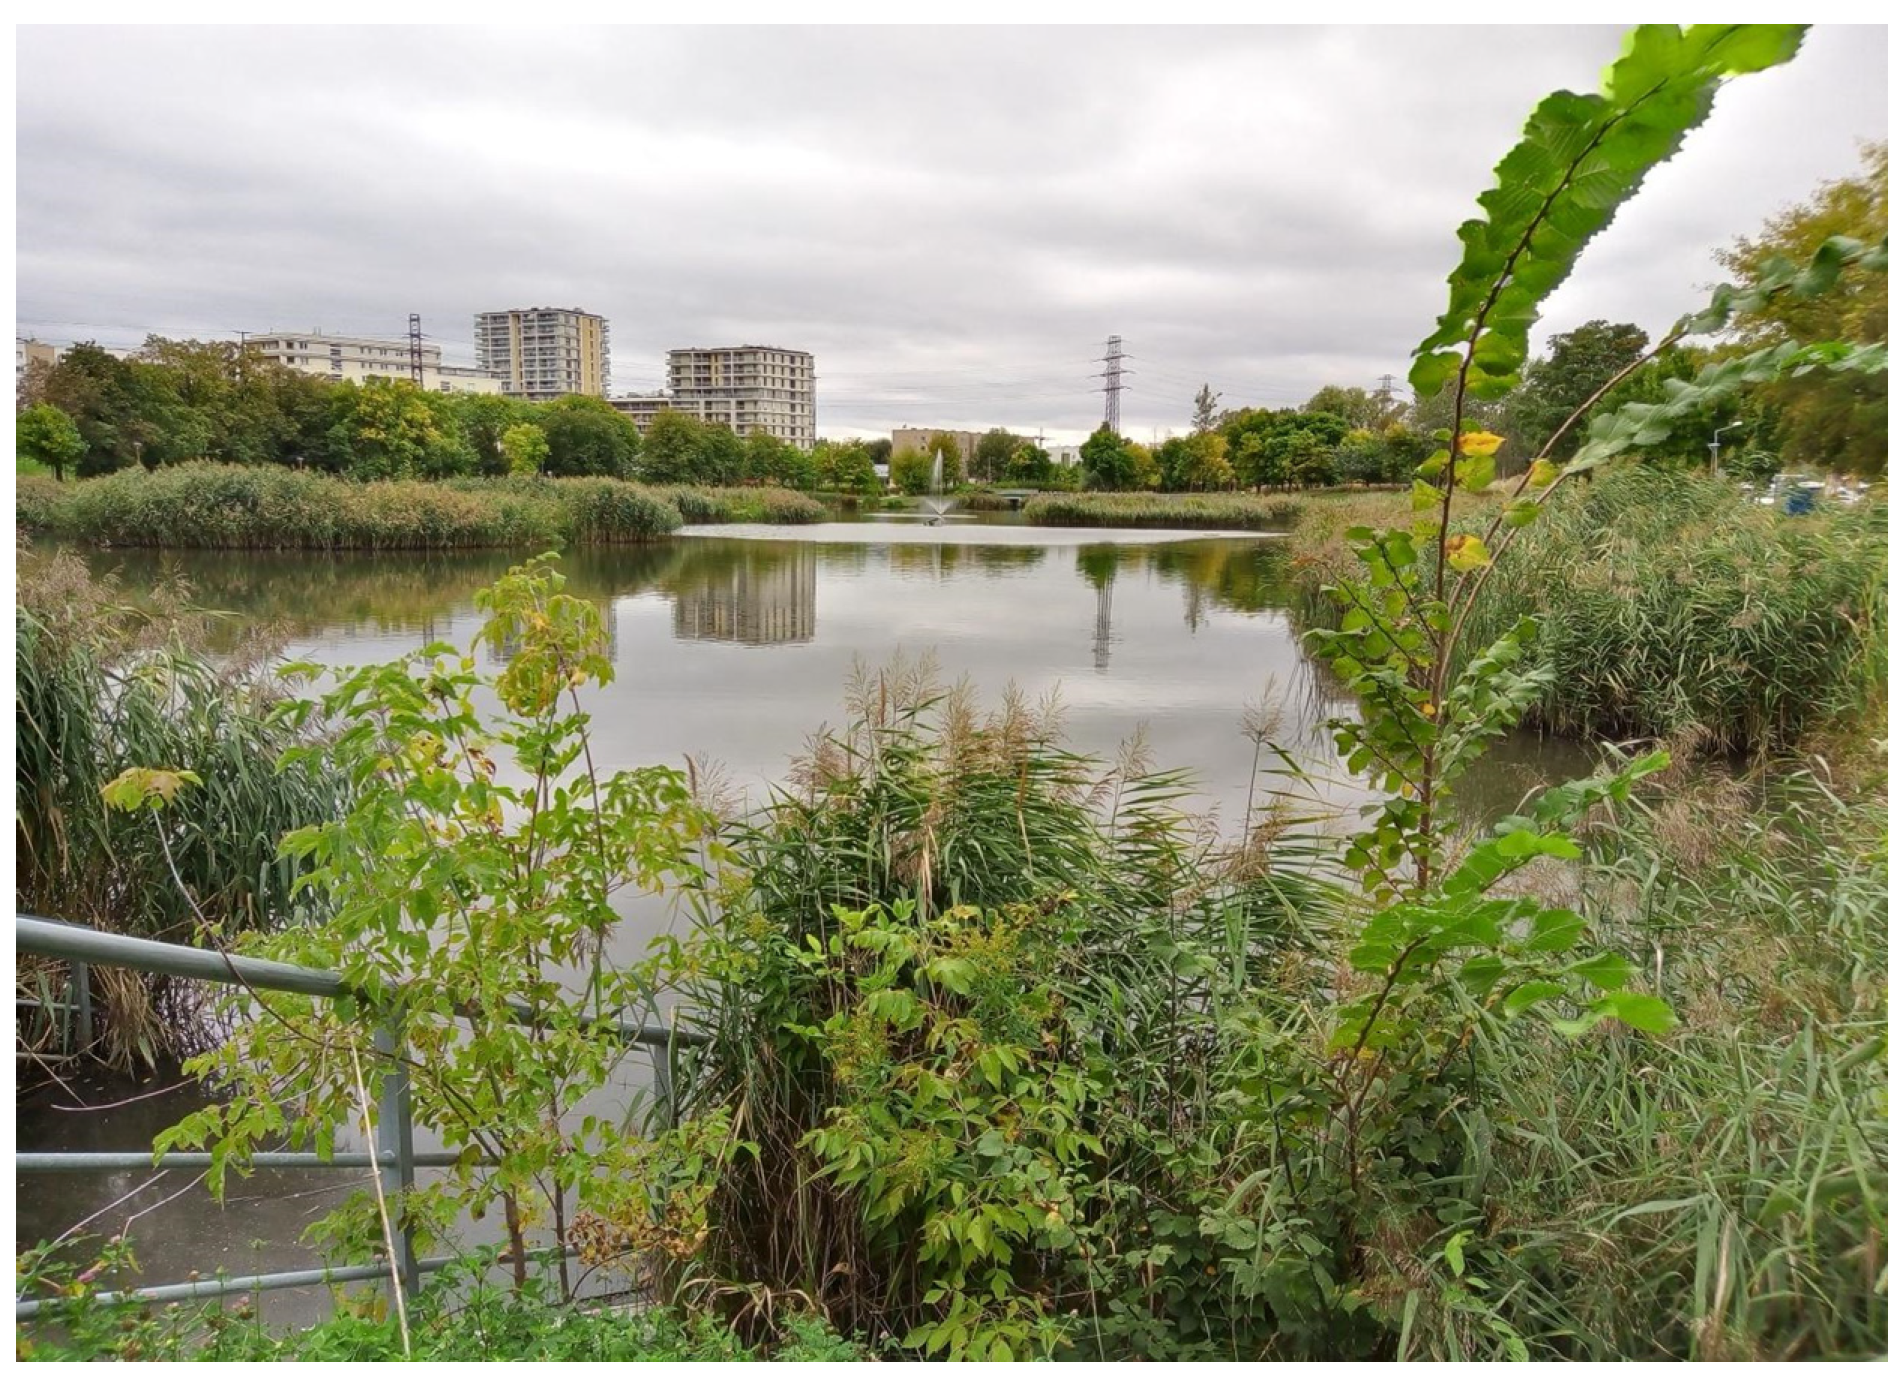
3.2.2. Służewiecki Pond—A Flow-Through Reservoir
- The reservoir has scenic qualities, with a fountain in the middle, which has a positive effect on the climate and leads to aeration of the reservoir;
- The reservoir is rich in flora and fauna.
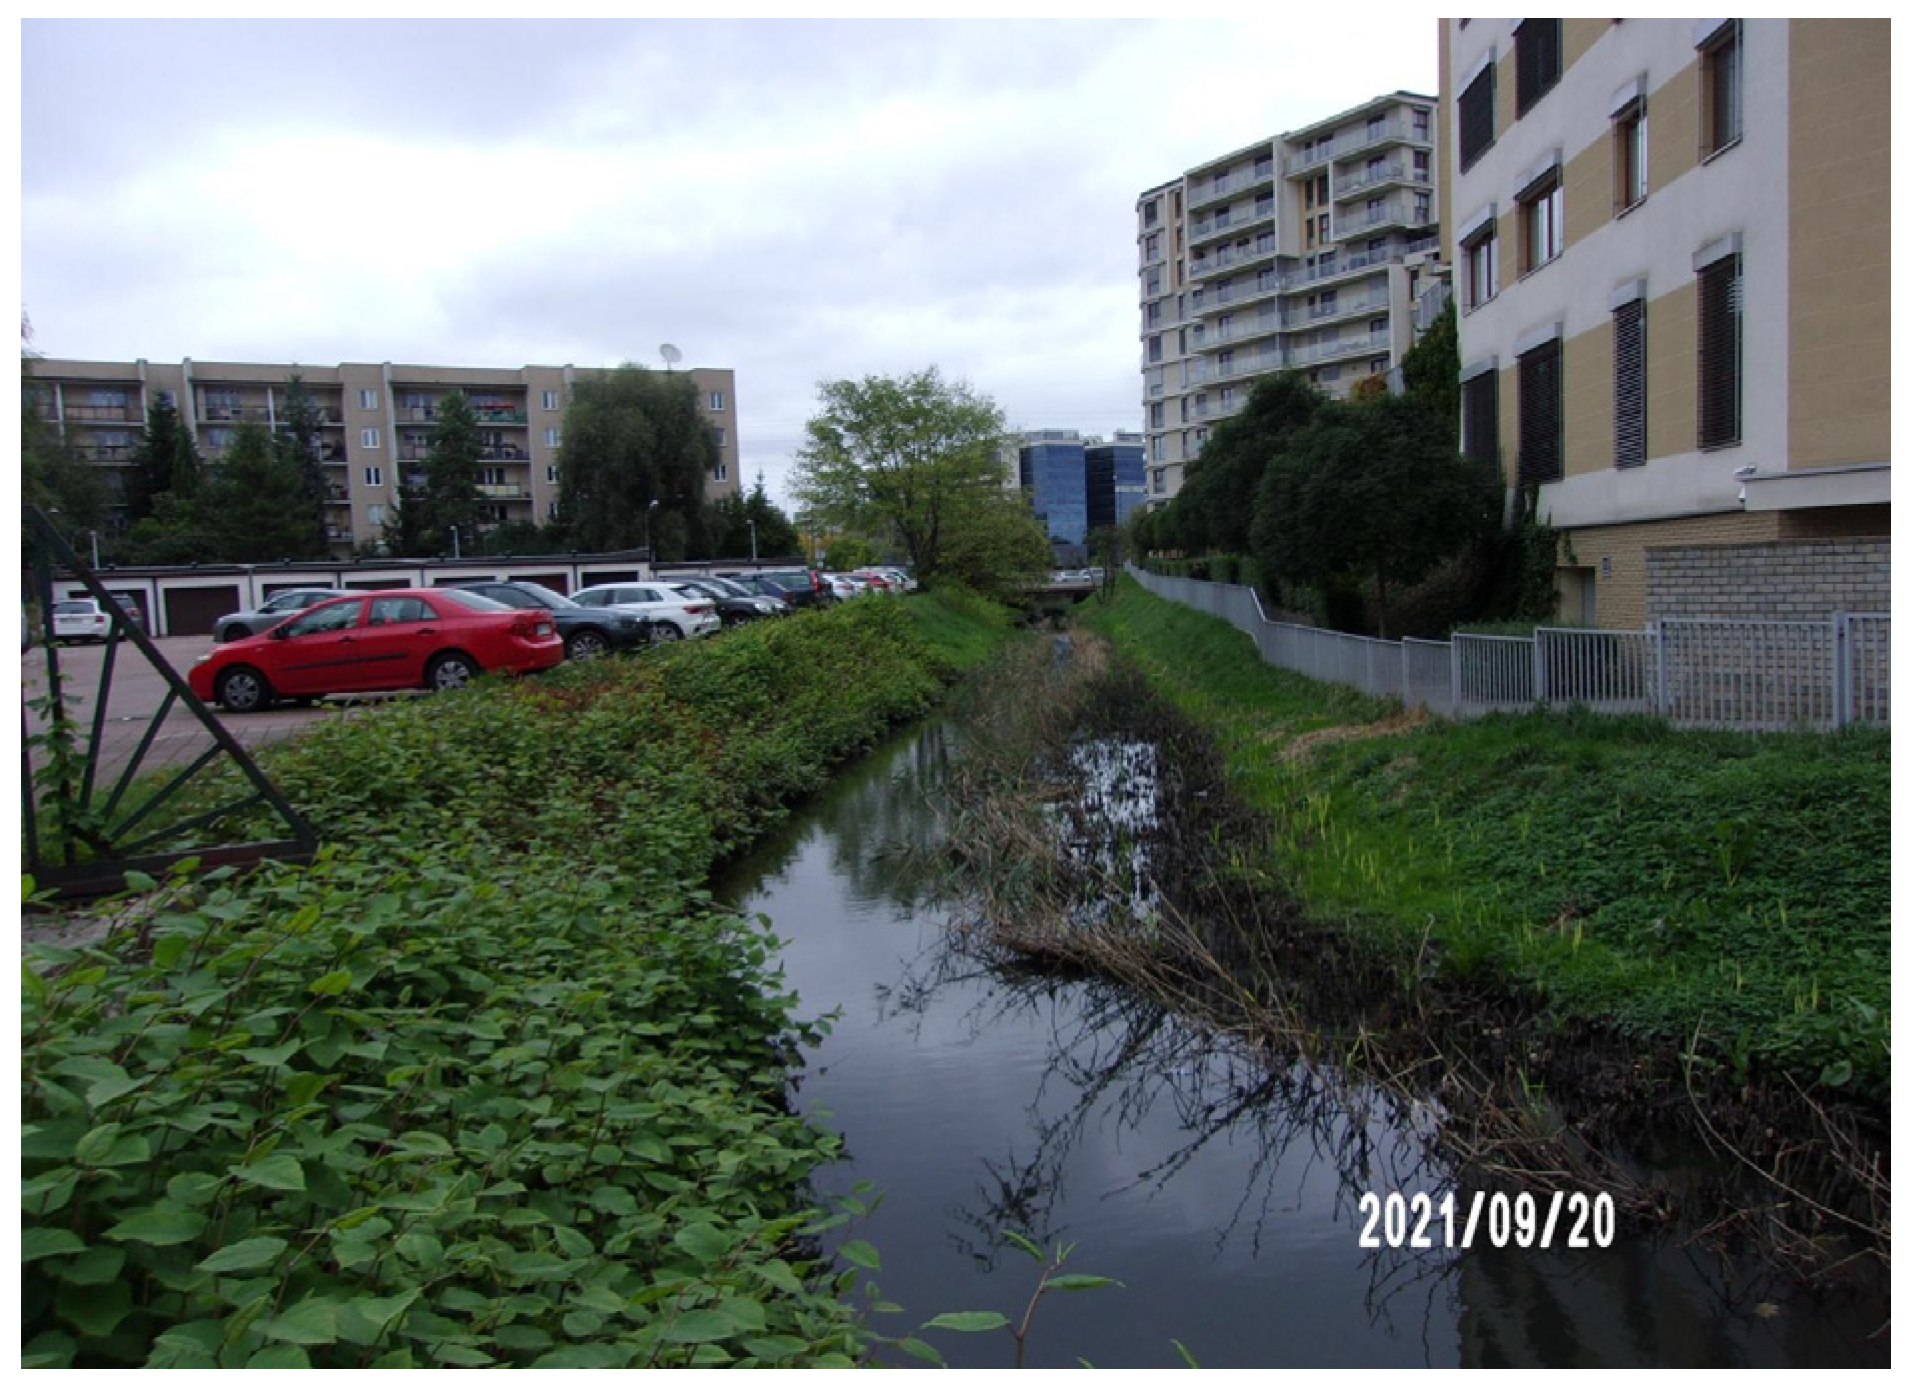
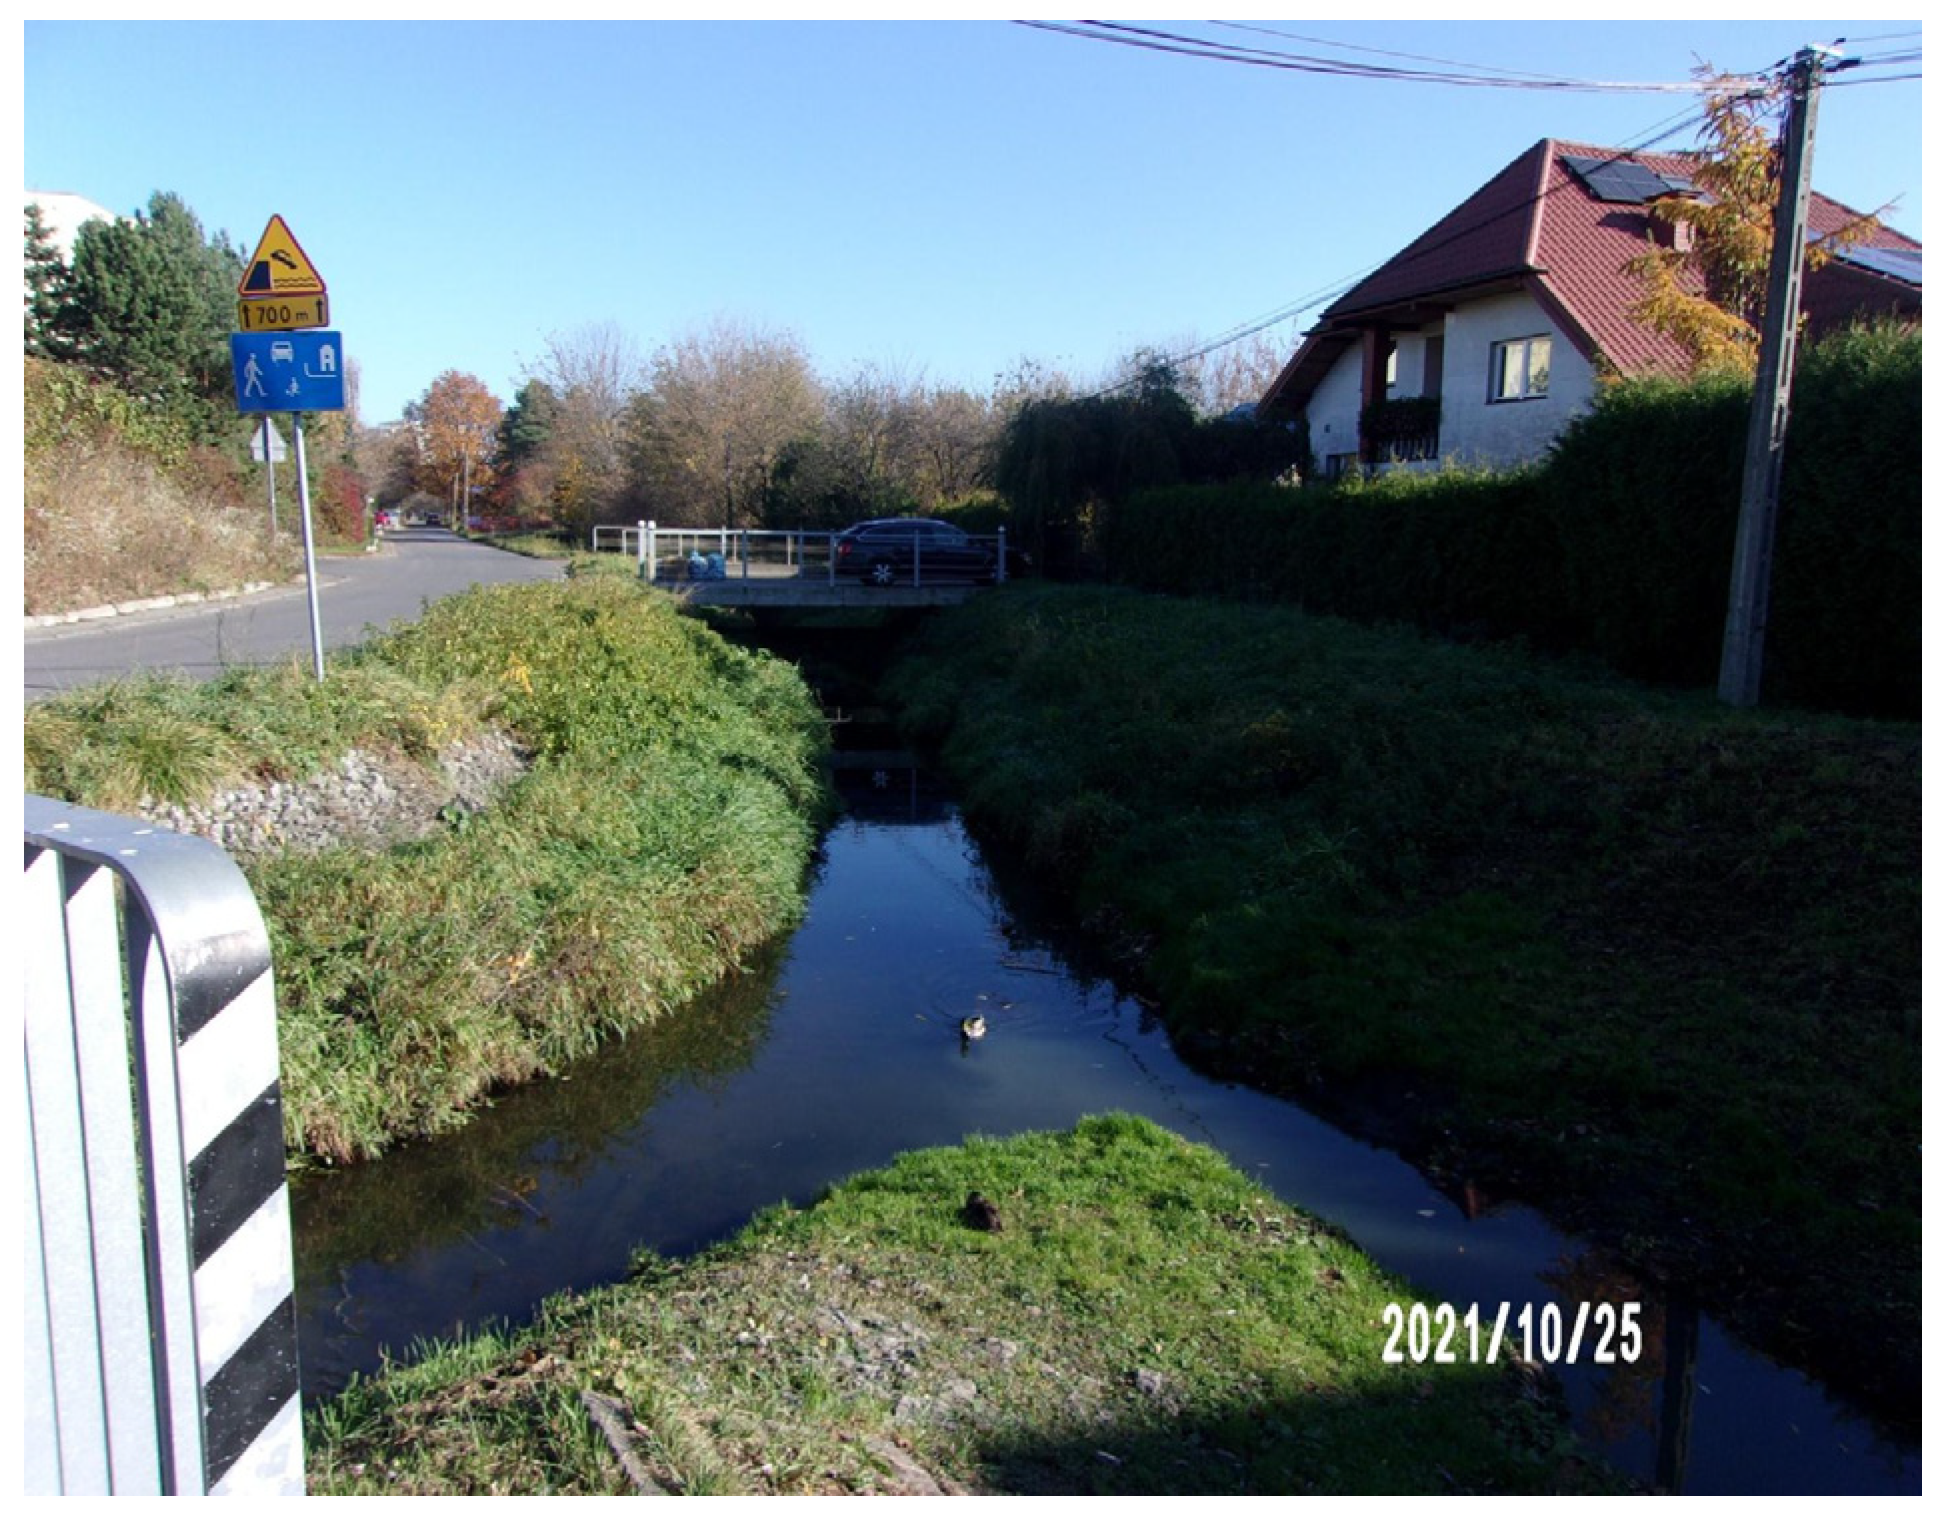
3.2.3. Wolica Canal and Its Discharge of Rainwater from Ursynów
4. Discussion
4.1. General Issues
4.2. What Comes Next?
- Construction of a “dry reservoir” for flood protection, a so-called polder, in the Służewiecka Valley between Puławska Street, Rzeczypospolitej Avenue and Nowoursynowska Street (see Figure A16 in Appendix A).
- Construction of dams above Łączyna Street to slow down the runoff of the collector along the Radomska Railway and Okęcie Airport.
- Construction of an aboveground or underground retention basin in Rosoła Street at the confluence of the Służewiecka Valley.
- Further revitalisation of reservoirs, e.g., Priest’s Pond.
- Reconstruction of stormwater runoff from Ursynów areas to increase retention in the channel during heavy rainfall, including the construction of a dam to retain stormwater in the Wolica Channel.
- Active management of water facilities.
- Designation of a single body that is responsible for the water facilities in the city of Warsaw.
4.3. Anticipated Difficulties
5. Summary and Conclusions
- There should be a single manager for the stormwater system in the city of Warsaw; otherwise, responsibility will be diluted;
- It is necessary to update the programme and spatial concepts for the discharge of water from individual catchment areas in Warsaw (e.g., the catchment area of the Służewiecki Stream);
- Natural retention basins need to be restored in the city and artificial retention basins need to be built in places where overflows and local flooding occur;
- The system must be made more efficient by building appropriate underground or open channels;
- All new investments (including high-rise buildings) must be equipped with detention basins to accomodate the so-called excess stormwater that cannot be absorbed by the city’s stormwater or combined sewer system;
- Ursynów’s stormwater runoff must be disconnected from the catchment area of the Służewiecki Stream;
- Water from Ursynów needs to be channelled to the Vistula via the southern ring road from Warsaw (S-2) to supply the dry ponds and lakes in Wilanów;
- The expansion of the combined sewer system should precede the planned investments and be carried out with a considerable reserve capacity so that, in future, the currently unserved areas (undeveloped land; raw land) can also be connected without problems;
- Spatial development plans and studies on the conditions and directions of spatial development must provide space for the construction of retention basins to absorb excess rainwater;
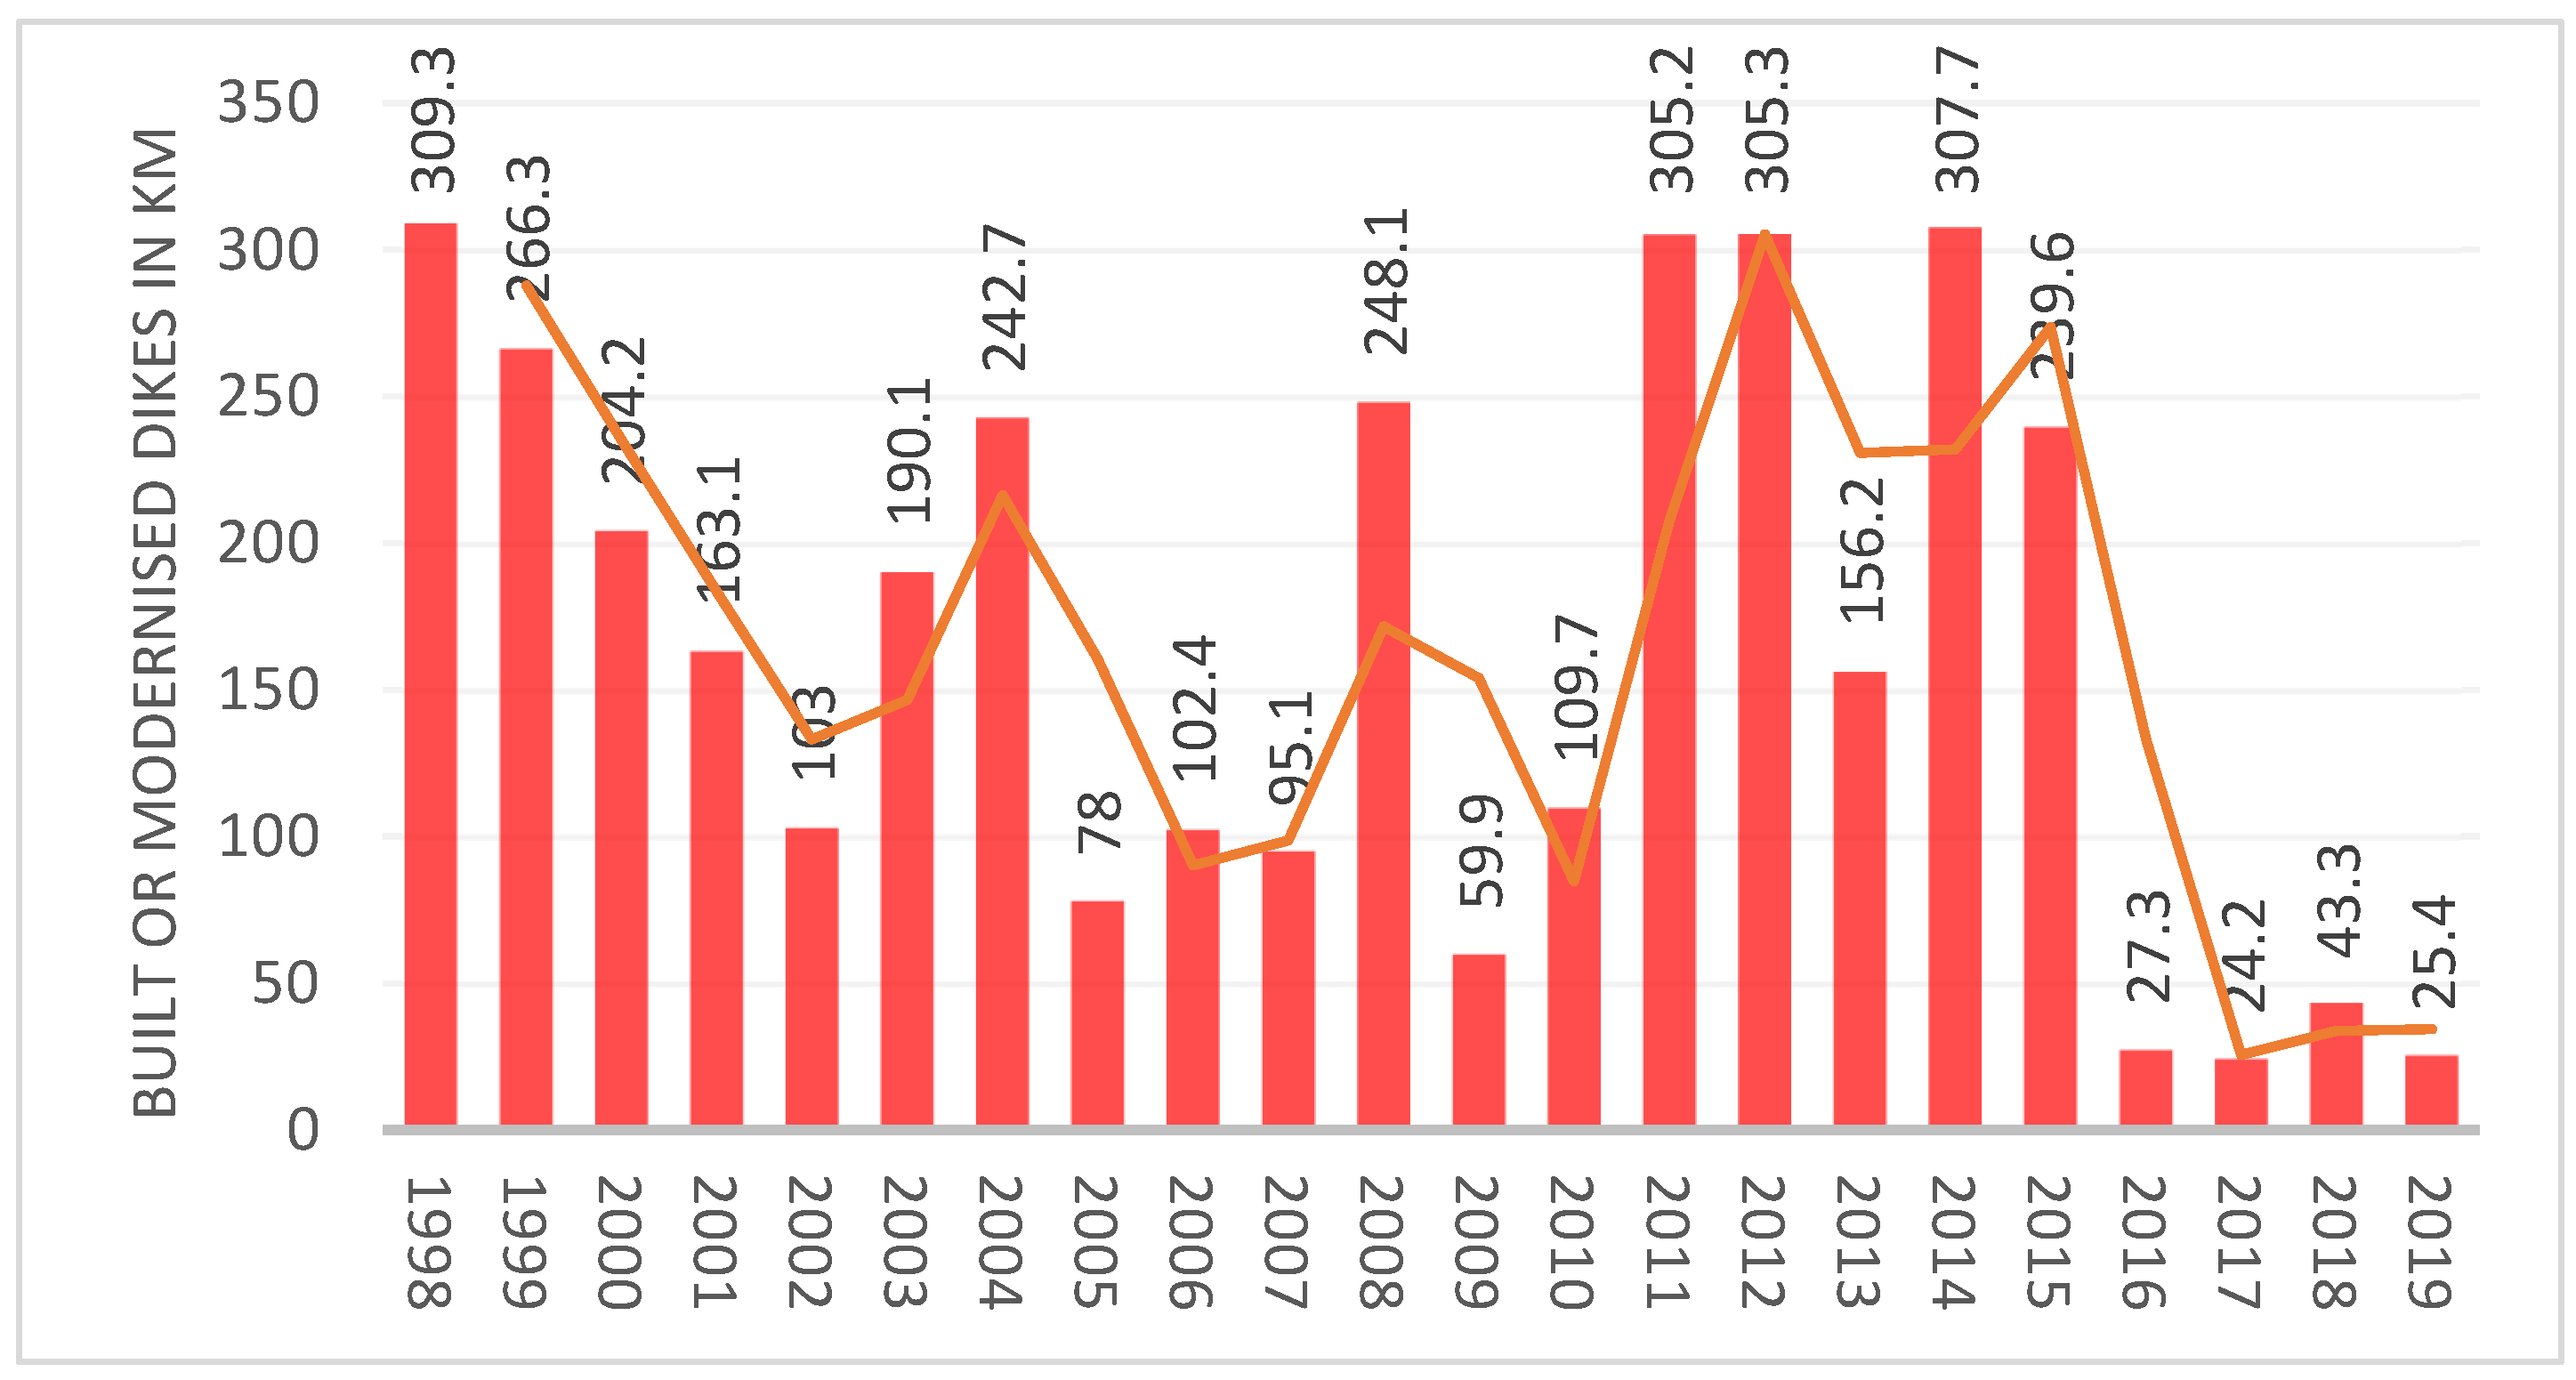
- It is necessary to revitalise the flood-control dikes in the Warsaw section;
- Reserves of floodplains (so-called polders) should be created before Warsaw.
- The implementation of SuDS, WSUD solutions and a comprehensive RTC system (currently under construction), discussed in Section 2.5 and Section 2.6, can significantly improve stormwater management in Warsaw.
Author Contributions
Funding
Institutional Review Board Statement
Informed Consent Statement
Data Availability Statement
Conflicts of Interest
Appendix A

| Authors | Subject | Contribution |
|---|---|---|
| Sieradz et al. [27] | Programmatic and spatial conception of water drainage from the catchment area of the Służewiecki Stream in Warsaw, considering the development of the catchment area. | In this study, the geodetic documentation of the Sluzewiecki Stream was evaluated and its existing technical conditions were determined, with special attention to the areas impeding the flow of water. The existing flow capacity of the Służewiecki stream and the structures (at various sections) were determined in great detail (with complete calculations). In addition, the influence of the stream on the groundwater and its level, as well as the infiltration of this water, was determined and ascertained. The hydrology of the entire catchment area of the Wilnowka River was discussed in detail. For certain sections of the Służewiecki Stream and the Wolica Canal, the predicted discharges of large rainwater were determined for p = 2%. The authors presented technical solution variants of the programme and the spatial concept of stormwater drainage from the Służewiecki Stream Catchment area (more precisely, 3 variants were presented, of which variant no. 2 was finally selected). Interestingly, many other technical solutions were also analysed, which were considered but eventually discarded for various reasons. Finally, an analysis of the water flow in the Wilanowskie and Powsinkowski Lakes was carried out in connection with the proposed solution variants. |
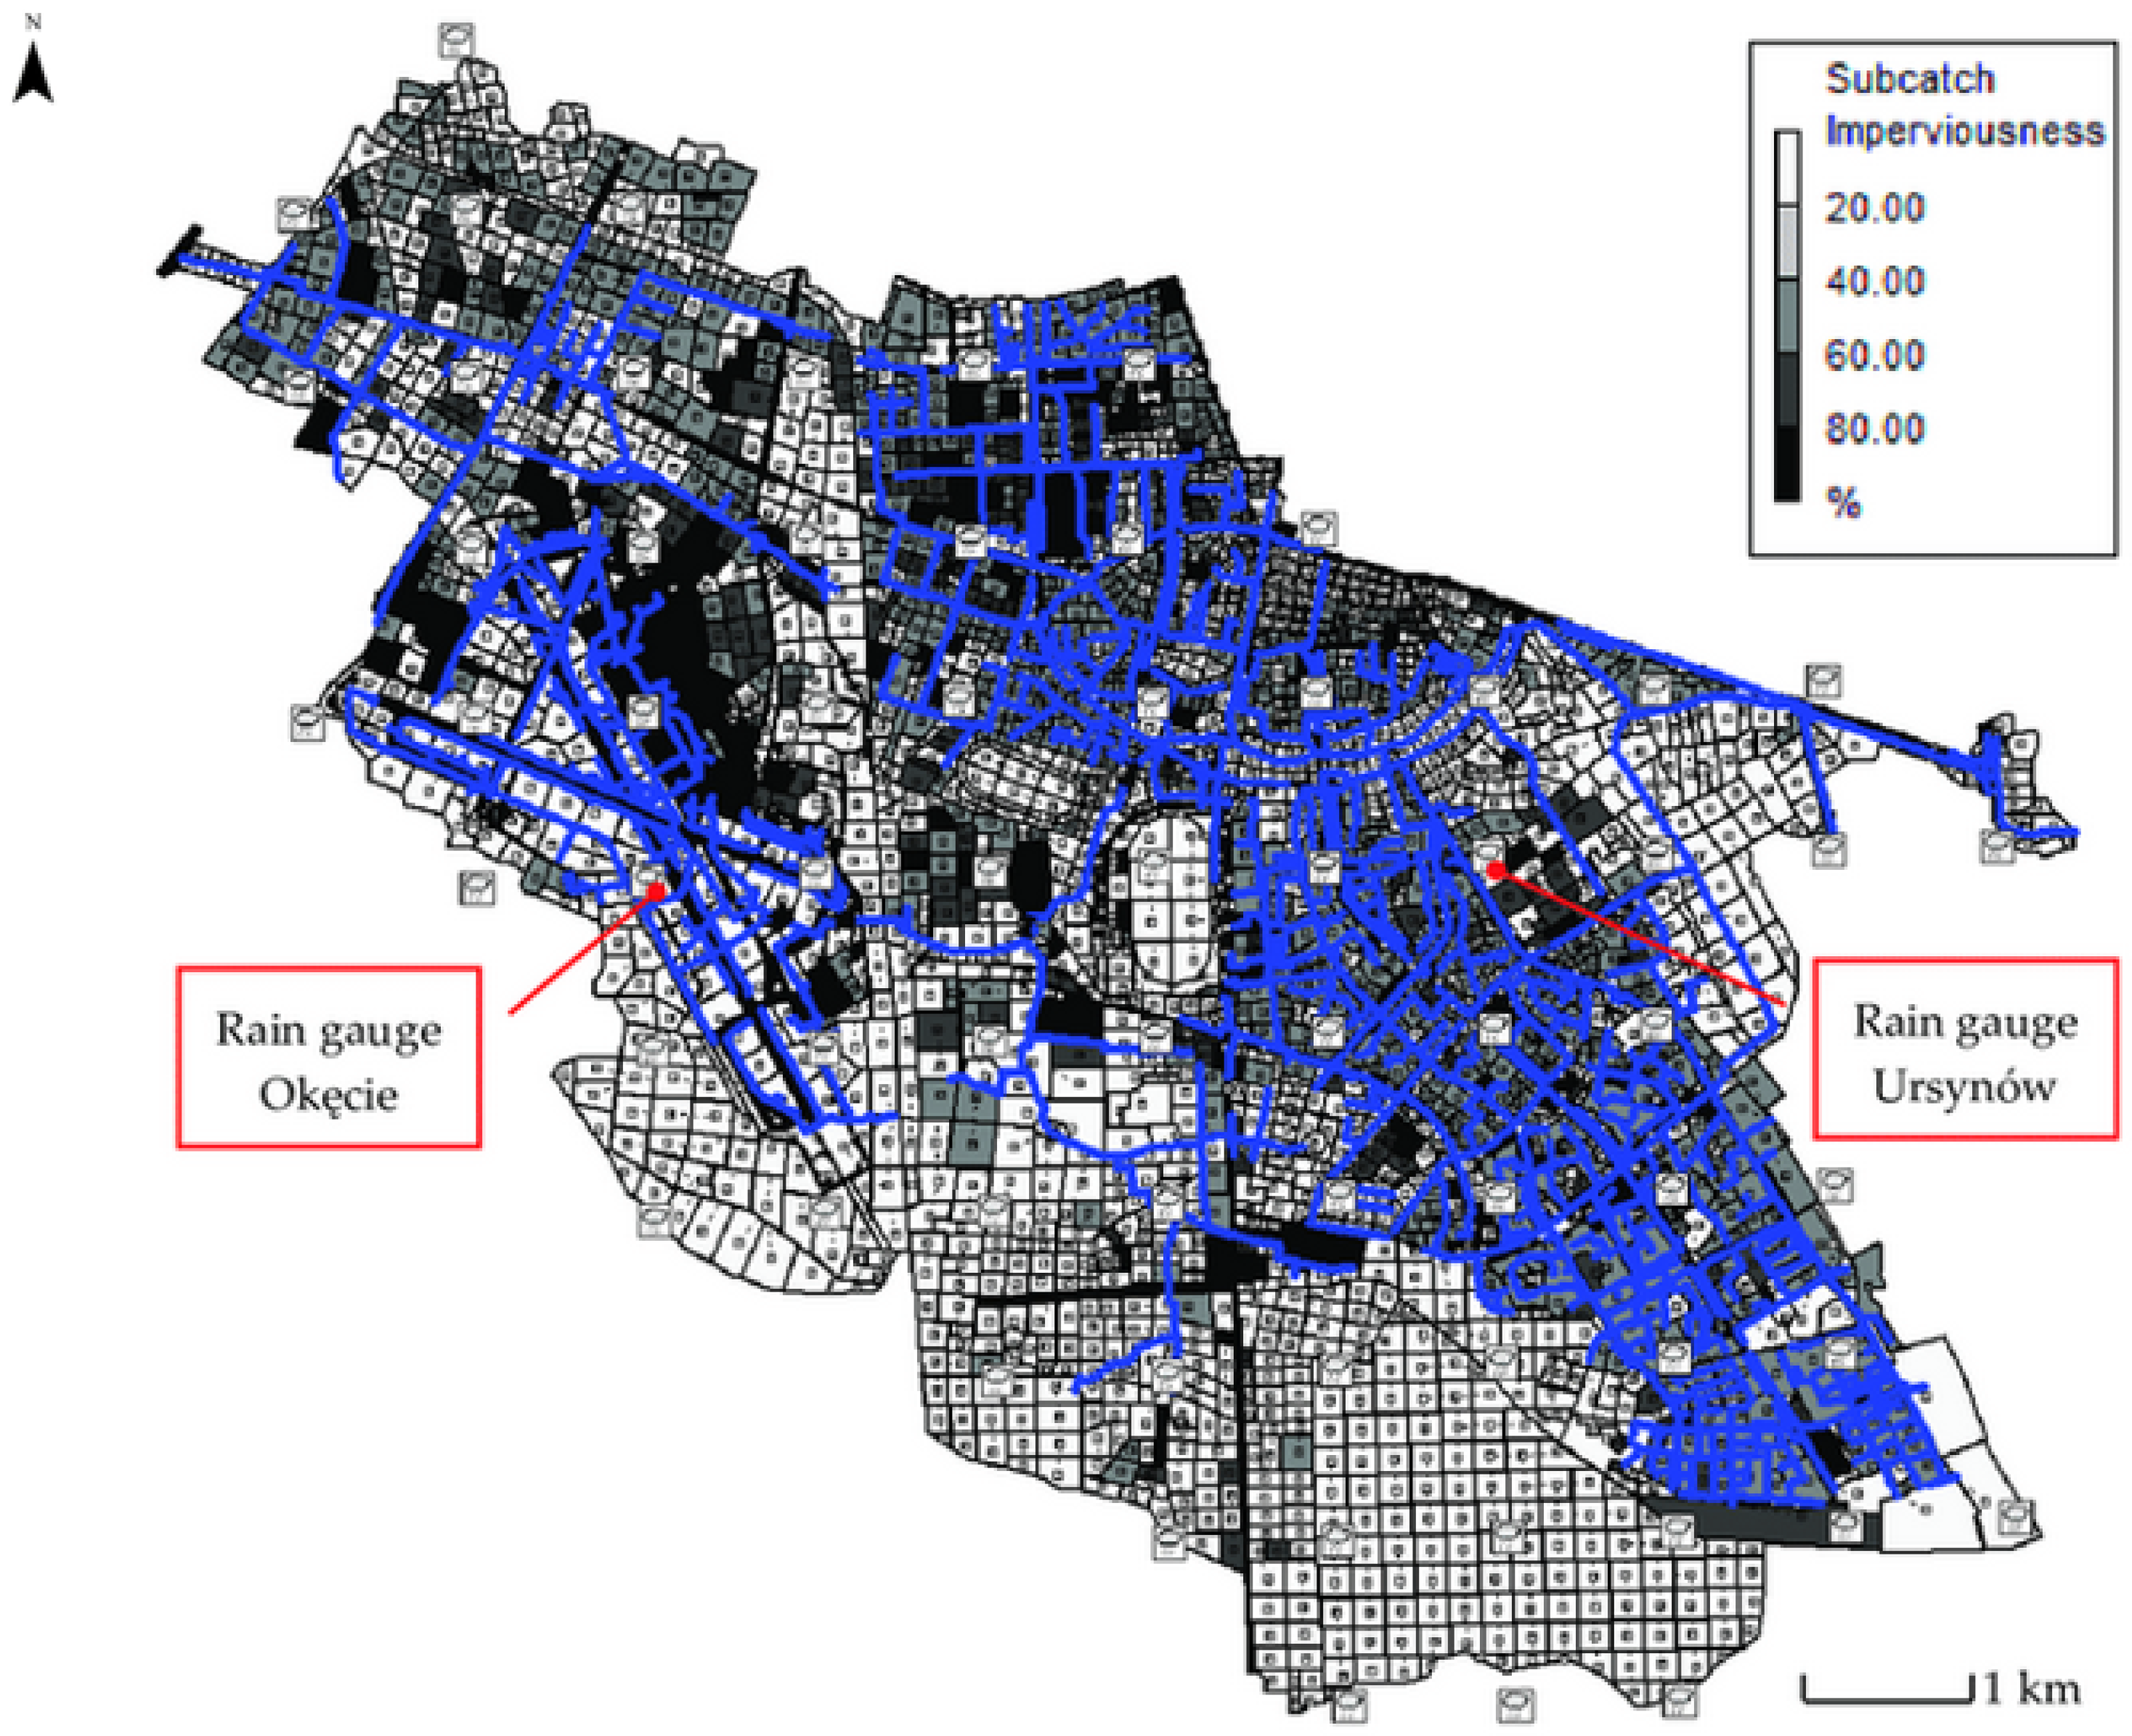
| Banasik et al. [106] | The catchment area of the Służewiecki Brook—a comparison of the impact of urbanisation in different phases of urban development (i.e., 1970 and 2005) on stormwater runoff. | Banasik et al. [106] studied the influence of different precipitation events with different durations and at different stages of urbanisation on peak runoff and rainfall runoff in the catchment of the Służewiecki stream. They applied the hydrological approach based on the SCS-CN and IUH method and showed a significant correlation between the increasing urbanisation of the catchment and the increase in peak runoff and the required retention volume. The study showed that an increase in impervious surface from 15 to 21% resulted in a 38% increase in peak runoff and a 76% increase in required detention volume. At the time the study was conducted, the authors projected an increase in impervious surface area to 31% by 2020 (i.e., within 12 years), which, according to their analysis, would have resulted in an increase in peak runoff of up to 92% and required detention volume of up to 357%. |
| Barszcz [6] | Prediction of the most probable runoff caused by heavy rainfall in the urbanised catchment of the Służewiecki Stream. | Barszcz [6] points out the high index of area variability of runoff for the catchment of the Służewiecki Stream, which is characterised by an area of 59.73. More specifically, Barszcz [6] points to mosaicism (land use/land cover) of the sub-catchments, which vary with their run-off rate. The problem with the lack of run-off area homogeneity comes down to the fact that each sub-area has a different specificity and, therefore, different run-off rates. |
| Olesiński [107] | Służewiecki Stream—technical solutions to stormwater retention in the area of the catchment. | The article deals with the application of technical solutions for stormwater retention in the area of Wilanowska Avenue and adjacent streets. This refers to the stormwater drainage system project, which provides for the discharge of stormwater into the Służewiecki Stream in quantities not exceeding 10 L per second. |
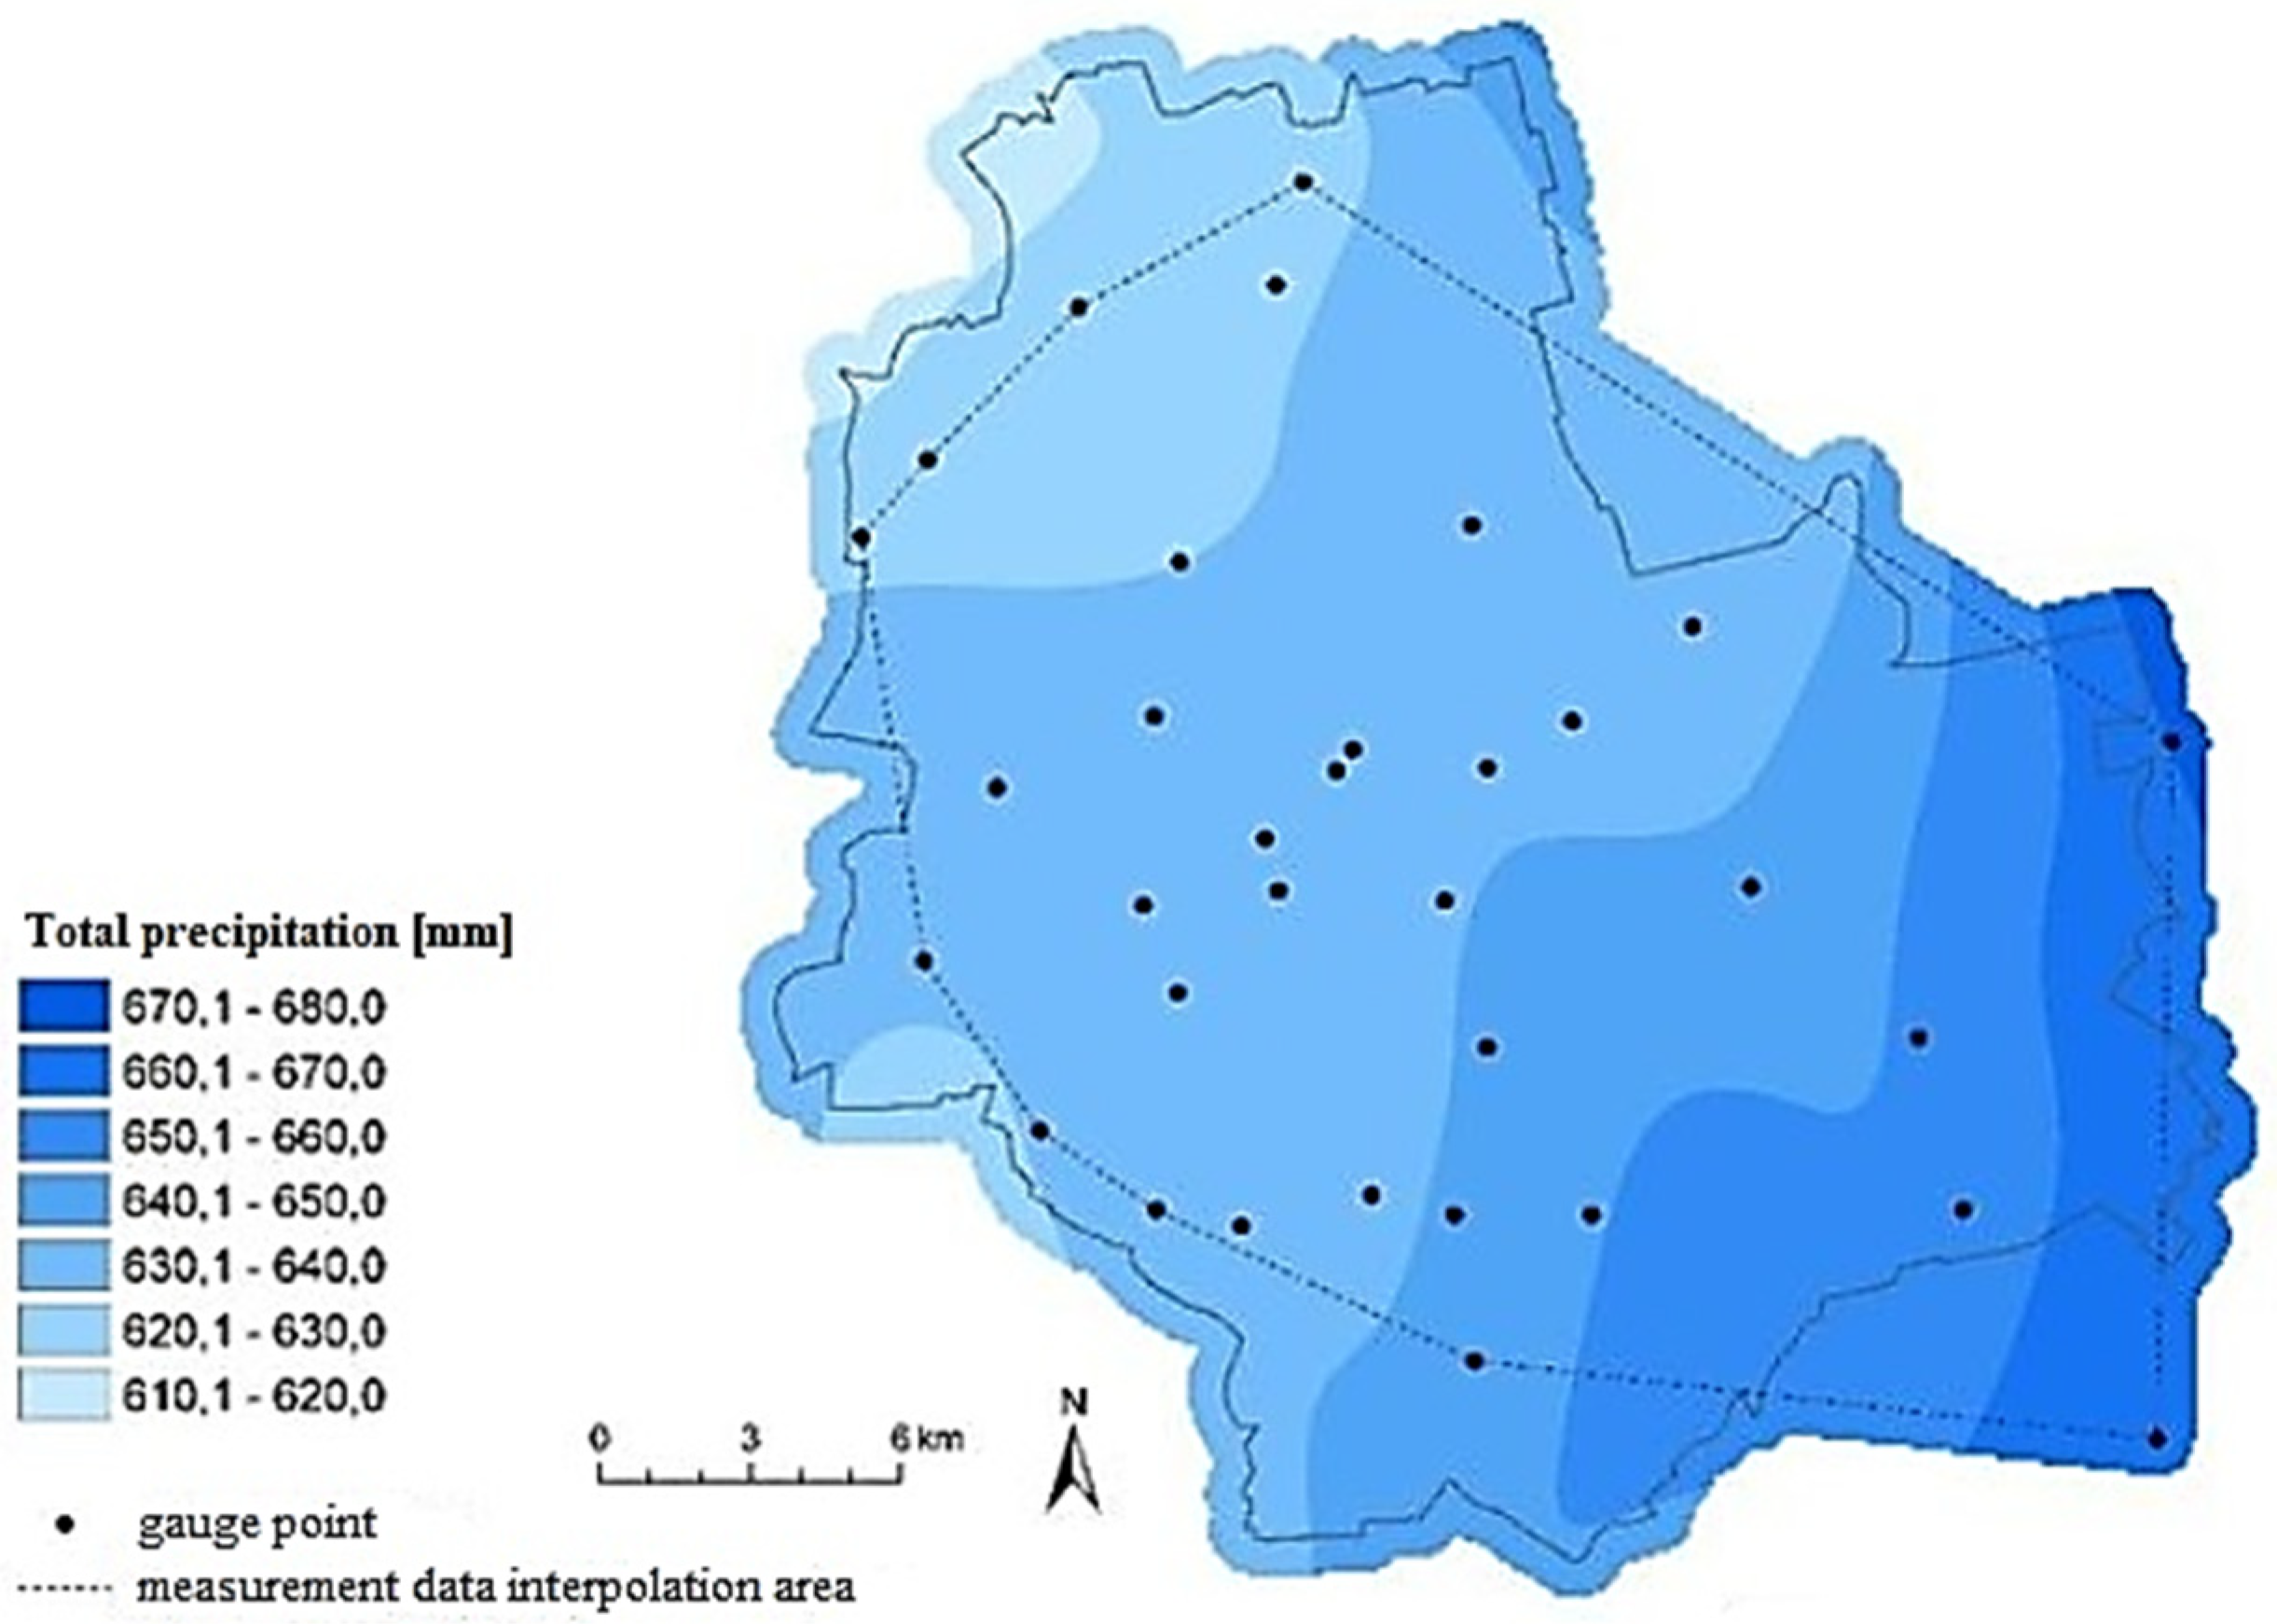
| Barszcz [42] | Służewiecki Stream—analysis of precipitations; calculation of normalised precipitation depth distributions for different cumulative precipitation durations. | The author presented an analysis of precipitation measured at 3 different measuring stations (i.e., Ursynów, Okęcie and Pyry) in the experimental catchment of the Służewiecki stream. The analysis included a total of 71 precipitation episodes and dealt with the calculation of normalised precipitation depth distributions for different cumulative precipitation durations (for each nearest 10th percentile of the cumulative precipitation time). The results showed that the rainfall depths ranged from 1.0 to 81.5 mm and the times ranged from 20 to 1000 min. The author then performed statistical processing on the data and presented a synthetic result (using the median of all results) showing the normalised distribution of rainfall depths. This is important because the hydrographs in the studied catchment can be determined based on the results presented by Barszcz [42]. Another contribution of the analysis by Barszcz [42] is the finding that the synthetic normalised precipitation distribution calculated for the studied area is very similar to the results obtained in the USA and Germany (graphically, these distributions show great similarity). This information and the results of the analyses can be used for design analyses. |
| Magnuszewski et al. [17] | Hydraulic conditions of the flow of the large waters in the Vistula section in Warsaw (500–521 km) in the period before embankment and regulation. Hydraulic capacity of the current riverbed in the so-called Warsaw. | Magnuszewski et al. [17] described the problem of maintaining adequate hydraulic capacity of the current riverbed in the so-called Warsaw Corset and performed corresponding calculations of riverbed capacity for the conditions of and flow and different development scenarios of the riverbed. The authors reproduced the flow volume of the catastrophic floods, which are shown by the signs of the big water with the two-dimensional hydrodynamic model CCHE2D. |
| Barszcz [108] | Służewiecki Stream | The author has conducted an analysis of the influence of the use of rainwater infiltration and retention systems on the runoff from the catchment area of the Służewiecki Brook in Warsaw. The paper presents a thorough analysis of how distributed stormwater infiltration and retention facilities (i.e., LID) in the urbanised sub-catchment of the Służewiecki Brook influence the characteristics of surface runoff and retention and infiltration layers in response to a single rainfall event. |
| Wawer [90] | Synthesis of water management problems with regard to the catchment area of Lake Wilanów and the Wilanówka River | Wawer [90] analysed the catchment area of Lake Wilanów and the Wilanówka River, evaluating the state of the water environment, and prepared a certain synthesis of water management problems. The author pointed out the reasons for the progressive deterioration in the city’s water resources, citing, among others, the ongoing urbanisation of the catchment area and the construction of transport infrastructures without a proper stormwater drainage network (lack of comprehensive legal regulations on wastewater disposal and an effective control system).Important problems that have led to occasional local flooding and inundation in Warsaw are: (1) the conversion of the Służewiecki stream into a stormwater and industrial wastewater outfall, which has led to the complete ecological degradation of the entire stream system and the reservoirs in its network; (2) the failure to implement a separate stormwater combined sewer network; (3) the chaotic water and wastewater management in Warsaw, which means that the proposed solutions concerning only flood protection are ad hoc and do not comprehensively solve the problem; (4) mistakes in planning new investments and communication infrastructures; (5) the regulation works on the Wilanów section and the liquidation of the floodplain, which led to a local increase in the risk of flooding for areas located in a depression in relation to the maximum filling capacity of the Służewiecki stream; (6) the lack of adequate policies and decisions regarding Lake Wilanów and the Southern Pond, which should receive the protection they deserve and be prioritised when solving water and sewage problems; (7) faulty or too limited legislation in the field of water management solutions; (8) creating a situation where the bottoms of new and newly reconstructed reservoirs are silted up due to the rapid accumulation of organic matter as a result of eutrophication with organic sediments; (9) finding a situation where some reservoirs are not in good condition, e.g., the Wyścigi Pond, and are filled with a high proportion of organic material, which become water objects/facilities causing the secondary deterioration of flowing waters, as decomposition processes of organic matter take place at the expense of the content of dissolved oxygen in the water; (10) the absence of solutions to the retention of clean rainwater in the soil in areas where this is possible, which aggravates the processes leading to flooding in the catchment area of the Służewiecki Stream. |
| Jakubiak et al. [101] | Warsaw—precipitation analysis for 25 different rain gauges. | Jakubiak et al. [101] based their study on the relationship between radar reflectivity factor ( Z) and rainfall rate ( R), and analysed individual pixels of the radar image to estimate rainfall intensity. They then compared their results with those of rain gauges in Warsaw (accurate for 25 different rain gauges) and found significant discrepancies in the highest values of rain intensity. Their results are worth considering when using radar data in the hydrological modelling of catchments such as the Służewiecki Stream Catchment. |
| Barszcz [69] | The impact of selected low-impact development objects (LID) in the catchment area of the Służewiecki stream (in Warsaw) on surface runoff (runoff) and retention and infiltration depths for different scenarios | The study was conducted to assess the impact of selected low-impact development objects (LID) in the catchment area of the Służewiecki stream on surface runoff (runoff) and retention and infiltration depths for different scenarios, including the selected property (shopping centre). The results show that LID objects increase the infiltration depth and decrease the surface runoff depth and volume. The study showed that the best results were achieved for scenarios with “permeable soil layer“ and green roofs. |
| Barszcz et al. [30] | Służewiecki Stream and Wolica Ditch (Canal) | The authors’ contribution consists of the development of a hydrodynamic Storm Water Management Model (SWMM) for different cross-section points in the catchment of the Służewiecki Brook and in the presentation of thorough calculations for discharges with corresponding exceedance probabilities, i.e., 50, 10, 2 and 1%. The calculations were performed for ten different design cross-sections, most of them for the respective sections of the Służewiecki Brook and two calculations for the Wolica Ditch, which is a tributary of the Służewiecki Brook. |
| Sobol [70] | Concept for implementing SuDS for the Siekierki area in Warsaw, which has been causing hydrogolgic problems for years. | Sobol [70] refers to new and effective ways of managing water in urban settings in the context of the rapidly growing population in urban areas. The author highlights that there are contemporary sustainable solutions for the more efficient management of urban stormwater, and that these are sustainable urban drainage systems (SuDS). These concepts contrast with traditional drainage infrastructures. Sobol [70] presents a concept for the implementation of such an SuDS solution for the Siekierki area in Warsaw (an area located in a bend of the Vistula River). In the hydrological and hydrogeological context, the Siekierki area is considered to be an area that causes many problems and hinders development planning. |
| Krajewski et al. [109] | Służewiecki Stream Catchment—prediction of sediment graphs in runoff from small detention basins in urban areas. | Krajewski et al. [109] used relevant data for 7 rainfall-runoff events with suspended sediment and developed a model of sediment concentration in stormwater runoff from a small detention pond in the catchment of the Służewiecki stream based on these data. The results showed a high degree of similarity between the estimated and observed discharges, which could allow accurate prediction of sediment graphs in the discharge of small detention ponds in urban areas. |
| Bartosik [15] | Review of the technical objects and water facilities that are part of the passive flood protection system of the city of Warsaw | Bartosik’s [15] work examined the technical objects that are part of the passive flood protection system of the city of Warsaw, emphasising that they were built in the last one hundred and sixty years. These objects were developed to protect the city of Warsaw from flooding of the Vistula and Jeziorka floodplains, where the Warsaw agglomeration is located. The system consists of linear structures—flood embankments, a dam and point structures—the Żerań navigation lock, the Czerniakowska Gate, a series of pumping stations and dam sluices, and a syphon. The total length of the dike sections is just under 53 km. The protected area at risk of flooding from water draining with a probability of p-1% is over 75 . |
| Barszcz [41] | Relationship between rainfall intensity (R) from rain gauges (for certain rainfall cells with 1-km resolution) and radar reflectivity Z for the urban catchment of the Służewiecki stream in Warsaw. | The aim of the study by Barszcz [41] was to find the relationship between rainfall intensity (R) from the rain gauge (for certain rainfall cells with 1-km resolution) and radar reflectivity Z for the urban catchment of the Służewiecki stream in Warsaw. In the study, the author used five methods to determine the calculated radar reflectivity values (for specific precipitation cells with 1-km resolution) and different scenarios that included data from 2 existing rain gauges and 64 virtual rain gauges assigned to the corresponding precipitation cells in the catchment. In his study, Barszcz [41] achieved reasonable agreement between the measured parameters of the runoff hydrographs and the simulated parameters as a function of rainfall depth. His results regarding the Z–R relationships allow for a better estimation and understanding of the precipitation intensity (compared to the Marshall–Palmer relationship). |
| Barszcz [43] | Prediction of hydrographs of runoff from stormwater retention basins in the Służewiecki Stream Catchment. | Barszcz [43] evaluated the utility of using SWMM and SBUH models to predict hydrographs of runoff from stormwater detention reservoirs in the catchment of the Służewiecki stream, when controlled by appropriate valves. Assuming that the rainwater is retained in the reservoirs, and considering the effect of the delay in rainwater runoff from the catchment resulting from this retention, the author then proposed methods for determining the concentration time for a given rainfall event. The median absolute errors in terms of peak flows and hydrograph volumes for the events analysed indicate satisfactory simulation results with both the SWMM and SBUH models. |
| Nowak Da Costa et al. [110] | Assessment of the risk of flooding and inundation by floods in Warsaw. | Considering deterministic and stochastic aspects, Nowak Da Costa et al. [110] studied the possibility and risk of flooding and inundation by floods in Warsaw by referring to the issue of risk, the function of buildings and the number of inhabitants (especially considering the characteristics of buildings in terms of their capacity function). The study has shown the percentage of buildings that could be affected by a 500-year flood and what risks this potential event poses in quantitative terms. |


References
- Anderson, D.G. Effects of Urban Development on Floods in Northern Virginia; US Government Printing Office: Washington, DC, USA, 1970; p. 22.
- Bailey, J.F.; Thomas, W.O.; Wetzel, K.L.; Ross, T.J. Estimation of Flood-Frequency Characteristics and the Effects of Urbanization for Streams in the Philadelphia, Pennsylvania Area: U.S. Geological Survey Water-Resources Investigations Report 87-4194; Philadelphia Water Department: Harrisburg, PA, USA, 1989.
- Konrad, C.P. Effects of Urban Development on Floods; U.S. Geological Survey–Water Resources: Tacoma, WA, USA, 2003.
- Xu, Z.; Zhao, G. Impact of urbanization on rainfall-runoff processes: Case study in the Liangshui River Basin in Beijing, China. Proc. Int. Assoc. Hydrol. Sci. 2016, 373, 7–12. [Google Scholar] [CrossRef] [Green Version]
- Kanclerz, J.; Murat-Błażejewska, S.; Dragon, K.; Birk, S. Wpływ urbanizacji w strefie podmiejskiej na stosunki wodne w zlewniach małych cieków. Inż. Ekol. 2016, 46, 94–99. [Google Scholar] [CrossRef] [Green Version]
- Barszcz, M. Prognoza maksymalnych przepływów prawdopodobnych wywołanych ulewami w zurbanizowanej zlewni Potoku Służewieckiego. Prz. Nauk. Inż. Kształt. Sr. 2009, 18, 1–20. [Google Scholar]
- Nowakowska, M.; Kotowski, A. Metodyka i Zasady Modelowania Odwodnień Terenów Zurbanizowanych; Oficyna Wydawnicza Politechniki Wrocławskiej: Wrocław, Poland, 2017. [Google Scholar]
- Koszewska, J.; Kuzak, Ł. Exogenous NaHS Treatment Alleviated Cd-induced Stress in Ocimum basilicum Plants through Modulation of Antioxidant Defense System. J. Water Land Dev. 2021, 50, 1–9. [Google Scholar]
- Haloursynow. Podtopienia na Ursynowie. Zalana ul. Stokłosy, Mocno Wzbiera Potok Służewiecki. Available online: https://www.haloursynow.pl/artykuly/podtopienia-na-ursynowie-zalana-ul-stoklosy-mocno-wzbiera-potok-sluzewiecki-synoptycy-ostrzegaja,15066.htm (accessed on 30 March 2022).
- TVN24. Podtopione Auta, Zalane Wejście do Metra. Wylał Potok Służewiecki, Nie Lądowały Samoloty. Available online: https://tvn24.pl/tvnwarszawa/najnowsze/warszawa-burza-podtopione-ulice-zalana-stacja-metra-wezbrany-potok-sluzewiecki-wideo-5146613 (accessed on 29 March 2022).
- Kochański, M. Wilanów Pod Wodą. Wylał Potok Służewiecki. Woda Stoi na Ulicach, Chodnikach i Podchodzi Pod Bloki. Available online: https://warszawa.naszemiasto.pl/wilanow-pod-woda-wylal-potok-sluzewiecki-woda-stoi-na/ar/c1-7769356 (accessed on 24 March 2022).
- Pieczka, A. Potok Służewiecki Nie Radzi Sobie z Nadmiarem Opadów. Dlaczego? Available online: https://www.rdc.pl/informacje/kolejna-proba-dla-potoku-sluzewieckiego-nie-odprowadza-wody/ (accessed on 30 March 2022).
- Paul, G. Approaches to abductive reasoning: An overview. Artif. Intell. Rev. 1993, 7, 109–152. [Google Scholar] [CrossRef]
- Yin, R.K. Validity and generalization in future case study evaluations. Evaluation 2013, 19, 321–332. [Google Scholar] [CrossRef]
- Bartosik, Z. Zagrożenie powodzią na terenie Warszawy. In Proceedings of the Conference of the Parliamentary Group for the Development of Waterways Entitled “Warsaw’s comeback to the Vistula River”, Warsaw, Poland, 9 October 2017. [Google Scholar]
- Magnuszewski, A.; Moran, S. Vistula River bed erosion processes and their influence on Warsaw’s flood safety. Proc. Int. Assoc. Hydrol. Sci. 2015, 367, 147–154. [Google Scholar] [CrossRef]
- Magnuszewski, A.; Gutry-Korycka, M.; Mikulski, Z. Historyczne i współczesne warunki przepływu wód wielkich Wisły w Warszawie. Część I. Gospod. Wodna 2012, 1, 9–18. [Google Scholar]
- Sobieraj, J. Wpływ Polityki Gospodarczej, Srodowiskowej i Prawnej na Zarzadzanie Procesem Inwestycyjnym w Budownictwie Przemysłowym; ITE-PIB: Radom, Poland, 2019. [Google Scholar]
- Glapiak, E. Polski Ład Rozłożył Finanse Samorządów. Efekt? Czekają nas Drastyczne Podwyżki, Forbes. Available online: https://www.forbes.pl/finanse/rzad-odebral-samorzadom-pieniadze-by-sfinansowac-polski-lad-samorzady-odbiora-je-nam/cm8xdl3 (accessed on 30 March 2022).
- Guranowska-Gruszecka, K.; Kordek, M. Port Praski in Warsaw–Plans and Reality. Studia KPZK 2018, 188, 353–376. [Google Scholar]
- Zając, D.E. A Water Tram Stop at the Prague Port in Warsaw. Ph.D. Thesis, Faculty of Architecture, Division of Design and Theory of Architecture of Warsaw Univesity of Technology, Warsaw, Poland, 2021. [Google Scholar]
- Waga-Bart. Koncepcja Programowo-Przestrzenna Przebudowy Ujściowego Odcinka Rzeki Długiej; Waga-Bart: Warsaw, Poland, 2013. [Google Scholar]
- Goździewski, J.; Giżejewski, Z. Management of the European Beaver Castor Fiber Population; Stacja Badawcza Instytutu Rozrodu Zwierząt i Badań Żywności PAN: Popielno, Poland, 2014. [Google Scholar]
- Sondaj, L.; Górecka-Żwirska, A. Monitoring zagrożeń naturalnych w PGE GIEK SA Oddział KWB Turów. Gór. Odkryw. 2015, 56, 28–32. [Google Scholar]
- Kopras, M. Dobór obudowy wykopu tymczasowego dla posadowienia zbiornika retencyjnego wód opadowych osiedla Chabrowe Wzgórza w Kowalach. Prz. Bud. 2017, 88, 51–55. [Google Scholar]
- Banasik, K. Operat Hydrologiczny Potoku Służewieckiego w Przekroju ul. Przyczółkowej; Maszynopis; Katedra Inżynierii Wodnej i Rekultywacji Środowiska SGGW: Warsaw, Poland, 2002. [Google Scholar]
- Sieradz, T.; Pałys, F.; Czartoryjski, J.; Błaszczyk, P.; Banasik, K.; Manios, K.; Drążek, A.; Łukaszewicz, A.; Mioduszewski, W. Koncepcja Programowo—Przestrzenna Odprowadzania Wód ze Zlewni Potoku Służewieckiego w Warszawie Przy Uwzględnieniu Obecnego i Perspektywicznego Zagospodarowania Zlewni; War–Mel–Projekt: Warsaw, Poland, 2003. [Google Scholar]
- Barszcz, M.P. Zastosowanie modelu SWMM do prognozy przepływów prawdopodobnych w zlewni miejskiej. Prz. Naukowy. Inż. Kształt. Sr. 2015, 24, 69. [Google Scholar]
- Barszcz, M.P. The application of the SWMM model to forecast probable flows in urban catchment. Sci. Rev. Eng. Environ. Sci. 2015, 3, 209–223. [Google Scholar]
- Barszcz, M.; Bartosik, Z.; Rukść, S.; Batory, J. Obliczenie przepływów maksymalnych i ich redukcji w zlewni zurbanizowanej. Czas. Inż. Lądowej Sr. Archit. 2016, 63, 7–20. [Google Scholar] [CrossRef]
- Barszcz, M.P. Adaptacja modelu Santa Barbara Unit Hydrograph do obliczania hydrogramu przepływów w zurbanizowanej zlewni Potoku Służewieckiego. Czas. Inż. Lądowej Sr. Archit./J. Civ. Eng. Environ. Archit. 2014, 61, 21–34. [Google Scholar]
- Barszcz, M.P. Porównanie przepływów o określonym prawdopodobieństwie wystąpienia obliczonych w zlewni miejskiej za pomocą modeli SWMM i SBUH. Prz. Geogr. 2017, 89, 429–449. [Google Scholar] [CrossRef] [Green Version]
- IPCC. Climate Change 2014: Synthesis Report. Contribution of Working Groups I, II and III to the Fifth Assessment Report of the Intergovernmental Panel on Climate Change; Core Writing Team, Pachauri, R.K., Meyer, L.A., Eds.; IPCC: Geneva, Switzerland, 2014; pp. 1–151. [Google Scholar]
- Miętus, M.; Marosz, M.; Filipiak, J.; Kitowski, M.; Kowalewski, M.; Urban, G.; Łaszyca, E.; Kowalska, B. Klimat Polski 2020; IMGW-PIB: Warsaw, Poland, 2021. [Google Scholar]
- Williams, D.S.; Manez Costa, M.; Sutherland, C.; Celliers, L.; Scheffran, J. Vulnerability of informal settlements in the context of rapid urbanization and climate change. Environ. Urban. 2019, 31, 157–176. [Google Scholar] [CrossRef] [Green Version]
- Sabine, C.L.; Heimann, M.; Artaxo, P.; Bakker, D.C.; Chen, C.T.; Field, C.B.; Valentini, R. Current status and past trends of the global carbon cycle. Scope-scientific committee on problems of the environment international council of scientific unions. In The Global Carbon Cycle. Integrating Humans, Climte and the Natural World; Field, C.B., Raupach, M.R., Eds.; Island Press: Washington, UK, 2004; Volume 62, pp. 17–44. [Google Scholar]
- Kassenberg, A. Wstępny Raport Monitoringu Środowiskowego na Potrzeby Projektu Adaptcity; Fundacja Instytut na rzecz Ekorozwoju: Warsaw, Poland, 2016. [Google Scholar]
- Nguyen, T.T.; Ngo, H.H.; Guo, W.; Wang, X.C.; Ren, N.; Li, G.; Liang, H. Implementation of a specific urban water management-Sponge City. Sci. Total Environ. 2017, 652, 147–162. [Google Scholar] [CrossRef]
- Li, H.; Ding, L.; Ren, M.; Li, C.; Wang, H. Sponge city construction in China: A survey of the challenges and opportunities. Water 2017, 9, 594. [Google Scholar] [CrossRef] [Green Version]
- Jia, H.; Wang, Z.; Zhen, X.; Clar, M.; Yu, S.L. China’s sponge city construction: A discussion on technical approaches. Front. Environ. Sci. Eng. 2017, 11, 18. [Google Scholar] [CrossRef]
- Barszcz, M.P. Radar data analyses for a single rainfall event and their application for flow simulation in an urban catchment using the SWMM model. Water 2018, 10, 1007. [Google Scholar] [CrossRef] [Green Version]
- Barszcz, M.P. Znormalizowane rozkłady warstwy opadu w czasie trwania deszczy na obszarze zlewni doświadczalnej w Warszawie. Woda-Sr.-Obsz. Wiej. 2012, 12, 27–38. [Google Scholar]
- Barszcz, M.P. Application of dynamic and conceptual models for simulating flow hydrographs in an urbanized catchment under conditions of controlled outflow from stormwater tanks. J. Water Clim. Chang. 2021, 12, 3899–3914. [Google Scholar] [CrossRef]
- Dou, X.; Song, J.; Wang, L.; Tang, B.; Xu, S.; Kong, F.; Jiang, X. Flood risk assessment and mapping based on a modified multi-parameter flood hazard index model in the Guanzhong Urban Area, China. Stoch. Environ. Res. Risk Assess. 2018, 32, 1131–1146. [Google Scholar] [CrossRef]
- Kaźmierczak, B.; Kotowski, A.; Dancewicz, A. Weryfikacja metod wymiarowania kanalizacji deszczowej za pomocą modelu hydrodynamicznego (SWMM) w warunkach wrocławskich. Ochr. Sr. 2012, 34, 25–31. [Google Scholar]
- Hakiel, J. Designing drainage systems–possible application of advanced calculations and hydrodynamical modeling. PhD Interdiscip. J. 2015, 1, 167–174. [Google Scholar]
- Hajdukiewicz, M.; Kowalski, D. Porównanie metod obliczeniowych do wymiarowania kanalizacji deszczowej. Gaz Woda Tech. Sanit. 2018, 1, 9–11. [Google Scholar] [CrossRef]
- Kotowski, A.; Nowakowska, M. Standards for the dimensioning and assessment of reliable operations of area drainage systems under conditions of climate change. Tech. Trans. 2018, 115, 125–139. [Google Scholar]
- Wittmanová, R.; Marko, I.; Šutúš, M.; Stanko, Š. Development of design rainfalls: A review. Mater. Sci. Eng. 2021, 1209, 012028. [Google Scholar] [CrossRef]
- Lomotowski, J. Podstawy Bezpiecznego Wymiarowania Odwodnień Terenów. Ochr. Sr. 2012, 34, 52. [Google Scholar]
- Błaszczyk, W. Spływy deszczowe w sieci kanalizacyjnej (wytyczne do normatywu). GWiTS 1954, 9, 262–271. [Google Scholar]
- Błaszczyk, W.; Roman, M.; Stamatello, H. Kanalizacja; Tom, I., Ed.; Arkady: Warsaw, Poland, 1974. [Google Scholar]
- Błaszczyk, P.; Igielski, D.; Osmulska-Mróz, B. Zasady Planowania i Projektowania Systemów Kanalizacyjnych w Aglomeracjach Miejsko-Przemysłowych i Dużych Miastach; Wyd. Instytut Kształtowania Środowiska: Warsaw, Poland, 1983. [Google Scholar]
- Kotowski, A. Wybrane aspekty wymiarowania i sprawdzania przepustowości kanałów deszczowych i ogólnospławnych. Forum Eksploatatora 2006, 1, 18–25. [Google Scholar]
- Kotowski, A. Podstawy Bezpiecznego Wymiarowania Odwodnień Terenów; Wydawnictwo Seidel–Przywecki: Warsaw, Poland, 2015. [Google Scholar]
- Schmitt, T.G. Kommentar zum Arbeitsblatt A “118 Hydraulische Bemessung und Nachweis von Entwässerungssystemen”; Wydawnictwo Seidel–Przywecki: Warsaw, Poland, 2007. [Google Scholar]
- Kotowski, A.; Kaźmierczak, B. Ocena przydatności dotychczasowych wzorów na natężenie opadów deszczowych do projektowania odwodnień terenów w Polsce. Gaz Woda Tech. Sanit. 2009, 11, 11–17. [Google Scholar]
- Licznar, P. Obliczenia częstotliwości nadpiętrzenia sieci kanalizacji deszczowej. Gaz Woda Tech. Sanit. 2008, 7–8, 16–21. [Google Scholar]
- Bogdanowicz, E.; Stachy, J. Maximum Rainfall in Poland—A Design Approach; IAHS Publications: Wallingford, UK, 2002; pp. 15–18. [Google Scholar]
- Dziopak, J.; Hypiak, J. Analiza metodologii wymiarowania kanalizacji ogólnospławnej. Zesz. Nauk. Politech. Rzeszowskiej Bud. Inż. Sr. 2011, 58, 21–34. [Google Scholar]
- Fletcher, T.D.; Shuster, W.; Hunt, W.F.; Ashley, R.; Butler, D.; Arthur, S.; Viklander, M. SUDS, LID, BMPs, WSUD and more—The evolution and application of terminology surrounding urban drainage. Urban Water J. 2015, 12, 525–542. [Google Scholar] [CrossRef]
- Gimenez-Maranges, M.; Breuste, J.; Hof, A. Sustainable Drainage Systems for transitioning to sustainable urban flood management in the European Union: A review. J. Clean. Prod. 2020, 255, 120191. [Google Scholar] [CrossRef]
- Godyń, I.; Grela, A.; Stajno, D.; Tokarska, P. Sustainable rainwater management concept in a housing estate with a financial feasibility assessment and motivational rainwater fee system efficiency analysis. Water 2020, 12, 151. [Google Scholar] [CrossRef] [Green Version]
- Woods Ballard, B.; Wilson, S.; Udale-Clarke, H.; Illman, S.; Scott, T.; Ashley, R.; Kellagher, R. The SuDS Manual; CIRIA: London, UK, 2015. [Google Scholar]
- Berwick, N. Sustainable Drainage Systems: Operation and Maintenance. In Sustainable Surface Water Management: A Handbook for SUDS; Wiley Blackwell: Chichester, UK, 2016; pp. 45–55. [Google Scholar]
- Graham, A. Sustainable Drainage Systems: Delivering Multiple Benefits for People and Wildlife. In Sustainable Surface Water Management: A Handbook for SUDS; Wiley Blackwell: Chichester, UK, 2016. [Google Scholar]
- Fletcher, T.D.; Andrieu, H.; Hamel, P. Understanding, management and modelling of urban hydrology and its consequences for receiving waters: A state of the art. Adv. Water Resour. 2013, 51, 261–279. [Google Scholar] [CrossRef]
- Burszta-Adamiak, E. Analysis of the retention capacity of green roofs. J. Water Land Dev. 2012, 16, 3–9. [Google Scholar] [CrossRef] [Green Version]
- Barszcz, M.P. Influence of applying infiltration and retention objects to the rainwater runoff on a plot and catchment scale–case study of Służewiecki Stream subcatchment in Warsaw. Pol. J. Environ. Stud. 2015, 24, 57–65. [Google Scholar] [CrossRef]
- Sobol, T.P. Urban Waterscape. Architecture’s Response to Changing Water Levels on the Example of Siekierki Area in Warsaw. Ph.D. Thesis, Katedra Urbanistyki i Gospodarki Przestrzennej, Warsaw University of Technology, Warsaw, Poland, 2018. [Google Scholar]
- Wojnowska-Heciak, M.; Suchocka, M.; Grzebulska, B.; Warmińska, M. Use of structural soil as a method for increasing flood resilience in Praga Północ in Warsaw. Annals of Warsaw University of Life Sciences–SGGW. Hortic. Landsc. Archit. 2019, 40, 15–28. [Google Scholar]
- Bus, A.; Szelągowska, A. Green water from green roofs—the ecological and economic effects. Sustainability 2021, 13, 2403. [Google Scholar] [CrossRef]
- Marzuchowska, M.; Żebrowski, M. Miasto Gąbka—Czyli Jak Wycisnąć Więcej Korzyści z Naszych Miast? Available online: https://obserwatorium.miasta.pl/miasto-gabka-czyli-jak-wycisnac-wiecej-korzysci-z-naszych-miast/ (accessed on 20 June 2022).
- Beeneken, T.; Erbe, V.; Messmer, A.; Reder, C.; Rohlfing, R.; Scheer, M.; Weyand, M. Real time control (rtc) of urban drainage systems–a discussion of the additional efforts compared to conventionally operated systems. Urban Water J. 2013, 10, 293–299. [Google Scholar] [CrossRef]
- Maiolo, M.; Palermo, S.A.; Brusco, A.C.; Pirouz, B.; Turco, M.; Vinci, A.; Piro, P. On the use of a real-time control approach for urban stormwater management. Water 2020, 12, 2842. [Google Scholar] [CrossRef]
- Borsányi, P.; Benedetti, L.; Dirckx, G.; De Keyser, W.; Muschalla, D.; Solvi, A.M.; Vandenberghe, V.; Weyand, M.; Vanrolleghem, P.A. Modelling real-time control options on virtual sewer systems. J. Environ. Eng. Sci. 2008, 7, 395–410. [Google Scholar] [CrossRef]
- Beck, M.B. Dynamic modeling and control applications in water-quality maintenance. Water Res. 1976, 10, 575–595. [Google Scholar] [CrossRef]
- Ly, D.K. Water Quality-Based Real Time Control of Combined Sewer Systems. Ph.D. Thesis, Université de Lyon, Lyon, France, 2019. [Google Scholar]
- Schütze, M.; Campisano, A.; Colas, H.; Schilling, W.; Vanrolleghem, P.A. Real time control of urban wastewater systems—Where do we stand today? J. Hydrol. 2004, 299, 335–348. [Google Scholar] [CrossRef]
- Schütze, M.; Erbe, V.; Haas, U.; Scheer, M.; Weyand, M. Sewer system real-time control supported by the M180 guideline document. Urban Water J. 2008, 5, 67–76. [Google Scholar] [CrossRef]
- Jørgensen, M.; Schilling, W.; Harremoës, P. General assessment of potential CSO reduction by means of real time control. Water Sci. Technol. 1995, 32, 249–257. [Google Scholar] [CrossRef]
- Campisano, A.; Cabot Ple, J.; Muschalla, D.; Pleau, M.; Vanrolleghem, P.A. Potential and limitations of modern equipment for real time control of urban wastewater systems. Urban Water J. 2013, 10, 300–311. [Google Scholar] [CrossRef]
- Schütze, M.; Butler, D.; Beck, M.B. Modelling, Simulation and Control of Urban Wastewater Systems; Springer: London, UK, 2002. [Google Scholar]
- Butler, D.; James Digman, C.; Makropoulos, C.; Davies, J. Urban Drainage; CRC Press: Boca Raton, FL, USA, 2018. [Google Scholar]
- Campisano, A.; Schilling, W.; Modica, C. Regulators’ setup with application to the Roma-Cecchignola combined sewer system. Urban Water 2000, 2, 235–242. [Google Scholar] [CrossRef]
- Meirlaen, J. Immission Based Real-Time Control of the Integrated Urban Wastewater System. Ph.D. Thesis, Ghent University, Ghent, Belgium, 2002. [Google Scholar]
- Lund, N.; Falk, A.; Borup, M.; Madsen, H.; Mikkelsen, P. Model predictive control of urban drainage systems: A review and perspective towards smart real-time water management. Crit. Rev. Environ. Sci. Technol. 2018, 48, 279–339. [Google Scholar] [CrossRef]
- Rawlings, J.; Mayne, D. Postface to model predictive control: Theory and design. Nob Hill Pub 2012, 5, 155–158. [Google Scholar]
- MPWiK. Inteligentny System Sterowania Siecią Kanalizacyjną w Stolicy. Available online: https://www.mpwik.com.pl/view/inteligentny-system-sterowania-sieci-kanalizacyjn-w-stolicy (accessed on 20 June 2022).
- Wawer, K. Synteza Problemów Wodno-Gospodarczych w Zlewni Jeziora Wilanowskiego i Rzeki Wilanówki. Available online: http://www.wilanow-palac.pl/download.php/28496/synteza_problemow_wodno_gosp_KWawer_17082015.pdf (accessed on 2 April 2020).
- Dąbrowska, K.; Trybułowski, Ł.; Butkiewicz, M.; Klimowicz, J.; Kisiel, A.; Skoczko, W.; Skoczko, I. Zarządzanie krajową gospodarką wodną od 2018 roku. Bud. Inż. Sr. 2018, 9, 109–115. [Google Scholar]
- Kińczyk, S. Tak Urósł Ursynów Przez 25 Lat! Available online: https://www.haloursynow.pl/artykuly/tak-urosl-ursynow-przez-25-lat-infografika,13924.htm (accessed on 10 April 2022).
- Witkowski, M.E. Warsaw Reconstructed: A Study and Historical Background of an Urban Plan for a Modern City Based on Its Cultural Past; Wayne State University: Detroit, MI, USA, 1964. [Google Scholar]
- Lewin, M.E.; Korzeń, K. Wilanowski Park Kulturowy Jako Przykład Ochrony i Zarządzania Krajobrazem Kulturowym. Prace Komisji Krajobrazu Kulturowego nr 10; Komisja Krajobrazu Kulturowego PTG: Sosnowiec, Poland, 2008. [Google Scholar]
- Marianowicz-Szczygieł, A. Ursynowskie Pojezierze. Nie Pozwólmy Mu Zniknąć! Halo Ursynów. Available online: https://www.haloursynow.pl/artykuly/ursynowskie-pojezierze-nie-pozwolmy-mu-zniknac,6758.htm (accessed on 6 April 2022).
- Gradowski, L.; Banasik, K. Wpływ zbiornika Staw Berensewicza na redukcję fali wezbraniowej Potoku Służewieckiego. Przegląd Naukowy. Inż. Kształt. Sr. 2008, 17, 39. [Google Scholar]
- Chmielewski, S.; Tabor, J.; Matyjasiak, J. Stan awifauny Jeziora Zgorzała w Warszawie po rekultywacji. Kulon 2018, 23, 87–97. [Google Scholar]
- Sobieraj, J. Impact of spatial planning on the pre-investment phase of the development process in the residential construction field. Arch. Civ. Eng. 2017, 63, 113–130. [Google Scholar] [CrossRef] [Green Version]
- Sobieraj, J. Investment Project Management on the Housing Construction Market; Universidad de Granada, Universitas Aurum Grupo Hespérides: Madrid, Spain, 2020. [Google Scholar]
- Sobieraj, J.; Metelski, D. Project Risk in the Context of Construction Schedules—Combined Monte Carlo Simulation and Time at Risk (TaR) Approach: Insights from the Fort Bema Housing Estate Complex. Appl. Sci. 2022, 12, 1044. [Google Scholar] [CrossRef]
- Jakubiak, B.; Licznar, P.; Malinowski, S.P. Rainfall estimates from radar vs. raingauge measurements. Warsaw case study. Environ. Prot. Eng. 2014, 40, 2. [Google Scholar] [CrossRef]
- Kassenberg, A.; Szymalski, W.; Drogosz, L.; Bugaj, M.; Jakubczak, I. Strategy of Adaptation to Climate Change for the Capital City of Warsaw to 2030 with a Perspective 2050 Municipal Adaptation Plan; Capital City of Warsaw City Hall: Warsaw, Poland, 2019. [Google Scholar]
- Giemza, W.; Szczerbatko, M. Opracowanie Stadium Projektu Budowlanego Budowy Południowej Obwodnicy Warszawy na Odcinku od Węzła “Puławska” do Węzła “Lubelska” (Długość ok. 19.5 km)—Koncepcja Programowa; Arcadis: Warsaw, Poland, 2013. [Google Scholar]
- Miasto Stołeczne Warszawa. Studium Uwarunkowań i Kierunków Zagospodarowania Przestrzennego Warszawy Wraz z Późniejszymi Zmianami. Available online: https://architektura.um.warszawa.pl/studium2006 (accessed on 10 April 2022).
- Zdancewicz. The Spacial Policy of Warsaw; Office of Architecture and Spatial Planning of the Capital City of Warsaw City Hall: Warsaw, Poland, 2007. [Google Scholar]
- Banasik, K.; Hejduk, L.; Barszcz, M. Flood flow consequences of land use changes in a small urban catchment of Warsaw. In Proceedings of the 11th International Conference on Urban Drainage (Vol. 31, No. 10), Edinburgh, UK, 31 August–5 September 2008. [Google Scholar]
- Olesiński, A. Potok Służewiecki przestanie zalewać ulice. Nowocz. Bud. Inż. 2009, 5, 90–91. [Google Scholar]
- Barszcz, M.P. Analiza wpływu zastosowania obiektów do infiltracji i retencji wód deszczowych na kształtowanie odpływu ze zlewni Potoku Służewieckiego w Warszawie. Gospod. Wodna 2014, 4, 134–140. [Google Scholar]
- Krajewski, A.; Sikorska, A.E.; Banasik, K. Modeling suspended sediment concentration in the stormwater outflow from a small detention pond. J. Environ. Eng. 2017, 143, 05017005. [Google Scholar] [CrossRef]
- Nowak Da Costa, J.; Calka, B.; Bielecka, E. Urban Population Flood Impact Applied to a Warsaw Scenario. Resources 2021, 10, 62. [Google Scholar] [CrossRef]


| Design Rainfall Frequency (1 in C Years) | Land Use | Frequency of Occurrence of Floods (1 in C Years) |
|---|---|---|
| 1 in 1 | Rural areas | 1 in 10 |
| 1 in 2 | Residential areas | 1 in 20 |
| 1 in 5 | City centres, service and industrial areas | 1 in 30 |
| 1 in 10 | Underground transport facilities, street crossings, etc. | 1 in 50 |
Publisher’s Note: MDPI stays neutral with regard to jurisdictional claims in published maps and institutional affiliations. |
© 2022 by the authors. Licensee MDPI, Basel, Switzerland. This article is an open access article distributed under the terms and conditions of the Creative Commons Attribution (CC BY) license (https://creativecommons.org/licenses/by/4.0/).
Share and Cite
Sobieraj, J.; Bryx, M.; Metelski, D. Stormwater Management in the City of Warsaw: A Review and Evaluation of Technical Solutions and Strategies to Improve the Capacity of the Combined Sewer System. Water 2022, 14, 2109. https://doi.org/10.3390/w14132109
Sobieraj J, Bryx M, Metelski D. Stormwater Management in the City of Warsaw: A Review and Evaluation of Technical Solutions and Strategies to Improve the Capacity of the Combined Sewer System. Water. 2022; 14(13):2109. https://doi.org/10.3390/w14132109
Chicago/Turabian StyleSobieraj, Janusz, Marek Bryx, and Dominik Metelski. 2022. "Stormwater Management in the City of Warsaw: A Review and Evaluation of Technical Solutions and Strategies to Improve the Capacity of the Combined Sewer System" Water 14, no. 13: 2109. https://doi.org/10.3390/w14132109