
Total Organic Carbon Concentration and Export in a Human-Dominated Urban River: A Case Study in the Shenzhen River and Bay Basin


1
Guangdong Provincial Engineering and Technology Research Center for Water Affairs Big Data and Water Ecology, Shenzhen Water Planning and Design Institute, Shenzhen 518008, China
2
Department of Geography, The University of Hong Kong, Pokfulam Road, Hong Kong 999077, China
*
Author to whom correspondence should be addressed.
Water 2022, 14(13), 2102; https://doi.org/10.3390/w14132102
Submission received: 28 May 2022
/
Revised: 26 June 2022
/
Accepted: 27 June 2022
/
Published: 30 June 2022
(This article belongs to the Special Issue Recent Progress in CO2 Emission from the World’s Rivers)
Abstract
:In order to understand the organic carbon dynamics in urban rivers, the present study monitored the total organic carbon (TOC) concentration and export in the Shenzhen River and Bay basin. The results show that the average TOC concentrations ranged from 7.04 to 17.50 mg/L in the study area, which exhibited pronounced spatial and temporal variations due to urbanization level, rainfall–runoff, and effluent of wastewater treatment plants (WWTPs). The TOC concentrations of rainwater were averaged at 4.03 mg/L during 2011–2012, which was higher than that of some urban river basins in developed countries. As an average rainfall year, the total TOC export in 2012 was 11.2 × 10⁶ kg/yr in the study basin, of which 37.5% was contributed by the effluent of WWTPs, 14.1% by wet deposition, and 48.4% by the surface non-point sources and endogenous pollution. The areal yield of TOC in the Shenzhen River and Bay basin was 23.73 × 10³ kg/(km2.yr) in 2012, which was 2.86 times the Pearl River’s average value and 6.43 times the global average value. According to the predicted values of linear regression, the TOC concentration showed a gradual downward trend (R = 0.87, p < 0.001, n = 14) during the period 2006–2019, which also induced a decreasing TOC export (R = 0.23, p > 0.05, n = 14).
1. Introduction
Rivers connect terrestrial and marine ecosystems and have essential ecosystem service functions in the carbon and hydrological cycle [1,2]. The annual carbon transported to the ocean via global streams and rivers is 0.8–1.2 Pg on average, accounting for about 25% of the net productivity of terrestrial ecosystems [3,4], which is on the same order as the carbon released by fossil fuel combustion of 5.2 Pg/yr and the net absorption of marine CO2 of 1.7–2.8 Pg/yr [5,6,7,8]. River systems are an essential component of the global carbon cycle [2,5,6,7,8].
In recent decades, great attention has been paid to riverine carbon export due to its importance and complexity [9,10]. TOC is helpful to advance understanding of the role of freshwaters in contributing to regional carbon budgets, given that recent literature suggests that freshwater ecosystems may play a more important role than previously recognized in carbon transformations and retention [10,11,12]. Natural biological and geochemical activities in soils and bedrock, as well as anthropogenic activities, are responsible for the TOC export and its composition in stream and rivers [9]. The TOC concentrations in many Chinese rivers have increased or maintained at a high-level due to the effect of natural conditions and human pressures [2]. Zhang et al. (2009) revealed that the range of POC concentration was 0.14–6.33 mg/L, and DOC was 1.01–3.78 in a human-disturbed mountainous river in the Pearl River basin [13], which was two to three times the TOC concentration in Xijiang River (the main branch of Pearl River) as reported by Wei et al. (2011) [14]. For some other large rivers in China, TOC concentration was 4.26–9.51 mg/L in the Haihe River, 8.09 mg/L in the Yangtze River, 3.0–16.27 mg/L in the Yellow River, and 5.05–26.62 mg/L in the Majia River [15,16,17]. It is well documented that land use profoundly affects lateral fluxes of carbon in surface waters [18,19,20]. Shih et al. (2010) [18] and Kaushal et al. (2014) [21] found that land use influences the TOC load, and a shift from agriculture or forest to urban will increase TOC load by three or four times. Kalev and Toor (2020) [22] reported that the TOC concentration of stormwater runoff could reach 12.5 mg/L, and DOC is the dominant component (86.2% of TOC) in the urban catchment of Manatee River in Southwest Florida. Wu et al. (2016) [23] determined that rainfall is the dominant factor for TOC load, and land use is also a principal factor for TOC load in a peri-urban watershed of Taihu Lake (China). Increases in riverine organic carbon concentrations have been observed across the northern hemisphere over the past few decades [14,15,16,17,18,19,20,21,22,23,24,25,26,27] due largely to climate change and the associated warming and increasing variation of precipitation, acidification, and land-use change [28,29,30]. For example, TOC concentrations with an average increase from 12.0 to 15.1 mg/L during the period 1993–2017 have been observed in boreal river systems of Finland, and discharge-associated land-use change is the most common driver, whereas pH and temperature were less important drivers [27]. Raymond et al. (2008) also reported that anthropogenic perturbations have greatly enhanced the fluxes of water and carbon from the Mississippi River over the past 100 years [31].
Urbanization or land use affects TOC concentration and profoundly affects TOC output by affecting rainfall–runoff and drainage in the Pearl River basin [13,14]. According to the nature–society dualistic cycle, the water cycle can be divided into natural and social cycles [32,33]. The natural water cycle is formed by the four paths of precipitation–slope–channel–underground, which is a typical collective structure [32,33,34]. With the development of human society, the social cycle forms complex paths such as water intake, water supply, water use, drainage, sewage collection and treatment, and recycling, which is also a typical dissipative structure [32,33,34].
Although there are some studies on TOC export in developed countries, carbon load in developing countries, especially for TOC export in urban rivers with a human-dominated hydrological cycle, has not been fully reported. Their contribution to the net ecosystem carbon load is still uncertain. This study aims to better understand (1) the primary characteristics of TOC concentration in rivers and rainwater and (2) TOC export and its primary sources in a rapidly urbanizing area of the Shenzhen River and Bay basin.
2. Materials and Method
2.1. Study Area
Shenzhen City is located in the central and southern districts of Guangdong Province, bordering Daya Bay to the East, the Pearl River Estuary to the west, Dongguan City and Huizhou City to the north, and territories of Hong Kong to the south. The geographical coordinates are 22°26′59″ to 22°51′49″ North latitude and 113°45′42″ to 114°37′21″ East longitude. The plane shape of the land area is long and narrow, which is wide from east to west and narrow from north to south. The territory has complex terrain and various geomorphologic types. It belongs to a wide geomorphologic landscape dominated by hills combined with low mountains, terraces, and plains. The city covers an area of 1952.48 km2. Shenzhen has a subtropical marine monsoon climate on the South China Sea coast. The weather is mild, and the annual average temperature is 22.3 °C. The rainy season starts from April until September, with an average yearly rainfall of 1925 mm.
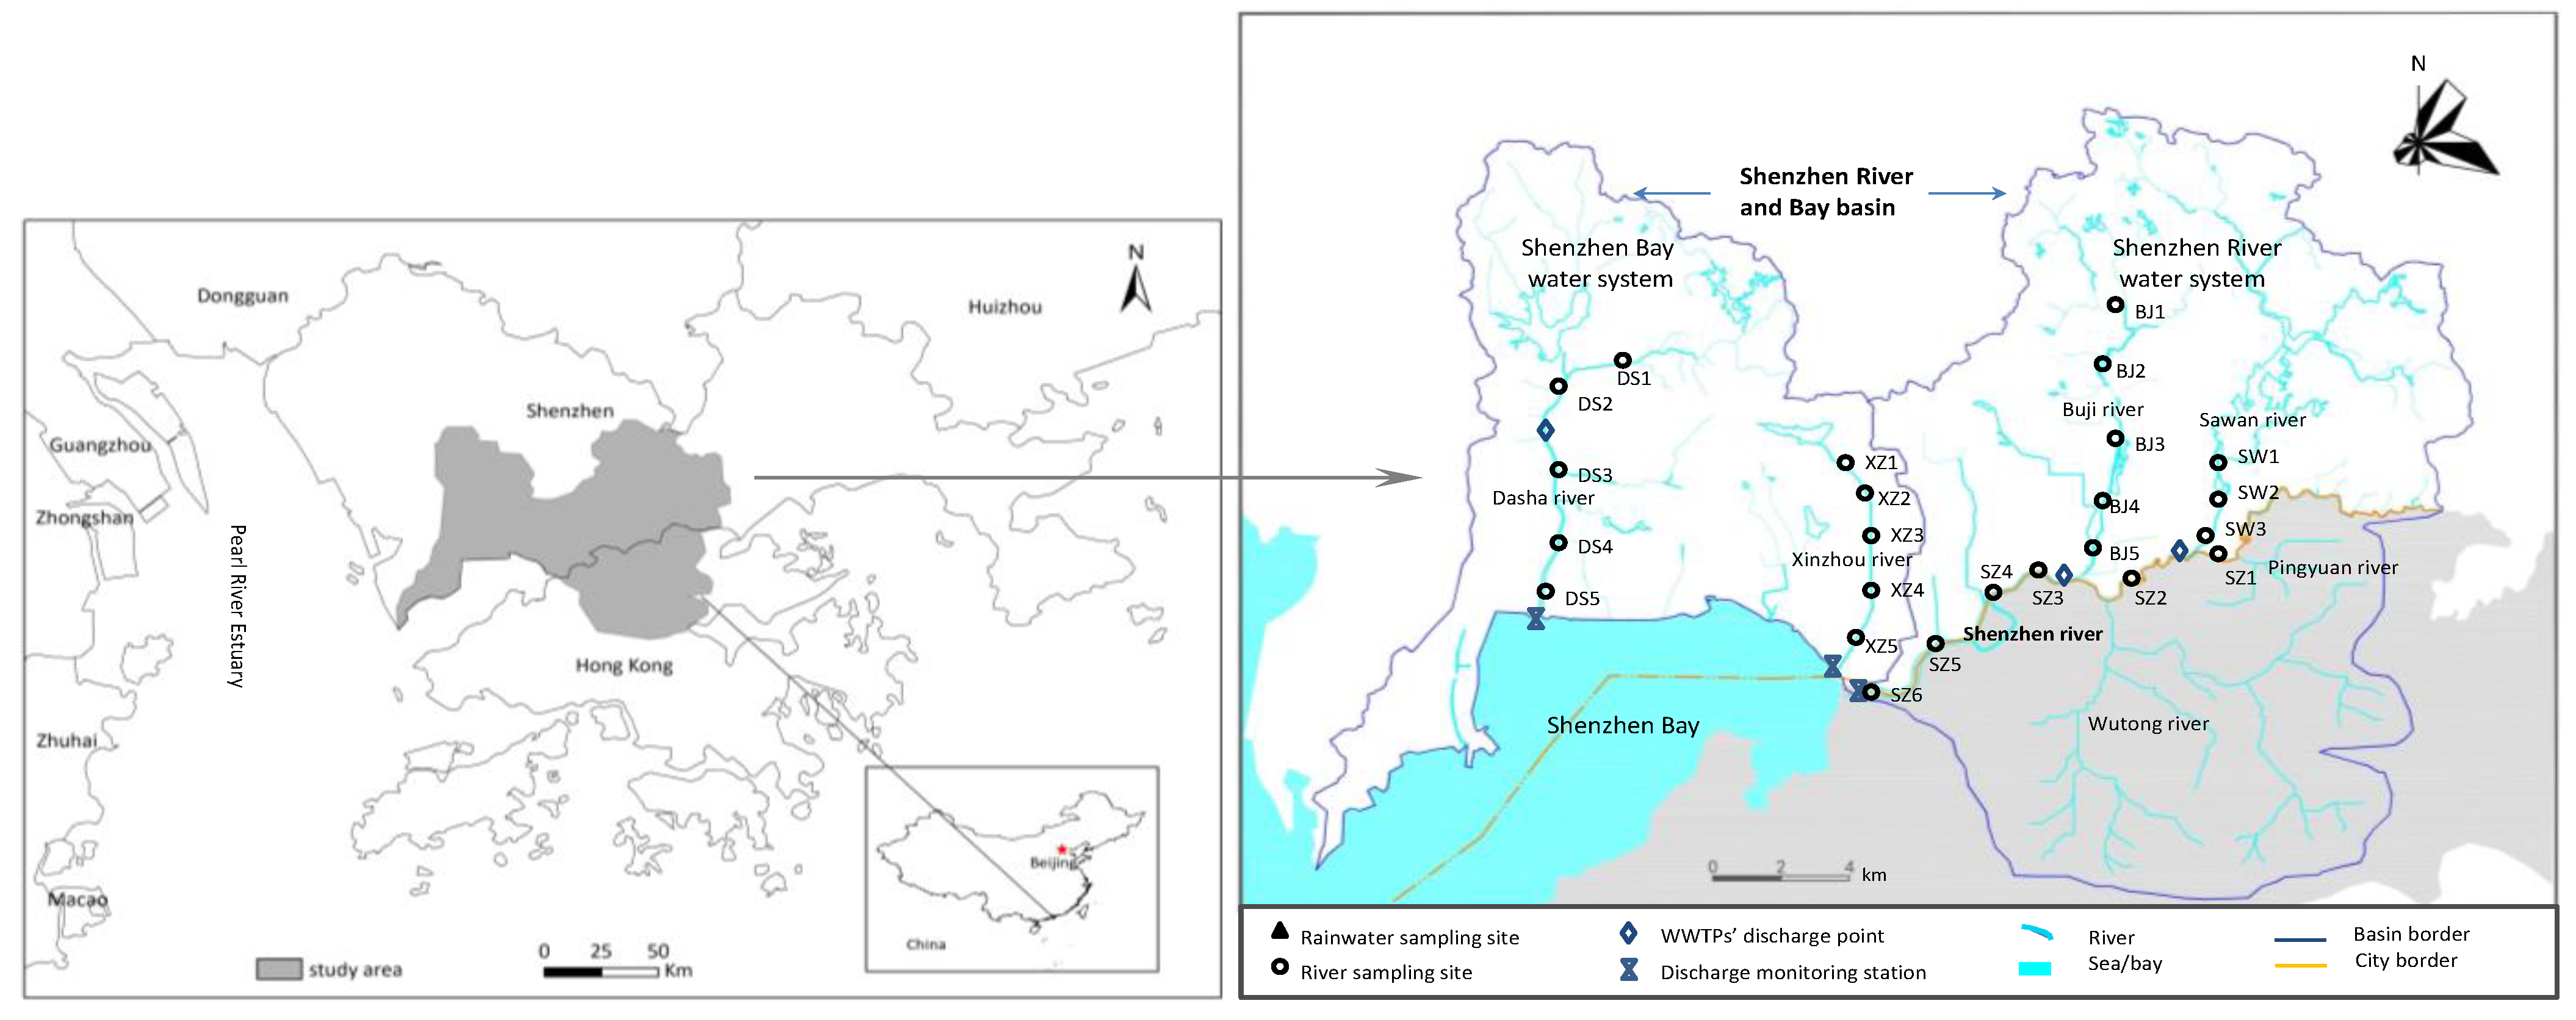
Shenzhen has numerous streams and rivers. Most rivers originate from the city’s Yangtai Mountain and coastal mountains and flow into the Pearl River Estuary, Shenzhen Bay, Dapeng Bay, and Daya Bay, respectively. Among them, the Shenzhen River and Bay basin was the fastest-growing region and had completed industrialization and urbanization processes during the period 1980–2010. Shenzhen River and Bay basin includes the Shenzhen River and Shenzhen Bay water system (Figure 1). The basin’s total area is 472 km2: 348.5 km2 on the Shenzhen side and the other 123.5 km2 on the Hong Kong side. The rivers of Shenzhen River and Bay ultimately flow into Shenzhen Bay. Shenzhen Bay is a semi-closed bay with a water surface area of 90 km2. The Shenzhen River and Bay basin is a high-intensity residential and commercial land with a GDP of USD 215 billion (about 50% of GDP of Shenzhen City, and the GDP of the Shenzhen River basin on Hong Kong side is not considered), and the population density was 1.32 × 10⁴ people/km2 in 2019 (Shenzhen side).
Although the Shenzhen River and Bay basin is located in subtropical China with high precipitation, there is an area with a high level of economy and society and a large population. Local water resources cannot meet the increased demand for production and living needs. The local water-gathering catchment can only provide around 15% of the total water demand. More than 85% of the water sources consumed in the Shenzhen River and Bay basin are transferred from the Dongjiang River. Two forms of the water cycle are exited. One is the natural water cycle, in which natural rainfall and runoff are deducted from reservoir water storage [32,33]. Another is the social water cycle, in which external water is transferred, and local water storage in reservoirs enters the water supply system [32,33]. Moreover, the water amount of the social water cycle is twice or more than that of the natural water cycle. The local water cycle and its associated carbon cycle and other ecological processes can be changed profoundly by enhancing the social water cycle process [32,33].
2.2. Water Samples
In order to understand the TOC concentration and load of rivers, a total of 24 water sampling sites among the major streams and rivers were collected in this study (Figure 1), including 5 monitoring sites in the Dasha River (DS1, DS2, DS3, DS4, and DS5), Buji River (BJ1, BJ2, BJ3, BJ4, and BJ5), and Xinzhou River (XZ1, XZ2, XZ3, XZ4, and XZ5), respectively, and 3 monitoring sites in the Shawan River (SW1, SW2, and SW3) and 6 monitoring sites in the Shenzhen River (SZ1, SZ2, SZ3, SZ4, SZ5, and SZ6). No sampling was performed in the Pingyuan River and Wutong River, the branches of Shenzhen River on Hong Kong side. Water samplings were collected from May 2011 to Dec 2012. The sampling frequency was generally monthly in 2011 but increased to biweekly in the rainy season from July to August and decreased to three months in 2012. In total, 312 samples were collected in this study.
There are three wastewater treatment plants in the study area. Water samples of the WWTPs’ effluent were also collected in 2011 at the same sampling frequency with the river systems. Because the variation in TOC concentration among the effluent of the three WWTPs was very small, no further sampling was carried out in 2012.
2.3. Chemical Analysis
Water samples from river sites and treated sewage were analyzed for pH, TOC, and chemical oxygen demand (COD). Because a significant correlation between COD and TOC was reported [17], this study also analyzed COD for further use. pH was determined using a micro-glass electrode (pH-Electrode, Sentix21-3, WTW, Munich, Germany). Water samplings were kept unfiltered for TOC and COD analysis. The TOC concentrations were determined with a TOC-VSCH analyzer (Shimadzu Corp., Tokyo, Japan) in this study. Before analysis, inorganic carbon was stripped off by adjusting the pH to 2 with HNO3 and sparging with CO2-free synthetic air. Duplication and blank samples were used to control the quality, and the analytical error (1σ) was below 1%. CODCr was analyzed using a standard method of Chinese EPA (rapid digestion spectrophotometry HJ 399-2007). In this method, potassium dichromate solution was added to the sample and silver sulfate was used as catalyst in a medium with strong sulfuric acid. After high-temperature digestion, we determined the chemical oxygen demand value by spectrophotometry. The 24 samples from October 2011 were affected by engineering construction, and 13 samples in other months were discarded in quality control.
2.4. Data Collection
Historical data of rainfall, runoff and water quality, and effluent of WWTPs data in the Shenzhen River and Bay basin during the period 2006~2019 were collected from Shenzhen Water Bureau (http://swj.sz.gov.cn, accessed on 12 May 2021) and Shenzhen Eco-environment Bureau (http://meeb.sz.gov.cn, accessed on 6 May 2021). The urbanization levels (the ratio of the built-up area to the total urban area) among different river basins were collected from Shenzhen Planning and Natural Resource Bureau (http://pnr.sz.gov.cn/, accessed on 15 April 2022).
2.5. Statistical Analysis
Analysis of variance (ANOVA) was used to test the difference in TOC among the different rivers. Comparisons were made using the least significant difference (LSD) method with p < 0.05.
Correlation analysis was applied to test the relationship between rainfall volume and rainwater TOC. Linear regression was used to analyze the relationship between TOC and CODCr concentration. Pearson’s correlation coefficients were calculated to analyze the correlation between rainfall volume and rainwater TOC, CODCr concentration, and TOC export over time, respectively, to detect the statistical significance.
3. Results and Discussion
3.1. TOC Concentrations on the Water’s Surface
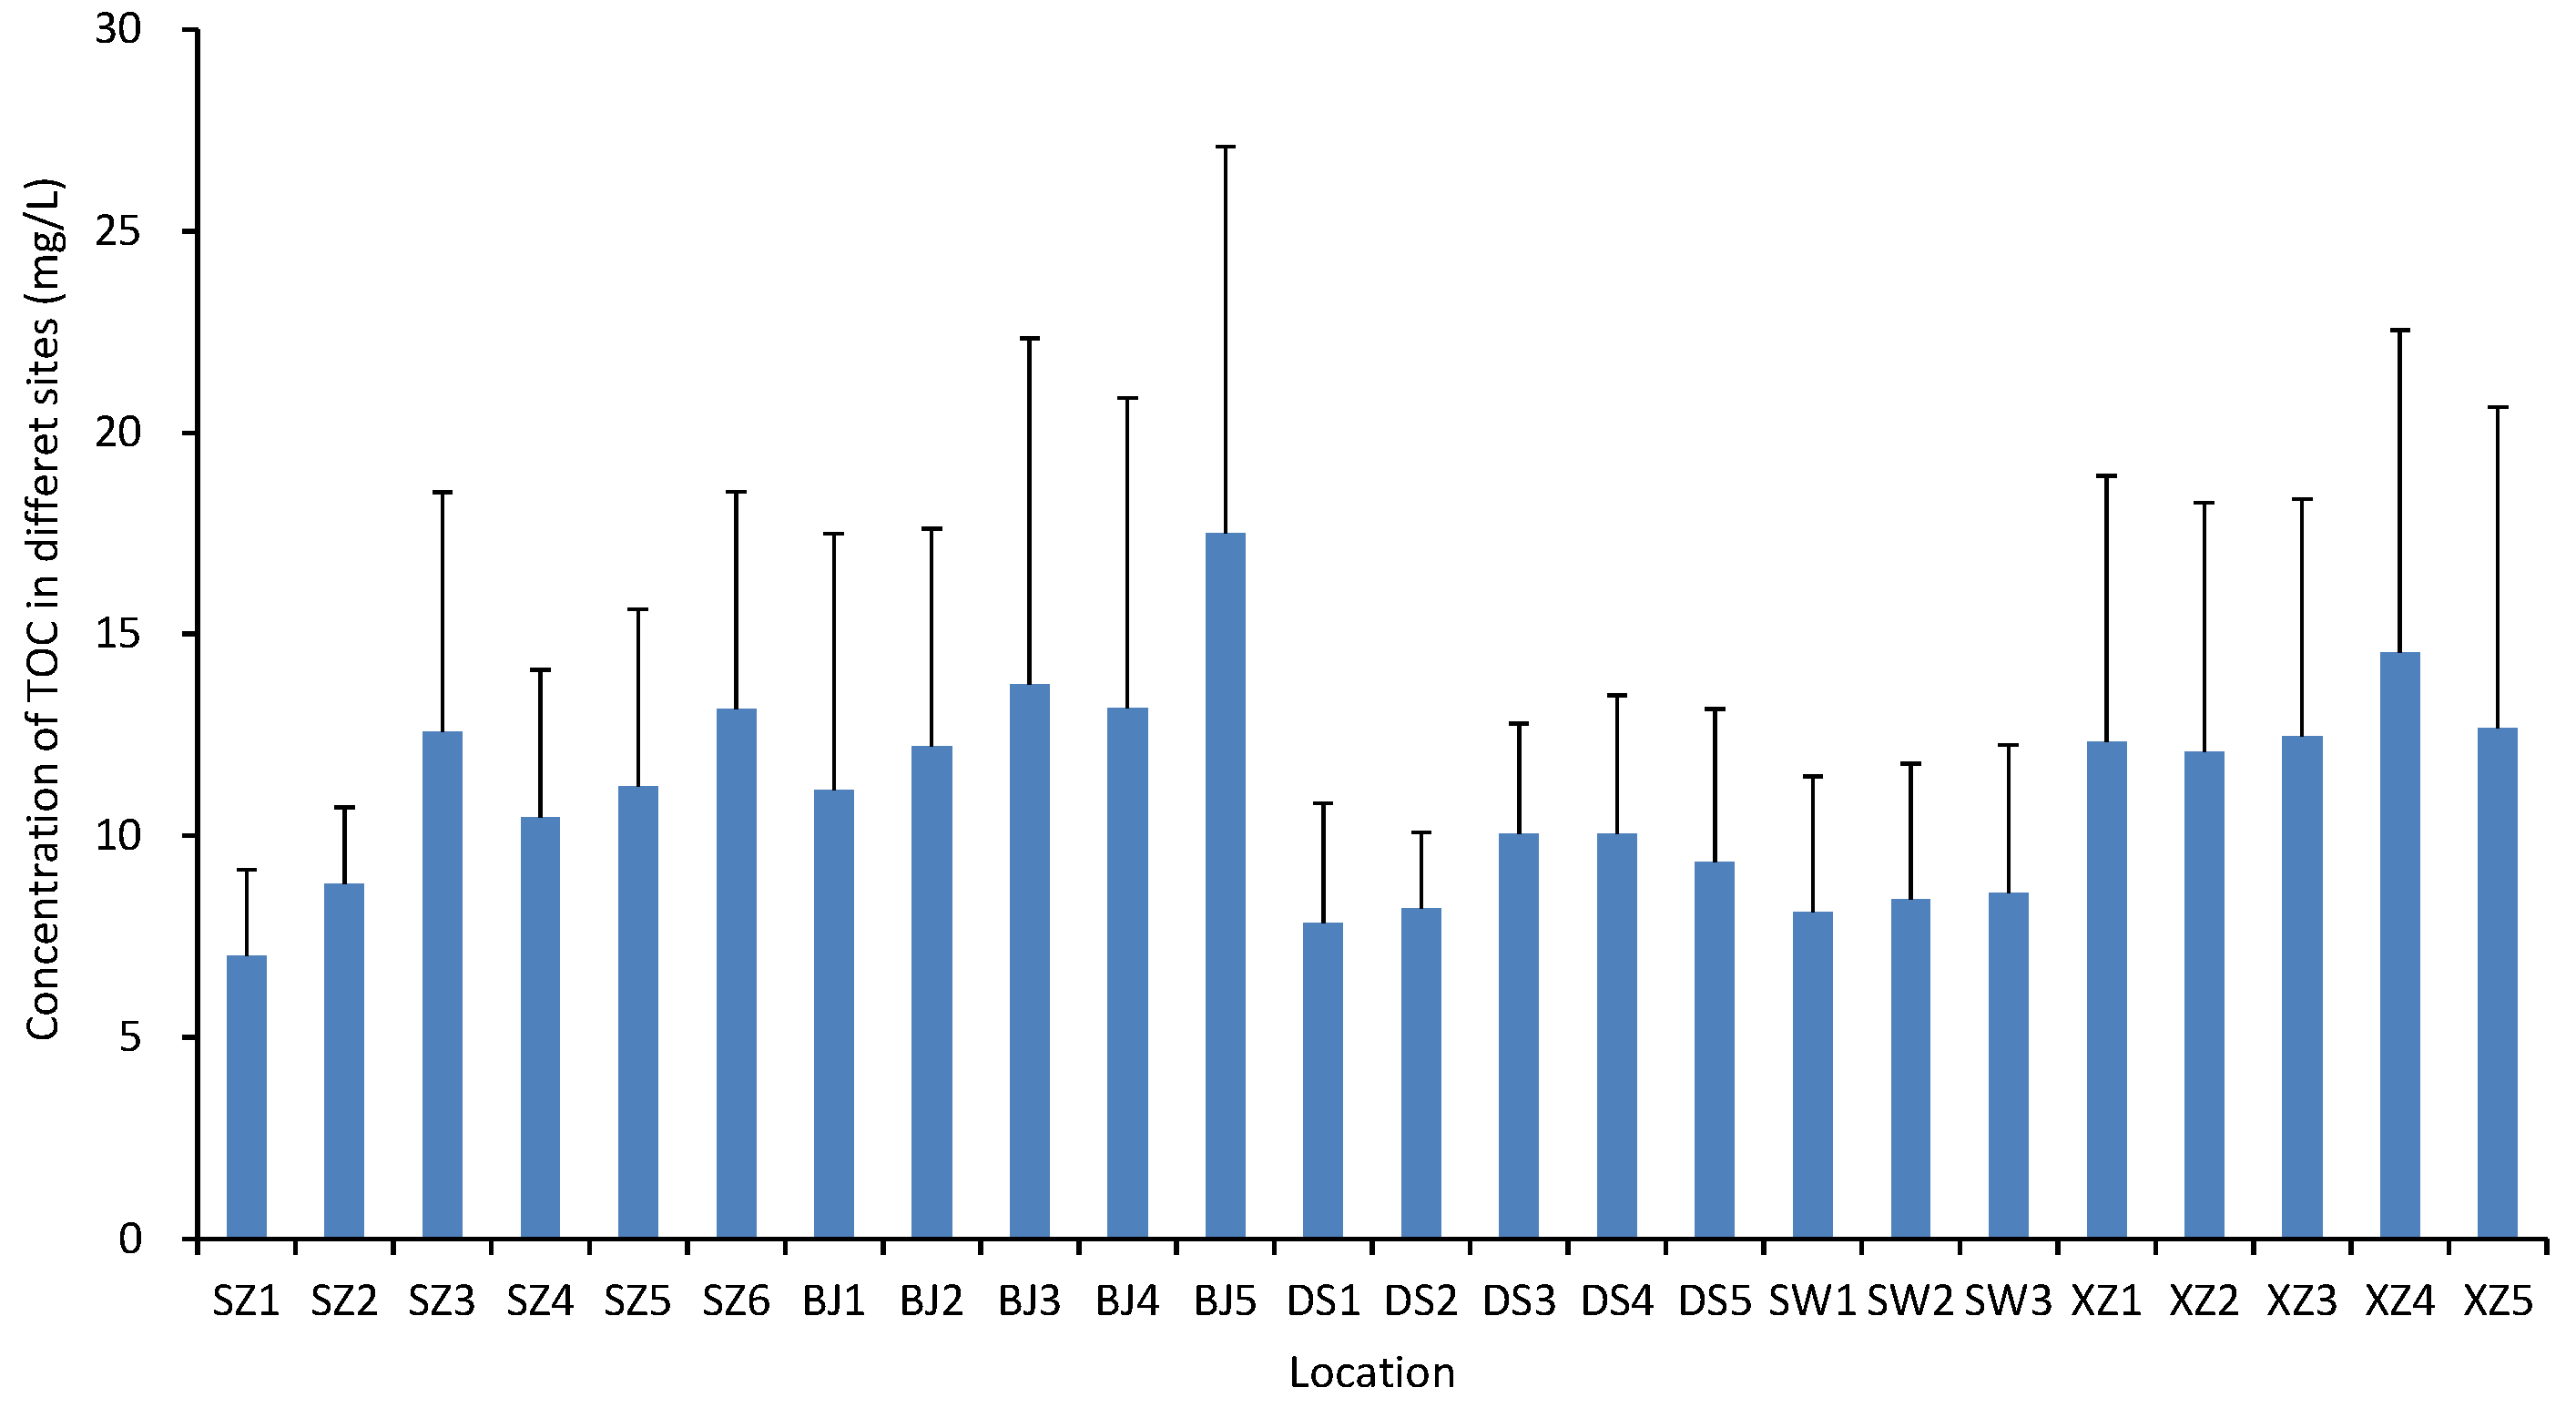
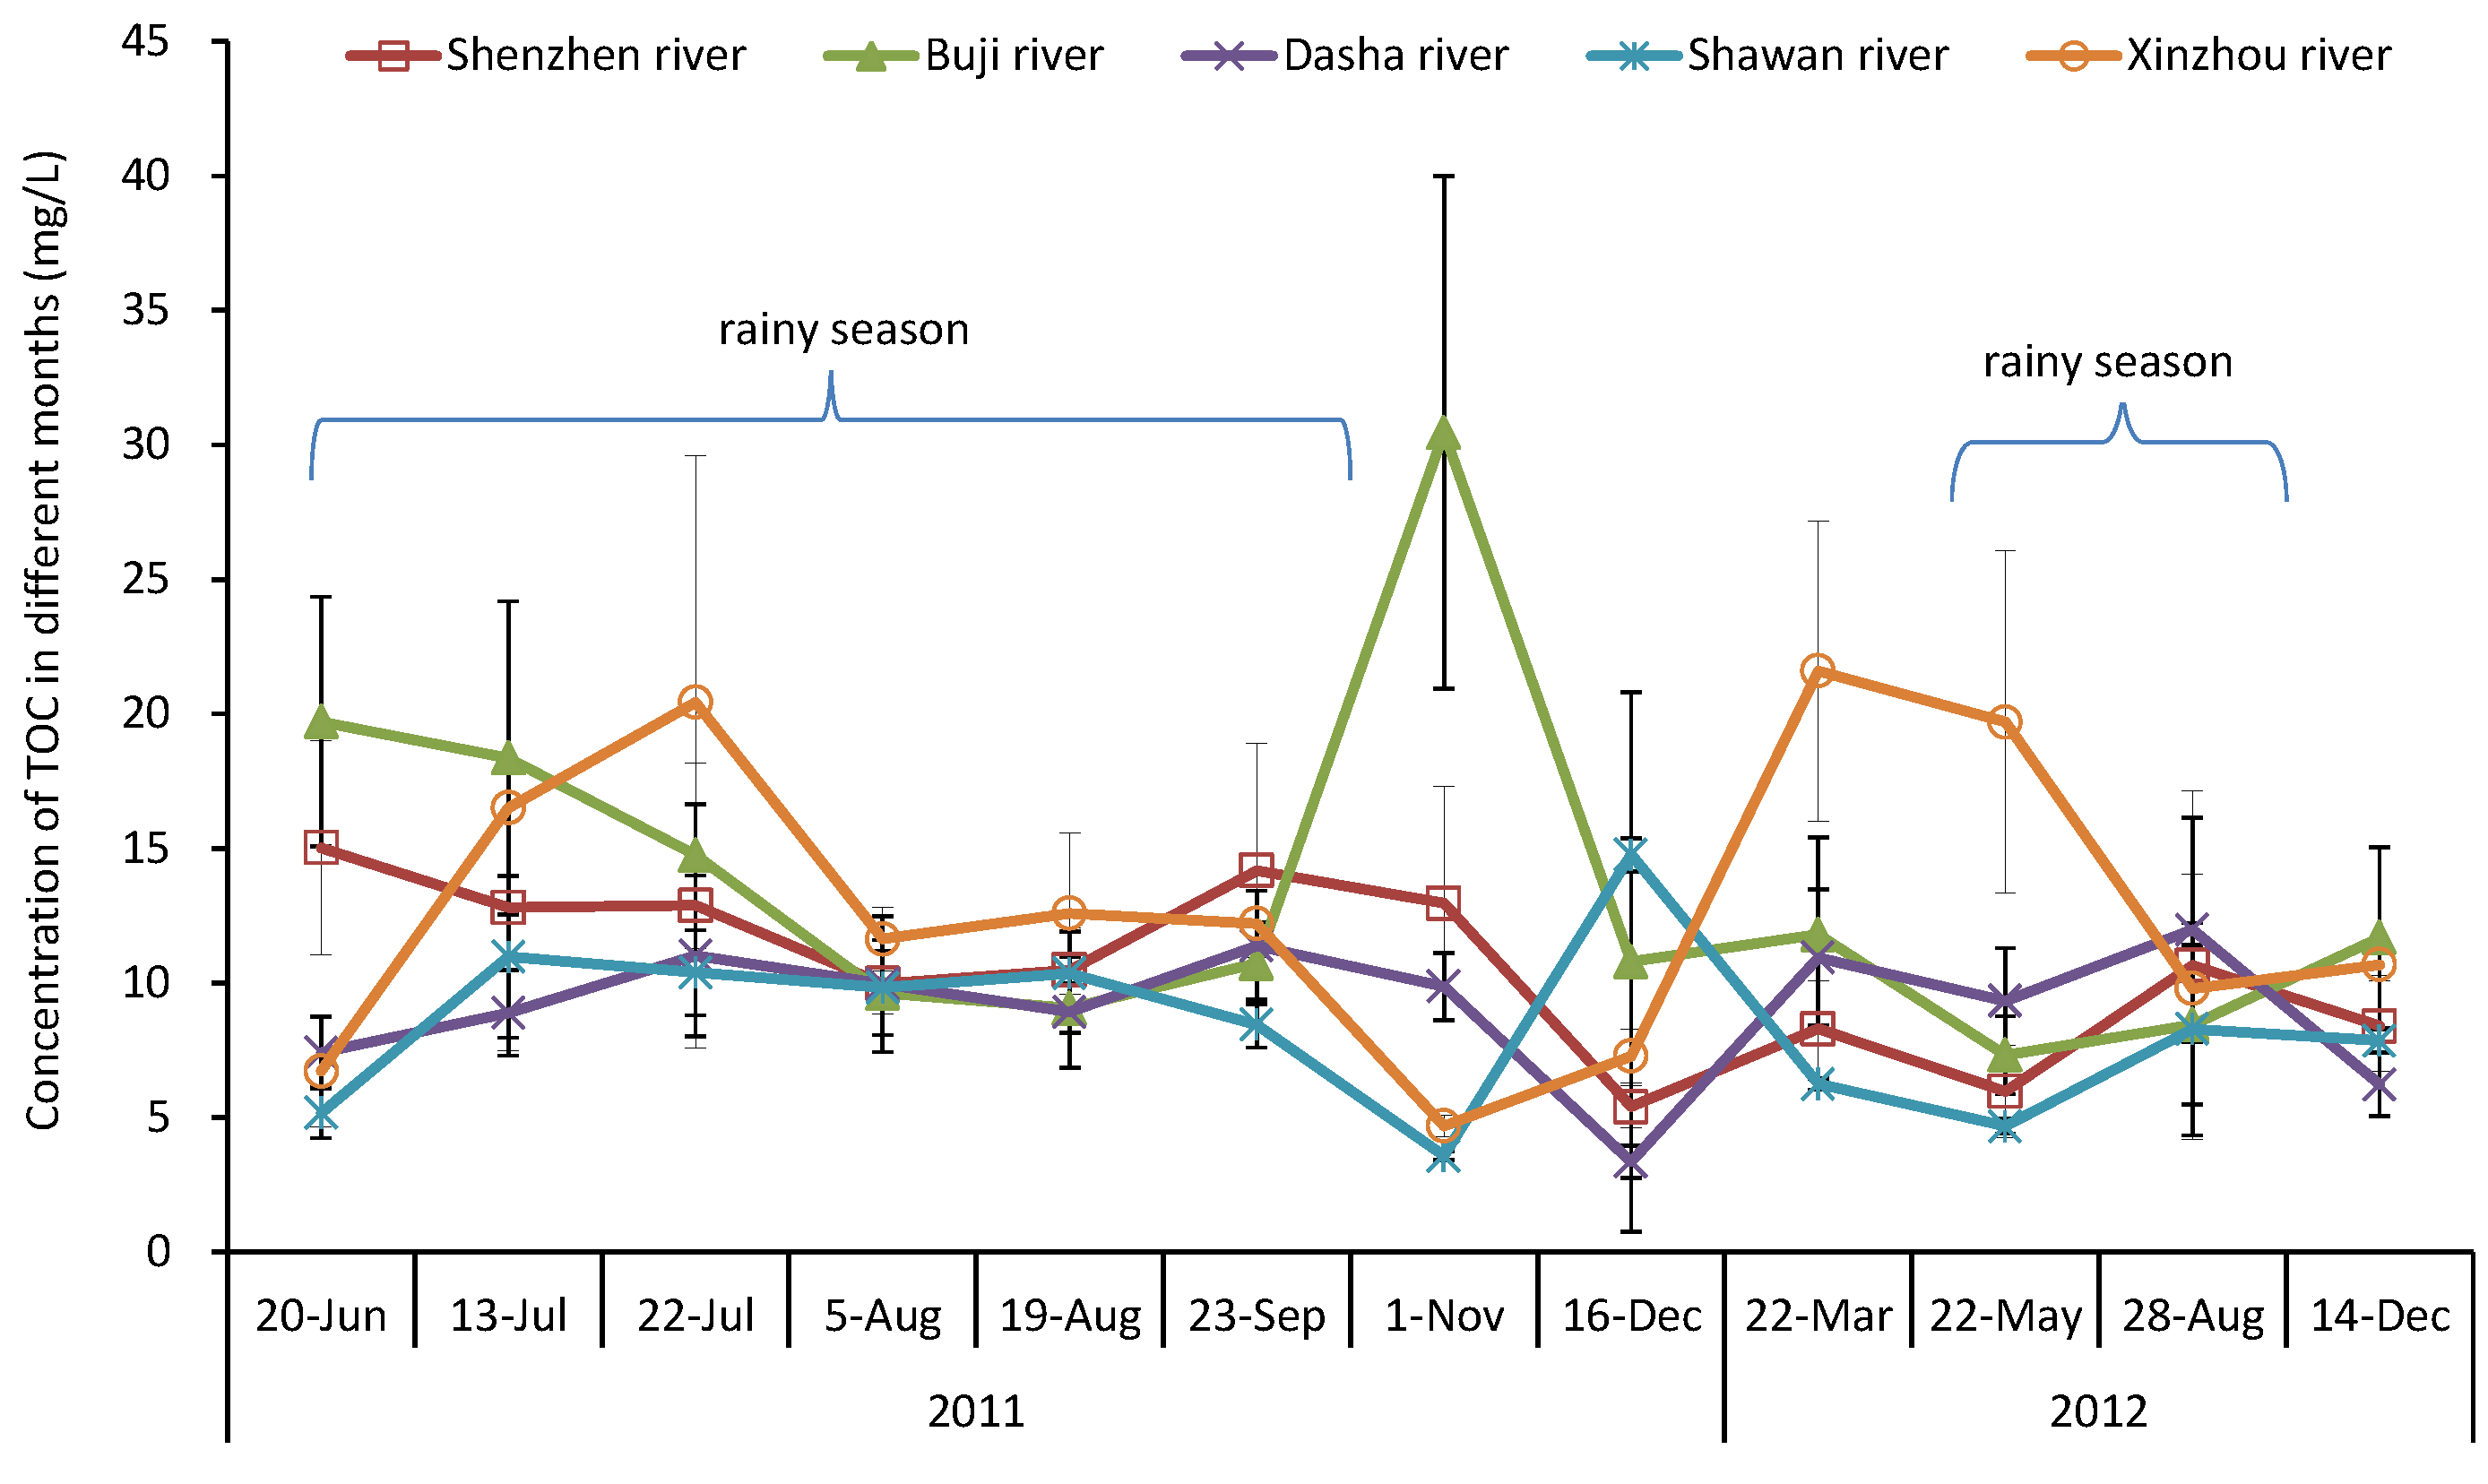
The averaged TOC concentrations ranged from 7.04 to 17.50 mg/L, with volume-weighted averages at 12.14 mg/L in 2011 and 12.25 mg/L in 2012 in the study basin (Figure 2). We also found significant spatial variations of TOC concentration. Generally, the TOC in the upstream area was lower than that in the midstream area and the highest in the downstream area within the same river (ANOVA, p < 0.05 in Shenzhen River, and p > 0.05 in the other four rivers). The reason was primarily related to urbanization, such as the low urbanization level in the upstream basin (53%, 22%, 31%, and 29% of urbanization level in the Buji River, Dasha River, Shawan River, and Xinzhou River, respectively) and the high urbanization level in the downstream basin (64%, 43%, 45%, and 62% of urbanization level in the Buji River, Dasha River, Shawan River, and Xinzhou River, respectively). Furthermore, high urbanization degree basins, such as the Buji River (urbanization level 64%) and the Xinzhou River (urbanization level 62%), have higher (ANOVA, p < 0.05) TOC concentrations than the Dasha River (urbanization level 43%) and Shawan River (urbanization level 45%). Our results support that the urbanization process increased the TOC load, which is consistent with the report that the development of urbanization induces the increasing water consumption and discharge, generally resulting in higher TOC concentrations and increased carbon export [37]. Figure 3 shows the river-averaged TOC concentration during different sampling periods. Averaged TOC concentrations in the wet season were 11.44, 9.86, and 13.70 mg/L for Shenzhen River, Dasha River, and Xinzhou River, respectively, which were higher than (ANOVA, p < 0.05) that of 8.76, 7.60, and 11.06 mg/L in the dry season for the three rivers, respectively. In addition, TOC concentration was 12.25 mg/L in the wet season and 16.18 mg/L in the dry season for Buji River due to intense human activities. Seasonal variations were obvious (ANOVA, p < 0.05) in the TOC concentration of the above four rivers during the study period, possibly due to the combined influence of the natural–social water cycle on TOC concentration [28,29]. Our results were consistent with the findings of [2,38,39] and partly supported the findings of Davies (2013), which reported that the TOC concentration in the wet season significantly exceeded that of the dry season in the Bonny Estuary, Nigeria [40]. The result of TOC concentration in this study was higher than that of the Pearl River (6.65 mg/L) [2], urban River Kelvin in the UK (8.28 mg/L) [41], and close to that of the Manatee River watershed in Florida, USA (12.52 mg/L) [22] but lower than that of Chongqing City (>43.6 mg/L) [42], Sacramento River, California (26.5 mg/L) [4], and the urban river Ouseburn in the UK (14.11 mg/L) [7]. The above analyses also showed that the TOC concentrations in surface waters vary by natural conditions and anthropogenic activities [10,21,43,44,45,46]. In recent decades, urbanization and its induced land uses have been the most important factors that increased the concentration of TOC in our study area.
3.2. TOC Concentrations in Rainwater
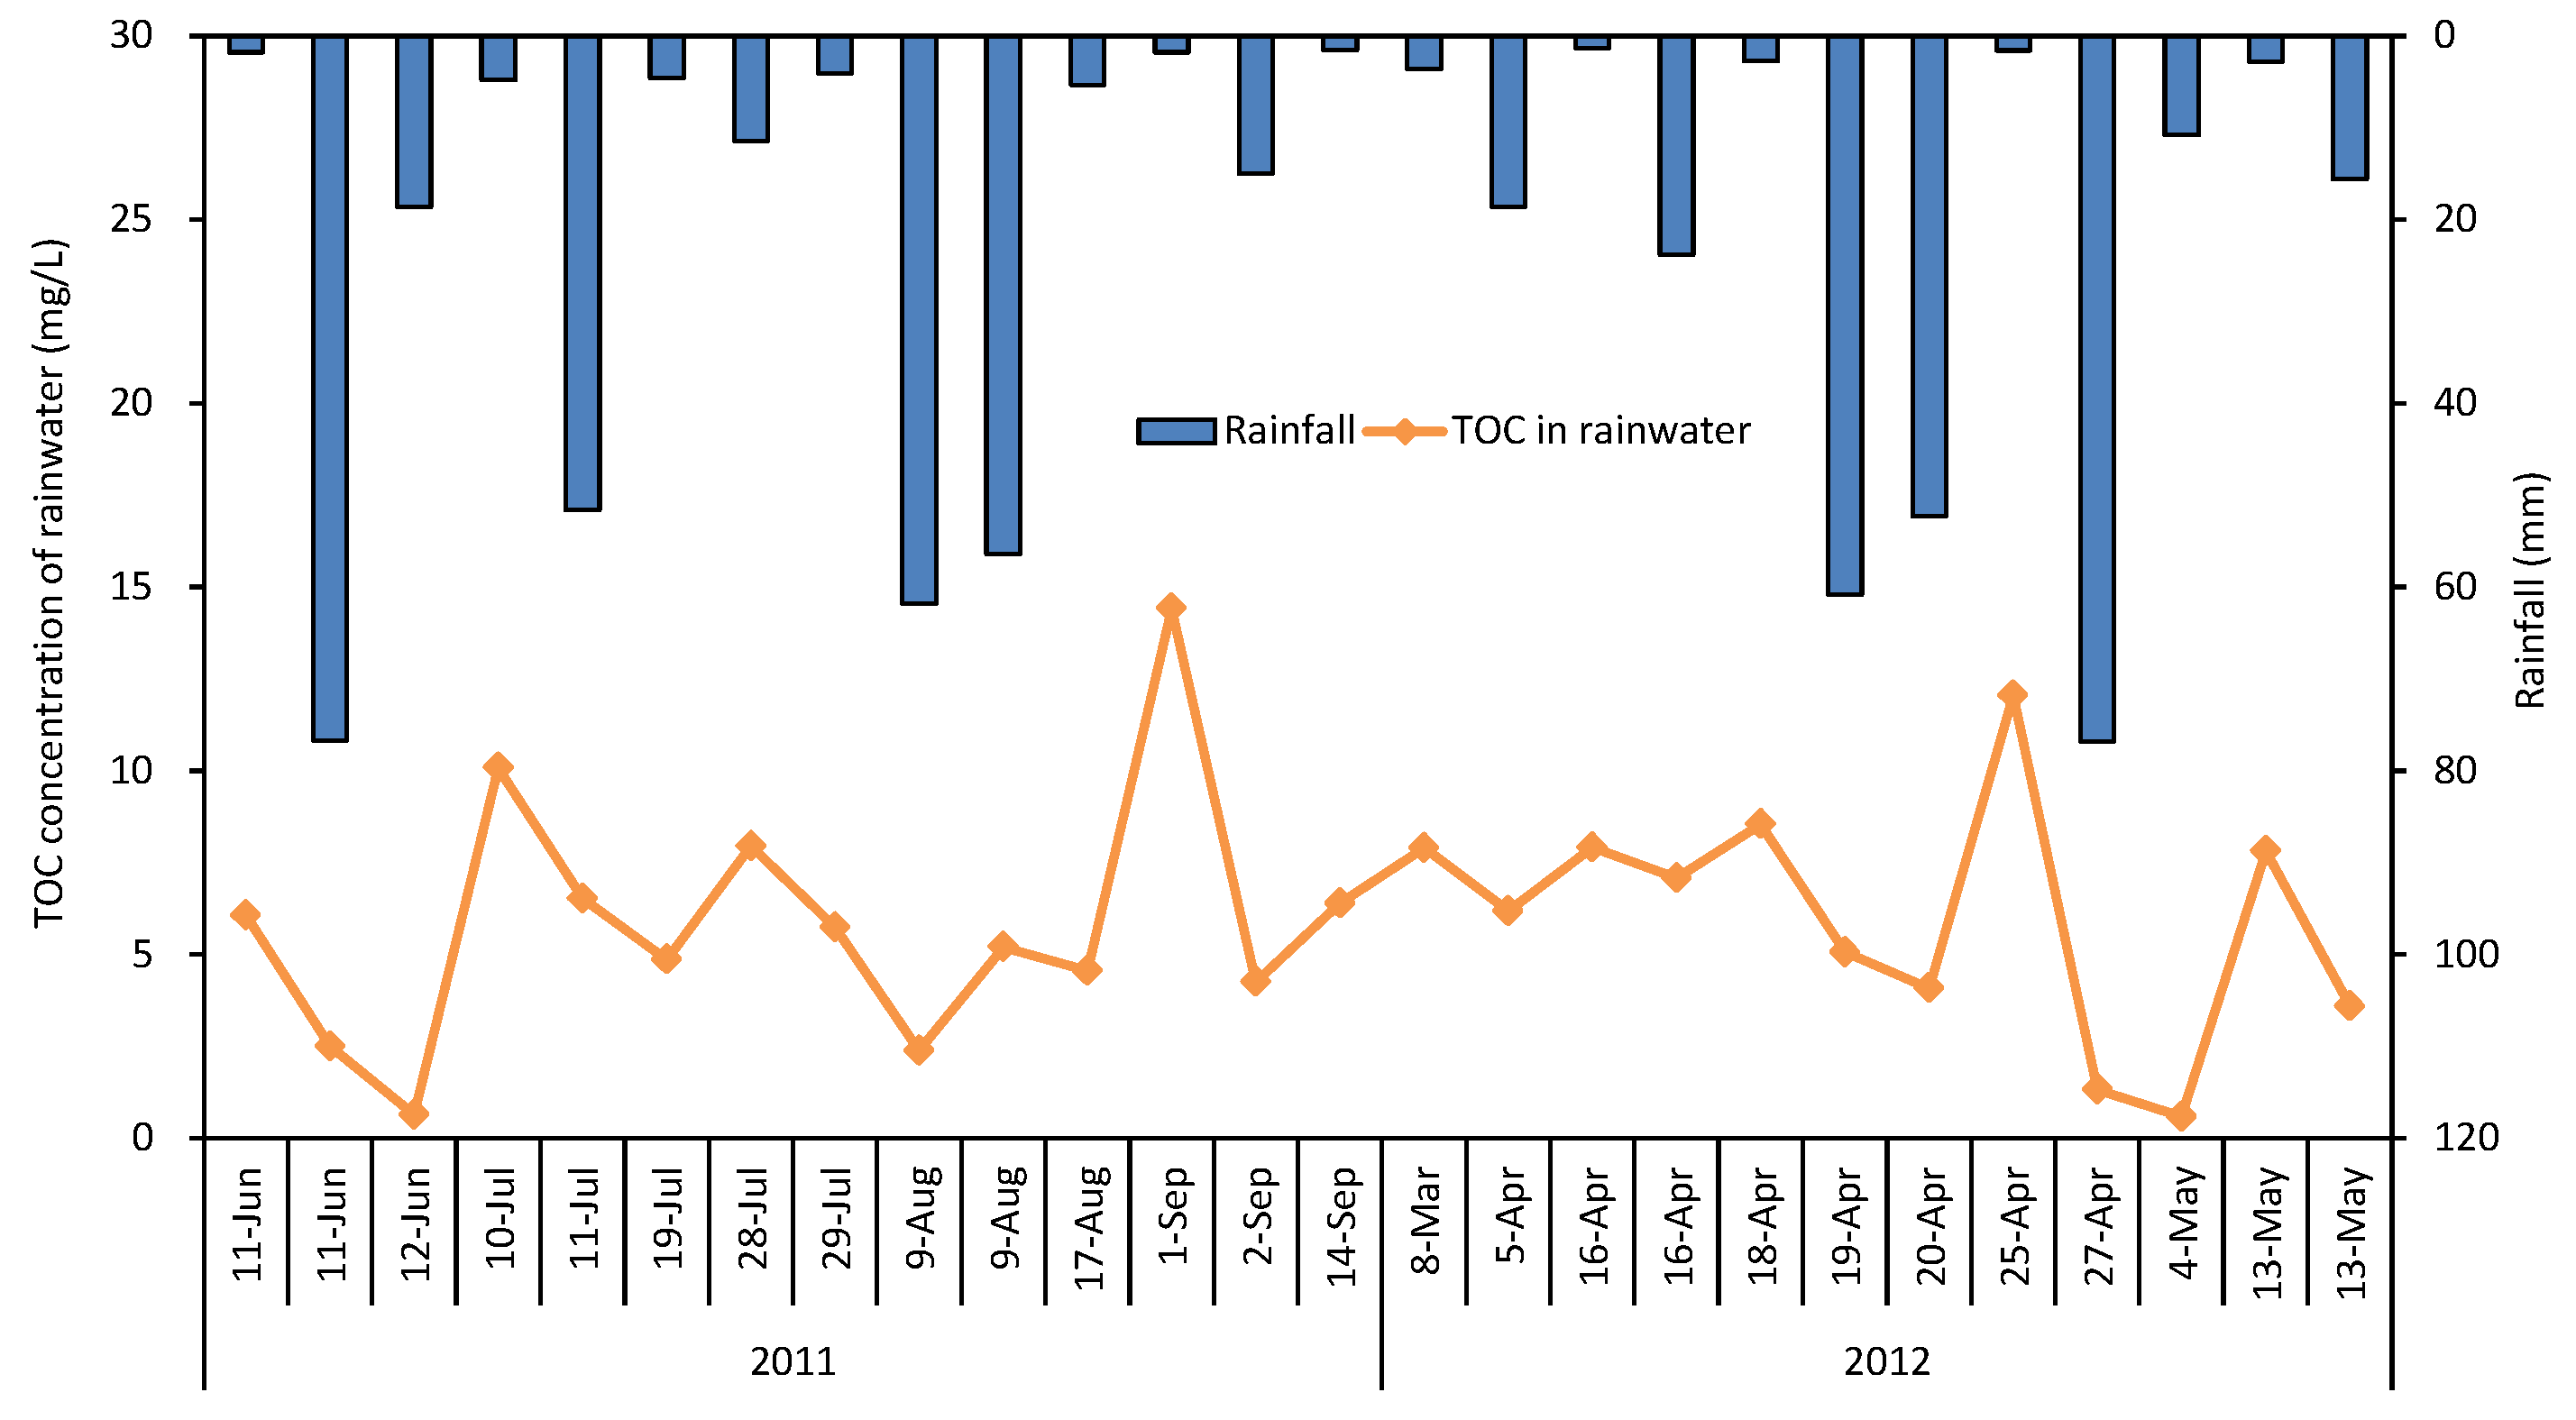
The TOC concentration in rainwater ranged from 0.58 to 14.41 mg/L, with an average of 4.12 mg/L in 2011 and 3.96 mg/L in 2012 (Figure 4). The highest value of 14.41 mg/L appeared on September 1 of the dry year 2011. There was no antecedent rainfall for a long time of period. Compared with some other studies, our findings were higher than that of Kalev and Toor (2020) in the urban Manatee River of Florida (2.6 mg/L) [22]. Antecedent rainfall can purify the atmosphere, so as to reduce the TOC concentration in rainwater [35]. The present study also found that the early rainfalls on June 11 have higher TOC concentrations than later rain on June 12 in 2011. It is supposed to be without rain in the early stage for many days. In that case, the subsequent rain generally has a relatively high TOC concentration due to air pollutant accumulation, shortage of self-purification (e.g., no rain), and rainfall characteristics (e.g., light rainfall) [36]. For example, the rain on July 10 and September 1 in 2011 and April 25 in 2012 had a relatively high TOC compared with the other rainfall events. Correlation analysis showed that the TOC concentration of rainwater decreased with rainfall (volume), showing a significant negative correlation (R = −0.51, p < 0.05, n = 26).
3.3. TOC Export and Areal Yield
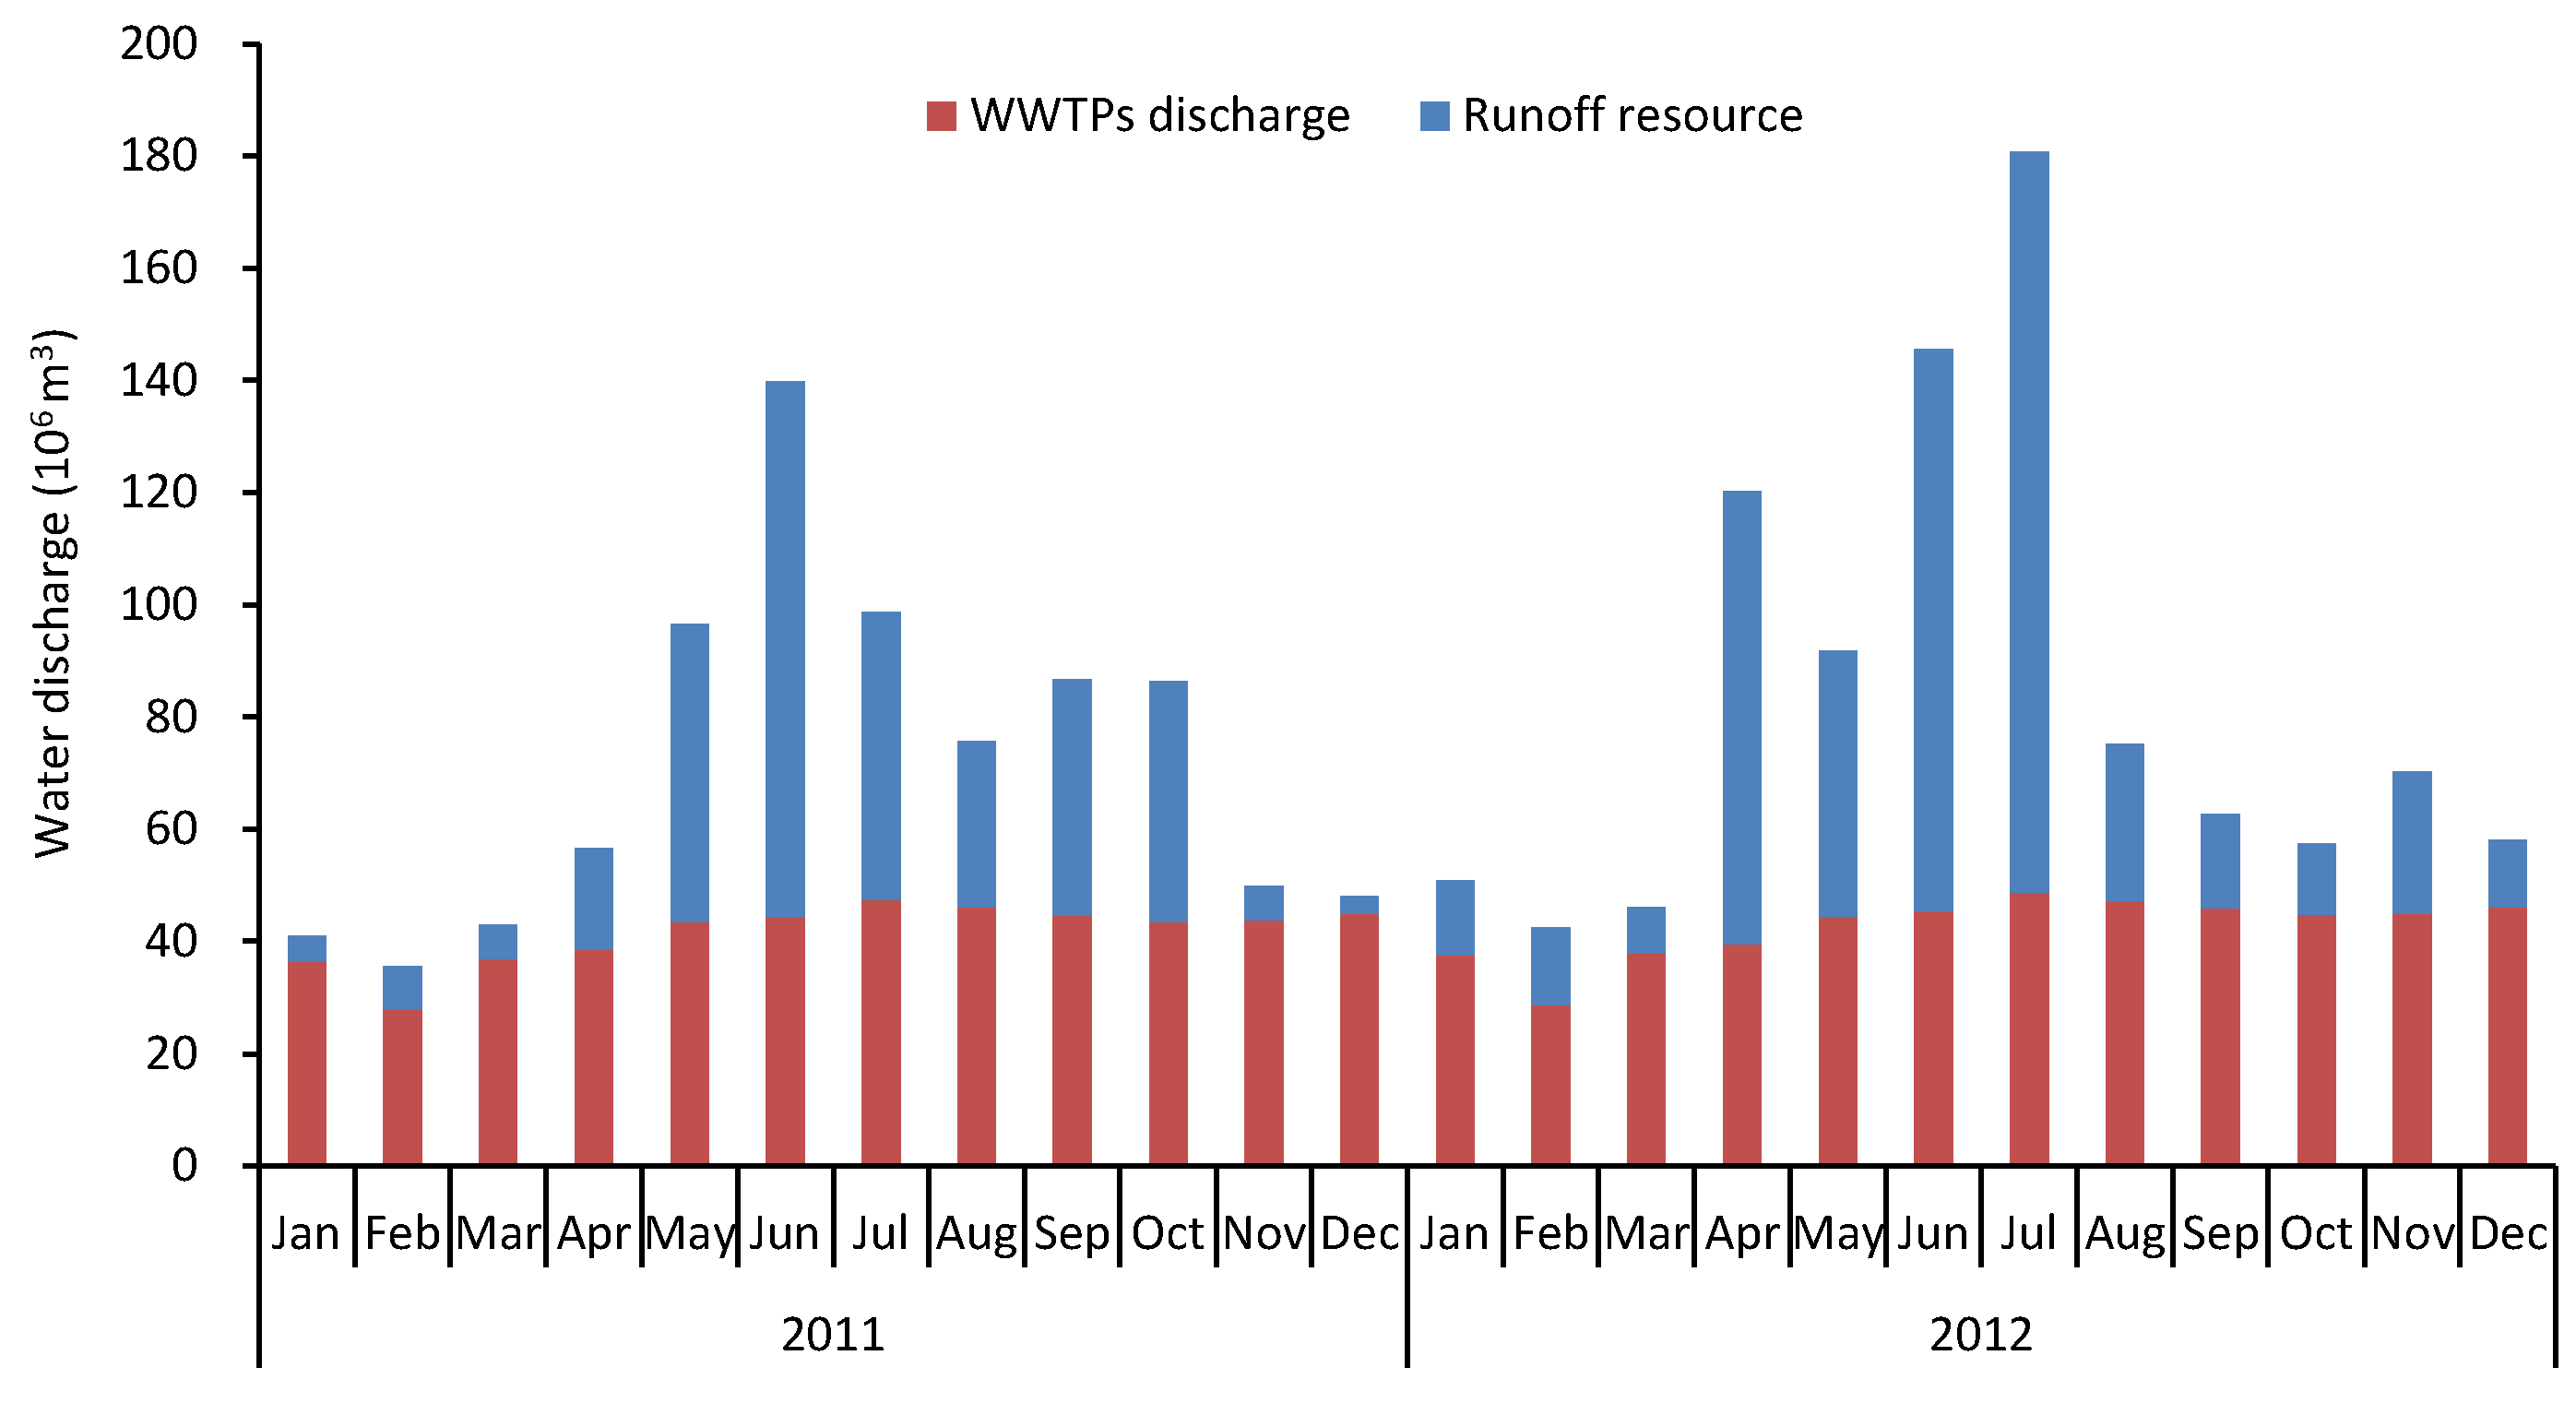
From the perspective of the social water cycle [32,33], the water discharge of the wastewater treatment plants was relatively stable with slight seasonal variations; the monthly discharge was 5.6–9.5% of the annual discharge in the study basin (Figure 5). On the contrary, the runoff discharge of the natural water cycle had noticeable seasonal differences, in which the rainfall and runoff from April to September accounted for about 80.5–82.6% of the total annual, resulting in significant seasonal differences in the total discharge of the Shenzhen River and Bay basin (Figure 5).
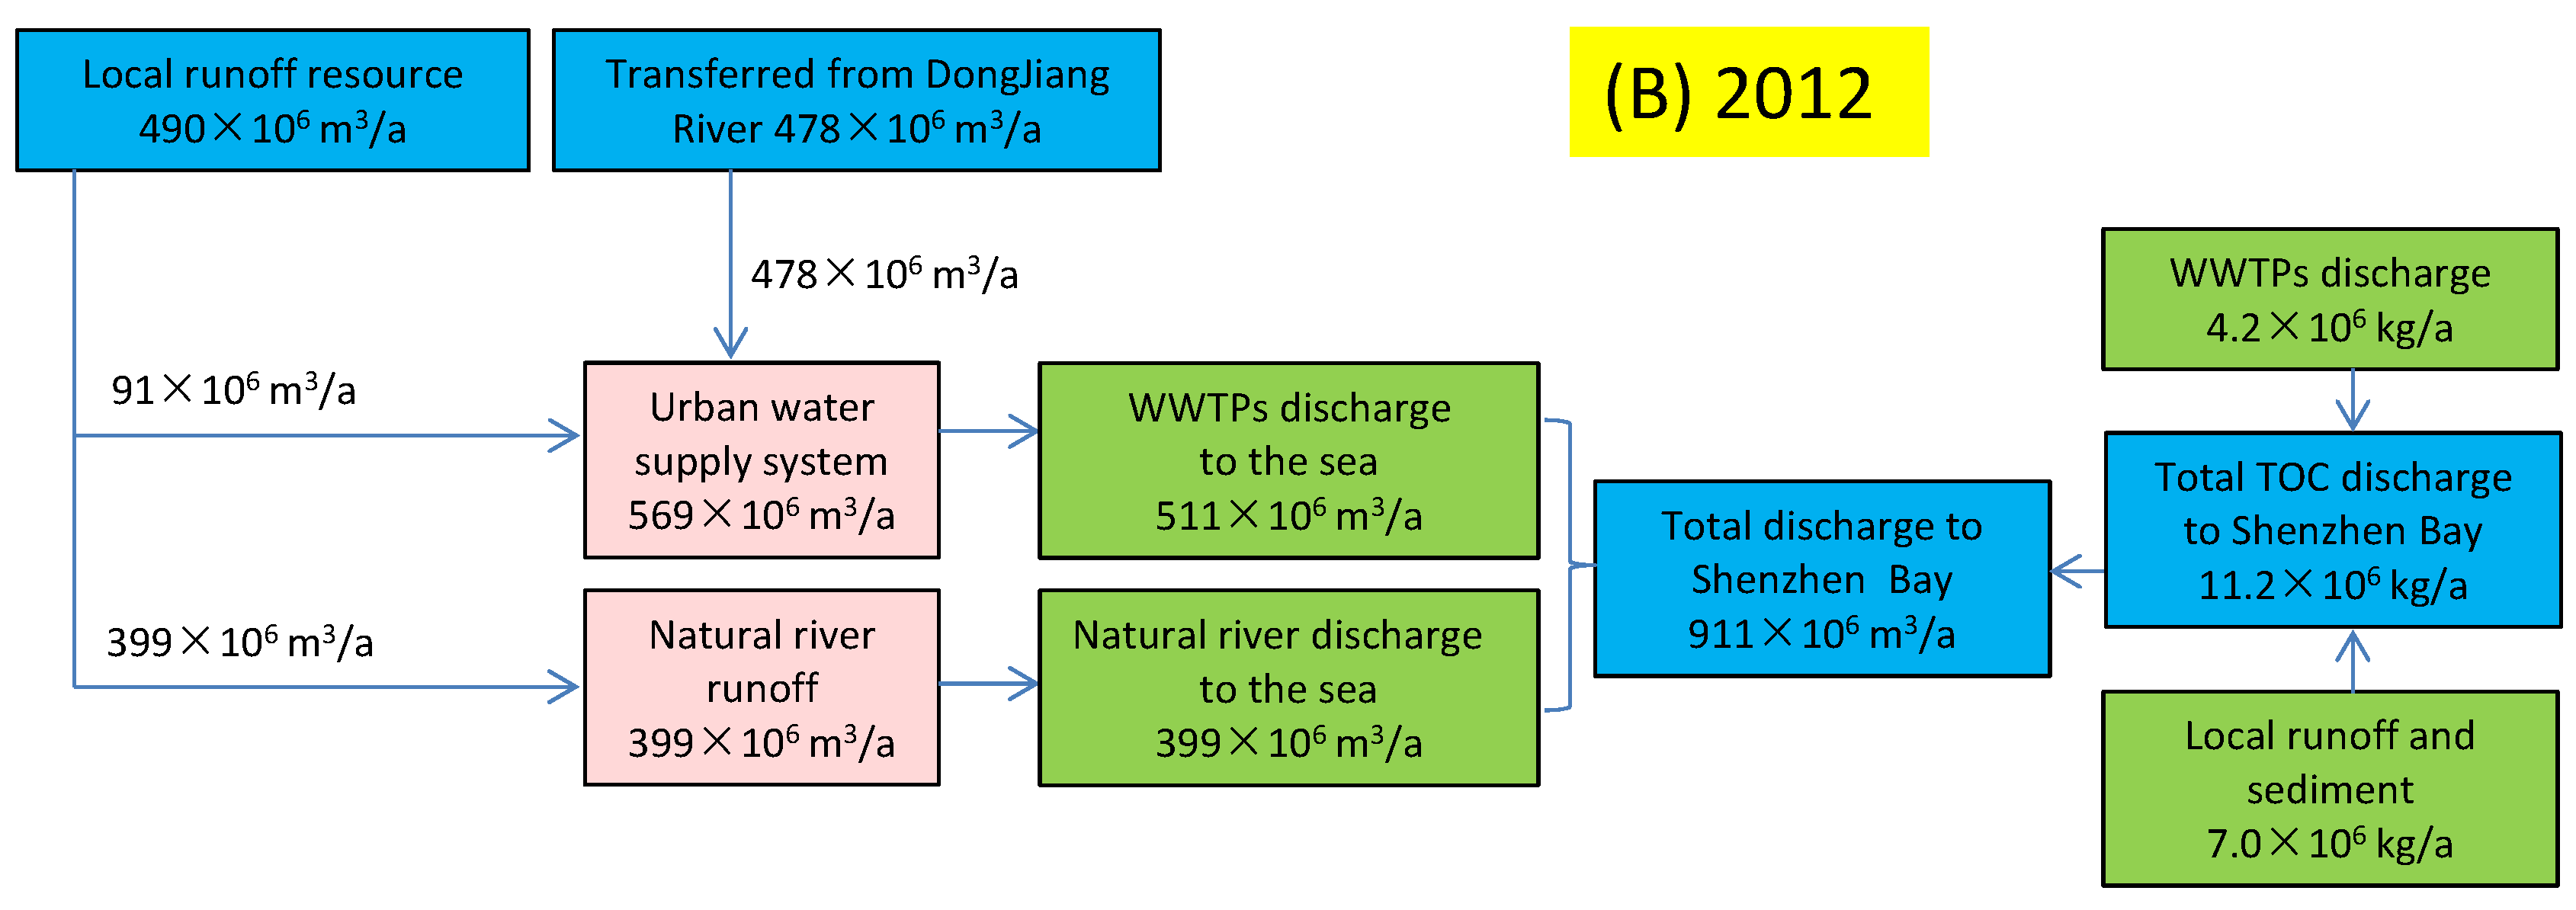
Taking the average rainfall year 2012 (annual rainfall: 1923 mm) as an example, the yearly runoff resources of the Shenzhen River and Bay basin were 490 × 106 m3/yr, of which 91 × 106 m3/yr was stored in reservoirs and 399 × 106 m3/yr was directly discharged into Shenzhen Bay. In this year, the urban water supply was 569 × 106 m3/yr, of which 91 × 106 m3/yr was supplied by local reservoirs and 478 × 106 m3/yr was supplied by the Dongsheng Water Supply Project (Figure 6). The total effluent of WTTPs to Shenzhen Bay was 511 × 106 m3/yr. The total discharge of the WWTPs and river runoff reached 911 × 106 m3/yr. According to the flow-averaged TOC data of rivers, the total export of TOC can be calculated, which reached 11.2 × 10⁶ kg/yr, of which 37.5% was contributed by the effluent of WWTPs, 14.1% by wet deposition, and 48.4% by the surface non-point sources and endogenous pollution. Therefore, wet deposition, surface non-point sources, and endogenous pollution were dominant, which were critical ways to decrease TOC load.
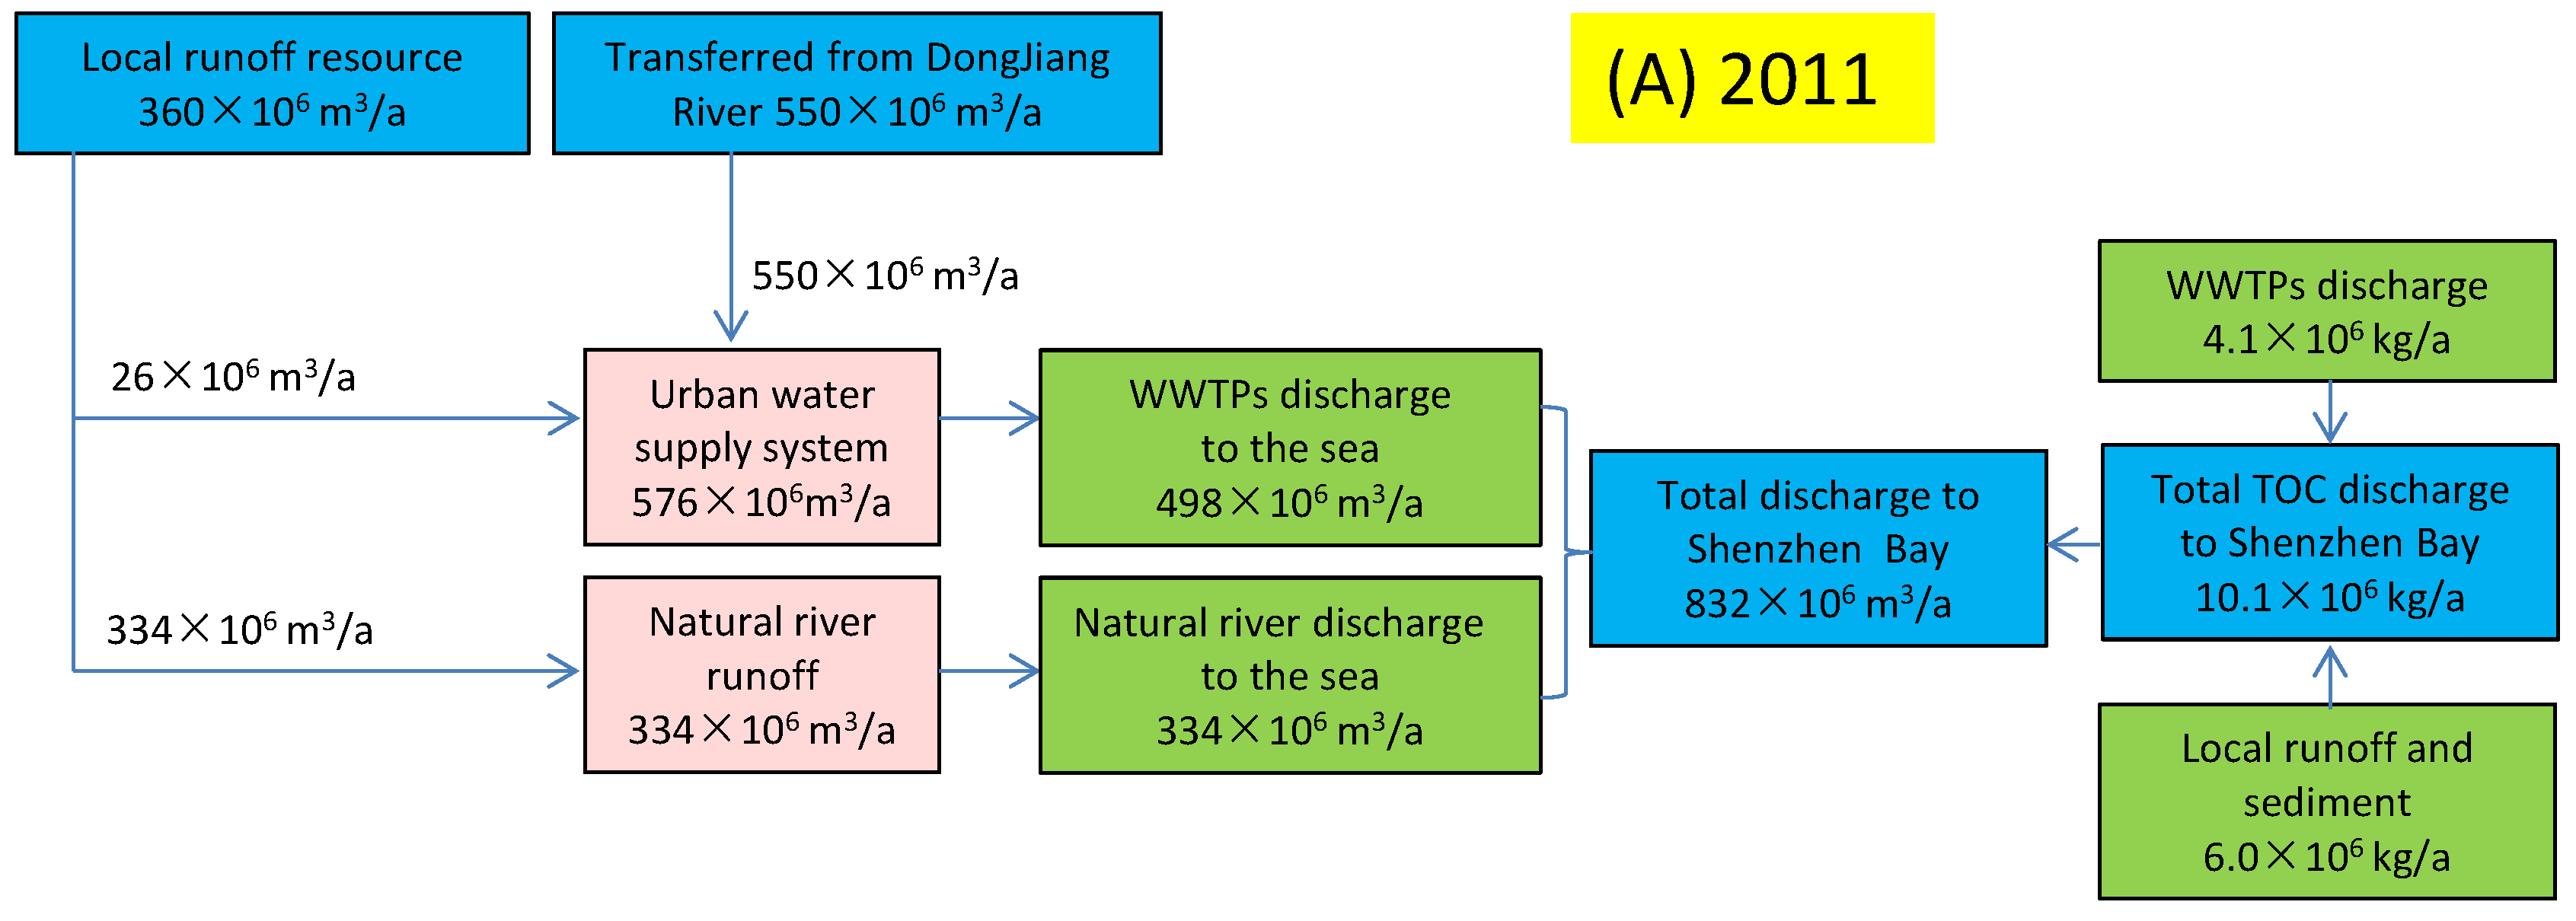
As a typical dry year in 2011, its annual rainfall was only 1412 mm. The water supply from the local reservoir was only 26 × 106 m3/yr, and about 95% of the urban water supply was dependent on the Dongsheng Water Supply Project (Figure 6). The total TOC export was 10.1 × 10⁶ kg/yr, the contribution of the effluent of WWTPs was 4.1 × 10⁶ kg/yr, and the local river runoff and sediment was 6.0 × 10⁶ kg/yr. The contribution of wet deposition, surface non-point sources, and endogenous pollution was 59.4% of the total TOC export, which was slightly lower than that of the year 2012.
The areal yield of TOC of the Shenzhen River and Bay basin was 23.73 × 10³ kg/(km2.yr) in 2012, which was 2.86 times that of the average value of the Pearl River and 6.43 times that of the global average value [2], due to the critical effect of urbanization and the nature–society dualistic cycle. The areal yield of TOC in this study was higher than that of some big rivers, such as 15.2 × 10³ kg/(km2.yr) in the Yellow River, 11.83 × 10³ kg/(km2.yr) in the Yangtze River, and 4.74 × 10³ kg/(km2.yr) in the India River [2], which was also higher than that of some urban rivers, such as the Manatee River in Florida (6.60 × 10³ kg/(km2.yr) [22], Sacramento River in California (15 × 103 kg/km2.yr) [4], and Atlantic provinces in Canada (1.61–12.35 × 10³ kg/(km2.yr) [9]. Given the high areal yield of TOC in this study, differences in hydrologic conditions and land use may explain some of the differences between yields in the literature [47].
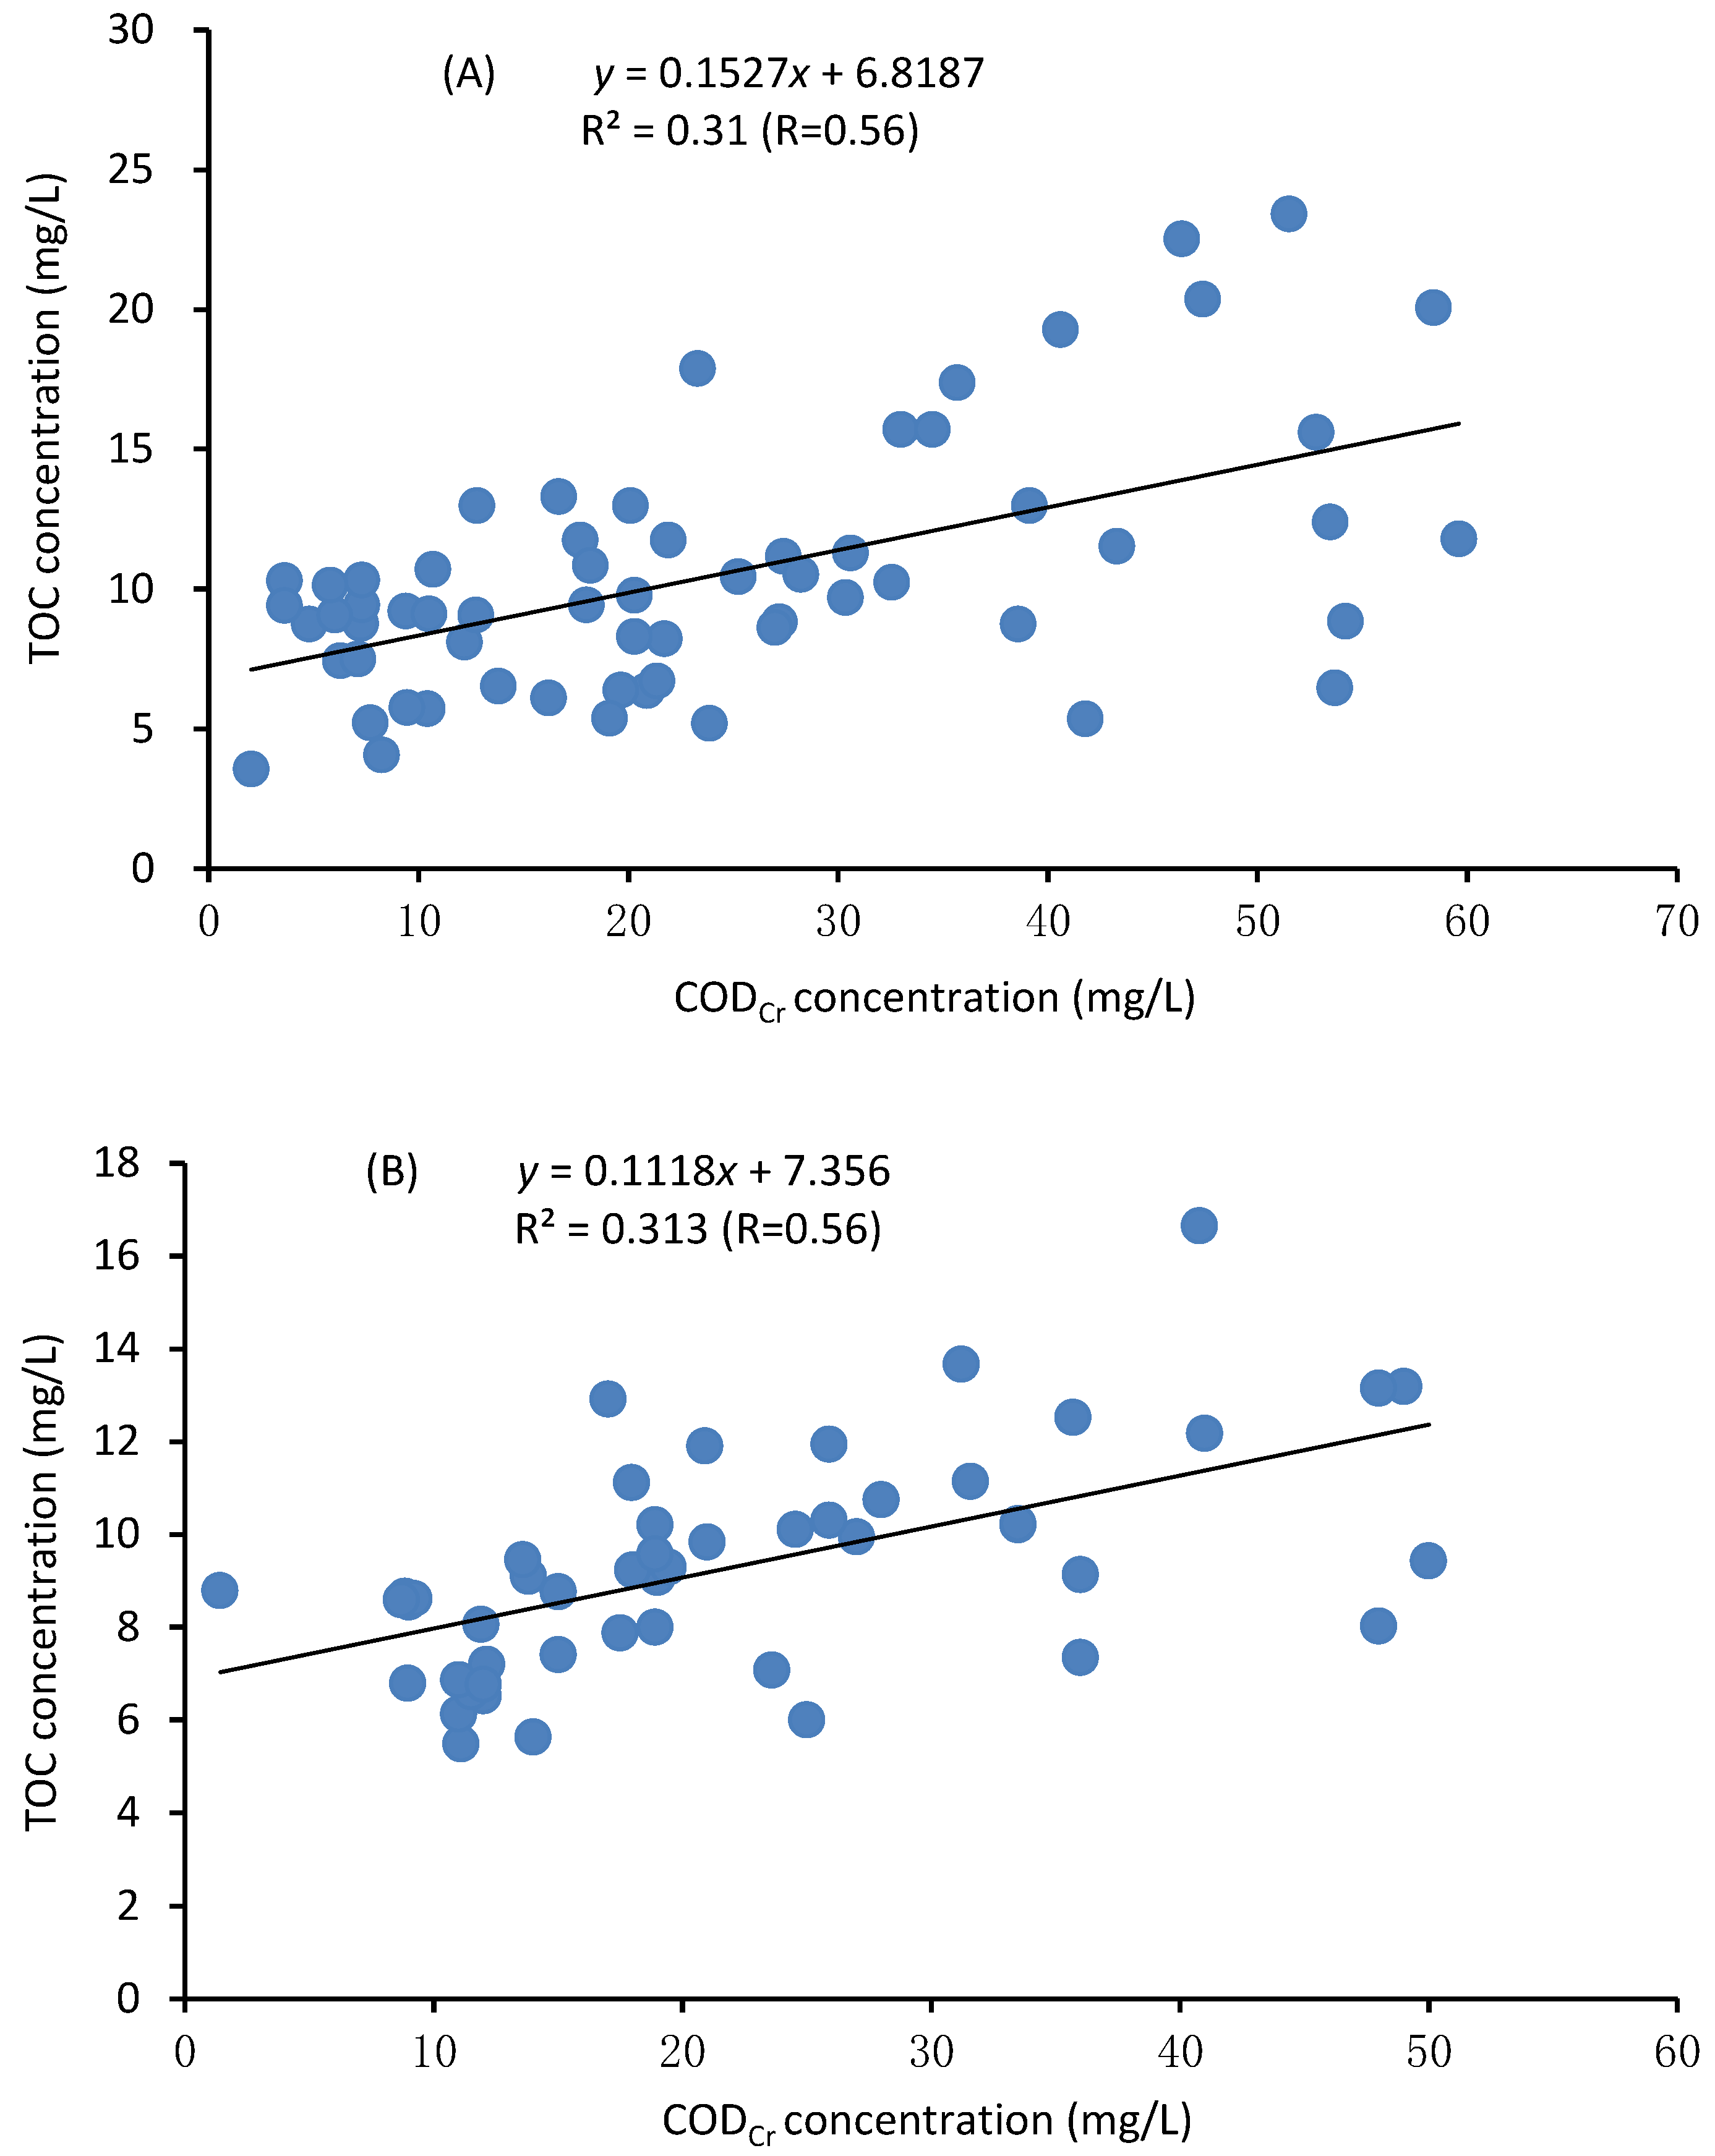
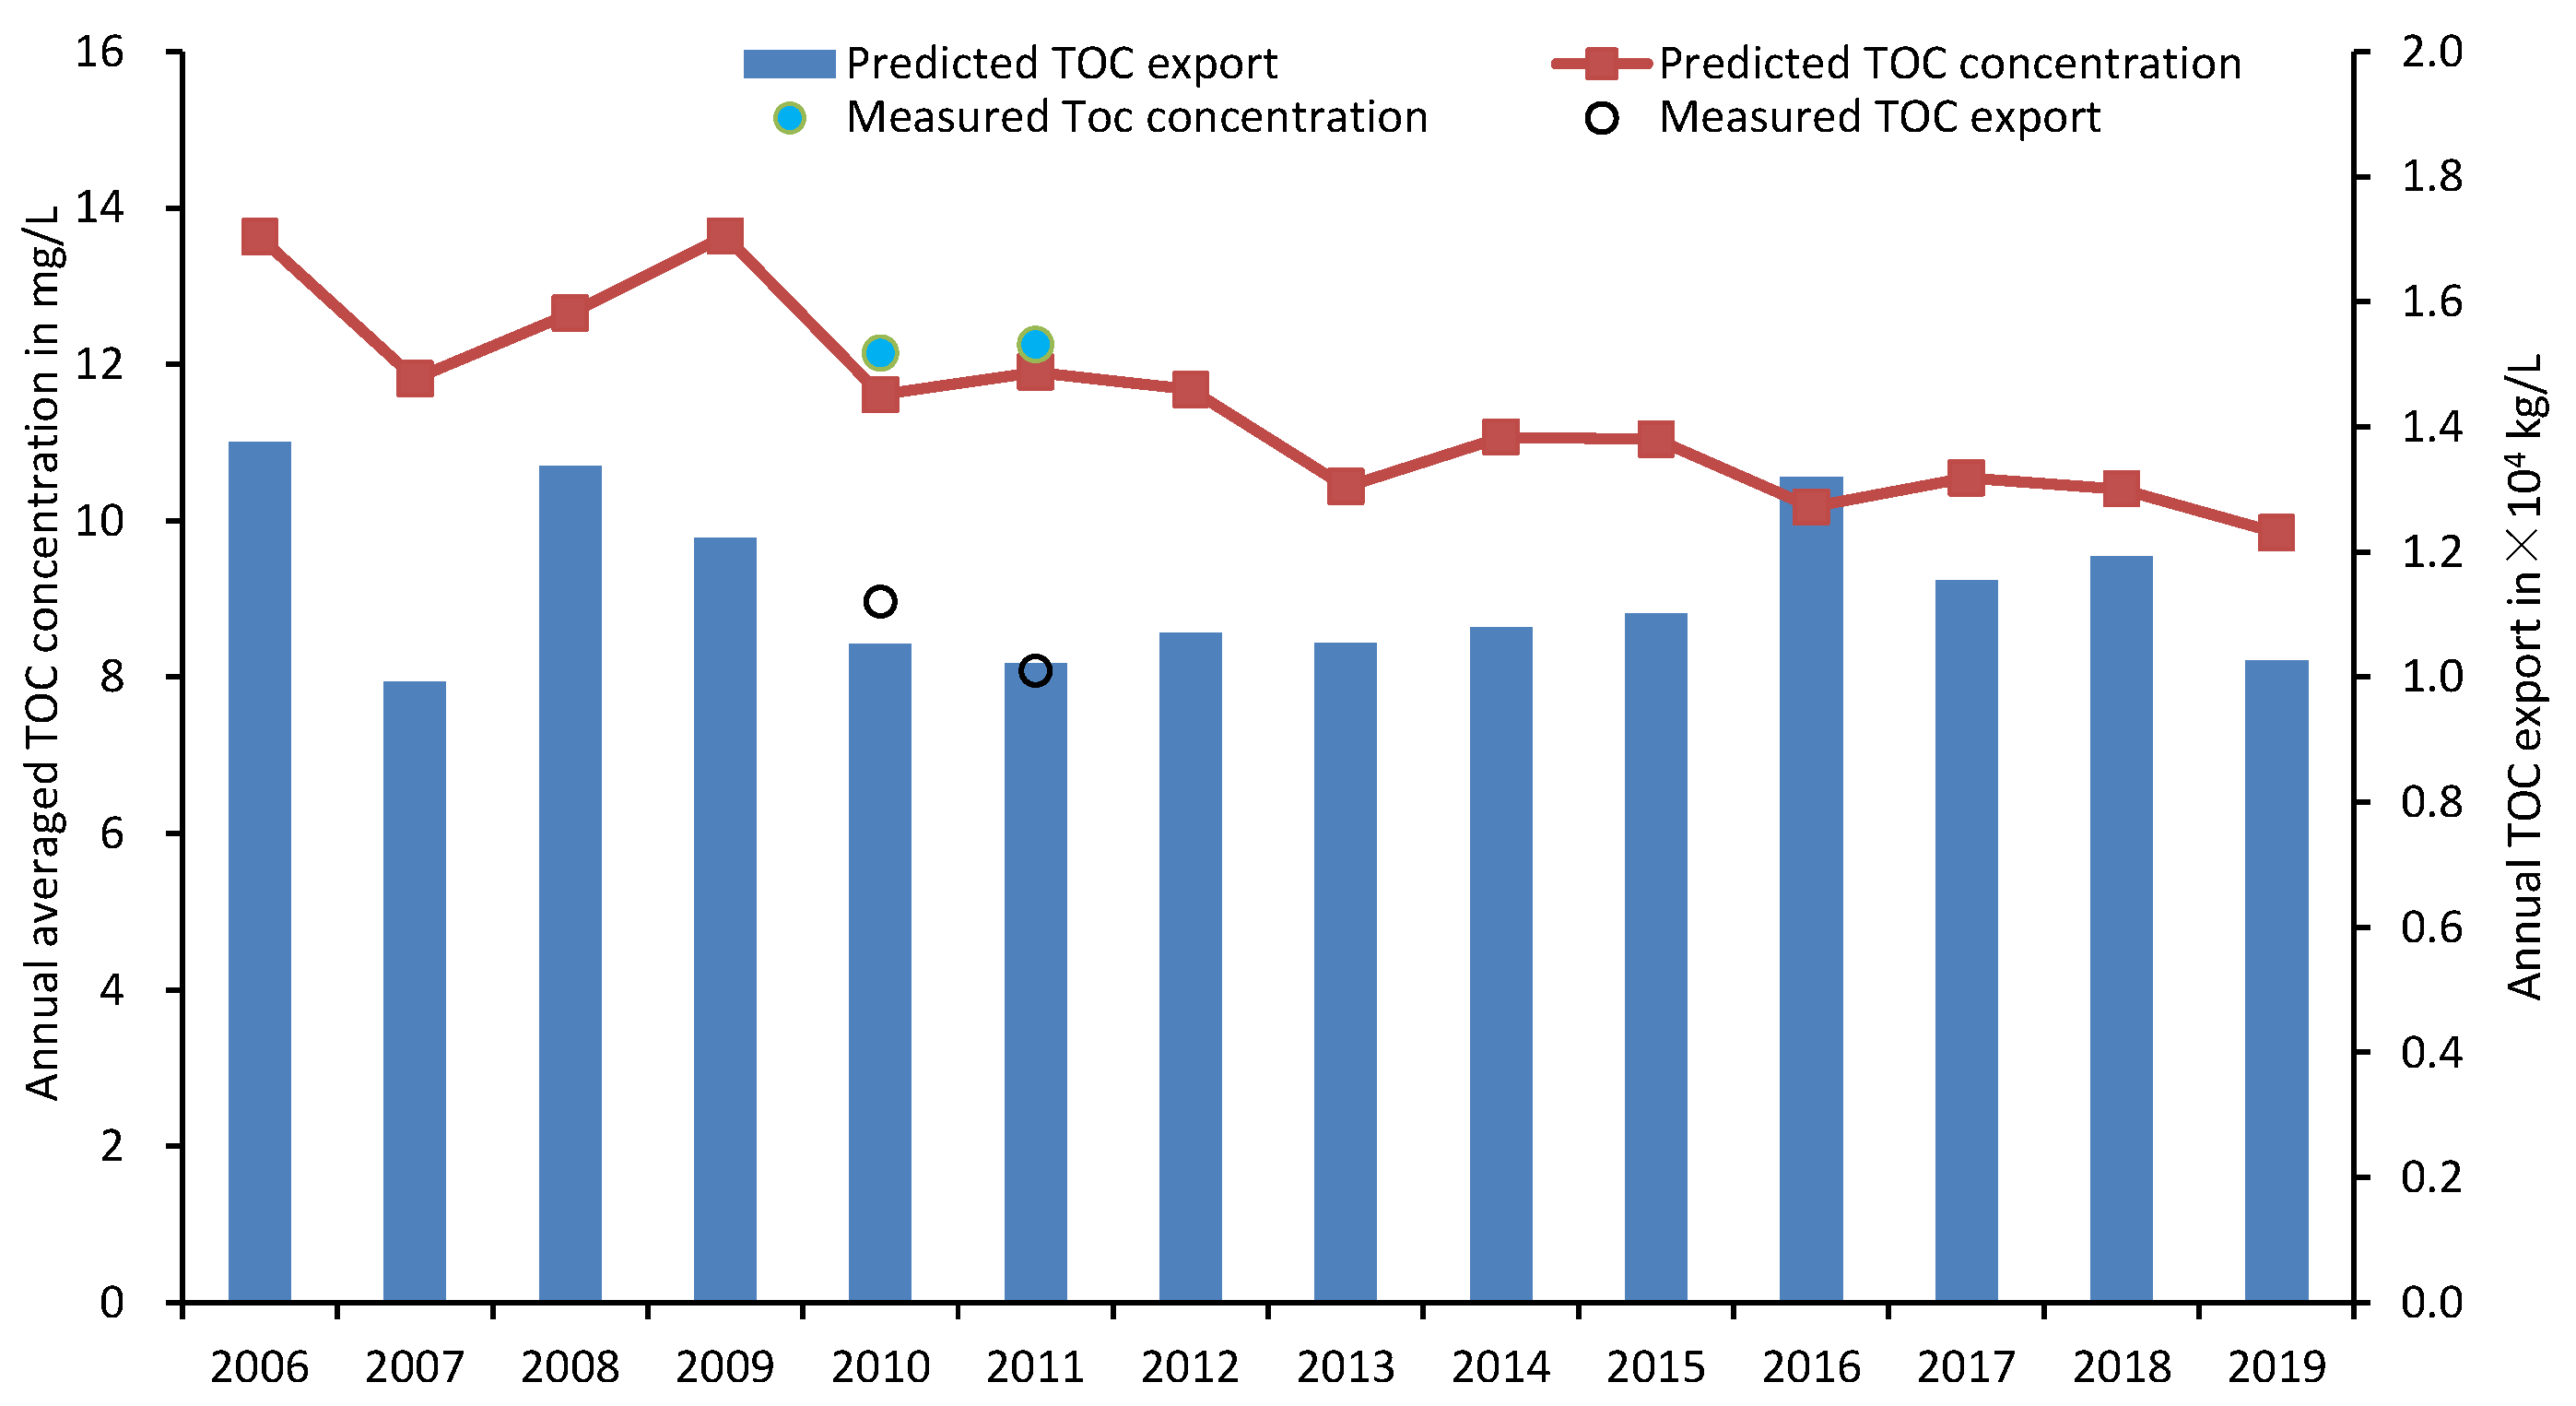
Many studies have shown a significant correlation between COD and TOC, and the regression equation can be used to predict the concentration of TOC [48,49]. The regression equation between concentrations of TOC and COD in the Shenzhen River basin (mainstream) and Shenzhen Bay basin (mainstream) was established in this study (CTOC = 0.1527CCOD + 6.8187, R = 0.56 and p < 0.05, n = 64; CTOC = 0.1188 CCOD + 7.356, R = 0.56 and p < 0.05, n = 55, respectively, Figure 7) and used the monthly monitored COD data during the period 2006–2019 to predict the TOC concentrations, respectively. The error between the predicted concentration of TOC and the actual concentration was within 1% in 2011 and 3% in 2012 (residuals analysis). The present study calculated the annual TOC export in the Shenzhen River and Bay basin according to the TOC values and river flow. The error between the predicted total TOC load and the actual value in 2011–2012 was 8.9% in 2011 and 5.9% in 2012 (Figure 8).
According to linear regression, the TOC concentration showed a gradual downward trend over time during 2006–2019 (R = 0.87, p < 0.001, n = 14), especially after 2012 since the ecological restoration project had been finished in the primarily streams and rivers (Figure 8). Therefore, the TOC load in the Shenzhen River and Bay basin also decreased gradually over time from 2006 to 2019 (R = 0.23, p > 0.05, n = 14). However, the TOC load did not reach a significant level due to the multiple effects of runoff, the effluent of WWTPs, and TOC concentration.
4. Conclusions
After several decades of rapid development, the average TOC concentrations in the Shenzhen River and Bay basin remained high because of the substantial effects of urbanization and human activities. The TOC concentrations exhibited pronounced spatial variations due to the influence of urbanization level and showed temporal variations due to the combined impacts of rainfall–runoff and effluent of WWTPs. It is also worth noting that the TOC concentrations in rainwater remained high and, together with the binding effect of surface non-point sources and endogenous pollution, it has become the priority control source for TOC reduction.
The areal yield of TOC in the Shenzhen River and Bay basin was several times the Pearl River’s average TOC yield and the global average TOC yield. According to linear regression analyses, the TOC concentration and export showed a gradual downward trend over time. Further studies should focus on the composition characteristics of TOC (i.e., POC and DOC) and the concentration and export of TOC linked to nutrients (i.e., organic N, TN, organic P, and TP). In the near future, decoupling of the carbon economy to achieve sustainable development is a critical issue in this region.
Author Contributions
Conceptualization, Y.H. and L.R.; methodology, Y.H.; software, L.Z.; validation, Y.H., L.R. and L.Z.; formal analysis, L.Z.; investigation, L.Z.; resources, L.Z.; data curation, L.Z.; writing—original draft preparation, Y.H.; writing—review and editing, Y.H. and L.R.; visualization, L.Z.; supervision, L.R.; project administration, Y.H. and L.R.; funding acquisition, Y.H. and L.R. All authors have read and agreed to the published version of the manuscript.
Funding
This research was funded by [the Shenzhen Science and Technology Project] grant number [JSGG20170824102728529], and [the Research Grants Council of Hong Kong] grant number [17300621].
Institutional Review Board Statement
Not applicable.
Informed Consent Statement
Not applicable.
Data Availability Statement
The authors would exclude this statement because the study did not report any data.
Acknowledgments
This study was supported by the Shenzhen Science and Technology Project (grant: JSGG20170824102728529). L.R. acknowledged support from the Research Grants Council of Hong Kong (grant: 17300621). Thanks are also given to Peking University and Tsinghua University for their data support of rainwater and river TOC. Three anonymous reviewers are also acknowledged for their critical comments and suggestions.
Conflicts of Interest
The authors declared no conflict of interest.
References
- Richey, J.E. Global river carbon biogeochemistry. In Encyclopedia of Hydrological Sciences; Anderson, M.G., McDonnell, J.J., Eds.; John Wiley & Sons, Ltd.: Hoboken, NJ, USA, 2005. [Google Scholar]
- Zhang, L.K.; Qin, X.Q.; Yang, H.; Huang, Q.B.; Liu, P.Y. Transported fluxes of the riverine carbon and seasonal variation in Pearl River basin. Environ. Sci. 2013, 34, 3025–3034, (In Chinese with English Abstract). [Google Scholar]
- Xiao, X.; Melillo, J.M.; Kicklighter, D.W.; McGuire, A.D.; Prinn, R.G.; Wang, C.; Stone, P.H.; Sokolov, A. Transient climate change and net ecosystem production of the terrestrial biosphere. Glob. Biogeochem. Cycles 1998, 12, 345–360. [Google Scholar] [CrossRef]
- Sickman, J.O.; Zanoli, M.J.; Mann, H.L. Effects of Urbanization on Organic Carbon Loads in the Sacramento River, California. Water Resour. Res. 2007, 44, 2578–2584. [Google Scholar] [CrossRef] [Green Version]
- Ludwig, W.; Amiotte-Suchet, P.; Probst, J.L. River discharges of carbon to the world’s ocean: Determining local inputs of alkalinity and of dissolved and particulate carbon. C. R. 1996, 323, 1007–1014. [Google Scholar]
- Cole, J.J.; Caraco, N.F. Carbon in catchments: Connecting terrestrial carbon losses with aquatic metabolism. Mar. Freshw. Res. 2001, 52, 101–110. [Google Scholar] [CrossRef] [Green Version]
- Baker, A.; Cumberland, S.; Hudson, N. Dissolved and total organic and inorganic carbon in some British rivers. Area 2008, 40, 117–127. [Google Scholar] [CrossRef]
- Regnier, P.; Friedlingstein, P.; Ciais, P.; Mackenzie, F.T.; Thullner, M. Anthropogenic perturbation of the carbon fluxes from land to ocean. Nat. Geosci. 2013, 6, 597–607. [Google Scholar] [CrossRef]
- Clair, T.A.; Pollock, T.L.; Ehrman, J.M. Exports of carbon and nitrogen from river basins in Canada’s Atlantic Provinces. Glob. Biogeochem. Cycles 1994, 8, 441–450. [Google Scholar] [CrossRef]
- Alvarez-Cobelas, M.; Angeler, D.G.; Sánchez-Carrillo, S.; Almendros, G. A worldwide view of organic carbon export from catchments. Biogeochemistry 2012, 107, 275–293. [Google Scholar] [CrossRef]
- Wolf-Gladrow, D.A.; Riebesell, U.; Burkhardt, S.; Bijma, J. Direct effects of CO2 concentration on growth and isotopic composition of marine plankton. Tellus 1999, 51, 461–476. [Google Scholar] [CrossRef] [Green Version]
- Allen, H.L. Production and Utilization of dissolved organic carbon during in situ phytoplankton photosynthesis measurements. Int. Rev. Hydrobiol. 2007, 58, 843–849. [Google Scholar] [CrossRef]
- Zhang, S.R.; Lu, X.X.; Sun, H.G.; Han, J.T.; Higgitt, D.L. Geochemical characteristics and fluxes of organic carbon in a human-disturbed mountainous river (the Loudingjiang River) of the Zhujiang (Pearl River), China. Sci. Total Environ. 2009, 407, 815–825. [Google Scholar] [CrossRef] [PubMed]
- Wei, X.G.; Li, N.L.; Shen, C.D.; Guo, Z.X. Riverine organic carbon content and significance of carbon isotopic composition in the Xijiang River, China. Sci. Geogr. Sin. 2011, 31, 166–171, (In Chinese with English Abstract). [Google Scholar]
- Gao, Q.Z.; Shen, C.D.; Sun, Y.M.; Yi, W.X. The organic carbon weathering fluxes in Xijiang River basin. Acta Sedimentol. Sin. 2000, 18, 639–645, (In Chinese with English Abstract). [Google Scholar]
- Chen, K.; Li, J.; Xu, Q.T.; Wang, X.L.; Liu, Q.Q.; Hao, C.L.; Wang, X.C. CODMn and TOC concentration distribution and correlation studies of different rivers in the West of Bohai Sea. Hubei Agric. Sci. 2016, 55, 1926–1930, (In Chinese with English Abstract). [Google Scholar]
- Ye, L.L.; Wu, X.D.; Liu, B.; Yan, D.Z. Tidal and seasonal variation in the concentrations of the organic carbons in the tidal freshwater reach of Changjiang River. Acta Sci. Circumstantiae 2022, in press (In Chinese with English Abstract). [Google Scholar] [CrossRef]
- Shih, J.-S.; Alexander, R.B.; Smith, R.A.; Boyer, E.W.; Schwarz, G.E.; Chung, S. An Initial SPARROW Model of Land Use and In-Stream Controls on Total Organic Carbon in Streams of the Conterminous United States: U.S. Geological Survey Open-File Report 2010-1276, 22 p. Available online: http://pubs.usgs.gov/of/2010/1276 (accessed on 1 November 2021).
- Borken, W.; Ahrens, B.; Schulz, C.; Zimmermann, L. Site-to-site variability and temporal trends of DOC concentrations and fluxes in temperate forest soils. Glob. Chang. Biol. 2011, 17, 2428–2443. [Google Scholar] [CrossRef]
- Grieve, I.C.; Marsden, R.L. Effects of forest cover and topographic factors on toc and associated metals at various scales in western scotland. Sci. Total Environ. 2001, 265, 143–151. [Google Scholar] [CrossRef]
- Kaushal, S.S.; Delaney-Newcomb, K.; Findlay, S.E.G.; Newcomer, T.A.; Duan, S.; Pennino, M.J.; Sivirichi, G.M.; Sides-Raley, A.M.; Walbridge, M.R.; Belt, K.T. Longitudinal patterns in carbon and nitrogen fluxes and stream metabolism along an urban watershed continuum. Biogeochemistry 2014, 121, 23–44. [Google Scholar] [CrossRef]
- Kalev, S.; Toor, G.S. Concentrations and loads of dissolved and particulate organic carbon in urban stormwater runoff. Water 2020, 12, 1031. [Google Scholar] [CrossRef] [Green Version]
- Wu, Z.P.; Lin, C.; Su, Z.H.; Zhou, S.L.; Zhou, H. Multiple landscape “source-sink” structures for the monitoring and management of non-point source organic carbon loss in a peri-urban watershed. Catena 2016, 145, 15–29. [Google Scholar] [CrossRef]
- Freeman, C.; Evans, C.D.; Monteith, D.T. Export of organic carbon from peat soils. Nature 2001, 412, 785. [Google Scholar] [CrossRef] [PubMed]
- Worrall, F.; Harriman, R.; Evans, C.D.; Watts, C.D.; Adamson, J.; Neal, C.; Tipping, E.; Burt, T.; Grieve, I.; Monteith, D. Trends in dissolved organic carbon in UK rivers and lakes. Biogeochemistry 2004, 70, 369–402. [Google Scholar] [CrossRef]
- Filella, M.; Rodríguez-Murillo, J. Long-term trends of organic carbon concentrations in freshwaters: Strengths and weaknesses of existing evidence. Water 2014, 6, 1360–1418. [Google Scholar] [CrossRef] [Green Version]
- Asmala, E.; Carstensen, J.; Räike, A. Multiple anthropogenic drivers behind upward trends in organic carbon concentrations in boreal rivers. Environ. Res. Lett. 2019, 14, 2408. [Google Scholar] [CrossRef] [Green Version]
- Hongve, D.; Riise, G.; Kristiansen, J.F. Increased colour and organic acid concentrations in Norwegian forest lakes and drinking water—A result of increased precipitation? Aquat. Sci. 2004, 66, 231–238. [Google Scholar] [CrossRef]
- Keller, W.; Paterson, A.M.; Somers, K.M.; Dillon, P.J.; Heneberry, J.; Ford, A. Relationships between dissolved organic carbon concentrations, weather, and acidification in small Boreal Shield lakes Can. J. Fish. Aquat. Sci. 2008, 65, 786–795. [Google Scholar] [CrossRef]
- Tank, S.E.; Striegl, R.G.; McClelland, J.W.; Kokelj, S.V. Multidecadal increases in dissolved organic carbon and alkalinity flux from the Mackenzie drainage basin to the Arctic Ocean. Environ. Res. Lett. 2016, 11, 054015. [Google Scholar] [CrossRef]
- Raymond, P.A.; Oh, N.H.; Turner, R.E.; Broussard, W. Anthropogenically enhanced fluxes of water and carbon from the Mississippi river. Nature 2008, 451, 449–452. [Google Scholar] [CrossRef] [Green Version]
- Wang, H.; Long, A.H.; Yu, F.L.; Wang, D.X. Study on theoretical method of social water cycle Ι: Definition and dynamical mechanism. J. Hydraul. Eng. 2011, 42, 379–387, (In Chinese with English Abstract). [Google Scholar]
- Wang, H.; Wang, J.H.; Qin, D.Y. Theoretical method of water resources evaluation based on binary water cycle model. J. Water Conserv. 2006, 37, 1496–1502, (In Chinese with English Abstract). [Google Scholar]
- Qin, D.Y.; Lu, C.Y.; Liu, J.H.; Wang, H.; Wang, J.H.; Li, H.H.; Chu, J.Y.; Chen, G.F. Theoretical framework of dualistic nature-social water cycle. Chin. Sci. Bull. 2014, 59, 419–427, (In Chinese with English Abstract). [Google Scholar] [CrossRef]
- Wang, L.Y.; Qin, H.P.; Tan, X.L. Study on water quality of roof-runoff affected by atmospheric wet deposition in Shenzhen. Environ. Sci. Technol. 2013, 36, 60–64, (In Chinese with English Abstract). [Google Scholar]
- Qin, H.P.; Tang, Q.L.; Wang, L.Y.; Fu, G.T. The impact of atmospheric wet deposition on roof runoff quality in an urbanized area. Hydrol. Res. 2015, 46, 880–891. [Google Scholar] [CrossRef]
- Rantakar, M.; Mattsson, T.; Kortelainen, P.; Piirainen, S.; Finér, L.; Ahtiainen, M. Organic and inorganic carbon concentrations and fluxes from managed and unmanaged boreal first-order catchments. Sci. Total Environ. 2010, 408, 1649–1658. [Google Scholar] [CrossRef] [PubMed]
- Pettersson, C.; Bishop, K. Seasonal variations of total organic carbon, iron, and aluminium on the Svartberget catchment in northern Sweden. Environ. Int. 1996, 22, 541–549. [Google Scholar] [CrossRef]
- Gao, Q.Z.; Shen, C.D.; Sun, Y.M. Seasonal variations of riverine organic carbon contents in Makou and Hekou gauge stations of the Zhujiang River, China. Chin. Geogr. Sci. 2000, 4, 44–46. [Google Scholar] [CrossRef]
- Davies, O.A. Seasonal variation of the physico-chemistry quality of a tributary of the Bonny Estuary, Rivers State, Nigeria. J. Adv. Biol. 2013, 25, 92–107. [Google Scholar]
- Gu, C.; Waldron, S.; Bass, A.M. Carbon dioxide, methane, and dissolved carbon dynamics in an urbanized river system. Hydrol. Processes 2021, 35, e14360. [Google Scholar] [CrossRef]
- Wang, X.F. Research on Carbon Gases Emissions from Metropolitan River Network. Ph.D. Thesis, Chongqing University, Chongqing, China, 2017; 169p. [Google Scholar]
- Moore, S.; Gauci, V.; Evans, C.D.; Page, S.E. Fluvial organic carbon losses from a Bornean blackwater river. Biogeosciences 2011, 8, 901–909. [Google Scholar] [CrossRef] [Green Version]
- Moore, S.; Evans, C.D.; Page, S.E.; Garnett, M.H.; Jones, T.G.; Freeman, C.; Hooijer, A.; Wiltshire, A.J.; Limin, S.H.; Gauci, V. Deep instability of deforested tropical peatlands revealed by fluvial organic carbon fluxes. Nature 2019, 493, 660–665. [Google Scholar] [CrossRef] [PubMed] [Green Version]
- Ågren, A.; Buffam, I.; Jansson, M.; Laudon, H. Importance of seasonality and small streams for the landscape regulation of dissolved organic carbon export. J. Geophys. Res. 2007, 112, G03003. [Google Scholar] [CrossRef] [Green Version]
- Jutras, M.F.; Nasr, M.; Castonguay, M.; Pit, C.; Pomeroy, J.H.; Smith, T.P.; Zhang, C.F.; Ritchie, C.D.; Meng, F.R.; Clair, T.A.; et al. Dissolved organic carbon concentrations and fluxes in forest catchments and streams: DOC-3 model. Ecol. Model. 2011, 222, 2291–2313. [Google Scholar] [CrossRef]
- Mulholland, P.J. Large scale patterns in DOC concentration, flux, and sources. In Aquatic Ecosystems—Interactivity of Dissolved Organic Matter; Findlay, S., Sinsabaugh, R., Eds.; Elsevier Science: Amsterdam, The Netherlands, 2003; pp. 139–159. [Google Scholar]
- Li, S.A.; Liu, D.Q.; Zhou, M.; Gu, T.F.; Qiu, H.Y. Study on the pertinence between CODMn and TOC in the drinking source of Shenzhen. Environ. Monit. China 2005, 21, 30–33, (In Chinese with English Abstract). [Google Scholar]
- Hu, L.F.; Li, X.Y.; Sun, S.L.; Zhang, J.B.; Zhou, K. Distribution characteristic and correlation of COD and TOC in Shenzhen bay. Mar. Environ. Sci. 2010, 29, 221–224, (In Chinese with English Abstract). [Google Scholar]
Figure 1.
Study area and sampling location in the Shenzhen River and Bay basin.

Figure 2.
TOC concentration at different sites in the Shenzhen River and Bay.

Figure 3.
TOC concentrations in the Shenzhen River and Bay in different months.

Figure 4.
Seasonal TOC characteristics of rainwater in Shenzhen City.

Figure 5.
Runoff and effluent of treated sewage in the Shenzhen River and Bay basin in 2011–2012.

Figure 6.
Water cycle and TOC export of the Shenzhen River and Bay basin in 2011 and 2012.


Figure 7.
The relationship between the concentrations of TOC and CODCr in Shenzhen River basin (A) and Shenzhen Bay basin (B).
Figure 7.
The relationship between the concentrations of TOC and CODCr in Shenzhen River basin (A) and Shenzhen Bay basin (B).

Figure 8.
The annual TOC concentrations and export in the Shenzhen River and Bay during the period 2006–2019.
Figure 8.
The annual TOC concentrations and export in the Shenzhen River and Bay during the period 2006–2019.

Publisher’s Note: MDPI stays neutral with regard to jurisdictional claims in published maps and institutional affiliations. |
© 2022 by the authors. Licensee MDPI, Basel, Switzerland. This article is an open access article distributed under the terms and conditions of the Creative Commons Attribution (CC BY) license (https://creativecommons.org/licenses/by/4.0/).
Share and Cite
MDPI and ACS Style
Huang, Y.; Zhang, L.; Ran, L. Total Organic Carbon Concentration and Export in a Human-Dominated Urban River: A Case Study in the Shenzhen River and Bay Basin. Water 2022, 14, 2102. https://doi.org/10.3390/w14132102
AMA Style
Huang Y, Zhang L, Ran L. Total Organic Carbon Concentration and Export in a Human-Dominated Urban River: A Case Study in the Shenzhen River and Bay Basin. Water. 2022; 14(13):2102. https://doi.org/10.3390/w14132102
Chicago/Turabian StyleHuang, Yilong, Liping Zhang, and Lishan Ran. 2022. "Total Organic Carbon Concentration and Export in a Human-Dominated Urban River: A Case Study in the Shenzhen River and Bay Basin" Water 14, no. 13: 2102. https://doi.org/10.3390/w14132102
Note that from the first issue of 2016, this journal uses article numbers instead of page numbers. See further details here.