Article

Estimation of River Discharge Using Unmanned Aerial Vehicle (UAV) Based on Manning Formula for an Ungauged Alpine River in the Eastern Qilian Mountains

1
State Key Laboratory of Geohazard Prevention and Geoenvironment Protection, Chengdu University of Technology, Chengdu 610059, China
2
Satellite Application Center for Ecology and Environment, MEE, Beijing 100094, China
*
Authors to whom correspondence should be addressed.
Water 2022, 14(13), 2100; https://doi.org/10.3390/w14132100
Submission received: 10 May 2022 / Revised: 20 June 2022 / Accepted: 27 June 2022 / Published: 30 June 2022

Abstract

:
River discharge is crucial to water resources development and ecological protection. However, in some arid areas of northwest China, it is still difficult to measure discharge accurately. In this study, unmanned aerial vehicle (UAV) imagery has been used to estimate river discharge at two river sections in the upper reaches of the Shiyang River in the eastern part of the Qilian Mountains based on the Manning formula. The estimated discharges at those two sections are 1.16 m3/s and 3.11 m3/s, respectively. Taking the discharges measured by an acoustic Doppler current profiler (ADCP) as the reference, the relative error of the estimates is below 5%, which is accurate enough for water resources management in mountain basin regions. Multiple high-resolution satellite images were also used to calculate water discharges at the two sections, which were in good agreement with the discharges estimated from UAVs. This study demonstrates the feasibility of using UAVs to estimate river discharge, which is of great significance for future regional-scale water resource assessments.

1. Introduction

River discharge is an important indicator of the water cycle and a basic element of water balance, which plays an important role in the development and utilization of regional water resources and river ecological protection [1,2]. For a long time, the acquisition of river discharge has mainly depended on manual observation at hydrological stations [3,4]. However, in some mountainous areas, it is difficult to establish fixed hydrological stations to measure river discharge due to poor natural conditions and an underdeveloped social economy [4].
The development of high-resolution remote sensing provides a new way to acquire river discharges in ungauged areas. Ling (2012) used multi-source satellite remote sensing data to monitor changes in the submerged area of islands in the middle of the Yangtze River and established an area–runoff relationship curve to forecast the river flow [5]. Great progress has been made in estimating the flow of large rivers based on satellite remote sensing data [6,7,8]. However, due to the coarse spatial resolution, long revisit period, susceptibility to weather conditions, and other limitations of satellite data, the above methods are difficult to apply to small and medium-sized rivers in mountainous areas [9].
In recent years, the development of unmanned aerial vehicle (UAV) aerial photogrammetry makes it convenient and reliable to obtain the terrain information of the underlying surface [10,11,12,13]. It has been widely used in monitoring dynamic changes in mountain glaciers [10,11,12,13,14], river morphology [15,16] and surface deformation [17], water quality [18], water turbidity [19], flood events [20], and changes in the coastal zone [21]. For river monitoring, many studies have been carried out using UAV data for river information gathering and discharge estimation [22] and river terraces and water erosion change monitoring [23]. Compared with satellite data, UAV data has advantages in terms of data accuracy [24,25,26]. Yang (2021) used the high-precision digital orthophoto map (DOM) and digital surface model (DSM) obtained by UAV aerial photography, combined with the classic Manning formula river flow algorithm, to estimate river flow velocity and discharge [9]. Compared with the measured discharge, the average relative error of this method is 10.74%, which proves the feasibility of combining UAV data and the Manning formula to estimate runoff.
A large number of glaciers developed in the Qilian Mountains provide a great amount of meltwater for the Shiyang River [27,28]. In recent years, with the rapid retreat of glaciers in the Qilian Mountains, glacier meltwater has increased river runoff. However, with the continuous retreat of glaciers, glacier meltwater will decrease after reaching a maximum, which restricts the utilization of water resources in the Hexi Corridor [29,30]. It is of great significance to acquire the runoff of mountain rivers for the estimation and utilization of water resources in the Hexi area. However, there are few observations of runoff available in the Qilian Mountains [31].
The objective of this study is to estimate river discharges for ungauged alpine river basins using UAV imagery. Two experimental river sections of the Shiyang River have been chosen to investigate this method. First, the 3D surface model of the river is retrieved from UAV imagery and then the hydraulic gradient is calculated. After that, we estimate discharge based on the Manning formula combined with the hydraulic radius and cross-sectional area measured by ADCP. Finally, the discharges at those two sections are validated against ADCP measurements.

2. Materials and Methods
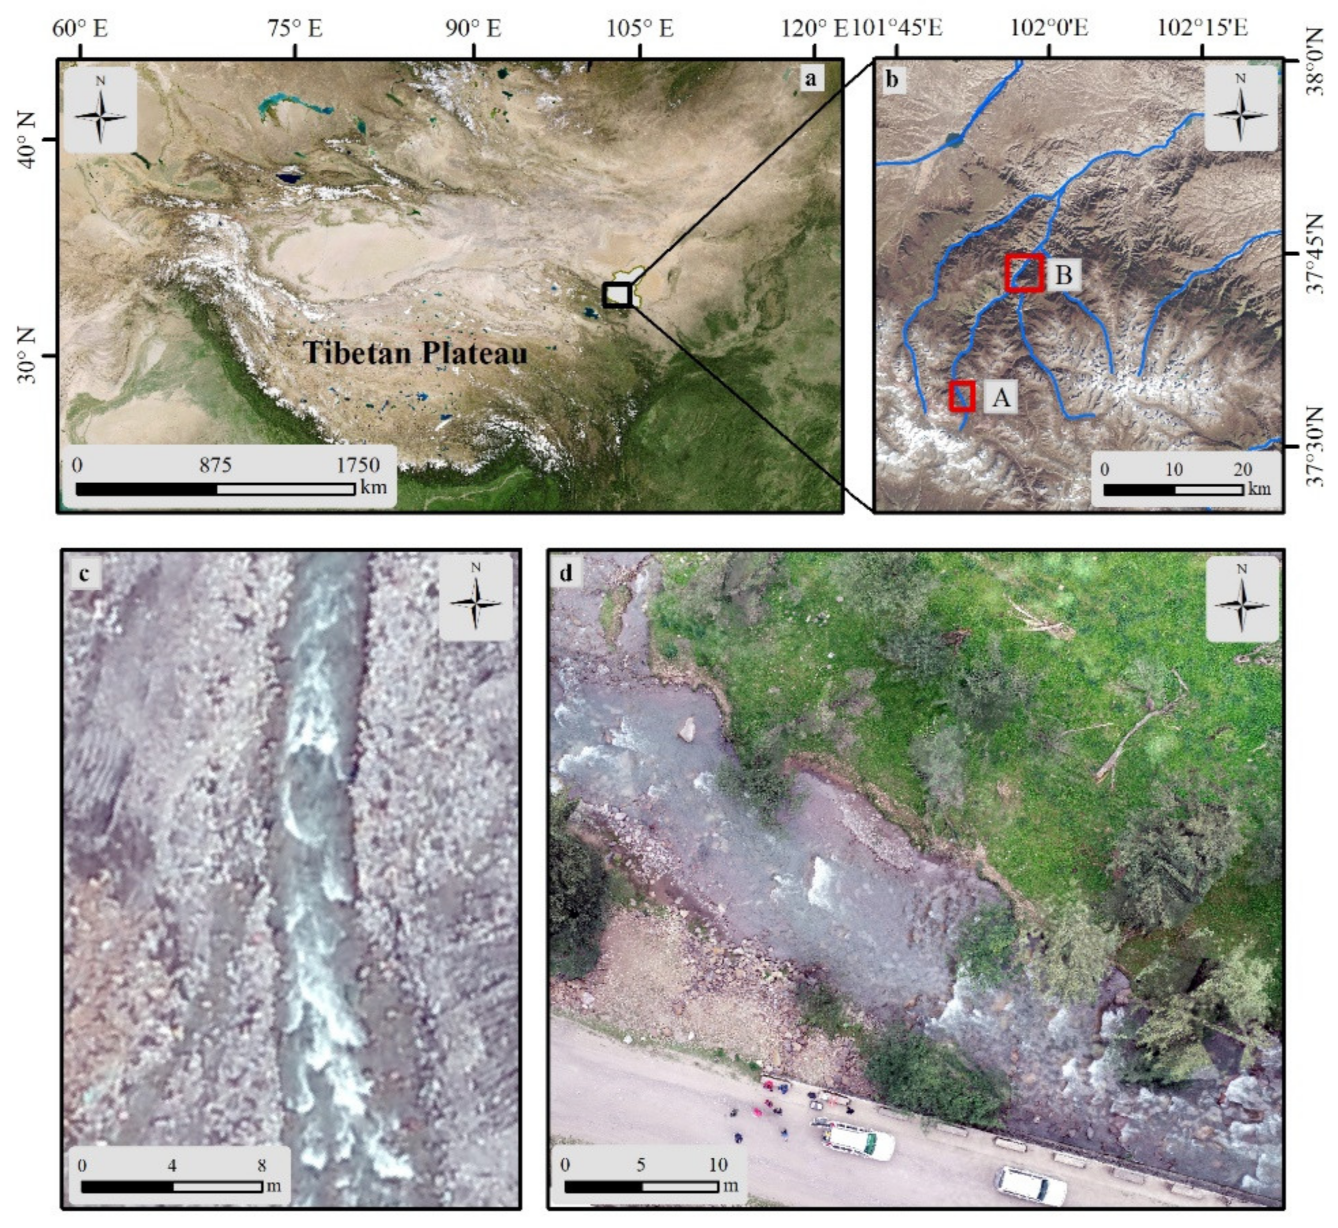
2.1. Study Area

The Qilian Mountains are located in the transition zone between the arid area in northwest China and the Qinghai-Tibet Plateau [28] at the northwest boundary of the East Asian summer monsoon and is jointly influenced by the East Asian monsoon, Indian monsoon, and westerlies. The average annual precipitation is about 250 mm, which is mainly concentrated in summer [28]. The Shiyang River originates from the eastern part of the Qilian Mountains (Figure 1). It is 250 km long. The terrain is high in the south and low in the north, sloping from southwest to northeast. The altitude of the mountainous area ranges from 2000 to 5000 m. In this region, rainfall is scarce, and the ecological environment is fragile. Water resources are the key factors that control the evolution of the ecosystem and limit social and economic development.
As Earth’s climate warms, the glaciers in the Shiyang River are highly sensitive to climate change and show a higher shrinkage rate than other glaciers studied in the Qilian Mountains. The total area of glaciers in the Shiyang River decreased by 28.3% from 1972 to 2007 [27]. The UAV survey and ADCP measurements were conducted at two experimental river sections, namely Section A and Section B (Figure 1). Section A is situated at the upper reaches of the river, with an altitude of 3255 m asl; section B is located about 20 km downstream of section A, with an altitude of 2574 m asl.

2.2. UAV Data Collection and Processing

A Phantom 4 Pro quadcopter system equipped with a 20-megapixel fixed-lens camera (DJI, Shenzhen, China) was used in this research to acquire aerial images on 10 July 2021. It is a rotorcraft, and each battery provides a maximum flight time of 20 min. Images collected by each UAV survey were processed into DOMs and DSMs using a structure-from-motion photogrammetry (SfM) workflow [32]. Pix4D software (www.pix4d.com, accessed on 20 August 2021) was used to splice the river section images obtained in the field, and synthetic images of the study area were obtained. In this study, the UAV was used to capture high-resolution images of the river in the study area as follows: (1) UAV route planning: flight routes were arranged according to the width, direction, location, and surrounding terrain of the river so that the study area was located in the center of the flight area; the flights were planned using the DJI-GS-Pro flight planning software to maintain 66% lateral overlap and 88% longitudinal overlap between the images. The average flight height was approximately 80 m. (2) UAV data sorting: we classified, sorted, and numbered the segmented UAV image data. (3) River information extraction: the segmented UAV image was imported into Pix4D software, and the complete river section image was derived through image mosaic, point cloud encryption, quality analysis, and other steps. The average errors in both vertical and horizontal directions measured by UAV were at the level of centimeters, which was accurate enough to meet the extraction of river topographic information [10].

2.3. ADCP Measurements

During the UAV survey, the cross-sectional profiles (Figure 2), river flow velocities, and discharges for sections A and B were measured by an acoustic Doppler current profiler (ADCP). The RiverRay ADCP comprises four 600 kHz transducers with a beam angle of 30°, which measures flow velocity at a resolution of 1 mm/s [33]. At the same time, the positions of those two sections were determined by GPS, so that they can be accurately located on the UAV imagery.

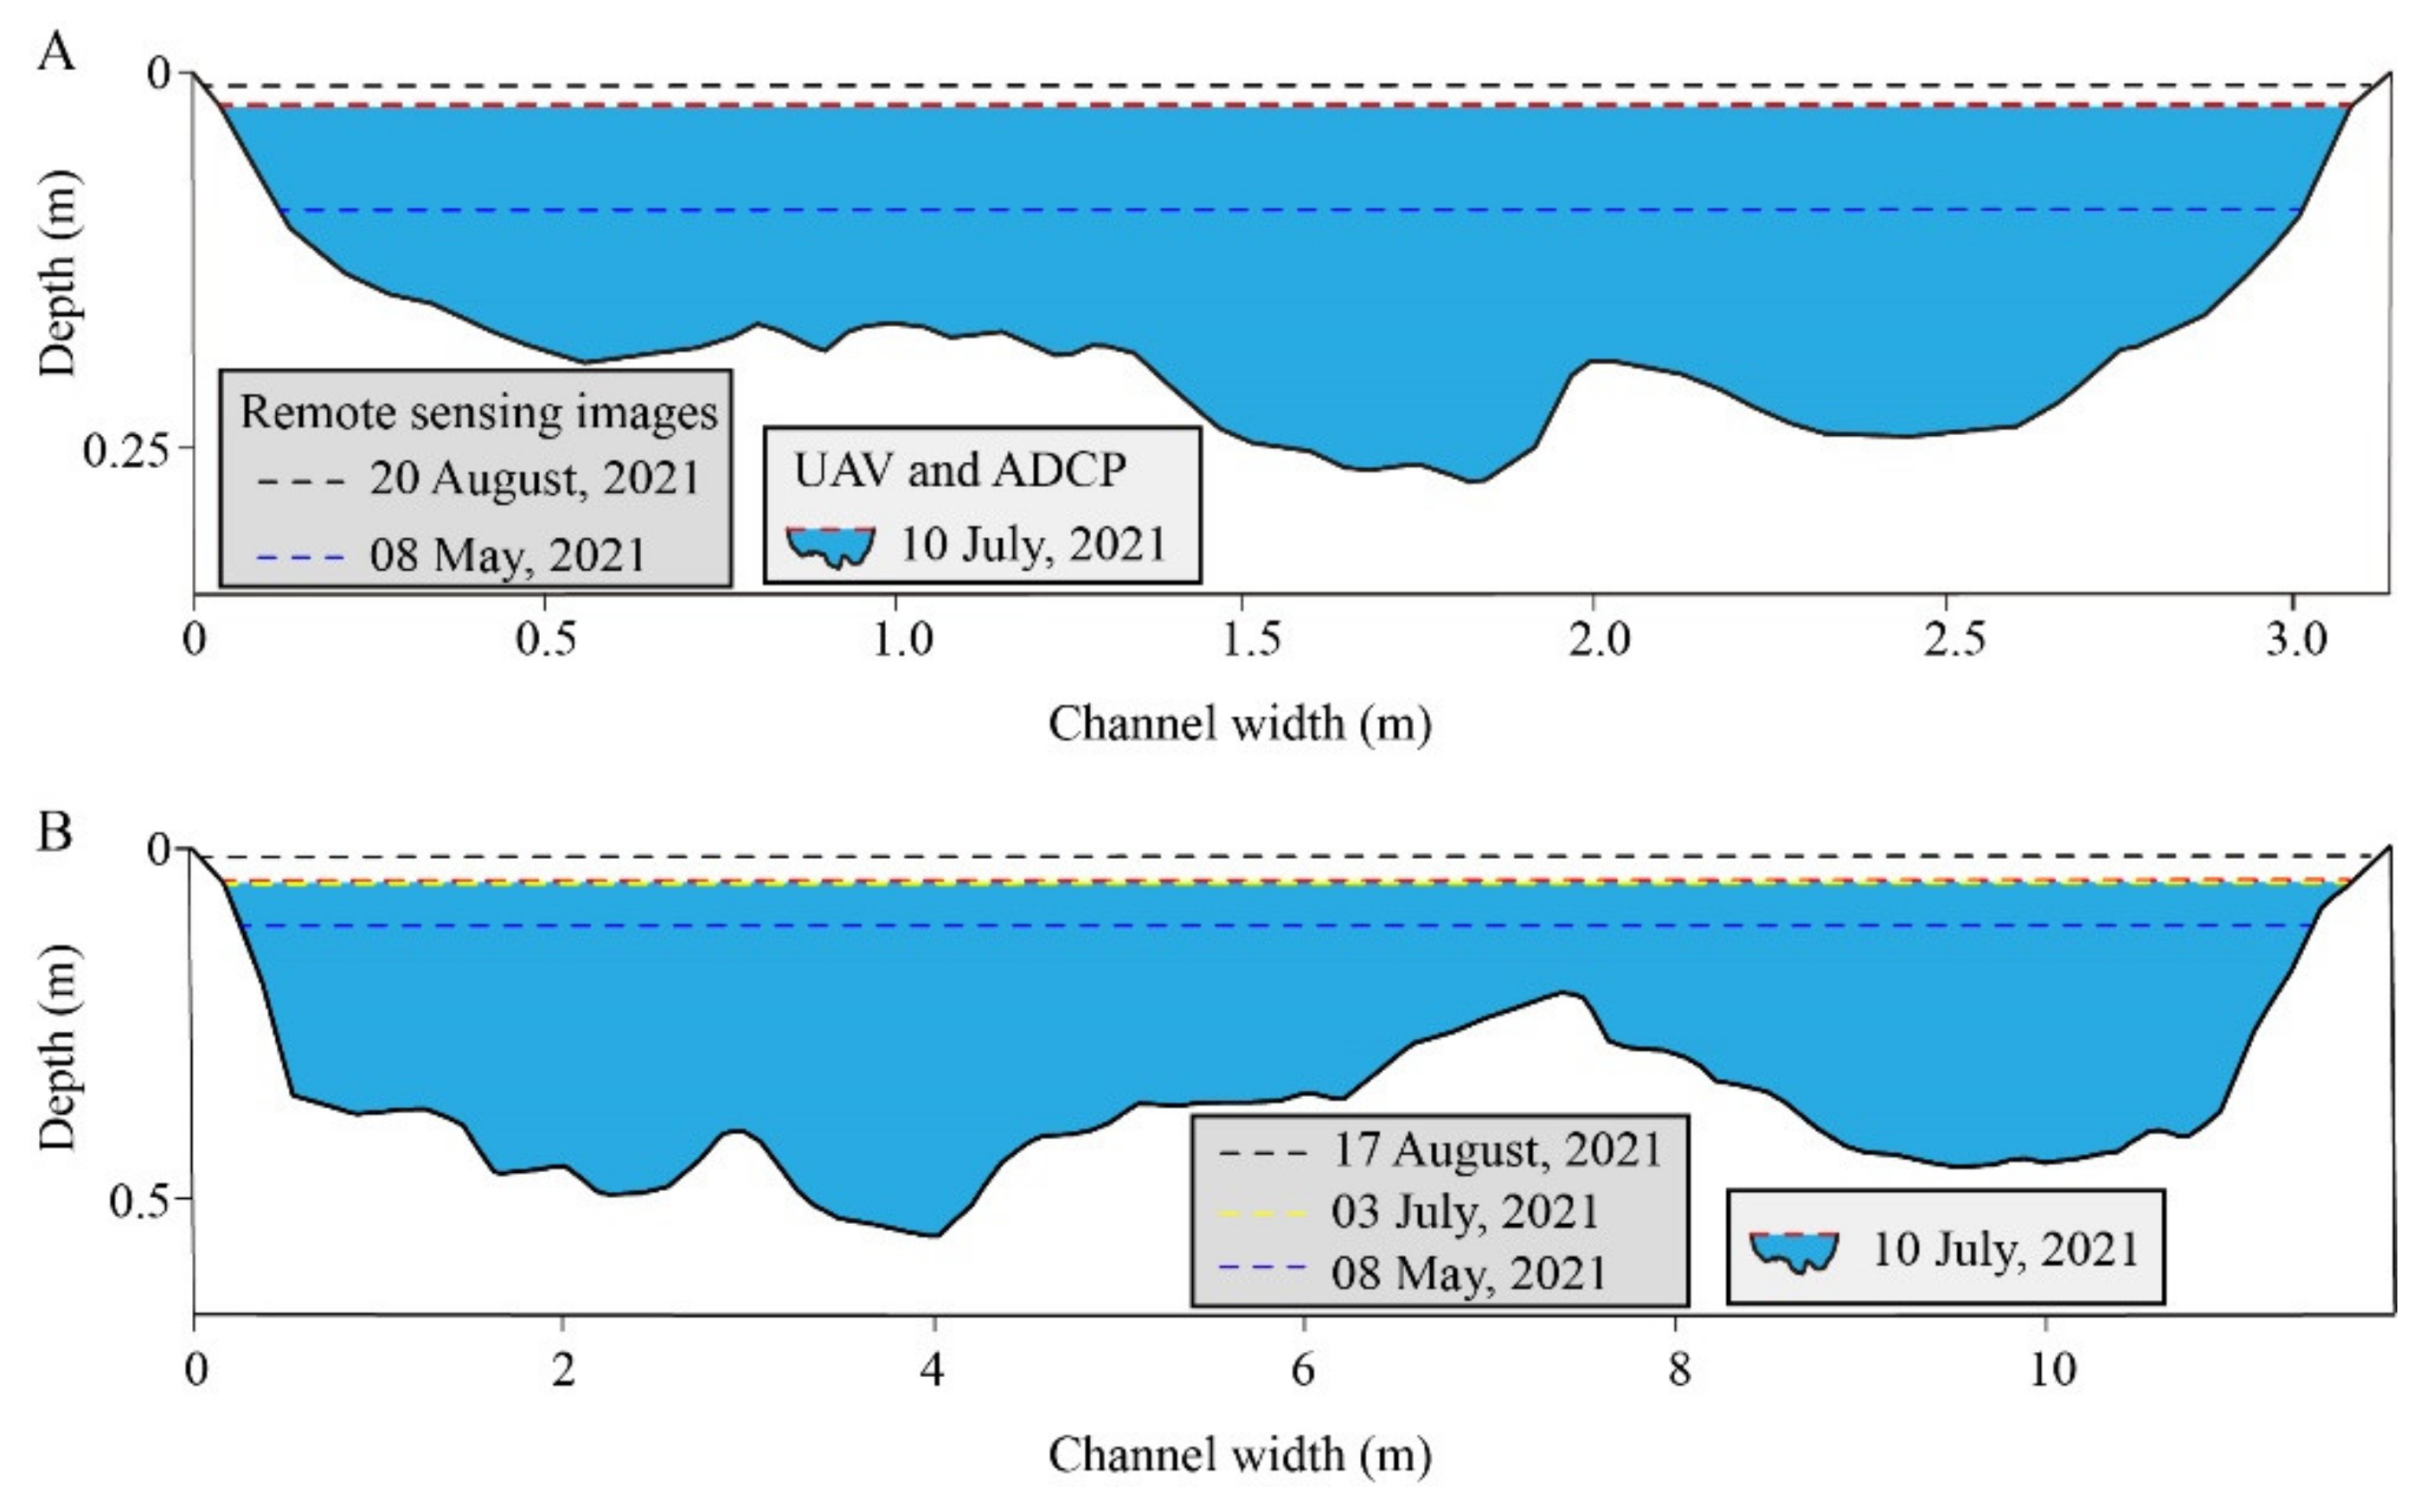
2.4. High-Resolution Satellite Images

To acquire river discharges for a longer term, we also combined multiple high-resolution satellite images with ADCP measurements to monitor runoff from May to August at the two sections. The satellite data involved in this study are shown in Table 1.

2.5. Discharge Estimation Based on the Manning Formula

The Manning formula is an empirical formula for calculating non-pressurized water flow [9], which is based on the Chezy formula proposed by French engineer Chezy in 1796, as shown in Equation (1):
v = C R 1 / 2 J 1 / 2
where v is the average flow velocity of the section, m/s; R is the hydraulic radius, which is related to the shape of the cross-section; J is hydraulic gradient; and C is the Chezy coefficient, which indicates the comprehensive effect of reactive boundary conditions on water flow, m1/2/s.
Most of the natural river flow is turbulent flow in the resistance square region [34], and the Chezy coefficient is commonly calculated using the Manning formula, as shown in Equation (2). The river discharge is then given by Equation (3) [35]:
C = 1 n R 1 / 6
Q = v × A = 1 n R 2 / 3 J 1 / 2 A
where n is roughness, which is a dimensionless index to measure the roughness of the river surface; and A is the cross-sectional area, m2.
The Manning formula involves four parameters: area of cross-section, roughness, hydraulic gradient, and hydraulic radius. According to their characteristics, these parameters can be divided into two categories: measured parameters and aerial parameters.
The measured parameters include cross-sectional area and hydraulic radius. The cross-sectional area refers to the area of the submerged river below the water surface. Hydraulic radius is the coefficient representing the shape of the cross-section, which is estimated as the ratio of the cross-sectional area to the wet circumference. In this study, both parameters will be obtained from the measured underwater terrain by ACDP.
The aerial parameters include roughness and hydraulic gradient. Roughness reflects the resistance of the channel to water flow. Hydraulic gradient refers to the ratio of the amount of head loss to the distance along the flow direction. The head loss of a natural rivers is expressed as the change of surface elevation. This can be extracted from DSM and DOM images obtained by UAVs. Roughness can be determined from DOM images by analyzing riverbank type, pebble particle size and its distribution at the bottom of the river, and tidal flat vegetation.

3. Results

3.1. Hydraulic Gradient

Hydraulic gradient describes the slope of vertical sections. It is quite sensitive to elevation variation, and UAVs can capture and record subtle changes in the underlying surface. In this study, the longitudinal elevation variation of the river reach is derived from the DOM image. The hydraulic gradient is determined as the ratio of elevation difference between the upstream parts and downstream parts to the corresponding distance. The elevations of the upstream and downstream parts as well as the estimated hydraulic gradients of the two reaches A and B are shown in Table 2.

3.2. Hydraulic Radius

Hydraulic radius reflects the water carrying capacity of the cross-section and is closely related to the shape of the cross-section. In this study, the complete cross-sectional shape (Figure 2) was obtained by combining the underwater data measured by ADCP with the water terrain data measured by UAV. Based on that profile, the cross-sectional area and wet circumference can be obtained. The ratio of these two parameters is thus the hydraulic radius, as shown in Table 1.

3.3. Roughness

Roughness reflects the amount of frictional resistance in rivers. In this study, it is determined depending on prior knowledge. The roughness of the two sections were 0.07 and 0.08, respectively.

3.4. River Discharges

The parameters required by the Manning formula for discharge estimation have been obtained step by step as noted above. As is shown in Table 1, the estimated river discharge using UAVs at section A is 1.16 m3/s, which is located in the upper reaches, where most of the runoff is replenished by the glacier meltwater at the top of the mountain. Section B has a higher river discharge (3.11 m3/s). It is located in the middle reaches, which collect more slope water. Compared with ADCP reference, the river discharge calculated based on the UAV aerial survey is very close to that measured by ADCP. The relative error is below 5%. This indicates that the accuracy of this method is good enough to meet the requirements in the application of mountain rivers.
For section B, we obtained a satellite image that was captured on 3 July 2021, which is close to the date of the UAV flight (10 July 2021). As is shown in Figure 2, the cross-sectional shapes retrieved from satellite and UAV images are almost the same. The water level on 10 July 2021 is slightly higher than that on 3 July 2021. This indicates that the two data sources can be matched (Figure 2). The river discharges from May to August were calculated from the cross-sectional shape retrieved from satellite images. It is found that both section A in the upstream and section B in the downstream have the highest runoff in August and the smallest runoff in May (Table 3).

4. Discussion

4.1. Influencing Factors

The major factors affecting the accuracy of this study come from the acquisition of underlying surface data.
First, the performance of this method largely depends on the accuracy of UAV aerial survey data. In the previous study, it was demonstrated that the horizontal error and vertical error of this series of UAVs are ±0.51 cm and ±4.39 cm, respectively [36]. The overall data accuracy is at centimeter-level, which has advantages in obtaining the shape of river cross-section and detecting ground objects. The main factor affecting the accuracy of the composite image is the meteorological conditions at the time of data acquisition. For example, when wind force is greater than level 4, the number of effective UAV images, which can be used for an image mosaic, will be reduced by about 10% due to the changes in UAV pose. In addition, the blocking effect of beach vegetation on water flow, the particle size distribution of sand and gravel in the river bed, and the underwater information are still difficult to determine with UAV imagery.
Second, among those parameters required in the Manning formula for discharge estimation, the roughness is relatively subjective and relies to a great extent on prior knowledge. When robust hydraulic gradient and hydraulic radius can be retrieved, the accuracy of estimated discharges depends largely on roughness [37,38]. In this study, the determination of roughness is based on the “Table of Natural River Roughness” [39]. Different values of roughness will result in a big difference in the results.

4.2. Comparison of Two River Sections

The cross-sectional area of section B is larger than that of section A, but the hydraulic radius of the two sections is almost the same, which indicates that the morphology of the two sections has a lot in common and is comparable.
The hydraulic gradient of section A is relatively larger. Therefore, the flow velocity is faster than that at section B. In addition, Section A is an alluvial channel, and its beach mostly consists of sub-rounded large stones. Section B is also an alluvial channel. However, compared with section A, the roundness of stones is relatively higher, the size of stones is smaller, and the beach has more vegetation. Therefore, the roughness of section B is higher than that of section A.
The watershed area controlled by section A is approximately 36.4 km², and the runoff mainly comes from glacier and snow meltwater in the alpine region. The watershed area controlled by section B is approximately 175.6 km², and the runoff includes not only glacier and snow meltwater but also the contribution of slope soil water. The basin area controlled by section B is 5 times that of section A, but the discharge is only 3 times that of section A, indicating that alpine snow and ice meltwater replenishment plays an important role in river runoff in the Qilian Mountains.
Comparing the river discharges at these two sections from May to August 2021 in the Shiyang River basin, it is found that the maximum discharge occurred in August, whereas the discharge in May is the lowest. At section A, river discharges increased more rapidly from May to July than from July to August. Glacier meltwater has made the largest contribution to total runoff. Due to the lower temperature, the runoff in May was relatively lower. As the temperature increased, there was more meltwater, which resulted in a larger discharge in July. At section B, the variation in discharges was not so significant. This may be because section A has a larger control area, and the runoff sources are more diverse.

4.3. The Implications of this Study for Further Research

No matter whether discharges are obtained by satellite or UAV imagery, the accuracy evaluation is always performed by comparison with in situ measurements. Therefore, the accuracy of the measurements is particularly important. Most of the previous studies adopted the “velocity area method” to obtain cross-sectional information and used the “one-point method” to synthesize the average velocity and discharge [9], which would lead to large errors. However, the ADCP used in this study can obtain more accurate cross-sectional morphology and flow velocities at different positions, which will result in more accurate river discharges.
A high-precision 3D river model is established using UAV aerial survey data, and a stable and reliable discharge estimation method is explored. However, this method is limited by time and space, and it is difficult to carry out continuously on a large scale. Future research will focus on how to combine satellite, UAV, and ground observations to acquire a large-scale and continuous river discharge dataset.

5. Conclusions

River discharge is fundamental to water resource development and ecological protection. However, in an area lacking in situ measurements, especially in the arid area of northwest China, it is still a problem to acquire river discharge conveniently and accurately. In this study, UAVs and multi-source satellites are used to calculate discharges at two sections of the Shiyang River in the eastern part of the Qilian Mountains based on the Manning formula. Compared to previous studies, ADCP in situ observation were also carried out in this study to acquire accurate river morphology, which has improved the accuracy of the estimation. The estimated discharges at sections A and B using UAVs are 1.16 m3/s and 3.11 m3/s, respectively, which are validated against ADCP reference. The relative error turned out to be less than 5%. However, the determination of roughness depends partly on prior knowledge, which brings uncertainty into the estimates. In general, UAVs can monitor surface runoff more effectively and have great potential for water resources management in alpine regions. Combining UAVs of higher spatial resolution and multi-source satellites with a better temporal resolution makes it possible to acquire runoff for a longer term. In addition, the operational use of fixed cameras will be also a promising method for continuous river flow monitoring at hydrological stations in the future.

Author Contributions

Conceptualization, M.C., J.G., X.F., S.L., W.S. and C.H.; methodology, M.C., J.G. and S.L.; visualization, M.C. and X.F.; writing—original draft, M.C. and S.L.; writing—review and editing, M.C., W.S. and C.H. All authors have read and agreed to the published version of the manuscript.

Funding

This research was funded by the National Natural Science Foundation of China, grant number 41801293, and the Opening Fund of State Key Laboratory of Geohazard Prevention and Geo-environment Protection (Chengdu University of Technology), grant number SKLGP2020K005, and the Sichuan Science and Technology Program, grant number 2022YFG0183.

Institutional Review Board Statement

Not applicable.

Informed Consent Statement

Not applicable.

Data Availability Statement

The data presented in this study are available on request from the corresponding authors.

Acknowledgments

We are grateful for the valuable and constructive advice given by Hezhen Lou and Junping Du on this paper.

Conflicts of Interest

The authors declare no conflict of interest.

References

  1. DeAngelis, A.M.; Qu, X.; Zelinka, M.; Hall, A. An observational radiative constraint on hydrologic cycle intensification. Nature 2015, 528, 249–253. [Google Scholar] [CrossRef] [PubMed]
  2. Ramanathan, V.; Terborgh, J.; Lopez, L.; Núñez, P.; Rao, M.; Shahabuddin, G.; Orihuela, G.; Riveros, M.; Ascanio, R.; Adler, G.H.; et al. Aerosols, Climate, and the Hydrological Cycle. Science 2001, 294, 2119–2124. [Google Scholar] [CrossRef] [PubMed] [Green Version]
  3. Huang, J.; Ji, M.; Xie, Y.; Wang, S.; He, Y.; Ran, J. Global semi-arid climate change over last 60 years. Clim. Dyn. 2015, 46, 1131–1150. [Google Scholar] [CrossRef] [Green Version]
  4. Yang, S. Ecohydrological Models: Introduction and Application; Science Press: Beijing, China, 2012. [Google Scholar]
  5. Ling, F.; Cai, X.; Li, W.; Xiao, F.; Li, X.; Du, Y. Monitoring River discharge with remotely sensed imagery using river island area as an indicator. J. Appl. Remote Sens. 2012, 6, 063564. [Google Scholar] [CrossRef]
  6. Garambois, P.-A.; Monnier, J. Inference of effective river properties from remotely sensed observations of water surface. Adv. Water Resour. 2015, 79, 103–120. [Google Scholar] [CrossRef]
  7. Gleason, C.J.; Smith, L.C. Toward global mapping of river discharge using satellite images and at-many-stations hydraulic geometry. Proc. Natl. Acad. Sci. USA 2014, 111, 4788. [Google Scholar] [CrossRef] [Green Version]
  8. Wang, S.; Zhou, F.; Russell, H. Estimating Snow Mass and Peak River Flows for the Mackenzie River Basin Using GRACE Satellite Observations. Remote Sens. 2017, 9, 256. [Google Scholar] [CrossRef] [Green Version]
  9. Yang, S.; Wang, P.; Wang, J.; Lou, H.; Gong, T. River Flow Estimation Method Based on UAV Aerial Photogrammetry. Natl. Remote Sens. Bull. 2021, 25, 1284–1293. [Google Scholar]
  10. Cao, B.; Guan, W.; Li, K.; Pan, B.; Sun, X. High-Resolution Monitoring of Glacier Mass Balance and Dynamics with Unmanned Aerial Vehicles on the Ningchan No. 1 Glacier in the Qilian Mountains, China. Remote Sens. 2021, 13, 2735. [Google Scholar] [CrossRef]
  11. Chandler, B.M.P.; Lovell, H.; Boston, C.M.; Lukas, S.; Barr, I.D.; Benediktsson, Í.Ö.; Benn, D.I.; Clark, C.D.; Darvill, C.M.; Evans, D.J.A.; et al. Glacial geomorphological mapping: A review of approaches and frameworks for best practice. Earth-Sci. Rev. 2018, 185, 806–846. [Google Scholar] [CrossRef] [Green Version]
  12. Colomina, I.; Molina, P. Unmanned aerial systems for photogrammetry and remote sensing: A review. ISPRS J. Photogramm. Remote Sens. 2014, 92, 79–97. [Google Scholar] [CrossRef] [Green Version]
  13. Śledź, S.; Ewertowski, M.W.; Piekarczyk, J. Applications of unmanned aerial vehicle (UAV) surveys and Structure from Motion photogrammetry in glacial and periglacial geomorphology. Geomorphology 2021, 378, 107620. [Google Scholar] [CrossRef]
  14. Urban, R.; Štroner, M.; Blistan, P.; Kovanič, L’.; Patera, M.; Jacko, S.; Ďuriška, I.; Kelemen, M.; Szabo, S. The Suitability of UAS for Mass Movement Monitoring Caused by Torrential Rainfall—A Study on the Talus Cones in the Alpine Terrain in High Tatras, Slovakia. ISPRS Int. J. Geo-Inf. 2019, 8, 317. [Google Scholar] [CrossRef] [Green Version]
  15. Rusnák, M.; Sládek, J.; Kidová, A.; Lehotský, M. Template for high-resolution river landscape mapping using UAV technology. Measurement 2018, 115, 139–151. [Google Scholar] [CrossRef]
  16. van Iersel, W.K.; Addink, E.A.; Straatsma, M.W.; Middelkoop, H. River floodplain vegetation classification using multi-temporal high-resolution colour infrared UAV imagery. In Proceedings of the GEOBIA 2016: Solutions and Synergies, Enschede, The Netherlands, 14–16 September 2016. [Google Scholar]
  17. Xue, Y.; Jing, Z.; Kang, S.; He, X.; Li, C. Combining UAV and Landsat data to assess glacier changes on the central Tibetan Plateau. J. Glaciol. 2021, 67, 862–874. [Google Scholar] [CrossRef]
  18. Lu, Q.; Si, W.; Wei, L.; Li, Z.; Xia, Z.; Ye, S.; Xia, Y. Retrieval of Water Quality from UAV-Borne Hyperspectral Imagery: A Comparative Study of Machine Learning Algorithms. Remote Sens. 2021, 13, 3928. [Google Scholar] [CrossRef]
  19. Cui, M.; Sun, Y.; Huang, C.; Li, M. Water Turbidity Retrieval Based on UAV Hyperspectral Remote Sensing. Water 2022, 14, 128. [Google Scholar] [CrossRef]
  20. Gergeľová, M.B.; Kuzevičová, Ž.; Labant, S.; Gašinec, J.; Kuzevič, Š.; Unucka, J.; Liptai, P. Evaluation of Selected Sub-Elements of Spatial Data Quality on 3D Flood Event Modeling: Case Study of Prešov City, Slovakia. Appl. Sci. 2020, 10, 820. [Google Scholar]
  21. Turner, I.L.; Harley, M.D.; Drummond, C.D. UAVs for coastal surveying. Coast. Eng. 2016, 114, 19–24. [Google Scholar] [CrossRef]
  22. Zhao, C.; Zhang, C.; Yang, S.; Liu, C.; Xiang, H.; Sun, Y.; Yang, Z.; Zhang, Y.; Yu, X.; Shao, N.; et al. Calculating e-flow using UAV and ground monitoring. J. Hydrol. 2017, 552, 351–365. [Google Scholar] [CrossRef]
  23. Lewin, J.; Gibbard, P. Quaternary river terraces in England: Forms, sediments and processes. Geomorphology 2010, 120, 293–311. [Google Scholar] [CrossRef]
  24. Xiang, H.; Tian, L. Development of a low-cost agricultural remote sensing system based on an autonomous unmanned aerial vehicle (UAV). Biosyst. Eng. 2011, 108, 174–190. [Google Scholar] [CrossRef]
  25. Neitzel, F.; Klonowski, J. Mobile 3D mapping with a low-cost UAV system. ISPRS-Int. Arch. Photogramm. Remote Sens. Spat. Inf. Sci. 2011, 38, C22. [Google Scholar] [CrossRef] [Green Version]
  26. Harder, P.; Schirmer, M.; Pomeroy, J.; Helgason, W. Accuracy of snow depth estimation in mountain and prairie environments by an unmanned aerial vehicle. Cryosphere 2016, 10, 2559–2571. [Google Scholar] [CrossRef] [Green Version]
  27. Pan, B.; Cao, B.; Wang, J.; Zhang, G.; Zhang, C.; Hu, Z.; Huang, B. Glacier variations in response to climate change from 1972 to 2007 in the western Lenglongling mountains, northeastern Tibetan Plateau. J. Glaciol. 2012, 58, 879–888. [Google Scholar] [CrossRef] [Green Version]
  28. Sun, M.; Liu, S.; Yao, X.; Guo, W.; Xu, J. Glacier changes in the Qilian Mountains in the past half-century: Based on the revised First and Second Chinese Glacier Inventory. J. Geogr. Sci. 2018, 28, 206–220. [Google Scholar] [CrossRef] [Green Version]
  29. Cao, B.; Pan, B.; Wen, Z.; Guan, W.; Li, K. Changes in glacier mass in the Lenglongling Mountains from 1972 to 2016 based on remote sensing data and modeling. J. Hydrol. 2019, 578, 124010. [Google Scholar] [CrossRef]
  30. Rounce, D.R.; Hock, R.; Shean, D.E. Glacier Mass Change in High Mountain Asia Through 2100 Using the Open-Source Python Glacier Evolution Model (PyGEM). Front. Earth Sci. 2020, 7, 331. [Google Scholar] [CrossRef] [Green Version]
  31. Li, Z.; Feng, Q.; Liu, W.; Wang, T.; Cheng, A.; Gao, Y.; Guo, X.; Pan, Y.; Li, J.; Guo, R.; et al. Study on the contribution of cryosphere to runoff in the cold alpine basin: A case study of Hulugou River Basin in the Qilian Mountains. Glob. Planet. Chang. 2014, 122, 345–361. [Google Scholar]
  32. Agisoft LLC. Agisoft PhotoScan User Manual Standard Edition; Version 1.2; Agisoft LLC: St. Petersburg, Russia, 2016. [Google Scholar]
  33. Teledyne RD Instruments. RiverRay ADCP Guide; Teledyne RD Instruments: Poway, CA, USA, 2015. [Google Scholar]
  34. Gauckler, P. Etudes Théoriques et Pratiques sur l’Ecoulement et le Mouvement des Eaux; Gauthier-Villars: Paris, France, 1867. [Google Scholar]
  35. Sun, D.; Ding, Q. Hydraulics; The Yellow River Water Conservancy PR: Zhengzhou, China, 2013; pp. 175–177. [Google Scholar]
  36. Zhang, C.; Yang, S.; Zhao, C.; Lou, H.; Zhang, Y.; Bai, J.; Wang, Z.; Guan, Y.; Zhang, Y. Topographic data accuracy verification of small consumer UAV. J. Remote Sens. 2018, 22, 185–195. [Google Scholar]
  37. Einstein, H.A. Bed-Load Transportation in Mountain Creek; United States Department of Agriculture: Washington, DC, USA, 1994. [Google Scholar]
  38. Qian, N.; Hong, R.; Mai, Q.; Bi, C. Channel roughness of lower yellow river. J. Sediment Res. 1959, 1, 3–17. [Google Scholar]
  39. Zhao, Z.; He, J. Hydraulics; Tsinghua University Press: Beijing, China, 2010; pp. 176–177. [Google Scholar]
Figure 1. (a) Location of the Shiyang River in the Qilian Mountains; (b) locations of A and B in the Shiyang River basin; (c) orthophoto at A; (d) orthophoto at B.
Water 14 02100 g001
Figure 2. The profiles of sections (Atop) and (Bbottom) measured by ADCP and reconstructed by remote sensing images.
Water 14 02100 g002
Table 1. Satellite data.
TimeSatellite Data in Section ASatellite Data in Section B
6 May 2021-Jilin-1(0.75 m)
8 May 2021SuperView-03(0.5 m)-
3 July 2021SuperView-02(0.5 m)-
17 August 2021-Jilin-1(0.75 m)
20 August 2021TRIPLESAT-2(0.8 m)
Table 2. Estimated parameters, aerial parameters, and discharges of two sections.
ParametersSection ASection B
Estimated parametersChannel width (m)3.111.4
Section area (m2)1.053.66
Flow velocity (m/s)1.060.85
Wet circumference (m)3.512.5
Hydraulic radius (m)0.300.29
Aerial parametersUpstream elevation (m)3255.912574.37
Downstream elevation (m)3255.222573.42
Hydraulic gradient0.0300.024
Roughness0.070.08
DischargesManning discharge (m3/s)1.163.11
Measured discharge (m3/s)1.113.10
Relative error0.05 (4.5%)0.01 (0.3%)
Table 3. Discharges of two sections in different seasons.
TimeDischarge in Section A (m3/s)Discharge in Section B (m3/s)
6 May 20210.81-
8 May 2021-2.75
3 July 2021-3.09
10 July 20211.163.11
17 August 2021-3.40
20 August 20211.25-
Publisher’s Note: MDPI stays neutral with regard to jurisdictional claims in published maps and institutional affiliations.

