
Influence of Fines Content on the Stability of Volcanic Embankments under Rainfall and Earthquake

1
Graduate School of Engineering, Muroran Institute of Technology, Muroran 050-8585, Japan
2
Faculty of Civil Engineering, Hanoi Architectural University, Hanoi 100000, Vietnam
*
Author to whom correspondence should be addressed.
Water 2022, 14(13), 2096; https://doi.org/10.3390/w14132096
Submission received: 14 April 2022
/
Revised: 24 June 2022
/
Accepted: 28 June 2022
/
Published: 30 June 2022
(This article belongs to the Special Issue Rainfall-Induced Geological Disasters)
Abstract
:This study aims to investigate the effects of fine content on the mechanical behavior of embankments constructed from volcanic soil subjected to rainfall and earthquake. To accomplish this purpose, a series of 1 g model experiments on slopes using Komaoka volcanic coarse-grained soils as materials was conducted with a spray nozzle and shaking table. In the experiments, shear strain, acceleration, pore water pressure, and saturation degree were monitored and measured to provide an understanding of the failure mechanism of the model embankment with different fine particle contents during post-rainfall earthquakes. The results show that the increase in the fines content of the volcanic soil reduces the permeability of the volcanic embankment but has no significant effect on rainfall-induced slope failure until the shear strain is less than 6%. Moreover, the seismic resistance of volcanic slopes subjected to previous rainfall increases when the fine particle content increases to a certain threshold of about 27%.
1. Introduction
In recent years, global warming caused by climate change has increased the number of natural disasters; thus, and dual disasters have become more common. The complex consequences of these combined disasters for natural or artificial soil structures have long been recognized; for example, Terzaghi (1950) [1] stated that rainfall is rarely the sole reason for failure on a long-standing slope that has experienced many heavy rainstorms in the past. Therefore, research on this topic is attracting the attention of authors around the world, such as surveys on the failure mechanism of volcanic embankments subjected to seismic loadings in combination with other external forces (heavy rainfall, wave loadings, freeze-thaw action, etc.) [2,3,4,5,6,7,8].
Among the dual disasters, the combination of rainfall and earthquakes has occurred many times in history, and their measured data are often used in case studies. Tuladhar et al., (2007) [9] investigated the earthquake-induced landslide name Higashi Takezawa in Niigata prefecture, Japan. Dynamic stability analysis based on the properties of soil layers above and below the sliding surface proved that the typhoon that happened 2–3 months before the earthquake might have played a major role in landslides. Matsumaru and Uzuoka (2016) [10] replicated the 2004 Niigata Chuetsu Earthquake to analyze the seepage strain of the embankment including the rainfall recorded before the earthquake to obtain the deformation which is greater than the case without rainfall. Vickneswaran and Ravichandran (2020) [11] used a numerical simulation with the acceleration of the 1940 El-Centro earthquake that attacked Imperial Valley, California to compare the effect of rainfall and erosion or rainfall and earthquake with a single hazard, the results show that dual hazards lead to greater slope movement and lower factor of safety.
After being proposed by Rocha in 1957 [12], the application of physical model experiments to the study of geotechnical problems has been widely accepted in the world thanks to its higher reliability and practicality compared with element experiments. Along with the development of technology, measuring devices for physical modeling experiments in the geotechnical field are constantly being researched and improved. Minardo et al., (2021) [13] used the distributed optical fiber sensors in flume tests with volcanic sand subjected to rainfall as well as in the monitoring of a coastal cliff to propose its application in the early warning system. Zhang et al., (2018) [14] presented the potential for measurement of deep deformation in landslide model tests of a flexible inclinometer probe, a design that includes gravity acceleration sensors. Similar to other topics, the failure of embankments subjected to post-earthquake rainfall has long been investigated by model experiments [7,15,16]. This fact raises the need to use model tests to study slope stability under the effect of post-rainfall earthquakes. Historically, earthquakes that occurred after typhoons are always among costliest disasters, such as Typhoon Hagibis in 2019, or Typhoon Jebi in combination with the 2018 Hokkaido Eastern Iburi earthquake. Through lessons learned from this double disaster that occurred in Hokkaido in 2018, Ishikawa et al., (2021) [17] proposed future research directions for geotechnical engineering in general and geo-disaster prevention, particularly the mitigation administration. One of these is the assessment of the liquefaction risk which needs to take into account the influence of rainfall and the rise of groundwater levels due to climate change. Moreover, rainfall-induced sedimentary disaster warning zones also need to be appropriately adjusted to the occurrence of earthquakes and the peculiarity of the material properties of crushable weathered volcanic soils.
Volcanic soil is distributed in many different countries around the world. In Hokkaido (Japan) it occupies about 40% of the land area. Due to its inexplicable performance and mechanical assessments that cannot be discussed in the same category as ordinary soils, volcanic soil is difficult to design, construct, and is known as problematic soil in the field of conventional engineering. Because of this, the study of the mechanical and physical properties of this soil has attracted the interest of many authors. Ng and Pang (2000) [18] investigated the soil–water characteristic curve of a completely decomposed volcanic soil in Hong Kong with different initial conditions by a conventional and a newly modified extractor. Hernandez et al., (2018) [19] used mineralogical characterization tests and thermogravimetric analysis and found the high irreversibility of the characteristics of compacted volcanic soils depending on the water content before compaction.
One of the existing problems with the coarse-grained volcanic soil of Hokkaido is that their fines content is easily altered by particle crushing when subjected to external factors such as consolidation, freeze-thawing, earthquakes, or compaction [20,21]. Although the fines content of soils has a significant impact on the mechanical properties and hydraulic conductivity of cohesionless soils, its influence is currently ignored in design procedures. In addition, the use of the fine grains content increment as a degree of crushability, proposed by Miura and Yagi (1997) [22], has been widely applied. Therefore, assessing the effect of fine particle content is also synonymous with evaluating the influence of crushability. For these reasons, the study of the effects of fine particle content is widely performed by elemental tests. Liu and Yang (2014) [23] investigated the small-strain shear modulus of volcanic soil from northeastern Japan and found that this parameter rises significantly when the particles smaller than 63 μm are removed from the original soils. Matsumura and Tatsuoka (2019) [24] demonstrated that the compacted volcanic soil’s dry density and the molding water content have a notable effect on its cyclic undrained strength; however, the trend of these relationships varies depending on the content of the fine particles. Among these studies, Hieu et al., (2017) [25] evaluated the internal erosion and piping phenomenon of volcanic soil with different fine grains contents under the same dry density condition. However, regulations for backfill or embankments in design practice often focus on compaction degree rather than dry density. To simulate this fact, three samples of volcanic coarse-grained soil with different fines content were prepared in this study with the same degree of compaction but three different void ratios. A series of 1 g model tests were conducted with these materials to clarify the influences of fines content on the mechanical behavior of embankments under rainfall and earthquake.
2. Materials and Methods
2.1. Test Materials
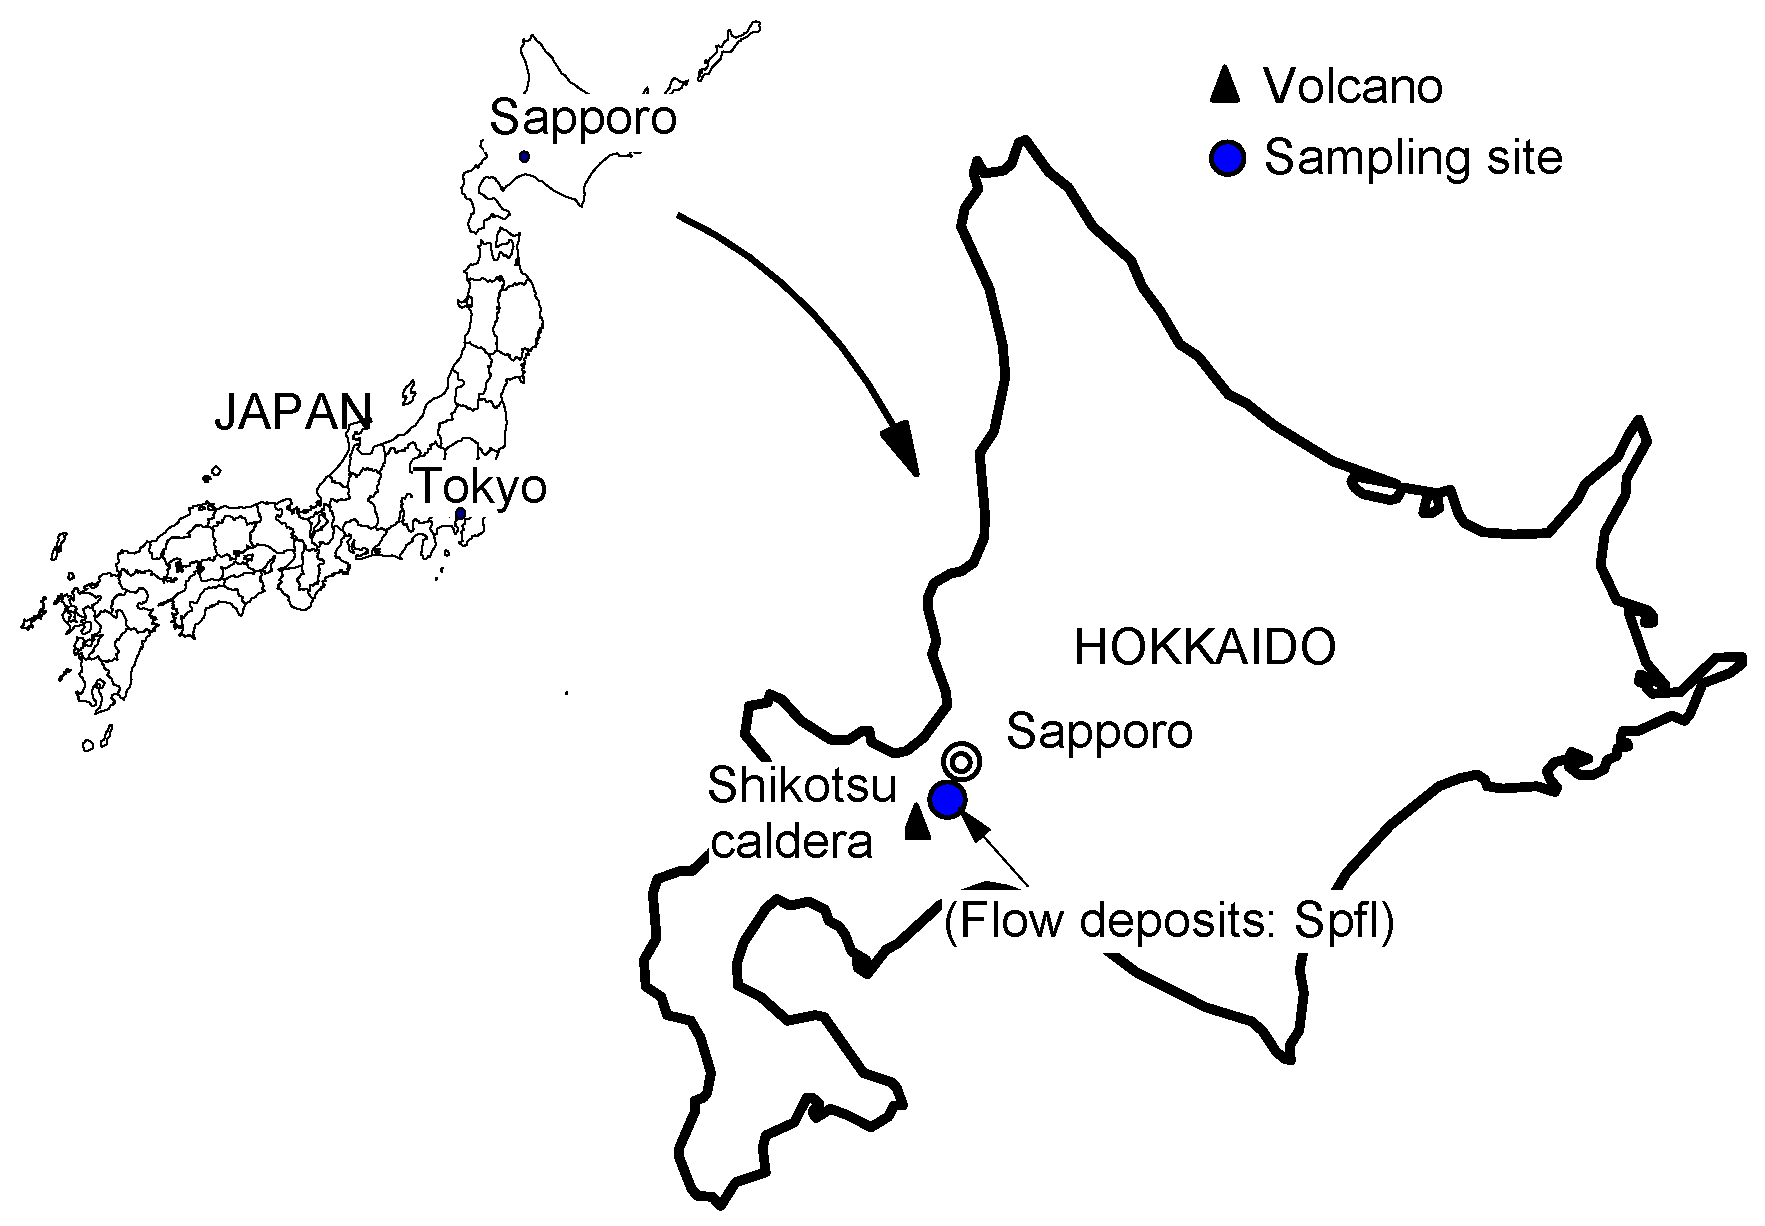
The original samples used in this study are Komaoka volcanic coarse-grained soils derived from Shikotsu caldera’s ejecta, Hokkaido, Japan (see Figure 1). This soil hereafter referred to as Spfl, is the same type of Shikotsu caldera liquefied by the 2018 Hokkaido Eastern Iburi Earthquake, as reported in [26]. The physical properties of Spfl in comparison with those of Toyoura sand are shown in Table 1. The natural water content of Spfl is ignored in this table because it is easily changed in the event of rainfall or earthquakes due to its loose deposition.
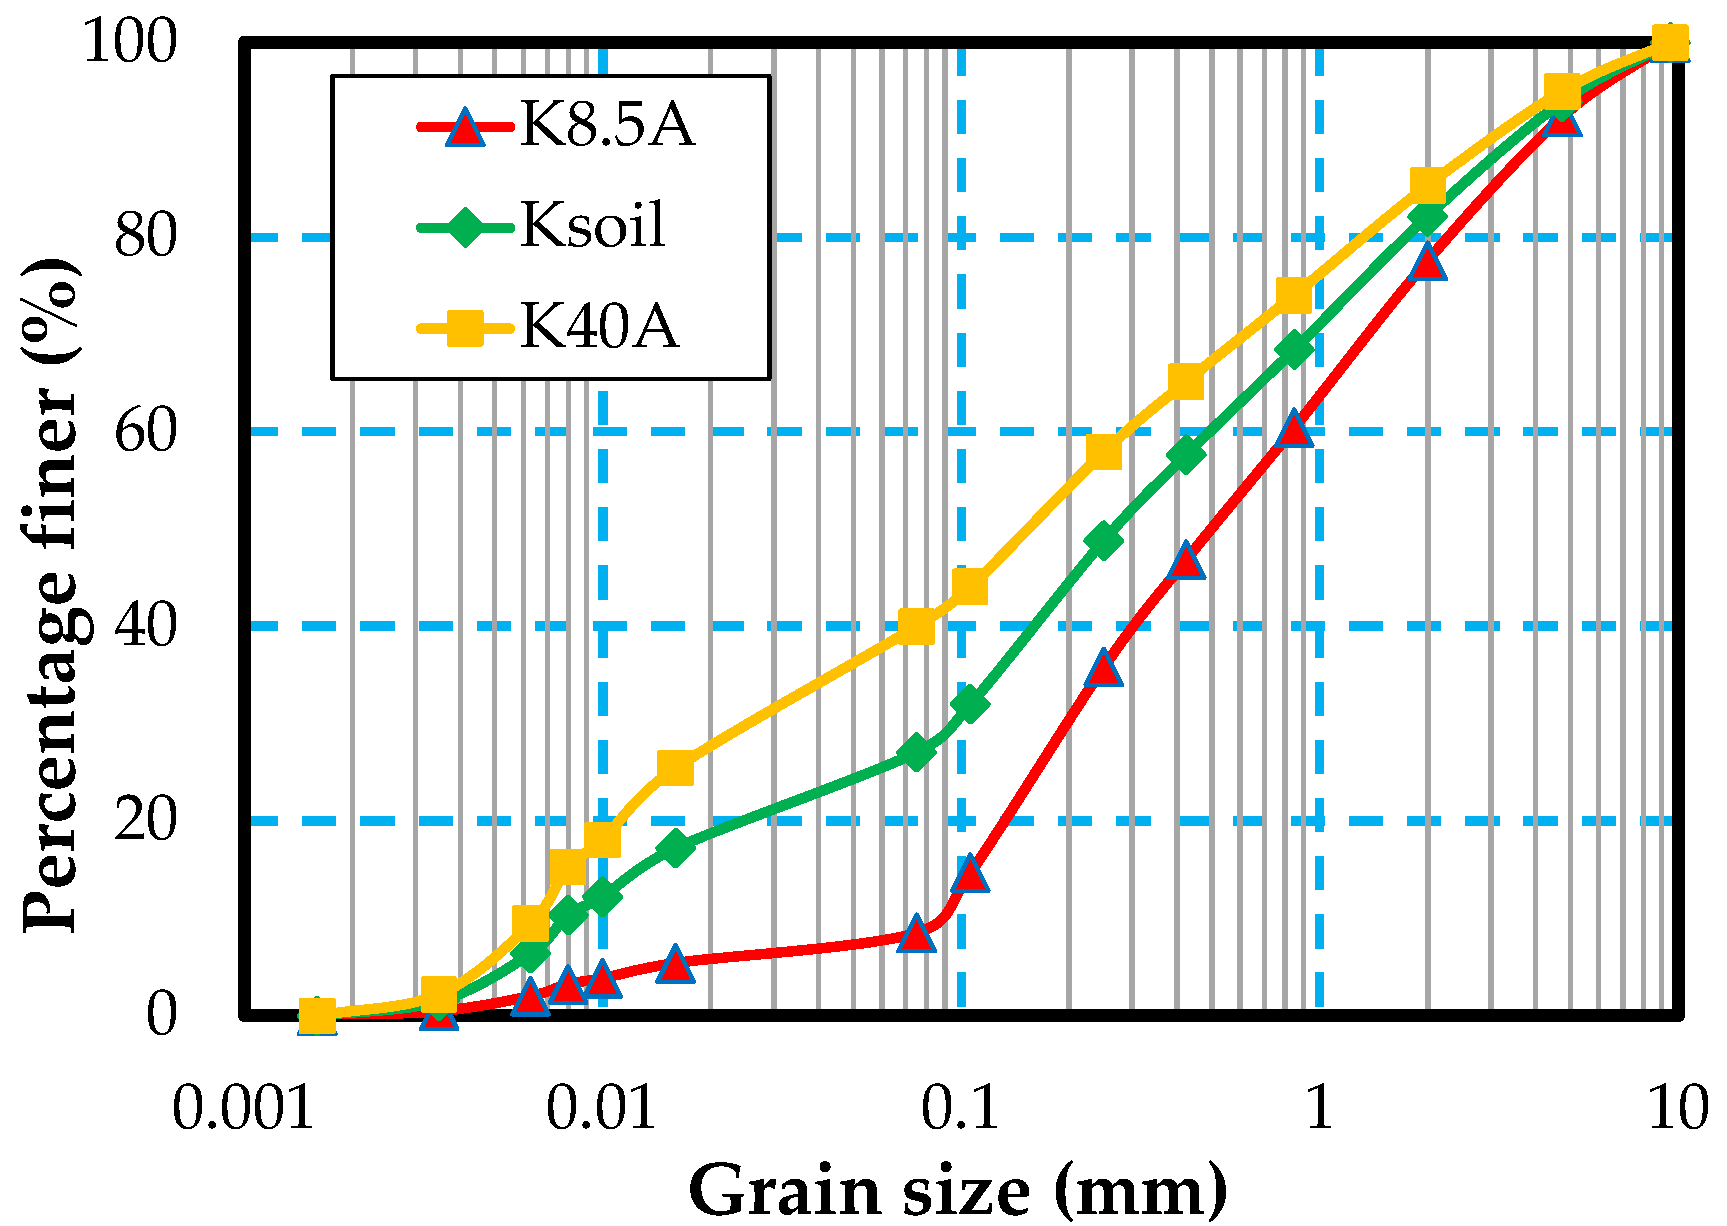
Similar to elemental experiments, the material sample Ksoil (Fc = 27%) in this study was obtained by removing particles larger than 9.5 mm from the Spfl to limit errors due to the scale effect. Then, the fine particle content of Ksoil was adjusted to produce samples K8.5A (Fc = 8.5%) and K40A (Fc = 40%). The grain size distribution, which was determined according to the procedure in JGS 0131-2009 [27] and the physical properties of the test samples are shown in Figure 2 and Table 2, respectively.
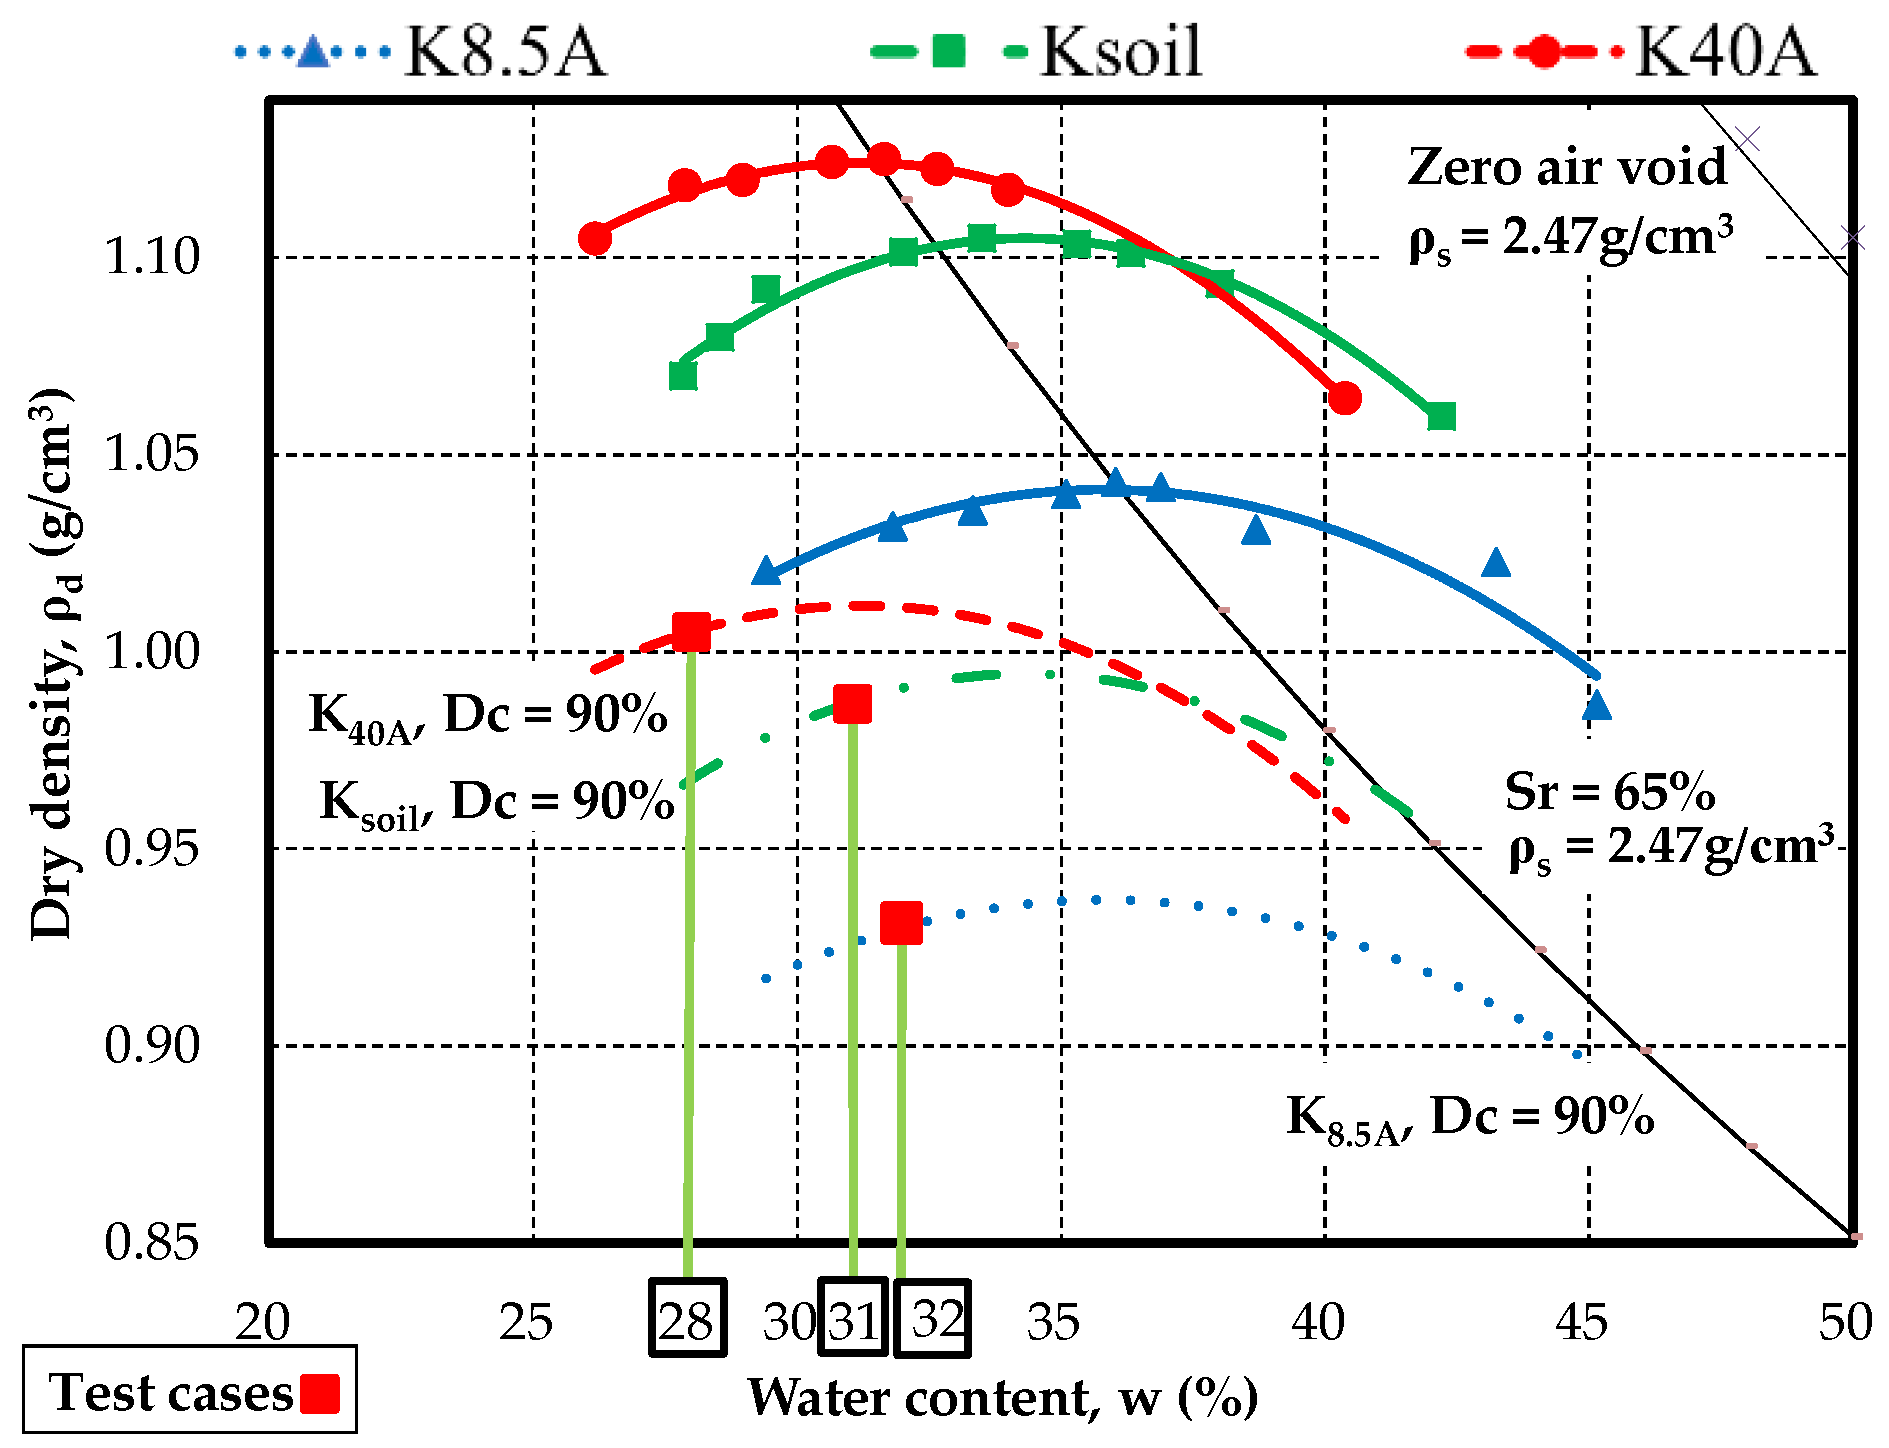
Since Komaoka soil particles are fragile and easily broken by compaction [6], the compaction curves of the test samples in this study are determined by a non-repetitive method (A-b method of JGS 0711-2009 [28]), as shown in Figure 3. Although the optimum water content is different, the peaks of these curves are all located near the line of Sr = 65%. As can be seen, the optimum saturation is almost similar with different fines content. In the figure, the test cases in this study are marked with the symbol ■, which lies on the dashed lines representing the compaction degree of Dc = 90%. Meanwhile, the initial water content ratio w0/wopt is equal to 0.9, representing the dryer side of the optimum water content.
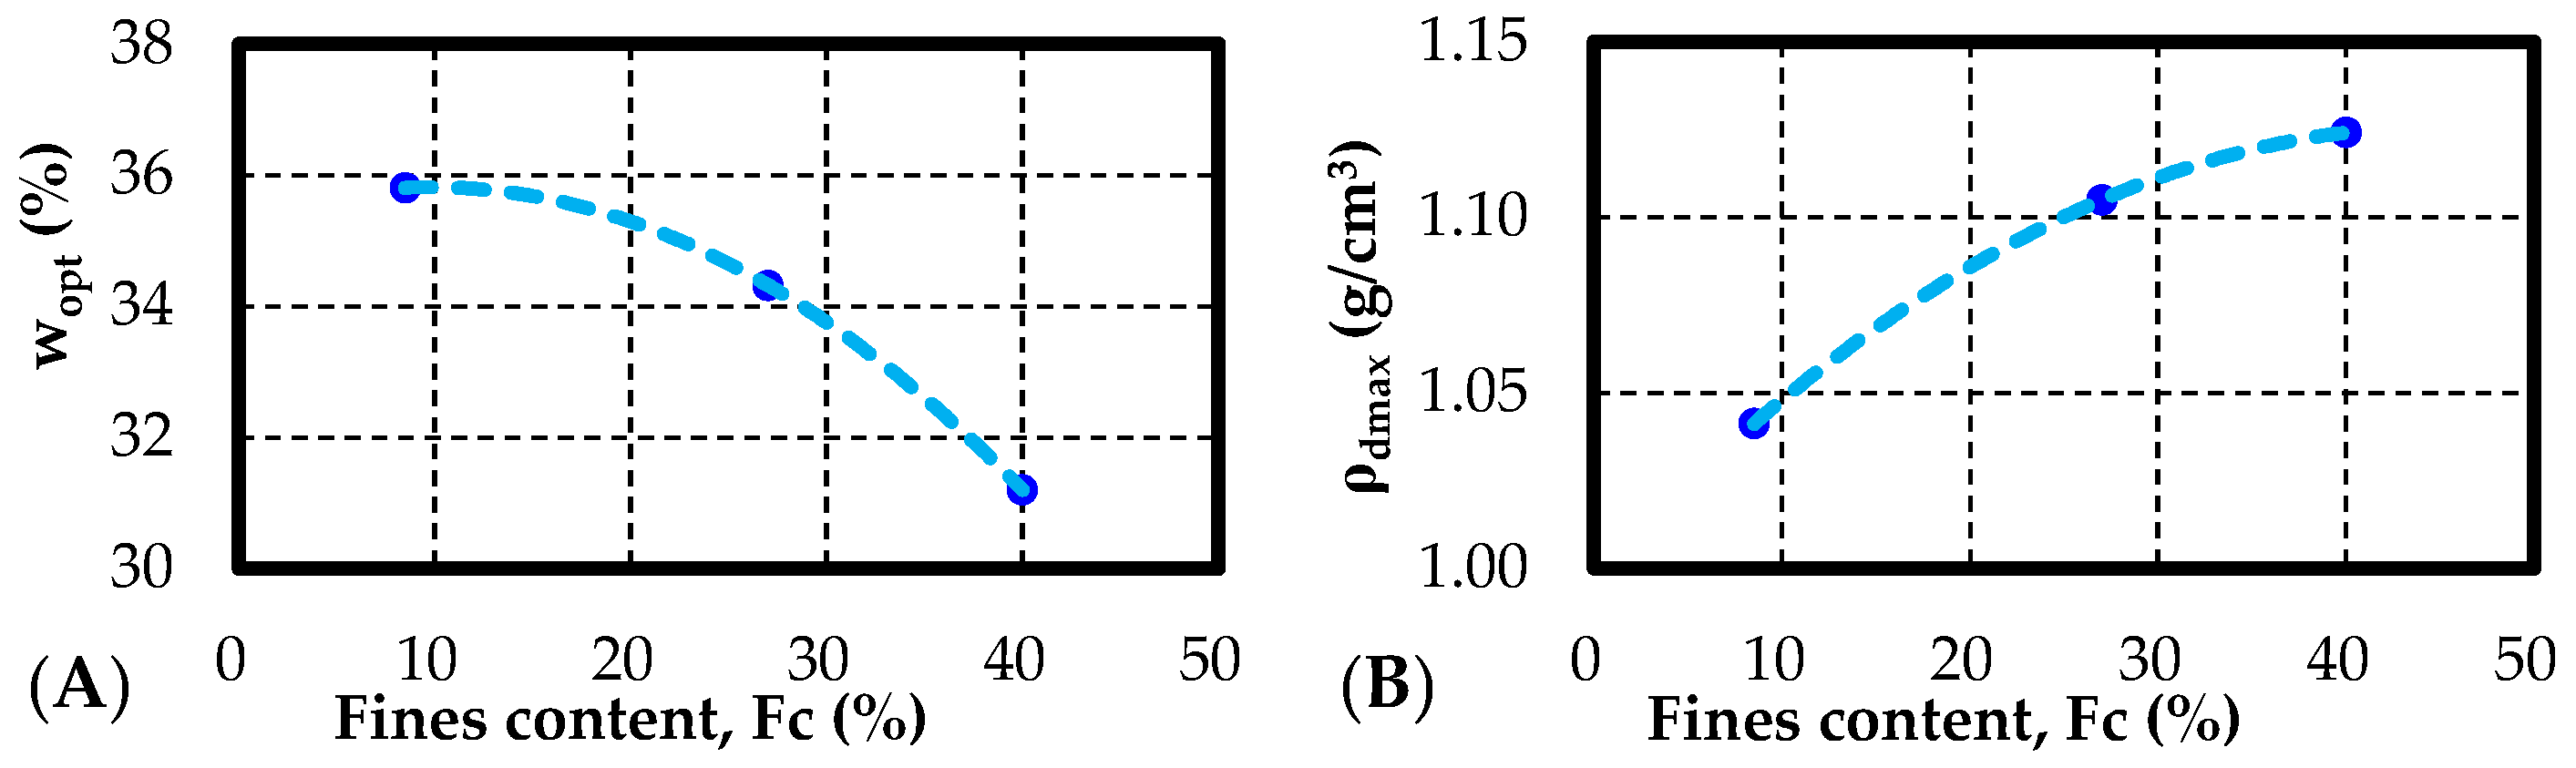
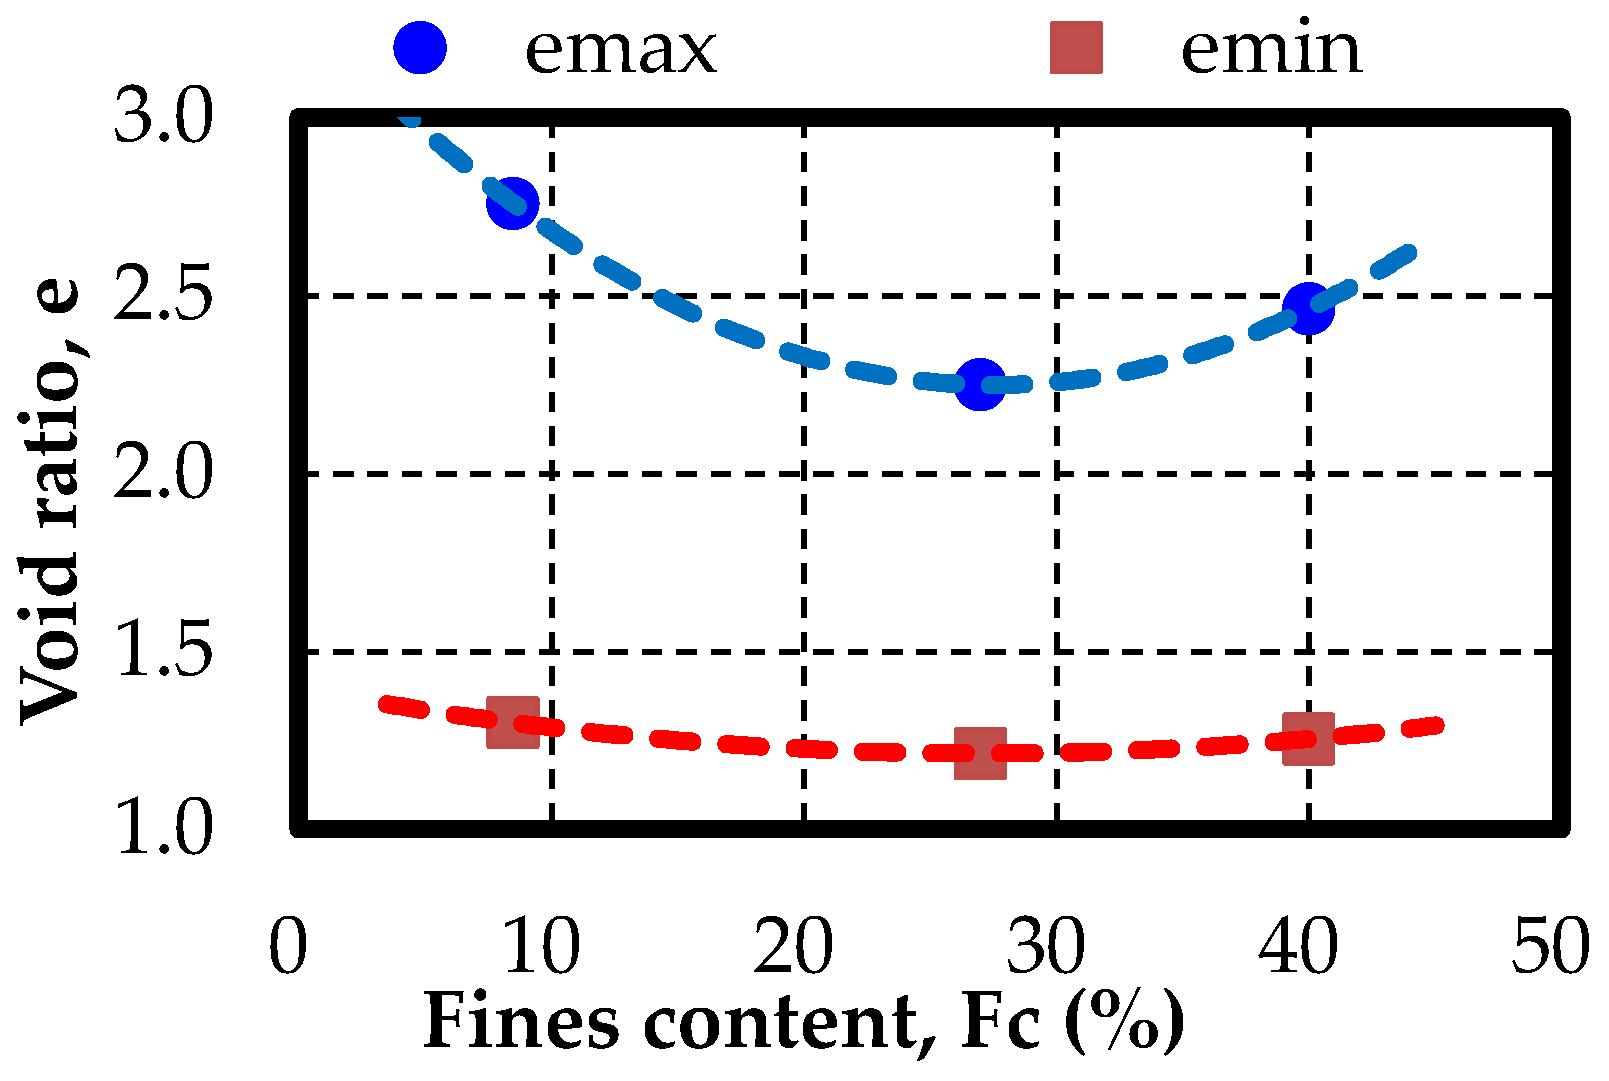
The influence of fine particles content on optimum water content and maximum dry density, obtained from these three compaction curves, is shown in Figure 4. As can be seen, an increase in fines content leads to an increase in the maximum dry density, but a decrease in optimum water content. Compaction by standard mortar or by roller in model tests is a process by which soil particles rearrange to reduce volume and increase density. Therefore, soils with a higher fines content more readily allow fine grains to enter the voids between larger particles, resulting in easier compaction and density increase. However, greater density also means less porosity and space to hold water. Figure 5 shows the maximum and minimum void ratio according to JGS 0161-2009 [29]. In the figure, the increase in fines content also leads to a decrease in the minimum void ratio. The compaction behavior of soil samples with different fines content shows a similar trend between dry conditions and optimum water content conditions. In contrast, the maximum void ratio in Figure 5 related to the loose condition shows that the Ksoil has a higher dry density or lower void ratio than K8.5A and K40A. In addition, the variation in emax was higher than that in emin, predicting that an increase in compaction degree reduces the effect of fine particle content.
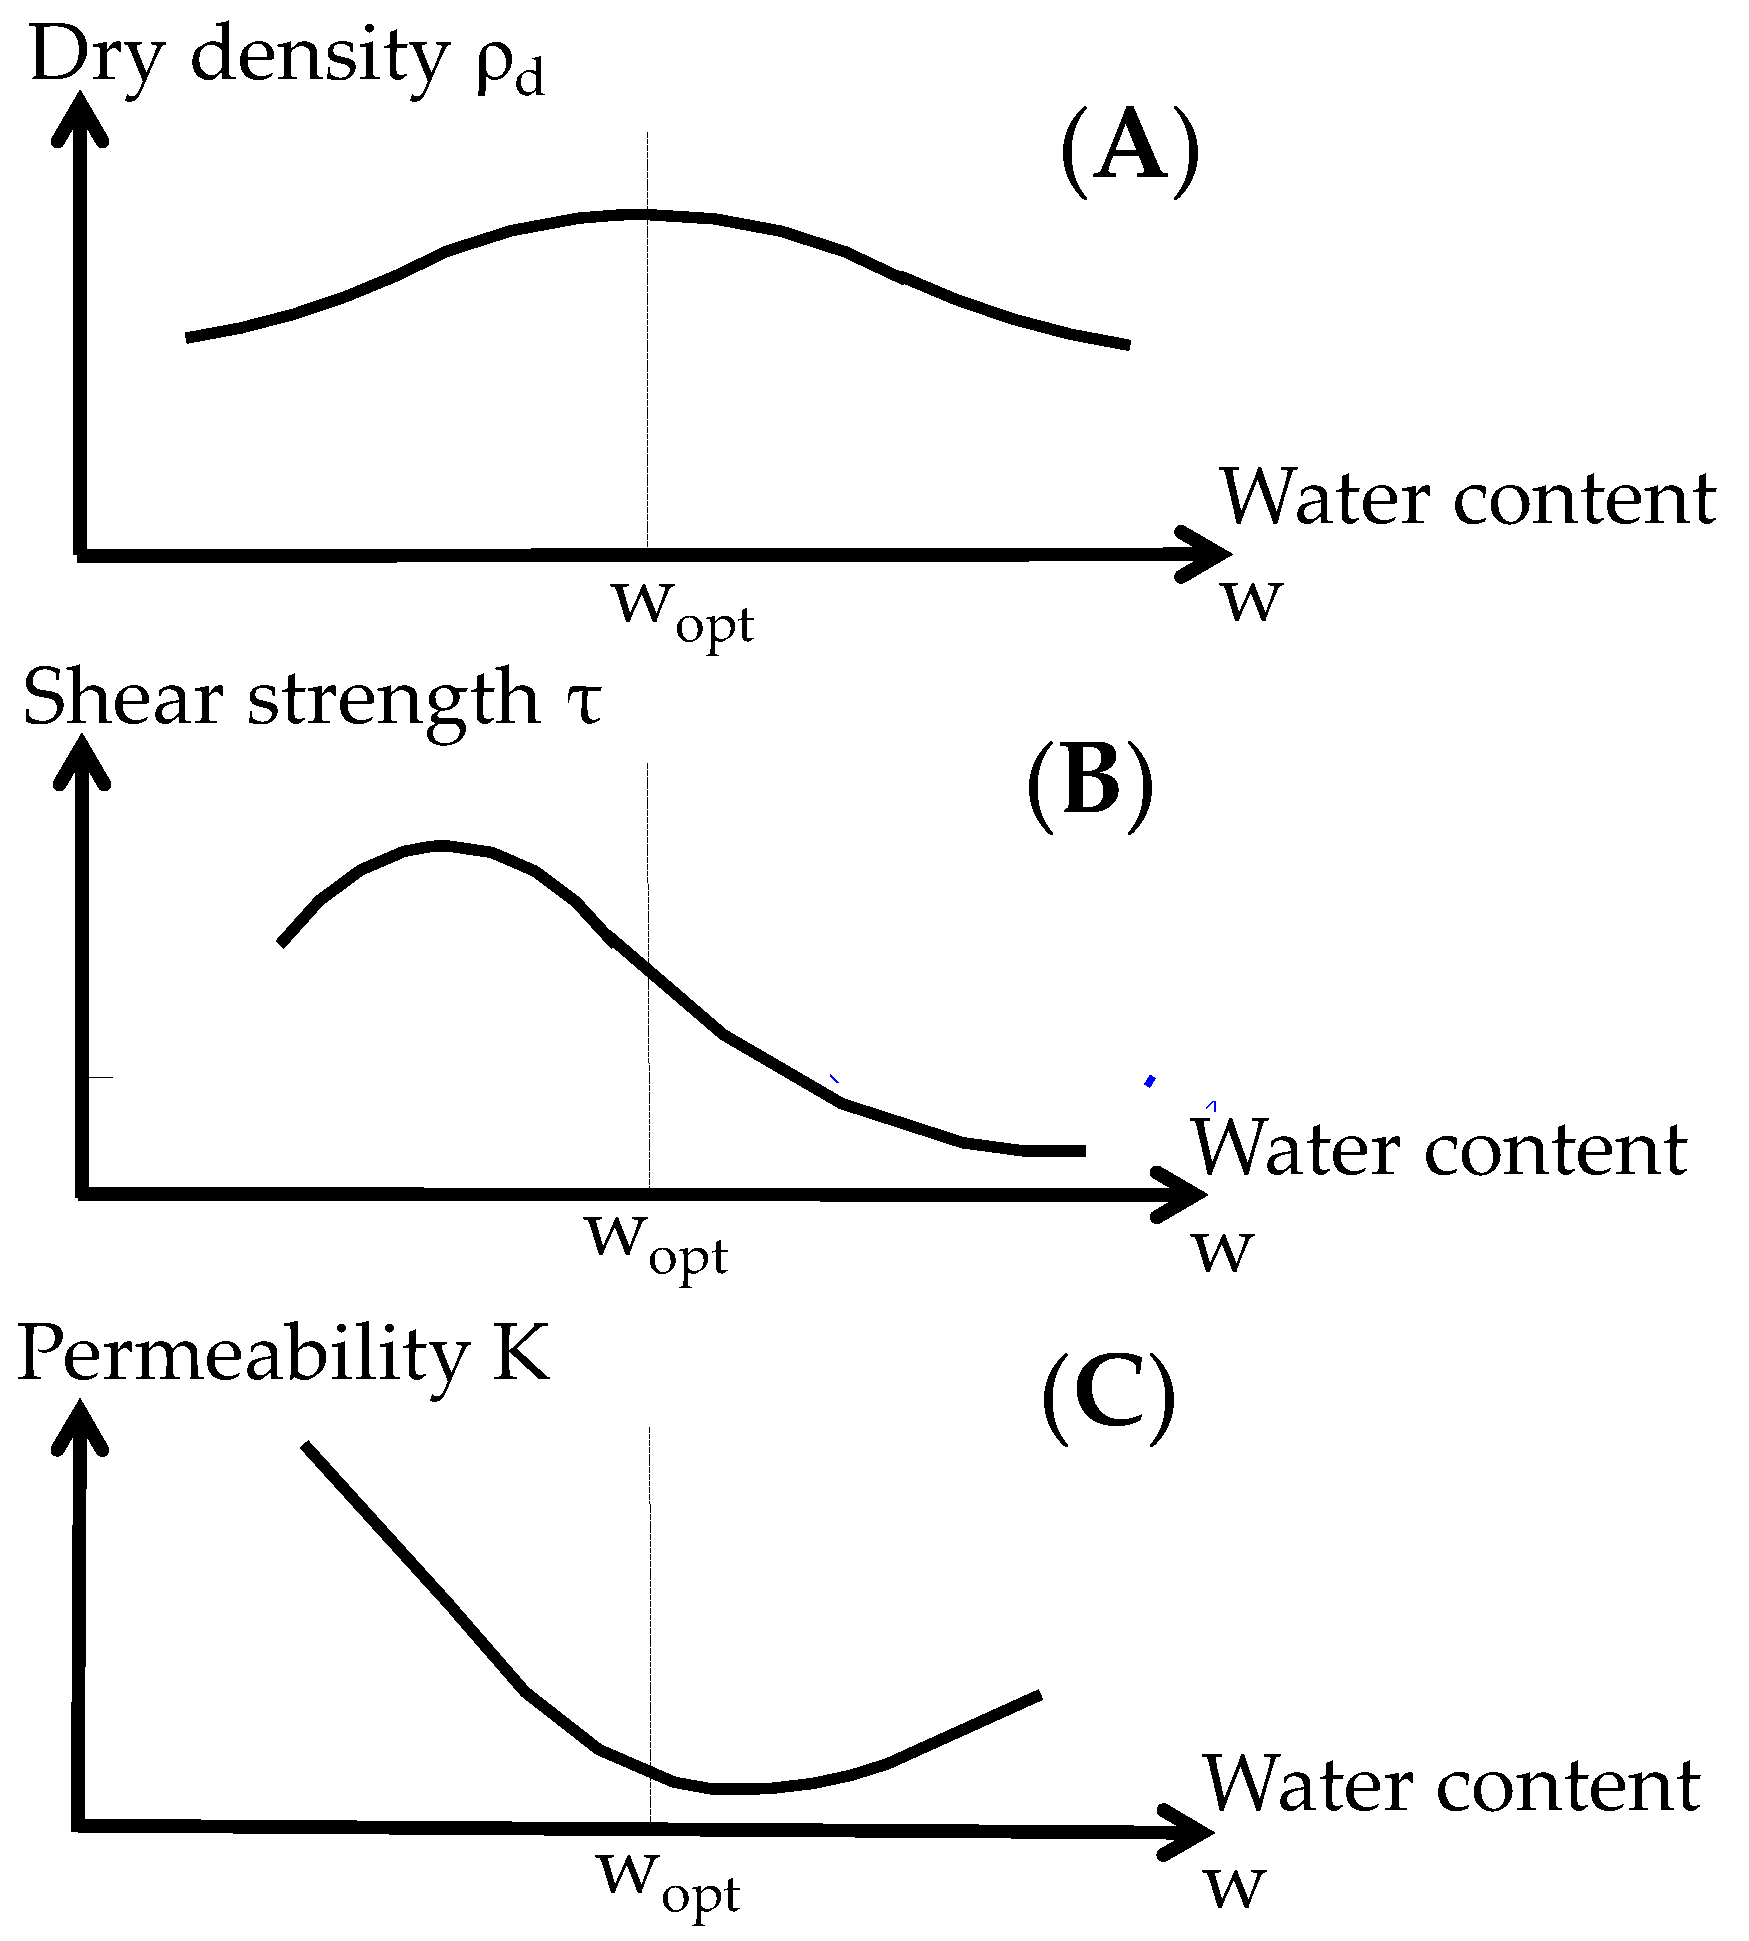
Hayashi and Kawamura (2019) [30] proposed the influence of water content on the dry density, shear strength, and permeability of volcanic soil, as shown in Figure 6. Comparing the behavior of compacted volcanic soils on the dry and wet sides of the optimum water content, the dry density is similar but the shear strength and permeability on the dry side show higher values. As soil moisture increases (e.g., due to rainfall), soil properties follow similar curves. The dry soil becomes wet and the permeability decreases until the soil is completely saturated. Therefore, experimenting with rainfall when the soil is on the dry and wet sides of the optimum water content leads to the same results. For the assessment to be general, the initial water content for the tests in this study was set at 0.9 wopt, which represents the dry side of the optimum water content.
Due to the size of the test apparatus, the influence of different fines contents on soil particle density cannot be taken into account by experiments. Therefore, the soil particle density ρs for K8.5A, Ksoil, and K40A in this study was calculated by the formula in Equation (1) and data proposed by Matsumura (2014) [31]:
where ρsi is the soil particle density of each grain size shown in Table 3 and xi is the content of this size in the soil sample.
ρs = Σρsixi
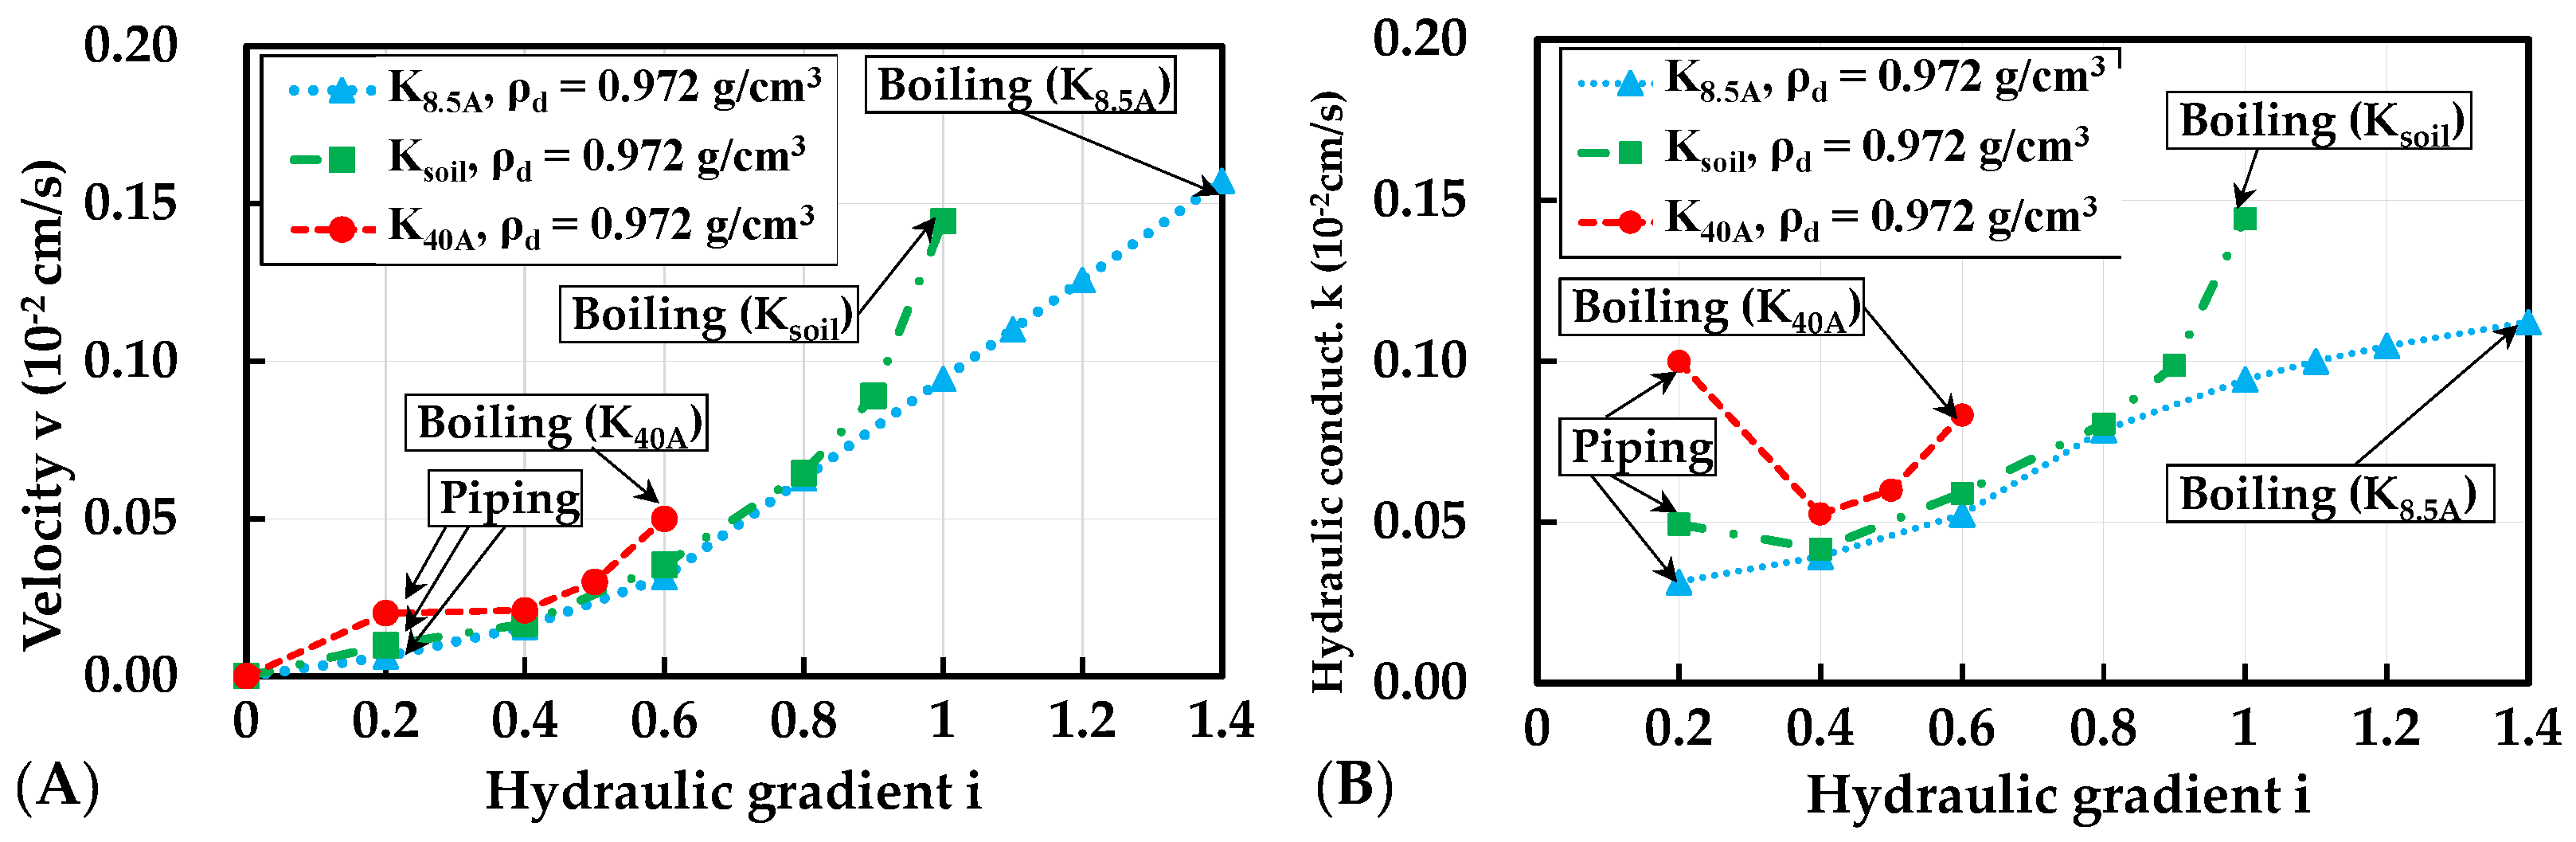
Dao (2018) [32] studied the piping and the boiling phenomenon of saturated Komaoka volcanic soil with different fine contents but the same dry density and water content at compaction, the results are shown in Figure 7. In the figure, the hydraulic behavior of these test samples was similar and indicated that the internal erosion according to Darcy’s law occurred in all samples. As can be seen in the relationship between hydraulic gradient i and velocity v (Figure 7A), the piping phenomenon occurred early at i = 0.2, and the critical hydraulic gradient corresponding to the occurrence of the boiling phenomenon was 1.4, 1, and 0.6 for K8.5A, Ksoil, and K40A, respectively. This implied that the permeability of compacted volcanic soil is affected by the increase in fine grains. Furthermore, the difference in hydraulic conductivity of K8.5A, Ksoil, and K40A as shown in Figure 7B was explained by the fine grains clogging to coarser particles and then being released. The tendency of water to flow through the pore network and wash out the fine particles was particularly obvious in samples with high fine content such as K40A. The loss of fine particles increased permeability and led to internal instability of the soil, so the boiling phenomenon of sample K40A was recorded with the smallest hydraulic gradient.
2.2. Test Apparatus and Procedures
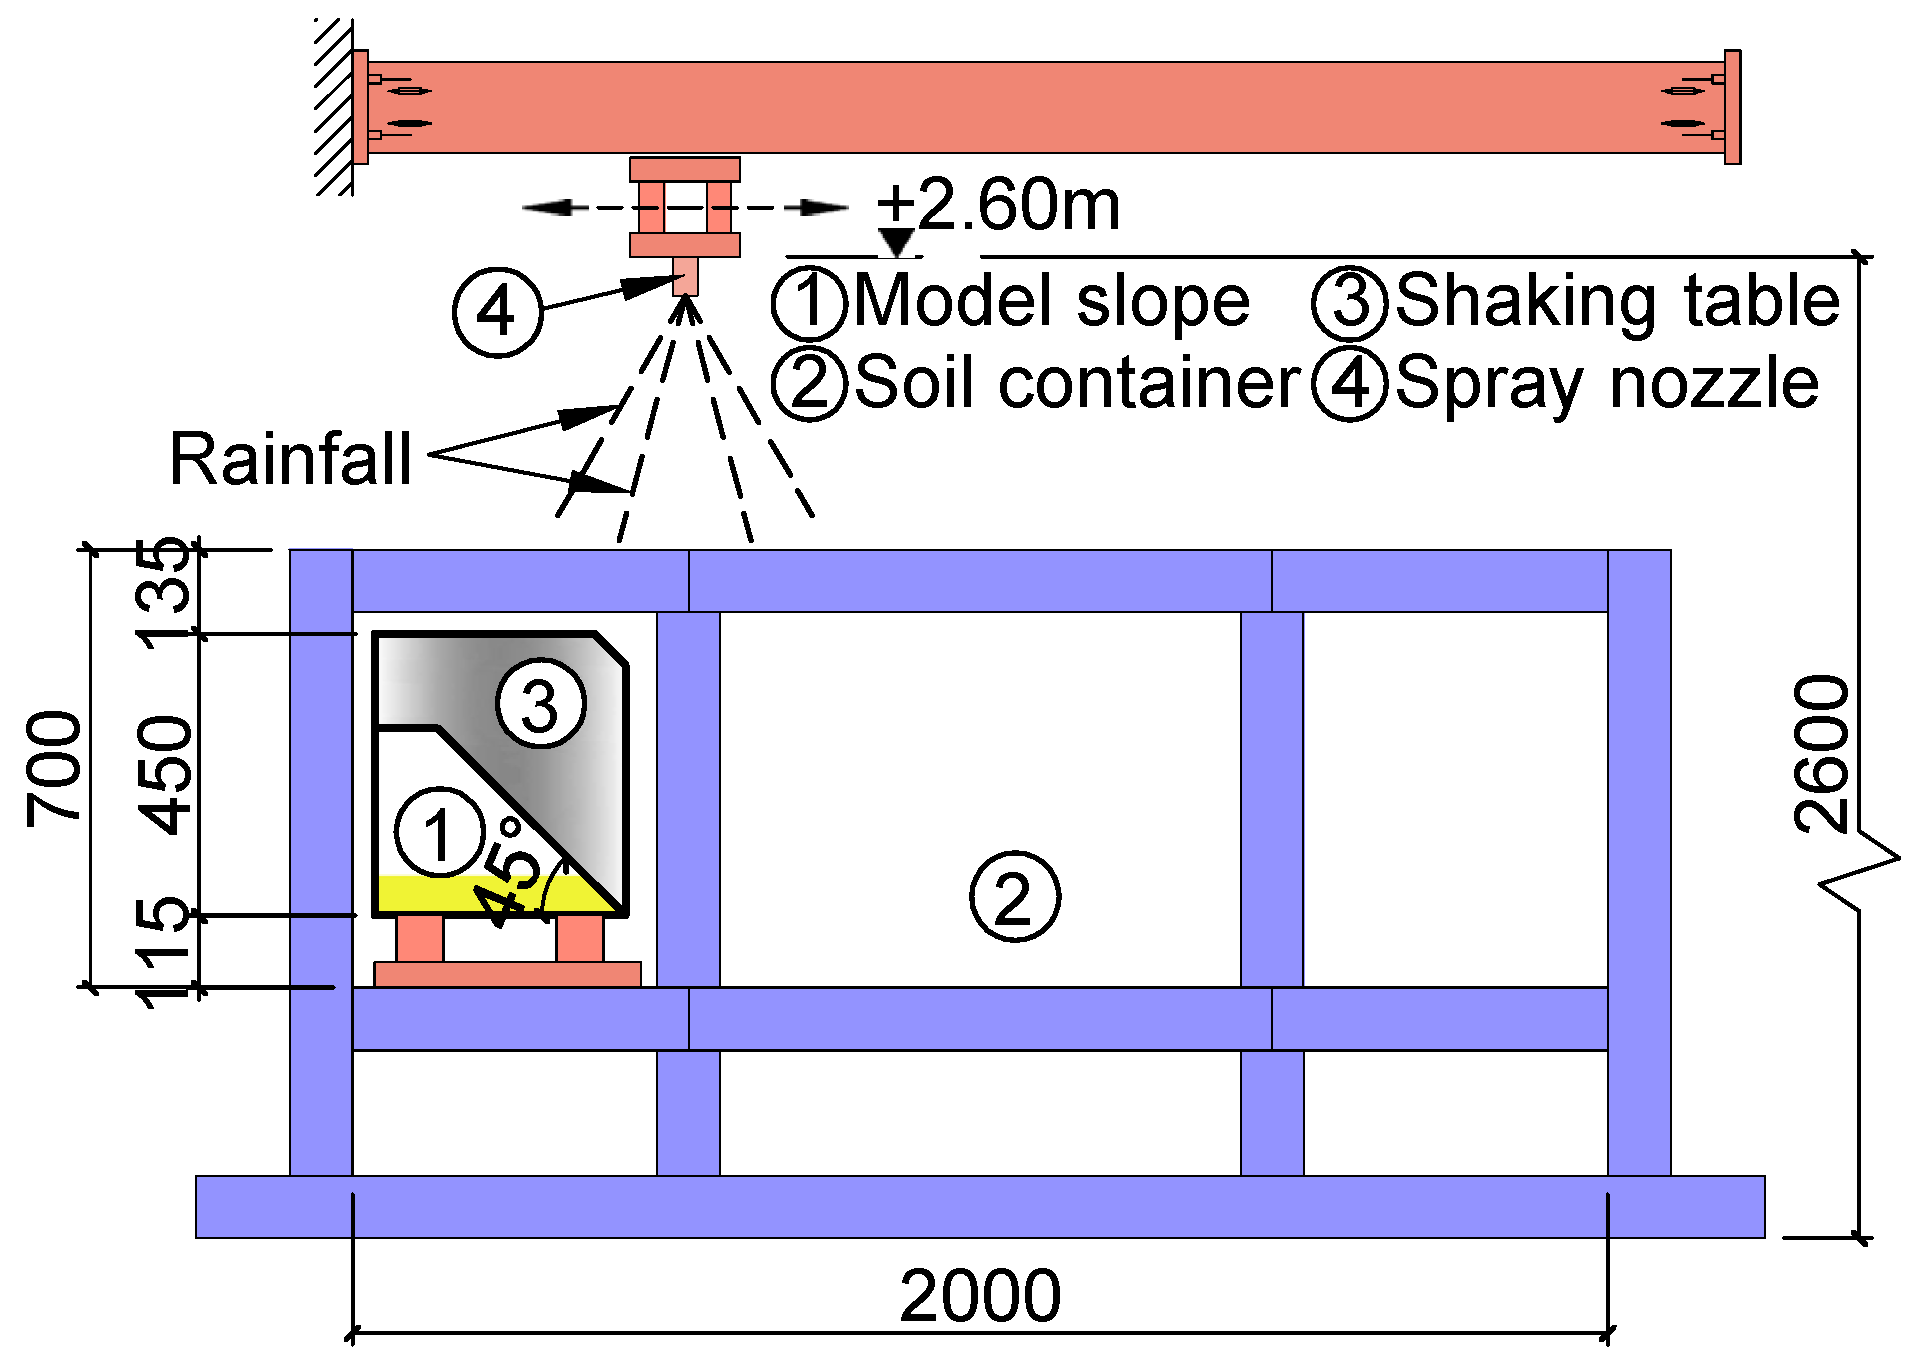
Figure 8 shows the overall view of the test apparatus used in this study to investigate the behavior of embankments subjected to rainfall and earthquake [2,3,4,5,6,7,8]. The internal dimensions of the model soil tank are 2000 mm long, 700 mm high, and 600 mm wide. The side of this tank is fitted with a 20 mm thick tempered glass to allow monitoring of the deformation of the slope during the test. In the soil tank, the model embankment was prepared in a shaking table with dimensions of 400 mm in length, 450 mm in height, and 580 mm in width. Friction on the sides of this table is eliminated by applying grease. The computer controls the one-dimensional vibration loading device attached under the shaking table through a hydraulic cylinder to apply a regular wave (sinusoidal form) with an amplitude of ±50 mm, a maximum load of 150 kg, and a frequency of 0.05–5.0 Hz. The support system for the spray nozzle can be adjusted in position and height so that the entire slope receives rainwater, and the rainfall intensity is managed by the valve system. Two digital cameras were used to record the phenomena on the front and side of the slope.
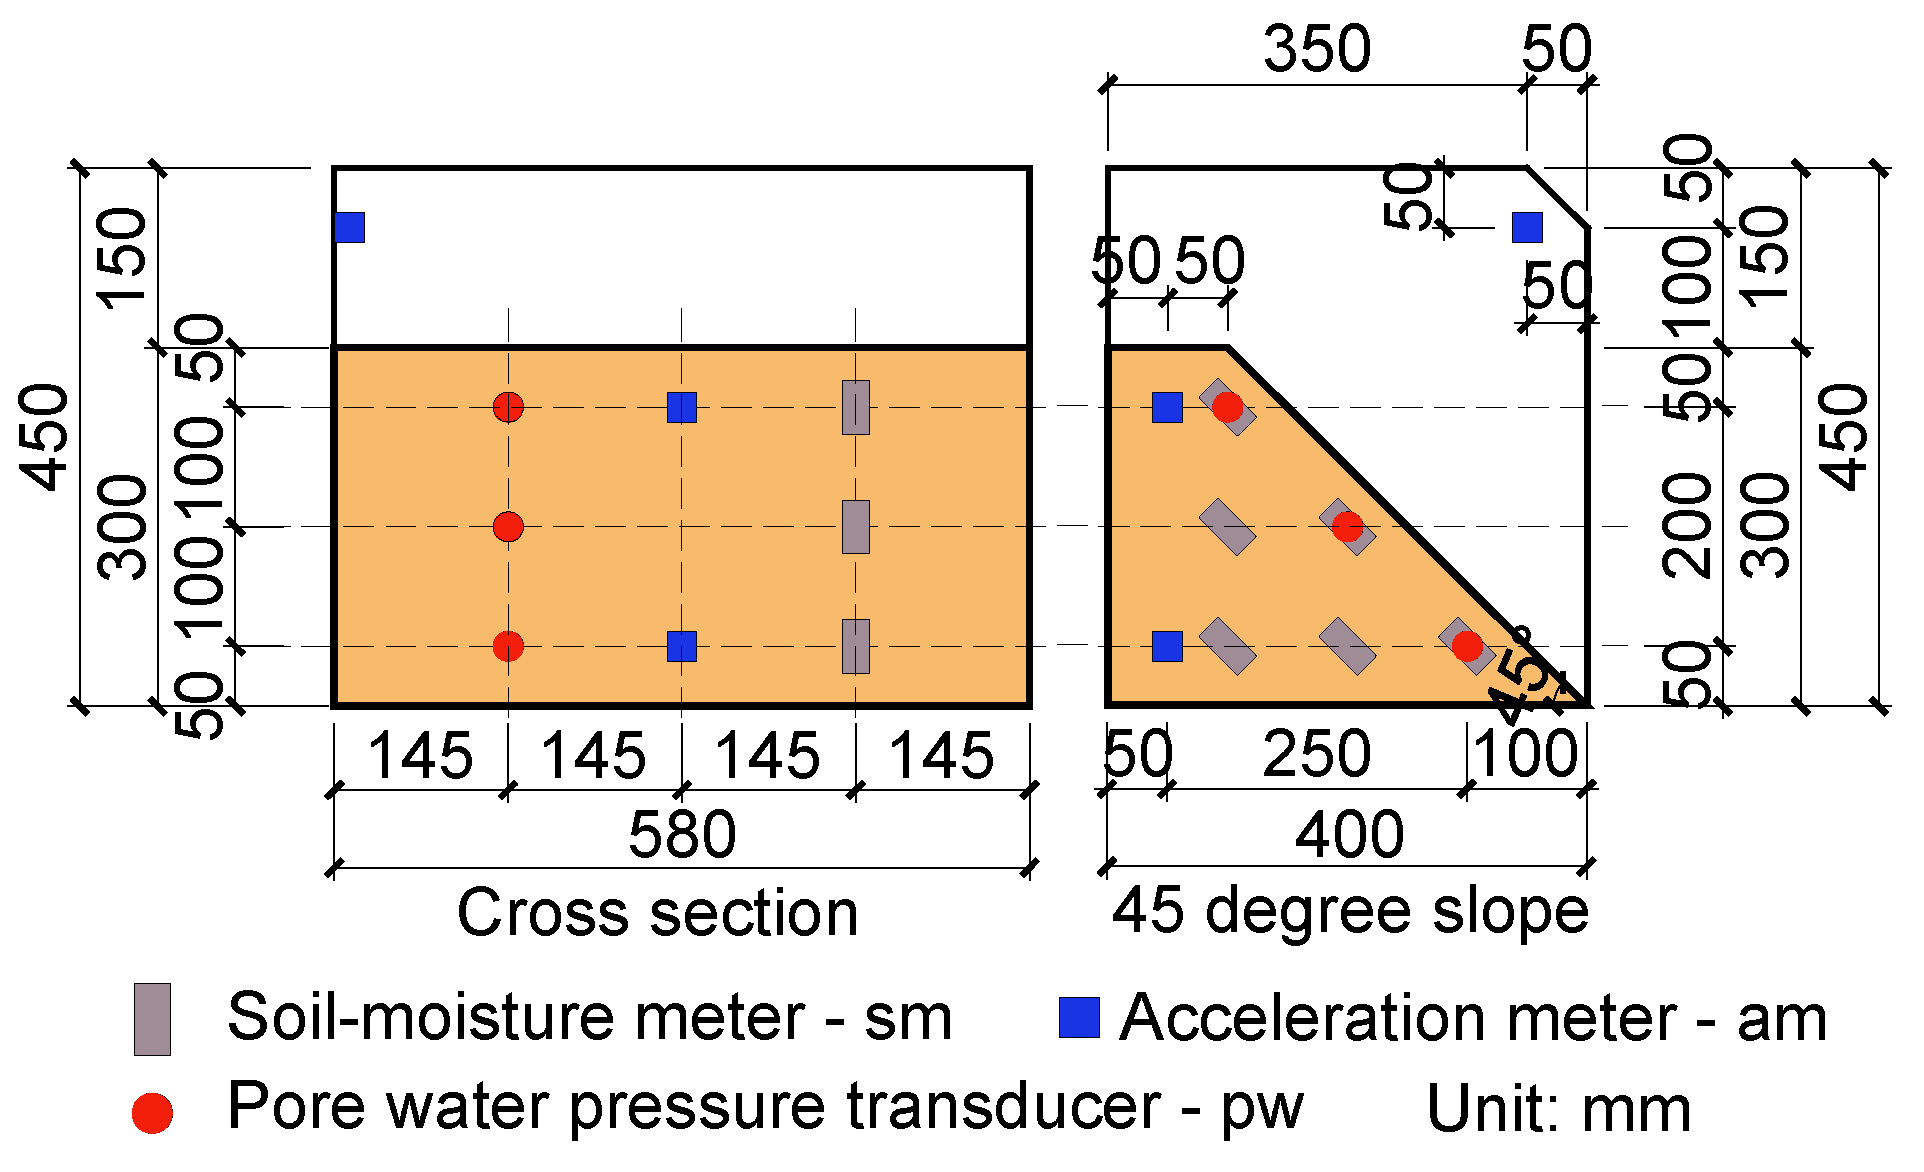
The shape and dimensions of the model embankments with the locations of measurement equipment are depicted in Figure 9. In this study, three acceleration meters, three pore water pressure transducers, and six dielectric constant type soil moisture meters were used. The types of measuring devices used in this study are listed below. The pore water pressure transducer is a small-sized gauge for model experiments manufactured by Kyowa named BPR-A-50KPS with a maximum capacity of 50 kPa, specifications are shown in [33]. Through the soil–water characteristic curve of compacted Spfl, Kawamura et al., (2021) [8] demonstrated that the influence of suction on the mechanical behavior of this soil can be ignored when the saturation is greater than 60% along the wetting path. Thus, the use of BPR-A-50KPS to monitor pore water pressure in the post-rainfall earthquake experiments with high soil moisture conditions in this study is completely appropriate. The soil moisture meter is the volumetric water content sensor ECH2O EC-5 from the METER Group. The specifications and the cited publications of ECH2O EC-5 are shown in [34,35]. The measured volumetric water content combined with the above-mentioned dry density ρd and soil particle density ρs were used to calculate the water content and saturation degree shown in the following sections. The acceleration meter is the oil damping type waterproof acceleration transducer named ASW-2A made by Kyowa with a maximum capacity of ±19.61 m/s2 (±2G), as described in [36]. Shear strain computed from displacements of six kite strings (as shown in Figure 10), acceleration, pore water pressure, and saturation degree were the parameters for understanding the slope failure mechanism. Table 4 summarizes the experimental conditions in this work.
Kawamura and Miura (2013) [4] monitored the failure phenomenon of the model embankments through the PIV method and found that the saturation reached its peak value when the shear strain was 4–6%, independent of the differences in soil material, rainfall intensity, slope angle, and permeability of the bottom layer; after that, the embankment collapsed. Therefore, the moment when the shear strain γ reaches 6% is also defined as the slope failure in this study.
Rocha (1957) [12], in his first steps in considering the feasibility of applying models to improve understanding of geotechnical problems, implied that it was possible to use the prototype cohesionless soil itself for the model tests. Kawamura et al., (2021) [8] demonstrated the feasibility of using Spfl soil in the prototype as the material of model experiments by the results of the consolidated undrained triaxial tests for this soil (the internal friction angle is 38° and the cohesion is 0 kN/m2). The presented stress–strain relationship also showed that peak points roughly lie on the same hyperbola in the graph normalized by the square root of the effective confining pressure. Therefore, in the case of this study where Komaoka volcanic soils are used as model materials and the stress–strain relationship follows a hyperbolic curve, the similarity laws used for the 1 g model experiments with the shaking table provided by [8] as shown in Table 5 can be applied.
The slope preparation method is described as follows: The amount of water was calculated to achieve the required water content and then mixed with the dry soil material. Two aluminum sashes were installed on either side to provide the slope a defined shape and angle. The sample was then sprinkled and settled uniformly to be homogeneous. For each 7 cm thick layer, a roller with a mass of 13 kg was used to compact three times to ensure dry density (degree of compaction) for the whole slope. This process was continued until the embankment reached the specified height, then excess soil was removed by sliding the iron plate with a sharp cutting edge on the aluminum sashes.
The procedure for post-rainfall earthquake experiments used in this study is presented as follows:
- Adjust the type, position, and water pressure of the spray nozzle installed at height G.L. + 2.6 m to obtain the rainfall intensity at the specified value (100 mm/h in this study). The acceleration is also set at 280 m/s2 as specified in Table 4;
- After the slope model was completed, spray water from the spray nozzle shown in Figure 8 and simultaneously start measuring the pore water pressure transducers, soil moisture meters, and acceleration meters;
- When the amount of rainfall reaches a predetermined value, finish the rainfall test and carry out the seismic loading test.
3. Results and Analysis
Similar to other research by model experiments, the variation in water content in soils during rainfall and earthquake tests in this study was depicted by saturation ratio Sr/Sr0, which is the saturation degree Sr normalized by its initial value Sr0. Along with that, the reduction in shear strength of the embankment was evaluated through the pore water pressure ratio Δu/σv′. In this, the change in pore water pressure Δu was normalized by the effective overburden pressure σv′ (calculated with the measured water content).
3.1. Effect of Fines Content on Slope Stability during Rainfall
First, rainfall-only experiments were conducted with a rainfall duration of 30 min for all three samples to find out the rainfall-induced failure time. The influence of fine particle content on the mechanical behavior of volcanic embankments during rainfall is discussed below.
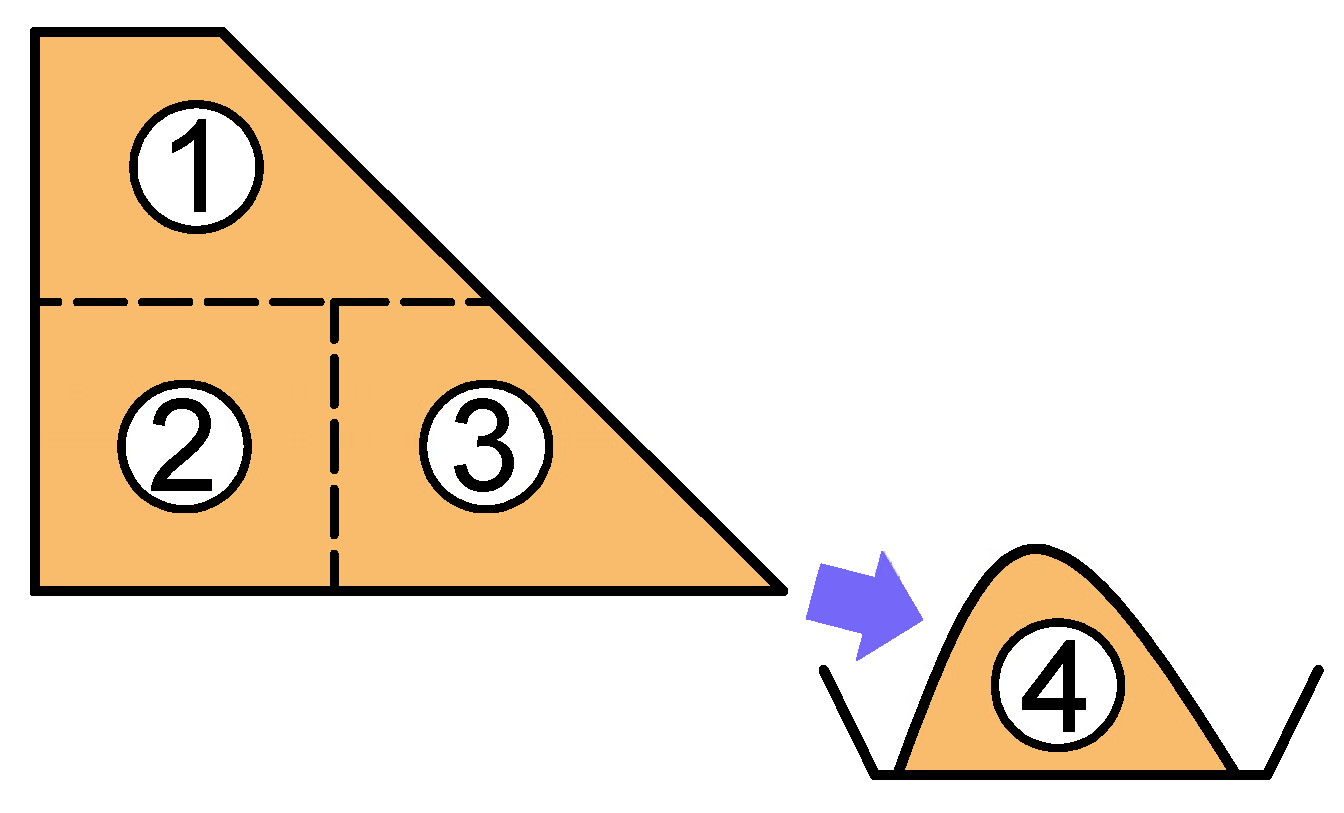
Kawamura and Miura (2014) [6] found that the increment of finer content in the Komaoka volcanic soil after rainfall experiments was nearly zero, implying that there is almost no particle breakage due to rainfall for this soil. However, because of their light weight and no cohesion, the fine particles easily move in the pores between the coarse particles under the effect of rainwater. In this study, an attempt to understand the trend of this migration was made by examining the grain size distribution with sieving tests in different parts of the embankments (Areas 1, 2, 3) and in the washed-out part (Area 4), as shown in Figure 11. The results shown in Table 6 imply that the fine particles in all three types of soil tend to move from Area 1 to Area 2 and 3 because of gravity and rainfall. It can also be seen that the fine particle content of Area 3 was greater than those of Area 2 in all three cases even though the direction of rainwater is towards Area 2 (shown by the movement direction of the wetting front in the next section). This may be due to fine particles moving with rainwater due to the piping phenomenon in the saturation region from Area 1 to Area 3. When the secondary failure had not yet occurred, the soil in Area 4, which was generated by runoff, consisted mainly of fine particles.
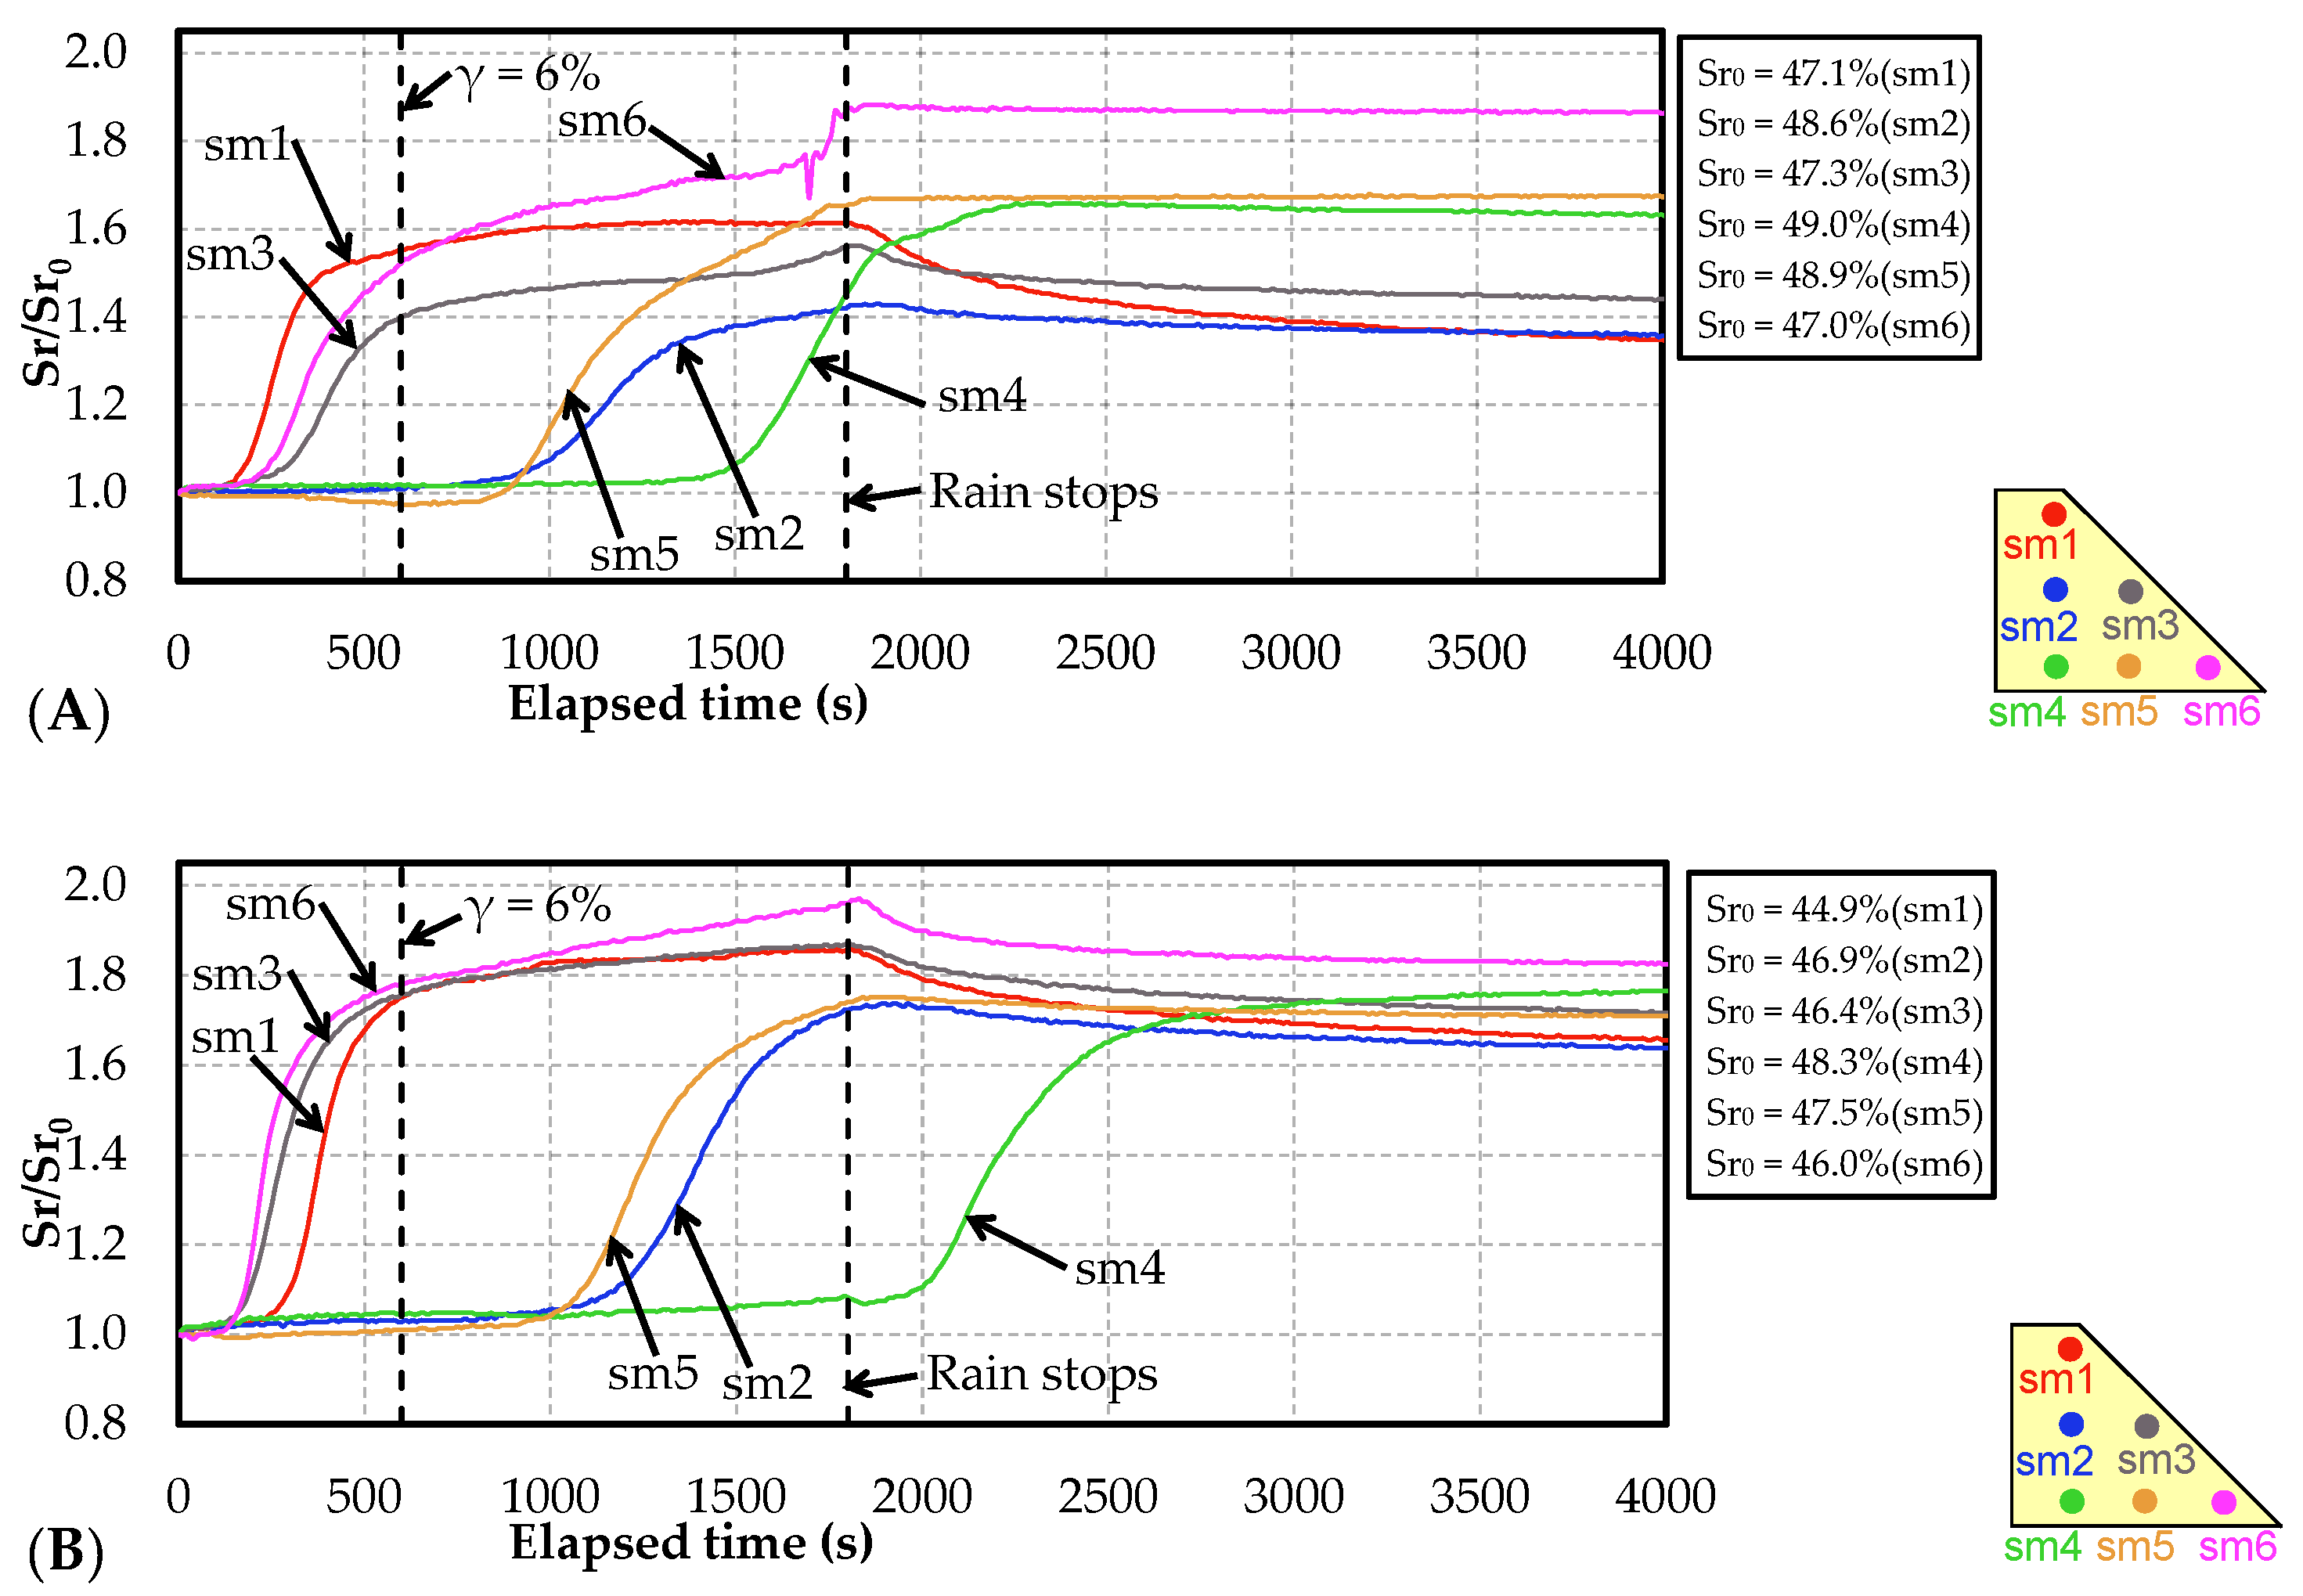
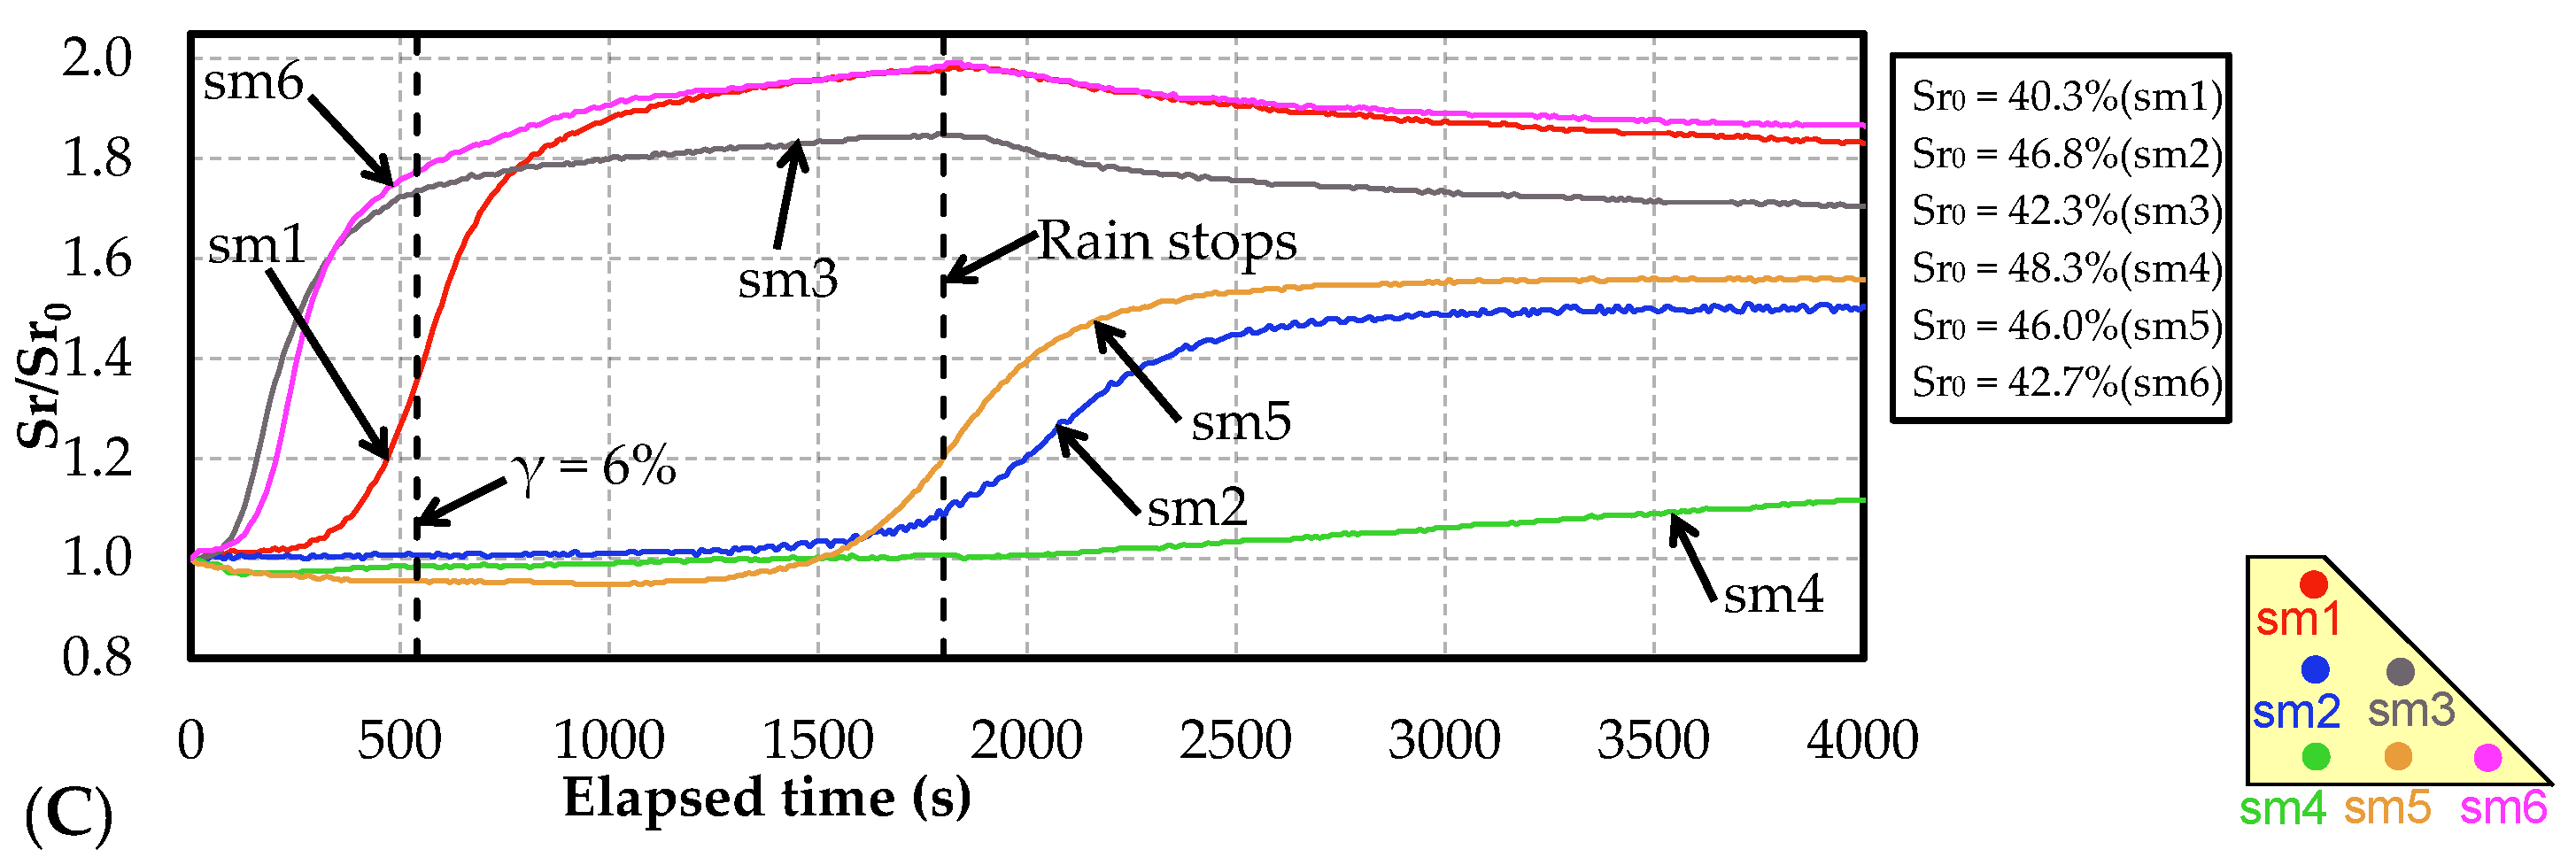
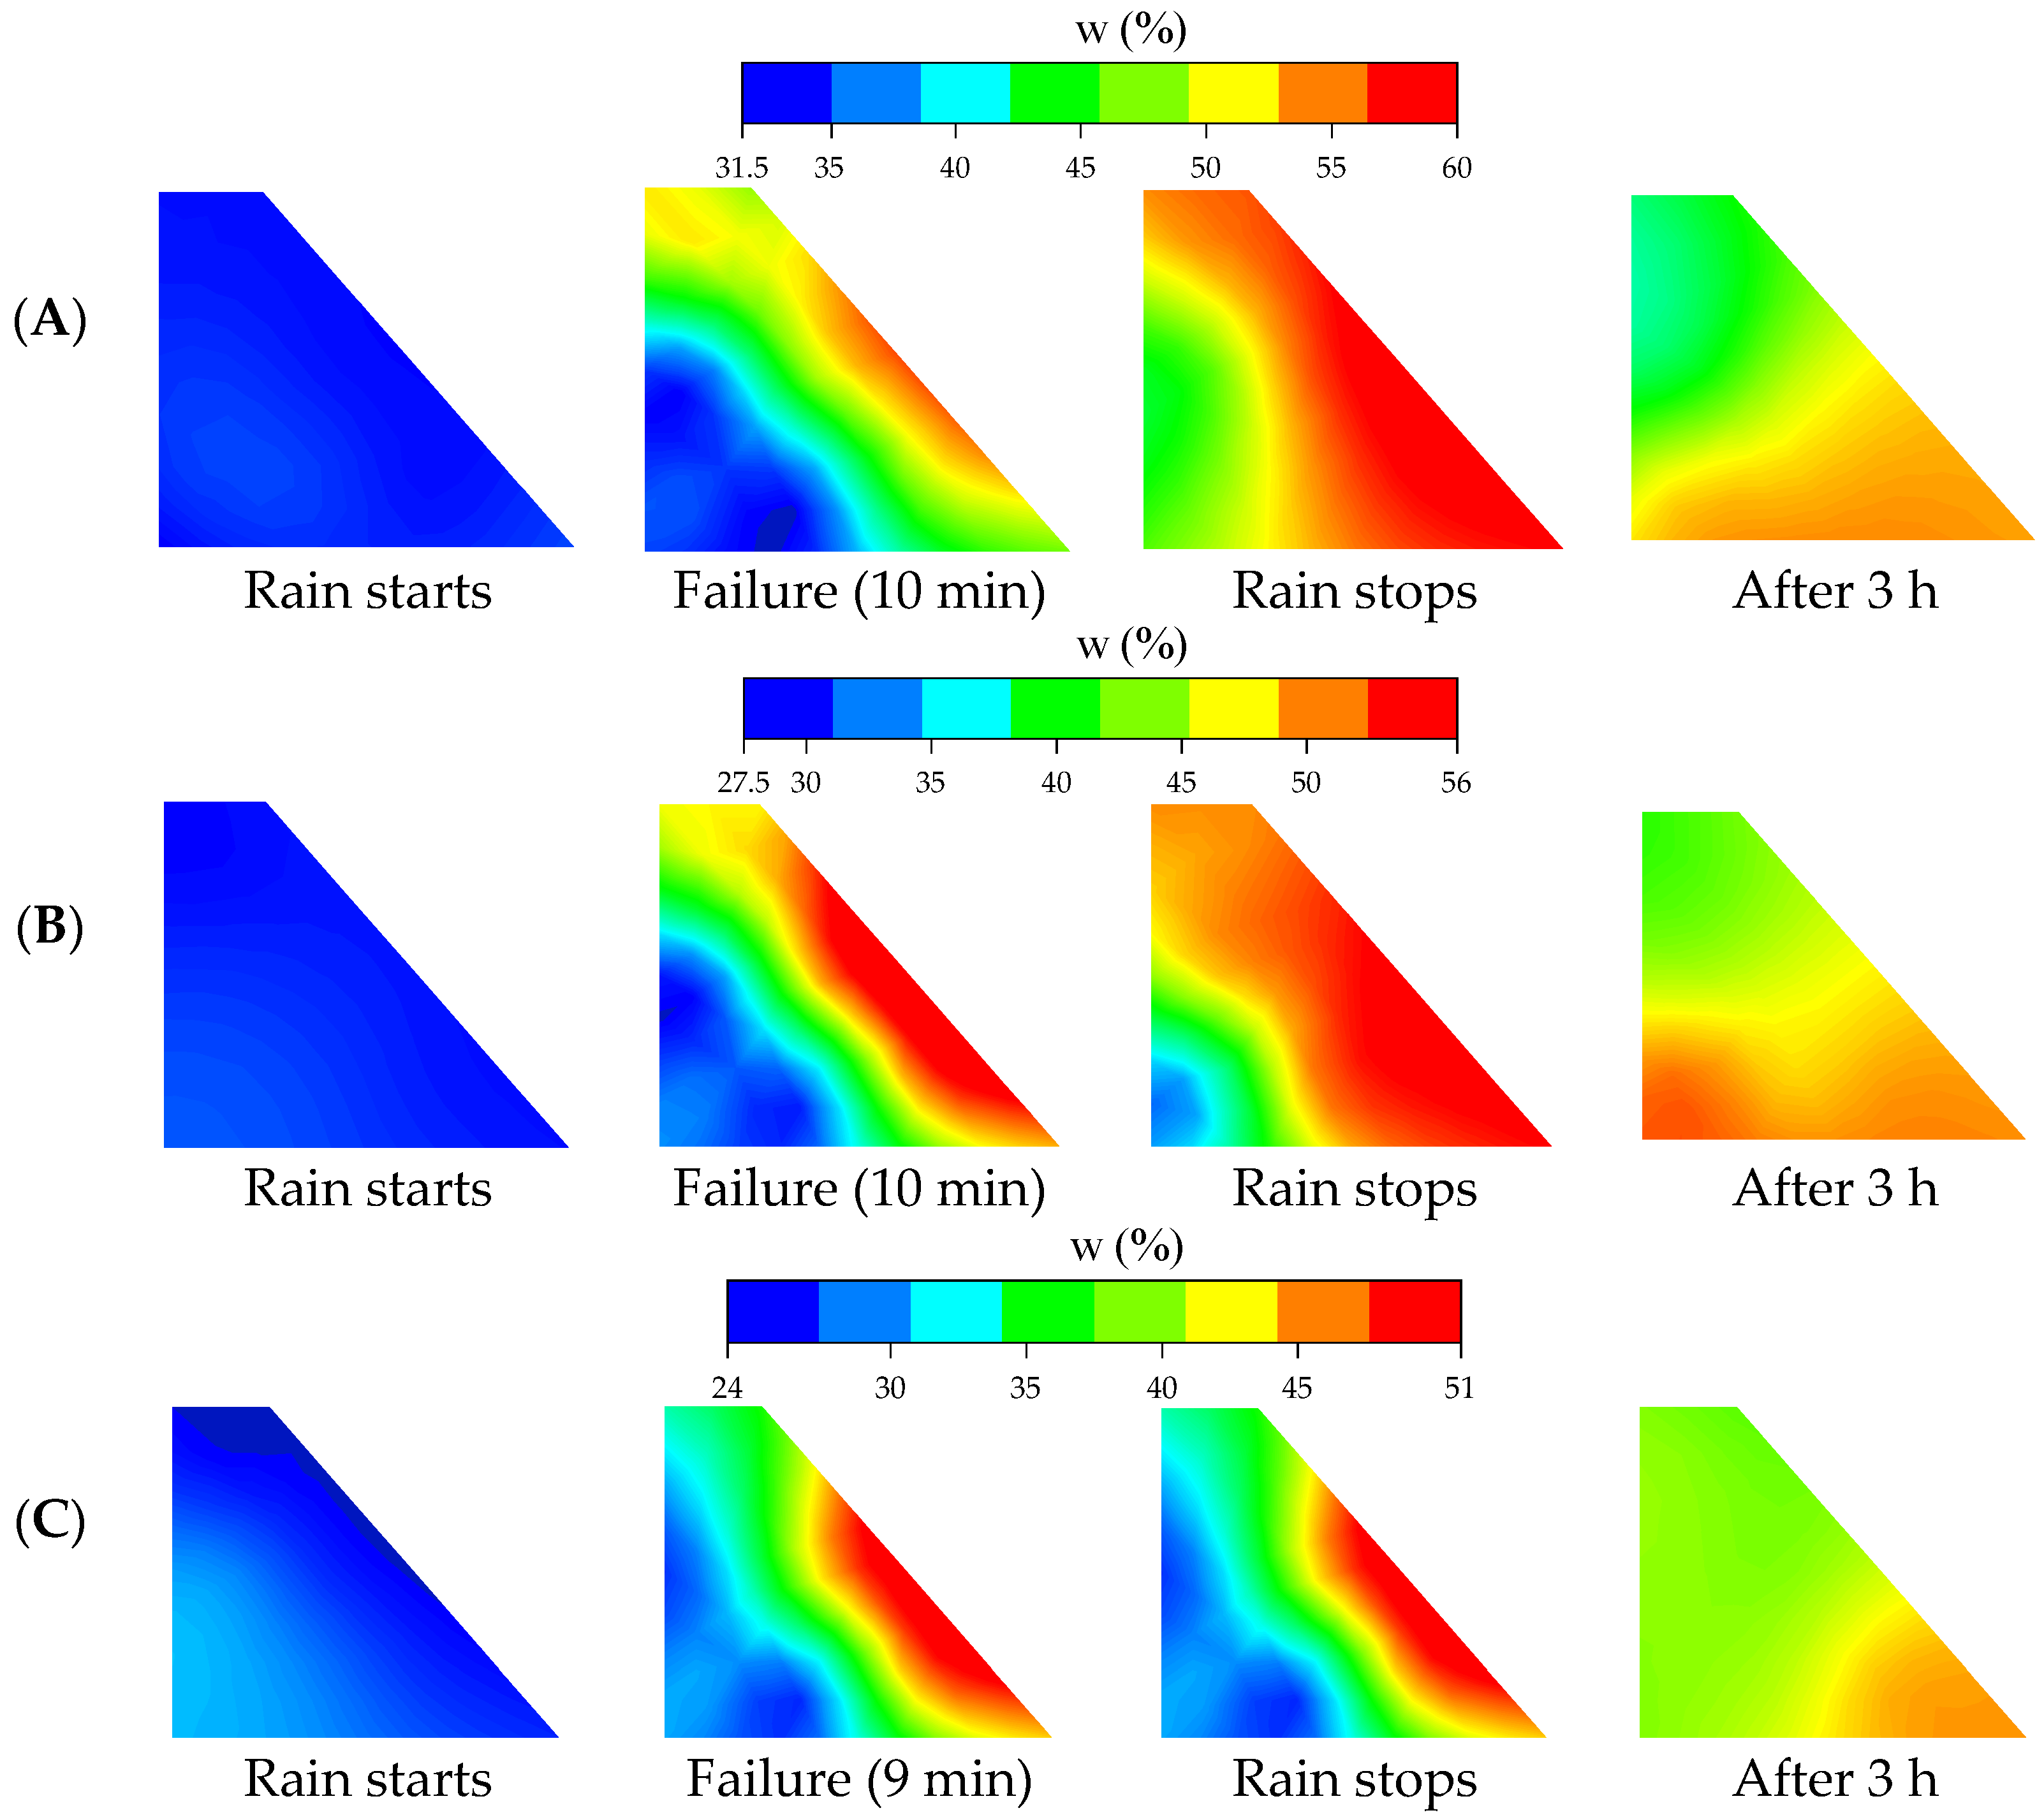
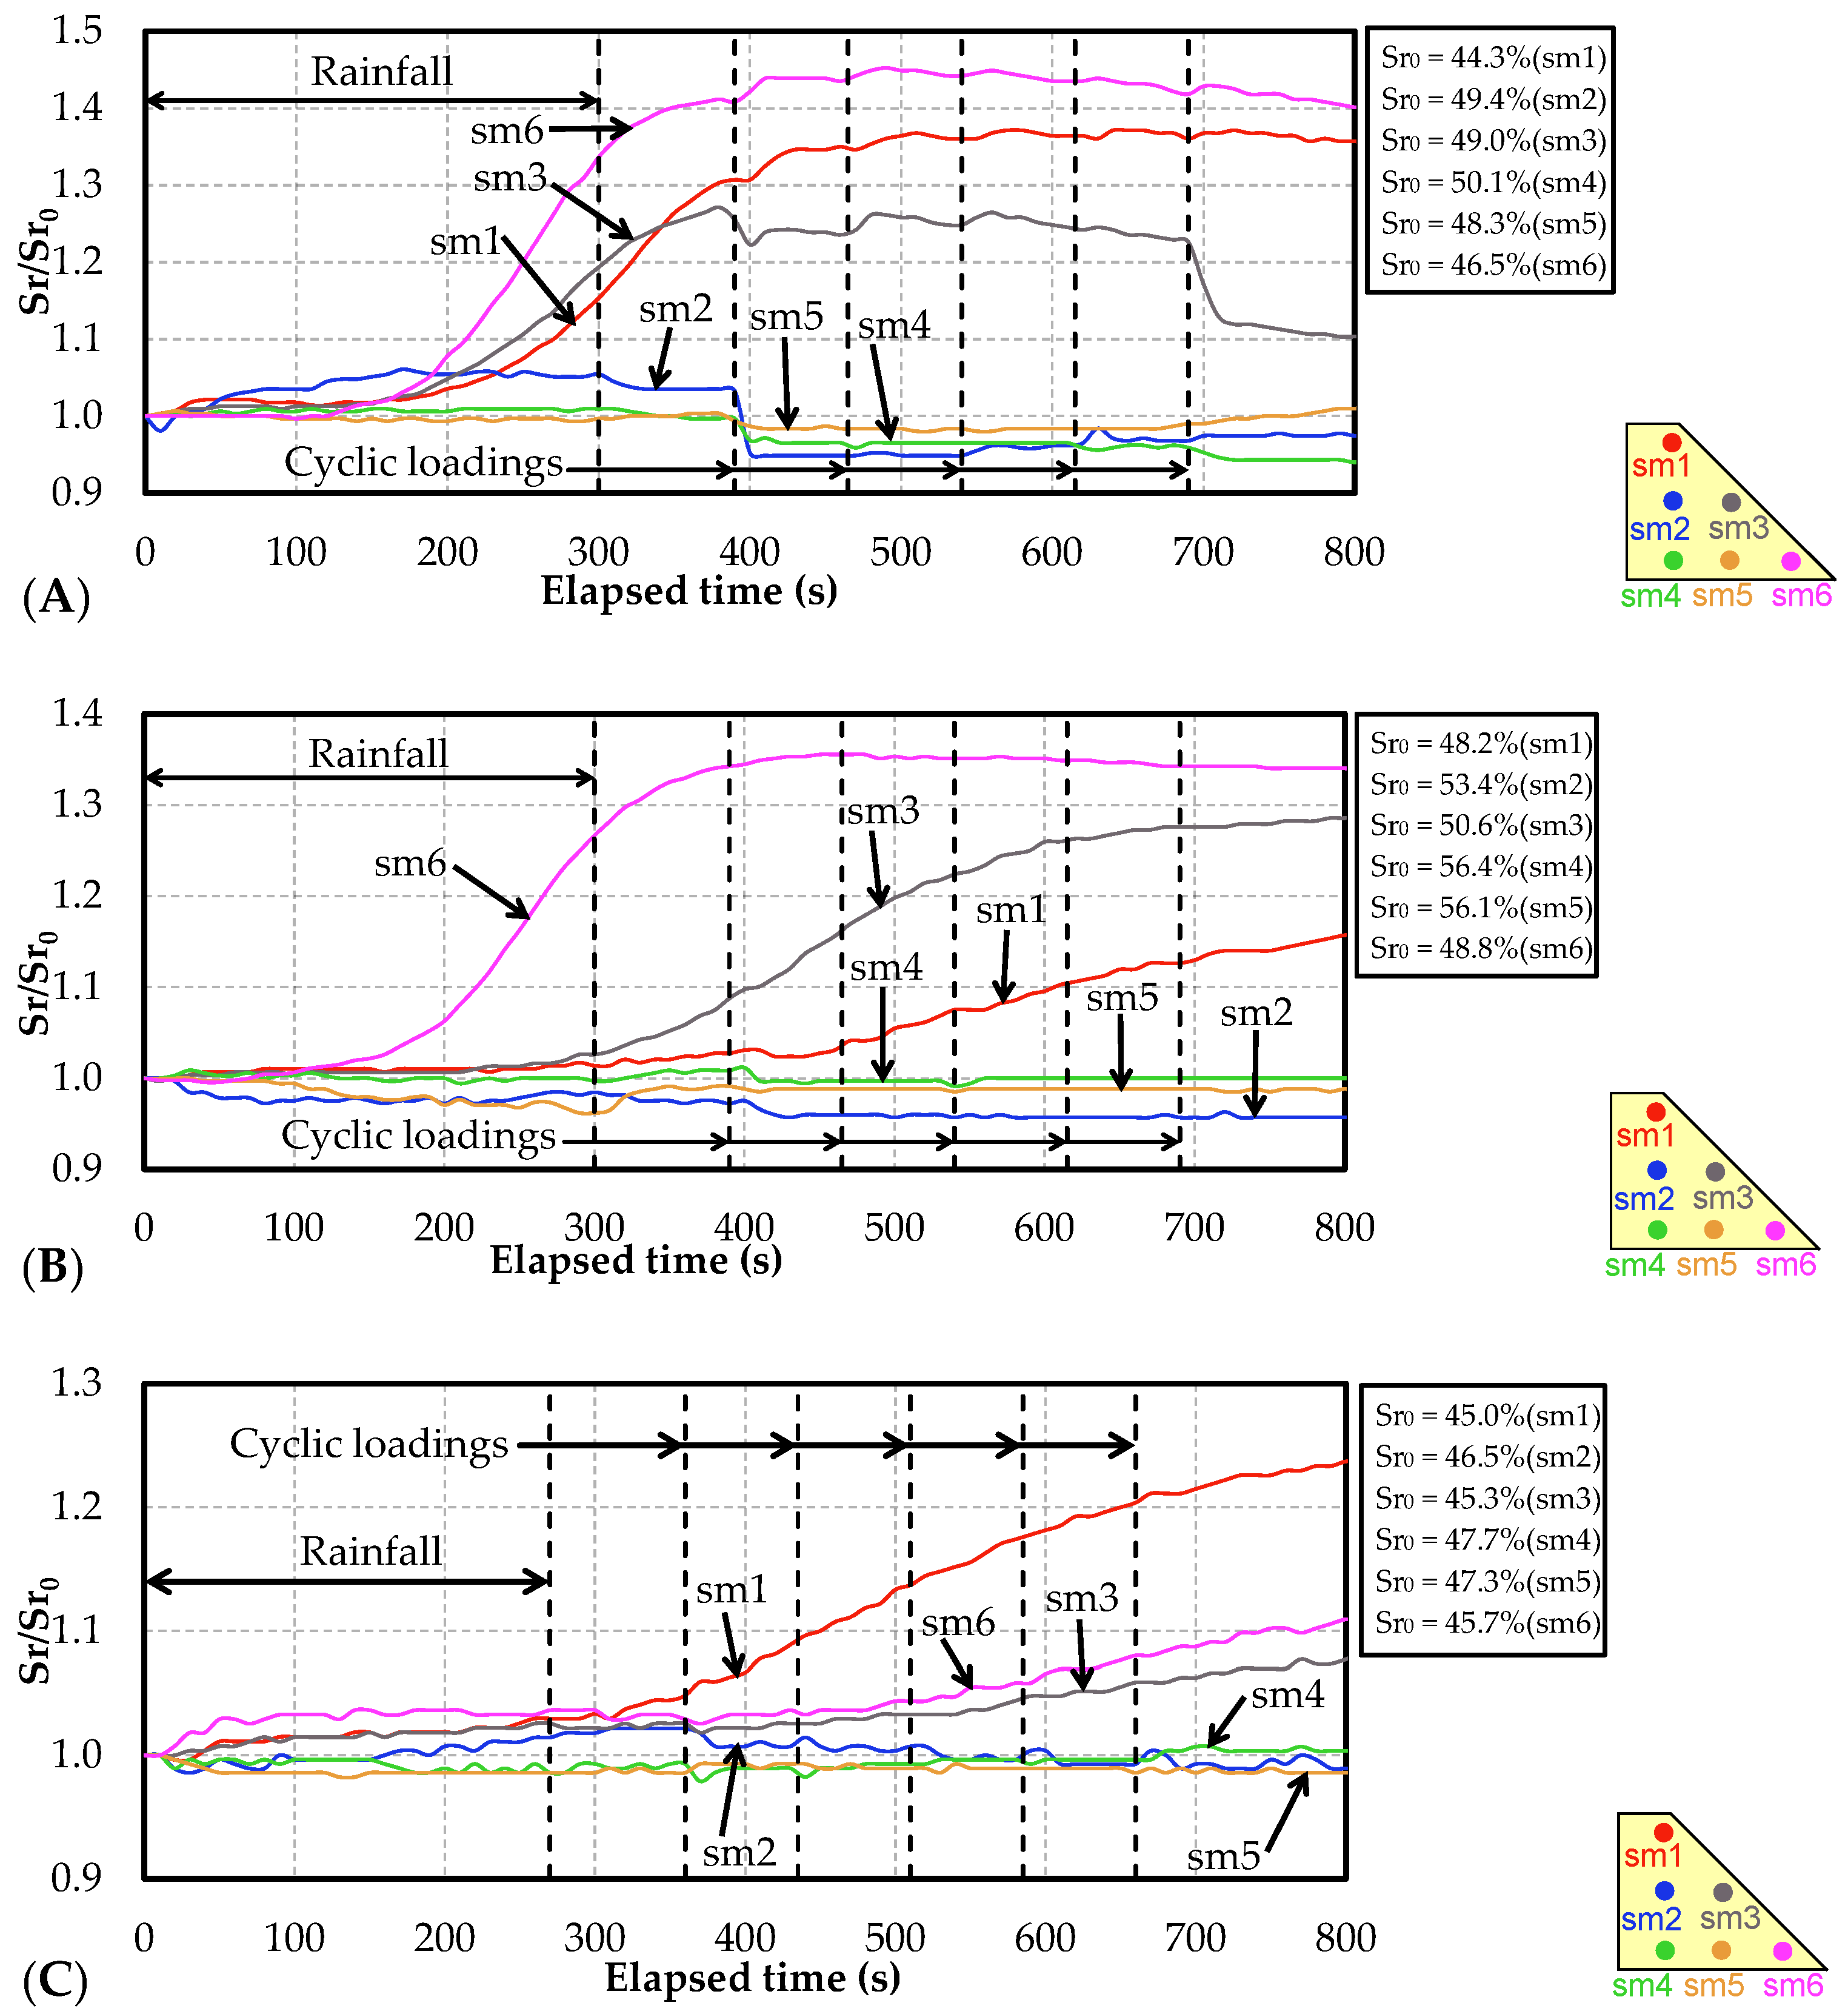
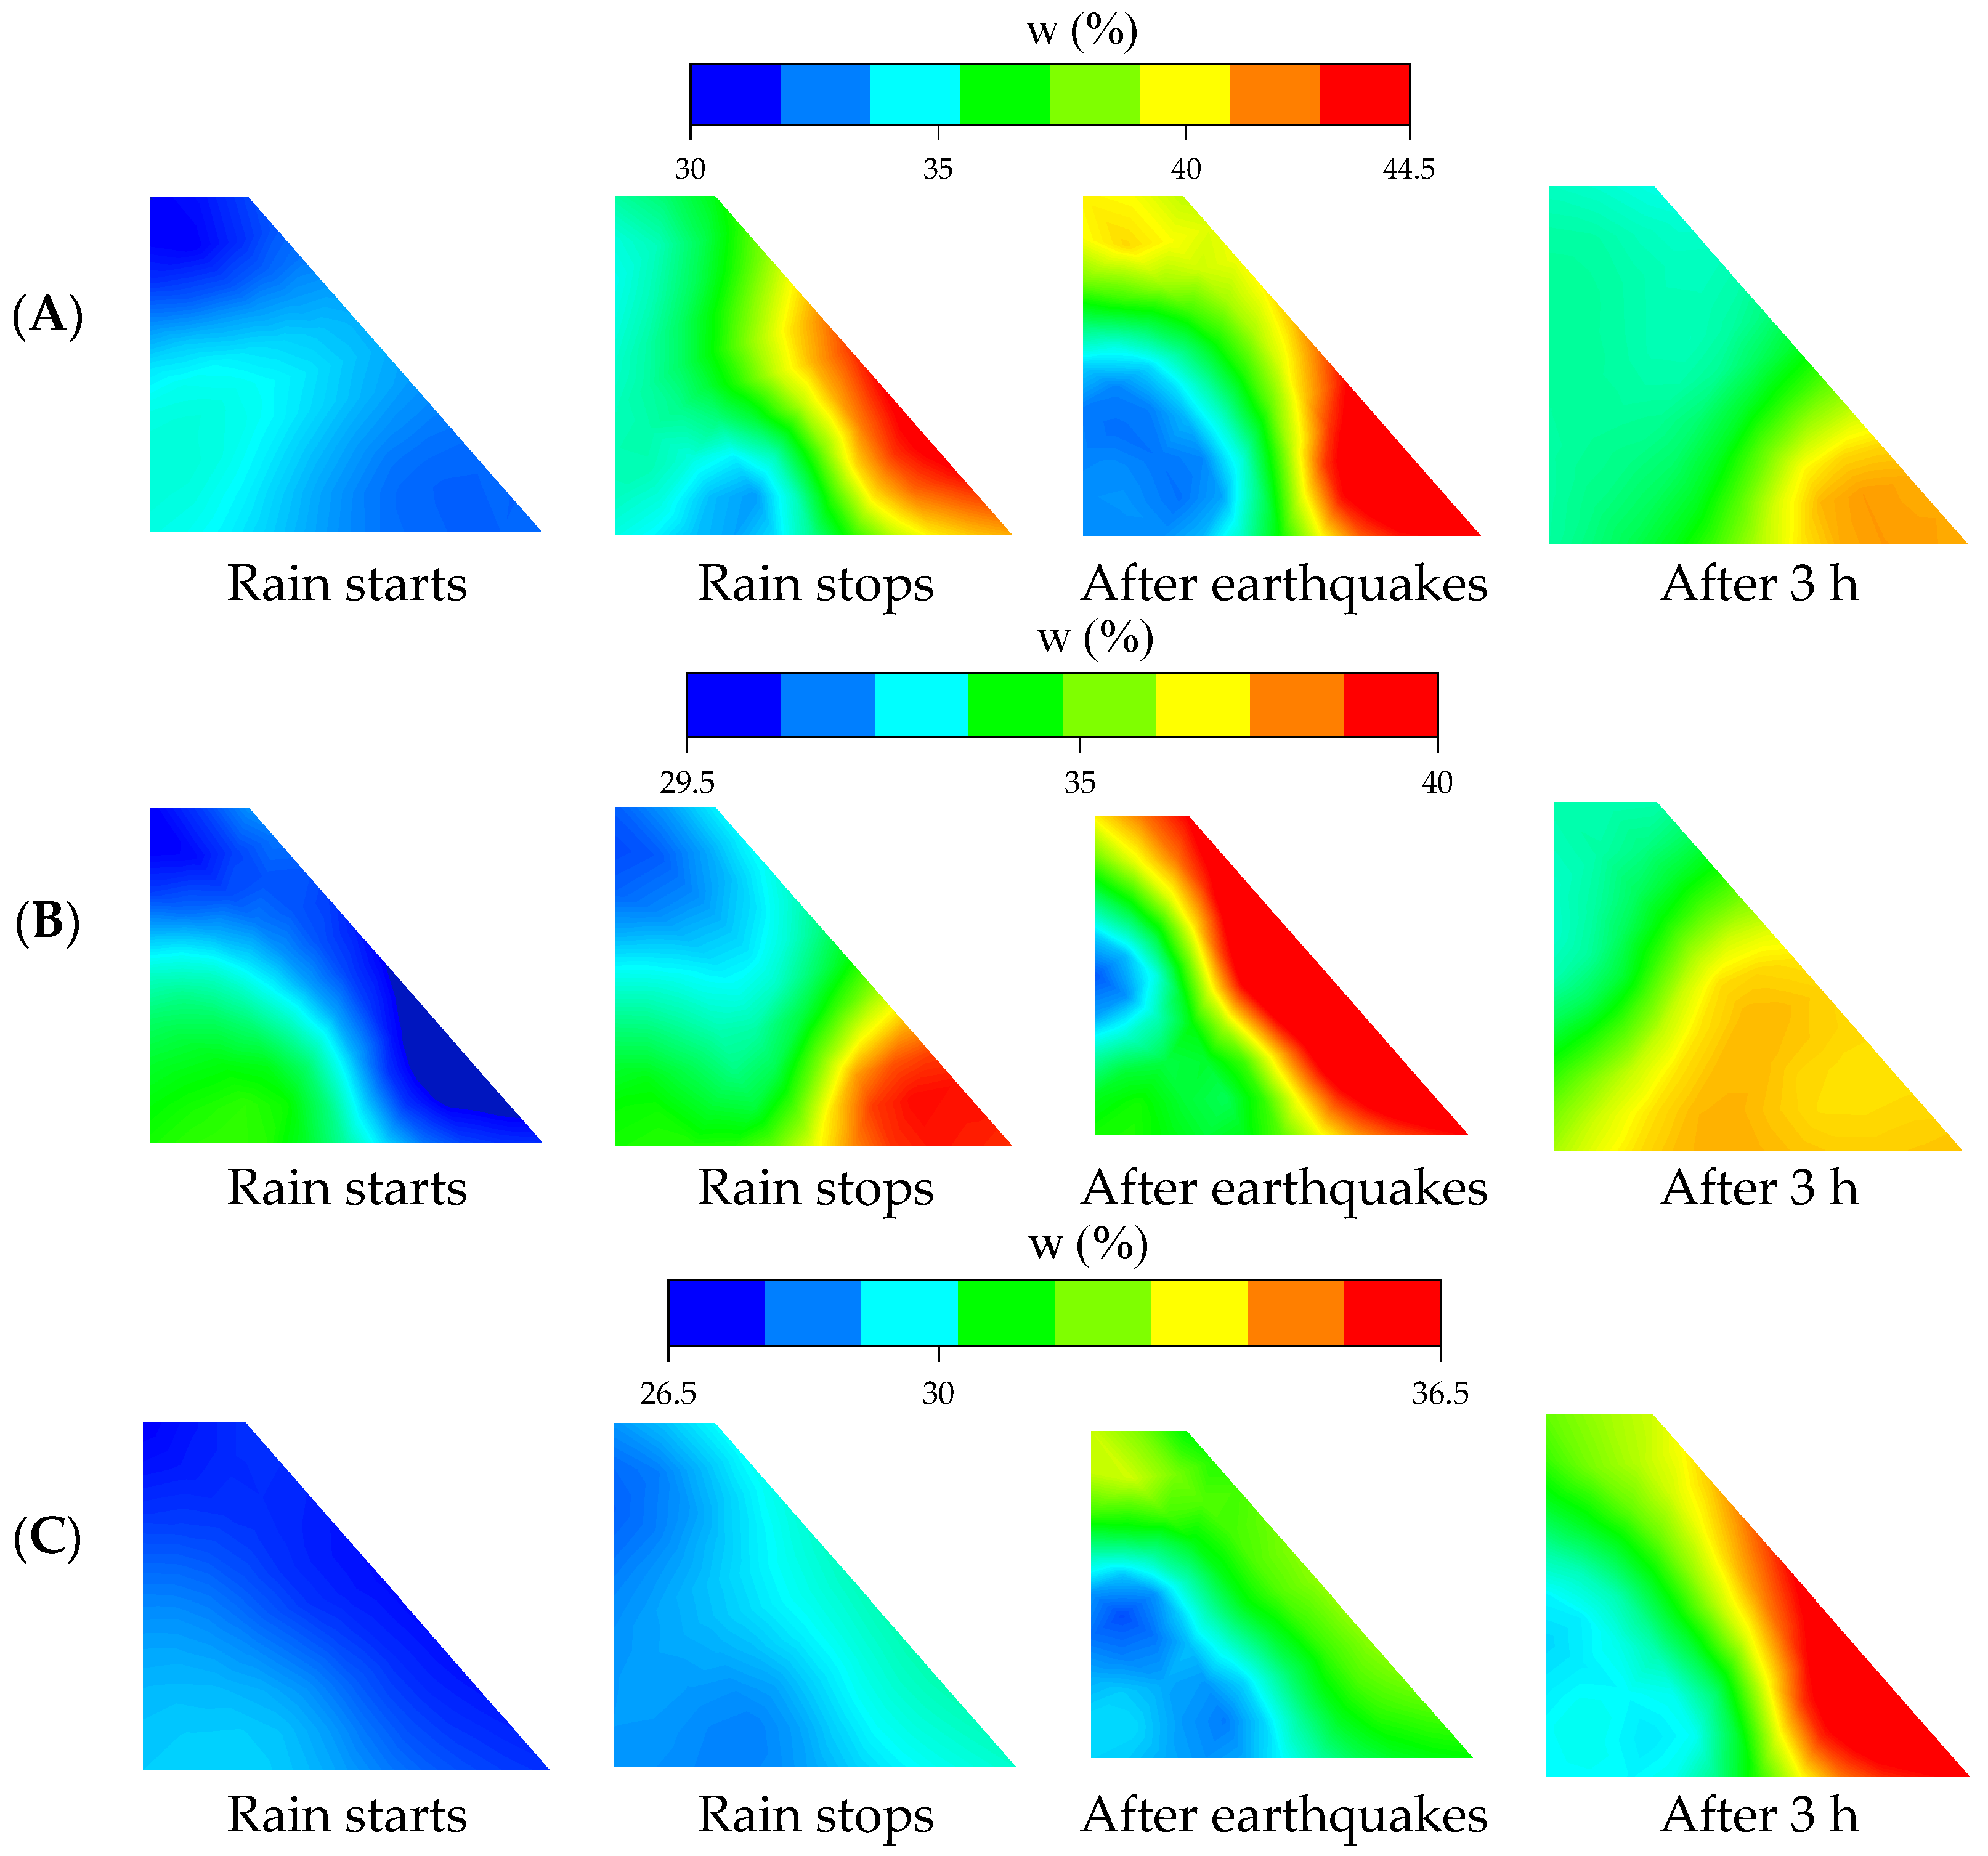
The variation in saturation degree during the rainfall tests is shown in Figure 12. Under the effect of rainfall, the value of each meter started to increase at different moments depending on their locations. All three samples showed a similar trend: sm6, sm3, and sm1 located closest to the surface increased first; then sm5 and sm2 increased, and finally, sm4 increased. If the meters lie on the same wetted front, their values start to increase together and show the same trend, as noted in sm1, sm3, and sm6 or sm2 and sm5. At the time of failure corresponding to shear strain reached 6%, the saturation conditions inside the embankment in three cases were also similar: sm1, sm3, and sm6 increased to near steady values while the other meters remained at the original value. However, as the rainfall continued, the different hydraulic conductivity between the three soils caused the difference in the speed of the wetting front in the embankment. This difference can be more easily observed in the water content distribution shown in Figure 13, which was obtained by linear interpolation from the six measurements inside the slope and the direct measurements at the boundary of the embankment before and after the experiments. In the figure, sample K8.5A showed the highest permeability: after 30 min of rainfall, except for the deepest meter sm4 which increased to a rather high value, the meters sm1, sm2, sm3, sm5, and sm6 increased to their maximum value, as shown by the fact that they no longer increase when the rainfall stopped. For Ksoil, sm4 did not start to increase after 30 min of rainfall. In particular, K40A showed the lowest permeability: sm2 and sm5 did not even reach their maximum value. The effect of fine particle content on the hydraulic conductivity of volcanic soil in this study seems to be more obvious than it was in [25], which can be explained as follows: Under the same dry density in [25], the loss of fines content only leads to an increase in the average size of pores. However, a decrease in fine particle content directly results in the void ratio under the same compaction degree condition in this study. Therefore, the decrease in permeability in the latter case was more significant. After the rainfall stopped, sample K8.5A showed the fastest drainage rate (sm6 did not decrease because it was exposed after failure), followed by Ksoil and the slowest, which was K40A.
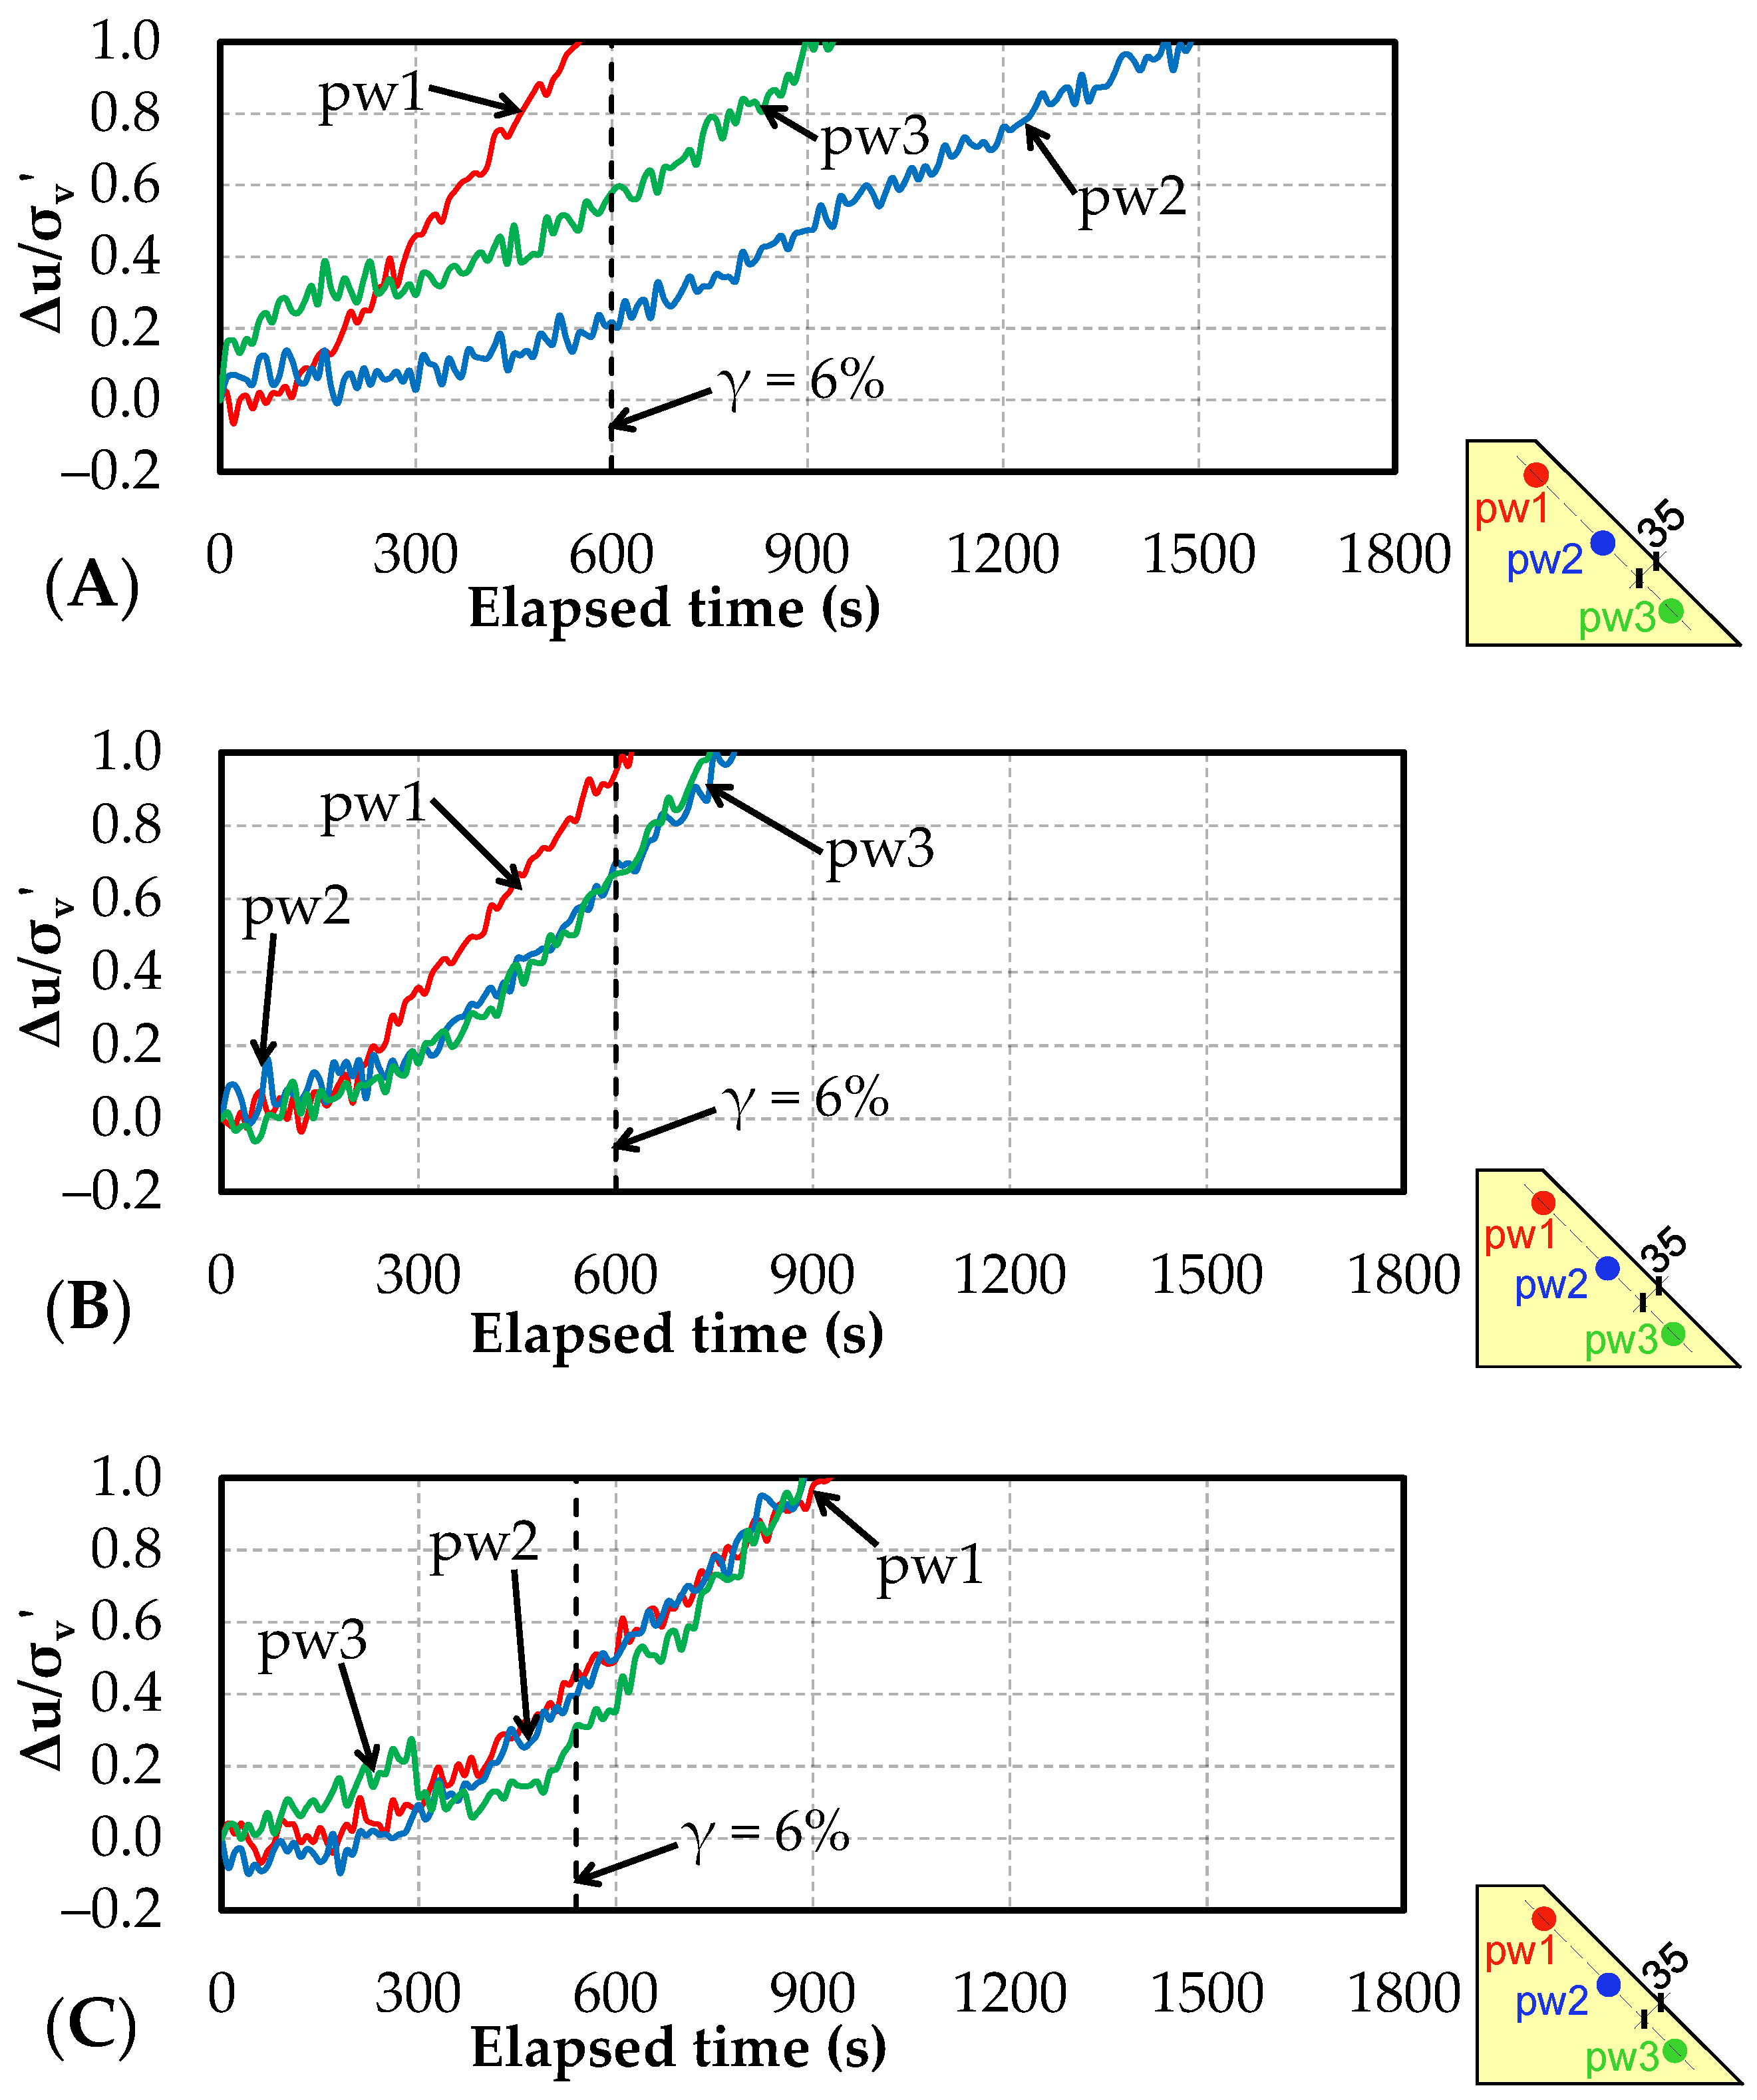
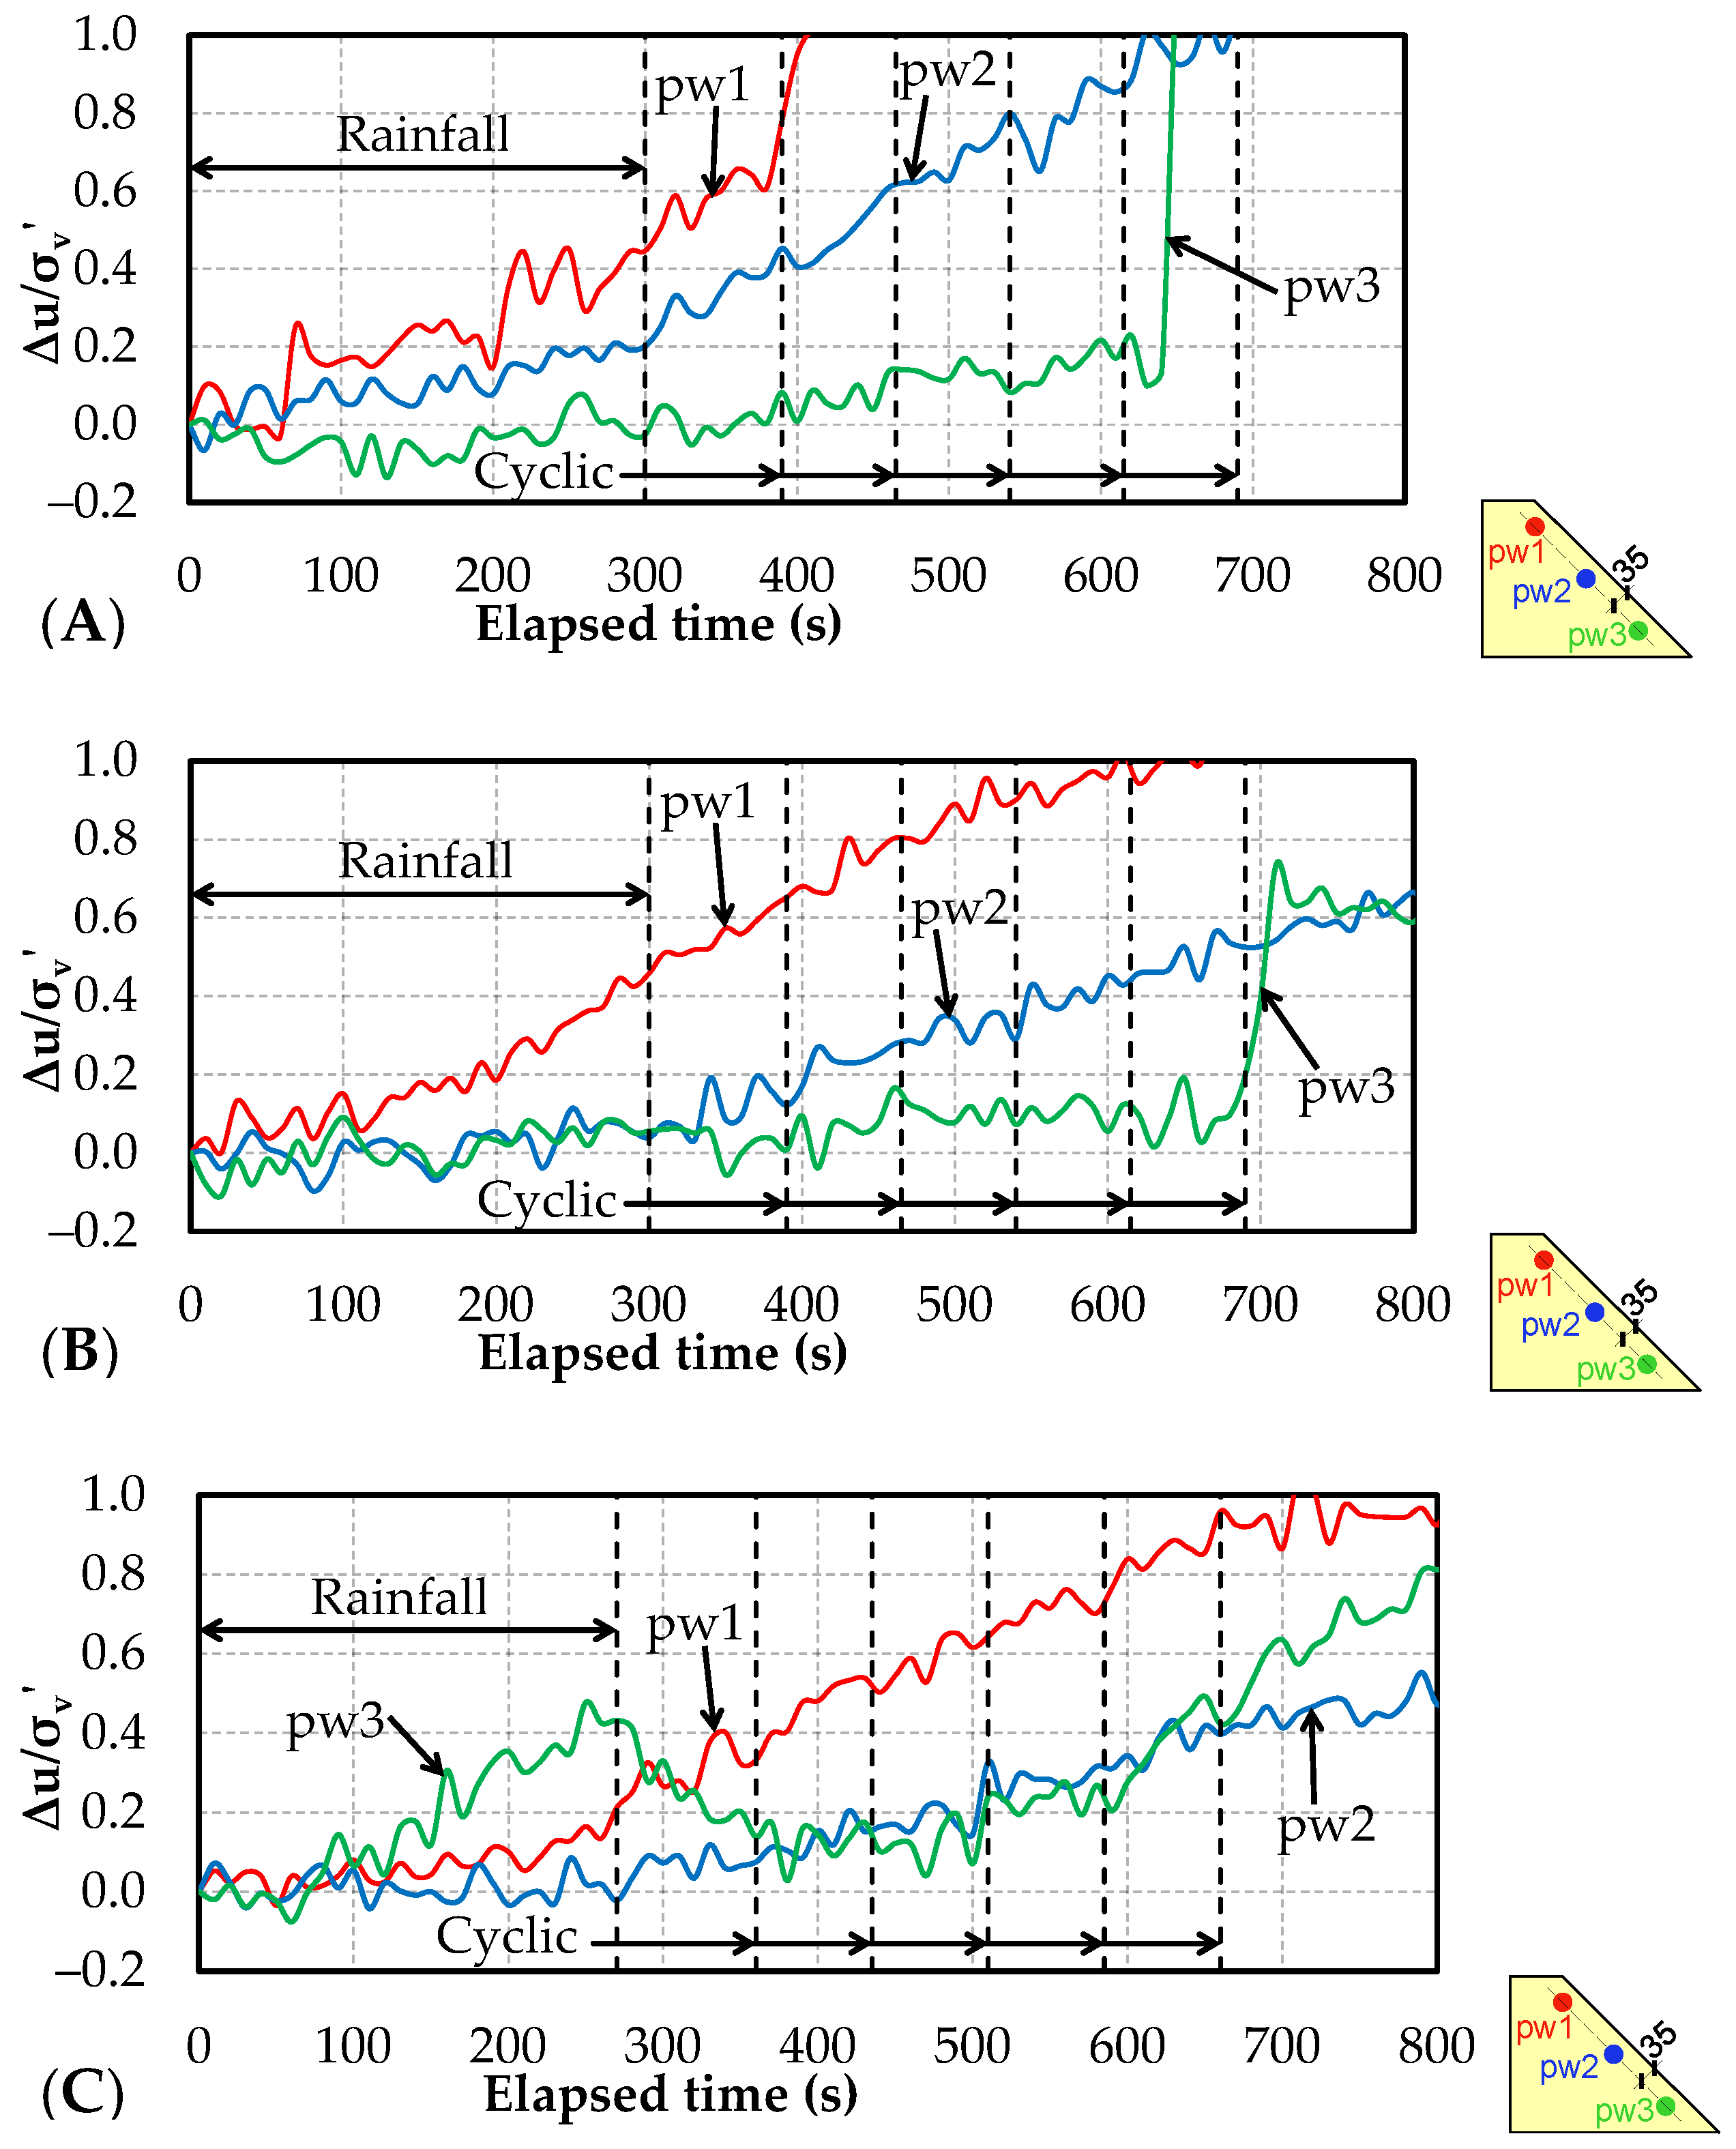
The change in pore water pressure during rainfall is shown in Figure 14. In the case of K8.5A and Ksoil, pw1 near the crown of the embankment increased faster than pw2 and pw3. Then, flow deformations occurred at the base of the slope when pw3 exceeded 1. For K40A, the rate of increase in pore water pressure was lower than that of K8.5A and Ksoil. The values at three positions, pw1, pw2, and pw3, were almost the same. When the shear strain reached 6%, the pore water pressure was quite small compared with the other two cases. Another difference of K40A was that the value of pw3 did not decrease for 3 h after the rainfall had stopped. The saturation degree sm4, sm5, and sm6 of K40A also showed an upward trend after rainfall instead of decreasing as was the case of K8.5A and Ksoil. This can be explained through the movement of fine particles. As mentioned above, the fines content in Area 3 was always greater than in Areas 1 and 2. This migration trend led to the concentration of a large amount of fine grain at the toe of the slope. Fine particles combined with coarser particles made their size larger than the size of the pores, which prevented water and soil from continuing to move through that pore. This blocking effect in the basement made it difficult to drain and thus increased the groundwater table in the embankment as can be seen in the K40A case.
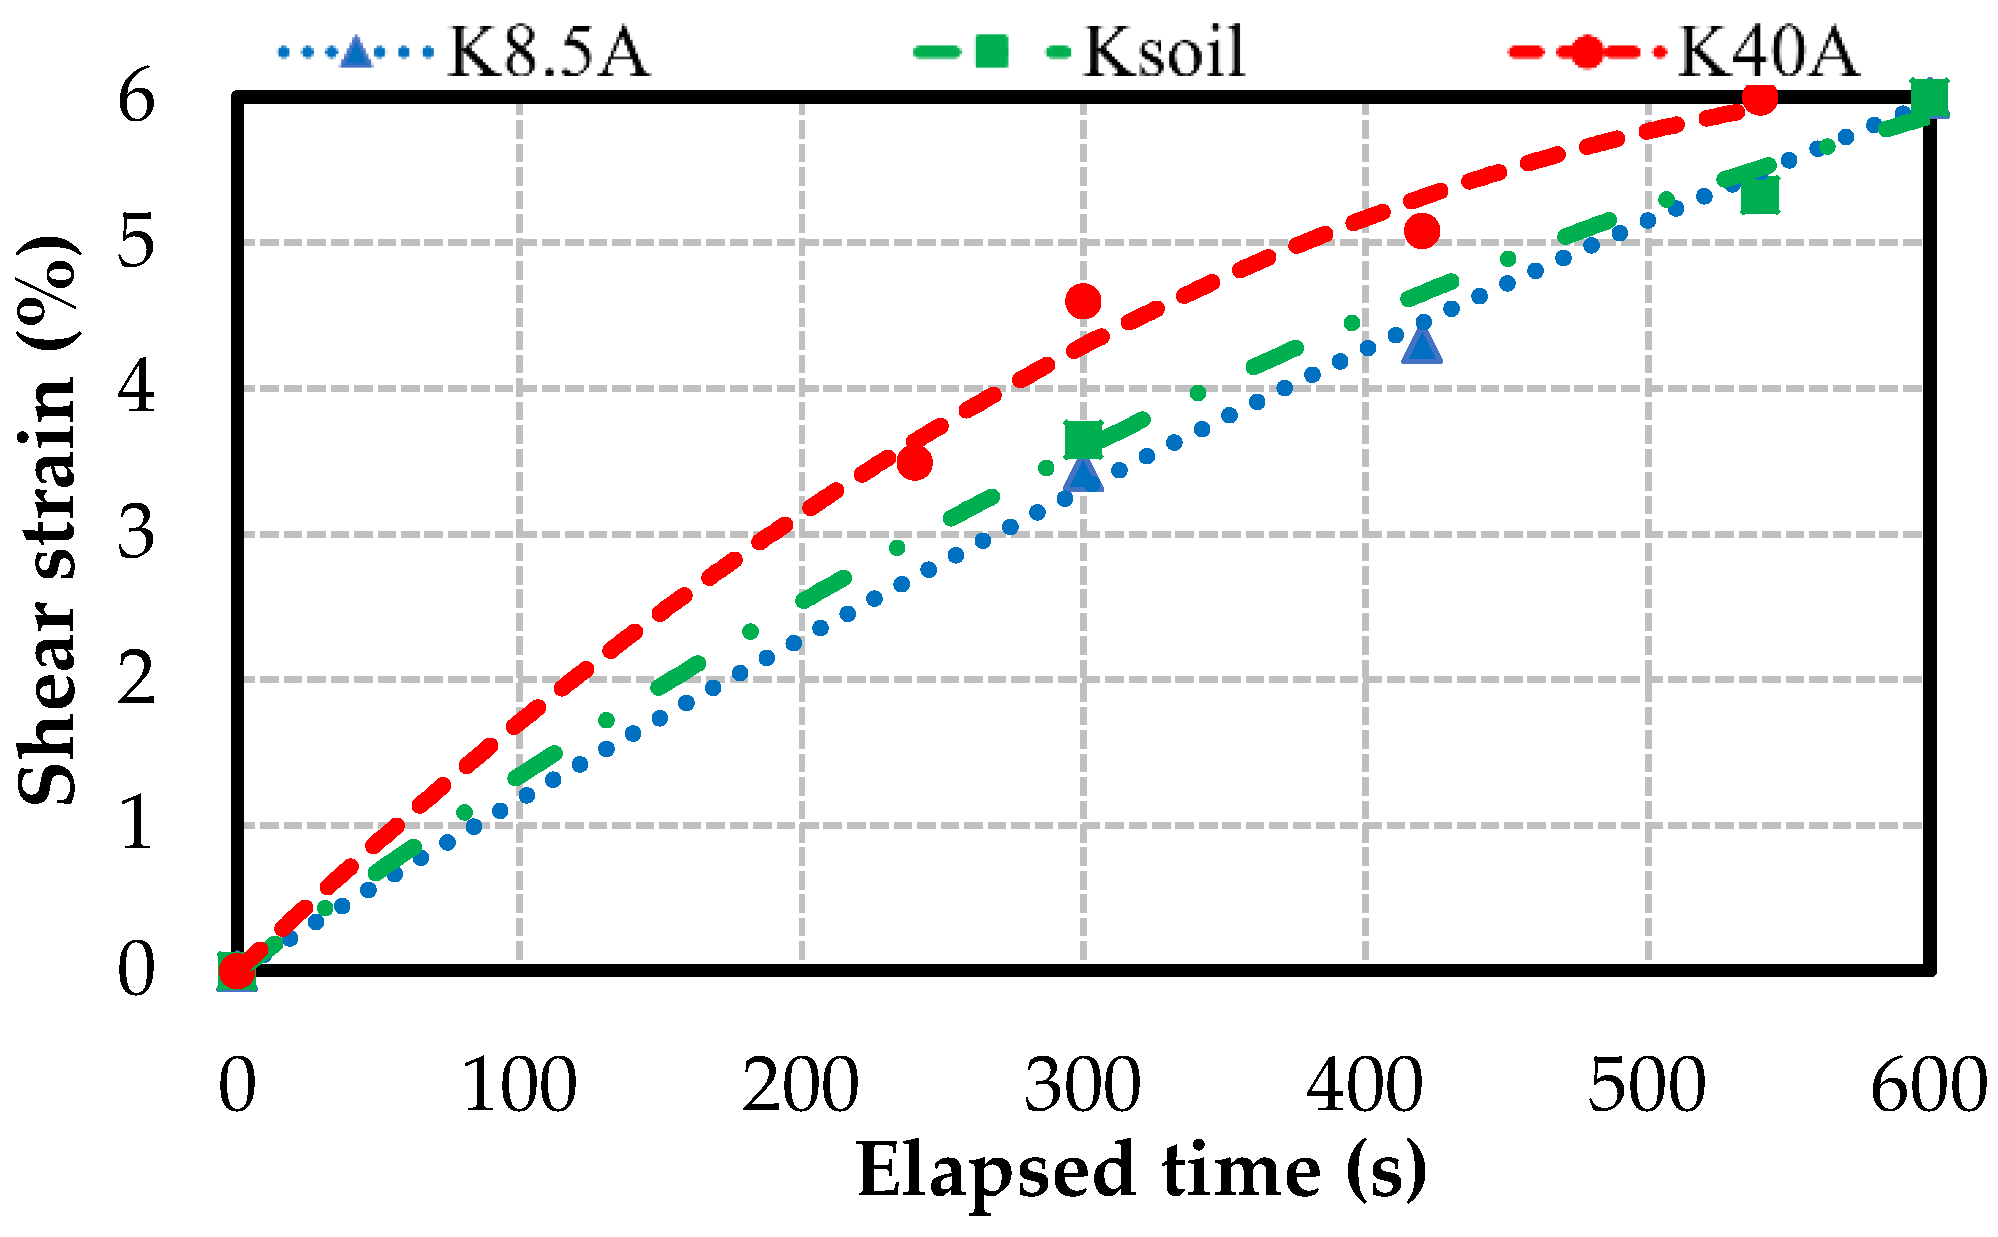
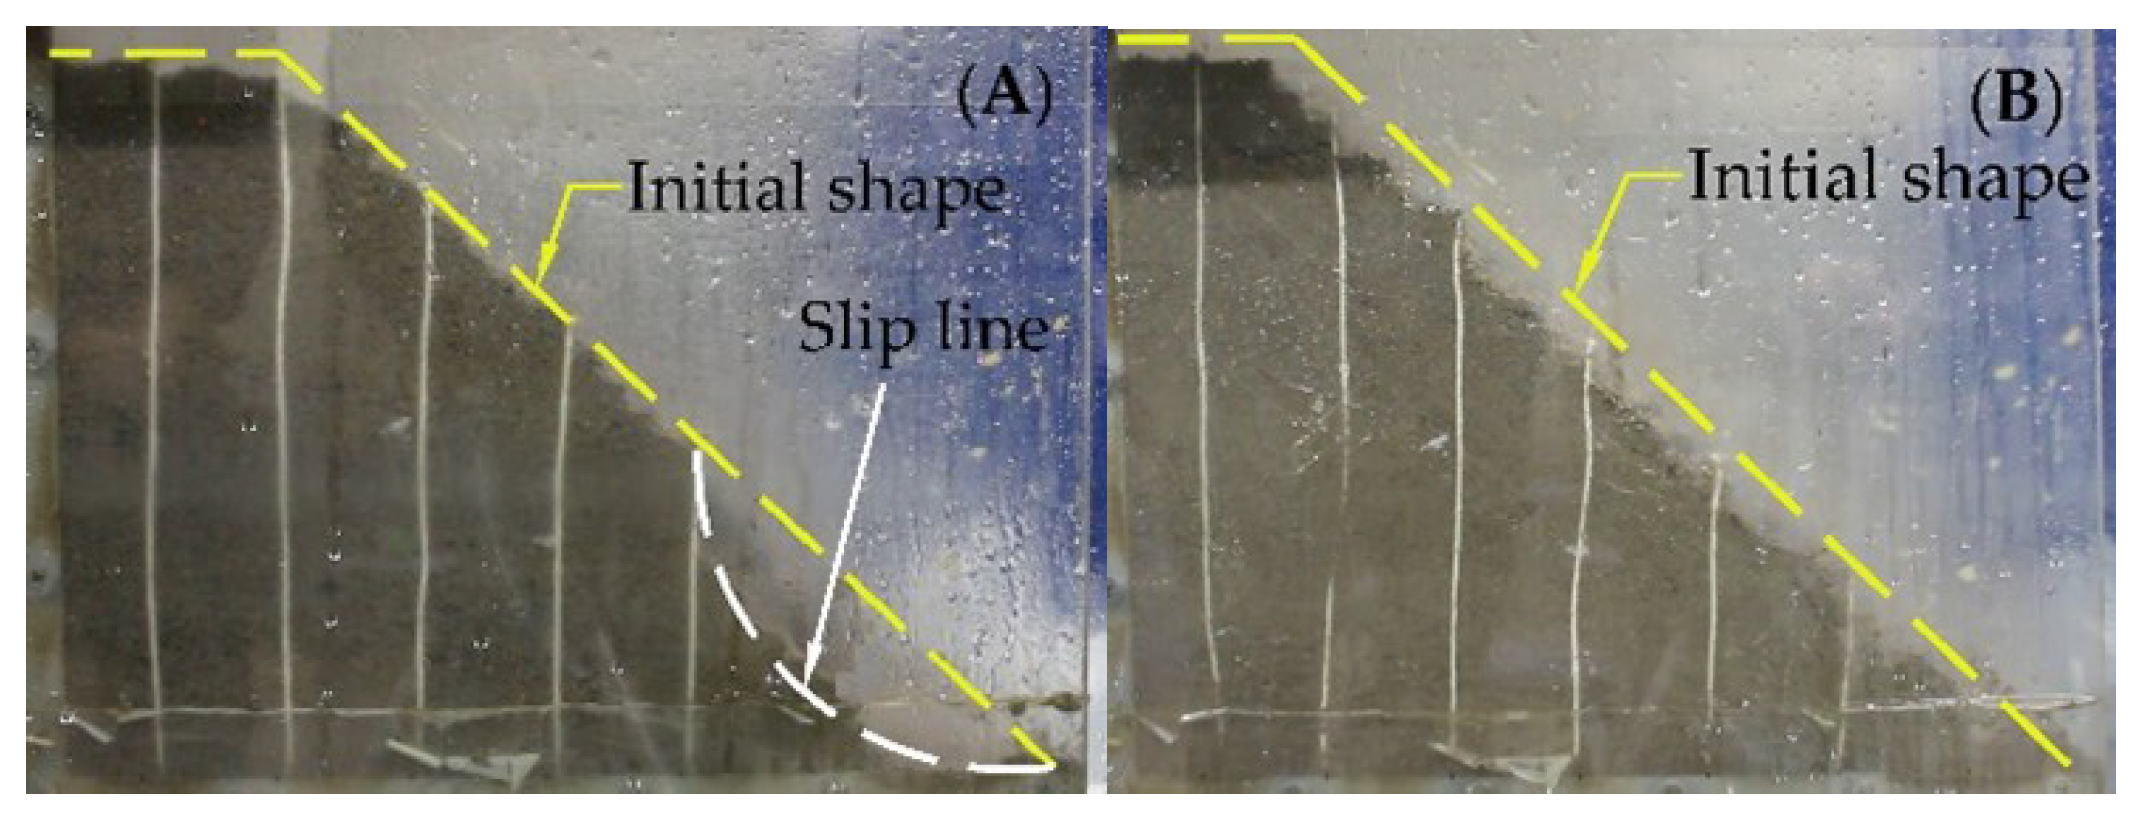
The increment of shear strain during rainfall is shown in Figure 15. When the shear strain was less than 6%, these relationships were almost linear for all three samples. Failure time for K8.5A and Ksoil was 10 min and for K40A was 9 min. Since the increase in pore water pressure during this period of K40A was smaller, the faster failure rate of this soil sample is considered to be due to its smaller shear strength (internal friction angle). Thus, although an increase in fine content was shown to reduce soil permeability, it had almost no effect on rain-induced slope failure when the shear strain is less than 6%. After the shear strain exceeded 6%, it sharply increased at 27 min for the K8.5A embankment along with secondary failure, which was not observed for Ksoil and K40A during 30 min of rainfall. Even in another experiment when the precipitation time was increased to more than 1 h, secondary failure did not occur with K40A. This difference can be explained through the failure pattern of K8.5A and K40A shown in Figure 16. In the case of K8.5A, along with the increment of pore water pressure, the flow deformation that occurred at the base of the embankment led to the fast development of a larger slip line. However, the other parts in the model slope except for the slip line showed almost no change. In contrast, the K40A embankment did not show slip line or gully erosion, but a small local failure appeared on the entire slope surface leading to a gradual reduction in size. Even when the pore water pressure exceeded 1, the flow deformation did not occur. The surface failure for K40A can be attributed to the fine grains migration in the embankment as described above, because fine particles play an important role in the construction of K40A’s soil structure, not just filling the voids as in the case of K8.5A. When the soil was gradually saturated, the flow of water inside the embankment became more difficult, leading to a decrease in the movement of fine particles. As a result, the rate of increase in shear strain for K40A was reduced.
3.2. The Failure of Embankments with Different Fine Contents under Post-Rainfall Earthquake
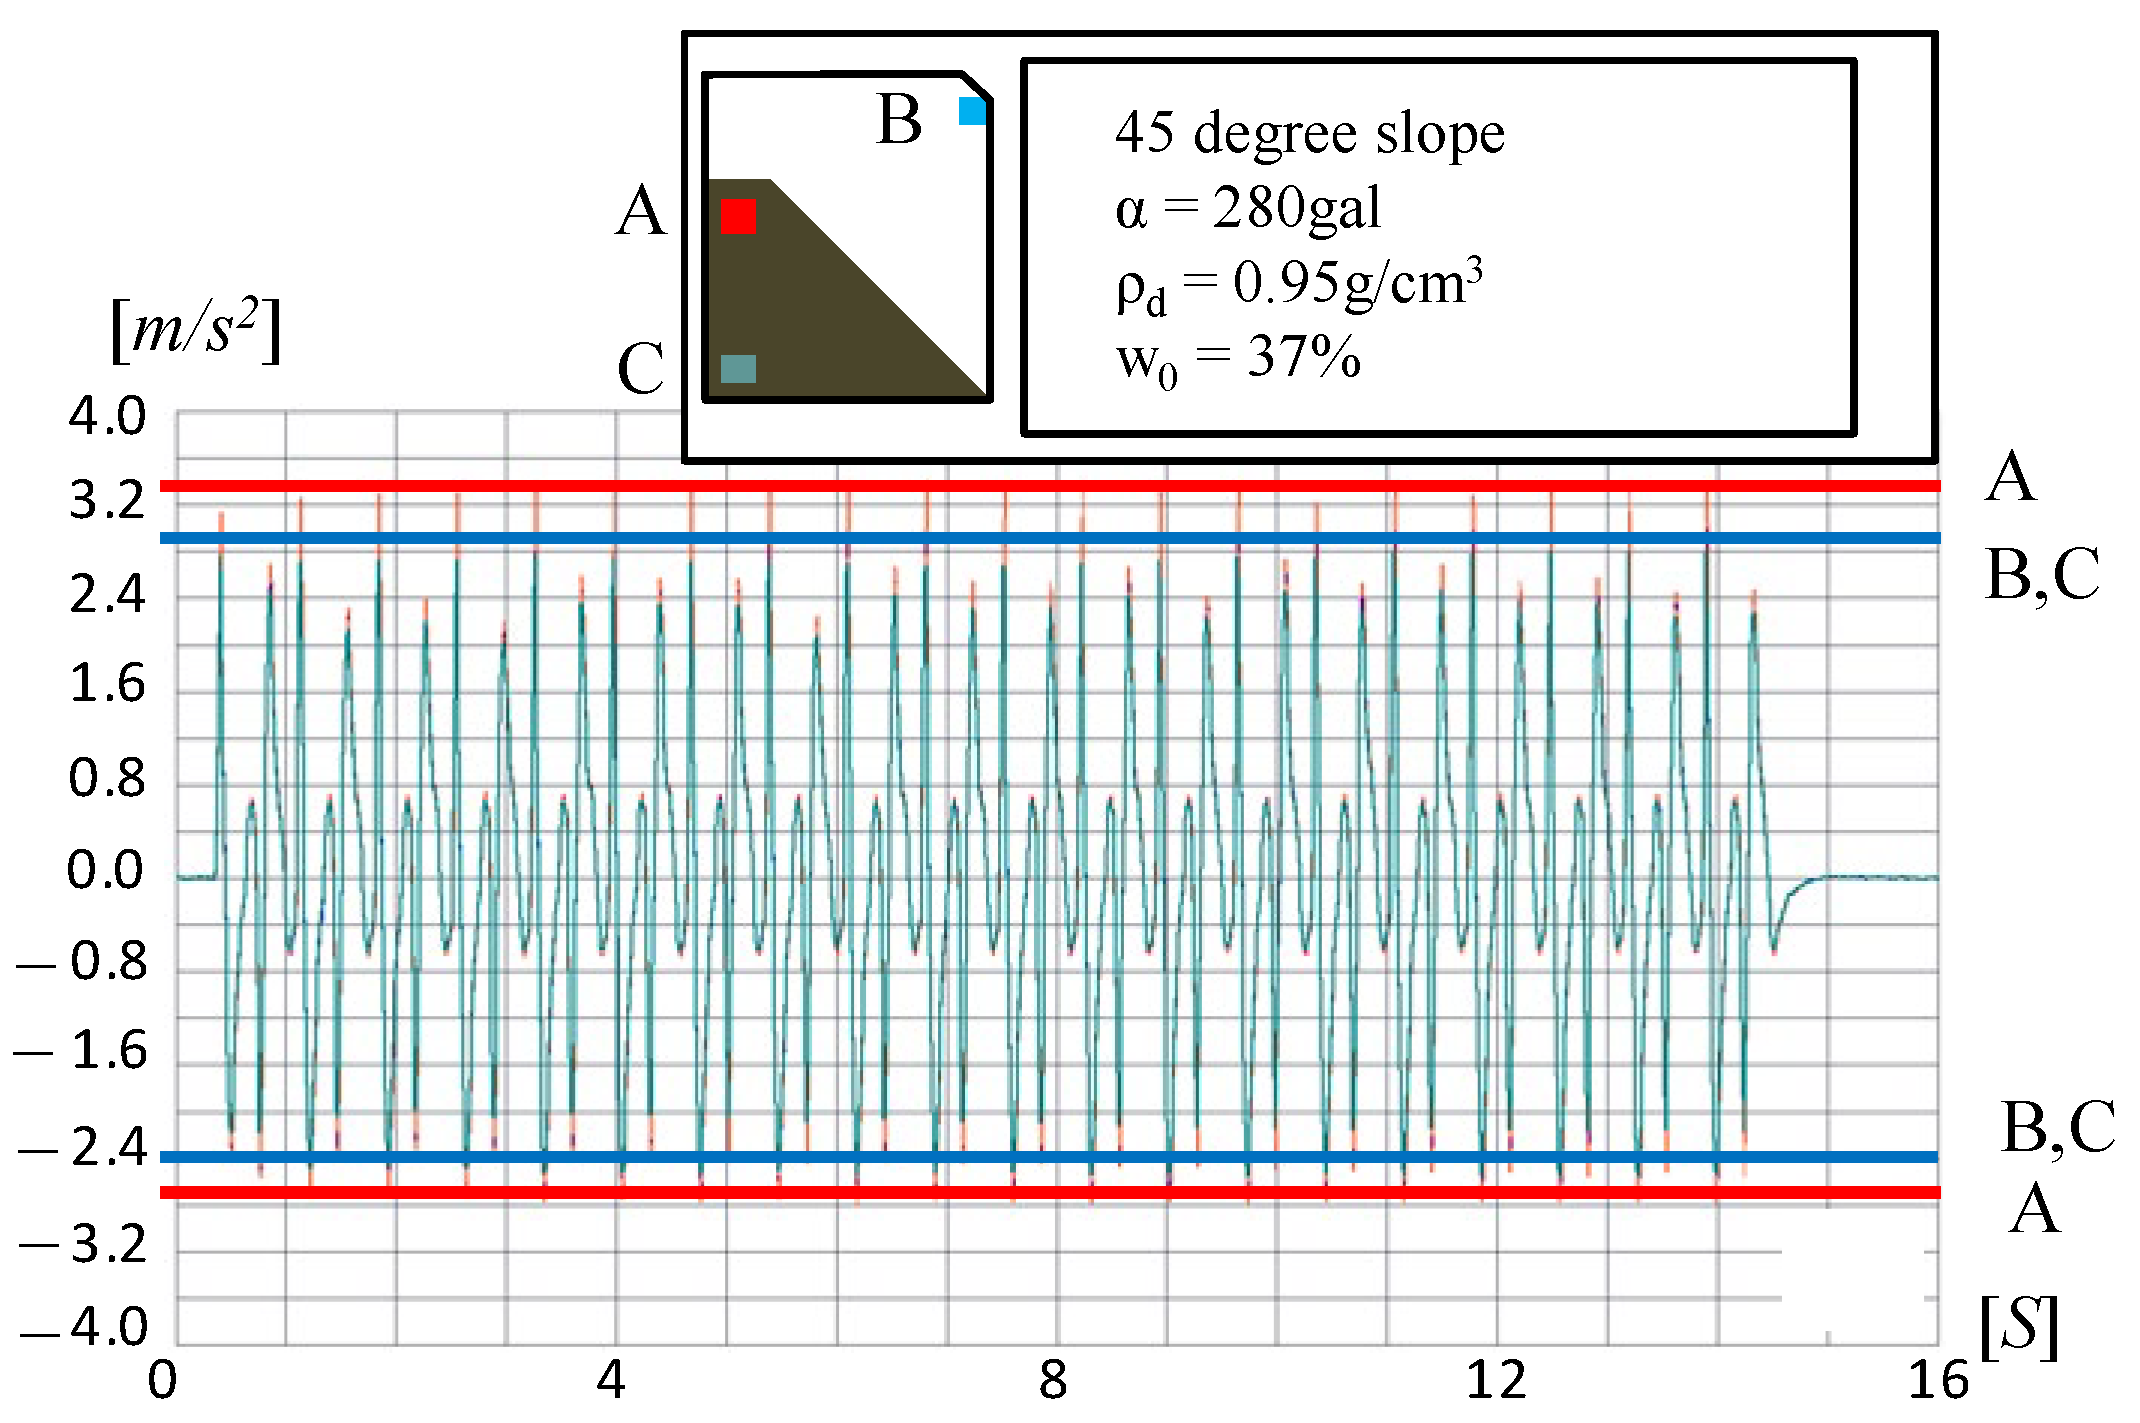
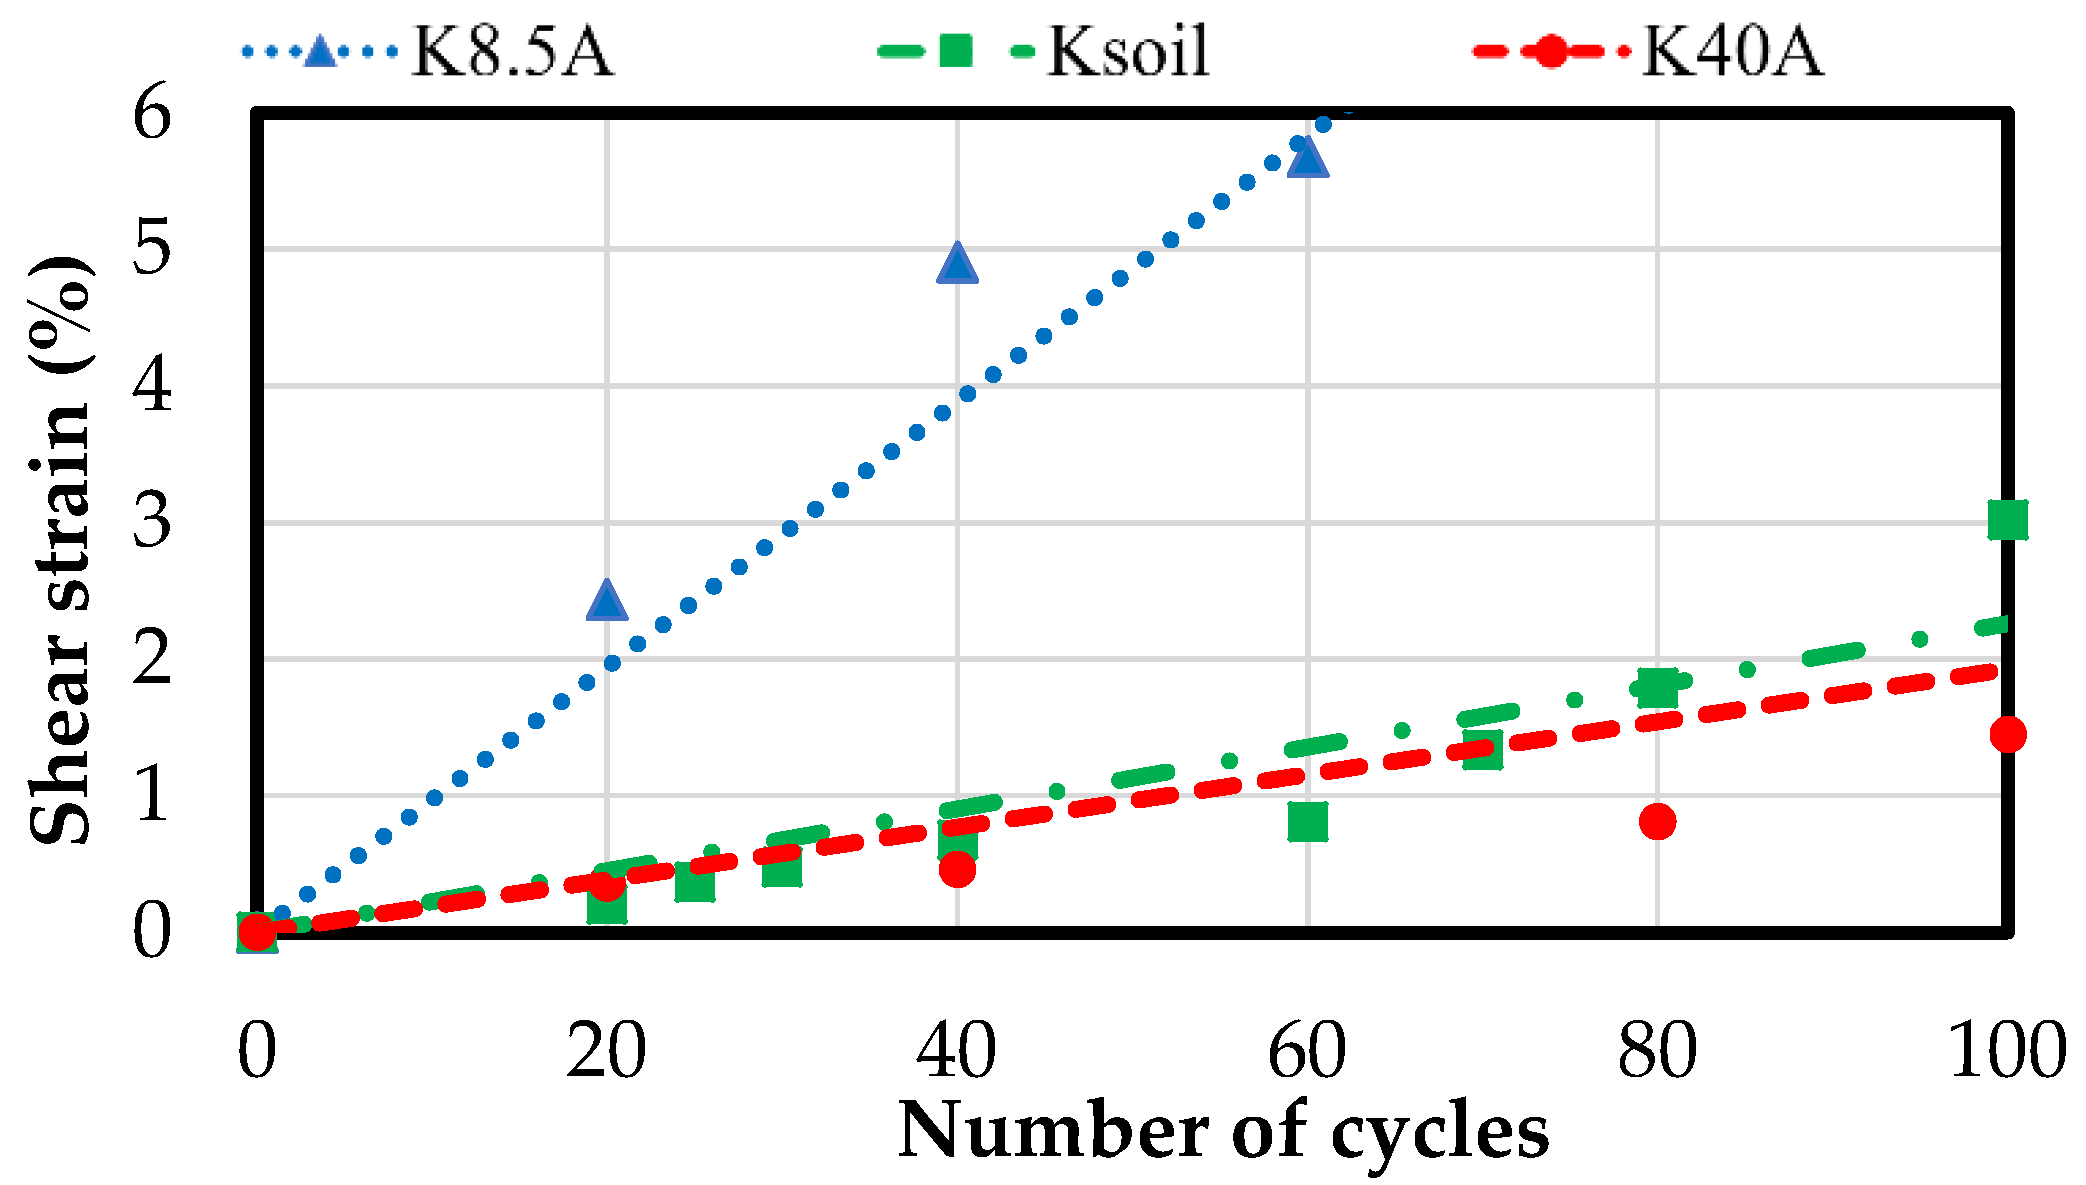
In Figure 17, the input motion of the 2.8 m/s2 seismic loading used in the earthquake-only experiments [6] is shown through the measured acceleration at the shaking table (point B), the upper part (point A), and the lower part (point C) of the embankment. It can be seen that the maximum acceleration near the crown area of the slope was larger than those at other locations. As the fine content varied, the samples in earthquake-only tests of this study showed similar mechanical behavior and shear strain (less than 2% after 400 cycles), implying that fine particle content had no significant effect on the seismic resistance of compacted volcanic soils at a compaction degree of 90%. However, this behavior is no longer correct in the post-rainfall earthquake experiments presented below.
The cumulative rainfall up to the time of failure mentioned in Section 3.1 was set as the total rainfall amount R0:
- -
- For K40A: R0 = 100 mm/h × 9 min = 100 mm/h × 0.15 h = 15 mm;
- -
- For K8.5A, Ksoil: R0 = 100 mm/h × 10 min = 100 mm/h × 0.17 h = 17 mm.
In this section, the model embankment was first subjected to the precipitation of R equal to 0.5R0. As a result, the rainfall-induced shear strain was 3.88% for K8.5A, 4.69% for Ksoil, and 3.11% for K40A. After the rainfall had stopped for 90 s, seismic loadings were applied when the residual pore water pressure was still high. The total number of cycles was 100 divided into five applying times, each time was about 75 s apart.
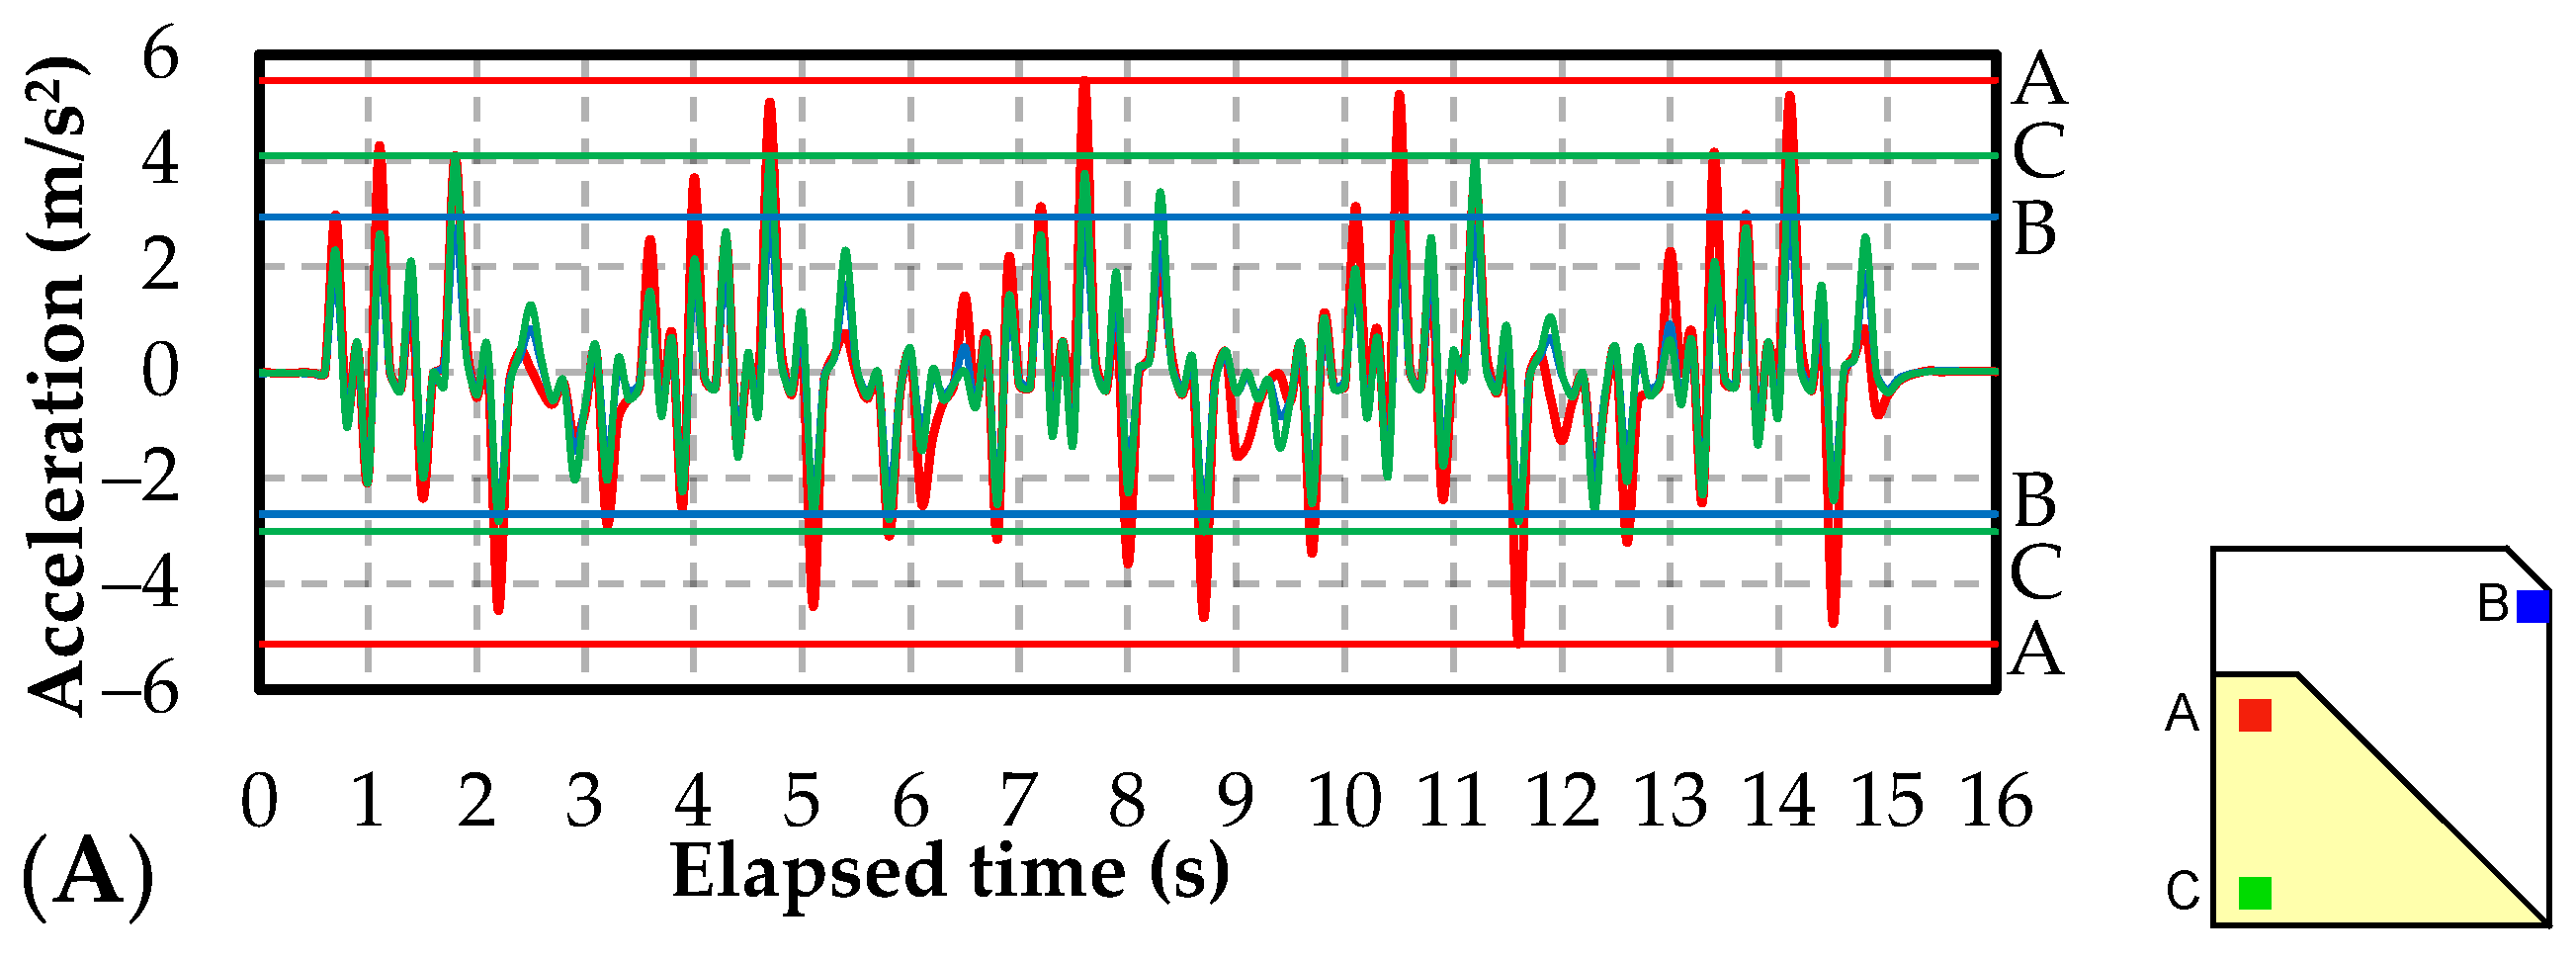
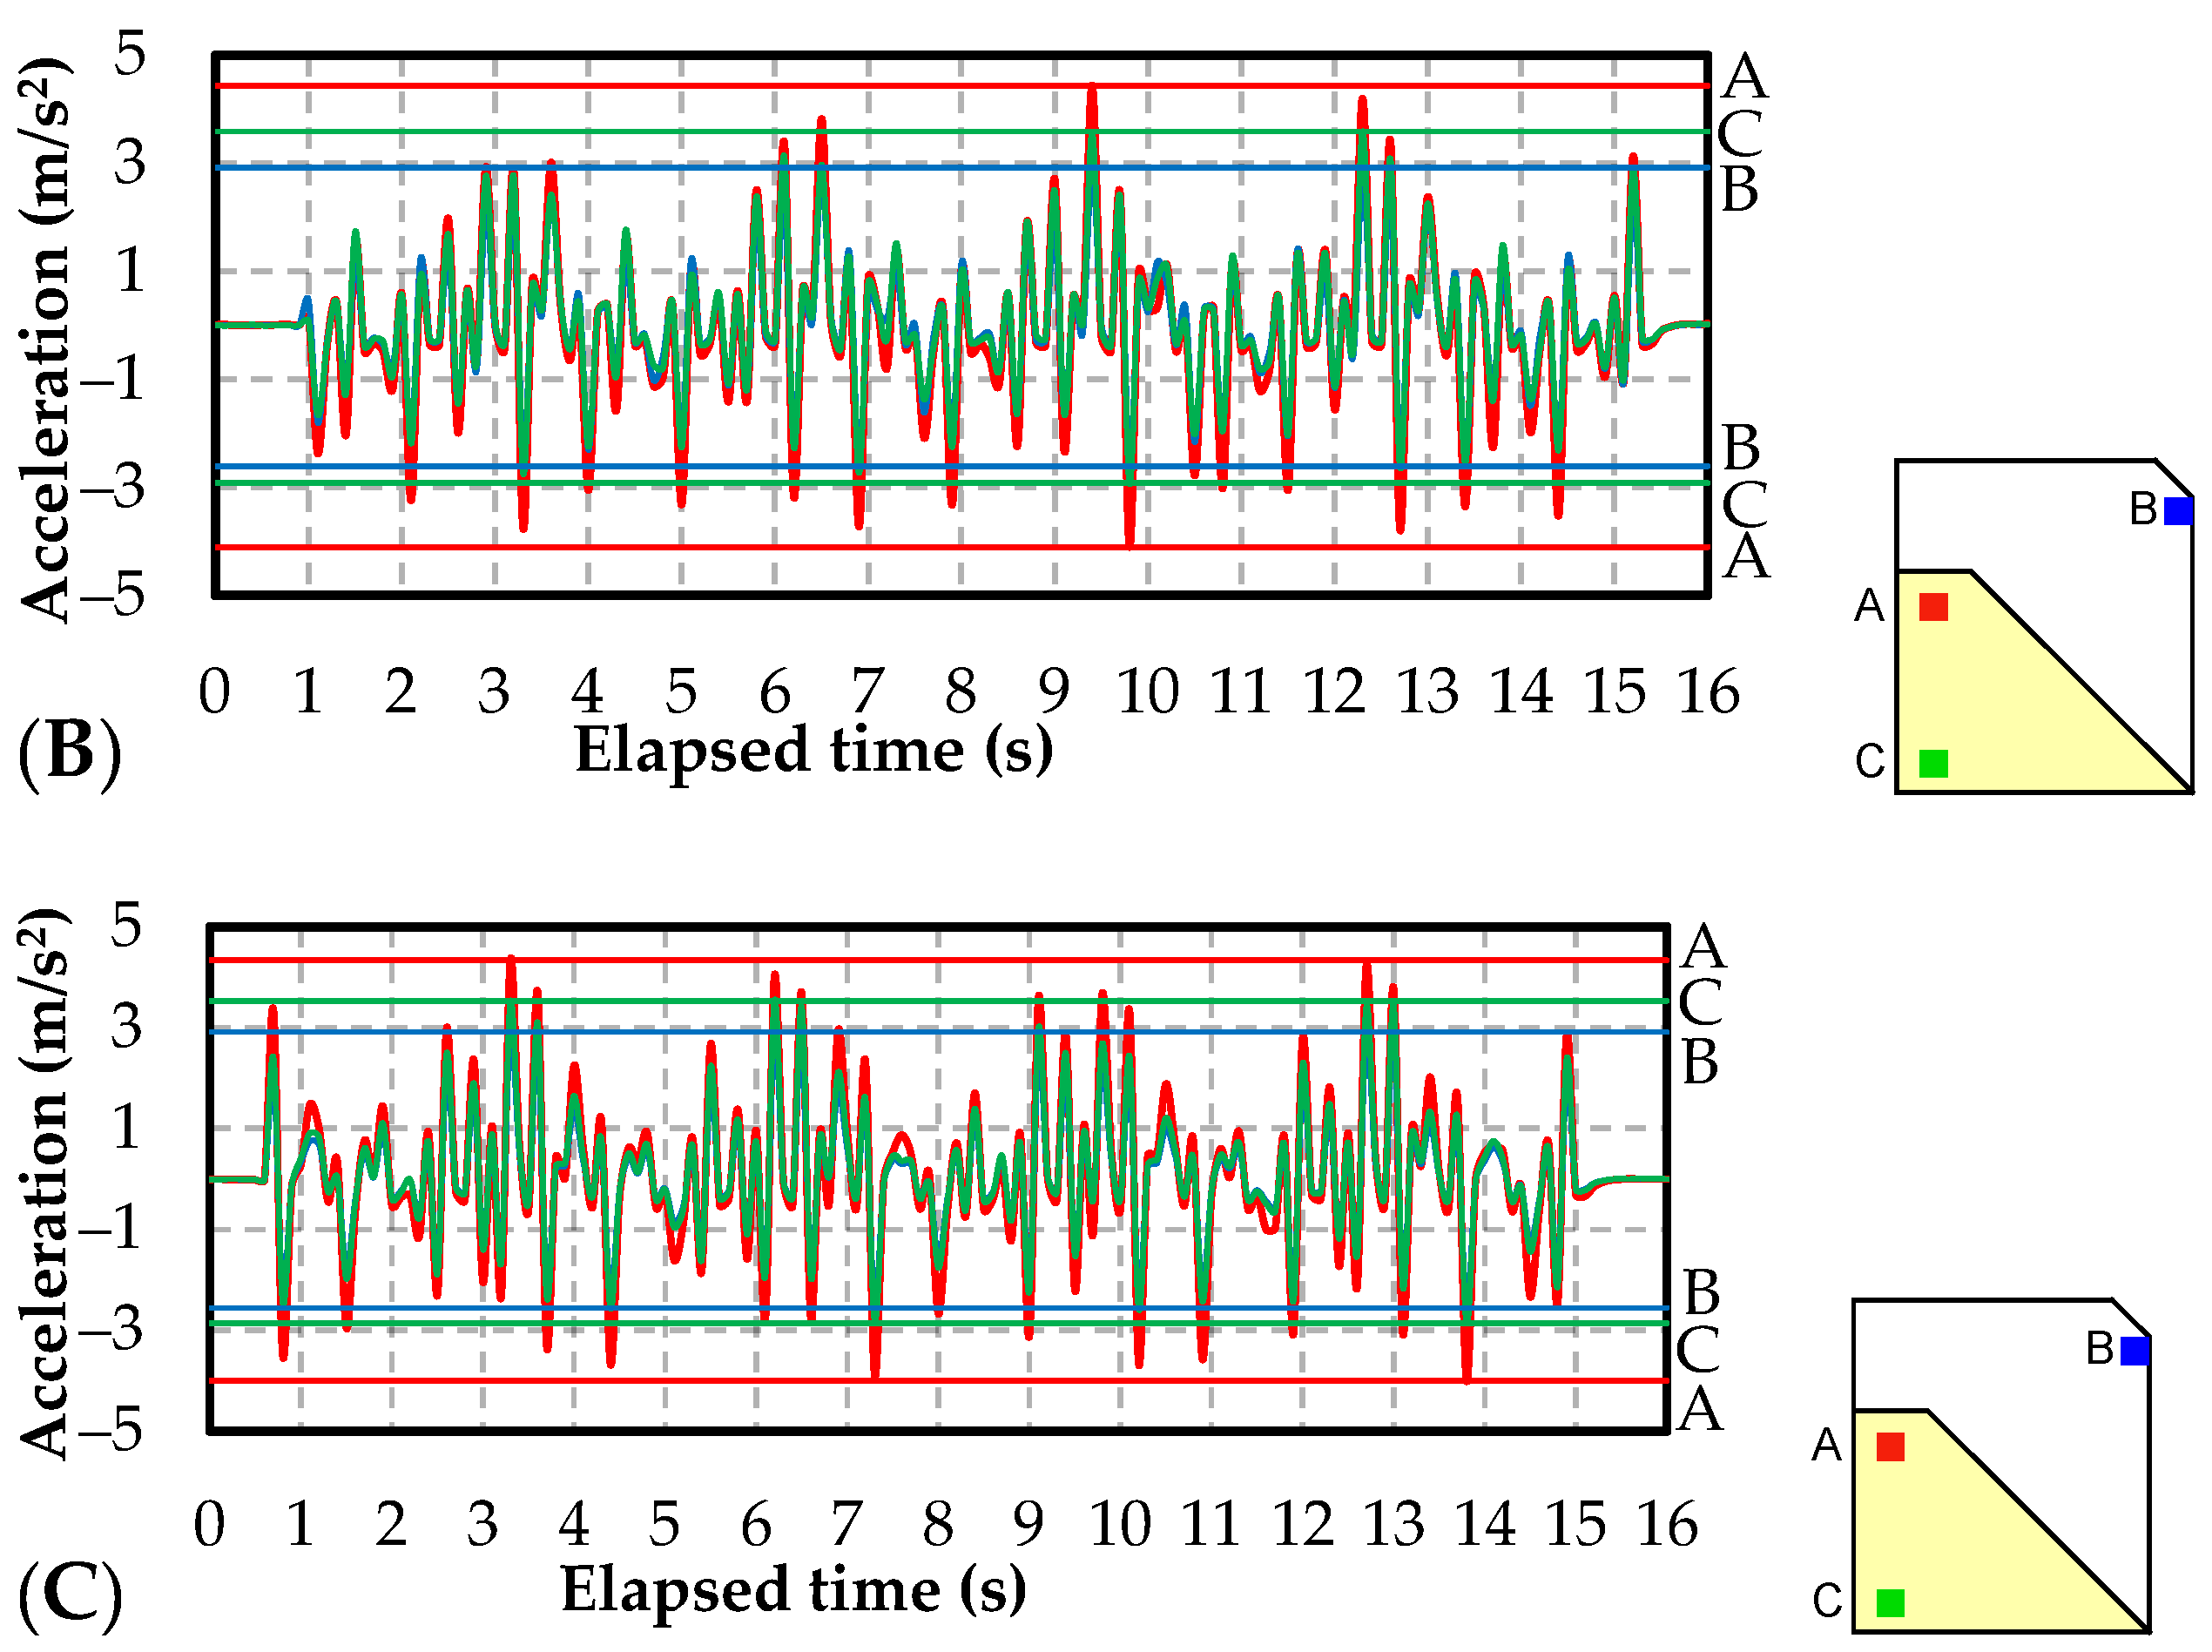
The response acceleration due to post-rainfall earthquakes at different locations inside the model embankment is shown in Figure 18. The previous rainfall caused this behavior not to retain the periodicity as in the earthquake-only experiment, but the acceleration at the upper parts was always higher than those at the lower parts of the slope. The maximum value of the acceleration at the crown area in the case of K8.5A, Ksoil, and K40A were 5.51, 4.43, and 4.33 (m/s2), respectively. It can be seen that these values were higher than the value of 3.2 m/s2 in the case of the earthquake-only experiment. This is considered to be due to the deformation and the change in soil structure generated by previous rainfall.
The behavior of saturation degree under the post-rainfall earthquake is shown in Figure 19. As can be seen, the variation during rainfall was similar to that of the beginning of the rainfall-only experiment: sm1, sm3, and sm6 started to increase due to the infiltration of rainwater but did not yet reach their maximum value while sm2, sm4, and sm5 were almost unchanged. When cyclic loadings were applied, a general trend was observed for all three samples: sm1, sm3, and sm6 increased while sm2 and sm5 decreased. In which, the change in sm1 and sm2 was more obvious than that of sm6 and sm5. Under the effect of seismic loadings, the particles rearrange, and the pore size changes, leading to the movement of water in the pore. Through the change in the distribution of water content before and after the earthquake as shown in Figure 20, we can see that the cyclic loadings have the effect of pushing water from the inside to the outside of the model embankment. Another point worth noting for the K40A case was the difficulty of drainage after earthquakes, which occurred not only in the basement but also in the upper parts of the slope. Thus, cyclic loadings can cause a blocking effect due to fine particle concentration at any point in the K40A embankment.
The change in pore water pressure during post-rainfall earthquakes is shown in Figure 21. Similar to the rainfall-only experiment, the measured values at the positions of pw1, pw2, and pw3 both increased during rainfall, and the difference between them was small. During earthquakes, the pore water pressure changed periodically. As the shaking table begins to move, it forces the slope back causing volume contraction and a decrease in voids, increasing pore water pressure. When the shaking table returns to the original position, the soil on the slope has a large degree of freedom, the pores between the particles increase, so the pore water pressure decreases. The amplitude of this periodical change in pore water pressure was greatest in the case of K8.5A. Figure 21 ignored these very rapid variations and focused on the changing trend of pore water pressure after earthquakes. As presented in the above section, earthquakes cause pore water to move outwards. Therefore, pw1, pw2, and pw3 placed near the slope surface increased together under the effect of cyclic loadings. It can be seen that the increase in pw1 near the crown of the slope was larger than that of pw2 and pw3. In the case of K8.5A, the pore water pressure at pw1 exceeded one at the first time of seismic loading and the flow deformation near the crown caused slope failure. During the 4th seismic loading, the pore water pressure of pw3 increased suddenly, causing the shear strength to rapidly decrease, the two soil sections were separated, creating cracks that were recorded near the basement. Pw1 in the case of Ksoil reached a value of one at about the 70th cycle, corresponding to the total shear strain due to rainfall and earthquake surpassing 6%. In the case of K40A, pw1 was still less than one after 100 cycles and only exceeded one at about the 140th cycle. This is because the shear strain due to rainfall was smaller in this case. As can be seen in most tests, the point of shear strain due to rainfall and earthquake reaching 6% was relatively close to the time when the pore water pressure ratio reaches one. Thus, the measurement of pore water pressure still plays an important role in assessing slope stability.
The increase in earthquake-induced shear strain of embankment subjected to previous rainfall is shown in Figure 22. In the figure, K8.5A was the fastest, and its rate was much higher than that of the other two samples. Meanwhile, the behavior of Ksoil and K40A was almost similar. The failure form of these two soils was also the settlement of the entire embankment due to the rearrangement effect of seismic loadings while the failure due to flow deformations and cracks were recorded in the case of K8.5A as mentioned above. Soils with small fine particle contents have higher hydraulic conductivity and pore water pressure is easier to increase during post-rainfall earthquakes. Meanwhile, high fines content soils, which have a small void ratio, increased their density even more during rainfall. Therefore, seismic loadings have difficulty in rearranging the particles to reduce pore size and increase pore water pressure. In addition, the increase in density also makes the stabilizing force due to self-weight more advantageous than the earthquake-induced destabilizing horizontal force. However, the characteristics that increase this resistance to seismic loadings in Ksoil and K40A are similar. As the fine content increases and exceeds a certain limit, its effect diminishes because fine particles occupy most of the voids in the soil. For these reasons, the earthquake resistance of compacted volcanic soil is subjected to previous rainfall increases with the increase in fine particle content. However, this strength does not increase further after the fine particle content exceeds a certain threshold of about 27% in this study.
4. Discussion
Using the same material as this study, Matsumura (2014) [31] investigated the effect of increment of fines content due to particle breakage on cyclic shear behavior through a series of cyclic undrained triaxial tests on compacted Komaoka volcanic soil with different fines content samples. The author found that as the fine particle content increases, the relationship between cyclic strength and dry density was proportional until the fine content was less than a certain threshold, after which it changed to inversely proportional. This fines content threshold was likely to be water content dependent: The higher the water content of the specimen, the lower the threshold of the fines content. When the soil moisture is equal to that of the model experiments in this study, the threshold is around 32%, and the declining behavior of cyclic strength appears to be weak after that. The elemental experiments apply many ideal conditions, the saturation progress in the triaxial experiments is not the same as the natural process. Therefore, it is necessary to verify these results with experiments that are closer to the field conditions. In the case that the increase in soil moisture was due to rainfall in the model tests in this study, the influence of fine particle content on cyclic strength confirmed a similar trend with [31].
As mentioned above, the area selected for sampling in this study is one of the sites that experienced the 2018 dual disaster and many major earthquakes [17,26,37]. A summary of the disasters that occurred in this area as well as the analysis of the large-scale slope failure/landslide at hillsides in the 2018 earthquake was performed by Kawamura et al., (2018) [26]. As for the Sapporo city area, Ishikawa et al., (2021) [17] reported the road cracks and subsidence caused by the 2018 earthquake (magnitude of M6.7), which was not recorded in the 2003 Tokachi-oki earthquake (magnitude of M8.0). The authors suggested that one of the reasons for the difference in the damage situation between these two severe earthquakes was the rainfall from Typhoon Jebi that preceded the 2018 earthquake. The rise of the groundwater level, which was reported in [17], may also be due to the blocking effect similar to that behavior of volcanic soils with high fine particles in the model experiment in this study. Watabe and Nishimura (2020) [37] reported the liquefaction phenomenon caused by the 2018 Hokkaido East Iburi Earthquake in the Satozuka district where the valley was filled with Spfl pumice sand deriving from the Lake Shikotsu caldera (same ejecta of volcano as the samples in this study). In order to provide a reasonable scenario for the observed ground movements, physical and mechanical tests were conducted with soil samples prepared based on actual field conditions prior to the earthquake: the degree of compaction was 70–75% and compaction water content was 47.2%. The results confirmed that despite having a high fine grains content of about 40%, the pumice fill was still highly susceptible to liquefaction. The reason is considered to be the loose condition of the soil although compacted on the wet side of optimum water content. The presented microscopic photographs showed the loose soil structure created with the aggregates formed by fine particles and an inter-pore network between these aggregates. The high angularity of these aggregates creates friction resulting in the need for a higher compaction effort to densify the soil. Therefore, the authors also suggested that if the fill material had been sufficiently compacted, the earthquake would not have caused liquefaction over such a wide area. The earthquake-only model experiments in this study partially proved this suggestion by recording the high cyclic strength of the compacted volcanic soils at a compaction degree of 90%. Furthermore, the effect of previous rainfall, which was only included as a potential factor in the disaster scenario in [37], was confirmed in this study. It can be seen that the conclusions from the model test results in this study are similar to the previously published elemental experiment results or disaster reports for the same soil material. Moreover, an additional note raised by this study is that groundwater table lowering should be provided special attention in volcanic soils with high fine-grained content of about 40% or more. In contrast, embankments with a sharp reduction in fine particle content due to the washing effect of rainfall should also be assigned a higher warning level. From the results of model tests, increasing the fine particle content of the volcanic soil was shown to reduce the hydraulic conductivity as well as the rate of increase in the shear strain of the embankment under rainfall and earthquake. Therefore, the selection of the filling material with high fines content soil or a mixture of sand and fine grain is proposed in this study as a solution for engineering design in mitigating the impacts of dual disasters. For economic purposes, it is necessary to provide a reasonable threshold for this increase. Furthermore, volcanic soils with a high fine-grained content of 40% exhibited some negative behaviors in this study such as difficulty in drainage and blocking effects which may cause an increase in the groundwater table. Based on the analysis performed in Section 3, a fine particle content of 27% is recommended as a reference value for the design of embankments constructed by cohesionless soil materials such as Komaoka volcanic soil.
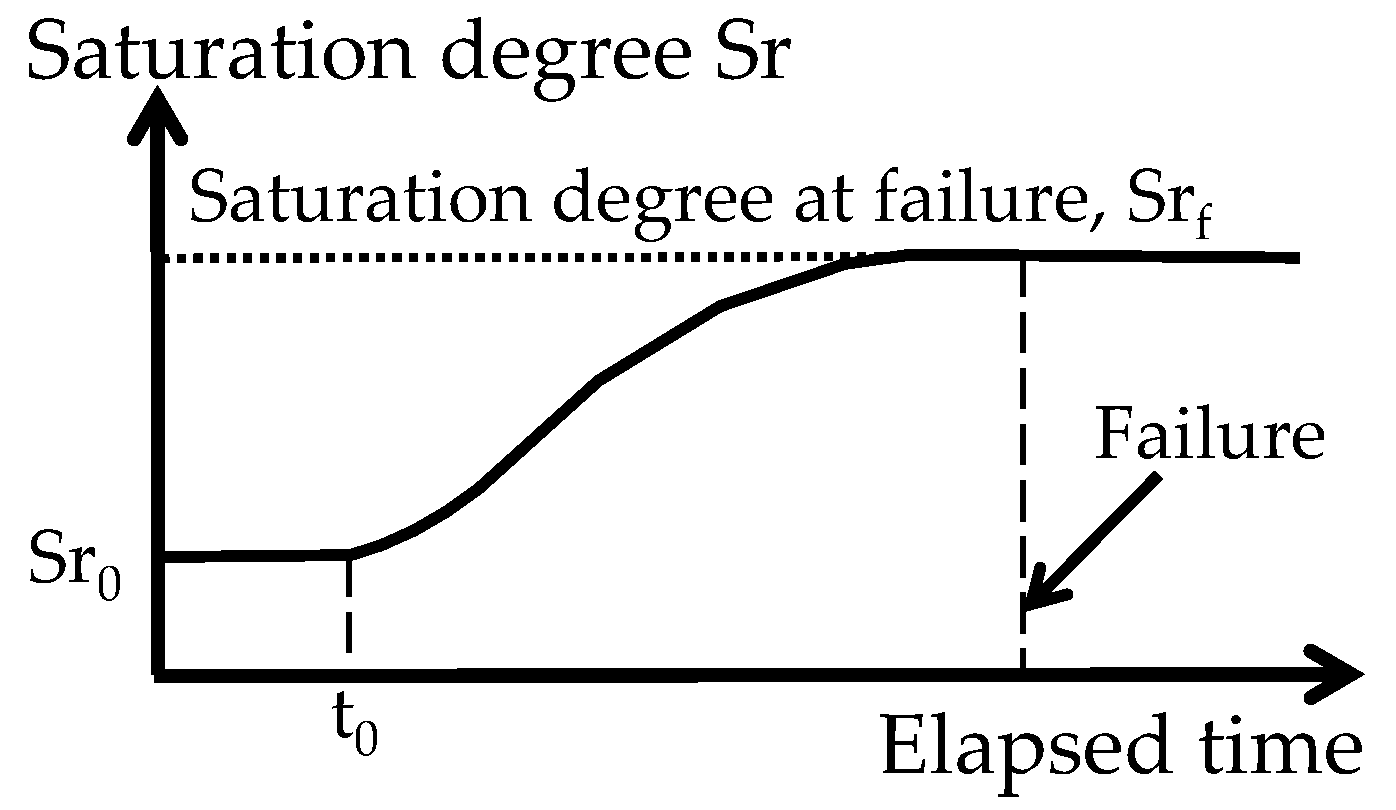
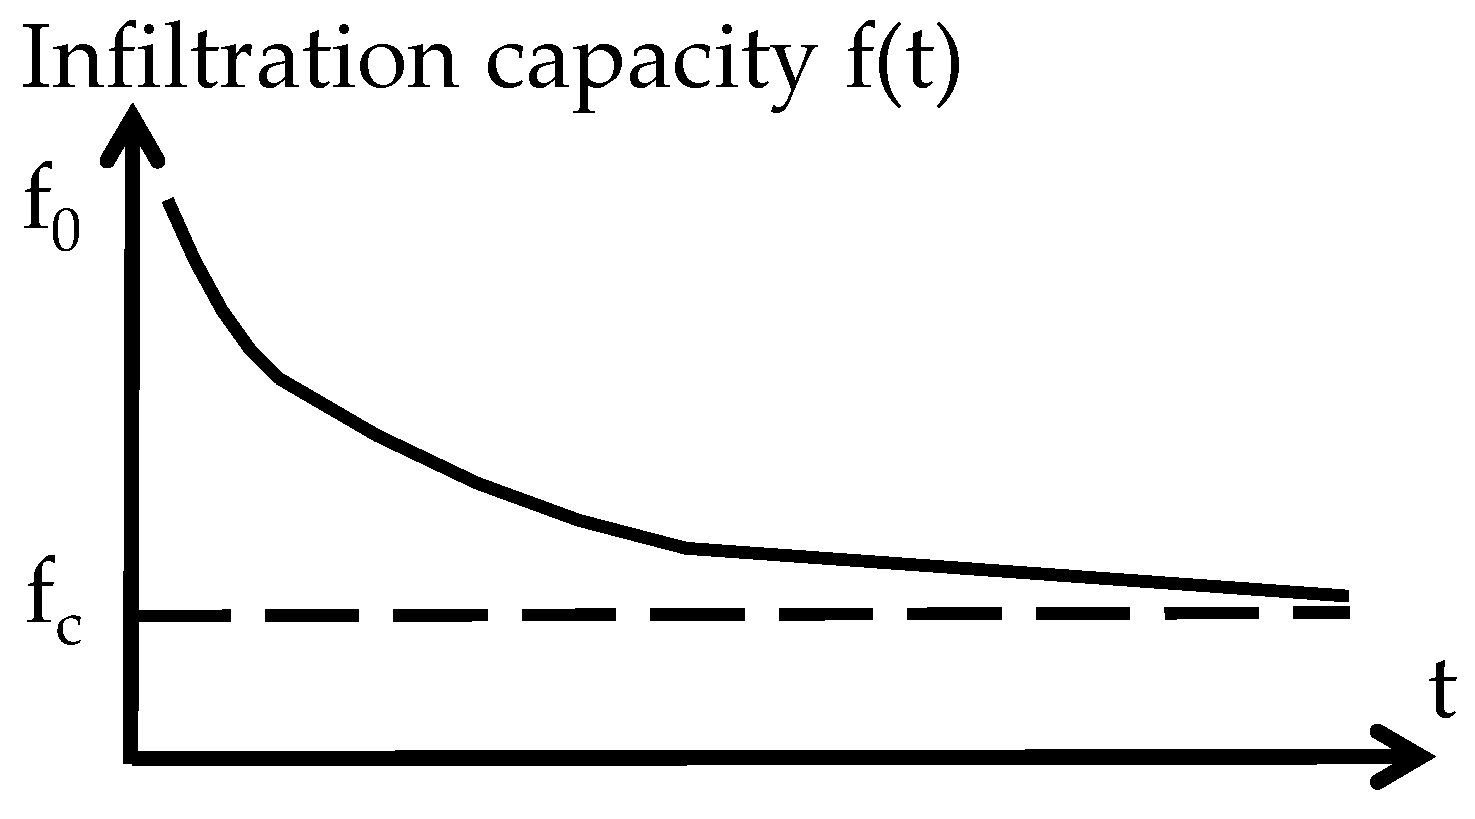
From Figure 12, the variation in the saturation degree during rainfall tests obtained in this study is typified as shown in Figure 23. On the other hand, Figure 24 shows the change in soil infiltration capacity during rainfall presented by Horton (1939) [38]. It can be seen from these two figures that the water content in the soil gradually increases while the permeability gradually decreases. When the soil is completely saturated and cannot hold any more water, the saturation degree converges while the infiltration capacity reaches its minimum value. This relationship implies that changes in saturation degree over rainfall time can be expressed similarly to that of infiltration. The formula corresponding to the diagram in Figure 24 which determines the infiltration capacity of soil f(t) over rainfall time t is shown in Equation (2) [38].
where f0 is the initial infiltration capacity, fc is the final infiltration capacity, and k is the shape coefficient.
With the above-mentioned similarity, the same way was used to illustrate the time-dependent change in water content w(t) as shown in Equation (3):
where w0 and wf are the water content at the initial and failure conditions, respectively; while n is the shape coefficient of the curve. The time t0 is added as the starting moment of the rise in water content to account for the difference in position in the slope. Based on the behavior of saturation degree obtained from the experiments, t0 is assumed to depend on the distance to the slope surface and the soil permeability. The interesting point is that the coefficient n seems to be independent of k and equal to 0.008 (sm1, sm3, sm6) or 0.005 (sm2, sm5) in this study for all three soil samples of K8.5A, Ksoil, and K40A. Thus, the remaining unknown of the above equation is the water content at failure wf which is investigated in the following section.
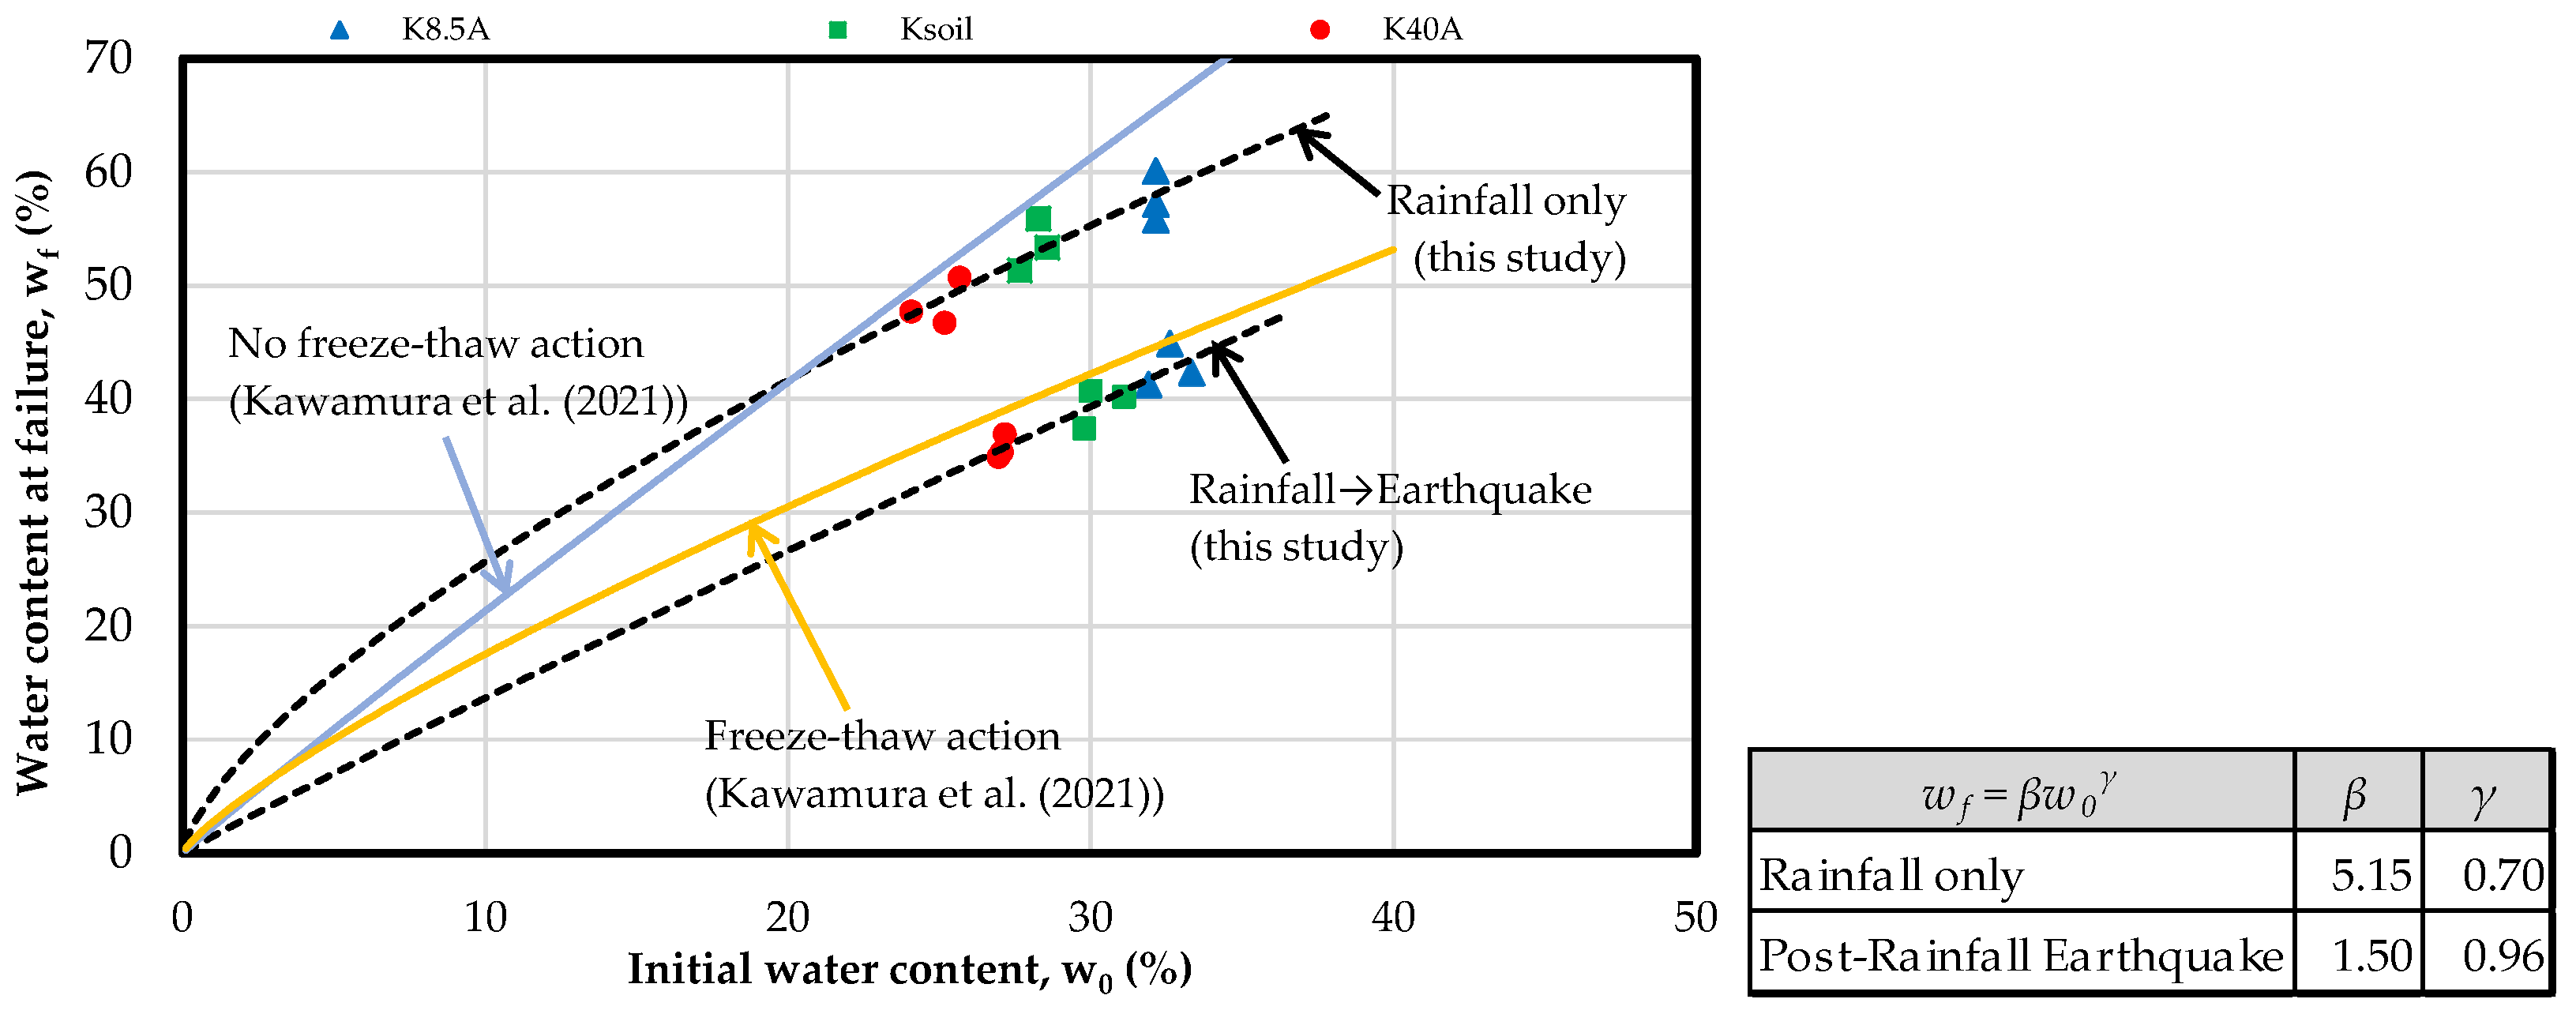
From the model test results, the relationship between initial water content w0 and water content at failure wf is summarized and illustrated in Figure 25. In addition to the results of the model tests in this study (dashed line), the data for the same material of Komaoka volcanic coarse-grained soil in Kawamura et al., (2021) [8] (solid line) were added for comparison purposes. As shown in the figure, the results of all three soil samples lie on the same curve in both the rainfall-only experiments and the post-rainfall earthquake experiments. The effect of dual disasters is demonstrated by the fact that the water content at failure in the case with seismic loadings is smaller. Moreover, the “rainfall-only” curve in this study is close to the “no freeze-thaw action” curve in [8] while the “post-rainfall seismic loadings” curve in this study is close to the “freeze-thaw action” curve in [8]. As can be seen, despite the different failure mechanisms, the failure point of slope in some specific cases (such as earthquake after rainfall and freeze-thaw action) is still similar. The relationship between both water contents in this study can also be expressed by a power function, similar to [8], as follows:
where values of coefficients β and γ are shown in Figure 25. These values combined with Equation (4) can be considered as a simple method to evaluate slope stability in practice with the measured water content as the object of assessment. However, the above results may change with variations in soil materials and inherent errors such as the scale effect. In any case, further discussions with results from field monitoring of natural slopes or full-scale embankments are required.
5. Conclusions
From a series of rainfall and earthquake experiments on model embankments constructed by Komaoka volcanic coarse-grained soil with different fines content, the following conclusions were obtained:
- -
- The fine particle content has a great influence and must be taken into account when studying the stability of the volcanic embankment under the independent or combined effects of rainfall and earthquake;
- -
- At the same degree of compaction, the permeability of volcanic soils decreases with the increase in the fine grains content. However, the rainfall-induced failure of the slope does not depend on this factor when the shear strain is less than 6%;
- -
- The earthquake resistance of the compacted volcanic embankment subjected to previous rainfall increases as the fine content increase. Even so, this increment in seismic strength is not significant when the fines content was higher than 27%;
- -
- A simple method to evaluate slope stability in practice with the measured water content as the object of assessment was proposed based on the change in soil infiltration capacity.
Author Contributions
Conceptualization, S.K. and T.N.N.; methodology, S.K. and T.N.N.; investigation, T.N.N., T.I. and M.H.D.; data curation, T.N.N., T.I. and M.H.D.; writing—original draft preparation, T.N.N.; writing—review and editing, S.K. and M.H.D.; project administration, S.K.; funding acquisition, S.K. All authors have read and agreed to the published version of the manuscript.
Funding
This research was funded by JSPS KAKENHI (B) (Grant Number 20H02404) and JST SPRING (Grant Number JPMJSP2153) in Japan.
Institutional Review Board Statement
Not applicable.
Informed Consent Statement
Not applicable.
Data Availability Statement
Data is contained within the article.
Acknowledgments
The authors wish to express their sincere gratitude to S. Miura (Hokkaido University, Japan) and Y. Kubo (Muroran Institute of Technology, Japan).
Conflicts of Interest
The authors declare no conflict of interest.
References
- Terzaghi, K. Mechanism of Landslides. In Application of Geology to Engineering Practice; Geological Society of America: Boulder, CO, USA, 1950; pp. 83–123. [Google Scholar]
- Kawamura, S.; Miura, S.; Ishikawa, T.; Yokohama, S. Rainfall-Induced Failure of Unsaturated Volcanic Slope Subjected to Freeze-Thaw Action and Its Mechanism. J. Geotech. Eng. 2010, 66, 577–594. (In Japanese) [Google Scholar] [CrossRef] [Green Version]
- Kawamura, S.; Miura, S.; Yokohama, S.; Kudo, A.; Kaiya, N. Field Monitoring of Embankment Constructed by Volcanic Soil and Its Evaluation. In Proceedings of the Geo-Congress 2013, San Diego, CA, USA, 3–7 March 2013; American Society of Civil Engineers: Reston, CV, USA, 2013; pp. 373–382. [Google Scholar]
- Kawamura, S.; Miura, S. Rainfall-Induced Failures of Volcanic Slopes Subjected to Freezing and Thawing. Soils Found. 2013, 53, 443–461. [Google Scholar] [CrossRef] [Green Version]
- Kawamura, S.; Miura, S. Failure of Volcanic Slopes in Cold Regions and Its Prediction. Procedia Earth Planet. Sci. 2014, 9, 143–152. [Google Scholar] [CrossRef] [Green Version]
- Kawamura, S.; Miura, S. Stability of Volcanic Slopes in Cold Regions. J. Geogr. Geol. 2014, 6, 34–54. [Google Scholar] [CrossRef] [Green Version]
- Kawamura, S.; Miura, S.; Dao, H.M.; Yamada, R. Rainfall-Induced Failure of Volcanic Embankments Subjected to Cyclic Loadings in Cold Regions. In Proceedings of the Geo-China 2016, Jinan, China, 25–27 July 2016; American Society of Civil Engineers: Reston, CV, USA, 2016; pp. 116–123. [Google Scholar]
- Kawamura, S.; Miura, S.; Matsumura, S. Stability Monitoring of Embankments Constructed by Volcanic Coarse-Grained Soil in Snowy-Cold Regions. J. Cold Reg. Eng. 2021, 35, 04020030. [Google Scholar] [CrossRef]
- Tuladhar, G.R.; Tiwari, B.; Marui, H. Post-Earthquake Evaluation of Higashi Takezawa Landslide Located at Niigata Prefecture of Japan. In Dynamic Response and Soil Properties, Proceedings of the Geo-Denver 2007, Denver, CO, USA, 18–21 February 2007; American Society of Civil Engineers: Reston, CV, USA, 2007; pp. 1–10. [Google Scholar]
- Matsumaru, T.; Uzuoka, R. Three-Phase Seepage-Deformation Coupled Analysis about Unsaturated Embankment Damaged by Earthquake. Int. J. Geomech. 2016, 16, C4016006. [Google Scholar] [CrossRef]
- Vickneswaran, T.; Ravichandran, N. Multi Hazard Analysis of Earth Slopes Using Coupled Geotechnical-Hydrological Finite Element Model. In Proceedings of the Geo-Congress 2020, Minneapolis, MN, USA, 25–28 February 2020; American Society of Civil Engineers: Reston, CV, USA, 2020; pp. 60–69. [Google Scholar]
- Rocha, M. The Possibility of Solving Soil Mechanics Problems by the use of Models. In Proceedings of the 4th International Conference on Soil Mechanics and Foundation Engineering, London, UK, 12–24 August 1957; Butterworths Scientific Publications: London, UK, 1957; Volume 1, pp. 183–188. [Google Scholar]
- Minardo, A.; Zeni, L.; Coscetta, A.; Catalano, E.; Zeni, G.; Damiano, E.; De Cristofaro, M.; Olivares, L. Distributed Optical Fiber Sensor Applications in Geotechnical Monitoring. Sensors 2021, 21, 7514. [Google Scholar] [CrossRef] [PubMed]
- Zhang, Y.; Tang, H.; Li, C.; Lu, G.; Cai, Y.; Zhang, J.; Tan, F. Design and Testing of a Flexible Inclinometer Probe for Model Tests of Landslide Deep Displacement Measurement. Sensors 2018, 18, 224. [Google Scholar] [CrossRef] [PubMed] [Green Version]
- Tiwari, B.; Ajmera, B.; Tran, D. Influence of Post-Earthquake Rainfall on the Stability of Clay Slopes (IPL-192). In Proceedings of the Advancing Culture of Living with Landslides, Ljubljana, Slovenia, 29 May–2 June 2017; Springer Nature: Cham, Switzerland, 2017; pp. 429–436. [Google Scholar]
- Tiwari, B.; Ajmera, B.; Tran, D.; Caballero, S. Effect of Post-Earthquake Rainfall in Triggering Landslides. In Proceedings of the 19th International Conference on Soil Mechanics and Geotechnical Engineering, Seoul, Korea, 17–22 September 2017; pp. 3533–3536. [Google Scholar]
- Ishikawa, T.; Yoshimi, M.; Isobe, K.; Yokohama, S. Reconnaissance Report on Geotechnical Damage Caused by 2018 Hokkaido Eastern Iburi Earthquake with JMA Seismic Intensity 7. Soils Found. 2021, 61, 1151–1171. [Google Scholar] [CrossRef]
- Ng, C.W.; Pang, Y.W. Experimental Investigations of the Soil-Water Characteristics of a Volcanic Soil. Can. Geotech. J. 2000, 37, 1252–1264. [Google Scholar] [CrossRef]
- Hernandez, O.; Neto, M.P.C.; Caicedo, B. Structural Features and Hydro-Mechanical Behaviour of a Compacted Andesitic Volcanic Soil. Géotech. Lett. 2018, 8, 195–200. [Google Scholar] [CrossRef] [Green Version]
- Miura, S.; Yagi, K.; Asonuma, T. Deformation-Strength Evaluation of Crushable Volcanic Soils by Laboratory and In-Situ Testing. Soils Found. 2003, 43, 47–57. [Google Scholar] [CrossRef] [Green Version]
- Ishikawa, T.; Miura, S. Influence of Freeze-Thaw Action on Deformation-Strength Characteristics and Particle Crushability of Volcanic Coarse-Grained Soils. Soils Found. 2011, 51, 785–799. [Google Scholar] [CrossRef] [Green Version]
- Miura, S.; Yagi, K. Particle Breakage of Volcanic Coarse-Grained Soils and Its Evaluation. J. Geotech. Eng. 1997, 561, 257–269. (In Japanese) [Google Scholar] [CrossRef] [Green Version]
- Liu, X.; Yang, J. Laboratory Measurement of Small-Strain Shear Modulus of Volcanic Soil. In Proceedings of the Geo-Congress 2014 Technical Papers, Atlanta, GA, USA, 23–26 February 2014; American Society of Civil Engineers: Reston, CV, USA, 2014; pp. 113–122. [Google Scholar]
- Matsumura, S.; Tatsuoka, F. Effect of Compaction Conditions and Fines Content on Cyclic Undrained Strength of Saturated Soils. Soil Dyn. Earthq. Eng. 2018, 112, 152–161. [Google Scholar] [CrossRef]
- Hieu, D.M.; Kawamura, S.; Matsumura, S. Internal Erosion of Volcanic Coarse Grained Soils and Its Evaluation. Int. J. GEOMATE 2017, 13, 165–172. [Google Scholar] [CrossRef]
- Kawamura, S.; Kawajiri, S.; Hirose, W.; Watanabe, T. Slope Failures/Landslides over a Wide Area in the 2018 Hokkaido Eastern Iburi Earthquake. Soils Found. 2019, 59, 2376–2395. [Google Scholar] [CrossRef]
- JGS 0131-2009; Test Method for Particle Size Distribution of Soils. Japanese Geotechnical Society: Tokyo, Japan, 2009.
- JGS 0711-2009; Test Method for Soil Compaction Using a Rammer. Japanese Geotechnical Society: Tokyo, Japan, 2009.
- JGS 0161-2009; Test Method for Minimum and Maximum Densities of Sands. Japanese Geotechnical Society: Tokyo, Japan, 2009.
- Hayashi, M.; Kawamura, S. Effect of Particle Breakage on Permeability of Volcanic Coarse-Grained Soils. In Proceedings of the 54th Japan National Conference on Geotechnical Engineering, Saitama, Japan, 16–18 July 2019; Japanese Geotechnical Society: Tokyo, Japan, 2019; pp. 849–850. (In Japanese). [Google Scholar]
- Matsumura, S. Laboratory and In-Situ Studies on Mechanical Properties of Volcanic Soil Embankment in Cold Region. Ph.D. Thesis, Graduate School of Engineering, Hokkaido University, Hokkaido, Japan, 2014. [Google Scholar]
- Dao, M.H. Stability Evaluation on Internal Erosion of Volcanic Coarse-Grained Soil. Ph.D. Thesis, Graduate School of Engineering, Muroran Institute of Technology, Hokkaido, Japan, 2018. [Google Scholar]
- KYOWA. BPR-A-S Small-sized Pore Pressure Transducer—Technical Specifications. Available online: https://www.kyowa-ei.com/eng/product/category/sensors/bpr-a-s/index.html (accessed on 4 June 2022).
- METER Group. ECH2O EC-5—Technical Specifications. Available online: https://www.metergroup.com/en/meter-environment/products/ech20-ec-5/ech20-ec-5-tech-specs (accessed on 4 June 2022).
- METER Group. Cited Publications for ECH2O EC-5. Available online: https://www.metergroup.com/en/meter-environment/products/ech20-ec-5/cited-publications-ech20-ec-5 (accessed on 4 June 2022).
- KYOWA. ASW-A Waterproof Acceleration Transducer—Technical Specifications. Available online: https://www.kyowa-ei.com/eng/product/category/sensors/asw-a/index.html (accessed on 4 June 2022).
- Watabe, Y.; Nishimura, S. Ground Movements and Damage in Satozuka District, Sapporo Due to 2018 Hokkaido Eastern Iburi Earthquake. Soils Found. 2020, 60, 1331–1356. [Google Scholar] [CrossRef]
- Horton, R.E. Analysis of Runoff-Plat Experiments with Varying Infiltration-Capacity. Eos Trans. Am. Geophys. Union 1939, 20, 693–711. [Google Scholar] [CrossRef]
Figure 1.
Location of sampling site in this study.

Figure 2.
Grain size distribution of test samples in this study, according to [27].
Figure 2.
Grain size distribution of test samples in this study, according to [27].

Figure 3.
Compaction curve of test samples in this study, according to the A-b method [28].
Figure 3.
Compaction curve of test samples in this study, according to the A-b method [28].

Figure 4.
Influence of fines contents on compaction features of Komaoka volcanic soil (A) optimum water content wopt, (B) and maximum dry density ρd max.
Figure 4.
Influence of fines contents on compaction features of Komaoka volcanic soil (A) optimum water content wopt, (B) and maximum dry density ρd max.

Figure 5.
Maximum and minimum void ratio of Komaoka volcanic soils with different fine particle contents.
Figure 5.
Maximum and minimum void ratio of Komaoka volcanic soils with different fine particle contents.

Figure 6.
Changes in the mechanical and physical behavior of volcanic soils with water content (A) dry density, (B) shear Strength, (C) and permeability [30].
Figure 6.
Changes in the mechanical and physical behavior of volcanic soils with water content (A) dry density, (B) shear Strength, (C) and permeability [30].

Figure 7.
Piping test results of Komaoka volcanic soil, (A) velocity (B) and hydraulic conductivity [32].
Figure 7.
Piping test results of Komaoka volcanic soil, (A) velocity (B) and hydraulic conductivity [32].

Figure 8.
Overall view of apparatus in this study.

Figure 9.
Shape and dimensions of model embankments and setting positions of measuring instruments.

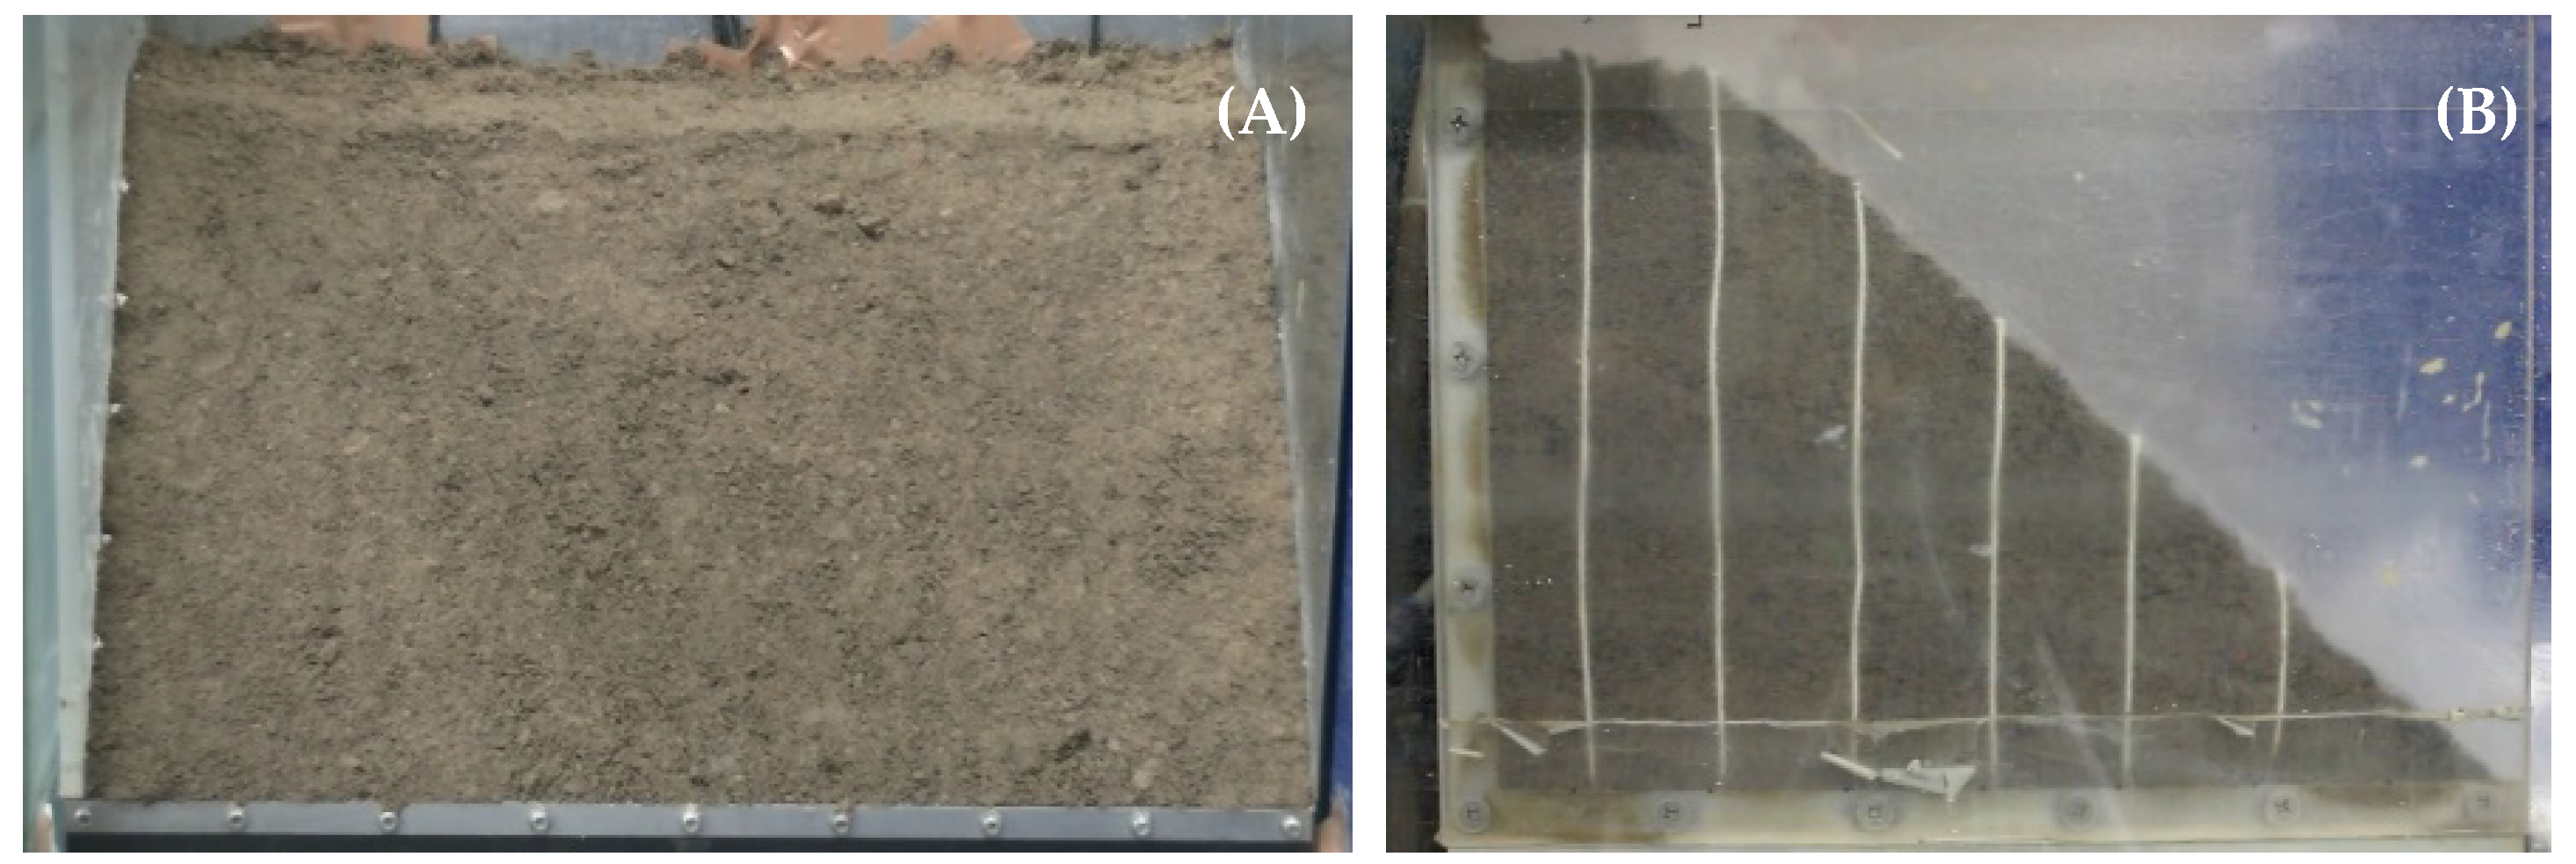
Figure 10.
The initial shape of the model embankments, (A) front view (B) and side view.

Figure 11.
Sieving test areas in this study.

Figure 12.
Changes in saturation degree during rainfall tests (A) K8.5A, (B) Ksoil, (C) and K40A.


Figure 13.
Water content distribution inside model embankments during and after rainfall tests (A) K8.5A, (B) Ksoil, (C) and K40A.
Figure 13.
Water content distribution inside model embankments during and after rainfall tests (A) K8.5A, (B) Ksoil, (C) and K40A.

Figure 14.
Change in pore water pressure during rainfall tests (A) K8.5A, (B) Ksoil, (C) and K40A.

Figure 15.
Change in rainfall-induced shear strain over time.

Figure 16.
Rainfall-induced failure type of model embankments (A) K8.5A (B) and K40A.

Figure 17.
Variation in accelerations at the basement, crown of the embankment, and shaking table in earthquake-only experiments [6].
Figure 17.
Variation in accelerations at the basement, crown of the embankment, and shaking table in earthquake-only experiments [6].

Figure 18.
Variation in accelerations during earthquakes at shaking table and basement, crown of embankments subjected to rainfall (A) K8.5A, (B) Ksoil, (C) and K40A.
Figure 18.
Variation in accelerations during earthquakes at shaking table and basement, crown of embankments subjected to rainfall (A) K8.5A, (B) Ksoil, (C) and K40A.


Figure 19.
Changes in saturation degree during post-rainfall earthquakes tests (A) K8.5A, (B) Ksoil, (C) and K40A.
Figure 19.
Changes in saturation degree during post-rainfall earthquakes tests (A) K8.5A, (B) Ksoil, (C) and K40A.

Figure 20.
Water content distribution inside model embankments during and after post-rainfall earthquakes tests (A) K8.5A, (B) Ksoil, (C) and K40A.
Figure 20.
Water content distribution inside model embankments during and after post-rainfall earthquakes tests (A) K8.5A, (B) Ksoil, (C) and K40A.

Figure 21.
Changes in pore water pressure during post-rainfall earthquakes tests (A) K8.5A, (B) Ksoil, (C) and K40A.
Figure 21.
Changes in pore water pressure during post-rainfall earthquakes tests (A) K8.5A, (B) Ksoil, (C) and K40A.

Figure 22.
The earthquake-induced shear strain of embankments subjected to rainfall.

Figure 23.
Typical variation in the saturation degree during rainfall tests in this study.

Figure 24.
Diagram of soil infiltration capacity during rainfall based on Horton’s concept [38].
Figure 24.
Diagram of soil infiltration capacity during rainfall based on Horton’s concept [38].

Figure 25.
Relationship between water content at initial and failure conditions for Komaoka volcanic soil [8].
Figure 25.
Relationship between water content at initial and failure conditions for Komaoka volcanic soil [8].


Table 1.
Physical properties of Spfl and Toyoura sand.
| Sample | ρs (g/cm3) | emax | emin | D501 (mm) | Uc2 | Fc3 (%) |
|---|---|---|---|---|---|---|
| Spfl | 2.47 | 2.25 | 1.21 | 0.27 | 46 | 26.0~42.6 |
| Toyoura sand | 2.68 | 0.96 | 0.64 | 0.18 | 1.5 | 0 |
1 mean grain size; 2 coefficient of uniformity; 3 natural fines content.
Table 2.
Physical properties of test samples in this study.
| Parameters | K8.5A | Ksoil | K40A |
|---|---|---|---|
| Fine particles content, Fc (%) | 8.5 | 27 | 40 |
| Optimum water content, wopt (%) | 35.81 | 34.32 | 31.20 |
| Maximum dry density, ρd max (g/cm3) | 1.0412 | 1.1049 | 1.1241 |
| Mean grain size, D50 (mm) | 0.50 | 0.27 | 0.16 |
| Uniformity coefficient, Uc | 10.6 | 62.5 | 42.8 |
| Soil particle density, ρs (g/cm3) | 2.5289 | 2.5203 | 2.5134 |
| Maximum void ratio, emax | 2.76 | 2.25 | 2.46 |
| Minimum void ratio, emin | 1.30 | 1.21 | 1.25 |
| Liquid limit, wL (%) | 46.7 | ||
| Plasticity index, wP (%) | Unavailable | ||
| Plasticity index, IP | NP | ||
Table 3.
Soil particle density of each grain size.
| Grain Size (mm) | 4.75~9.5 | 2.0~4.75 | 0.85~2.0 | 0.425~0.85 | 0.25~0.425 | 0.106~0.25 | 0.075~0.106 | <0.075 |
|---|---|---|---|---|---|---|---|---|
| Index i | 1 | 2 | 3 | 4 | 5 | 6 | 7 | 8 |
| Soil particle density, ρsi (g/cm3) | 2.595 | 2.591 | 2.569 | 2.587 | 2.519 | 2.444 | 2.414 | 2.484 |
Table 4.
Test conditions in this study.
| Parameters | K8.5A | Ksoil | K40A |
|---|---|---|---|
| Fines content (%) | 8.5 | 27 | 40 |
| Slope angle (°) | 45 | 45 | 45 |
| Length of base (mm) | 400 | 400 | 400 |
| Initial water content (%) | 32 | 31 | 28 |
| Rainfall intensity (mm/h) | 100 | 100 | 100 |
| Acceleration (m/s2) | 2.8 | 2.8 | 2.8 |
| Degree of compaction (%) | 90 | 90 | 90 |
| Dry density (g/cm3) | 0.93 | 0.99 | 1.00 |
| Void ratio | 1.72 | 1.55 | 1.50 |
| Rainfall-only experiments | |||
| Rainfall time (min) | 30 | 30 | 30, 75 |
| Post-rainfall earthquake experiments | |||
| Rainfall time (min) | 5 | 5 | 4.5 |
| Shear strain after rainfall (%) | 3.88 | 4.68 | 3.11 |
| Dissipation time (s) | 90 | 90 | 90 |
| Number of cycles | 100 | 100 | 100, 200 |
Table 5.
Similarity laws applied in this study.
| Parameters | Scale (Model/Prototype) |
|---|---|
| Length (L) | 1/λ |
| Time (t) | 1/λ0.75 |
| Soil density (ρ) | 1 |
| Gravity acceleration (g) | 1 |
| Stress (σ) | 1/λ |
| Strain (ε) | 1/λ0.5 |
| Deformation (d) | 1/λ1.5 |
| Friction (tanϕ) | 1 |
| Cohesion (c) | 1/λ |
| Permeability (f) | 1/λ0.25 |
| Pore water pressure (u) | 1/λ |
| Saturation degree (Sr) | 1 |
Table 6.
Fine particle content inside embankment after 30 min of rainfall.
| Test Samples | Fc1 (%) | Fc2 (%) | Fc3 (%) | Fc4 (%) | m4 (kg) |
|---|---|---|---|---|---|
| K8.5A | 5.47 | 8.61 | 9.12 | 12.68 | 6.22 |
| Ksoil | 24.24 | 27.34 | 28.49 | 38.49 | 0.84 |
| K40A | 37.07 | 40.24 | 41.18 | 53.33 | 1.02 |
Publisher’s Note: MDPI stays neutral with regard to jurisdictional claims in published maps and institutional affiliations. |
© 2022 by the authors. Licensee MDPI, Basel, Switzerland. This article is an open access article distributed under the terms and conditions of the Creative Commons Attribution (CC BY) license (https://creativecommons.org/licenses/by/4.0/).
Share and Cite
MDPI and ACS Style
Nguyen, T.N.; Kawamura, S.; Dao, M.H.; Inaba, T. Influence of Fines Content on the Stability of Volcanic Embankments under Rainfall and Earthquake. Water 2022, 14, 2096. https://doi.org/10.3390/w14132096
AMA Style
Nguyen TN, Kawamura S, Dao MH, Inaba T. Influence of Fines Content on the Stability of Volcanic Embankments under Rainfall and Earthquake. Water. 2022; 14(13):2096. https://doi.org/10.3390/w14132096
Chicago/Turabian StyleNguyen, Trong Nam, Shima Kawamura, Minh Hieu Dao, and Takumi Inaba. 2022. "Influence of Fines Content on the Stability of Volcanic Embankments under Rainfall and Earthquake" Water 14, no. 13: 2096. https://doi.org/10.3390/w14132096
Note that from the first issue of 2016, this journal uses article numbers instead of page numbers. See further details here.