
Damming-Induced Hydrogeomorphic Transition in Downstream Channel and Delta: A Case Study of the Yellow River, China
by
 ,
,
Hongyu Ji
1, 
Shenliang Chen
1,*,
Chao Jiang
2,
Yaoshen Fan
3,
Yutao Fu
1,
Peng Li
1 and
Fucheng Liu
4 1
State Key Laboratory of Estuarine and Coastal Research, East China Normal University, Shanghai 200241, China
2
School of Urban and Planning, Yancheng Teachers University, Yancheng 224007, China
3
Yellow River Institute of Hydraulic Research, Yellow River Conservancy Commission, Zhengzhou 450003, China
4
School of Marine Technology and Geomatics, Jiangsu Ocean University, Lianyungang 222005, China
*
Author to whom correspondence should be addressed.
Water 2022, 14(13), 2079; https://doi.org/10.3390/w14132079
Submission received: 5 June 2022
/
Revised: 24 June 2022
/
Accepted: 27 June 2022
/
Published: 29 June 2022
(This article belongs to the Section Water Erosion and Sediment Transport)
Abstract
:River dynamics and sediment budget play a crucial role in shaping geomorphic variability of river channels and deltaic environments. Basin-scale human activities, including dam construction, induce alterations in river flow and sediment dynamics in the downstream channels and to the delta, and quantification of sediment source shift along downstream fluvial-deltaic systems is often uncertain. This study analyzed the river regime changes and sediment dynamics of a typical sediment-laden fluvial-deltaic system—the lower Yellow River (LYR) and the Yellow River Delta (YRD) —to assess the integrated effects of dam impoundment and dam-based river regulation schemes on downstream hydrogeomorphic transition processes. The Xiaolangdi (XLD) Reservoir, which was completed in 2000 with a total storage of 12.7 km3, is the final reservoir located in the middle Yellow River and plays an important role in flood control and energy supply. Following the full operation of XLD Reservoir, the relationship between water and sediment in the LYR became more balanced, with a drastic decline of sediment input and seasonal migrations of floodwaters. The interannual variability of water levels at downstream hydrological stations indicated a geomorphic transition in the LYR from net deposition to erosion state. The building of the XLD Reservoir caused a downstream shift of river-originated sediment source and 48% of the total sediment delivered to the YRD was derived from the LYR. However, the reduced sediment delivery since 2000 has still triggered net land loss regarding the YRD system, with a strong spatial variability which is dominated by the reduced accretion at the active delta front and erosion at the abandoned river mouth and coastal engineering zone. Compared with other environmental factors, the construction of upstream dams contributed the most to the decline of downstream sediment delivery over the past decades. The challenge for sustainable sediment management is the gradual decline of scouring efficiency as the riverbed sediment is coarsening. Our study suggests that future river regulation strategies should consider the geomorphic sustainability of both the LYR and the YRD system.
1. Introduction
Rivers feed their lower reaches, floodplains, and deltaic systems with sediment and solute mass. Sediment transport and its flux are highly dynamic from lower reaches to estuaries with profound impacts on regional morphological variability [1,2] and biogeochemical cycles [3]. Along with intensified basin-wide human activities, including construction of dams, soil and water conservation practices, and water diversion projects over the past few decades, fluvial-deltaic systems have become highly human-modified and intensively regulated [4,5]. It is estimated that the fluvial regimes of over half of the world’s large river systems have been intensively affected by dam-based impacts [6,7].
As a continuum between land–sea interface, the evolutionary trends of river channel and estuarine coast are both influenced by watershed management [8,9]. The sediment supply from the river to the coastal ocean varies significantly due to human alterations and climatic changes [10,11,12,13]. Construction of reservoirs and dams often causes the decline of sediment delivery to downstream channels and the delta, with profound morphological [14] and environmental impacts [15] on the lower fluvial-deltaic system. For example, dams built in the Amazon Basin (South America) have reduced sediment fluxes at lower reaches and to the delta plain, influencing coastal and marine ecosystem functions [16]. In the Mekong River (Southeast Asia), entrapment of sediment by upstream dams has induced downstream channel incision and bank collapse [17], threatening the sustainability of delta [18,19]. The sediment trapping effect of dams has shaped the Missouri–Mississippi river system (the United States) from transport-limited to supply-limited [20], inducing riverbed erosion and channelization in the lower Missouri River [21] and delta degradation [22]. In the Changjiang River (China), the closure of the Three Gorges Dam has also led to significant downstream channel erosion and sediment source shifts towards the middle-lower reach [4], and has triggered delta front transition from progradation to recession [23]. It should be noticed that the sediment entrapment and flow regulation by reservoirs and dams in recent decades exacerbated the external environmental change to the fluvial-deltaic system [24]. Under such circumstances, research on sediment budget from terrestrial fields to coastal areas needs expanded long-term monitoring [25], numerical modeling [26,27], and experimental investigations [28], which are fundamental and essential to develop effective strategies for the sustainment of fluvial-deltaic systems [29,30].
The Yellow River (Huanghe) is well-known as a sediment-laden river with high suspended sediment concentrations [31]. The lower river-delta system is regarded as the primary geomorphic unit for sediment deposition in history [32]. In recent decades, the fluvial-deltaic system has been heavily dammed and met two main challenges from the geomorphic perspective: extensive channel siltation behind dams and in the Lower Yellow River (LYR), and the coastal erosion of the Yellow River Delta (YRD). The Water-Sediment Regulation Scheme (WSRS), jointly facilitated by middle-reach reservoirs, has been implemented since 2002 by managing water and sediment fluxes to alleviate this situation [32]. This basin-scale river regulation effort has reshaped the morphodynamic processes of the LYR and the YRD. At the event-scale, man-made flood peaks during WSRS have replaced the natural regime during flood seasons [33], which has sufficiently scoured the lower riverbed [34] and rapidly built deltaic land [35] in a very short period (within 20 days) each year. Notable studies in this regard also quantitatively assessed the lower-reach channel geometry changes, including bank full area variations, channel incision depth changes, and lateral migration [36,37,38]. Attention was also paid to connecting the morphological evolution of the subaerial and subaqueous vicinities of the YRD to the upstream sediment input changes [39,40,41].
Previous studies have primarily focused on the morphological changes of the LYR and YRD as separate geomorphic units [34,39], but few studies concentrated on downstream hydrogeomorphic transition process of the river–estuary system as a continuum. Furthermore, the sediment budget and its possible relation to the shift in fluvial sediment source and delta evolution remain highly dynamic. To achieve erosion–accretion balance and geomorphic sustainability at the lower fluvial-deltaic system, we need to investigate: (1) the critical fluvial regime changes that determine geomorphic transition of the LYR, (2) the spatial-temporal variability in sediment dynamics and scouring efficiency along the LYR, and (3) the impact of sediment source shift in shaping deltaic evolution processes.
Thus, in this work, the LYR and the modern YRD were selected as the study area. Using multi-source hydrologic, morphologic, and remote sensing data, we focused on the relationship changes of downstream water and sediment discharge after the operation of XLD Reservoir. The lower reaches and deltaic vicinity of the Yellow River were studied for spatial-temporal morphologic response under the new regime of river delivery. As other fluvial-deltaic systems worldwide become heavily dammed, the LYR and its delta would serve as a typical environment for studying the relationship between dam-based river regulation and its hydrogeomorphic responses. The findings of this study will also contribute to shedding light on the fluvial regime changes and its potential impacts on the transition of fluvial sediment source of mega-river systems.
2. Materials and Methods
2.1. Regional Settings
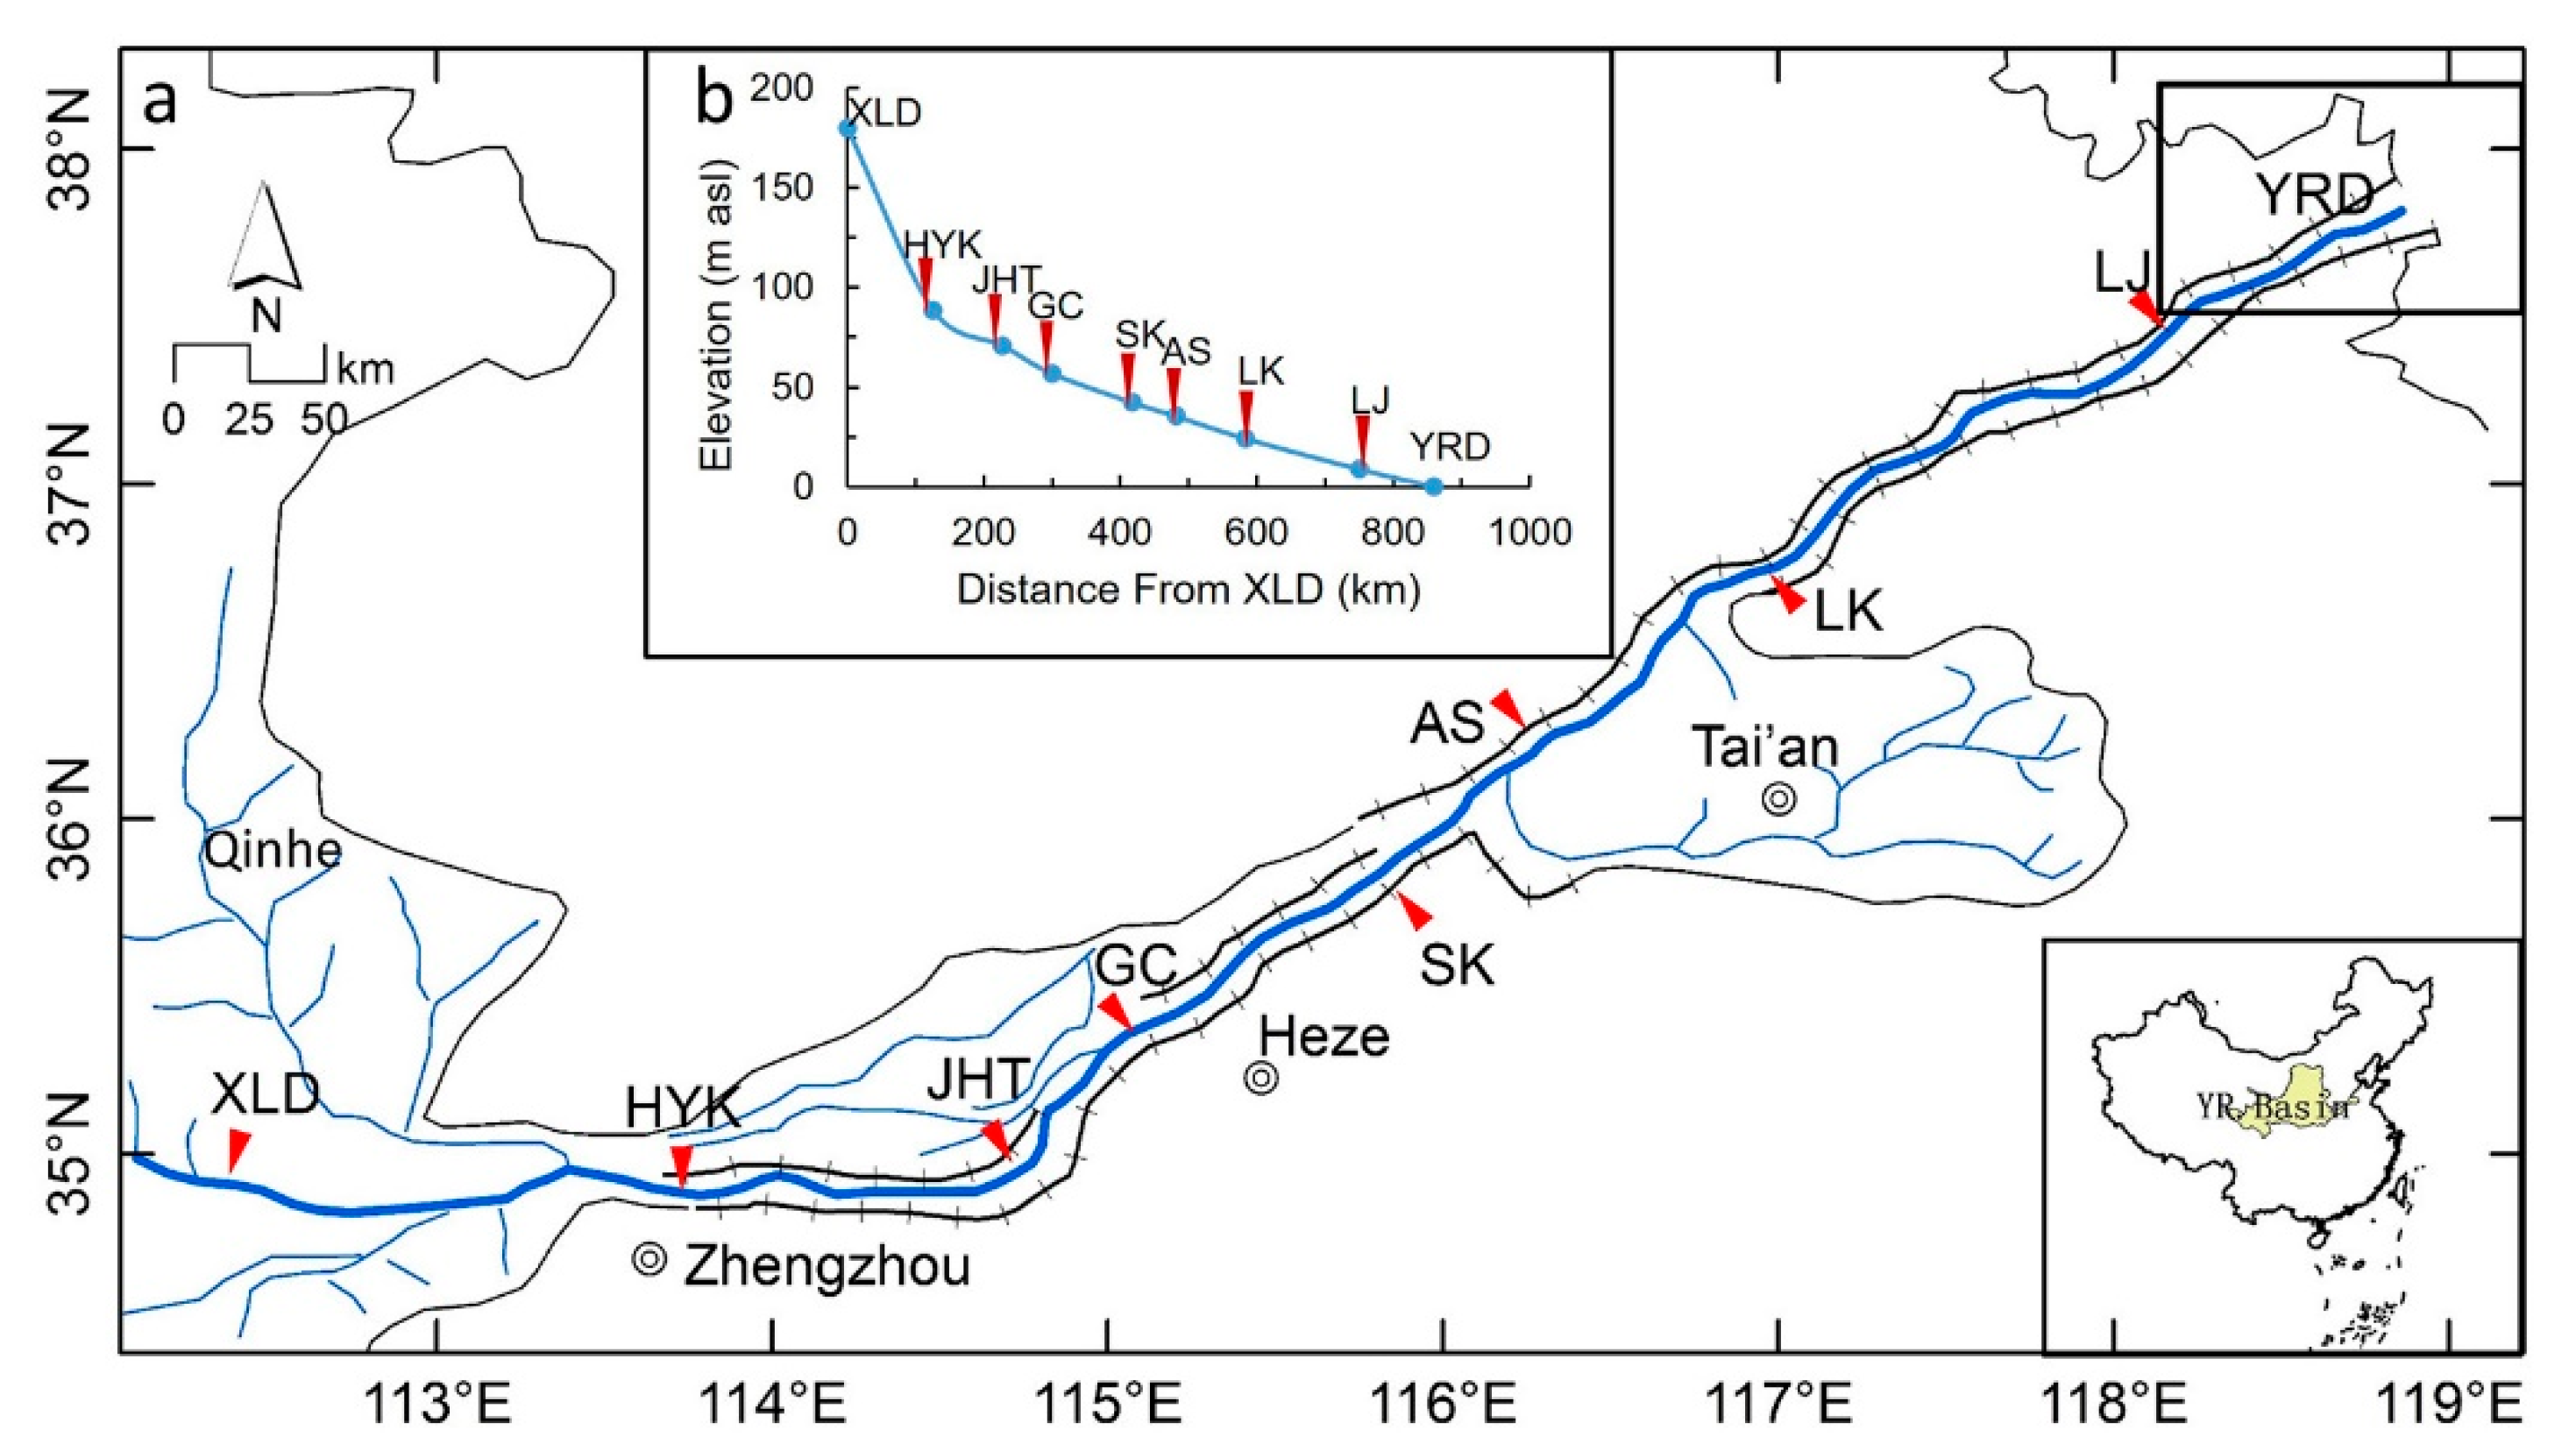
The Yellow River originates from the Tibetan Plateau, runs eastward across the Loess Plateau and the North China Plain, and empties into the Bohai Sea, with a mainstream length of 5464 km. The sediment scoured from the Loess Plateau in the middle reaches can account for more than 90% of the river basin’s total sediment supply [42]. Extending from Huayuankou (HYK) to Lijin (LJ), the LYR was the primary sedimentation region due to reduced longitudinal slope and few tributaries (Figure 1). The continuous and severe sedimentation caused the riverbed to rise above surrounding farmland with an elevation of 3–7 m, known as the “perched river” [43]. Over the past decades, dams were constructed in the Yellow River Basin (YRB) to generate hydroelectricity and control floods. Over 3000 dams with a total storage of 72 km3 were completed by 2007 [44]. The channel fragmentation and sediment entrapment induced by high dams further triggered the imbalanced relationship between water and sediment in downstream channels. The no-flow events often occurred during the 1970s–1990s and even reached 226 days in the year 1997 [45]. To mitigate heavy sediment siltation behind the XLD Reservoir and in the LYR, the WSRS has been conducted by the co-operations of Xiaolangdi, Sanmenxia, and Wanjiazhai Reservoirs since 2002 [32]. The man-made peak flow during WSRS, which lasts ~20 days from mid-June to early July each year, has efficiently scoured the riverbed of the LYR since 2002.
The modern Yellow River Delta (YRD) is a river-dominated and fan-shaped depositional system. With highly concentrated sediment discharge delivery, rapid sediment deposition and frequent channel avulsions occurred in the YRD over recent decades. The flow path was shifted to the Qingshuigou channel in 1976 and the mouth channel was migrated to Qing 8 by artificial avulsions in 1996, forming the active delta lobe [46]. At the active river mouth outlet, the shear front and strong longshore tidal current act as a barrier for the sediment dispersal process by keeping suspended sediment nearshore [47], resulting in a rapid deposition process at the active delta [48]. The land-building processes of the active delta are also shown to be significantly associated with sediment input [49,50].
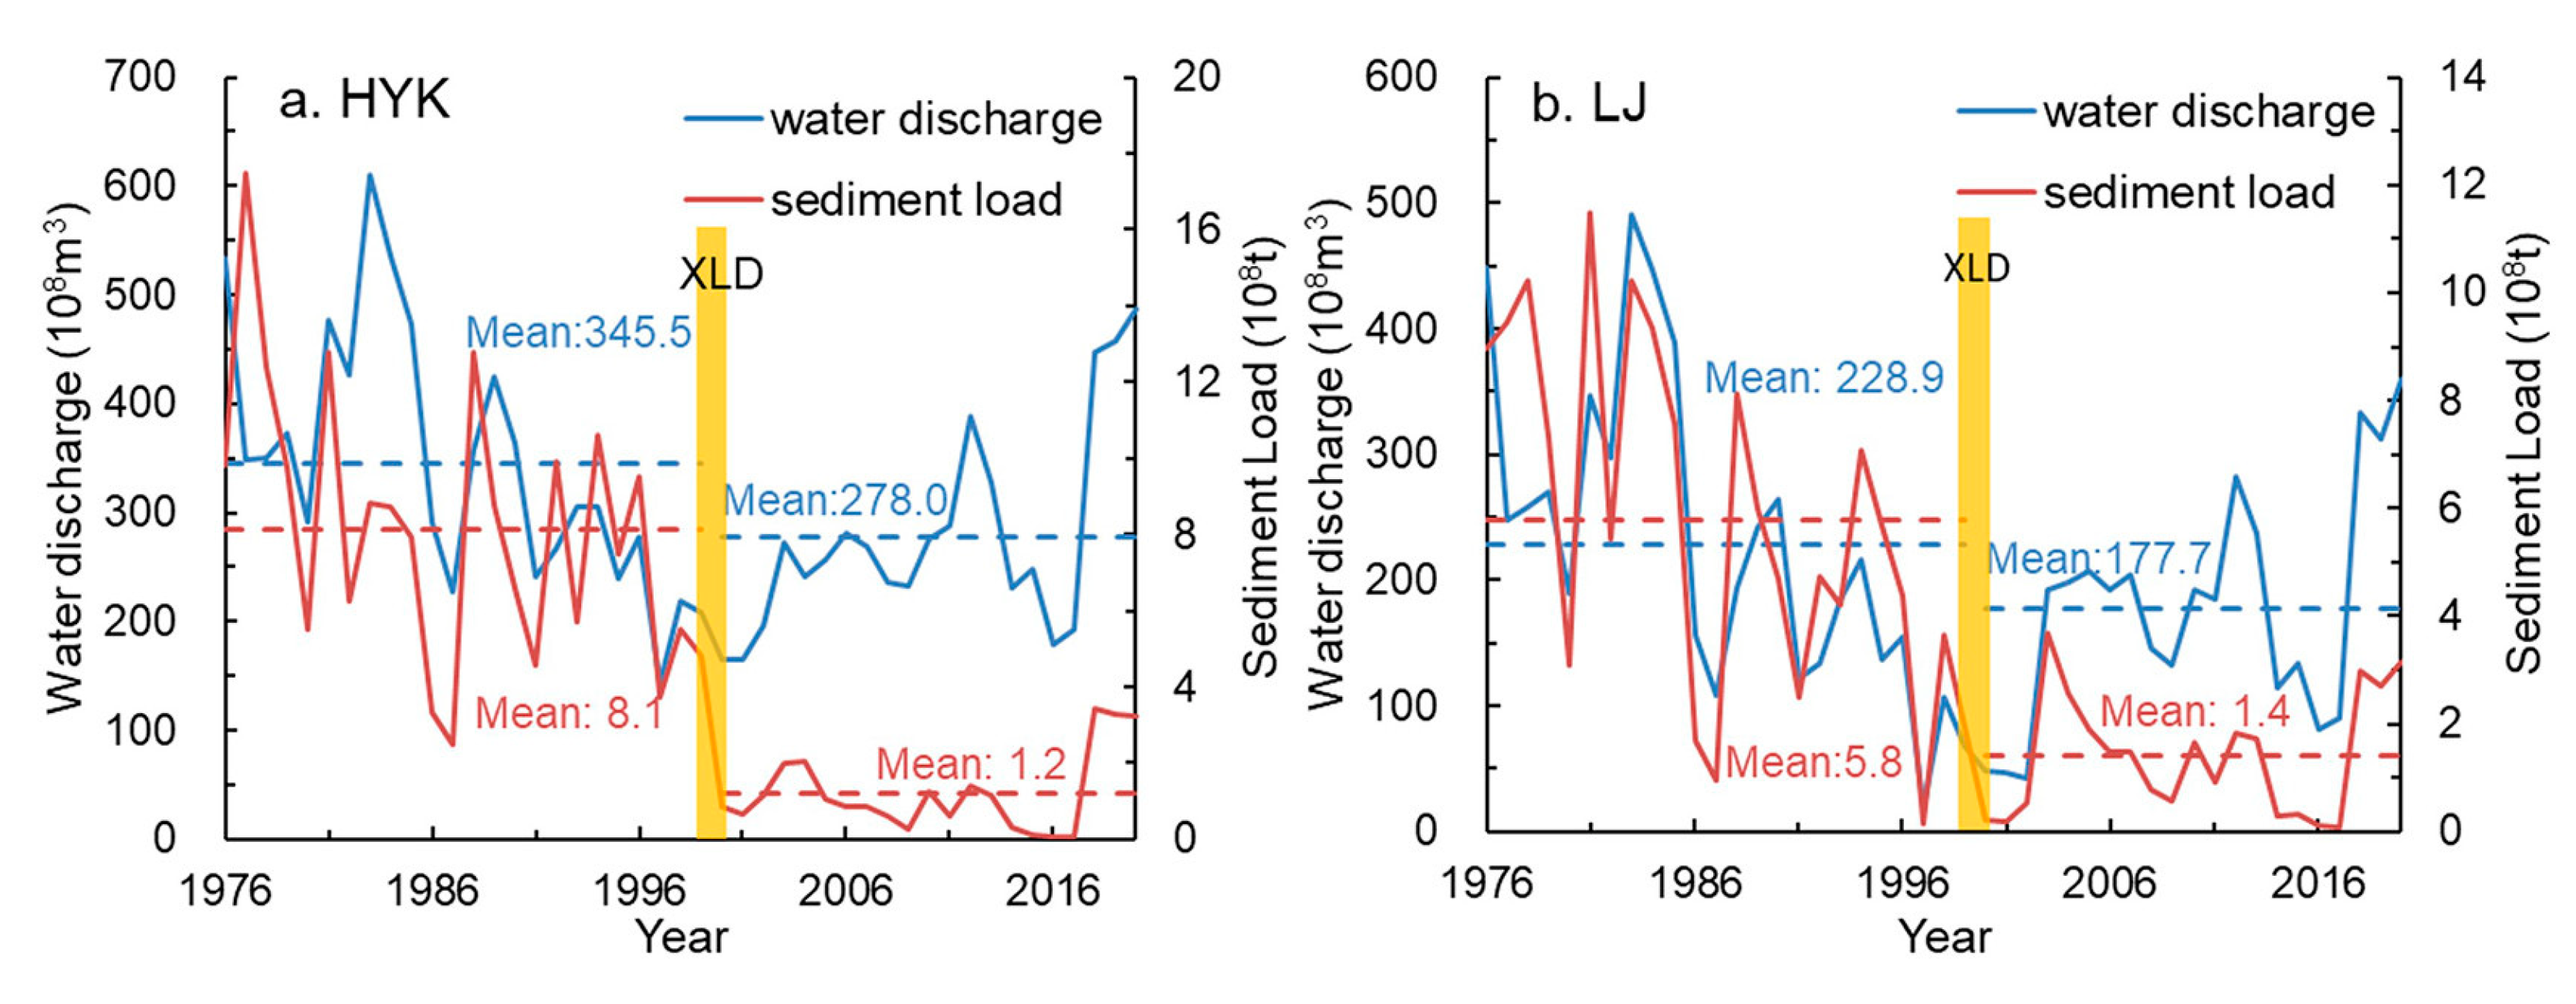
In this study, we mainly focused on the hydro-morphologic responses of the LYR and YRD to the upstream damming. Following the full operation of XLD Reservoir, the timeframe is divided into the pre-dam period (1976–1999) and post-dam period (2000–2020). The pre-dam period is regarded as the human-interfered stage, with more effective soil and water conservation practices and increased water abstraction in the YRB compared to natural fluvial regimes during the 1950s. The post-dam period is the highly river-regulated stage, with full operation of XLD Reservoir and implementation of WSRS. Figure 2 shows the hydrologic records at HYK and LJ stations, which are the most downstream hydrological stations in the middle and lower reaches. It can be seen that the sediment discharge drastically declined from 5.8–8.1 × 10⁸ t/yr during the pre-dam period to 1.2–1.4 × 10⁸ t during the post-dam period, while the downstream water discharge in the LYR remained at a relatively stable level at 177.7–345.5 × 10⁸ m3/yr (Figure 2).
2.2. Hydrological Parameters
To compare flow regime changes induced by dam construction, the annual and monthly water and sediment discharge during 1976–2020 at HYK and LJ stations were accessed from the Yellow River Conservancy Commission (YRCC). Records of sediment median diameter during the post-dam period at HYK, JHT, GC, SK, AS, LK, LJ stations along the lower reaches were collected from the Bulletin of Yellow River Sediment (BYRS, http://www.yrcc.gov.cn/zwzc/gzgb/gb/nsgb/, accessed on 1 September 2021), the Bulletins of Chinese River Sediment (BCRS, http://www.mwr.gov.cn/sj/tjgb/zghlnsgb/, accessed on 1 September 2021), and [51]. Daily water levels of hydrological stations along the LYR were supplied from the Yellow River Conservancy Commission (YRCC). The erosion/accretion volumes of different segments along the LYR were accessed by BYRS, BCRS, YRCC, and [52]. Sediment retained by water-soil conservation practices was estimated from [53,54]. The volume of water and sediment abstraction at the LYR were available at BYRS and [53] (Table 1).
The channel erosion and deposition is controlled by changes in water and sediment discharge, their relations and the grain size of transported particles [55,56]. Generally, with higher sediment concentrations delivery (S), the LYR tends to be in deposition state, and with higher water flux input (Q), the channel can be more easily scoured. Thus, the incoming sediment coefficient (ξ), expressed as (S/Q), can reflect the relationship between water and sediment and predict the general trend of the erosion–deposition state of the LYR [57]. To achieve an erosion–accretion balance along the LYR channels, a threshold for incoming sediment coefficient of 0.015 is suggested by observations of multi-year erosion-accretion status in the LYR [58].
Under the influence of both human interventions and climate change in the YRB, the LYR and YRD have received a decreased river discharge with highly interannual and seasonal variability over recent decades [59]. To evaluate the seasonal distribution changes of water discharge and sediment load, the coefficient of variations (Cv) is introduced and calculated as:
where Ri is the monthly sediment discharge, and is the annual averaged sediment discharge. A higher Cv suggests that the water and sediment distributions differ significantly between flood seasons and non-flood seasons.
2.3. Quantifications of Sediment Budget along the LYR
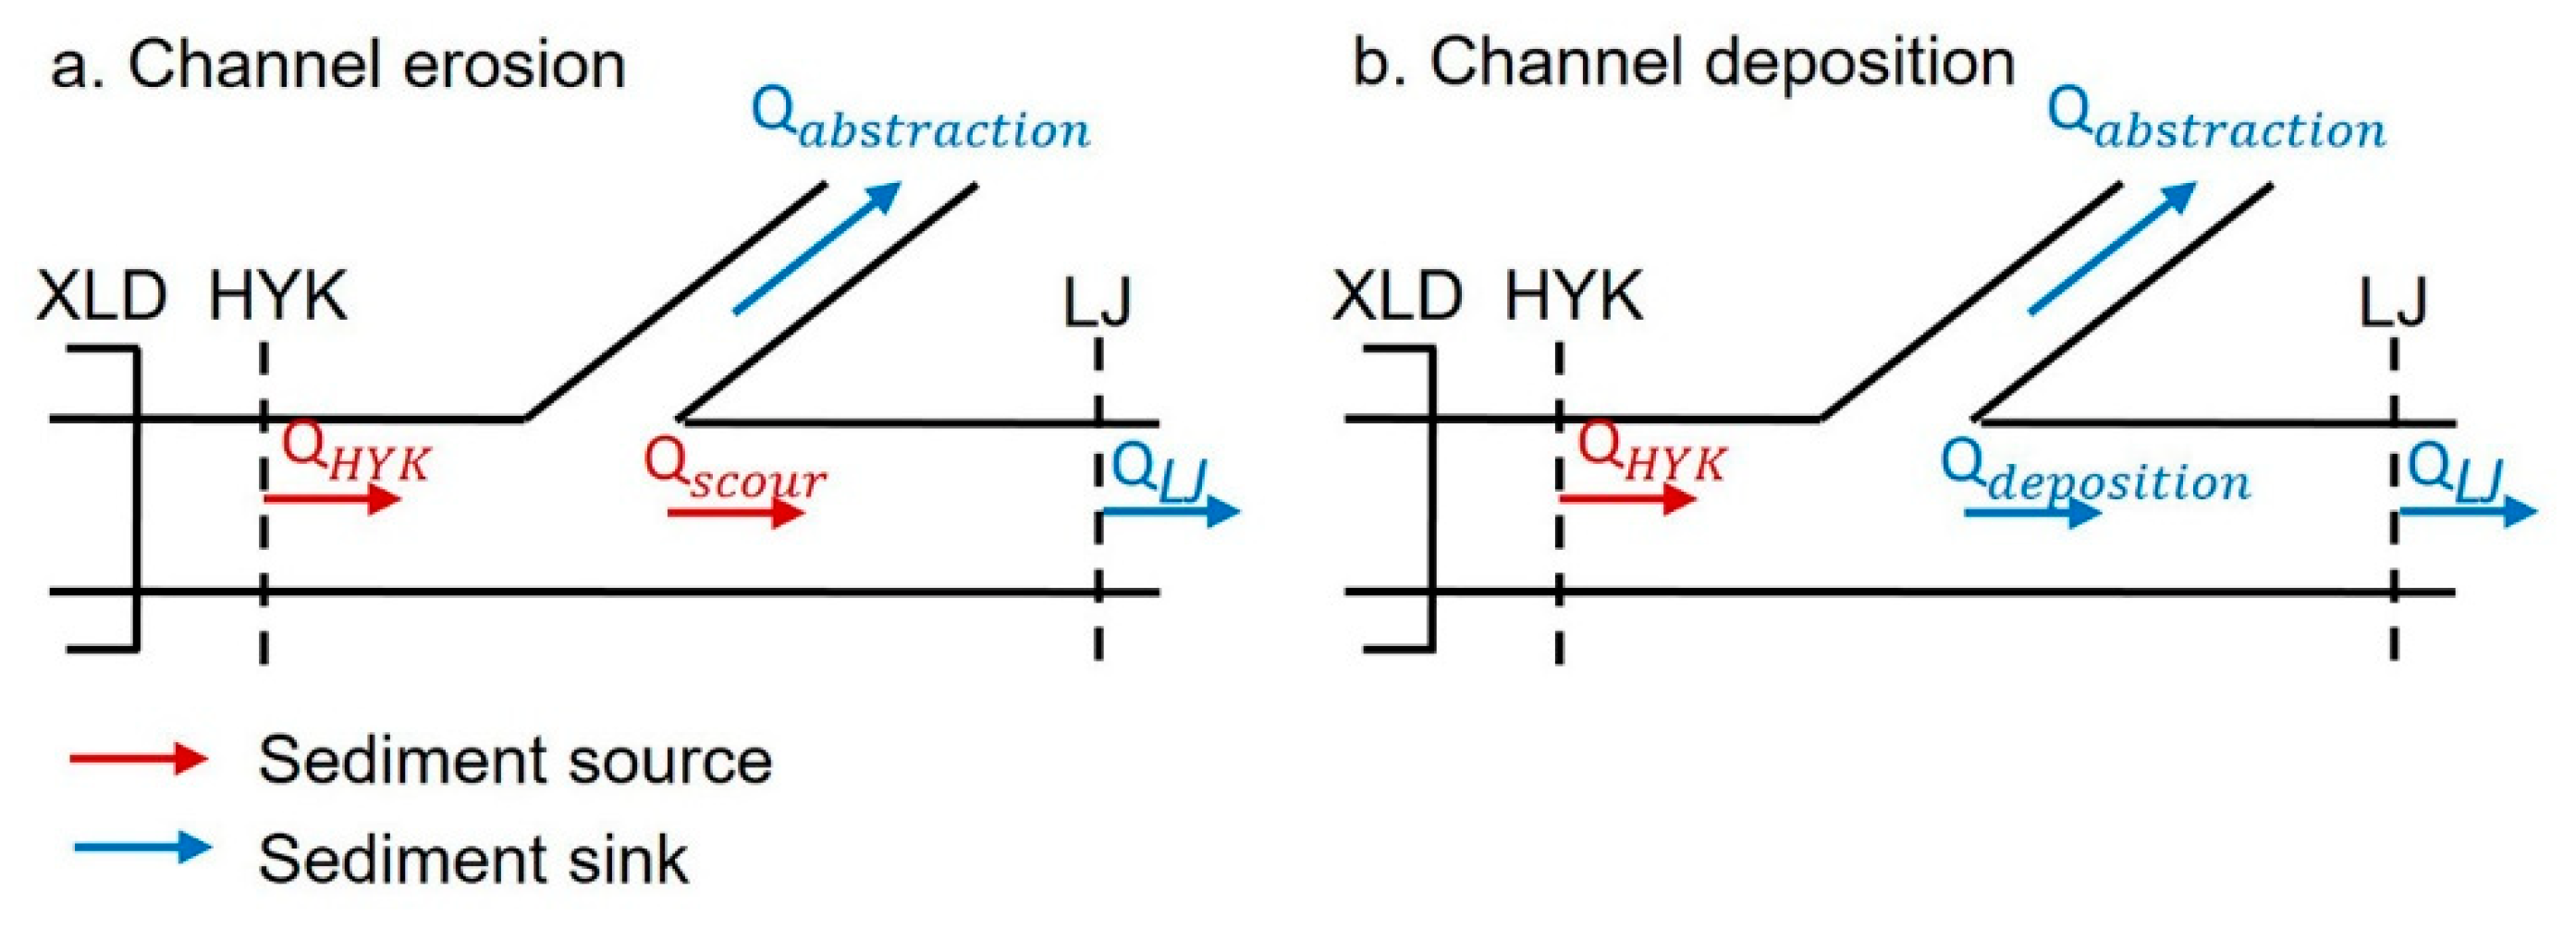
The sediment budget is often applied to investigate sediment dynamics under complex environmental changes along the fluvial-deltaic system [12,19]. The key sediment sources in the LYR can be ascribed as downstream channel scour from the HYK-LJ reach (Qscour) and incoming sediment from the upstream, while the latter can be represented by sediment flux at HYK (QHYK). The sediment sink includes in-channel sediment deposition (Qdeposition), sediment loss due to water abstraction (Qabstraction), and sediment delivered to the delta-front, while the latter can be regarded as sediment discharge at LJ (QLJ). As shown in Figure 3, their relationship can be described as [60]:
If the LYR channels show a net erosion state, its relative contribution to the total sediment source is (), and the spatial variability of scouring efficiency (SE) in the LYR is calculated by:
where V is the erosion and accretion volume of different segments in the LYR and unified to quality (108 t) by the bulk density of 1.40 t/m3 [61]. Q represents the annual water discharge in the LYR.
2.4. Shoreline Extraction of the YRD
Investigating decadal shoreline change is essential to understand the influence of coastal processes [62,63]. To monitor erosion–accretion patterns of the YRD, the shoreline dynamics and land area changes were extracted and monitored by Landsat satellite data. The satellite images with acquisition dates 2 June 1976 (MSS), 8 April 2000 (TM), and 2 June 2020 (OLI) were acquired from Earth Resources Observation and Science (EROS) Center (http://glovis.usgs.gov/, accessed on 1 September 2021). For the shoreline extraction, the normalized difference water index (NDWI) [64] was employed to discern land and water body:
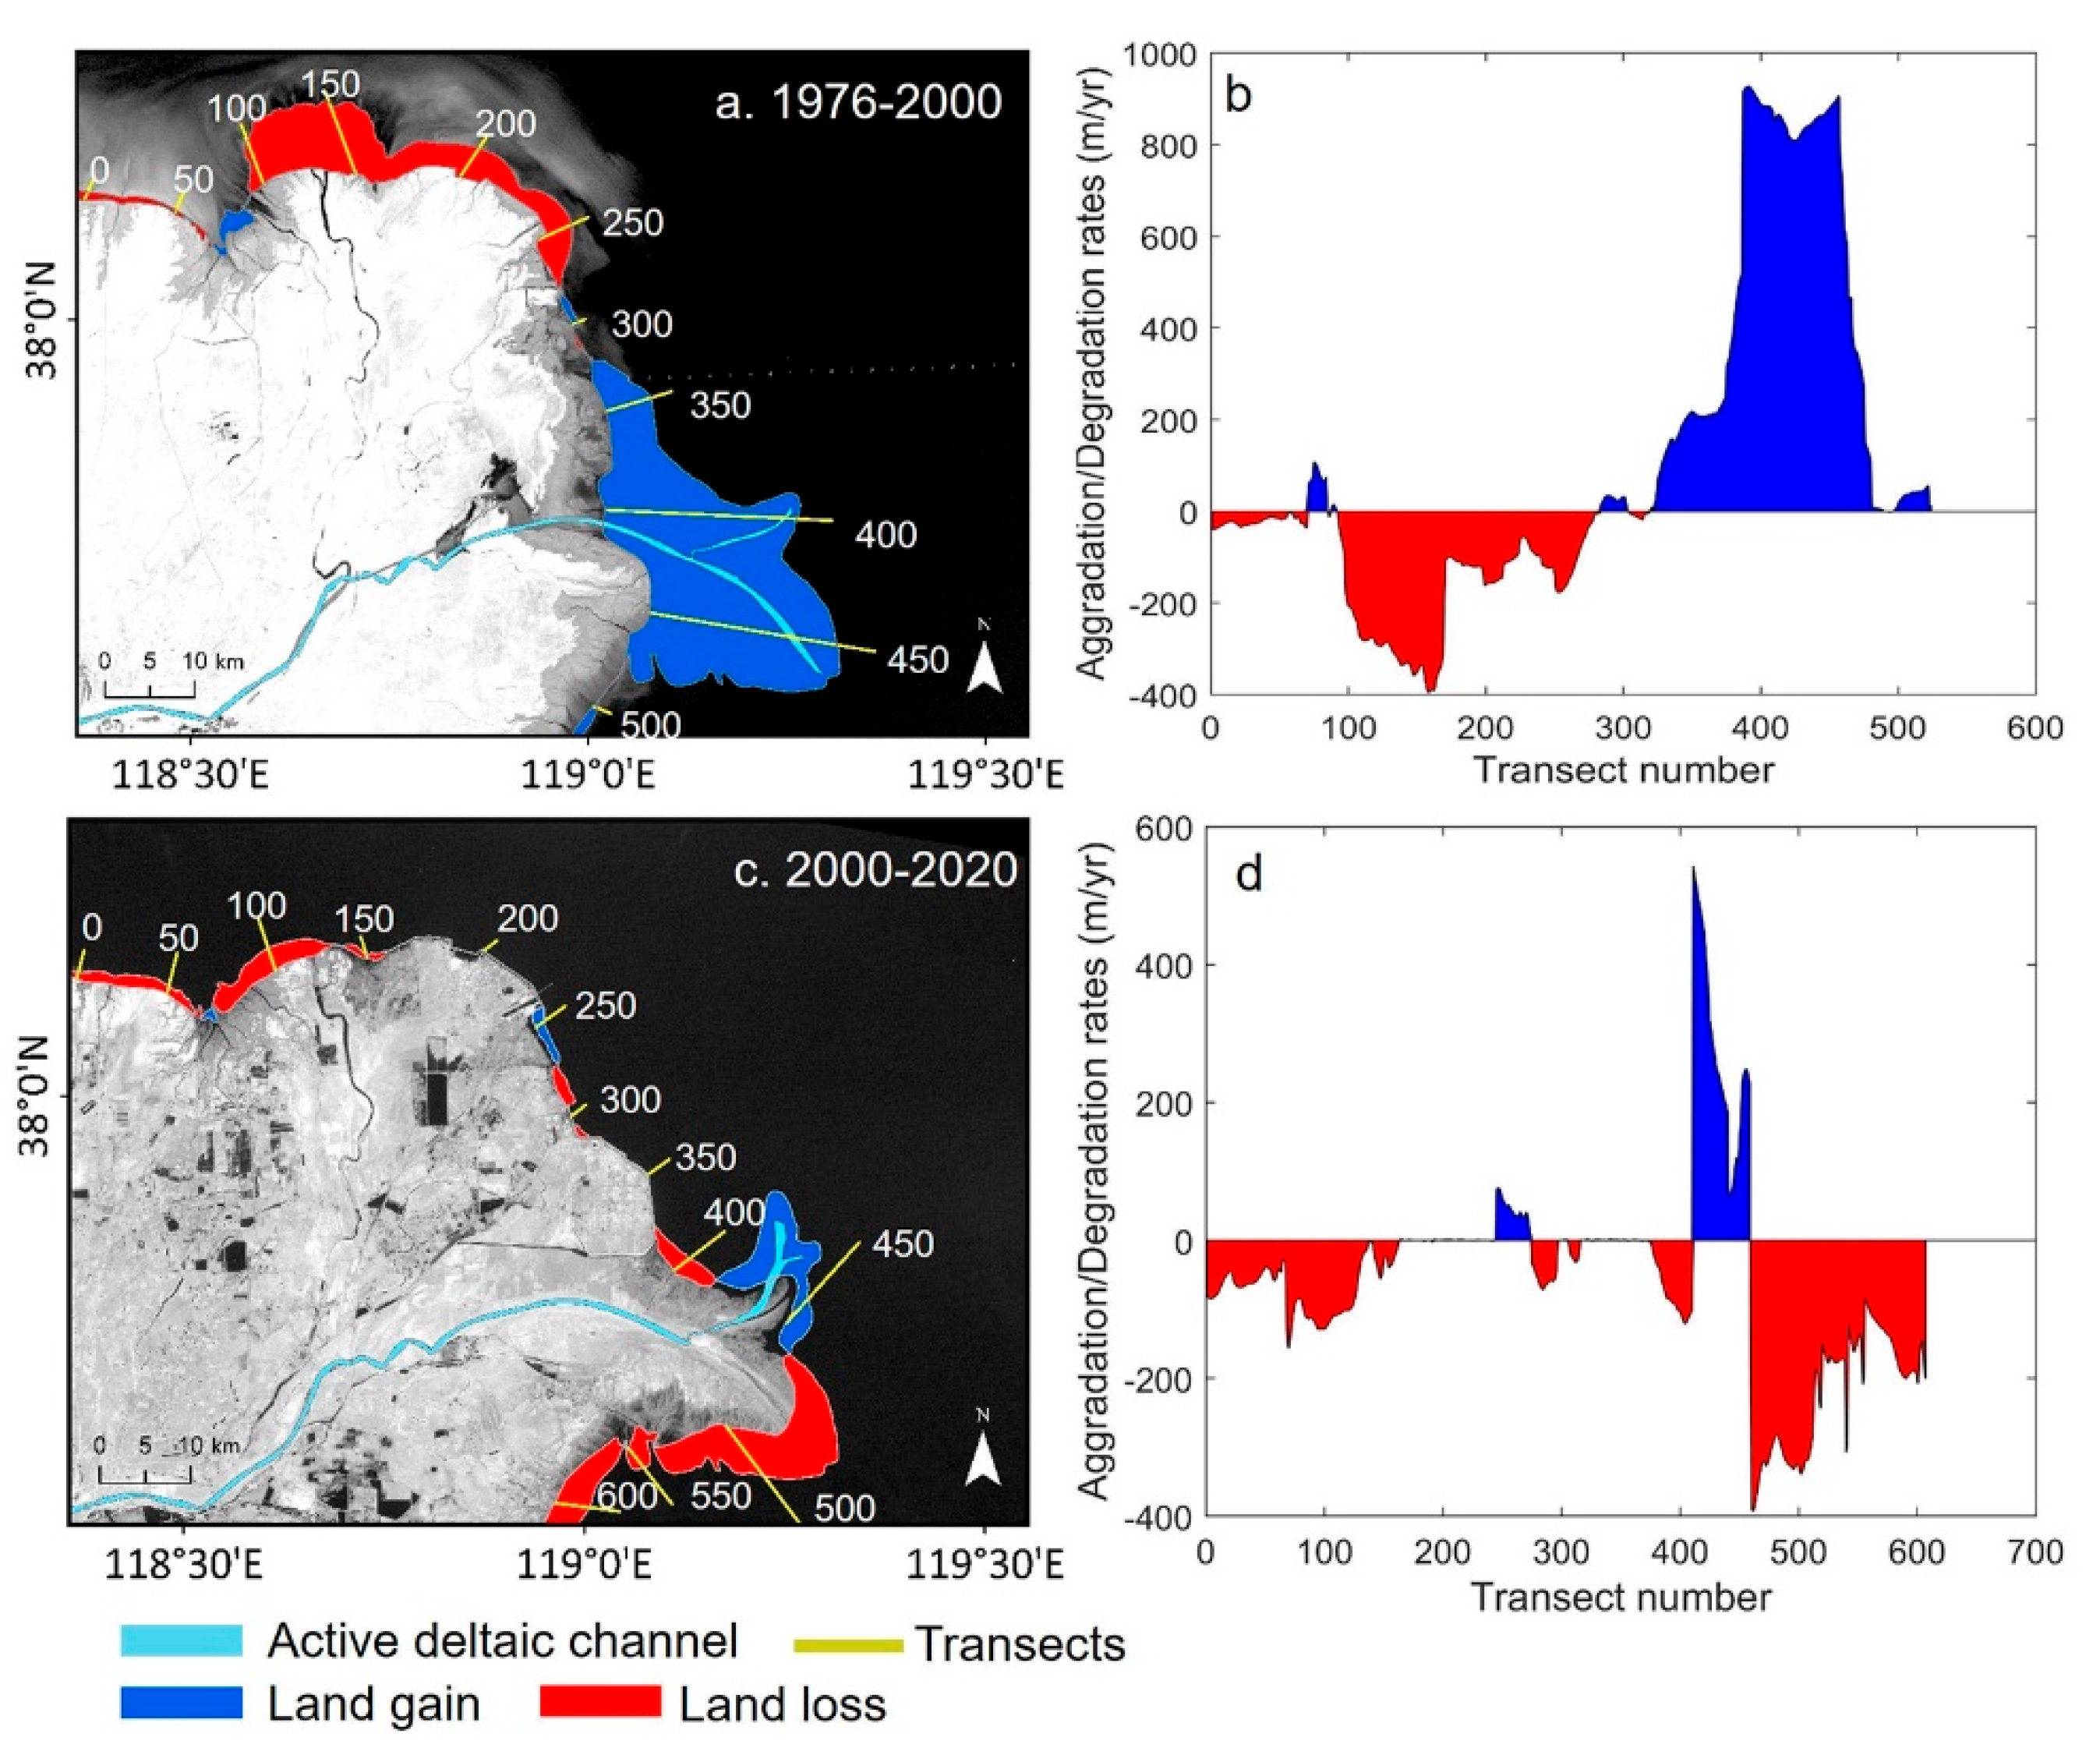
where Green and NIR represent the green light band and near-infrared band. According to the digitized shorelines, 524 and 607 transects perpendicular to the deltaic coast were separately generated in the Digital Shoreline Analysis System (DSAS) [65] to calculate spatial evolutionary trends of the YRD during pre-dam period (1976–2000) and post-dam period (2000–2020). The end point rate (EPR) method was then used to compute the shoreline change rates between adjacent years. The land area changes of the YRD were further quantified by ArcGIS 10.3 software developed by ESRI.
3. Results
3.1. Transition of Downstream River Regimes after the Construction of XLD Reservoir
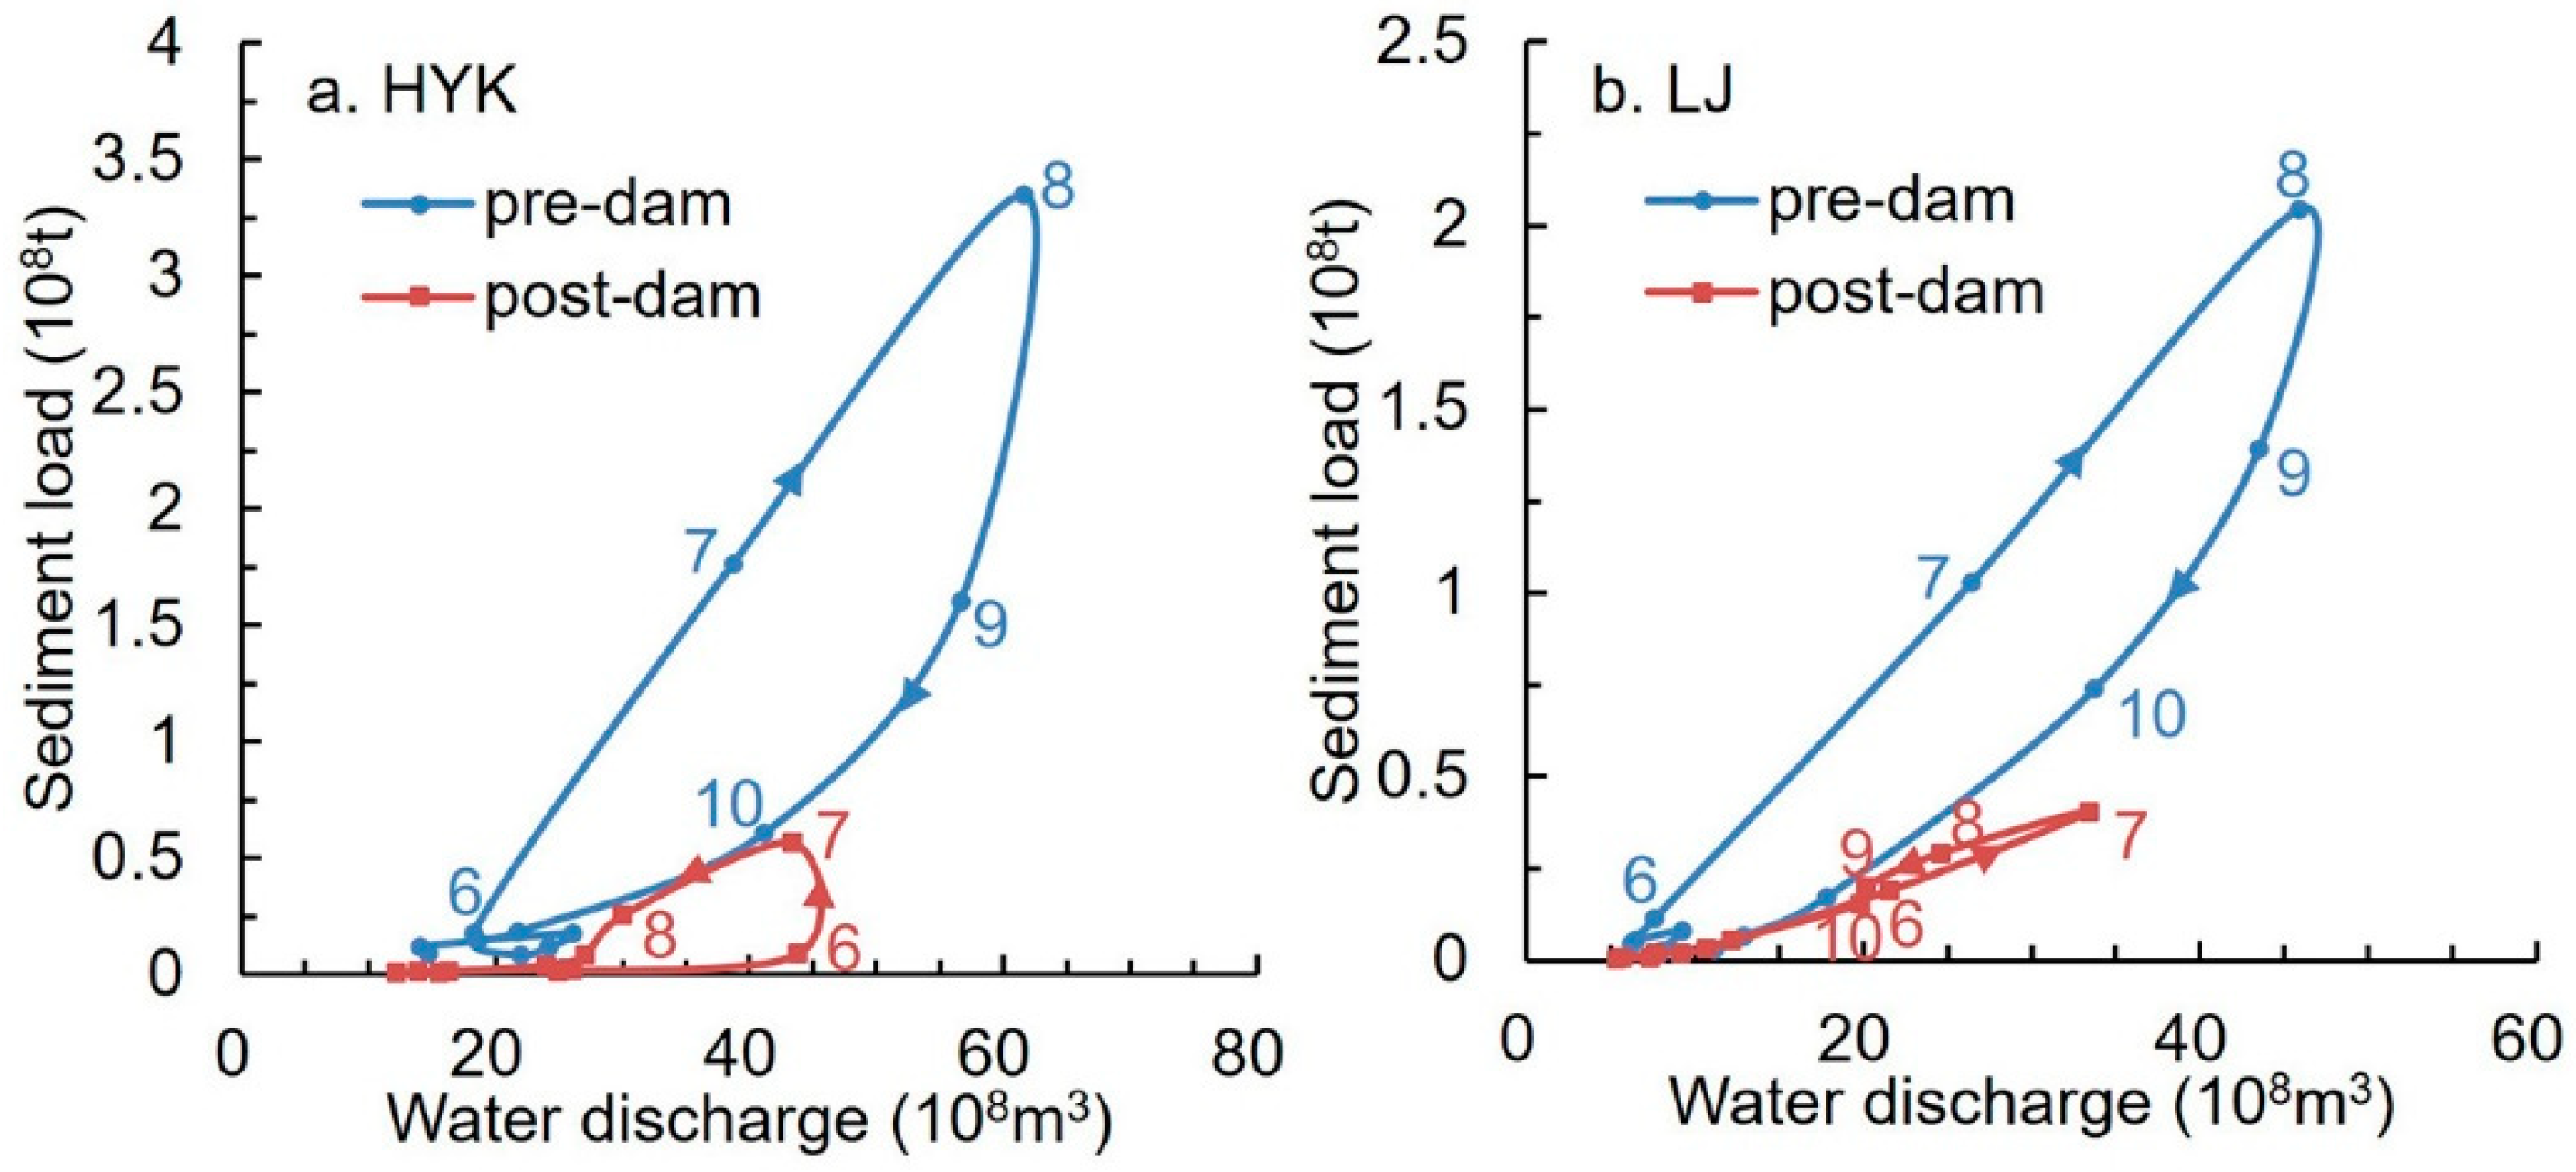
Previous studies have revealed that the presence of dam caused a new discharge regime, characterized by a more drastic decline of sediment load than water discharge delivered to the delta [33,39]. We extended the studies to the LYR and concentrated on the reach-scale water and sediment relationship by analyzing the hydrological records at the inlet (HYK) and outlet (LJ) of the lower reaches. Figure 4a,b present a power function between water and sediment delivery in the LYR. It can be seen that at both HYK and LJ stations, the sediment load has declined markedly under the same water discharge (e.g., Q = 300 × 108 m3/yr) after the construction of the XLD Reservoir, which suggests that the water discharge variations may not be the dominant factor for the decline of sediment delivery. It is also proved by Figure 2 that, while the water discharge remained at a relatively stable level between 1976 and 2020, the sediment load reduced significantly after 2000, implying that the relationship between water and sediment discharge has been in transition from imbalanced to more balanced, with less sediment discharge delivered to the sea.
Figure 4c,d present the relationship between suspended sediment concentrations (SSC) and water discharge. Before the construction of the XLD Reservoir, the annual SSC in the LYR was far above 10 kg/m3, but then dropped to less than ~10 kg/m3 during the post-dam period. As shown in the variations of incoming sediment coefficient in Figure 4c, the water–sediment relationship in the LYR before 2000 was imbalanced with a high coefficient; especially during annual water flux input was lower than 400 × 108 m3. After the impoundment of the XLD Reservoir, the decreasing trend of SSC distributions has been mostly below the erosion–accretion threshold, which indicates a more balanced relationship between water and sediment discharge and a net erosion trend at the downstream channels (Figure 4d).
The operation of the XLD Reservoir has also changed the seasonal pattern of downstream river delivery. The natural flood seasons last from July to October, followed by a clockwise dispersion of water–sediment discharge, with an annual peak flood in August (Figure 5a,b). After the impoundment of the XLD Reservoir, the man-made flood peaks during WSRS have been discharged to the downstream channels and river delta, which lasts for 20 days from June to July. The rating curves of water and sediment discharge at HYK and LJ show anti-clockwise distributions, implying that river flow in the LYR has been redistributed under highly human-altered conditions [32,33]. Meanwhile, it appears that dams have mitigated the precipitation-derived floods, resulting in higher downstream water discharge delivery in June and July (Figure 5a,b).
As shown by the coefficient of variation (Cv) of river discharge calculated by Equation (1), the water discharge at LJ has decreased from 3.25 during 1976–2000 to 2.85 after 2000, and the sediment discharge has decreased slightly from 5.77 to 5.57, indicating decreased seasonal variations of river delivery at downstream channels from XLD Reservoir. During the post-dam period, the imbalanced relationship between water and sediment delivery has been ameliorated, mitigating drying-up events in the LYR. Meanwhile, the WSRS has met the demand for seasonal agricultural irrigation and flood peak control throughout the year [66], resulting in a reduction in the variations of river delivery between flood and non-flood seasons.
3.2. Hydrogeomorphic Response of the Downstream Channels
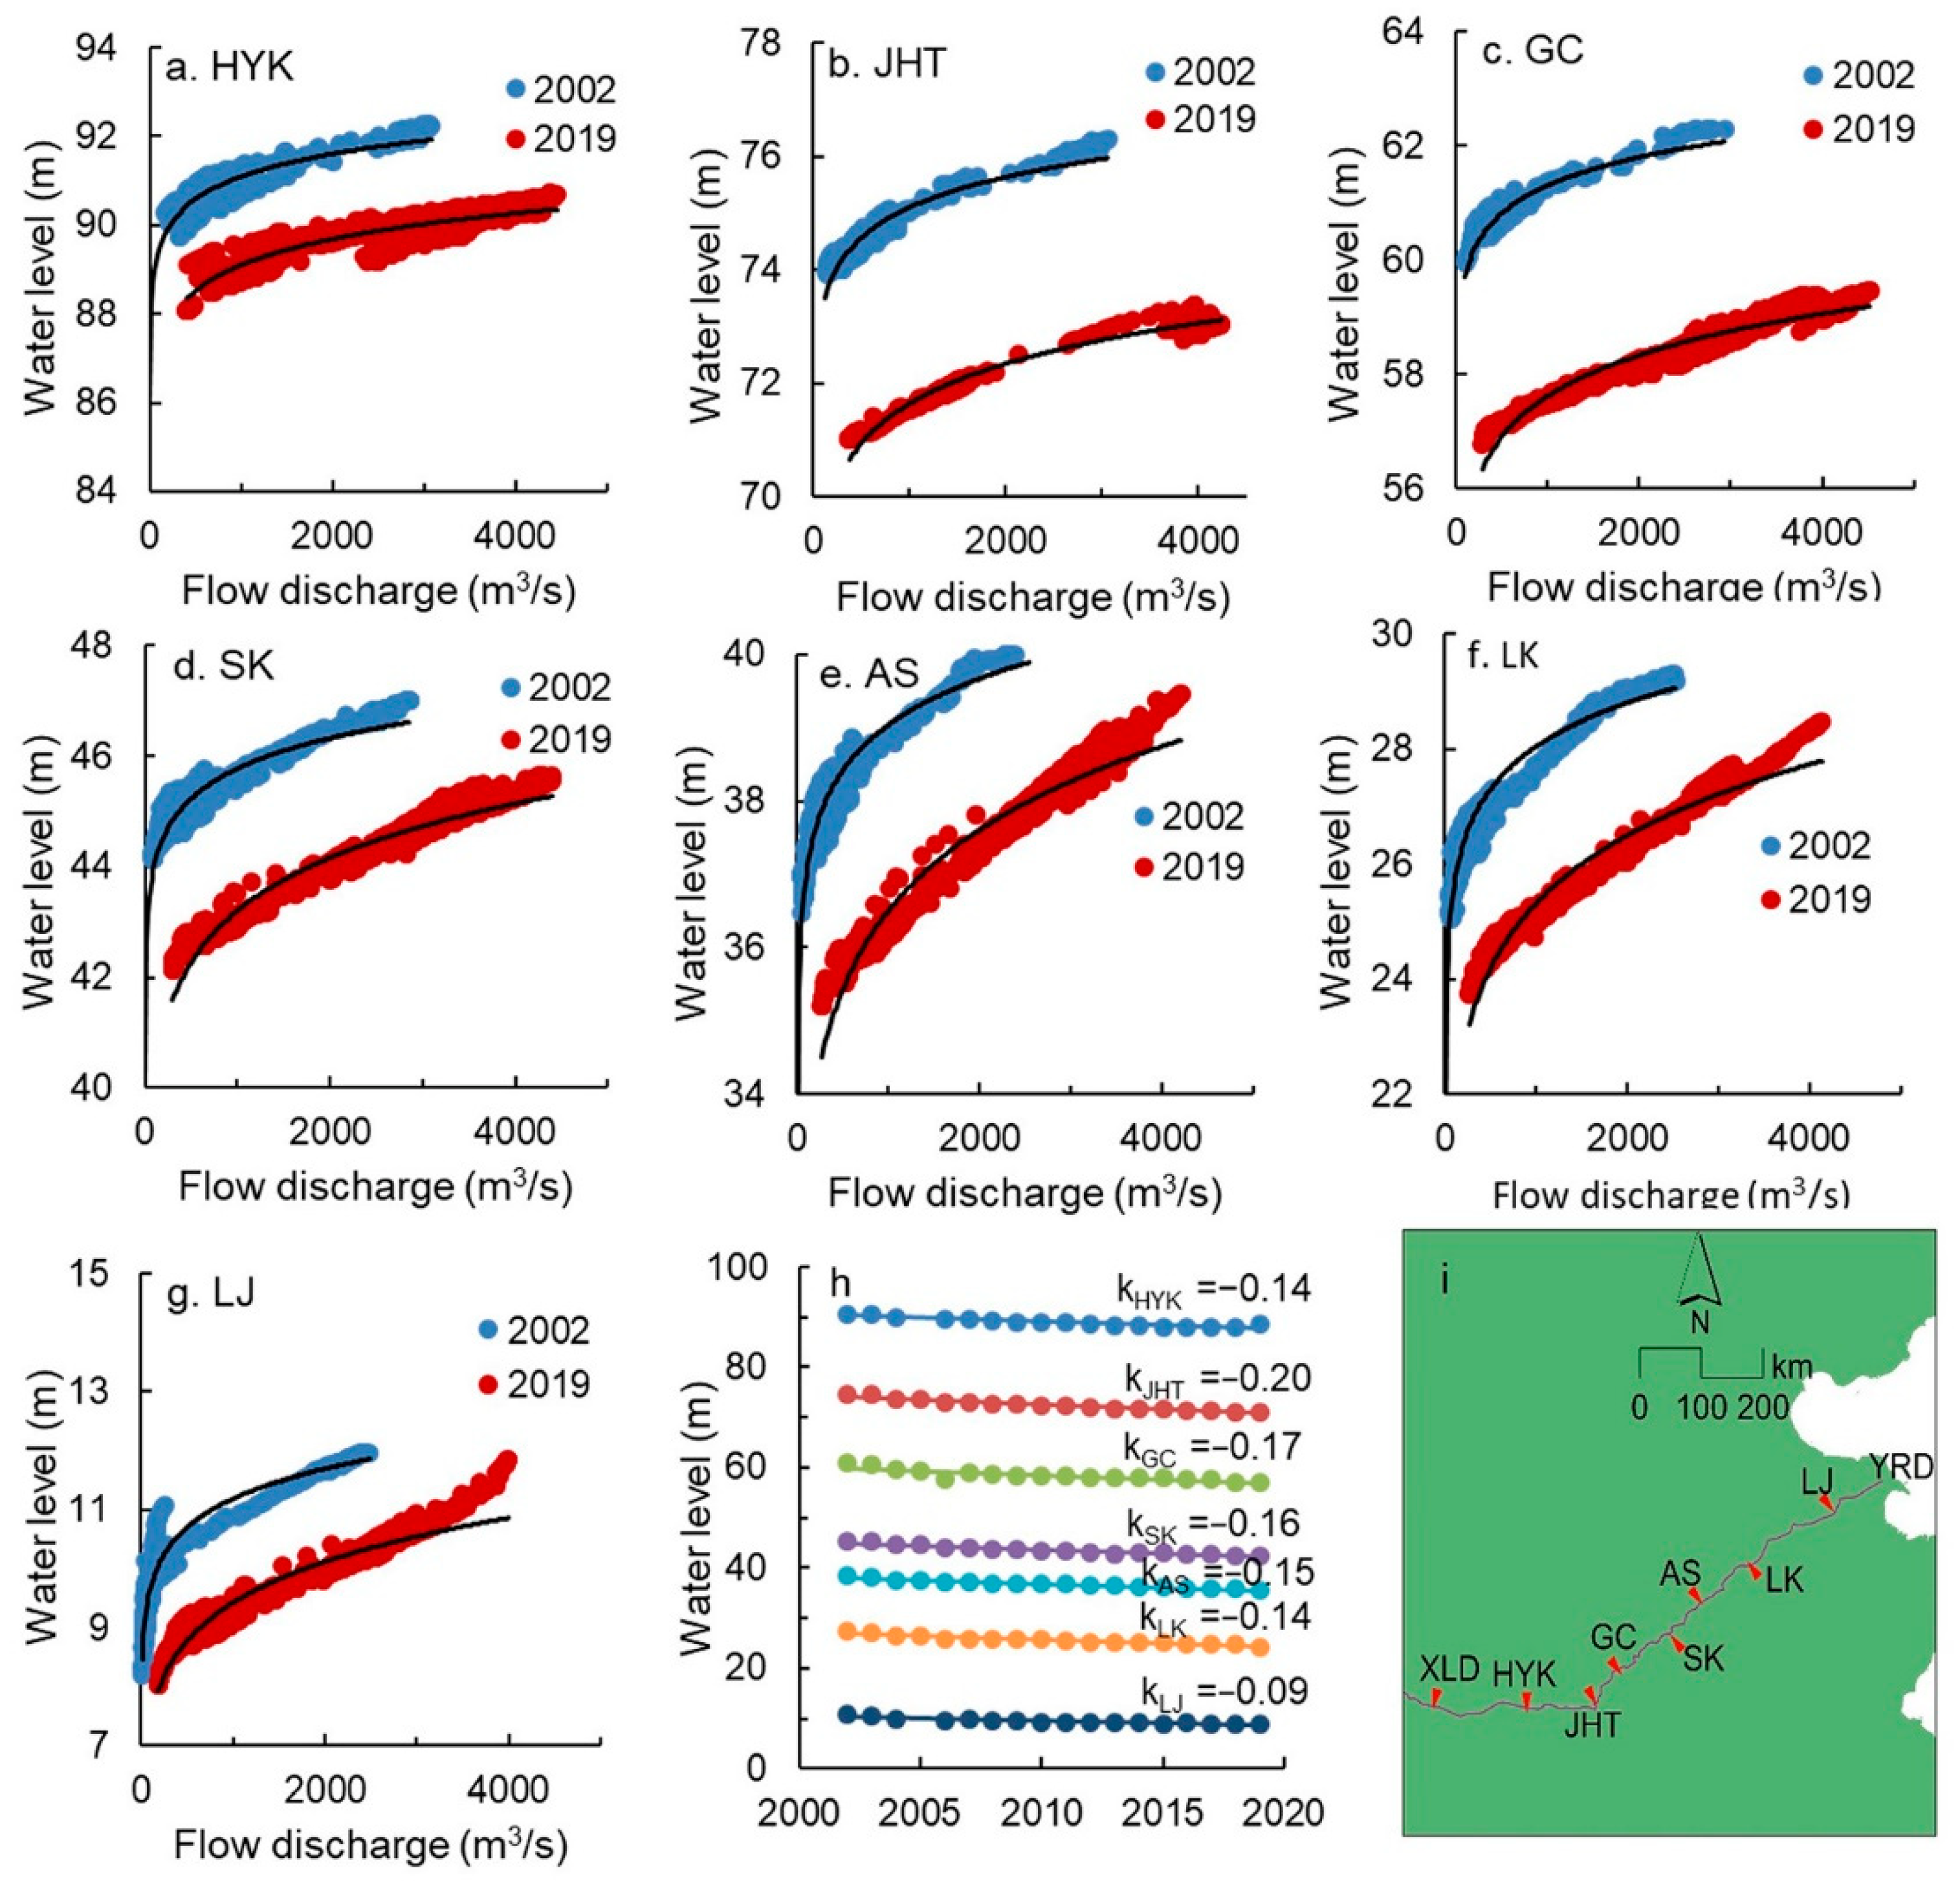
The relationship between flow discharge and water levels reflects changes in upstream river conditions and the downstream morphological responses. From hydrological records of daily discharge and water levels at the gauging stations along the LYR, we observed changes in water levels between flood seasons and non-flood seasons and a dramatic drop in water levels from 2002 to 2019, with strong spatial disparities in different channel segments (Figure 6a–g). Using power functions to fit distributions of daily water levels, we observed drastic declines in water levels of 2.04 m, 3.61 m, 3.92 m, 2.99 m, 3.00 m, 3.11 m, and 1.92 m at HYK, JHT, GC, SK, AS, LK, and LJ stations under normal water discharge 500 m3/s from 2002 to 2019 (Figure 6a–g). Figure 6h,i further show the annual changing trend of water levels under 500 m3/s flow discharge for each station. A steady downward trend was identified in water levels, with the largest vertical decreases at JHT and GC (−0.20 m/yr and −0.17 m/yr, respectively), and least variations at LJ station (−0.09 m/yr) (Figure 6h). The decrease in cross-section water levels demonstrates that changes in upstream river regimes have had a substantial impact on downstream channel morphodynamic processes, shaping the lower reaches to a continuous erosion state during the post-dam period.
During the pre-dam period, upstream sediment generally tended to deposit in the LYR with an average deposition volume of 1.11 × 10⁸ m3/yr (suggested by BCRS), due to the decrease of water discharge and the related decline of sediment transport capacity of high-turbid waters (Figure 7a). The sediment load substantially decreased with the impoundment of XLD Reservoir and implementation of WSRS, with a relatively consistent water outflow on the annual basis, resulting in a balanced connection between sediment and water delivery. Except for the slight accumulation in 2019, the WSRS-induced floodwaters efficiently scoured the lower reaches during 2002–2020 (Figure 7a). It suggests a geomorphic transition of the LYR from net deposition to erosion state, after the XLD Reservoir came into operation.
Because of the differences in geometry settings, there is a spatial-temporal variation in geomorphic evolution in the LYR. The HYK–GC segment is typically regarded as a braided reach with easily eroded soil and sediment [37], which creates a highly dynamic geomorphic unit in terms of erosion–accretion variability. Upstream sediment was deposited primarily in the HYK–GC section during 1986–1999, with a deposition rate of 0.85 × 10⁸ m3/yr [52], and it drastically shifted to a net erosion rate of 0.27 × 10⁸ m3/yr and 0.16 × 10⁸ m3/yr at HYK–JHT and JHT–GC segments respectively after 2000 (Figure 7b). The GC–LJ segment is controlled by river-training features including levees and embankments, limiting channel migrations and keeping the reach-scale channel morphology relatively stable [36]. During the pre-dam period, deposition volume was estimated to be 0.27 × 10⁸ m3/yr and 0.35 × 10⁸ m3/yr for the GC–AS and AS–LJ segments, respectively, and it has transferred to an average erosion rate of 0.04–0.14 × 10⁸ m3/yr since the impoundment of XLD Reservoir (Figure 7b).
3.3. Geomorphic Response of the YRD
River deltas are nourished with river-borne sediment, which helps them maintain aggradation and keep up with changing environmental forces [67]. The critical impact of dam-based sediment retention on the morphological evolution of the delta was investigated by comparing shoreline dynamics and land area changes at the YRD. During 1976–2000, the YRD was dominated by rapid accretion at the active delta under the inflow path of the Qingshuigou channel and dramatic erosion at the abandoned river mouth due to the absence of river supply. The active delta’s net accretion rate was 21.2 km2/yr, while the erosion rate of land area reached 7.9 km2/yr at the northern abandoned delta (Figure 8a,b).
The sediment delivery decreased from 5.8 × 10⁸ t/yr to 1.4 × 10⁸ t/yr at LJ station during post-dam period, resulting in sediment starvation and a significant retreat of the YRD. Although the WSRS-induced floodwaters delivered external sediment from lower reaches to build new lands at the active delta, this cannot save the entire deltaic system from drowning. When compared to the pre-dam period, the deltaic shoreline has exhibited strong spatial variability in morphological changes (Figure 8c,d). The northern abandoned delta coastline has entered a period of reduced landward retreat [68], and the eroded seabed silt tends to transport offshore to the center of the Bohai Sea and the Yellow Sea [69]. Despite being protected by coastal dikes, the subaqueous component of the engineering zone for port operation and oil extraction was still at risk of severe coastal erosion [39]. For the active delta, with a land accretion rate of 3.3 km2/yr, it entered into a lower accretion phase compared to the pre-dam period. After the flow path was artificially diverted to Qing 8 channel, the silt at the abandoned Qingshuigou lobe was flushed away by strong parallel tidal currents and winter waves [47]. Based on its erosion rate of −7.0 km2/yr, the entire deltaic system has been in transition into a net coastal erosion state.
The subaqueous delta exhibited the same reduced accretion trend as the subaerial delta. Previous studies found that during the post-dam period, the accretion volume at the Qingshuigou subaqueous delta only reached 0.75 × 10⁸ m3/yr, approximately 36% of the pre-dam level [50]. Because of the upstream sediment retention and reduced sediment supply to the delta during the post-dam period, both subaerial and subaqueous geomorphic evolution experienced a deltaic shrinkage tendency [70].
4. Discussion
4.1. Transition of Sediment Source of the Fluvial-Deltaic System
The loess zone of the Yellow River’s middle reaches was the primary river-derived sediment source during its pristine state, responsible for 90% of total sediment outflow [60]. To investigate changing sediment dynamics in the LYR and to the YRD, and whether the sediment source of the Yellow River has shifted, sediment budgets of the LYR for pre-and post-dam periods were created. Because there are fewer tributaries along the LYR, the primary sediment source is from sediment derived from the middle reaches and scoured from the downstream riverbed from XLD Reservoir to the YRD [60]. The sediment sink primarily includes water and sediment abstraction along the LYR and deliveries to the estuary for delta-building, followed by Equation (2).
The respective contributions to the sediment source can be calculated by comparing the relative proportions of sediment discharge at HYK and sediment scoured from the LYR channels. The results suggest that before 2000, the major sediment supply was scoured sediment from the middle reaches. During 1986–1999, 30% of upstream deliveries were deposited in the LYR with rapid deposition of 1.20 × 10⁸ t/yr at HYK–GC segment, with slight deposition of 0.37 × 10⁸ t/yr and 0.50 × 10⁸ t/yr at GC–AS and AS–LJ segments, respectively [52] (Figure 9a). According to the sediment budget for the LYR, water abstraction has resulted in a sediment loss of 0.79 × 10⁸ t/yr. The estimates are slightly lower than previous research [60,71], which suggested an annual sediment loss of 1.20 × 10⁸ t/yr due to water abstraction during the pre-dam period.
After the impoundment of the XLD Reservoir, the sediment scoured from the lower reaches contributed comparably to the sediment derived from the lower reaches, with the most efficient scouring at the HYK–GC segment (Figure 9a). Between 2001 and 2020, the averaged sediment delivery to the LYR was only 1.22 × 10⁸ t/yr. Comparably, the riverbed HYK–GC, GC–AS, and AS–LJ segments were scoured with 0.61 × 10⁸ t/yr, 0.27 × 10⁸ t/yr, and 0.24 × 10⁸ t/yr of sediment, which contributed 48% of total sediment source along the Yellow River. Increased agricultural and industrial water demand perhaps caused additional water abstraction and sediment loss [34]. A total of 0.9 × 10⁸ t/yr of sediment loss due to water diversion (38.5% of total sediment) was predicted along the LYR to achieve the balance of sediment budget. This estimation is close to the observations from BYRS, with water abstractions of 94 × 108 m3/yr (HYK-LJ segments) and an averaged SSC of 7 kg/m3 at LJ station during the post-dam period.
Note that when the water discharge at the upstream boundary was exceptionally low, such as in 2016 and 2017, the sediment scoured from the LYR may make more contributions (Figure 9b,c). As scouring effectiveness declined, the proportions of sediment scoured from the riverbed dropped, which was insufficient to meet the sediment diversion and delta-building demands, as seen in 2018–2020 (Figure 9c). The sediment source-to-sink mechanism along the mainstream has changed as a result of highly altering human activities such as soil and water conservation practices and basin-scale water regulation. During the post-dam period, sediment scoured from the lower riverbed has become equivalent contributors to middle-reaches supply as a riverine sediment source, and its contribution proportions are mostly connected with upstream water input.
Because of the implementation of the WSRS, 48% of external sediment was delivered from the LYR, contributing to the delta-building process of the river mouth. It was estimated that a threshold of 2.6 × 10⁸ t sediment delivery could achieve the erosion–accretion balance of the whole YRD [70]. This means the post-dam yearly sediment discharge with external sediment delivery from the LYR still cannot induce net accretion at the YRD. Considering the integrated impact of accelerated land subsidence due to groundwater and oil extraction in coastal regions, drowning of the YRD is to some extent irreversible. It has induced environmental challenges in terms of an increase of coastal vulnerability in sediment-starved coast [72], soil salinization [73], and regional environmental degradation of wetlands [74].
4.2. Spatial-Temporal Changes of Scouring Efficiency in the LYR
To further discuss the sustainability of sediment scouring in the LYR, the reach-scale scouring efficiency was calculated by Equation (3) for the period 2001–2020. The results demonstrated significant spatial variations in scouring efficiency after the building of the XLD Reservoir. The HYK–JHT segment had the maximum scouring efficiency of 1.51 kg/m3, while the SK–AS section had the lowest scouring efficiency of 0.22 kg/m3 (Figure 10a). A significant decrease in scouring efficiency should also be noted along the mainstream of the LYR. The highest scouring efficiency was during the early stages of water regulation in 2002–2003, and since then, it decreased at a rate of 0.28 (kg·m−3)/yr (Figure 10b). Even though the water discharge increased to above 400 × 108 m3/yr during 2019–2020, the scouring efficiency has decreased to its lowest level since the WSRS was implemented.
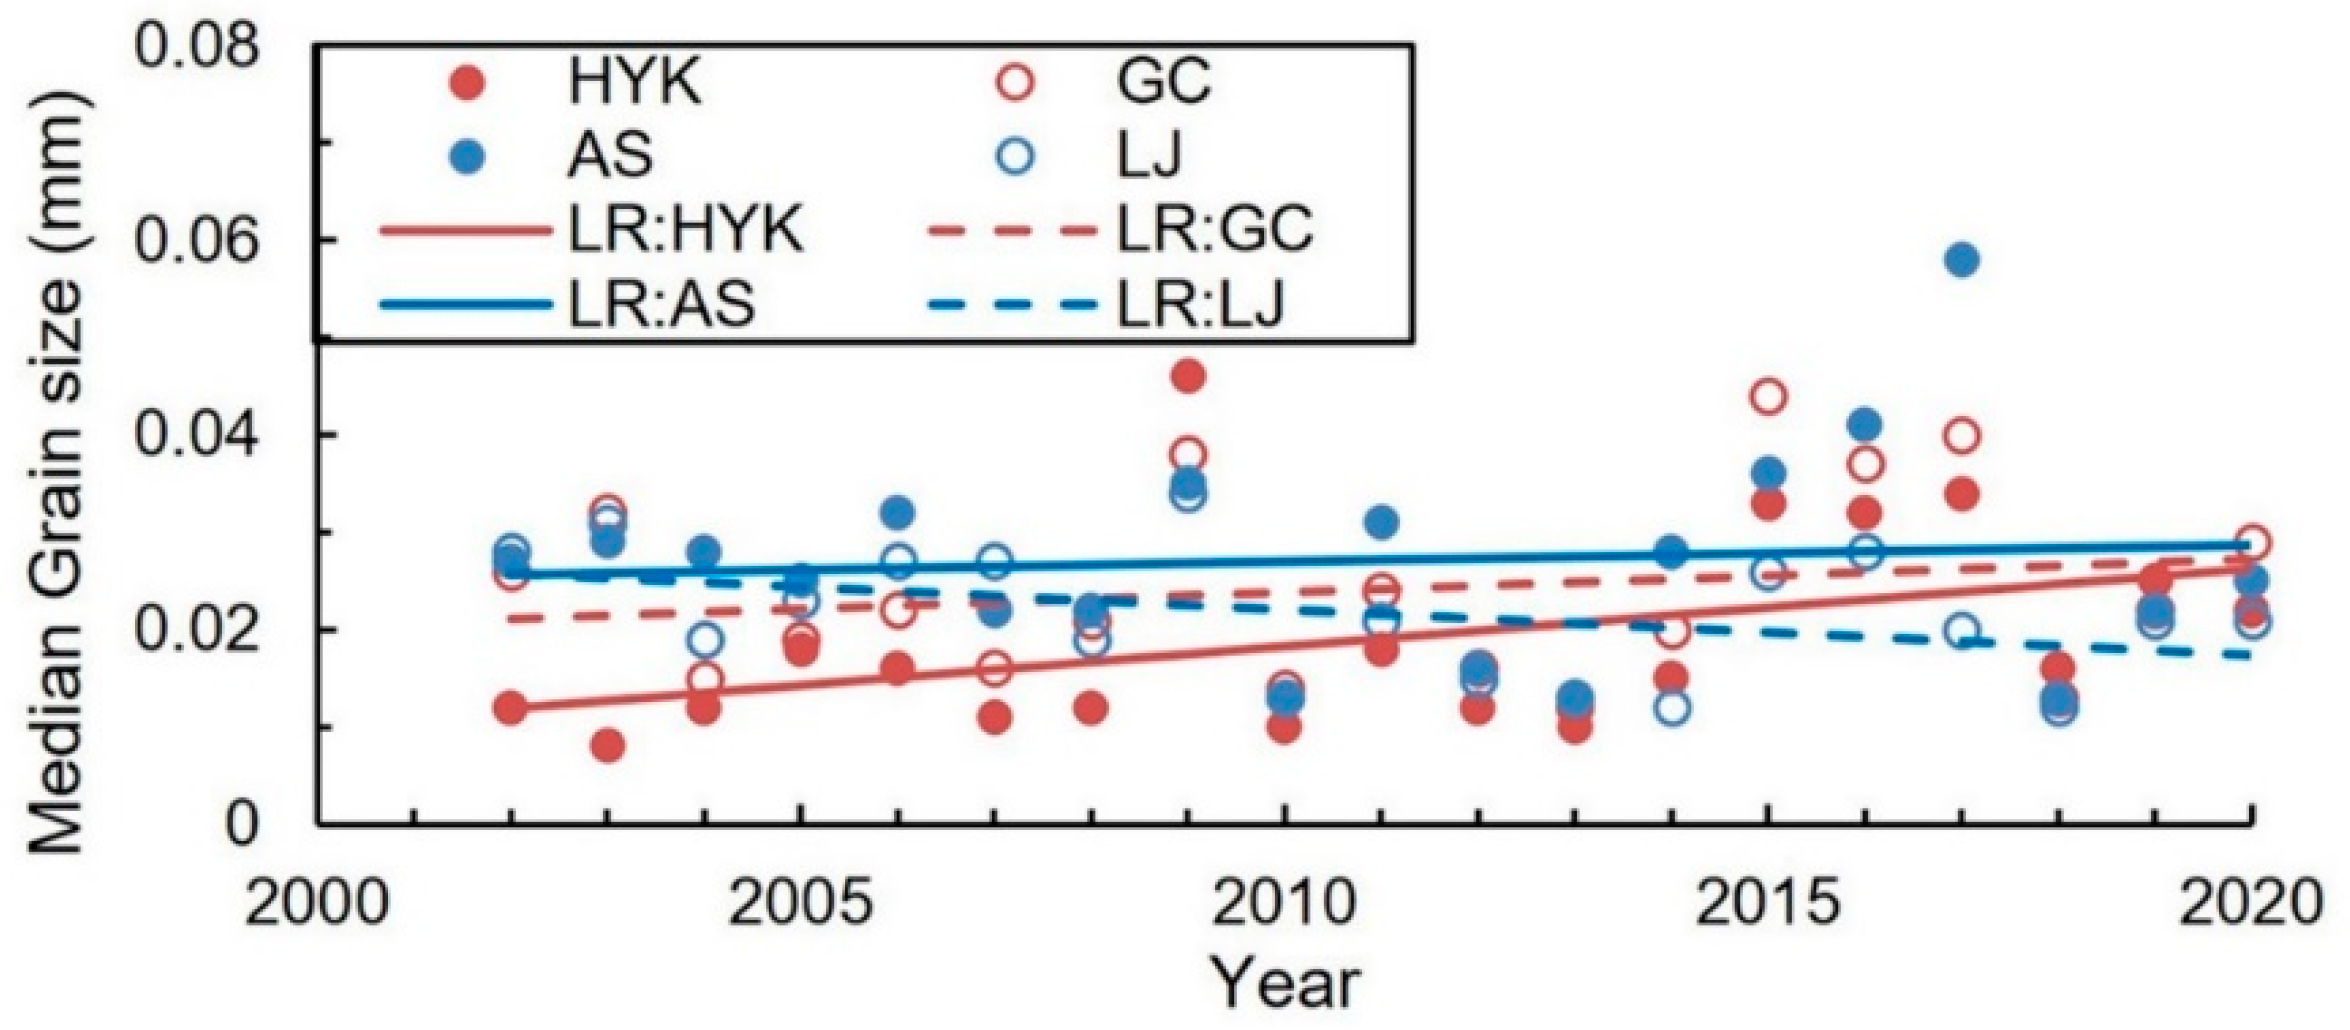
Variations in median grain size of suspended sediment can suggest the erosion–accretion patterns along the LYR. The variations of yearly suspended sediment diameters through hydrological stations, which can be accessed from BYRS and BCRS (Table 1), showed a typically coarsened sediment delivery in the LYR during the post-dam period compared to the averaged median grain size of 18.5 μm at LJ during 1976–1999 [51]. Linear regressions show a coarsening trend of sediment delivery at HYK, GC, and AS stations and finer particles delivery at LJ station, indicating that the scouring efficiency increased at the HYK–AS segment and decreased at the AS–LJ segment (Figure 11). It is further supported by the slight deposition trend observed at the AS–LJ segment between 2014 and 2017, when the flow discharge was low at the upstream river boundary. Because the AS-LJ segment is a meandering reach with levee protection, it has a decreased sediment transport capacity, making the riverbed more susceptible to accretion and flood risk [37].
The supply of coarsened sediment from the LYR also shows channel erosion trends since the implementation of WSRS, which is also supported by the observations of coarsened riverbed sediment [32,75]. The coarsened sediment eroded by high river discharge is generally supplied to the river mouth for delta building [33]. Sediment dispersal to deeper shelf environments is restricted due to low suspended sediment concentrations and coarser sediment delivery, which has resulted in greater deposit proportions of total sediment delivery since the water regulation went into effect [76].
The results in this study are consistent with a previous study, which indicated that the sediment derived from the LYR has significantly decreased since 2007 [32]. In this study, a more detailed description of erosion–accretion patterns in different channel segments is given. In addition, the LYR is found to have potential inverse evolutionary trends from erosion to accretion after 2019 due to the significant decrease in scouring efficiency.
4.3. Impact of Other Environmental Forcings on Sediment Dynamics
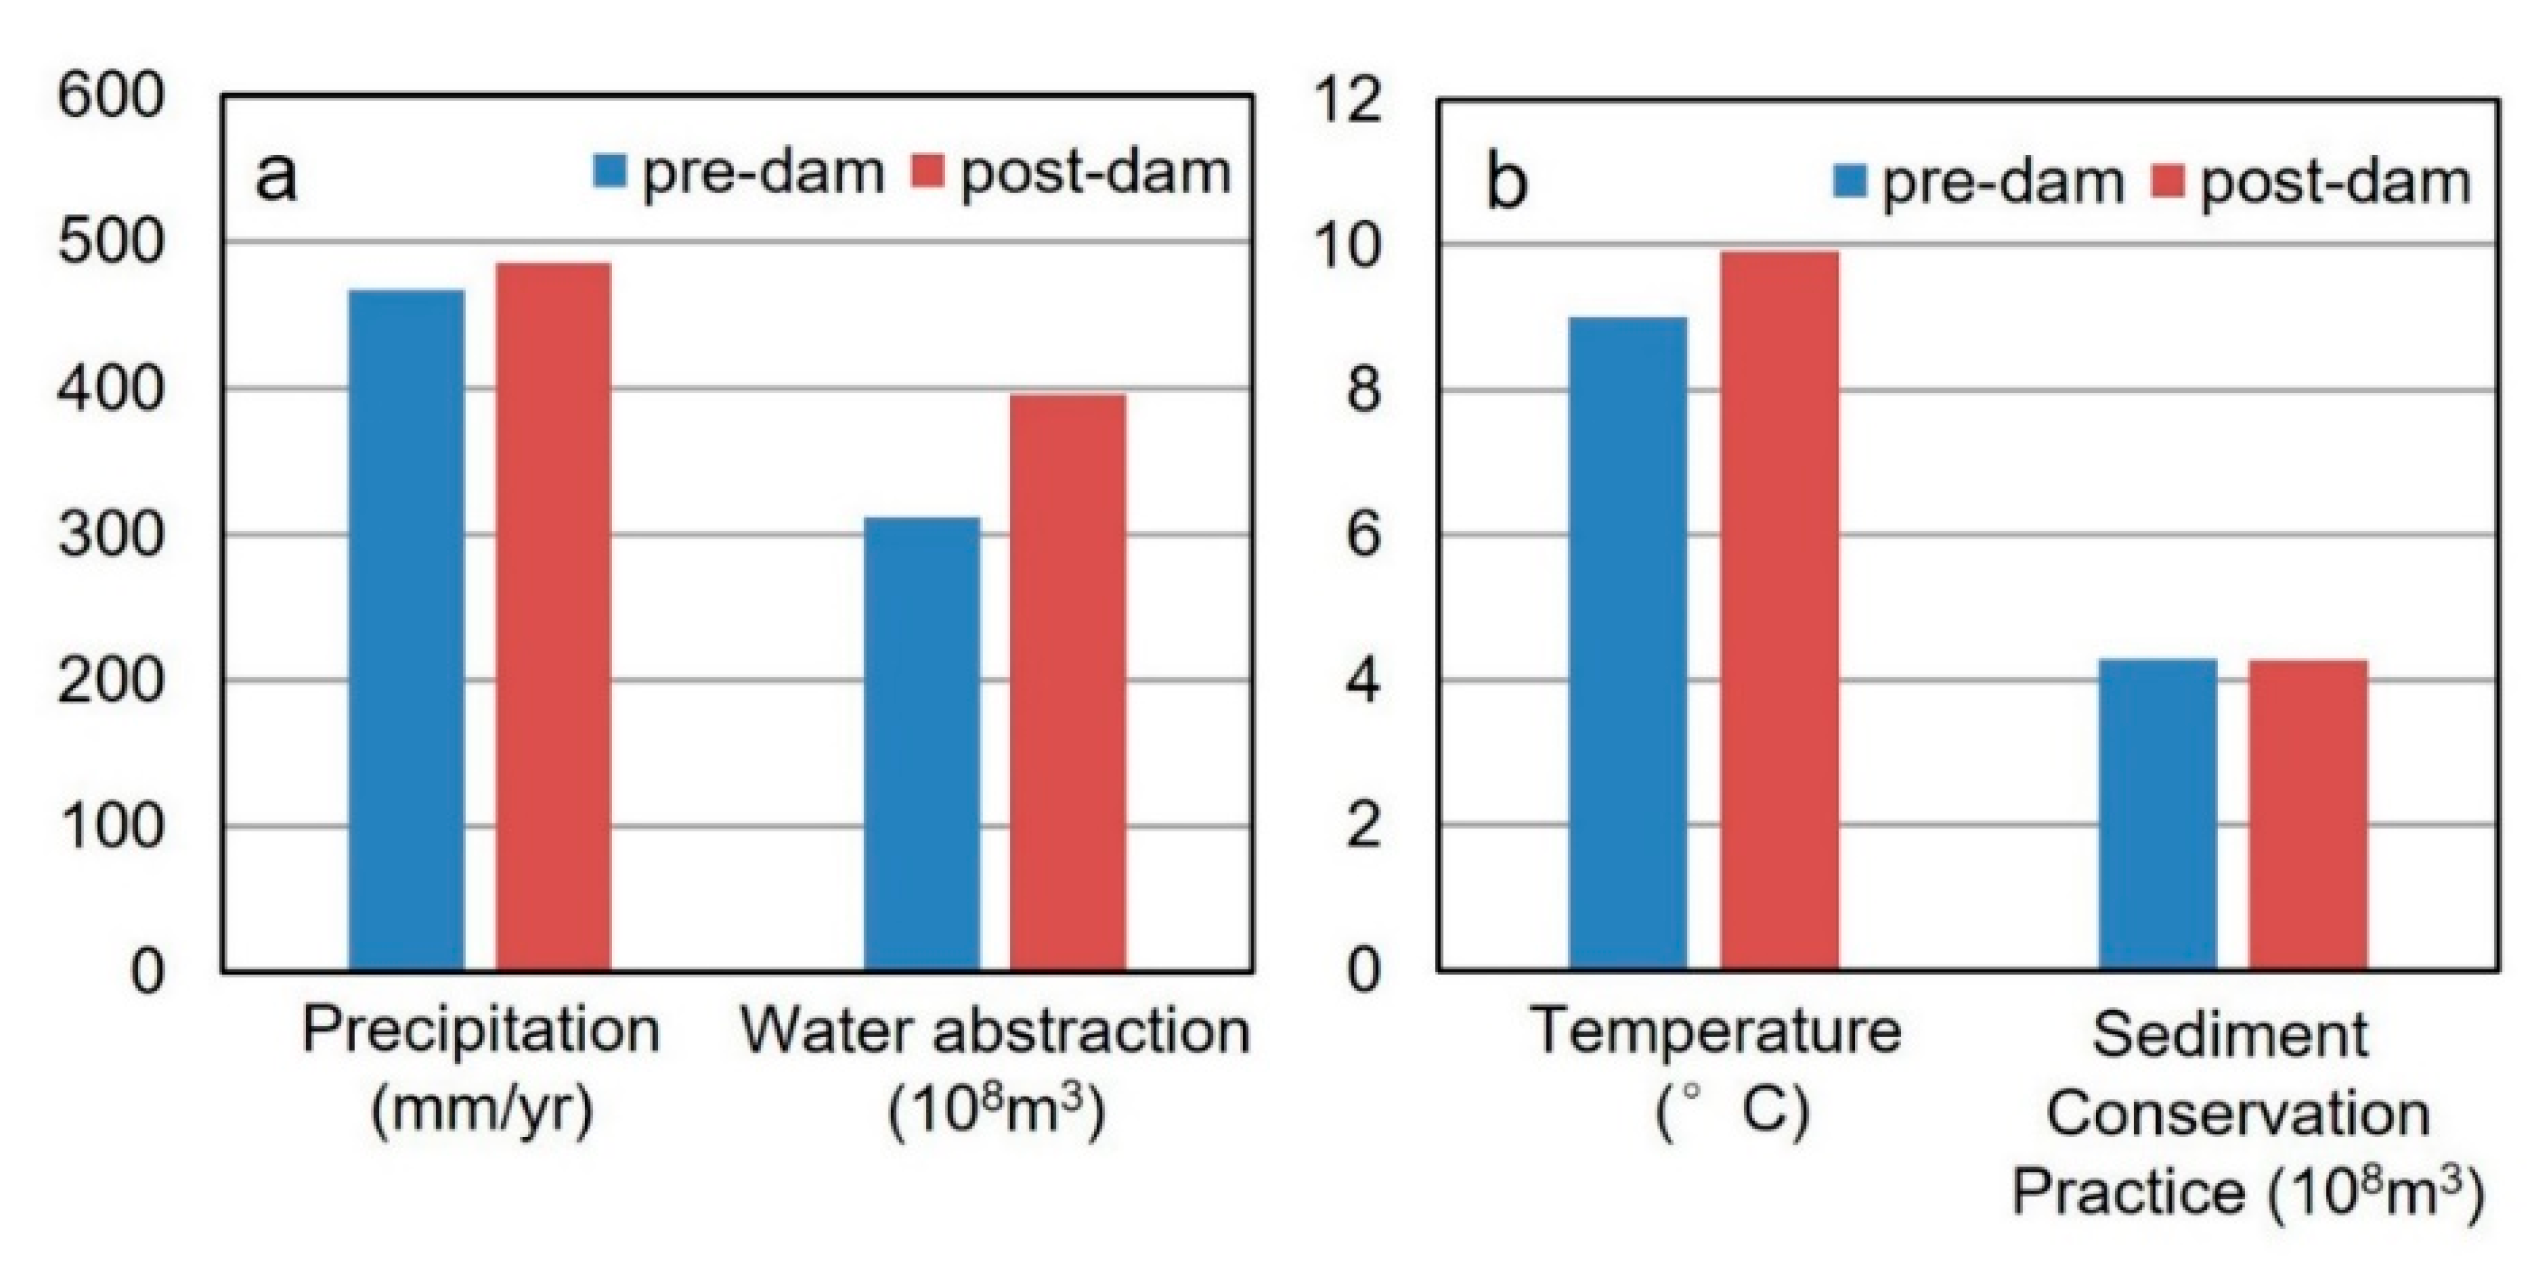
Human intervention and climate change significantly influence river hydrodynamics and morphological changes. Dams and reservoirs, soil and water conservation practices, water consumption, evaporation, and precipitation changes have all been explored as influencing factors on the morphological changes of the Yellow River and its delta [41,45,60,77]. These key environmental forcings that may determine the decline of sediment discharge in the LYR and to the delta during the post-dam period were investigated based on multi-sourced data (Figure 12, Supplementary Material Figure S1).
We found that basin-scale precipitation increased from 466.8 mm/yr during 1976–1999 to 486.2 mm/yr after 2000 and that the air temperature increased from 9.0 °C to 9.9 °C [78], both of which had a positive effect on the increase of water and sediment delivery [79]. The sediment discharge in the LYR, on the other hand, decreased to 14.8–24.0% of the pre-dam level. This suggests that climate change is not the primary cause of decreased sediment discharge in recent decades, but a dominant factor influencing interannual runoff fluctuations [80].
In terms of human activities, the soil and water conservation practices have attained a high level for sediment and water retention, resulting in an estimate of sediment entrapment of 4.29 × 10⁸ t/yr during 1980–1999 and 4.28 × 10⁸ t/yr during 2000–2015 in the middle reaches [53,54]. In comparison, reservoirs in the YRB have kept roughly 5.9 × 10⁸ t/yr of sediment [44], with the construction of XLD Reservoir alone capturing of 1.7 × 10⁸ t/yr of upstream sediment since 2000, suggested by BCRS. It implies that highly efficient soil and water conservation practices, as well as dam constructions, have reduced sediment deposit in the LYR. Furthermore, due to socio-economic reasons before 1960, the deforestation for agriculture caused substantial soil erosion in the middle-reach of the Yellow River, making the Yellow River one of the most sediment-laden rivers. Since the 1980s, the land cover of the YRB has significantly changed, and the effect of soil and water conservation practices on sediment retention is both stable and efficient during both pre-dam and post-dam periods. Comparatively, the operational and planned dams are playing a dominant role in increasing sediment retention. Other human activities, such as increased water and sediment abstraction owing to economic development, have also contributed to the decrease of fluvial sediment to the sea. During the post-dam period, sediment loss owing to water diversion is estimated to be between 0.2–1.5 × 10⁸ t/yr in the LYR from BYRS and [60], which is not considered as the primary cause for sediment decrease.
Previous studies gave systematic analysis of the contributions of human activities and climate change on the reduction of sediment load and found that over 70% decrease was caused by water–soil conservation practices (40%) and sediment-trapping by reservoirs (30%) [45,60]. Our study shows that water–soil conservation practices may play a crucial role in shaping sediment dynamics in the early stage of human interference in the YRB. Since it became stable and efficient since 1980s, with the increasing trend of precipitation and temperature at decadal scale, the dams and reservoirs play a more crucial role in shaping sediment dynamics from the LYR to the YRD.
Although the post-dam effect by XLD Reservoir has irreversibly triggered a decrease in sediment delivery and erosion of the lower river-delta system, the Yellow River’s dam-based water regulation scheme provides a good example of pre-planned man-made floods successfully flushing the heavy deposit in the lower channels and behind reservoirs to build new land in the active delta, and it might be applied to other fluvial-deltaic systems to achieve geomorphic sustainability. If the dam-based river regulation is not in place, the LYR may convert to a net deposition state, causing a decrease of over half of the material to be delivered and severe erosion near the active delta. The current challenge is the functional degradation of water regulation in effectively scouring the downstream riverbed [81,82], and the irreversibly drowning tendency of the whole YRD.
5. Conclusions
Utilizing up-to-date multi-source hydrological and morphological data along the lower fluvial-deltaic system of the Yellow River, this study presents a quantitative analysis of hydrogeomorphic transition processes and sediment budget changes from the LYR to the YRD before and after the full implementation of the XLD Reservoir. The key findings are:
- (1)
- The post-dam effect induced a more balanced relationship between annual water and sediment discharges. Natural flood seasons were replaced with man-made flood peaks with the implementation of WSRS, with reduced seasonal variations in river delivery. Changes in flow regime induced a substantial reduction in water levels and geomorphic transition in the LYR, with severe erosion occurring in braided reaches compared to lower reaches with training features. The entire YRD also received reduced sediment supply and experienced erosional processes with significant spatial morphological heterogeneity, with only limited accretion of the active river mouth.
- (2)
- The impoundment of XLD Reservoir and implementation of WSRS caused a downstream shift in the river-derived sediment source. From 2001 to 2020, the LYR has provided 48% of the total material delivered to the YRD, 38.5% of which were lost due to water abstraction. As the riverbed sediment coarsening and upstream river boundary changes, the channel scouring efficiency is rapidly decreasing.
- (3)
- Because the effect of soil and water conservation practices on sediment retention was both stable and efficient in the last 40 years, the operational and planned dams is being the dominant factor resulted in the reduction of sediment supply. Upstream damming results in fluvial regime shifts, downstream channel erosion, and delta front degradation, and this process is to some extent irreversible. Given the challenge of decreasing scouring efficiency of river channels and degradation of deltaic environments, future river regulation measures should consider the geomorphic sustainability of both the LYR and the YRD system.
Supplementary Materials
The following supporting information can be downloaded at: https://www.mdpi.com/article/10.3390/w14132079/s1, Figure S1: Environmental changes in the Yellow River Basin.
Author Contributions
Conceptualization, H.J. and S.C.; methodology, H.J. and P.L.; software, Y.F. (Yutao Fu); formal analysis, Y.F. (Yaoshen Fan); investigation, C.J.; data curation, H.J.; writing—original draft preparation, H.J.; writing—review and editing, S.C., H.J. and F.L.; supervision, S.C.; funding acquisition, S.C., C.J., Y.F. (Yaoshen Fan), F.L. and H.J. All authors have read and agreed to the published version of the manuscript.
Funding
This study was partly supported by the National Natural Science Foundation of China (NSFC, No. U1706214, 42106170, U2243207, and 41976187), the National Natural Science Foundation of Jiangsu Province young investigator grant program (No. BK20210948), the Open Research Fund of SKLEC (SKLEC-KF202001), and the joint Ph.D. program of the China Scholarship Council for Overseas Studies (No. 201806140079).
Institutional Review Board Statement
Not applicable.
Informed Consent Statement
Not applicable.
Data Availability Statement
The data that support the findings of this study are available from the corresponding author upon reasonable request.
Acknowledgments
We would like to acknowledge the hydrological dataset provided by the Yellow River Conservancy Commission, Ministry of Water Resources of China, and the open-source remote sensing data provided by the USGS. We would also thank anonymous reviewers for their constructive comments.
Conflicts of Interest
The authors declare no conflict of interest.
References
- Bianchi, T.S.; Allison, M.A. Large-river delta-front estuaries as natural ‘‘recorders’’ of global environmental change. Proc. Natl. Acad. Sci. USA 2009, 106, 8085–8092. [Google Scholar] [CrossRef] [PubMed] [Green Version]
- Wang, B.; Xu, Y.J. Decadal-Scale Riverbed Deformation and Sand Budget of the Last 500 km of the Mississippi River: Insights Into Natural and River Engineering Effects on a Large Alluvial River. J. Geophys. Res. Earth Surf. 2018, 123, 874–890. [Google Scholar] [CrossRef]
- Maavara, T.; Chen, Q.; Van Meter, K.; Brown, L.E.; Zhang, J.; Ni, J.; Zarfl, C. River dam impacts on biogeochemical cycling. Nat. Rev. Earth Environ. 2020, 1, 103–116. [Google Scholar] [CrossRef]
- Dai, Z.; Mei, X.; Darby, S.E.; Lou, Y.; Li, W. Fluvial sediment transfer in the Changjiang (Yangtze) river-estuary depositional system. J. Hydrol. 2018, 566, 719–734. [Google Scholar] [CrossRef] [Green Version]
- Liu, F.; Xie, R.; Luo, X.; Yang, L.; Cai, H.; Yang, Q. Stepwise adjustment of deltaic channels in response to human interventions and its hydrological implications for sustainable water managements in the Pearl River Delta, China. J. Hydrol. 2019, 573, 194–206. [Google Scholar] [CrossRef]
- Nilsson, C.; Reidy, C.A.; Dynesius, M.; Revenga, C. Fragmentation and Flow Regulation of the World’s Large River Systems. Science 2005, 308, 405–408. [Google Scholar] [CrossRef] [Green Version]
- Best, J. Anthropogenic stresses on the world’s big rivers. Nat. Geosci. 2018, 12, 7–21. [Google Scholar] [CrossRef]
- Samaras, A.G.; Koutitas, C.G. An integrated approach to quantify the impact of watershed management on coastal morphology. Ocean Coast. Manag. 2012, 69, 68–77. [Google Scholar] [CrossRef]
- Bamunawala, J.; Dastgheib, A.; Ranasinghe, R.; van der Spek, A.; Maskey, S.; Murray, A.B.; Duong, T.M.; Barnard, P.L.; Sirisena, T.A.J.G. A Holistic Modeling Approach to Project the Evolution of Inlet-Interrupted Coastlines Over the 21st Century. Front. Mar. Sci. 2020, 7, 542. [Google Scholar] [CrossRef]
- Syvitski, J.P.; Vorosmarty, C.J.; Kettner, A.J.; Green, P. Impact of humans on the flux of terrestrial sediment to the global coastal ocean. Science 2005, 308, 376–380. [Google Scholar] [CrossRef]
- Topping, D.J.; Rubin, D.M.; Vierra, L.E. Colorado River sediment transport: 1. Natural sediment supply limitation and the influence of Glen Canyon Dam. Water Resour. Res. 2000, 36, 515–542. [Google Scholar] [CrossRef]
- Cox, J.R.; Huismans, Y.; Knaake, S.M.; Leuven, J.R.F.W.; Vellinga, N.E.; Vegt, M.; Hoitink, A.J.F.; Kleinhans, M.G. Anthropogenic Effects on the Contemporary Sediment Budget of the Lower Rhine-Meuse Delta Channel Network. Earth’s Future 2021, 9, e2020EF001869. [Google Scholar] [CrossRef]
- Ylla Arbós, C.; Blom, A.; Viparelli, E.; Reneerkens, M.; Frings, R.M.; Schielen, R.M.J. River Response to Anthropogenic Modification: Channel Steepening and Gravel Front Fading in an Incising River. Geophys. Res. Lett. 2021, 48, e2020GL091338. [Google Scholar] [CrossRef]
- Vörösmarty, C.J.; Meybeck, M.; Fekete, B.; Sharma, K.; Green, P.; Syvitski, J.P.M. Anthropogenic sediment retention: Major global impact from registered river impoundments. Glob. Planet. Chang. 2003, 39, 169–190. [Google Scholar] [CrossRef]
- Barbarossa, V.; Schmitt, R.J.P.; Huijbregts, M.A.J.; Zarfl, C.; King, H.; Schipper, A.M. Impacts of current and future large dams on the geographic range connectivity of freshwater fish worldwide. Proc. Natl. Acad. Sci. USA 2020, 117, 3648–3655. [Google Scholar] [CrossRef] [Green Version]
- Latrubesse, E.M.; Arima, E.Y.; Dunne, T.; Park, E.; Baker, V.R.; d’Horta, F.M.; Wight, C.; Wittmann, F.; Zuanon, J.; Baker, P.A.; et al. Damming the rivers of the Amazon basin. Nature 2017, 546, 363–369. [Google Scholar] [CrossRef]
- Kondolf, G.M.; Rubin, Z.K.; Minear, J.T. Dams on the Mekong: Cumulative sediment starvation. Water Resour. Res. 2014, 50, 5158–5169. [Google Scholar] [CrossRef]
- Li, X.; Liu, J.P.; Saito, Y.; Nguyen, V.L. Recent evolution of the Mekong Delta and the impacts of dams. Earth-Sci. Rev. 2017, 175, 1–17. [Google Scholar] [CrossRef]
- Kondolf, G.M.; Schmitt, R.J.P.; Carling, P.; Darby, S.; Arias, M.; Bizzi, S.; Castelletti, A.; Cochrane, T.A.; Gibson, S.; Kummu, M.; et al. Changing sediment budget of the Mekong: Cumulative threats and management strategies for a large river basin. Sci. Total Environ. 2018, 625, 114–134. [Google Scholar] [CrossRef] [Green Version]
- Meade, R.H.; Moody, J.A. Causes for the decline of suspended-sediment discharge in the Mississippi River system, 1940–2007. Hydrol. Processes 2009, 24, 35–49. [Google Scholar] [CrossRef]
- Bentley, S.J.; Blum, M.D.; Maloney, J.; Pond, L.; Paulsell, R. The Mississippi River source-to-sink system: Perspectives on tectonic, climatic, and anthropogenic influences, Miocene to Anthropocene. Earth-Sci. Rev. 2016, 153, 139–174. [Google Scholar] [CrossRef] [Green Version]
- Maloney, J.M.; Bentley, S.J.; Xu, K.; Obelcz, J.; Georgiou, I.Y.; Miner, M.D. Mississippi River subaqueous delta is entering a stage of retrogradation. Mar. Geol. 2018, 400, 12–23. [Google Scholar] [CrossRef]
- Yang, S.L.; Zhang, J.; Xu, X.J. Influence of the Three Gorges Dam on downstream delivery of sediment and its environmental implications, Yangtze River. Geophys. Res. Lett. 2007, 34, L10401. [Google Scholar] [CrossRef]
- Thieme, M.L.; Tickner, D.; Grill, G.; Carvallo, J.P.; Goichot, M.; Hartmann, J.; Higgins, J.; Lehner, B.; Mulligan, M.; Nilsson, C.; et al. Navigating trade-offs between dams and river conservation. Glob. Sustain. 2021, 4, E17. [Google Scholar] [CrossRef]
- Malara, G.; Zema, D.A.; Arena, F.; Bombino, G.; Zimbone, S.M. Coupling watershed—Coast systems to study evolutionary trends: A review. Earth-Sci. Rev. 2020, 201, 103040. [Google Scholar] [CrossRef]
- Varrani, A.; Nones, M.; Gupana, R. Long-term modelling of fluvial systems at the watershed scale: Examples from three case studies. J. Hydrol. 2019, 574, 1042–1052. [Google Scholar] [CrossRef]
- Nones, M.; Ronco, P.; Di Silvio, G. Modelling the impact of large impoundments on the Lower Zambezi River. Int. J. River Basin Manag. 2013, 11, 221–236. [Google Scholar] [CrossRef]
- Csiki, S.; Rhoads, B.L. Hydraulic and geomorphological effects of run-of-river dams. Prog. Phys. Geogr. Earth Environ. 2010, 34, 755–780. [Google Scholar] [CrossRef]
- Day, J.W.; Agboola, J.; Chen, Z.; D’Elia, C.; Forbes, D.L.; Giosan, L.; Kemp, P.; Kuenzer, C.; Lane, R.R.; Ramachandran, R.; et al. Approaches to defining deltaic sustainability in the 21st century. Estuar. Coast. Shelf Sci. 2016, 183, 275–291. [Google Scholar] [CrossRef]
- Wang, S.; Fu, B.; Piao, S.; Lü, Y.; Ciais, P.; Feng, X.; Wang, Y. Reduced sediment transport in the Yellow River due to anthropogenic changes. Nat. Geosci. 2015, 9, 38–41. [Google Scholar] [CrossRef]
- Milliman, J.D.; Meade, R.H. World-wide delivery of river sediment to the oceans. J. Geol. 1983, 91, 1–21. [Google Scholar] [CrossRef]
- Wang, H.; Wu, X.; Bi, N.; Li, S.; Yuan, P.; Wang, A.; Syvitski, J.P.M.; Saito, Y.; Yang, Z.; Liu, S.; et al. Impacts of the dam-orientated water-sediment regulation scheme on the lower reaches and delta of the Yellow River (Huanghe): A review. Glob. Planet. Chang. 2017, 157, 93–113. [Google Scholar] [CrossRef]
- Yu, Y.; Wang, H.; Shi, X.; Ran, X.; Cui, T.; Qiao, S.; Liu, Y. New discharge regime of the Huanghe (Yellow River): Causes and implications. Cont. Shelf Res. 2013, 69, 62–72. [Google Scholar] [CrossRef]
- Bi, N.; Sun, Z.; Wang, H.; Wu, X.; Fan, Y.; Xu, C.; Yang, Z. Response of channel scouring and deposition to the regulation of large reservoirs: A case study of the lower reaches of the Yellow River (Huanghe). J. Hydrol. 2019, 568, 972–984. [Google Scholar] [CrossRef]
- Fan, Y.; Chen, S.; Zhao, B.; Pan, S.; Jiang, C.; Ji, H. Shoreline dynamics of the active Yellow River delta since the implementation of Water-Sediment Regulation Scheme: A remote-sensing and statistics-based approach. Estuar. Coast. Shelf Sci. 2018, 200, 406–419. [Google Scholar] [CrossRef]
- Wu, B.; Xia, J.; Fu, X.; Zhang, Y.; Wang, G. Effect of altered flow regime on bankfull area of the Lower Yellow River, China. Earth Surf. Processes Landf. 2008, 33, 1585–1601. [Google Scholar] [CrossRef]
- Kong, D.; Miao, C.; Li, J.; Zheng, H. Full-stream erosion in the lower Yellow River: Feasibility, sustainability and opportunity. Sci. Total Environ. 2022, 807, 150810. [Google Scholar] [CrossRef]
- Li, J.; Xia, J.; Ji, Q. Rapid and long-distance channel incision in the Lower Yellow River owing to upstream damming. Catena 2021, 196, 104943. [Google Scholar] [CrossRef]
- Ji, H.; Chen, S.; Pan, S.; Xu, C.; Jiang, C.; Fan, Y. Morphological variability of the active Yellow River mouth under the new regime of riverine delivery. J. Hydrol. 2018, 564, 329–341. [Google Scholar] [CrossRef]
- Wu, X.; Bi, N.; Xu, J.; Nittrouer, J.A.; Yang, Z.; Saito, Y.; Wang, H. Stepwise morphological evolution of the active Yellow River (Huanghe) delta lobe (1976–2013): Dominant roles of riverine discharge and sediment grain size. Geomorphology 2017, 292, 115–127. [Google Scholar] [CrossRef]
- Jiang, C.; Pan, S.; Chen, S. Recent morphological changes of the Yellow River (Huanghe) submerged delta: Causes and environmental implications. Geomorphology 2017, 293, 93–107. [Google Scholar] [CrossRef]
- Miao, C.; Ni, J.; Borthwick, A.G.L.; Yang, L. A preliminary estimate of human and natural contributions to the changes in water discharge and sediment load in the Yellow River. Glob. Planet. Chang. 2011, 76, 196–205. [Google Scholar] [CrossRef] [Green Version]
- Chu, Z. The dramatic changes and anthropogenic causes of erosion and deposition in the lower Yellow (Huanghe) River since 1952. Geomorphology 2014, 216, 171–179. [Google Scholar] [CrossRef]
- Ran, L.; Lu, X.X. Delineation of reservoirs using remote sensing and their storage estimate: An example of the Yellow River basin, China. Hydrol. Processes 2012, 26, 1215–1229. [Google Scholar] [CrossRef]
- Peng, J.; Chen, S.; Dong, P. Temporal variation of sediment load in the Yellow River basin, China, and its impacts on the lower reaches and the river delta. Catena 2010, 83, 135–147. [Google Scholar] [CrossRef]
- Zheng, S.; Han, S.; Tan, G.; Xia, J.; Wu, B.; Wang, K.; Edmonds, D.A. Morphological adjustment of the Qingshuigou channel on the Yellow River Delta and factors controlling its avulsion. Catena 2018, 166, 44–55. [Google Scholar] [CrossRef]
- Ji, H.; Pan, S.; Chen, S. Impact of river discharge on hydrodynamics and sedimentary processes at Yellow River Delta. Mar. Geol. 2020, 425, 106210. [Google Scholar] [CrossRef]
- Kuenzer, C.; Ottinger, M.; Liu, G.; Sun, B.; Baumhauer, R.; Dech, S. Earth observation-based coastal zone monitoring of the Yellow River Delta: Dynamics in China’s second largest oil producing region over four decades. Appl. Geogr. 2014, 55, 92–107. [Google Scholar] [CrossRef]
- Cui, B.-L.; Li, X.-Y. Coastline change of the Yellow River estuary and its response to the sediment and runoff (1976–2005). Geomorphology 2011, 127, 32–40. [Google Scholar] [CrossRef]
- Jiang, C.; Chen, S.; Pan, S.; Fan, Y.; Ji, H. Geomorphic evolution of the Yellow River Delta: Quantification of basin-scale natural and anthropogenic impacts. Catena 2018, 163, 361–377. [Google Scholar] [CrossRef]
- Wang, H.; Bi, N.; Saito, Y.; Wang, Y.; Sun, X.; Zhang, J.; Yang, Z. Recent changes in sediment delivery by the Huanghe (Yellow River) to the sea: Causes and environmental implications in its estuary. J. Hydrol. 2010, 391, 302–313. [Google Scholar] [CrossRef]
- Long, Y.Q.; Liang, G.T.; Zhang, Y.F. Range survey of deposition in the lower Yellow River. Int. J. Sediment Res. 2002, 17, 91–101. [Google Scholar]
- Peng, J.; Chen, S. The variation process of water and sediment and its effect on the Yellow River Delta over the six decades. Acta Geogr. Sin. 2009, 64, 1353–1362. [Google Scholar]
- Gao, J.; Gao, Y.; Yue, B. Analysis of Soil and Water Conservation Benefits of Yellow River Management in recent 70 Years. Yellow River 2016, 38, 20–23. [Google Scholar]
- Mossa, J. Sediment dynamics in the lowermost Mississippi River. Eng. Geol. 1996, 45, 457–479. [Google Scholar] [CrossRef]
- Brandt, S.A. Classification of geomorphological effects downstream of dams. CATENA 2000, 40, 375–401. [Google Scholar] [CrossRef]
- Wu, B.S.; Shen, G.Q. Discussion of the physical meaning of incoming sediment coefficient. Yellow River 2008, 30, 15–16. [Google Scholar]
- Hu, C. Variation of Flow and Sediment and Complicated Response of Channels in the Yellow River; The Publishing Company of Science: Beijing, China, 2005. [Google Scholar]
- Liu, F.; Chen, S.; Dong, P.; Peng, J. Spatial and temporal variability of water discharge in the Yellow River Basin over the past 60 years. J. Geogr. Sci. 2012, 22, 1013–1033. [Google Scholar] [CrossRef]
- Wang, H.; Yang, Z.; Saito, Y.; Liu, J.P.; Sun, X.; Wang, Y. Stepwise decreases of the Huanghe (Yellow River) sediment load (1950–2005): Impacts of climate change and human activities. Glob. Planet. Chang. 2007, 57, 331–354. [Google Scholar] [CrossRef]
- Xiong, G.S. Non-cohesive silt dry bulk analysis. Yellow River 1993, 10, 7–8. [Google Scholar]
- Hossain, S.K.A.; Mondal, I.; Thakur, S.; Linh, N.T.T.; Anh, D.T. Assessing the multi-decadal shoreline dynamics along the Purba Medinipur-Balasore coastal stretch, India by integrating remote sensing and statistical methods. Acta Geophys. 2022, 1–5. [Google Scholar] [CrossRef]
- Kumar, L.; Afzal, M.S.; Afzal, M.M. Mapping shoreline change using machine learning: A case study from the eastern Indian coast. Acta Geophys. 2020, 68, 1127–1143. [Google Scholar] [CrossRef]
- McFeeters, S.K. The use of the Normalized Difference Water Index (NDWI) in the delineation of open water features. Int. J. Remote Sens. 1996, 17, 1425–1432. [Google Scholar] [CrossRef]
- Thieler, E.R.; Himmelstoss, E.A.; Zichichi, J.L.; Ergul, A. The Digital Shoreline Analysis System (DSAS) Version 4.0—An ArcGIS Extension for Calculating Shoreline Change, 2008-1278; U.S. Geological Survey: Reston, VA, USA, 2009. [Google Scholar]
- Wang, H.; Yang, Z.; Saito, Y.; Liu, J.P.; Sun, X. Interannual and seasonal variation of the Huanghe (Yellow River) water discharge over the past 50 years: Connections to impacts from ENSO events and dams. Glob. Planet. Chang. 2006, 50, 212–225. [Google Scholar] [CrossRef]
- Besset, M.; Anthony, E.J.; Bouchette, F. Multi-decadal variations in delta shorelines and their relationship to river sediment supply: An assessment and review. Earth-Sci. Rev. 2019, 193, 199–219. [Google Scholar] [CrossRef] [Green Version]
- Li, P.; Chen, S.; Ji, H.; Ke, Y.; Fu, Y. Combining Landsat-8 and Sentinel-2 to investigate seasonal changes of suspended particulate matter off the abandoned distributary mouths of Yellow River Delta. Mar. Geol. 2021, 441, 106622. [Google Scholar] [CrossRef]
- Bi, N.; Wang, H.; Wu, X.; Saito, Y.; Xu, C.; Yang, Z. Phase change in evolution of the modern Huanghe (Yellow River) Delta: Process, pattern, and mechanisms. Mar. Geol. 2021, 437, 106516. [Google Scholar] [CrossRef]
- Fu, Y.; Chen, S.; Ji, H.; Fan, Y.; Li, P. The modern Yellow River Delta in transition: Causes and implications. Mar. Geol. 2021, 436, 106476. [Google Scholar] [CrossRef]
- Lin, X.; Liu, Q.; Qu, S. Impact of diverted water and sediment on erosion and deposition in Lower Yellow River. J. Sediment Res. 2010, 6, 42–47. [Google Scholar]
- Fan, Y.; Chen, S.; Zhao, B.; Yu, S.; Ji, H.; Jiang, C. Monitoring tidal flat dynamics affected by human activities along an eroded coast in the Yellow River Delta, China. Environ. Monit. Assess. 2018, 190, 396. [Google Scholar] [CrossRef]
- Yu, J.; Li, Y.; Han, G.; Zhou, D.; Fu, Y.; Guan, B.; Wang, G.; Ning, K.; Wu, H.; Wang, J. The spatial distribution characteristics of soil salinity in coastal zone of the Yellow River Delta. Environ. Earth Sci. 2013, 72, 589–599. [Google Scholar] [CrossRef] [Green Version]
- Wang, M.; Qi, S.; Zhang, X. Wetland loss and degradation in the Yellow River Delta, Shandong Province of China. Environ. Earth Sci. 2012, 67, 185–188. [Google Scholar] [CrossRef]
- Xue, B.; Zhang, X.; Xu, L.; Li, J.; Mao, H. Response law of sediment diameter change in the lower Yellow River to water and sediment regulation in Xiaolangdi Reservoir. J. North China Univ. Water Resour. Electr. Power 2020, 41, 55–62. [Google Scholar]
- Ji, H.; Chen, S.; Pan, S.; Xu, C.; Tian, Y.; Li, P.; Liu, Q.; Chen, L. Fluvial sediment source to sink transfer at the Yellow River Delta: Quantifications, causes, and environmental impacts. J. Hydrol. 2022, 608, 127622. [Google Scholar] [CrossRef]
- Chu, Z.X.; Zhai, S.K.; Lu, X.X.; Liu, J.P.; Xu, J.X.; Xu, K.H. A quantitative assessment of human impacts on decrease in sediment flux from major Chinese rivers entering the western Pacific Ocean. Geophys. Res. Lett. 2009, 36. [Google Scholar] [CrossRef]
- Wang, Y.H.; Tan, D.; Han, L.Y.; Li, D.H.; Wang, X.; Lu, G.Y.; Lin, J.J. Review of climate change in the Yellow River Basin. J. Desert Res. 2021, 41, 235–246. [Google Scholar]
- Kazimierski, L.D.; Irigoyen, M.; Re, M.; Menendez, A.N.; Spalletti, P.; Brea, J.D. Impact of Climate Change on sediment yield from the Upper Plata Basin. Int. J. River Basin Manag. 2013, 11, 411–421. [Google Scholar] [CrossRef]
- Tang, Y.; Tang, Q.; Tian, F.; Zhang, Z.; Liu, G. Responses of natural runoff to recent climatic variations in the Yellow River basin, China. Hydrol. Earth Syst. Sci. 2013, 17, 4471–4480. [Google Scholar] [CrossRef] [Green Version]
- Miao, C.; Kong, D.; Wu, J.; Duan, Q. Functional degradation of the water-sediment regulation scheme in the lower Yellow River: Spatial and temporal analyses. Sci. Total Environ. 2016, 551–552, 16–22. [Google Scholar] [CrossRef]
- Wu, X.; Bi, N.; Syvitski, J.; Saito, Y.; Xu, J.; Nittrouer, J.A.; Bianchi, T.S.; Yang, Z.; Wang, H. Can Reservoir Regulation Along the Yellow River Be a Sustainable Way to Save a Sinking Delta? Earth’s Future 2020, 8, e2020EF001587. [Google Scholar] [CrossRef]
Figure 1.
Sketch map of the study area: (a) the lower reaches of the Yellow River from the Xiaolangdi (XLD) Reservoir to the Yellow River Delta (YRD). Main hydrological stations along the mainstream of the LYR are Huayuankou (HYK), Jiahetan (JHT), Gaocun (GC), Sunkou (SK), Aishan (AS), Luokou (LK), Lijin (LJ). (b) Elevation changes along the mainstream of the LYR.

Figure 2.
Temporal variations in water discharge and sediment load at (a) HYK and (b) LJ stations during 1976–2020. The blue dash lines indicate the mean water discharge and the red dash lines represent the mean sediment load.
Figure 2.
Temporal variations in water discharge and sediment load at (a) HYK and (b) LJ stations during 1976–2020. The blue dash lines indicate the mean water discharge and the red dash lines represent the mean sediment load.

Figure 3.
Sketch diagram of sediment source and sink along the LYR during (a) channel erosion and (b) channel deposition state.
Figure 3.
Sketch diagram of sediment source and sink along the LYR during (a) channel erosion and (b) channel deposition state.

Figure 4.
Temporal variations of water and sediment discharge at (a) HYK and (b) LJ during 1976–1999 and 2000–2020. Temporal variations between SSC and water discharge during pre-dam (c) and post-dam periods (d) are also given. The black dash line indicates a suggested threshold of ξ = 0.015 to reference the erosion–accretion equilibrium in the lower reaches [58].

Figure 5.
Rating curves of distributions in monthly water discharge and sediment load at (a) HYK and (b) LJ stations during pre-dam and post-dam period. Numbers represent the sequential months.
Figure 5.
Rating curves of distributions in monthly water discharge and sediment load at (a) HYK and (b) LJ stations during pre-dam and post-dam period. Numbers represent the sequential months.

Figure 6.
The relationship between flow discharge and water levels at (a) HYK, (b) JHT, (c) GC, (d) SK, (e) AS, (f) LK, and (g) LJ stations. (h) The responding water levels to the normal water discharge 500 m3/s of each station and their fit slope of linear regression analysis in water level changes were calculated during 2002–2019. (i) Sketch map of hydrological stations along the LYR.

Figure 7.
(a) Erosion–accretion patterns in the LYR during 1976–2020. (b) Post-dam erosion–accretion rates in the LYR.
Figure 7.
(a) Erosion–accretion patterns in the LYR during 1976–2020. (b) Post-dam erosion–accretion rates in the LYR.

Figure 8.
Subaerial area changes and shoreline dynamics of the modern YRD: (a) pre-dam land area changes; (b) pre-dam shoreline changes; (c) post-dam area changes; (d) post-dam shoreline changes. The white lines in figures (a,c) indicate the position of the selected cross-shore transects.
Figure 8.
Subaerial area changes and shoreline dynamics of the modern YRD: (a) pre-dam land area changes; (b) pre-dam shoreline changes; (c) post-dam area changes; (d) post-dam shoreline changes. The white lines in figures (a,c) indicate the position of the selected cross-shore transects.

Figure 9.
Dynamics of sediment budget along the LYR. (a) Comparisons between pre-dam and post-dam sediment budgets. (b) Post-dam annual sediment scoured from the riverbed in the LYR and sediment discharge at the HYK station. (c) Proportions of sediment scoured in the LYR to the total river-derived sediment, which is regarded as the sum of sediment scoured from the river channel and sediment flux through the HYK station.

Figure 10.
(a) Post-dam scouring efficiency distributions of the lower reaches and (b) temporal variations.
Figure 10.
(a) Post-dam scouring efficiency distributions of the lower reaches and (b) temporal variations.

Figure 11.
Median grain diameters of suspended sediment at HYK, GC, AS, and LJ stations. The linear regression lines show a coarsening trend of sediment delivery at HYK, GC, and AS stations, and finer particles delivery at LJ station.
Figure 11.
Median grain diameters of suspended sediment at HYK, GC, AS, and LJ stations. The linear regression lines show a coarsening trend of sediment delivery at HYK, GC, and AS stations, and finer particles delivery at LJ station.

Figure 12.
Factors that control distributions of water and sediment discharge in the YRB during pre-dam and post-dam periods. (a) Precipitation and water abstraction. (b) Average watershed temperature and sediment retention by soil and water conservation practices in the middle reaches. Detailed information can be seen in Supplementary Material Figure S1.


Table 1.
Information of hydrological data utilized in this study.
| Data | Position | Source | Timespan |
|---|---|---|---|
| Monthly water and sediment discharge | LJ, HYK | YRCC | 1976–2020 |
| Suspended sediment median grain size | LYR | [51], BYRS, BCRS | 1976–2020 |
| Daily water levels | LYR | YRCC | 2002–2019 |
| Sediment retained by water-soil conservation practices | YRB | [53,54] | 1980–2015 |
| Water and sediment abstraction volume | YRB | [53], BYRS | 1980–2019 |
| Erosion and deposition volume of the LYR | LYR | [52], BYRS, BCRS, YRCC | 1976–2020 |
Publisher’s Note: MDPI stays neutral with regard to jurisdictional claims in published maps and institutional affiliations. |
© 2022 by the authors. Licensee MDPI, Basel, Switzerland. This article is an open access article distributed under the terms and conditions of the Creative Commons Attribution (CC BY) license (https://creativecommons.org/licenses/by/4.0/).
Share and Cite
MDPI and ACS Style
Ji, H.; Chen, S.; Jiang, C.; Fan, Y.; Fu, Y.; Li, P.; Liu, F. Damming-Induced Hydrogeomorphic Transition in Downstream Channel and Delta: A Case Study of the Yellow River, China. Water 2022, 14, 2079. https://doi.org/10.3390/w14132079
AMA Style
Ji H, Chen S, Jiang C, Fan Y, Fu Y, Li P, Liu F. Damming-Induced Hydrogeomorphic Transition in Downstream Channel and Delta: A Case Study of the Yellow River, China. Water. 2022; 14(13):2079. https://doi.org/10.3390/w14132079
Chicago/Turabian StyleJi, Hongyu, Shenliang Chen, Chao Jiang, Yaoshen Fan, Yutao Fu, Peng Li, and Fucheng Liu. 2022. "Damming-Induced Hydrogeomorphic Transition in Downstream Channel and Delta: A Case Study of the Yellow River, China" Water 14, no. 13: 2079. https://doi.org/10.3390/w14132079
Note that from the first issue of 2016, this journal uses article numbers instead of page numbers. See further details here.