
Water-Saving Potential of Different Agricultural Management Practices in an Arid River Basin

1
Institute of Water Sciences, College of Engineering, Peking University, Beijing 100871, China
2
State Environmental Protection Key Laboratory of Integrated Surface Water-Groundwater Pollution Control, School of Environmental Science and Engineering, Southern University of Science and Technology, Shenzhen 518055, China
*
Author to whom correspondence should be addressed.
Water 2022, 14(13), 2072; https://doi.org/10.3390/w14132072
Submission received: 25 May 2022
/
Revised: 20 June 2022
/
Accepted: 24 June 2022
/
Published: 29 June 2022
(This article belongs to the Special Issue Agricultural Water Saving: Advanced Technologies for Water Resources Efficient Utilization)
Abstract
:Water scarcity threatens food security in arid areas, highlighting the importance of water-saving agriculture for food production. Agricultural management practices are developed to improve water-use efficiency, and their water-saving effects are generally evaluated at the field scale rather than the regional scale. To figure out the regional water-saving potential of irrigation methods and mulching practices, the FAO AquaCrop model was first calibrated and validated at the three experimental stations. With aggregating spatial information, a distributed model was constructed and validated in a typical arid river basin of northwest China. Twelve combinations of soil mulching (plastic and straw) and irrigation methods (basin, furrow, drip, and subsurface drip) were simulated using the model to evaluate the effect of agricultural management practices on crop evapotranspiration (ET), crop water productivity, and regional water consumption. The results showed that soil mulching, advanced irrigation methods, and their combinations reduced noneffective soil evaporation (E) and the E/ET ratios and improved crop water productivity. Plastic mulching combined with subsurface drip irrigation is the most promising practice, increasing the crop water productivity of seed maize and spring wheat by 18.2% and 11.1% on average and reducing regional crop water consumption by 7.7% (75.0 million m3) and 7.4% (72.7 million m3), respectively. The reduction in irrigation water extraction ranged from 20.6% under furrow irrigation with straw mulching to 68.7% under subsurface drip irrigation with plastic mulching. This study quantitatively assessed the water-saving potential of soil mulching, irrigation methods, and their combinations to reduce agricultural water use, offering practical implications for the management and development of water-saving agriculture in arid areas.
1. Introduction
Agricultural arable land accounts for only 11% of the global land areas but consumes approximately 70% of the world’s total water withdrawal [1]. With population growth and climate change, the competition between food demand and freshwater availability is increasingly intense [2,3,4]. Therefore, agricultural water saving is an effective and important way to relieve water stress, particularly in arid and semiarid regions with severe water scarcity [5,6,7]. In China, irrigated land (690 million ha in 2020) produces 80% of the food but has lower irrigation water-use coefficient (0.542 in 2016) than other developed countries [8]. Thus, the shortage and inefficient use of agricultural water need to be solved urgently [9,10].
Agronomic management practice offers an effective and direct way to improve water productivity and reduce agricultural water use [11,12]. The effects of various agricultural management practices, such as soil mulching and advanced irrigation technology, on crop growth and water-use efficiency have been extensively reported at the site level through field experiments [13,14,15]. Soil mulching could increase crop water productivity (CWP) by reducing noneffective soil evaporation, improving the soil environment, and promoting crop growth [16,17]. While traditional irrigation method results in overuse of water resources, advanced irrigation techniques, including drip and subsurface drip irrigation, could irrigate precisely for crops, minimize the nonproductive water loss from the soil surface, and provide uniform soil water distribution to save irrigation water [18,19,20].
Previous studies have focused on comparing the water-saving effects of different irrigation methods [21,22,23], mulching regimes [24,25], and combinations of mulching and advanced irrigation techniques at the field scale with experiments [26,27] and numerical modeling [28,29]. Few studies have discussed the water-saving potential of various combinations of agricultural practices at the regional scale. Jägermeyr et al. [30] indicated that water and soil management interventions could reduce global irrigation water consumption by 23–37%. Nouri et al. [31] estimated that mulching and mulching combined with drip irrigation reduced the blue water footprint in the Upper Litani Basin by 3.6% and 4.7%, respectively. Huang et al. [32] found that maize irrigation water extraction in China could be saved through water management interventions, such as improved irrigation technology, soil mulching, and irrigation scheduling. With the booming application of water-saving techniques, the effects of these agronomic practices on regional crop production and water consumption remain unclear, particularly in arid areas [33].
Crop-growth modeling is an effective and useful way to study the crop-growth process under various environmental conditions, while field experiments are time-consuming and hard to be applied on larger regions [34,35,36]. Many advanced crop-growth models, such as DSSAT and RZWQM, have been developed and tested to simulate the effects of management practices on the crop growth [37,38]. However, most of these models are sophisticated and need a large number of input parameters. The AquaCrop model balances simplicity, accuracy, and robustness, which requires a relatively smaller number of parameters and focuses on the crop yield response to water stress [39]. The AquaCrop model has been evaluated well to simulate maize growth under plastic mulching, drip and subsurface drip irrigation [40,41,42], wheat growth under drip irrigation and straw mulching [5,43], and other crops under different practices [44,45].
The Heihe River Basin (HRB) is the second largest inland river basin in China, where competition between agricultural and ecological water use is becoming keener. The Zhangye Basin, the middle reach of the HRB, has intensive agricultural activities that mostly rely on irrigation, consumes more than 80% of water, and contributes most of the agricultural production of the whole basin [46,47]. Due to limited water resources and low irrigation water-use efficiency, the Zhangye Basin faces great challenges in food security and water resource sustainability [48]. Thus, water-saving practices have been promoted in recent years. However, to our knowledge, the feasibility of these practices in agricultural water saving at the basin scale has not been studied.
The main objective of this study is to explicitly explore the effects of agricultural management practices on arid agriculture. We selected the Zhangye Basin as the study area to (1) construct the distributed AquaCrop model under traditional management; (2) simulate the effect of different combinations of soil mulching and irrigation methods on evapotranspiration (ET) and CWP; and (3) evaluate the water-saving potential of agricultural management practices in regional crop water consumption and irrigation water extraction. This quantitative study could help policy makers choose the best management for sustainable agriculture, raise awareness of water saving, and promote highly efficient agronomic practices. The work further provides practical insights into developing and managing water-saving agriculture in arid areas.
2. Materials and Methods
2.1. Study Area
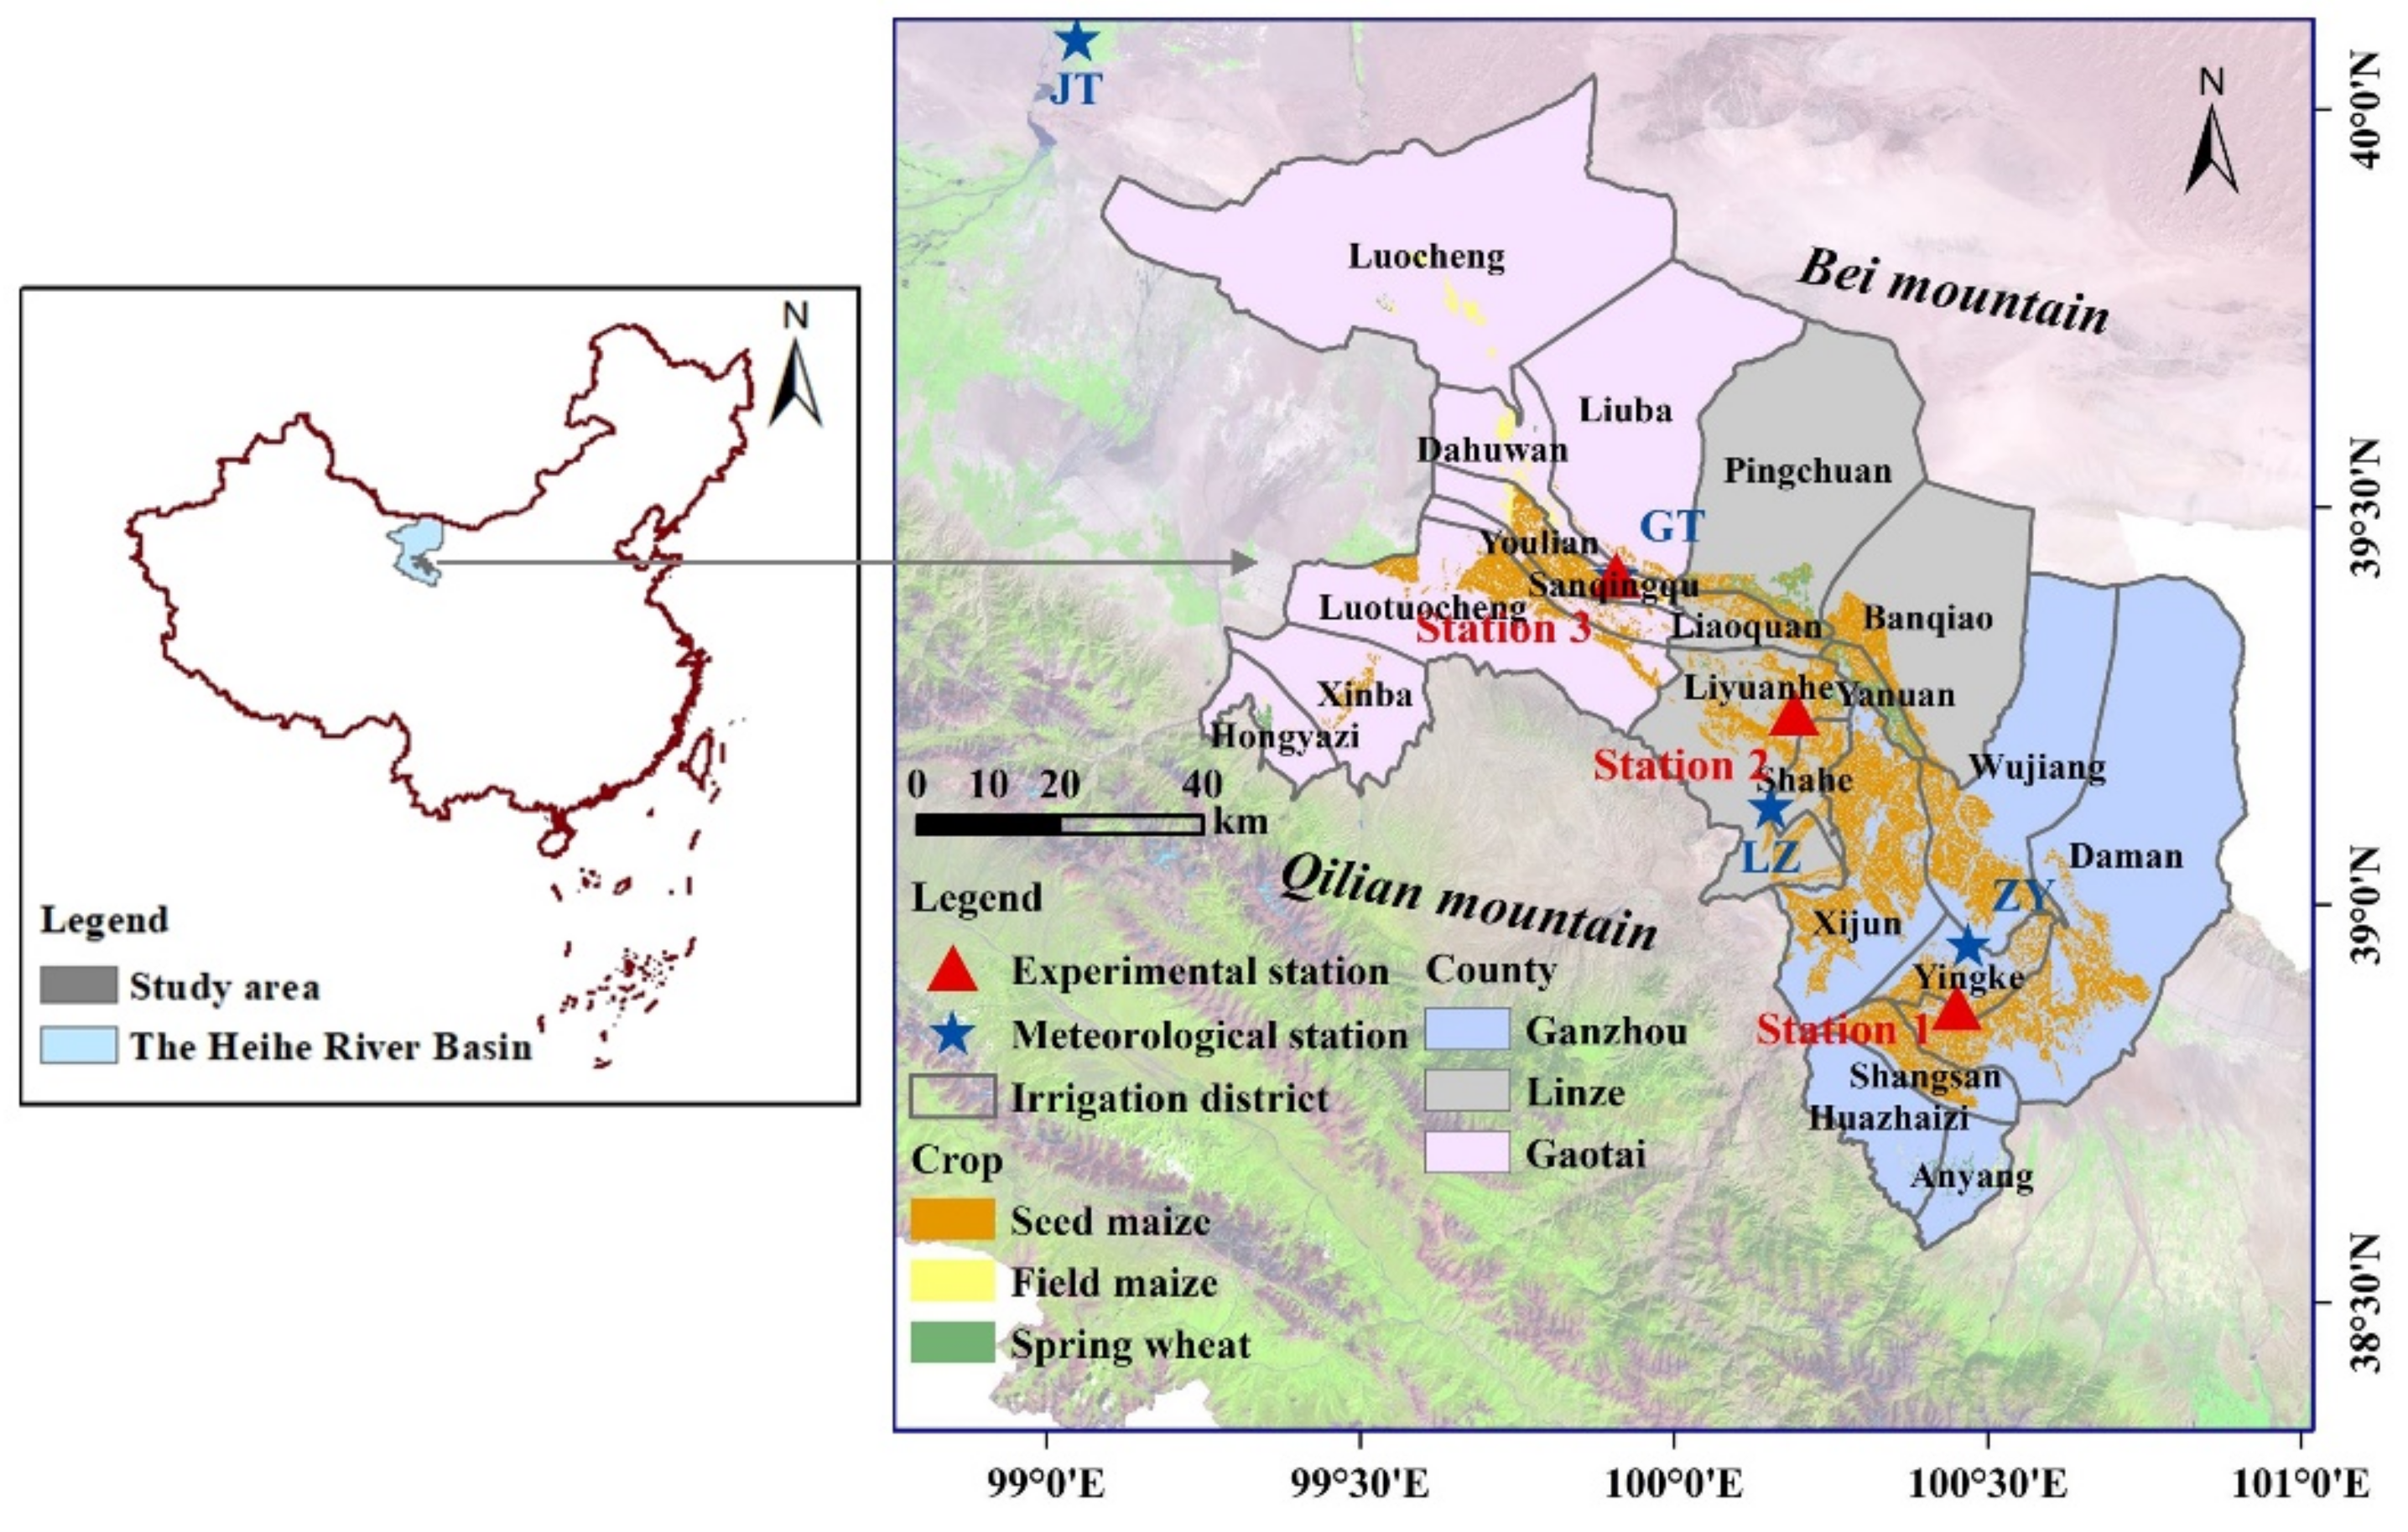
The Zhangye Basin, a typical arid river basin, is the largest seed maize production base in China [49]. The study area is composed of three administrative counties and subdivided into 21 irrigation districts (Figure 1). The climate is typically arid with low precipitation of approximately 120 mm yr−1 and high potential ET of 1200 mm yr−1 [50]. The major types of land use are cultivated land and Gobi Desert, with the major soil textures of loam and silty loam.
The study area occupies the most farmland and water consumption in the HRB [51]. Spring wheat has historically been the main food crop; however, the sown area of seed maize has expanded in recent years [49]. The growing period is from March to September, with most of the rainfall occurring from June to September. Crop growth mainly depends on irrigation rather than limited rainfall in this arid area. The traditional irrigation method is basin irrigation, leading to wasted water resources and inefficient water use for agriculture [52]. Most irrigation water comes from the Heihe River, with part from groundwater exploitation [53]. With population growth and cultivated land expansion, the pressure of agricultural water use increases after a water allocation plan is implemented. The limited surface water supply leads to excessive groundwater extraction and lower groundwater levels, which further influences the downstream ecosystem [54]. Therefore, effectively reducing agricultural water consumption is an important issue that must be solved urgently in the study area.
2.2. The FAO Crop Model AquaCrop
The AquaCrop model is a water-driven crop-growth model developed by FAO and has been widely used in recent years. The conceptual equations used in AquaCrop to simulate soil evaporation and crop yield are as follows [55]:
where is the actual yield, is the reference harvest index, is the effect of stress on , T is the daily actual transpiration, ET0 is the daily reference ET, is the normalized water productivity, Ks is the soil water stress coefficient, E is the soil evaporation, Ke is the soil water evaporation coefficient, and Kr is the evaporation reduction coefficient of water stress.
The root zone is depicted as a reservoir in the AquaCrop model, and the soil water storage is calculated by Equation (3):
where and are the soil water storage at time t and t − 1; , , , and represent rainfall, surface runoff, irrigation, and capillary rise from groundwater, respectively; and , , and represent soil evaporation, crop transpiration, and deep percolation loss, respectively.
An important feature of the AquaCrop model is the consideration of agricultural management practices that affect the interaction between crop growth and the soil environment. The practices are composed of field management, such as mulching, and irrigation management, such as drip and subsurface drip irrigation.
The soil mulching mainly affects soil evaporation and is calculated by adjusting the soil evaporation coefficient (Ke) to Keadj [55]:
where fm is the adjustment factor for soil evaporation, which is 0.5 and close to 1.0 for straw mulches and plastic mulches, respectively [56]; perm is the percentage covered by mulch (%); is the canopy cover adjusted for micro-advective effects; and Kex is the maximum soil evaporation coefficient for fully wet and unshaded soil surfaces. Irrigation management considers irrigation schedules and irrigation methods, which have different percentages of soil surface wetted. The fraction of soil surface wetted was highest for basin and border irrigation and lowest for subsurface drip irrigation among all irrigation methods. The Keadj for different irrigation methods is calculated as follows [55]:
where fw is the soil fraction of the surface wetted.
2.3. Data
Daily weather data were collected from four national meteorological stations (ZY, LZ, GT, and JT stations) over the period of 1995–2015, including precipitation, maximum and minimum air temperature, and mean relative humidity (Figure 1). ET0 was calculated by the Penman–Monteith equation in the AquaCrop model. The region was divided into four climate zones by the Thiessen polygon method [37]. The soil texture and land-use data of 2011 were collected from the National Tibetan Plateau Data Center (http://data.tpdc.ac.cn, accessed 19 April 2021).
According to the change in cropping structure, seed maize and spring wheat were selected as the major crops. The crop-growth periods of these crops were analyzed from national agrometeorological stations (http://data.cma.cn/, (accessed on 1 April 2021)) and National Science and Technology Infrastructure (http://lzd.cern.ac.cn/, (accessed on 13 April 2019)). The current irrigation timing and frequency were generalized from previous studies [57,58,59,60]. The irrigation amount under different hydrological years was calculated from local water management annual reports (Table 1). Therefore, three crop-growth and irrigation schedule zones were obtained based on multisource data.
The observed soil water contents and crop-growth indicators, including canopy cover, aboveground biomass, and yield of seed maize and spring wheat, were collected from three local experimental sites (Figure 1) for model calibration and validation (Table 2). Annual crop yields from the Statistical Yearbook of Gansu Province and Rural Economic Yearbook of Gansu Province were used to evaluate the distributed model performance in simulating regional yields. Seed maize has become the main crop since 2000, so the yield data started in 2002.
2.4. Model Setup and Simulation
A distributed model was established in the cultivated land, combining the weather, crop-growth period, and irrigation schedule zones by ArcGIS software (version 10.2, Environmental Systems Research Institute, Inc., Redlands, CA, USA). The regional model consisted of 3979 simulated units, each of which was homogenous and irregularly shaped. Lateral soil water movement was ignored because of the flat terrain in the study area.
The soil hydraulic parameters were first calibrated and validated at the three experimental stations by Parameter ESTimation method (PEST) [66] with the aim of soil water content. Crop parameters were adjusted by trial and error method with the aim of three crop-growth indicators. The uncertainty of model outputs was analyzed by SimLab software (version 2.2.1, the European Commission’s Joint Research Centre, European Union) [67]. With spatial soil texture data collected, the soil hydraulic parameters of five soil layers in the basin were estimated by ROSETTA software (version 1.2, Schaap et al., USA), and the equations are illustrated in Supplementary Material A. The initial soil water content was set as field capacity because of winter irrigation before sowing.
Crop water productivity (CWP) is the crop yield produced per unit water, which could describe the agricultural water use efficiency [11]. The regional crop water consumption (CWC) is calculated by multiplying the simulated crop evapotranspiration and area of simulated units. Irrigation water extraction (IWE) is calculated when considering the field application efficiency and conveyance efficiency of different irrigation methods. The conveyance efficiency of surface irrigation methods (basin and furrow irrigation) ranges from 0.55 to 0.76 from local water management annual reports.
The simulation period was from 1995 to 2015 based on the most sufficient data collected. After model calibration and validation at the experimental stations, the distributed model was validated under the current irrigation schedule at the regional scale, and four statistical indicators were selected to evaluate the model performance [68,69,70]:
where is Willmott’s index of agreement; and represent the mean bias error and the root mean square error, respectively, and is the coefficient of determination. Oi and Pi are the observed and simulated values, respectively; and are the mean values of the observations and simulations, respectively; and n is the number of observed/simulated values.
2.5. Scenario Setting
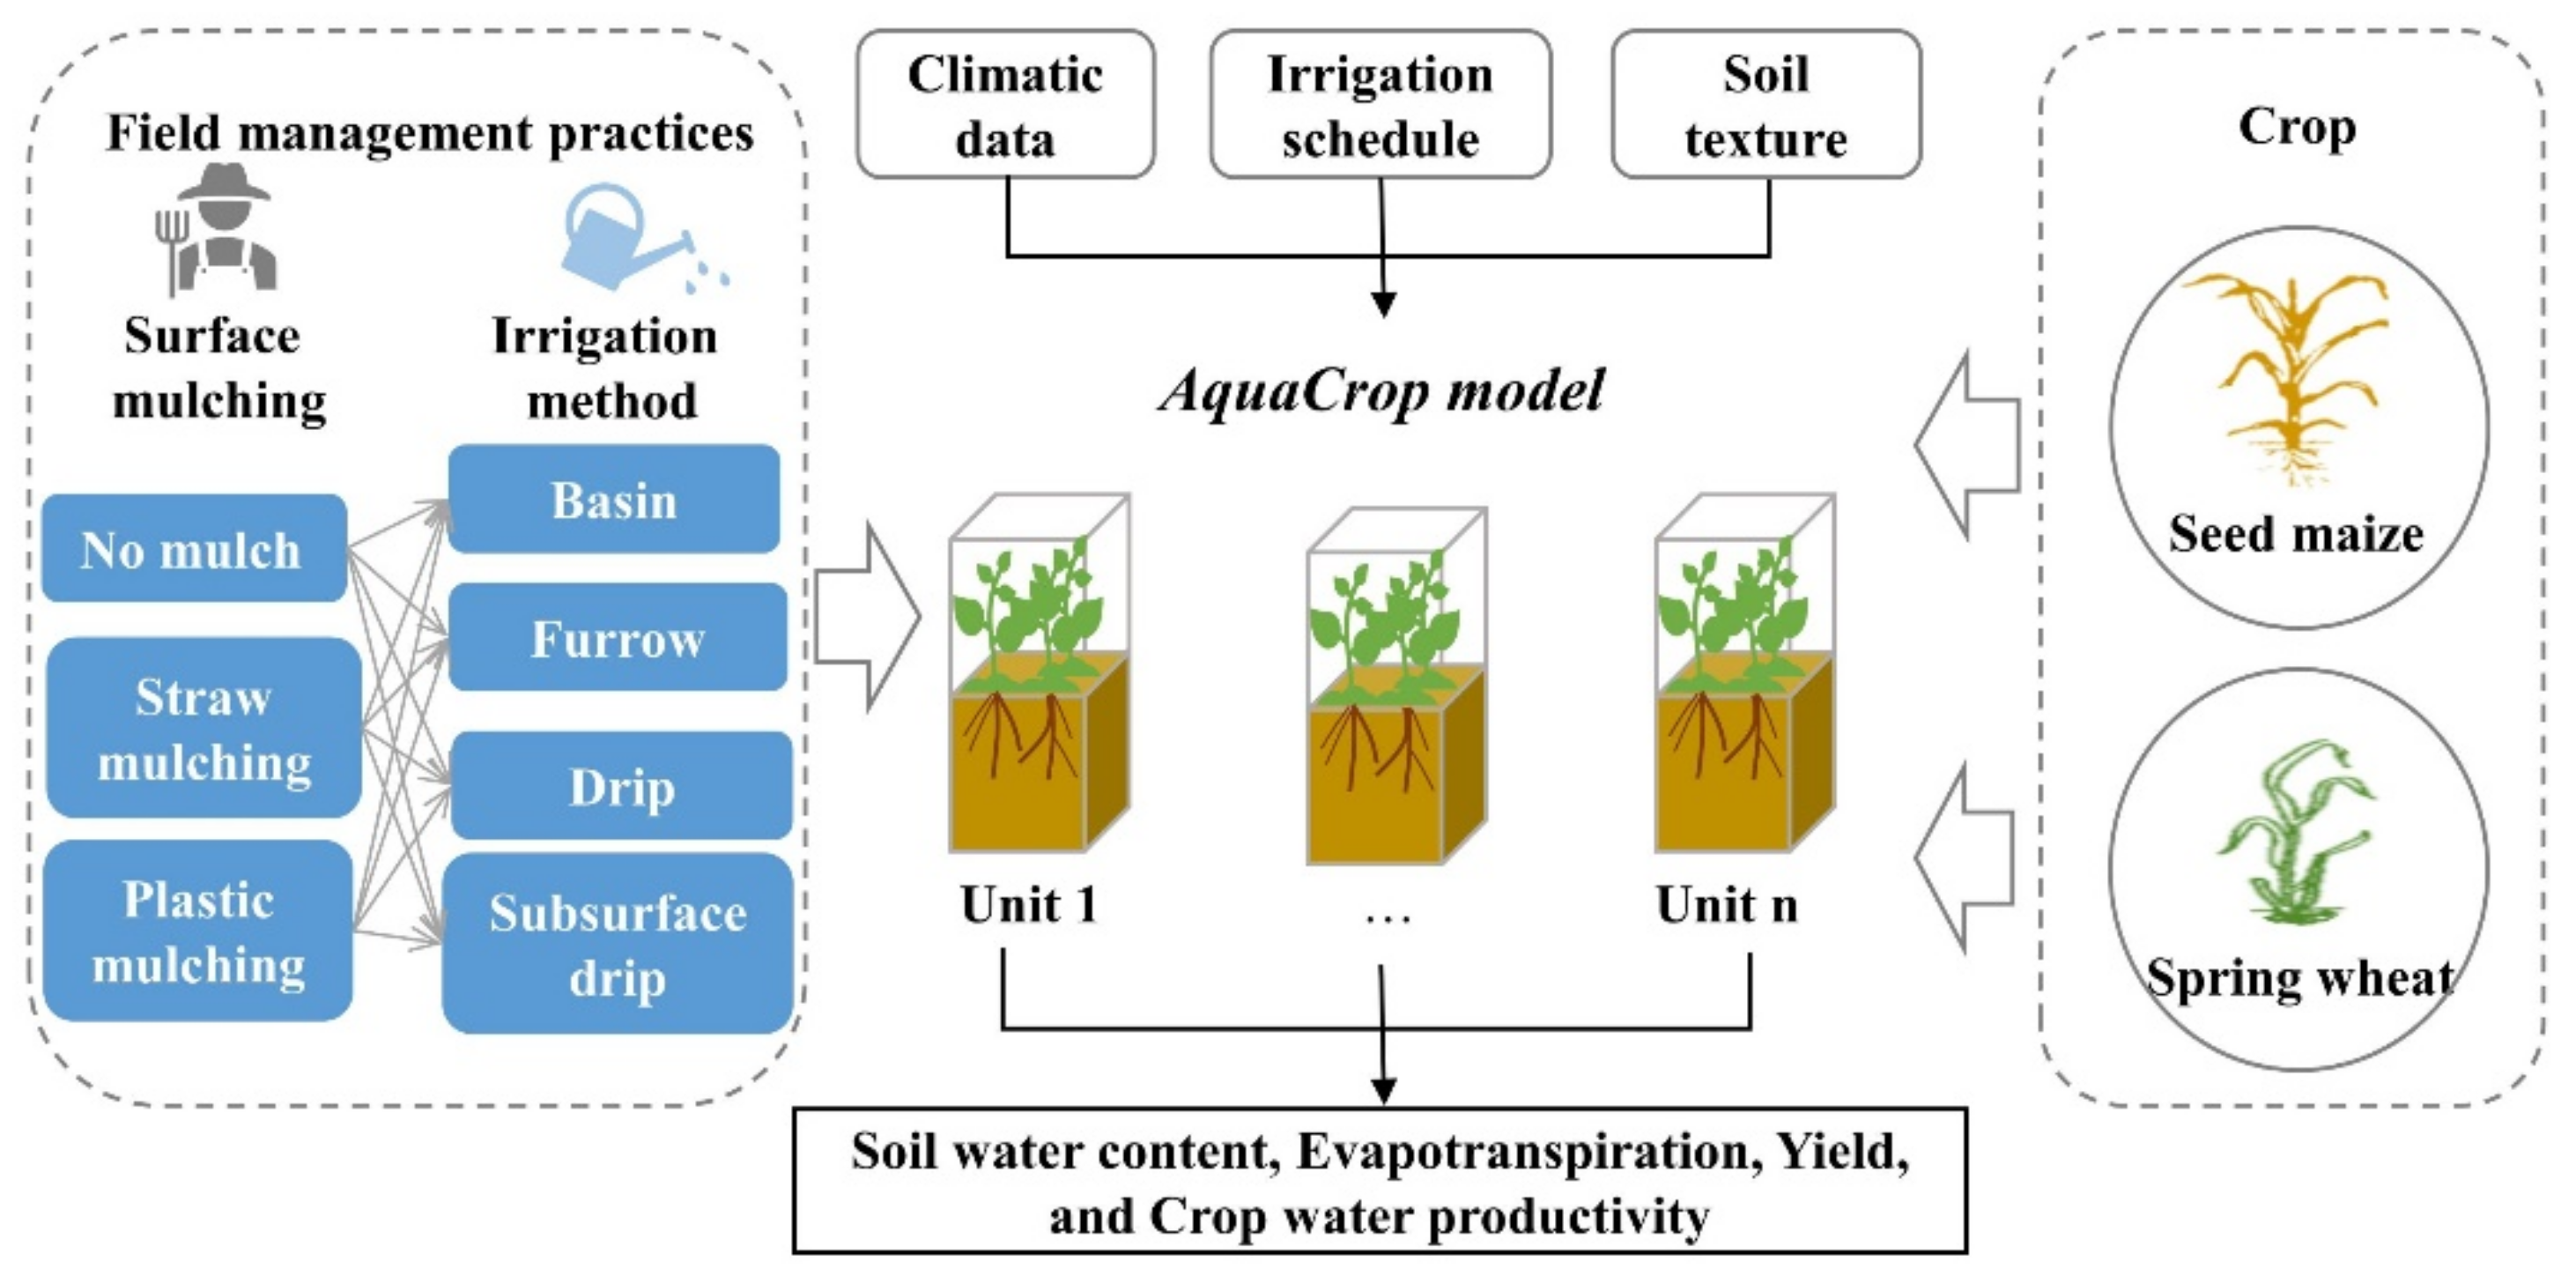
Different materials of soil mulching (straw and plastic mulch) and irrigation methods (basin, furrow, drip, and subsurface drip irrigation) were considered, and twelve combination scenarios were simulated in this study (Figure 2). Sprinkler irrigation was not considered in the simulation because of the high wind speed. The parameters to describe the difference through all these field management practices are listed in Table 3. The reduction in soil evaporation losses was 50% and 100% for straw and plastic mulches, respectively. Half the soil area covered was simulated in both materials. Due to the limited data on irrigation schedules under drip and subsurface drip irrigation, full irrigation (86% of total available water) [32,55] was considered in various irrigation methods.
The combination of no mulch and basin irrigation was selected as the baseline (CK). The simulated crop ET, yield, and water productivity under different management practices were analyzed. Crop water consumption was multiplied by ET and the area of the simulated unit and further aggregated into irrigation district and county scales. With the aim of evaluating the regional water-saving potential of agricultural management practices, irrigation water demand considered field water application efficiency (Table 3) and the irrigation amount derived from Equation (3).
3. Results and Discussion
3.1. Model Performance
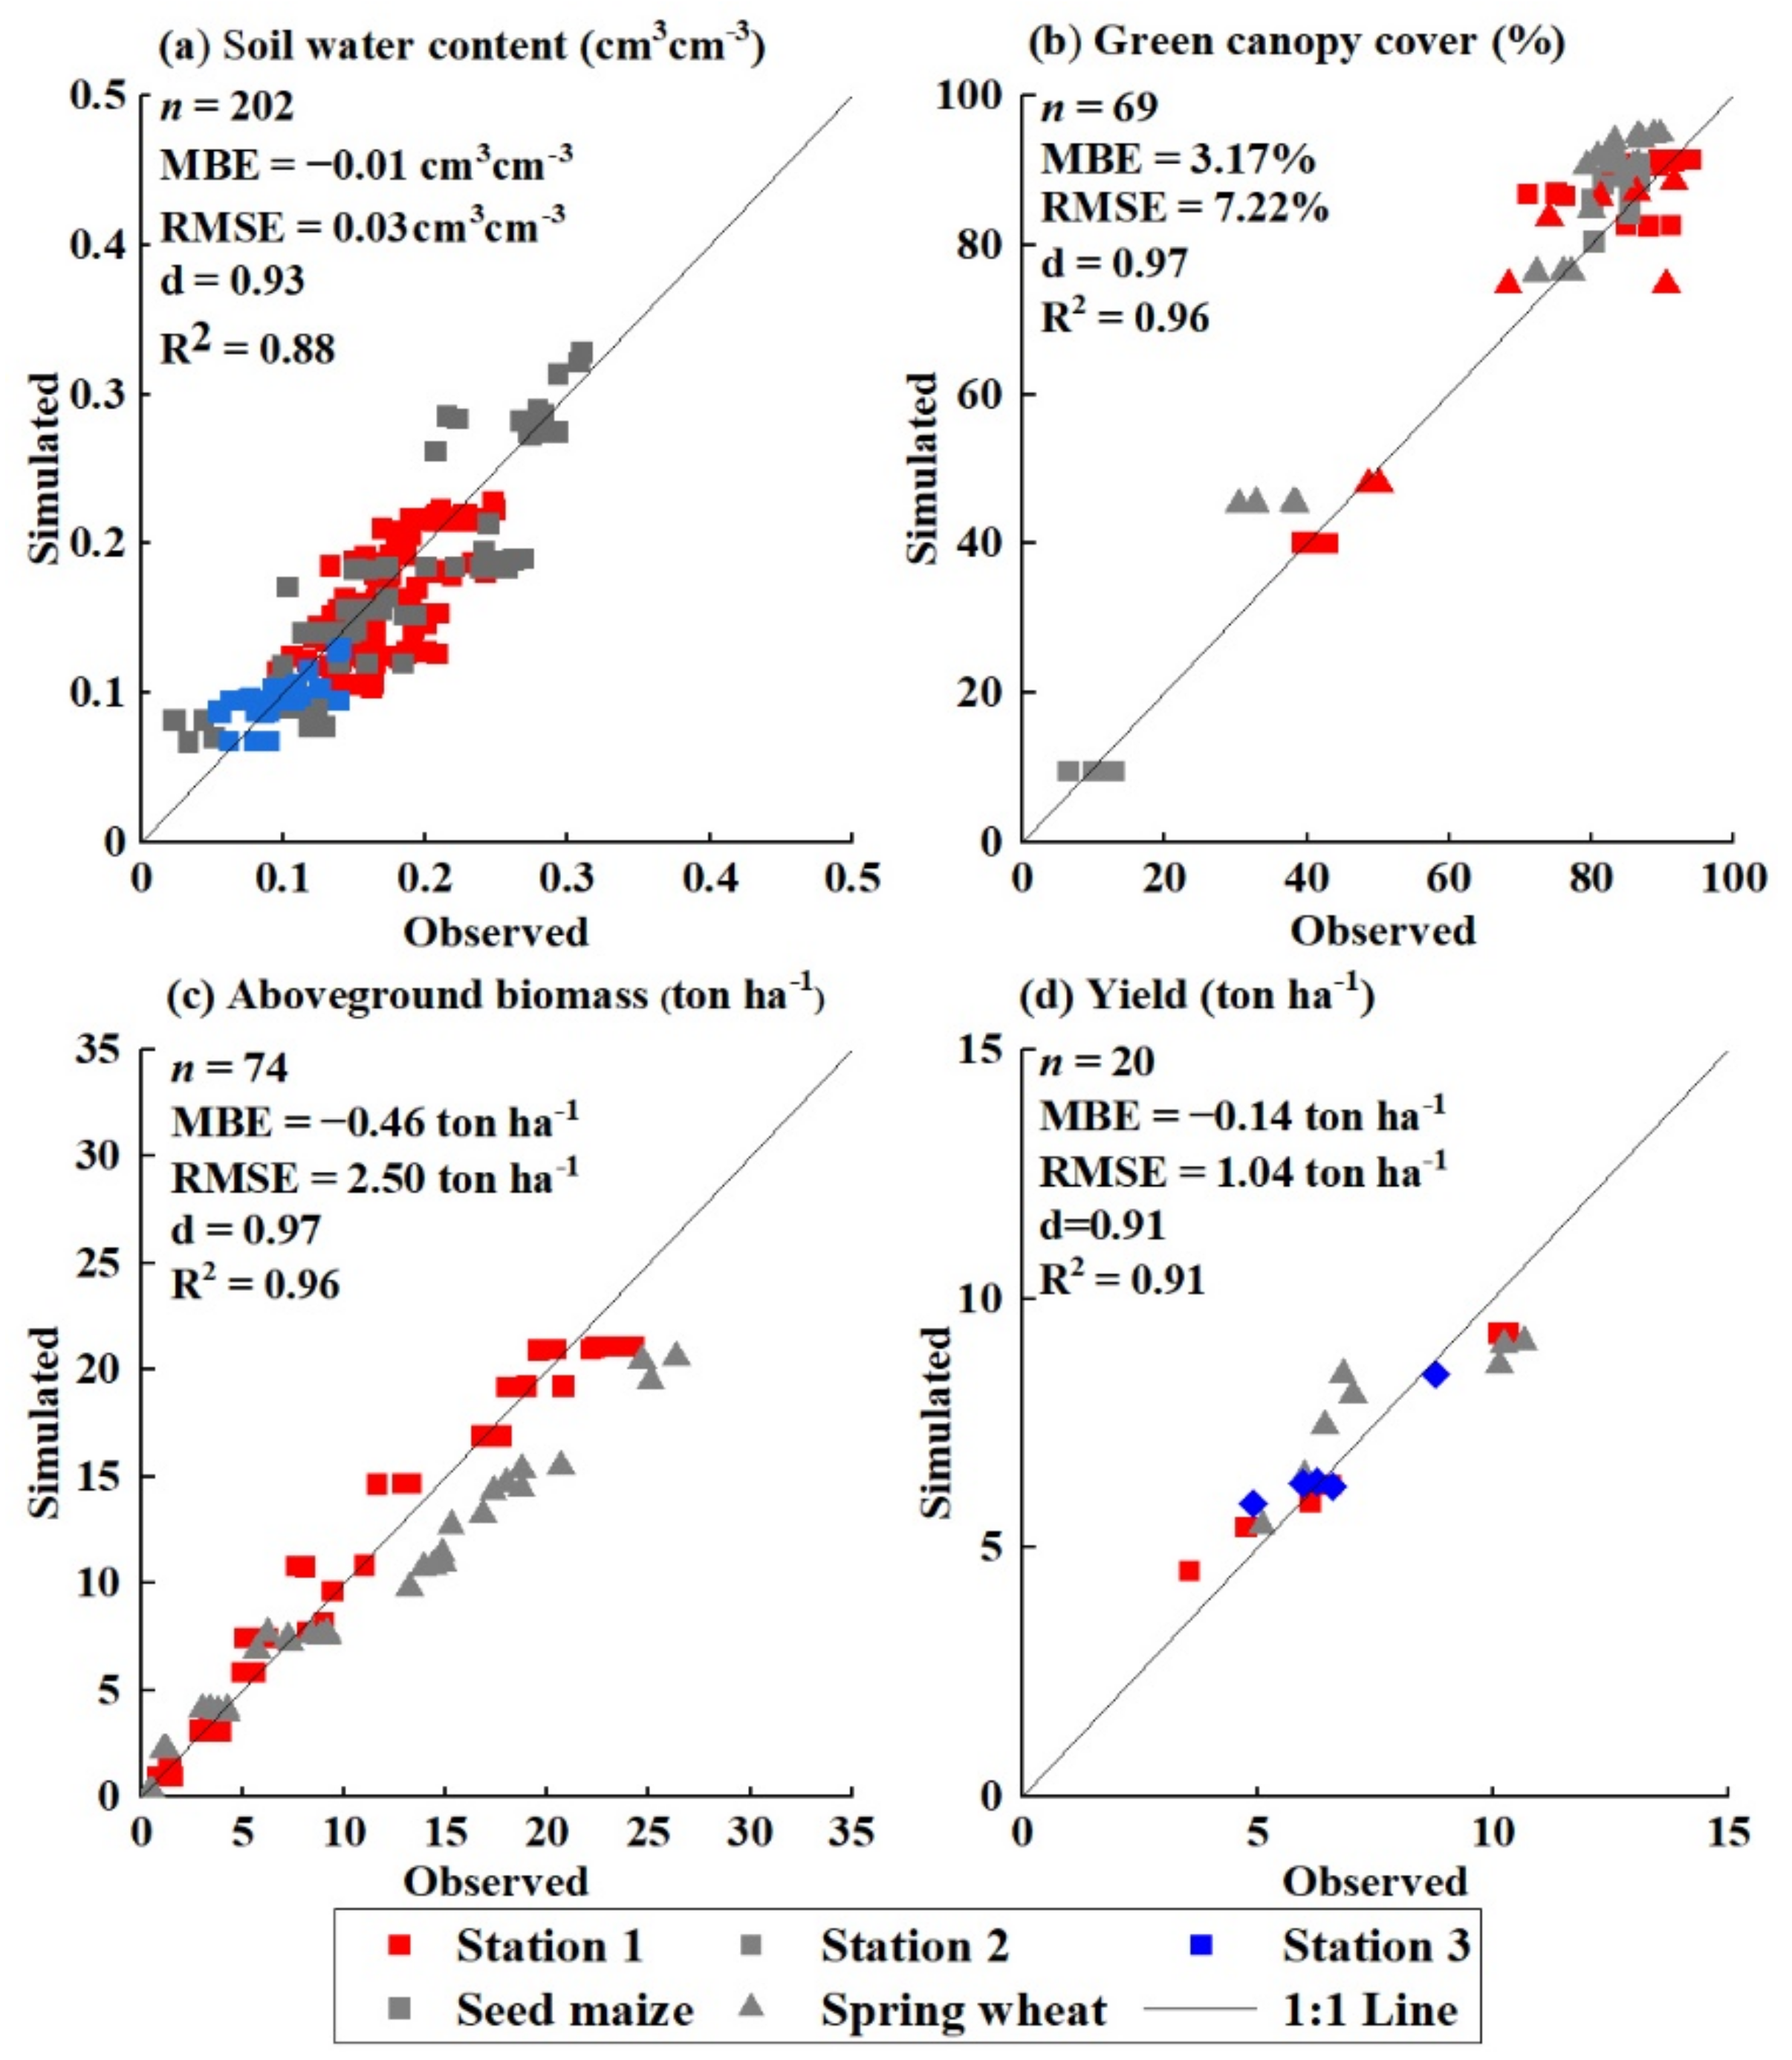
Figure 3 compares the observed and simulated values of soil water content, crop canopy cover, biomass, and yield at the three experimental stations during the calibration period. The comparison between observed and simulated soil water content and three crop variables during the validation period is shown in Figure S1. The statistical indicators showed that the model could simulate crop growth well after calibrating the soil and crop parameters, with the R2 values of 0.88, 0.96, 0.96, and 0.91 for soil water content, crop canopy cover, biomass, and crop yield, respectively. The average crop yields were compared with statistical data for regional validation (Table 4), which indicates that the distributed model had a good performance. The full list of crop parameters in each crop zone is shown in Table S1. Table S2 illustrates that the uncertainty analysis results of simulated crop yields vary from station to station, where Station 3 has the lowest coefficient of variation.
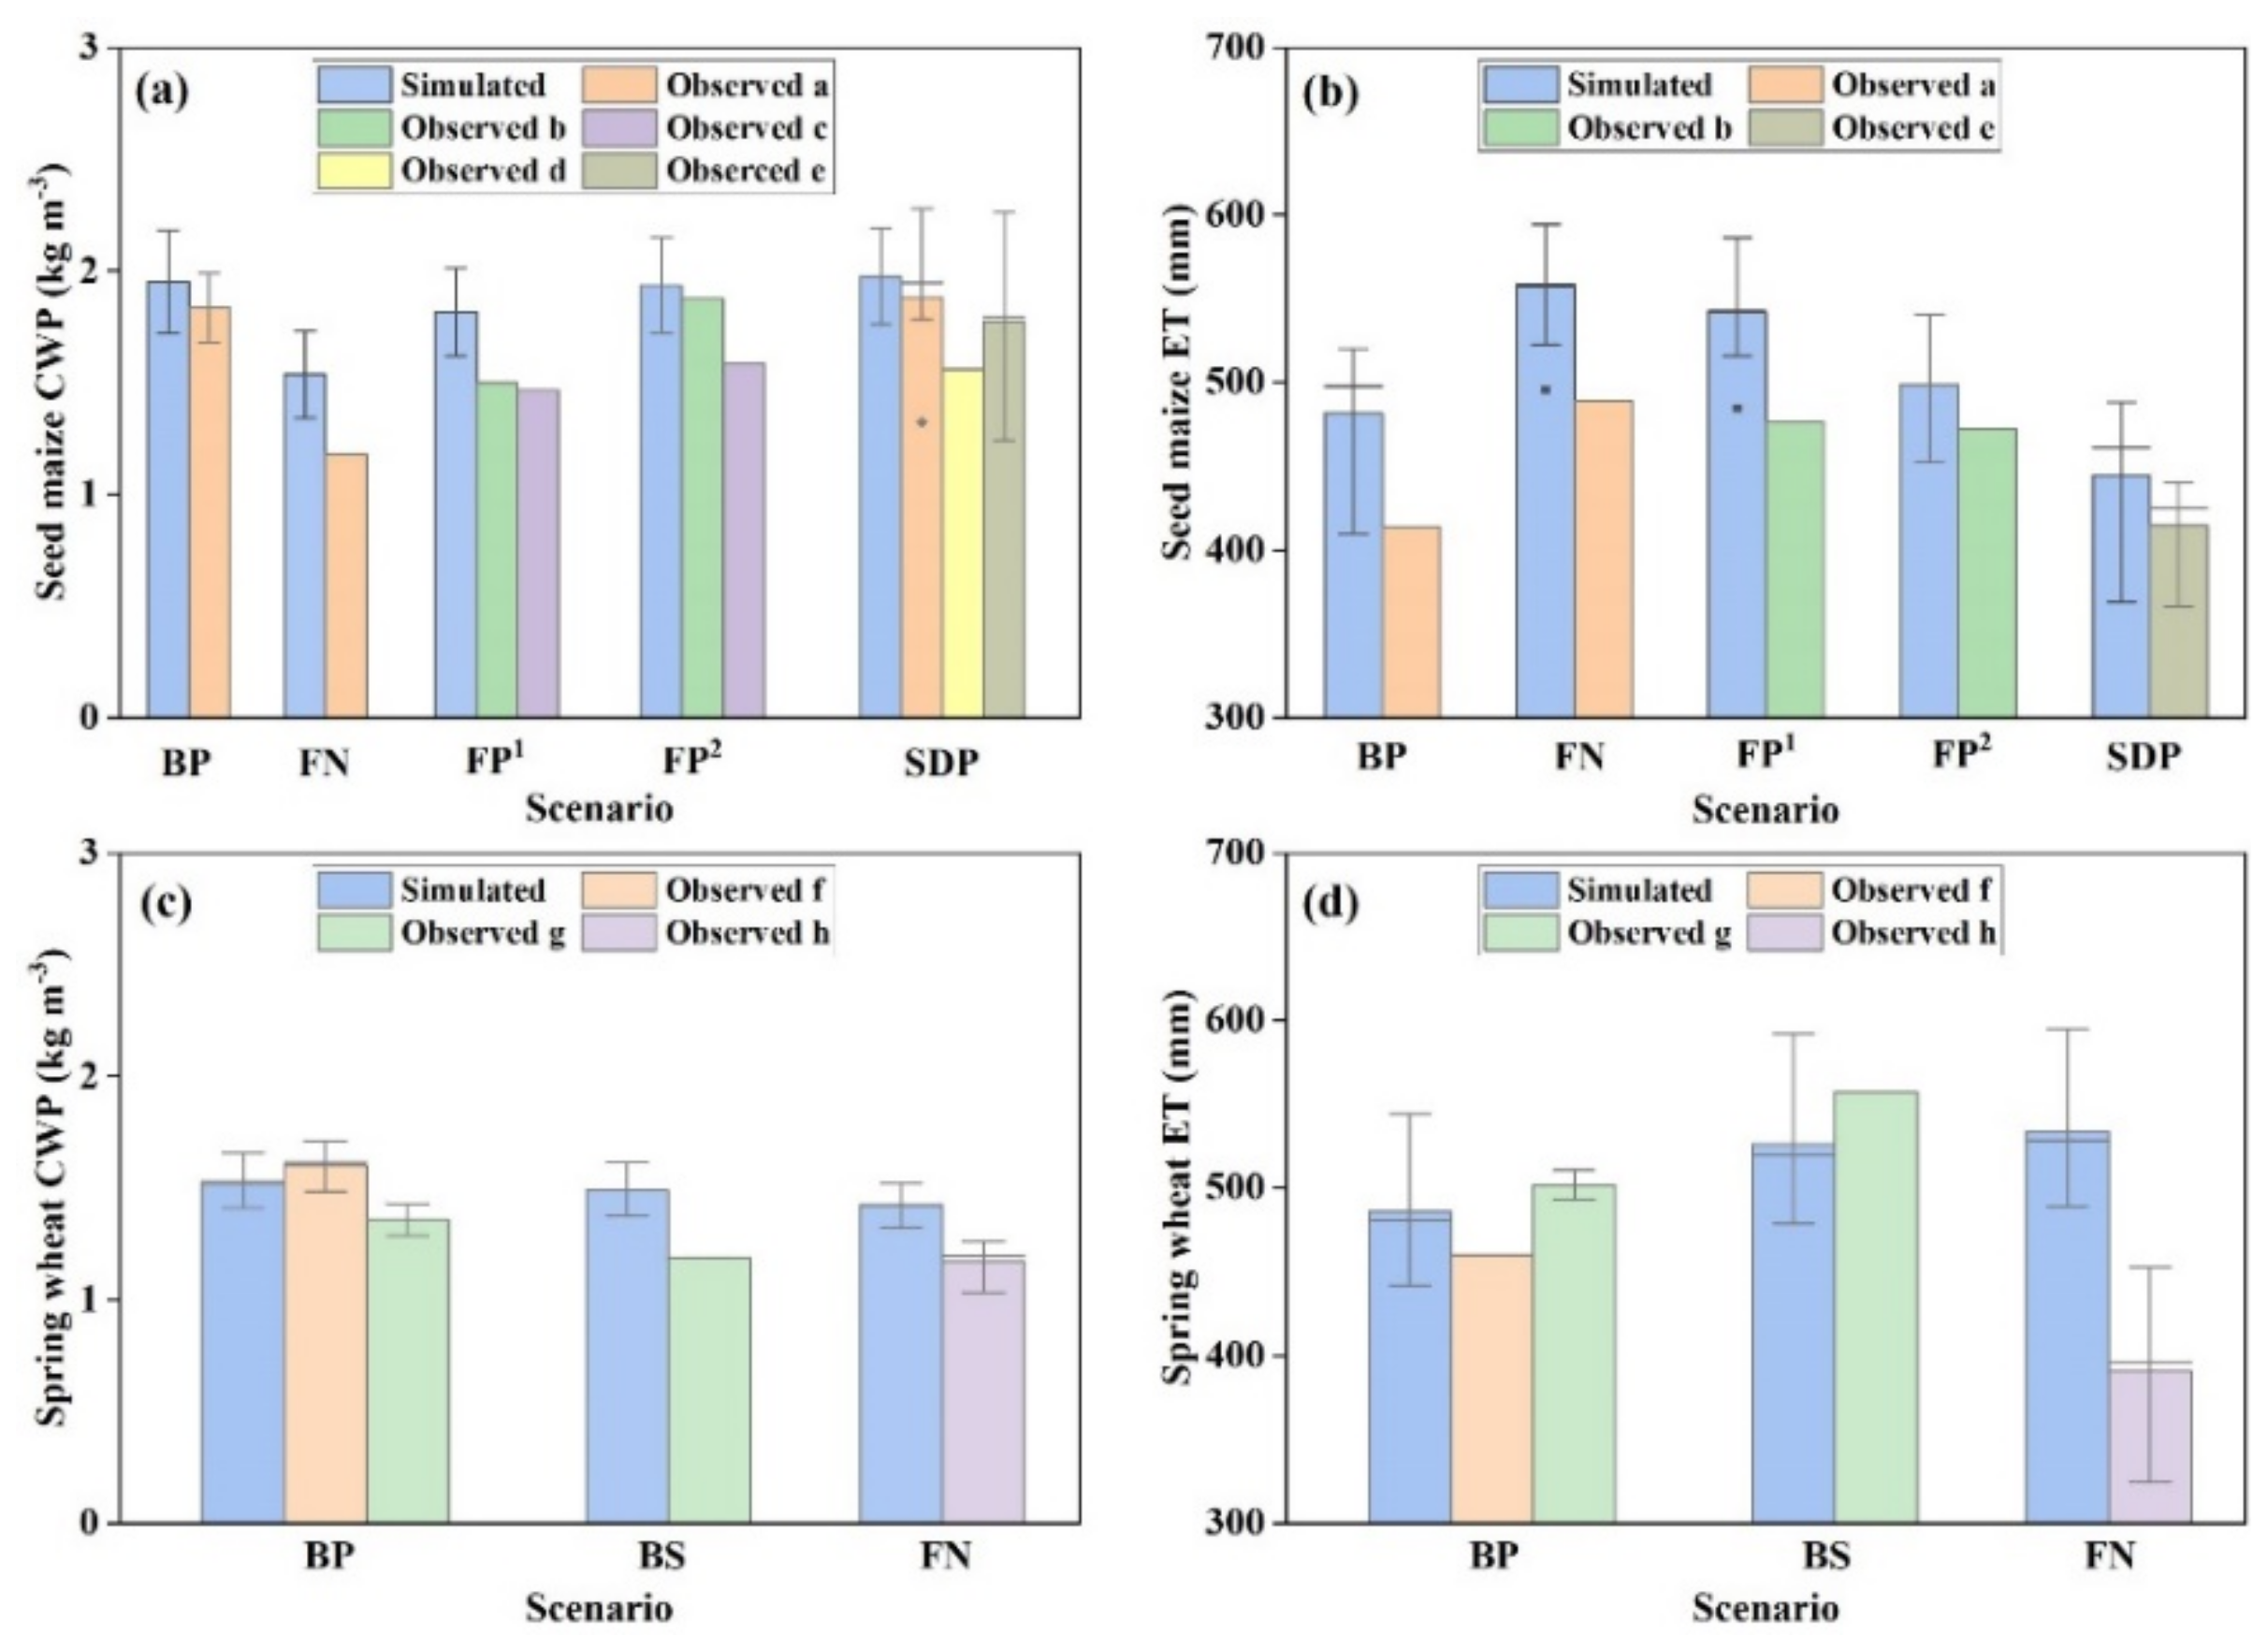
The comparisons between the observed and simulated CWP and ET showed the validity of AquaCrop model to simulate different agricultural management practices (Figure 4). The results also demonstrated that the model had a relatively poor performance in furrow irrigation. The reason could be that the soil water movement under furrow irrigation is two-dimensional, while AquaCrop model is one-dimensional and neglects soil water lateral movement [55]. On the other hand, the observed values collected from previous literature indicated the practices currently being studied and promoted, for instance, subsurface drip irrigation with plastic mulching for seed maize and basin irrigation with mulching for spring wheat.
3.2. Effect of Agricultural Management on ET and E/ET Ratio
Soil mulching, irrigation method, and its combinations reduced ET in comparison to CK, as shown in Figure 5. Compared with no mulching, straw mulching and plastic mulching under basin irrigation decreased the average seed maize ET by 3.9% and 6.6%. The corresponding decreases in the average spring wheat ET were 2.3% and 5.4%, respectively. Under no mulching, furrow, drip, and subsurface drip irrigation reduced seed maize ET by 2.1%, 3.5%, and 4.4% on average, respectively. The corresponding decreases in the average spring wheat ET were 1.2%, 4.2%, and 5.8%. It should be noted that plastic mulching with 50% coverage had a stronger impact on seed maize ET than subsurface drip irrigation. Zhuo et al. [29] also found that irrigation methods had less effect on winter wheat ET than mulching practices in northern China.
With plastic mulching, the negative effects of irrigation methods on ET ranked from subsurface drip irrigation to drip irrigation and to furrow irrigation. The combination of subsurface drip irrigation and plastic mulching had the largest reduction in ET for both seed maize (8.1%) and spring wheat (8.0%). The reductions in seed maize ET ranged from 68.0 mm under subsurface drip irrigation and plastic mulching to 45.0 mm under basin irrigation and straw mulching. The corresponding reduction values of spring wheat ET were 42.4 mm and 11.2 mm, respectively. The difference in ET reduction between seed maize and spring wheat could be attributed to different crop types (C3 or C4 plants) and the longer crop-growth period of seed maize in the study area.
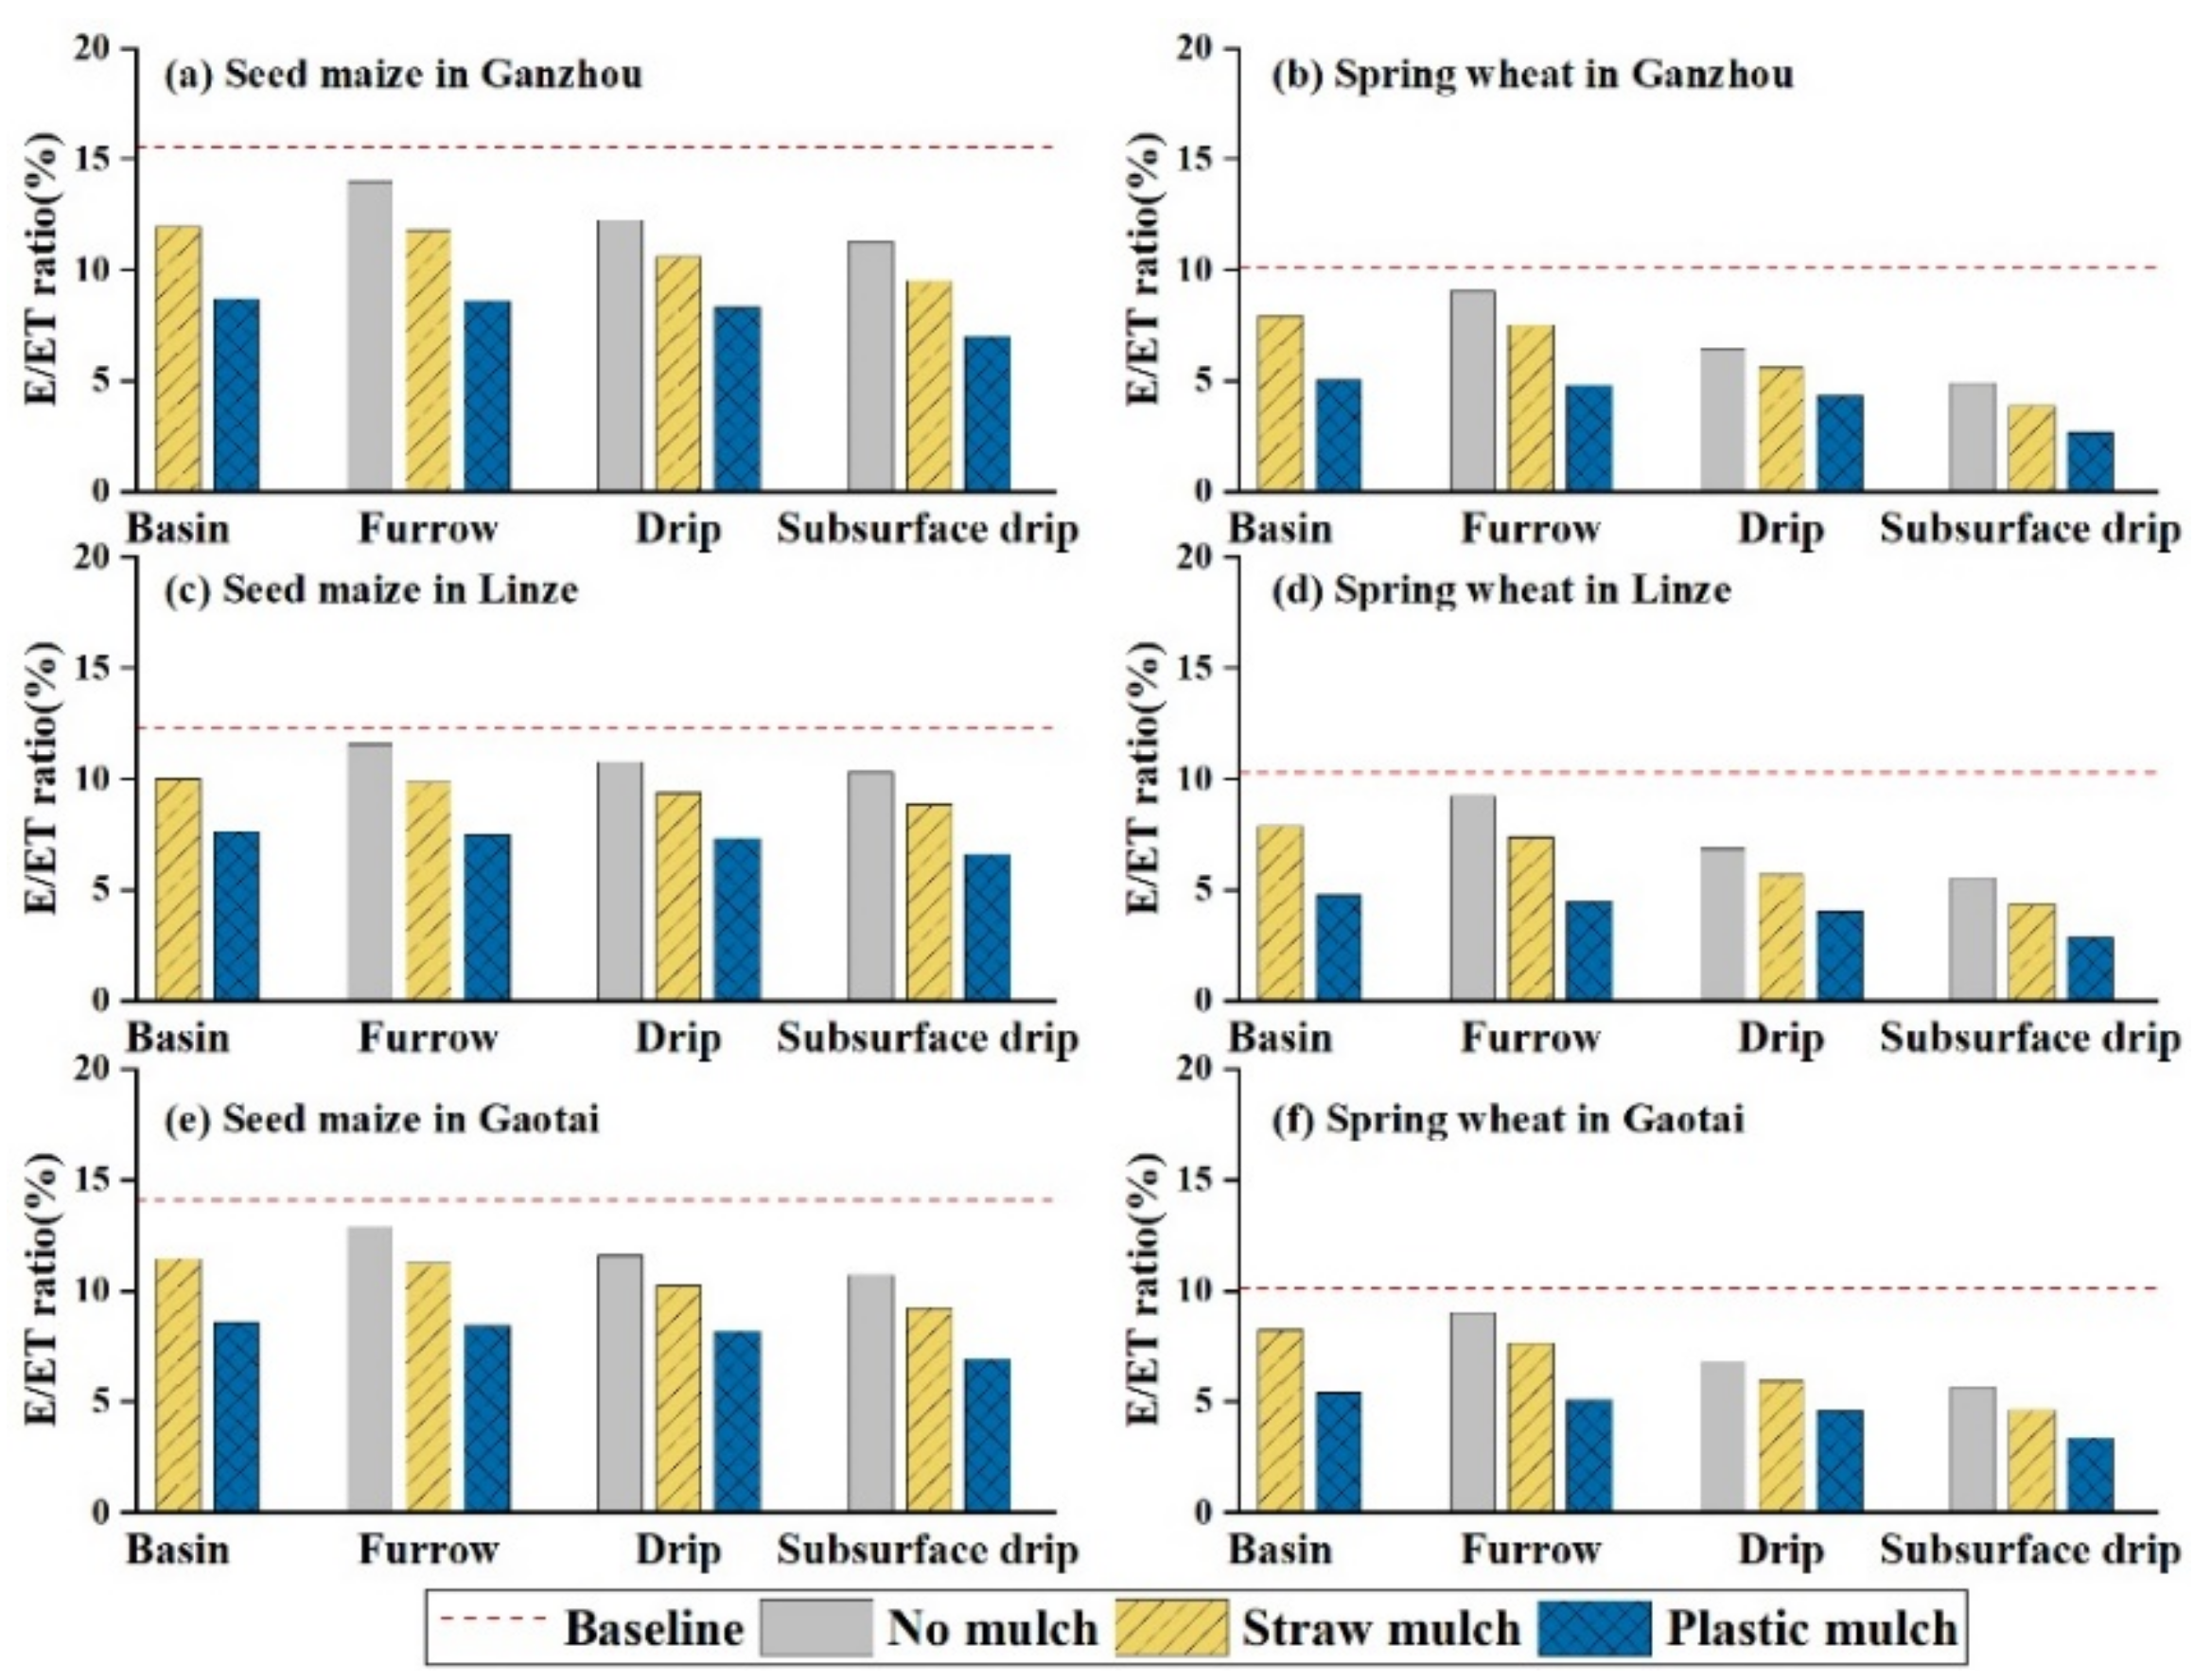
Figure 6 reveals that both mulching and advanced irrigation techniques reduce ET by decreasing soil evaporation and affecting the ratio of soil evaporation to ET (E/ET). Under no mulching, the E/ET ratio during the seed maize-growth period decreased from 13.9% under basin irrigation to 12.7%, 11.5%, and 10.7% under furrow, drip, and subsurface drip irrigation, respectively. For spring wheat, the E/ET ratio also showed the same decreasing trend with the change in irrigation methods.
Under furrow irrigation, the average seed maize E/ET ratios of straw mulching and plastic mulching were 10.9% and 8.2%, respectively. Compared with no mulching, straw mulching and plastic mulching under drip irrigation decreased the seed maize E/ET ratios by 12.7% and 30.5%, respectively. The corresponding decreases under subsurface drip irrigation were 15.0% and 36.4%, respectively. For spring wheat, the average E/ET ratios under no mulching, straw mulching, and plastic mulching with drip irrigation were 6.7%, 5.7%, and 4.3%, respectively. It can be seen that for the same irrigation method, the E/ET ratio decreased under soil mulching, and plastic mulching had a more obvious effect than straw mulching due to the difference in the reduction in soil evaporation.
It is noteworthy that the E/ET ratio of seed maize under drip irrigation with no mulching was greater than that under furrow irrigation with straw mulching. However, the E/ET ratio of spring wheat did not exhibit the same trend. The reason could be that seed maize was more sensitive to soil mulching than spring wheat, which was consistent with [17].
3.3. Effect of Agricultural Management on CWP
Figure 7 shows the simulated average CWP of three counties under different combinations of water-saving management practices. The results indicated that soil mulching and water-saving irrigation methods could improve the CWPs of seed maize and spring wheat. Under full irrigation conditions, the highest CWPs of seed maize and spring wheat were 1.83 kg m−3 and 1.59 kg m−3, respectively, under the combination of subsurface drip irrigation and plastic mulching. Compared with no mulching, the enhancements of seed maize CWP by changing irrigation methods from basin irrigation were 1.5%, 3.7%, and 4.9% under furrow, drip, and subsurface drip irrigation, respectively. The corresponding values of spring wheat CWP were 1.1%, 3.8%, and 5.4%, respectively.
In all combinations of irrigation methods and straw mulching, the increases in seed maize CWP ranged from 3.8% under basin irrigation to 4.1% under furrow irrigation, 5.6% under drip irrigation, and 7.0% under subsurface drip irrigation. Plastic mulching increased seed maize CWP by 7.9%, 8.1%, 8.4%, and 10.1% under basin, furrow, drip, and subsurface drip irrigation, respectively. Compared with the results of local experiments in northwest China, the simulated effect of plastic mulching on seed maize CWP (50% plastic mulch covered) may be lower than that of Fan et al. [13] (19% on average with 90% plastic mulch covered) and Wang et al. [79] (9.3% with 50% plastic mulch covered and high irrigation level). The reason could be the differences in film colors, soil covered percentage, and irrigation water input [17,80,81]. For spring wheat, the CWP increases of basin irrigation and plastic mulching were 5.9% on average, which were 2.0–4.7% for the treatment of plastic mulching and maintained 85% minimum soil water content based on a two-year experiment in the Zhangye Basin [16]. It was also observed that the spring wheat CWP increased less with higher irrigation levels or even became lower than that with no mulching treatment. The water input levels influenced the mulching effect on CWP, which should be considered more carefully when mulching practices are implemented.
In addition, the seed maize CWP increase by drip irrigation at larger farmland scales (15% on average) was less than that at small zone scales (>20%) found by Wang et al. [82]. This could help explain why the positive effects of drip irrigation on CWP at the basin scale are not as obvious as those of previous site-scale studies. The effect of different irrigation methods on the improvement in CWP was not as good as that of soil mulching practices. Plastic mulching was better at increasing the CWP than straw mulching. The difference could be attributed to the larger reduction in ET and better improvement in the soil environment resulting in higher yield by plastic mulching, as discussed before.
Furthermore, there was less difference among the three counties in the effect of changing irrigation methods than in soil mulching. The reason could be the full irrigation applied in the simulation. Under full irrigation, the actual irrigation amount satisfied the crop water requirement, which did not differ greatly among the various irrigation methods. The results also indicated that the application of water-saving technology in Ganzhou District reached the best positive effect on seed maize CWP (Table 5).
3.4. Water-Saving Potential Analysis
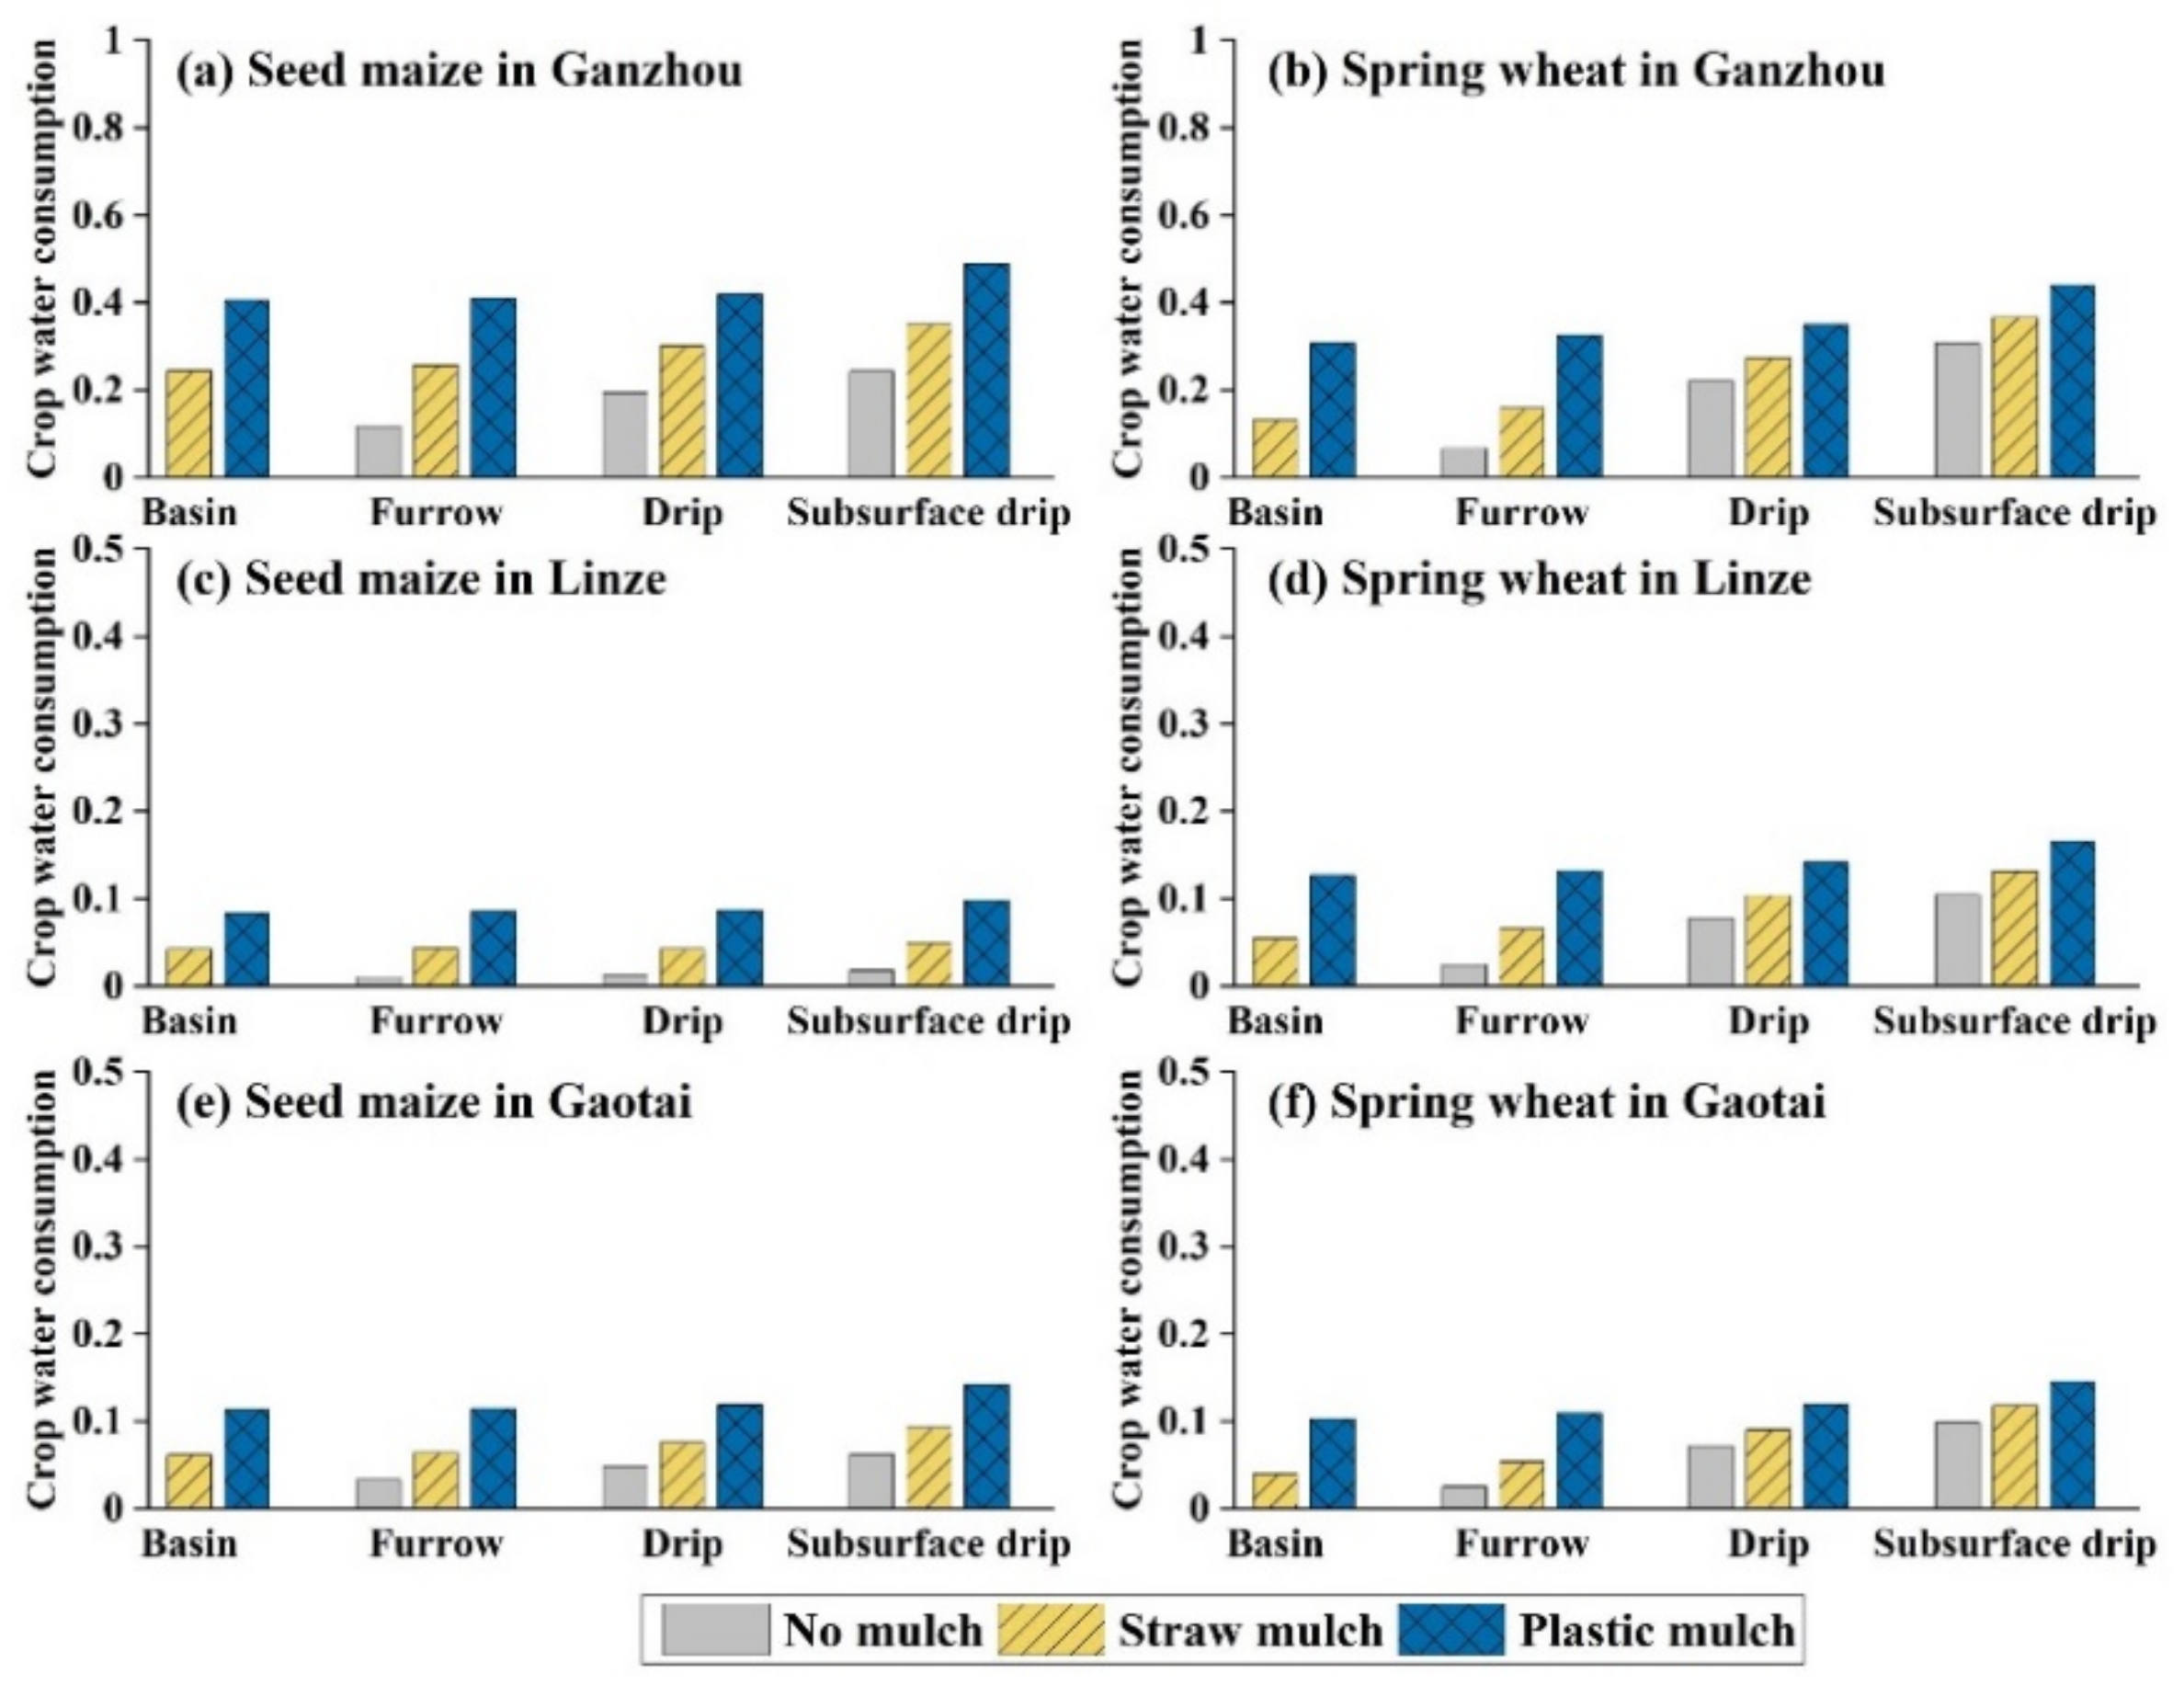
The reductions in regional crop water consumption are illustrated in Figure 8. The combination of subsurface drip irrigation and plastic mulching had the largest water-saving potential, while the combination of furrow irrigation and no mulching had the lowest water-saving potential in all three counties and two crops. With no mulching, the regional CWC of seed maize decreased by 1.2% (16.0 million m3), 3.5% (37.0 million m3), and 4.9% (51.0 million m3) under furrow, drip, and subsurface drip irrigation, respectively. The corresponding CWC decreases in spring wheat were 1.1% (11.6 million m3), 3.1% (25.4 million m3), and 3.8% (32.3 million m3), respectively.
With plastic mulching, the reduction in seed maize CWC varied from 5.3% (60.1 million m3) to 7.7% (75.0 million m3) under different irrigation methods in the whole study area. With straw mulching, the corresponding values of seed maize ranged from 2.2% to 5.9%. The results of CWC reduction showed that the application of plastic mulching could save more water than the change in irrigation methods. However, the comparison between the water-saving potential of straw mulching and irrigation method depended on the situation. For example, basin irrigation with plastic mulching and subsurface drip irrigation with no mulching had a comparable effect on seed maize CWC. Plastic mulching and its residue have caused pollution problems such as soil structure damage and nutrient reduce [83,84]. For environmental protection, the results showed that advanced irrigation techniques could be adopted rather than plastic films to save comparable amount of water.
Drip and subsurface drip irrigation have the highest field application efficiency and conveyance efficiency, leading to the greatest average IWE reduction of 62.4% and 64.7% for maize. The simulated IWE reduction under drip irrigation and straw mulching was 61.3–66.5% in three counties, which was 65% under the combination of drip irrigation, regular deficit irrigation, and straw mulching in China [32]. Huang et al. [32] also estimated the average IWE reduction under drip irrigation and plastic mulching (68%) and under furrow irrigation with no mulching (13%), with the corresponding values of 67.2% and 18.2% in our study. The results showed that agricultural management practices had great potential to save water extraction and irrigation methods had a greater potential than soil mulching in saving IWE (Table 6). Chen et al. [80] also indicated that the irrigation water consumption of Gansu Province, where the study area was located, was mainly affected by irrigation techniques.
Among all irrigation methods, subsurface drip irrigation is the most useful way to reduce agricultural water use in the Zhangye Basin, which is consistent with findings from Wang et al. [33] in China and Chukalla et al. [28] in arid environments. However, the application of subsurface drip irrigation may be costly and require stringent operational maintenance [81]. Hence, a cost–benefit analysis of agricultural management practices should be involved in future work. It is noted that AquaCrop model has some limitations, such as only considering vertical soil water movement and the inability to simulate the depth where subsurface drip irrigation happens. Moreover, crop parameters are adjusted under current conditions (basin irrigation and no mulching) in this study, which may cause over- or under-estimation. We believe that the model performance could be improved by collecting further experimental data under different environment. The evaluation of various combinations of water-saving practices could be a reference for trade-offs among water resources, food security, and economic benefits. The study could help improve local growers’ awareness of agronomic practice and promote its development and application.
4. Conclusions
To explore the agricultural water-saving potential in arid regions, a distributed AquaCrop model was established and validated in the Zhangye Basin. Twelve combinations of soil mulching and irrigation methods were simulated and evaluated. Compared to the current situation, soil mulching and advanced irrigation methods reduced ET, changed the E/ET ratios, and improved CWP. Under different management practices, the CWP of seed maize improved from 3.5% to 10.9%, with the largest increase in Ganzhou County. The decreases in crop water consumption ranged from 1.9% to 7.3%, with that of irrigation water extraction varying from 17.4% to 68.7%. The results showed that management practices, especially subsurface drip irrigation with plastic mulching, had great potential to cut down irrigation water extraction in arid areas.
The findings of the study also indicated that soil mulching has a more obvious effect than irrigation methods in reducing crop water consumption. However, drip and subsurface drip irrigation showed greater water-saving potential in irrigation water extraction than soil mulching. Plastic mulching is recommended for saving crop water consumption and subsurface drip irrigation for reducing irrigation water extraction in the study area. This research provides a deeper understanding and practical implications of the water-saving difference between soil mulching and irrigation methods. The regional assessment would help the local governments make strategic policies more precisely and scientifically. The quantitative results could be used to optimize the scale and distribution of agricultural practices application in the future work. This work could contribute to better addressing the risk of water shortages and food security.
Supplementary Materials
The following supporting information can be downloaded at: https://www.mdpi.com/article/10.3390/w14132072/s1, Figure S1: Comparison between the observed and simulated (a) soil water content, (b) crop canopy cover, (c) aboveground biomass and (d) yield at the three experimental stations during the validation period; Table S1: Full list of calibrated crop parameters at three experimental stations; Table S2: Uncertainty analysis results of simulated crop yields. References [85,86] are citied in the Supplementat Materials.
Author Contributions
W.Z., writing—original draft preparation; Y.T. and Y.F., writing—review and editing; J.L. and C.Z., supervision, project administration, and funding acquisition. All authors have read and agreed to the published version of the manuscript.
Funding
This research was funded by National Key Research and Development Program (No. 2018YFE01960005) of the Ministry of Science and Technology of China and the National Natural Science Foundation of China (No. 42071244 and 41861124003).
Institutional Review Board Statement
Not applicable.
Informed Consent Statement
Not applicable.
Data Availability Statement
The data generated from this study are available from the corresponding author on reasonable request.
Acknowledgments
The authors wish to acknowledge National Key Research and Development Program (No. 2018YFE01960005) of the Ministry of Science and Technology of China and the National Natural Science Foundation of China (Nos. 42071244 and 41861124003), and the data set was provided by the National Tibetan Plateau Data Center (http://data.tpdc.ac.cn, accessed on 20 June 2022).
Conflicts of Interest
The authors declare no conflict of interest.
References
- Aquastat. FAO Global Information System on Water and Agriculture. Available online: https://www.fao.org/aquastat/en/overview/ (accessed on 20 June 2022).
- Kang, S.; Hao, X.; Du, T.; Tong, L.; Su, X.; Lu, H.; Li, X.; Huo, Z.; Li, S.; Ding, R. Improving agricultural water productivity to ensure food security in China under changing environment: From research to practice. Agric. Water Manag. 2017, 179, 5–17. [Google Scholar] [CrossRef]
- Wada, Y.; de Graaf, I.E.; van Beek, L.P. High-resolution modeling of human and climate impacts on global water resources. J. Adv. Modeling Earth Syst. 2016, 8, 735–763. [Google Scholar] [CrossRef] [Green Version]
- Hassan, W.H.; Hussein, H.H.; Nile, B.K. The effect of climate change on groundwater recharge in unconfined aquifers in the western desert of Iraq. Groundw. Sustain. Dev. 2022, 16, 100700. [Google Scholar] [CrossRef]
- Raeisi, L.G.; Morid, S.; Delavar, M.; Srinivasan, R. Effect and side-effect assessment of different agricultural water saving measures in an integrated framework. Agric. Water Manag. 2019, 223, 105685. [Google Scholar] [CrossRef]
- Zhong, R.; Dong, X.; Ma, Y. Sustainable water saving: New concept of modern agricultural water saving, starting from development of Xinjiang’s agricultural irrigation over the last 50 years. Irrig. Drain. 2009, 58, 383–392. [Google Scholar]
- Hassan, W.H.; Nile, B.K.; Mahdi, K.; Wesseling, J.; Ritsema, C. A Feasibility Assessment of Potential Artificial Recharge for Increasing Agricultural Areas in the Kerbala Desert in Iraq Using Numerical Groundwater Modeling. Water 2021, 13, 3167. [Google Scholar] [CrossRef]
- Li, X.; Jiang, W.; Duan, D. Spatio-temporal analysis of irrigation water use coefficients in China. J. Environ. Manag. 2020, 262, 110242. [Google Scholar] [CrossRef]
- Deng, X.; Shan, L.; Zhang, H.; Turner, N.C. Improving agricultural water use efficiency in arid and semiarid areas of China. Agric. Water Manag. 2006, 80, 23–40. [Google Scholar] [CrossRef]
- Cao, X.; Wang, Y.; Wu, P.; Zhao, X.; Wang, J. An evaluation of the water utilization and grain production of irrigated and rain-fed croplands in China. Sci. Total Environ. 2015, 529, 10–20. [Google Scholar] [CrossRef]
- Molden, D. Accounting for Water Use and Productivity; SWIM: Colombo, Sri Lanka, 1997. [Google Scholar]
- Kijne, J.W.; Barker, R.; Molden, D.J. Water Productivity in Agriculture: Limits and Opportunities for Improvement; Cabi: Colombo, Sri Lanka, 2003; Volume 1. [Google Scholar]
- Fan, Y.; Ding, R.; Kang, S.; Hao, X.; Du, T.; Tong, L.; Li, S. Plastic mulch decreases available energy and evapotranspiration and improves yield and water use efficiency in an irrigated maize cropland. Agric. Water Manag. 2017, 179, 122–131. [Google Scholar] [CrossRef]
- Lv, G.; Kang, Y.; Li, L.; Wan, S. Effect of irrigation methods on root development and profile soil water uptake in winter wheat. Irrig. Sci. 2010, 28, 387–398. [Google Scholar] [CrossRef]
- Zhang, Y.; Wang, J.; Gong, S.; Xu, D.; Sui, J.; Wu, Z.; Mo, Y. Effects of film mulching on evapotranspiration, yield and water use efficiency of a maize field with drip irrigation in Northeastern China. Agric. Water Manag. 2018, 205, 90–99. [Google Scholar] [CrossRef]
- Xie, Z.; Wang, Y.; Li, F. Effect of plastic mulching on soil water use and spring wheat yield in arid region of northwest China. Agric. Water Manag. 2005, 75, 71–83. [Google Scholar] [CrossRef]
- Qin, W.; Hu, C.; Oenema, O. Soil mulching significantly enhances yields and water and nitrogen use efficiencies of maize and wheat: A meta-analysis. Sci. Rep. 2015, 5, 16210. [Google Scholar] [CrossRef]
- El-Hendawy, S.; Hokam, E.; Schmidhalter, U. Drip irrigation frequency: The effects and their interaction with nitrogen fertilization on sandy soil water distribution, maize yield and water use efficiency under Egyptian conditions. J. Agron. Crop Sci. 2008, 194, 180–192. [Google Scholar] [CrossRef]
- Camp, C.; Lamm, F.; Evans, R.; Phene, C. Subsurface drip irrigation–Past, present and future. In Proceedings of the Fourth Decennial Nat’l Irrigation Symposium, Phoenic, AZ, USA, 14–16 November 2000; pp. 14–16. [Google Scholar]
- Ayars, J.E.; Phene, C.J.; Hutmacher, R.B.; Davis, K.R.; Schoneman, R.A.; Vail, S.S.; Mead, R.M. Subsurface drip irrigation of row crops: A review of 15 years of research at the Water Management Research Laboratory. Agric. Water Manag. 1999, 42, 1–27. [Google Scholar] [CrossRef]
- Hansona, B.; Schwankl, L.; Schulbach, K.; Pettygrove, G. A comparison of furrow, surface drip, and subsurface drip irrigation on lettuce yield and applied water. Agric. Water Manag. 1997, 33, 139–157. [Google Scholar] [CrossRef]
- Jha, S.K.; Ramatshaba, T.S.; Wang, G.; Liang, Y.; Liu, H.; Gao, Y.; Duan, A. Response of growth, yield and water use efficiency of winter wheat to different irrigation methods and scheduling in North China Plain. Agric. Water Manag. 2019, 217, 292–302. [Google Scholar]
- Ibragimov, N.; Evett, S.R.; Esanbekov, Y.; Kamilov, B.S.; Mirzaev, L.; Lamers, J.P.A. Water use efficiency of irrigated cotton in Uzbekistan under drip and furrow irrigation. Agric. Water Manag. 2007, 90, 112–120. [Google Scholar] [CrossRef]
- Li, S.; Wang, Z.; Li, S.; Gao, Y.; Tian, X. Effect of plastic sheet mulch, wheat straw mulch, and maize growth on water loss by evaporation in dryland areas of China. Agric. Water Manag. 2013, 116, 39–49. [Google Scholar] [CrossRef]
- Ghosh, P.; Dayal, D.; Bandyopadhyay, K.; Mohanty, M. Evaluation of straw and polythene mulch for enhancing productivity of irrigated summer groundnut. Field Crop. Res. 2006, 99, 76–86. [Google Scholar] [CrossRef]
- Tiwari, K.N.; Singh, A.; Mal, P.K. Effect of drip irrigation on yield of cabbage (Brassica oleracea L. var. capitata) under mulch and non-mulch conditions. Agric. Water Manag. 2003, 58, 19–28. [Google Scholar] [CrossRef]
- Zhang, T.; Zou, Y.; Kisekka, I.; Biswas, A.; Cai, H. Comparison of different irrigation methods to synergistically improve maize’s yield, water productivity and economic benefits in an arid irrigation area. Agric. Water Manag. 2021, 243, 11. [Google Scholar] [CrossRef]
- Chukalla, A.D.; Krol, M.S.; Hoekstra, A.Y. Green and blue water footprint reduction in irrigated agriculture: Effect of irrigation techniques, irrigation strategies and mulching. Hydrol. Earth Syst. Sci. 2015, 19, 4877–4891. [Google Scholar] [CrossRef] [Green Version]
- Zhuo, L.; Hoekstra, A.Y. The effect of different agricultural management practices on irrigation efficiency, water use efficiency and green and blue water footprint. Front. Archit. Res. 2017, 4, 185–194. [Google Scholar] [CrossRef] [Green Version]
- Jägermeyr, J.; Gerten, D.; Schaphoff, S.; Heinke, J.; Lucht, W.; Rockström, J. Integrated crop water management might sustainably halve the global food gap. Environ. Res. Lett. 2016, 11, 025002. [Google Scholar] [CrossRef]
- Nouri, H.; Stokvis, B.; Galindo, A.; Blatchford, M.; Hoekstra, A.Y. Water scarcity alleviation through water footprint reduction in agriculture: The effect of soil mulching and drip irrigation. Sci. Total Environ. 2019, 653, 241–252. [Google Scholar] [CrossRef] [PubMed]
- Huang, G.; Hoekstra, A.Y.; Krol, M.S.; Jägermeyr, J.; Galindo, A.; Yu, C.; Wang, R. Water-saving agriculture can deliver deep water cuts for China. Resour. Conserv. Recycl. 2020, 154, 104578. [Google Scholar] [CrossRef]
- Wang, W.; Zhuo, L.; Li, M.; Liu, Y.; Wu, P. The effect of development in water-saving irrigation techniques on spatial-temporal variations in crop water footprint and benchmarking. J. Hydrol. 2019, 577, 123916. [Google Scholar] [CrossRef]
- Siad, S.M.; Iacobellis, V.; Zdruli, P.; Gioia, A.; Stavi, I.; Hoogenboom, G. A review of coupled hydrologic and crop growth models. Agric. Water Manag. 2019, 224, 105746. [Google Scholar] [CrossRef]
- Whisler, F.D.; Acock, B.; Baker, D.N.; Fye, R.E.; Hodges, H.F.; Lambert, J.R.; Lemmon, H.E.; McKinion, J.M.; Reddy, V.R. Crop Simulation Models in Agronomic Systems. In Advances in Agronomy; Brady, N.C., Ed.; Academic Press: Cambridge, MA, USA, 1986; Volume 40, pp. 141–208. [Google Scholar]
- Jin, X.; Kumar, L.; Li, Z.; Feng, H.; Xu, X.; Yang, G.; Wang, J. A review of data assimilation of remote sensing and crop models. Eur. J. Agron. 2018, 92, 141–152. [Google Scholar] [CrossRef]
- Corbeels, M.; Chirat, G.; Messad, S.; Thierfelder, C. Performance and sensitivity of the DSSAT crop growth model in simulating maize yield under conservation agriculture. Eur. J. Agron. 2016, 76, 41–53. [Google Scholar] [CrossRef]
- Saseendran, S.A.; Ma, L.; Malone, R.; Heilman, P.; Ahuja, L.R.; Kanwar, R.S.; Karlen, D.L.; Hoogenboom, G. Simulating management effects on crop production, tile drainage, and water quality using RZWQM–DSSAT. Geoderma 2007, 140, 297–309. [Google Scholar] [CrossRef] [Green Version]
- Steduto, P.; Hsiao, T.C.; Raes, D.; Fereres, E. AquaCrop—The FAO crop model to simulate yield response to water: I. Concepts and underlying principles. Agron. J. 2009, 101, 426–437. [Google Scholar] [CrossRef] [Green Version]
- Shen, Q.; Ding, R.; Du, T.; Tong, L.; Li, S. Water use effectiveness is enhanced using film mulch through increasing transpiration and decreasing evapotranspiration. Water 2019, 11, 1153. [Google Scholar] [CrossRef] [Green Version]
- Amiri, E.; Abedinpour, M. Simulating Maize Yield Response to Depletion of Available Soil Water and Nitrogen Management under Drip Irrigation with the FAO AquaCrop Model. Russ. Agric. Sci. 2020, 46, 602–608. [Google Scholar] [CrossRef]
- Sandhu, R.; Irmak, S. Assessment of AquaCrop model in simulating maize canopy cover, soil-water, evapotranspiration, yield, and water productivity for different planting dates and densities under irrigated and rainfed conditions. Agric. Water Manag. 2019, 224, 105753. [Google Scholar] [CrossRef]
- Qin, W.; Chi, B.; Oenema, O. Long-term monitoring of rainfed wheat yield and soil water at the loess plateau reveals low water use efficiency. PLoS ONE 2013, 8, e78828. [Google Scholar] [CrossRef] [PubMed]
- Tsakmakis, I.D.; Zoidou, M.; Gikas, G.D.; Sylaios, G.K. Impact of Irrigation Technologies and Strategies on Cotton Water Footprint Using AquaCrop and CROPWAT Models. Environ. Process. 2018, 5, 181–199. [Google Scholar] [CrossRef]
- Malik, A.; Shakir, A.S.; Ajmal, M.; Khan, M.J.; Khan, T.A. Assessment of AquaCrop Model in Simulating Sugar Beet Canopy Cover, Biomass and Root Yield under Different Irrigation and Field Management Practices in Semi-Arid Regions of Pakistan. Water Resour. Manag. 2017, 31, 4275–4292. [Google Scholar] [CrossRef]
- Zhao, W.; Liu, B.; Zhang, Z. Water requirements of maize in the middle Heihe River Basin, China. Agric. Water Manag. 2010, 97, 215–223. [Google Scholar] [CrossRef]
- Xiao, X.; Fan, L.; Li, X.; Tan, M.; Jiang, T.; Zheng, L.; Jiang, F. Water-Use Efficiency of Crops in the Arid Area of the Middle Reaches of the Heihe River: Taking Zhangye City as an Example. Water 2019, 11, 1541. [Google Scholar] [CrossRef] [Green Version]
- Jiang, Y.; Xu, X.; Huang, Q.; Huo, Z.; Huang, G. Assessment of irrigation performance and water productivity in irrigated areas of the middle Heihe River Basin using a distributed agro-hydrological model. Agric. Water Manag. 2015, 147, 67–81. [Google Scholar] [CrossRef]
- Shi, M.; Wang, X.; Yang, H.; Wang, T. Pricing or quota? A solution to water scarcity in oasis regions in China: A case study in the Heihe River Basin. Sustainability 2014, 6, 7601–7620. [Google Scholar] [CrossRef] [Green Version]
- Wang, G.; Cheng, G. The characteristics of water resources and the changes of the hydrological process and environment in the arid zone of northwest China. Environ. Geol. 2000, 39, 783–790. [Google Scholar] [CrossRef]
- Cheng, G.; Li, X.; Zhao, W.; Xu, Z.; Feng, Q.; Xiao, S.; Xiao, H. Integrated study of the water-ecosystem-economy in the Heihe River Basin. Natl. Sci. Rev. 2014, 1, 413–428. [Google Scholar] [CrossRef] [Green Version]
- Zhang, B.; Li, F.M.; Huang, G.; Cheng, Z.Y.; Zhang, Y. Yield performance of spring wheat improved by regulated deficit irrigation in an arid area. Agric. Water Manag. 2006, 79, 28–42. [Google Scholar] [CrossRef]
- Wu, B.; Zheng, Y.; Wu, X.; Tian, Y.; Han, F.; Liu, J.; Zheng, C. Optimizing water resources management in large river basins with integrated surface water-groundwater modeling: A surrogate-based approach. Water Resour. Res. 2015, 51, 2153–2173. [Google Scholar] [CrossRef]
- Tian, Y.; Zheng, Y.; Zheng, C.; Xiao, H.; Fan, W.; Zou, S.; Wu, B.; Yao, Y.; Zhang, A.; Liu, J. Exploring scale-dependent ecohydrological responses in a large endorheic river basin through integrated surface water-groundwater modeling. Water Resour. Res. 2015, 51, 4065–4085. [Google Scholar] [CrossRef]
- Raes, D.; Steduto, P.; Hsiao, T.C.; Fereres, E. Aquacrop Reference Manual; FAO: Rome, Italy, 2009; Volume 218. [Google Scholar]
- Allen, R.G.; Pereira, L.S.; Raes, D.; Smith, M. Crop Evapotranspiration-Guidelines for Computing Crop Water Requirements-FAO Irrigation and Drainage Paper NO. 56; FAO: Rome, Italy, 1998. [Google Scholar]
- Zhu, T. The Spatial and Temporal Variation of Crop Water Consumption in the Middle Reaches of Heihe River Basin; China Agricultural University: Beijing, China, 2014. (In Chinese) [Google Scholar]
- Wang, J. Study on Formula Fertilization Effect of Maize in Gaotai County. Available online: https://www.docin.com/p-707572952.html (accessed on 20 June 2022).
- Ma, L. Study of Spring Wheat Growth Characteristics and Water Use Efficiency in Desert Oasis Area (in Chinese with English Abstract) [D]; Institute of Soil and Water Conservation, Chinese Academy of Sciences and Ministry of Water Resources: Yangling, China, 2013. [Google Scholar]
- Ma, Z.; Lian, C.; Zhang, L. Effects of Bed Planting System on Growth and Yield of Spring Wheat in Oasis Irrigation Region. J. Triticeae Crop. 2012, 32, 315–319. [Google Scholar]
- Zhang, Y. Studies on the Yield Effects and Its Influencing Mechanism of Bed Planting Spring Wheat in Hexi Oasis Irrigated Area. Master’s Thesis, Gansu Agricultural University, Lanzhou, China, 2006. (In Chinese). [Google Scholar]
- Xing, J. Calibration of CERES-Maize Model and Analysis of Water Saving Potential in Arid Area of Northwest China; Shanxi Agriculture University: Taigu, China, 2016. (In Chinese) [Google Scholar]
- Zhang, Z. Effects of Regulated Deficit Irrigation on Seed Maize; Gansu Agricultural University: Lanzhou, China, 2012. (In Chinese) [Google Scholar]
- Gao, B.; Yin, X.R.; Zhang, T. Impact of Cliamte Change on Wheat Yield in a Small Geographical Area Based on AquaCrop model. Hubei Agric. Sci. 2017, 56, 2856–2859. (In Chinese) [Google Scholar]
- Wang, J. Effects of mulching methods on yield and water use efficiency of seed maize production in Hexi irrigated area. Available online: https://www.docin.com/p-707766179.html (accessed on 20 June 2022).
- Doherty, J. PEST: Model-Independent Parameter Estimation, 5th ed.; Watermark Computing: Brisbane, Australia, 2010; pp. 551–554. [Google Scholar]
- Tarantola, S. Ispra, SimLab software 2.2.1.; Institute for Systems, Informatics and Safety, European Commission, Joint Research Center: Amman, Jordan, 2005. [Google Scholar]
- Jamieson, P.; Porter, J.; Wilson, D. A test of the computer simulation model ARCWHEAT1 on wheat crops grown in New Zealand. Field Crop. Res. 1991, 27, 337–350. [Google Scholar] [CrossRef]
- Willmott, C.J.; Matsuura, K. Advantages of the mean absolute error (MAE) over the root mean square error (RMSE) in assessing average model performance. Clim. Res. 2005, 30, 79–82. [Google Scholar] [CrossRef]
- Legates, D.R.; McCabe, G.J., Jr. Evaluating the use of “goodness-of-fit” Measures in hydrologic and hydroclimatic model validation. Water Resour. Res. 1999, 35, 233–241. [Google Scholar] [CrossRef]
- Steduto, P.; Hsiao, T.C.; Raes, D.; Fereres, E. AquaCrop—the FAO crop model to simulate yield response to water: II. Main algorithms and software description. Agron. J. 2009, 101, 438–447. [Google Scholar] [CrossRef] [Green Version]
- Brouwer, C.; Prins, K.; Heibloem, M. Irrigation Water Management: Training Manual No. 4: Irrigation Scheduling; FAO: Rome, Italy, 1985. [Google Scholar]
- Zhang, R. Study on the Optimal Regulated Deficit Drip Irrigation under Plastic Film Mulched Schedule of Corn for Seed and High-Efficient Use of Soil Water and Heat. Master’s Thesis, Gansu Agricultural University, Lanzhou, China, 2007. [Google Scholar]
- Zhao, R.; Mao, T.; Zhou, J. Contrastive experiment of different cropping patterns of seed maize production in Zhangye City. Gansu Agric. Sci. Technol. 2014, 3, 43–45. (In Chinese) [Google Scholar]
- Zhang, L.; Ma, Z.; Wang, Z.; Lian, C. Yield and Water Production Effect of Seed Corn under Different Cultivation Mode. Water Sav. Irrig. 2012, 12, 43–45, 50. [Google Scholar]
- He, Y.; Cheng, Z.; Zhang, R.; Zhang, J.; Li, Y.; Yao, M. Effects of Different Ways of Micro-moist Irrigation on Growth and Yield of Maize. J. South China Agric. Univ. 2012, 33, 566–569. (In Chinese) [Google Scholar]
- Zheng, R.; Wang, J.; Miu, C.; Li, C.; Yang, Y. Irrigation Schedules of Seed Maize with Trickle Irrigation Technique under Sub-film. J. Irrig. Drain. Eng. 2015, 34, 55–58. [Google Scholar]
- Wang, X. Study on the Technology of RDI Applied to Irrigation with Mulching and High-Efficient Use of Soil Water and Temperature in the Inland Irrigation District of Hexi. Master’s Thesis, Gansu Agricultural University, Lanzhou, China, 2006. (In Chinese). [Google Scholar]
- Wang, C.; Zhao, X.; Li, Y.; Zheng, R.; Zhang, T.; Yao, H.; Zhao, J.; Fan, Y.; Wang, H. Effects of irrigation quota and plastic film mulching on yield of seed corn in Hexi area. J. Henan Agric. Sci. 2016, 45, 25–30. (In Chinese) [Google Scholar]
- Chen, M.; Luo, Y.; Shen, Y.; Han, Z.; Cui, Y. Driving force analysis of irrigation water consumption using principal component regression analysis. Agric. Water Manag. 2020, 234, 106089. [Google Scholar] [CrossRef]
- Martinez, J.; Reca, J. Water Use Efficiency of Surface Drip Irrigation versus an Alternative Subsurface Drip Irrigation Method. J. Irrig. Drain. Eng. 2014, 140, 9. [Google Scholar] [CrossRef]
- Wang, Y.; Li, S.; Cui, Y.; Qin, S.; Guo, H.; Yang, D.; Wang, C. Effect of Drip Irrigation on Soil Water Balance and Water Use Efficiency of Maize in Northwest China. Water 2021, 13, 217. [Google Scholar] [CrossRef]
- Liu, E.K.; He, W.Q.; Yan, C.R. ‘White revolution’ to ‘white pollution’—Agricultural plastic film mulch in China. Environ. Res. Lett. 2014, 9, 091001. [Google Scholar] [CrossRef] [Green Version]
- Gao, H.; Yan, C.; Liu, Q.; Ding, W.; Chen, B.; Li, Z. Effects of plastic mulching and plastic residue on agricultural production: A meta-analysis. Sci. Total Environ. 2019, 651, 484–492. [Google Scholar] [CrossRef] [PubMed]
- Campbell, G.S. A simple method for determining unsaturated conductivity from moisture retention data. Soil Sci. 1974, 117, 311–314. [Google Scholar]
- Koren, V.; Smith, M.; Duan, Q. Use of a priori parameter estimates in the derivation of spatially. Calibration Watershed Models 2003, 239. [Google Scholar]
Figure 1.
Location, irrigation districts, and staple crops of the study area. Sites of meteorological stations and experimental stations are labeled.
Figure 1.
Location, irrigation districts, and staple crops of the study area. Sites of meteorological stations and experimental stations are labeled.

Figure 2.
Schematic flowchart of the study.

Figure 3.
Comparisons between the observed and simulated (a) soil water content, (b) crop canopy cover, (c) aboveground biomass, and (d) yield at the three experimental stations during the calibration period.
Figure 3.
Comparisons between the observed and simulated (a) soil water content, (b) crop canopy cover, (c) aboveground biomass, and (d) yield at the three experimental stations during the calibration period.

Figure 4.
Comparisons between the observed and simulated seed maize (a) CWP and (b) ET and spring wheat (c) CWP and (d) ET under different scenarios. (BP, FN, FP, BS, and SDP present basin irrigation with plastic mulching, furrow irrigation with no mulching, furrow irrigation with plastic mulching, basin irrigation with straw mulching, and subsurface drip irrigation with plastic mulching, respectively. FP1 and FP2 present different coverage of plastic mulching, respectively. The observed values a to h are collected from a Zhang [73], b Zhao et al. [74], c Zhang et al. [75], d He et al. [76], e Zheng et al. [77], f Wang [78], g Ma et al. [59], and h Ma et al. [60].

Figure 5.
Comparisons of ET for seed maize in (a) Ganzhou, (c) Linze and (e) Gaotai, and spring wheat in (b) Ganzhou, (d) Linze and (f) Gaotai under different combinations of management practices.
Figure 5.
Comparisons of ET for seed maize in (a) Ganzhou, (c) Linze and (e) Gaotai, and spring wheat in (b) Ganzhou, (d) Linze and (f) Gaotai under different combinations of management practices.

Figure 6.
Comparisons of E/ET ratios for seed maize in (a) Ganzhou, (c) Linze and (e) Gaotai, and spring wheat in (b) Ganzhou, (d) Linze and (f) Gaotai under different combinations of management practices.
Figure 6.
Comparisons of E/ET ratios for seed maize in (a) Ganzhou, (c) Linze and (e) Gaotai, and spring wheat in (b) Ganzhou, (d) Linze and (f) Gaotai under different combinations of management practices.

Figure 7.
Crop water productivity (kg m−3) of seed maize in (a) Ganzhou, (c) Linze and (e) Gaotai, and spring wheat in (b) Ganzhou, (d) Linze and (f) Gaotai under different combinations of management practices. (Baseline represents the combination of no mulching and basin irrigation).
Figure 7.
Crop water productivity (kg m−3) of seed maize in (a) Ganzhou, (c) Linze and (e) Gaotai, and spring wheat in (b) Ganzhou, (d) Linze and (f) Gaotai under different combinations of management practices. (Baseline represents the combination of no mulching and basin irrigation).

Figure 8.
Reduction in crop water consumption (108 m3) of seed maize in (a) Ganzhou, (c) Linze and (e) Gaotai, and spring wheat in (b) Ganzhou, (d) Linze and (f) Gaotai under different combinations of practices compared with no mulch and basin irrigation.
Figure 8.
Reduction in crop water consumption (108 m3) of seed maize in (a) Ganzhou, (c) Linze and (e) Gaotai, and spring wheat in (b) Ganzhou, (d) Linze and (f) Gaotai under different combinations of practices compared with no mulch and basin irrigation.


Table 1.
Generalized current irrigation schedule.
| Crop | Zone | Irrigation Timing (Days after Planting) | Irrigation Amount (mm) | ||||||||
|---|---|---|---|---|---|---|---|---|---|---|---|
| 75% 1 | 50% 1 | 25% 1 | |||||||||
| Seed maize | 1 | 40 | 73 | 105 | 125 | 690 | 640 | 580 | |||
| 2 | 53 | 62 | 74 | 98 | 111 | 123 | 147 | 945 | 825 | 795 | |
| 3 | 55 | 74 | 88 | 107 | 123 | 144 | 945 | 915 | 865 | ||
| Spring wheat | 1 | 35 | 62 | 87 | 495 | 465 | 435 | ||||
| 2 | 37 | 60 | 90 | 110 | 585 | 555 | 525 | ||||
| 3 | 37 | 60 | 90 | 110 | 555 | 530 | 480 | ||||
1 The percentages represent the precipitation probability of non-exceedance.
Table 2.
Data collected from the literature for crop parameter calibration and validation.
| Period | Indicator | Sample Size | |||
|---|---|---|---|---|---|
| Station 1 | Station 2 | Station 3 | |||
| Calibration | Soil water content | 100 (2003) 1 | 66 (2012) 6 | 36 (2009–2011) 8 | |
| Spring wheat | Green canopy cover | 8 (2004) 2 | 25 (2012) 6 | - | |
| Aboveground biomass | 10 (2004) 2 | 25 (2012) 6 | - | ||
| Yield | 4 (2004) 2 | 5 (2012) 6 | 4 (2000–2003) 9 | ||
| Seed maize | Green canopy cover | 24 (2012) 3 | 12 (2011) 7 | - | |
| Aboveground biomass | 27 (2012) 3 | 12 (2011) 7 | - | ||
| Yield | 3 (2012–2013) 3 | 3 (2011) 7 | 1 (2008) 10 | ||
| Validation | Soil water content | 100 (2004) 1 | 45 (2012) 6,* | 41 (2011–2013) 8 | |
| Spring wheat | Green canopy cover | 8 (2008) 4 | 25 (2011) 6 | - | |
| Aboveground biomass | 5 (2008) 4 | 25 (2011) 6 | - | ||
| Yield | 4 (2008) 4 | 5 (2011) 6 | 3 (2004–2006) 9 | ||
| Seed maize | Green canopy cover | 17 (2012–2013) 5 | 16 (2011) 7,* | - | |
| Aboveground biomass | 8 (2012) 5 | 16 (2011) 7,* | - | ||
| Yield | 6 (2012) 5 | 6 (2011) 7,* | 1 (2009) 11 | ||
Note: The numbers in parentheses present the year of calibration and validation periods. Source: 1 Zhang et al. [52], 2 Zhang [61], 3 Zhu [57], 4 Ma et al. [60], 5 Xing [62], 6 Ma [59], 7 Zhang [63], 8 http://data.cma.cn/, 9 Gao et al. [64], 10 Wang [58], and 11 Wang [65].* Irrigation schedules are different from that of the calibration period.
Table 3.
Parameters of field management practices used in AquaCrop.
| Scenario | 1 | 2 | 3 | 4 | 5 | 6 | 7 | 8 | 9 | 10 | 11 | 12 | Per1 | |||
|---|---|---|---|---|---|---|---|---|---|---|---|---|---|---|---|---|
| Irrigation method | Basin | √ | √ | √ | 100% | 50% | 55–76% | |||||||||
| Furrow | √ | √ | √ | 80% | 60% | |||||||||||
| Drip | √ | √ | √ | 30% | 90% | 95% | ||||||||||
| Subsurface drip | √ | √ | √ | 0% | 95% | 95% | ||||||||||
| Surface mulching | No mulch | √ | √ | √ | √ | 0% | ||||||||||
| Straw mulching | √ | √ | √ | √ | 50% | |||||||||||
| Plastic mulching | √ | √ | √ | √ | 50% | |||||||||||
Table 4.
Statistical indicators of annual crop yield simulation.
| Crop | County | Simulated Yield (ton ha−1) | n | RMSE (ton ha−1) | MBE (ton ha−1) |
|---|---|---|---|---|---|
| Seed maize | Ganzhou | 7.475 | 14 | 0.040 | 0.033 |
| Linze | 7.183 | 14 | 1.058 | 0.965 | |
| Gaotai | 8.228 | 14 | 0.929 | 0.712 | |
| Spring wheat | Ganzhou | 8.610 | 21 | 0.760 | −0.643 |
| Linze | 8.691 | 21 | 0.841 | −0.738 | |
| Gaotai | 8.625 | 21 | 1.183 | −0.881 |
Table 5.
Improvements in crop water productivity (%) under different combinations of irrigation methods and soil mulching.
Table 5.
Improvements in crop water productivity (%) under different combinations of irrigation methods and soil mulching.
| Management Practices | Seed Maize | Spring Wheat | ||||
|---|---|---|---|---|---|---|
| Ganzhou | Linze | Gaotai | Ganzhou | Linze | Gaotai | |
| Basin + straw mulching | 4.3 | 3.3 | 3.7 | 2.3 | 2.6 | 2.3 |
| Basin + plastic mulching | 8.6 | 7.3 | 7.9 | 5.7 | 6.3 | 5.8 |
| Furrow + no mulching | 1.8 | 1.1 | 1.6 | 1.1 | 1.0 | 1.1 |
| Furrow + straw mulching | 4.6 | 3.5 | 3.9 | 2.8 | 3.1 | 2.8 |
| Furrow + plastic mulching | 8.8 | 7.5 | 8.0 | 6.0 | 6.6 | 6.1 |
| Drip + no mulching | 4.1 | 3.2 | 3.8 | 3.9 | 3.6 | 3.9 |
| Drip + straw mulching | 6.2 | 5.0 | 5.6 | 4.9 | 5.0 | 4.9 |
| Drip + plastic mulching | 9.1 | 7.8 | 8.3 | 6.4 | 7.0 | 6.6 |
| Subsurface drip + no mulching | 5.3 | 4.3 | 5.2 | 5.6 | 5.0 | 5.4 |
| Subsurface drip + straw mulching | 7.5 | 6.2 | 7.1 | 6.8 | 6.4 | 6.5 |
| Subsurface drip + plastic mulching | 10.9 | 9.2 | 10.1 | 8.2 | 8.2 | 8.1 |
Table 6.
Reduction in irrigation water extraction (%) under different combinations of irrigation methods and soil mulching.
Table 6.
Reduction in irrigation water extraction (%) under different combinations of irrigation methods and soil mulching.
| Management Practices | Seed Maize | Spring Wheat | ||||
|---|---|---|---|---|---|---|
| Ganzhou | Linze | Gaotai | Ganzhou | Linze | Gaotai | |
| Furrow + no mulching | 17.5 | 17.1 | 20.1 | 18.9 | 17.8 | 17.4 |
| Furrow + straw mulching | 18.3 | 21.6 | 21.8 | 22.9 | 22.5 | 21.5 |
| Furrow + plastic mulching | 21.3 | 30.0 | 27.3 | 23.5 | 22.7 | 22.0 |
| Drip + straw mulching | 61.3 | 63.3 | 66.5 | 63.7 | 62.8 | 62.2 |
| Drip + plastic mulching | 62.6 | 66.3 | 66.9 | 64.1 | 63.1 | 63.0 |
| Subsurface drip + straw mulching | 62.9 | 67.1 | 68.1 | 65.9 | 64.1 | 64.9 |
| Subsurface drip + plastic mulching | 64.5 | 68.4 | 68.7 | 66.3 | 65.1 | 64.4 |
Publisher’s Note: MDPI stays neutral with regard to jurisdictional claims in published maps and institutional affiliations. |
© 2022 by the authors. Licensee MDPI, Basel, Switzerland. This article is an open access article distributed under the terms and conditions of the Creative Commons Attribution (CC BY) license (https://creativecommons.org/licenses/by/4.0/).
Share and Cite
MDPI and ACS Style
Zhang, W.; Tian, Y.; Feng, Y.; Liu, J.; Zheng, C. Water-Saving Potential of Different Agricultural Management Practices in an Arid River Basin. Water 2022, 14, 2072. https://doi.org/10.3390/w14132072
AMA Style
Zhang W, Tian Y, Feng Y, Liu J, Zheng C. Water-Saving Potential of Different Agricultural Management Practices in an Arid River Basin. Water. 2022; 14(13):2072. https://doi.org/10.3390/w14132072
Chicago/Turabian StyleZhang, Wang, Yong Tian, Yu Feng, Jie Liu, and Chunmiao Zheng. 2022. "Water-Saving Potential of Different Agricultural Management Practices in an Arid River Basin" Water 14, no. 13: 2072. https://doi.org/10.3390/w14132072
Note that from the first issue of 2016, this journal uses article numbers instead of page numbers. See further details here.