
Analyzing the Benefit-Cost Ratio of Sediment Resources by Remote Sensing Data in the Ping River Basin, Thailand


1
Department of Water Resources Engineering, Faculty of Engineering, Kasetsart University, Bangkok 10900, Thailand
2
Department of Earth and Environment, AHC-5-390, Florida International University, 11200 SW 8th Street, Miami, FL 33199, USA
*
Author to whom correspondence should be addressed.
Water 2022, 14(13), 2071; https://doi.org/10.3390/w14132071
Submission received: 7 June 2022
/
Revised: 25 June 2022
/
Accepted: 25 June 2022
/
Published: 28 June 2022
(This article belongs to the Section Water Erosion and Sediment Transport)
Abstract
:Sediment is one of the important natural resources on the Earth. Information on sediment resources is key to making decisions regarding soil resources management and mitigation during sediment hazard events. Thus, this research analyzed and mapped the benefit-cost ratio (BCR) of sediment in the Ping River using a Geographic Information System (GIS). Furthermore, the benefit of sediment was analyzed using a new application of the Revised Universal Soil Loss Equation (RUSLE) with a spatial resolution of 1 km2. The results reveal that the potential of annual soil loss and sediment deposition in the Ping River Basin (PRB) were approximately 825 and 530 m3/km2·y, respectively. In addition, the results indicated that there was a higher BCR in the upstream area of the PRB where there was greater sediment deposition. The average benefit of sediment in the PRB is USD 4280/km2·y. It is expected that the BCR of the sediment resources map analyzed in this research will help policy-makers for decision-making on the benefits of sediment resources in Thailand.
Keywords:
sediment; benefit-cost ratio; GIS; remote sensing; RUSLE; spatial analysis; Ping River Basin1. Introduction
Annually, billions of tons of sediment are produced globally, with the major source of sediment being water erosion [1]. Soil erosion is the displacement of soil, which depends on the relationship between precipitation, surface runoff, and the soil properties of each area. The soil properties affecting resistance to erosion are the percent of sand, clay, and silt, the soil elasticity, and the grainsize distribution. Recently, soft computing techniques have attracted more attention to estimating the soil properties [2,3,4]. Soil erosion by water flow also delivers large amounts of sediment to downstream areas such as reservoirs, lakes, and dams. Sediment yield caused by water runoff can impact water quality, agricultural productivity, and dam capacity [5,6]. Therefore, a method for analyzing soil erosion is necessary for the estimation of sediment yield. In past decades, field experiments, numerical, and empirical methods have been developed for estimating soil erosion [7,8]. In 1997, Renard et al. [9] developed the Revised Universal Soil Loss Equation method (RUSLE) for estimating annual soil degradation based on the Universal Soil Loss Equation method (USLE). The RUSLE method is widely used for analyzing soil erosion analysis. Several researchers have used USLE and RUSLE for estimating long-term soil loss [10,11,12]. In addition, remote sensing and GIS have been applied to analyze soil erosion and sediment deposition in river systems [13,14,15,16]. Nevertheless, assessing sediment deposition is also equally important. Thus, Rangsiwanichpong et al. [17] developed a new technique for sediment deposition analysis in Thailand based on the original RUSLE method. Recently, several researchers have also recommended Rangsiwanichpong’s method for analyzing sediment deposition in the ungauged basin [18,19]. Chuenchum and Tang [18] applied Rangsiwanichpong’s method for estimating sediment yield in the Lancang-Mekong River. The results showed a strong correlation between the sediment yield from the modified RUSLE and observed data. Presently, sediments from lakes, rivers, and canals are widely used for construction materials [20,21], such as material to manufacture lightweight aggregate, material to manufacture bricks, and binder in concrete works [22,23,24,25,26,27,28]. In Thailand, brick production mostly uses local soil mixed with sawdust, rice husk, and sediment from the river, such as sand and clay. In addition, brick production has been using traditional construction material in the northern part of Thailand. Moreover, the brick plant leads approximately THB 2800 million to the rural economy [29]. Therefore, Rangsiwanichpong et al. [30], with the aim of broadening people’s awareness about the benefits of sediment resources, applied a new RUSLE-based technique to assess the benefit of sediment yield in Thailand.
However, the current study aimed to estimate the potential of applying the benefit-cost ratio approach to sediment resources in the Ping River Basin (PRB) using remote sensing data and a GIS technique. The goal this study is to present economic values on sediment for sustainable management of sediment resources at the PRB. In addition, the specific objectives of the study are to (1) estimate soil erosion and sediment deposition rates in the PRB, (2) broaden people’s knowledge on benefit of sediment resources, and (3) compare the positive and negative effect of soil erosion based on the benefit-cost ratio (BCR).
2. Study Area
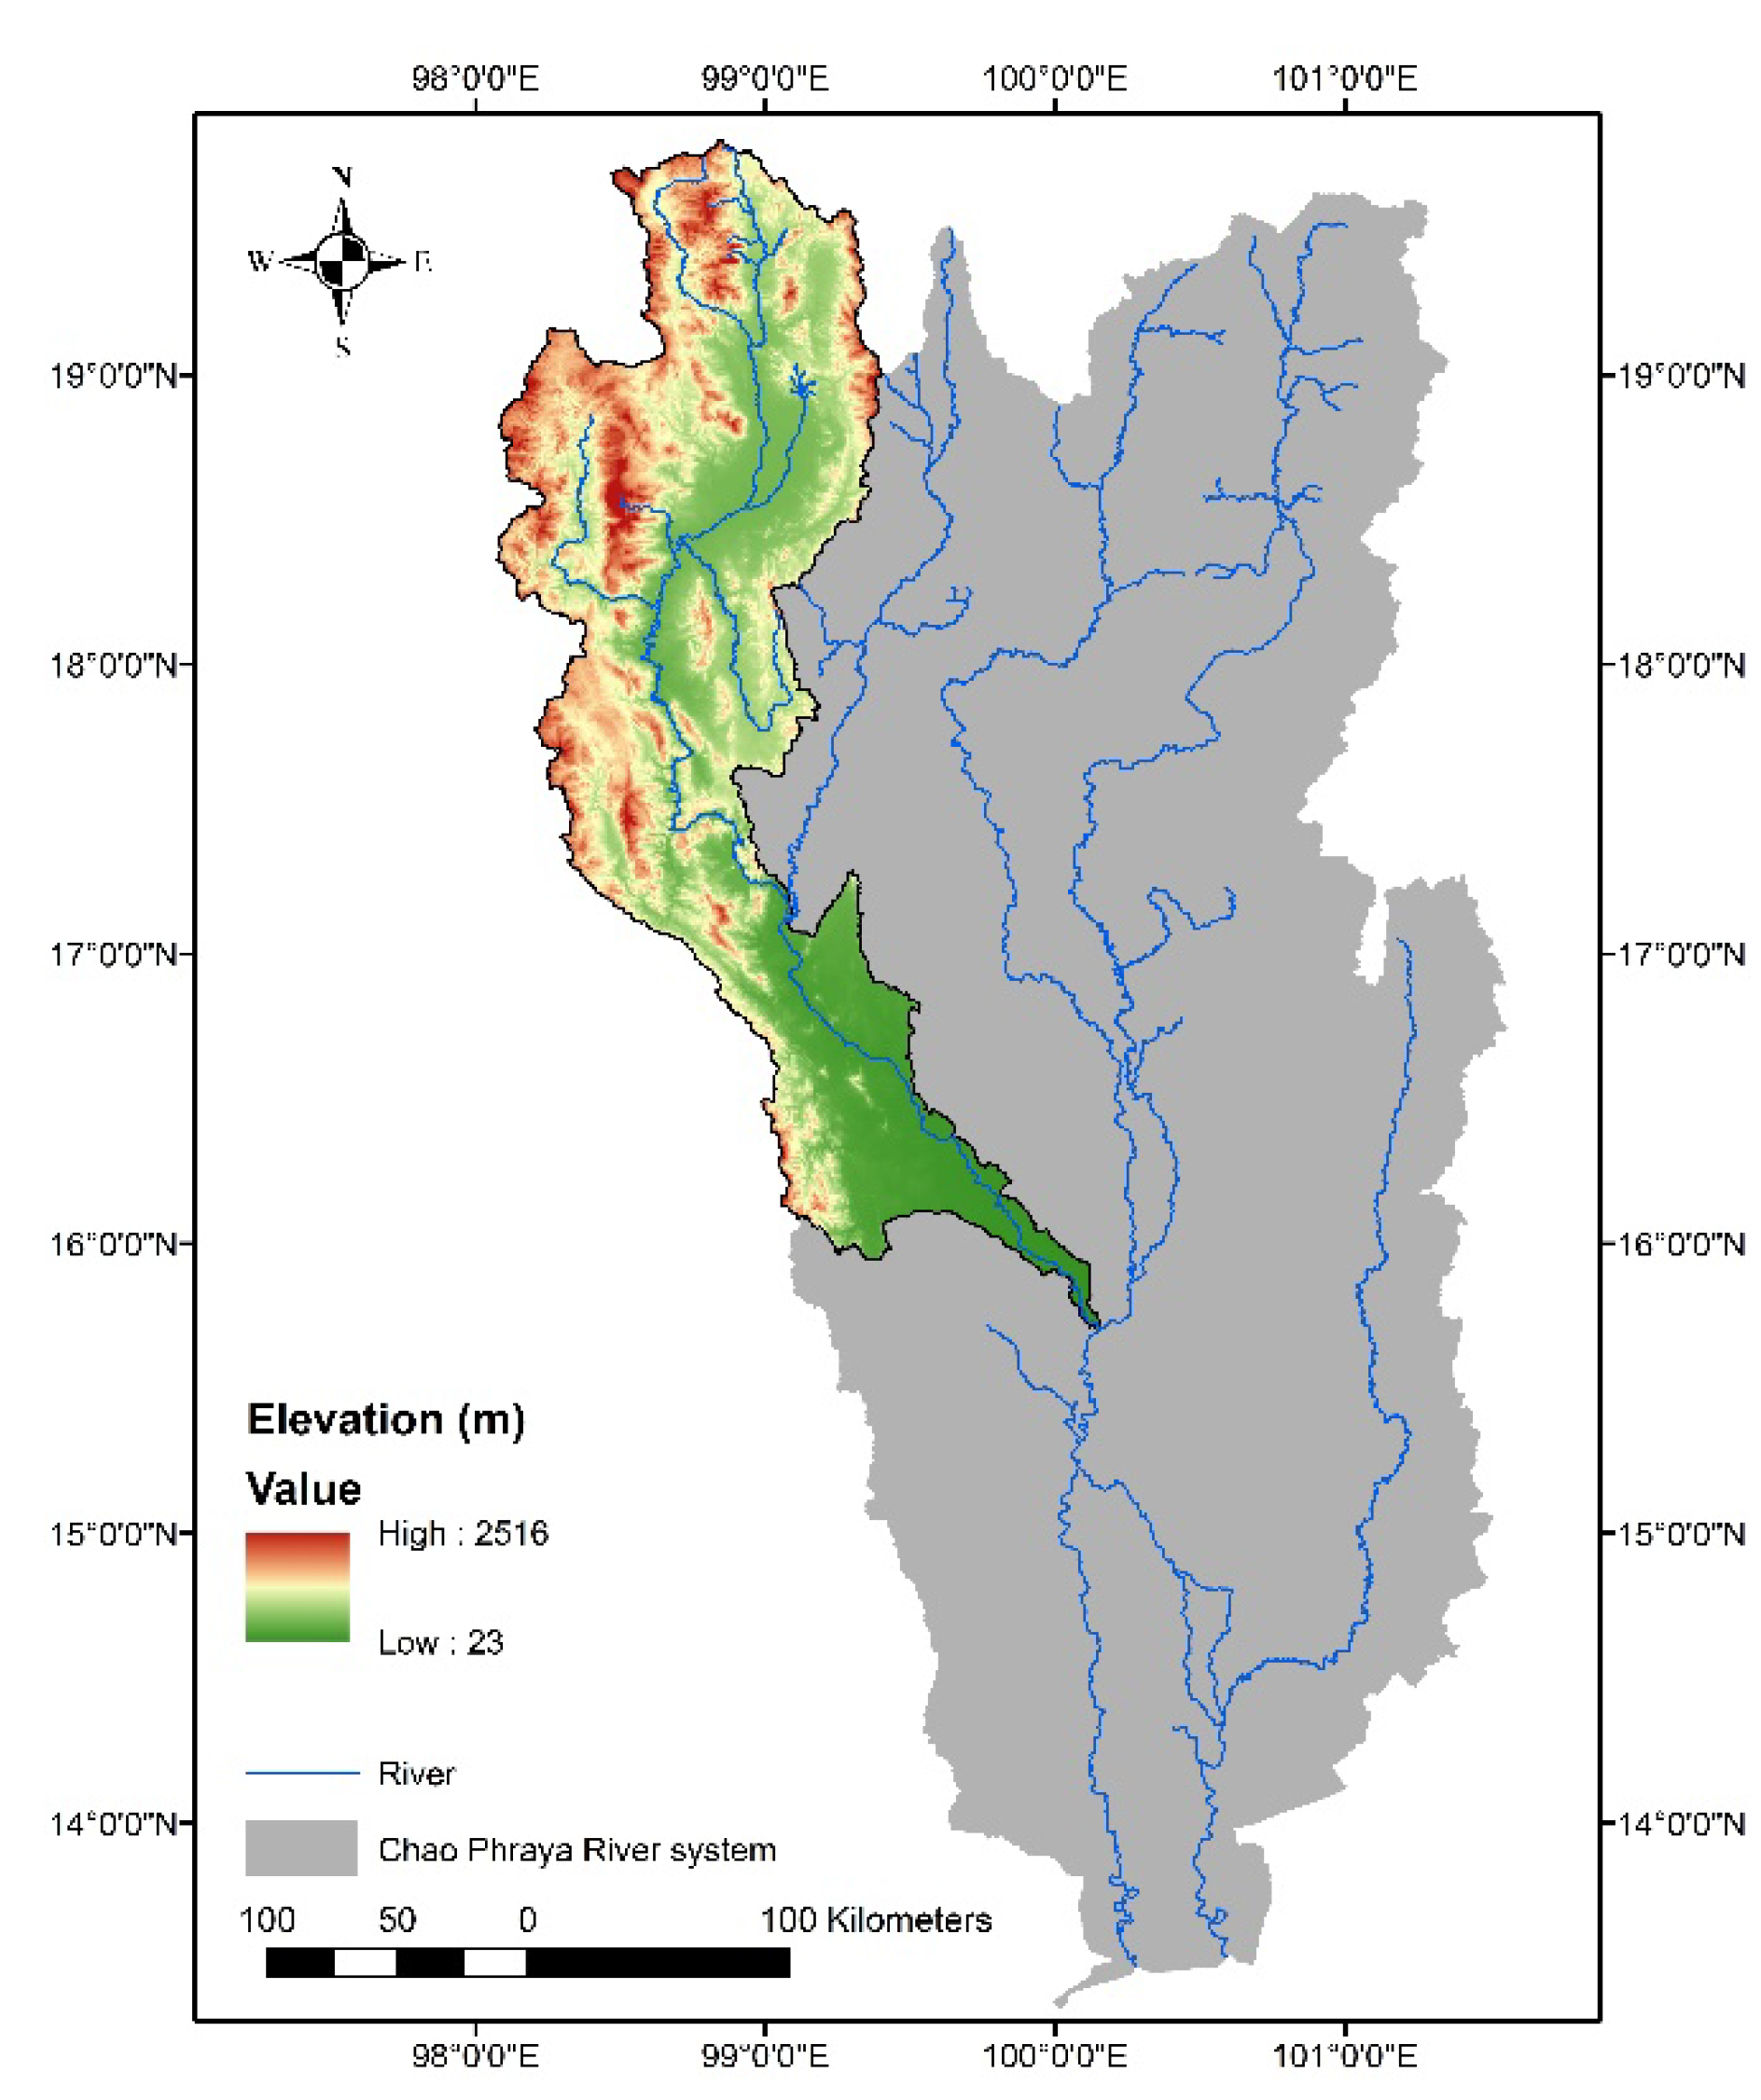
The Ping River Basin (PRB) is located in Northern Thailand, between latitudes 15.7° N and 19.8° N, and longitudes 98° E and 100.1° E. The PRB is the largest of the eight river basins which form the Chao Phraya River system. With the basin area of about 34,537 km2, the PRB covers approximately 22 percent of the Chao Phraya River system (Figure 1). The topography of PRB can be divided into three categories consisting of mountains and hills, lowland plains, and valleys. The length of the Ping River is approximately 740 km with its channel being from 150 to 350 m wide and its depth 5 to 15 m [31].
Furthermore, the average annual discharge of the Ping River is 62 m3/s, contributing around 24% of the total average annual river flow of the Chao Phraya River Basin [32].
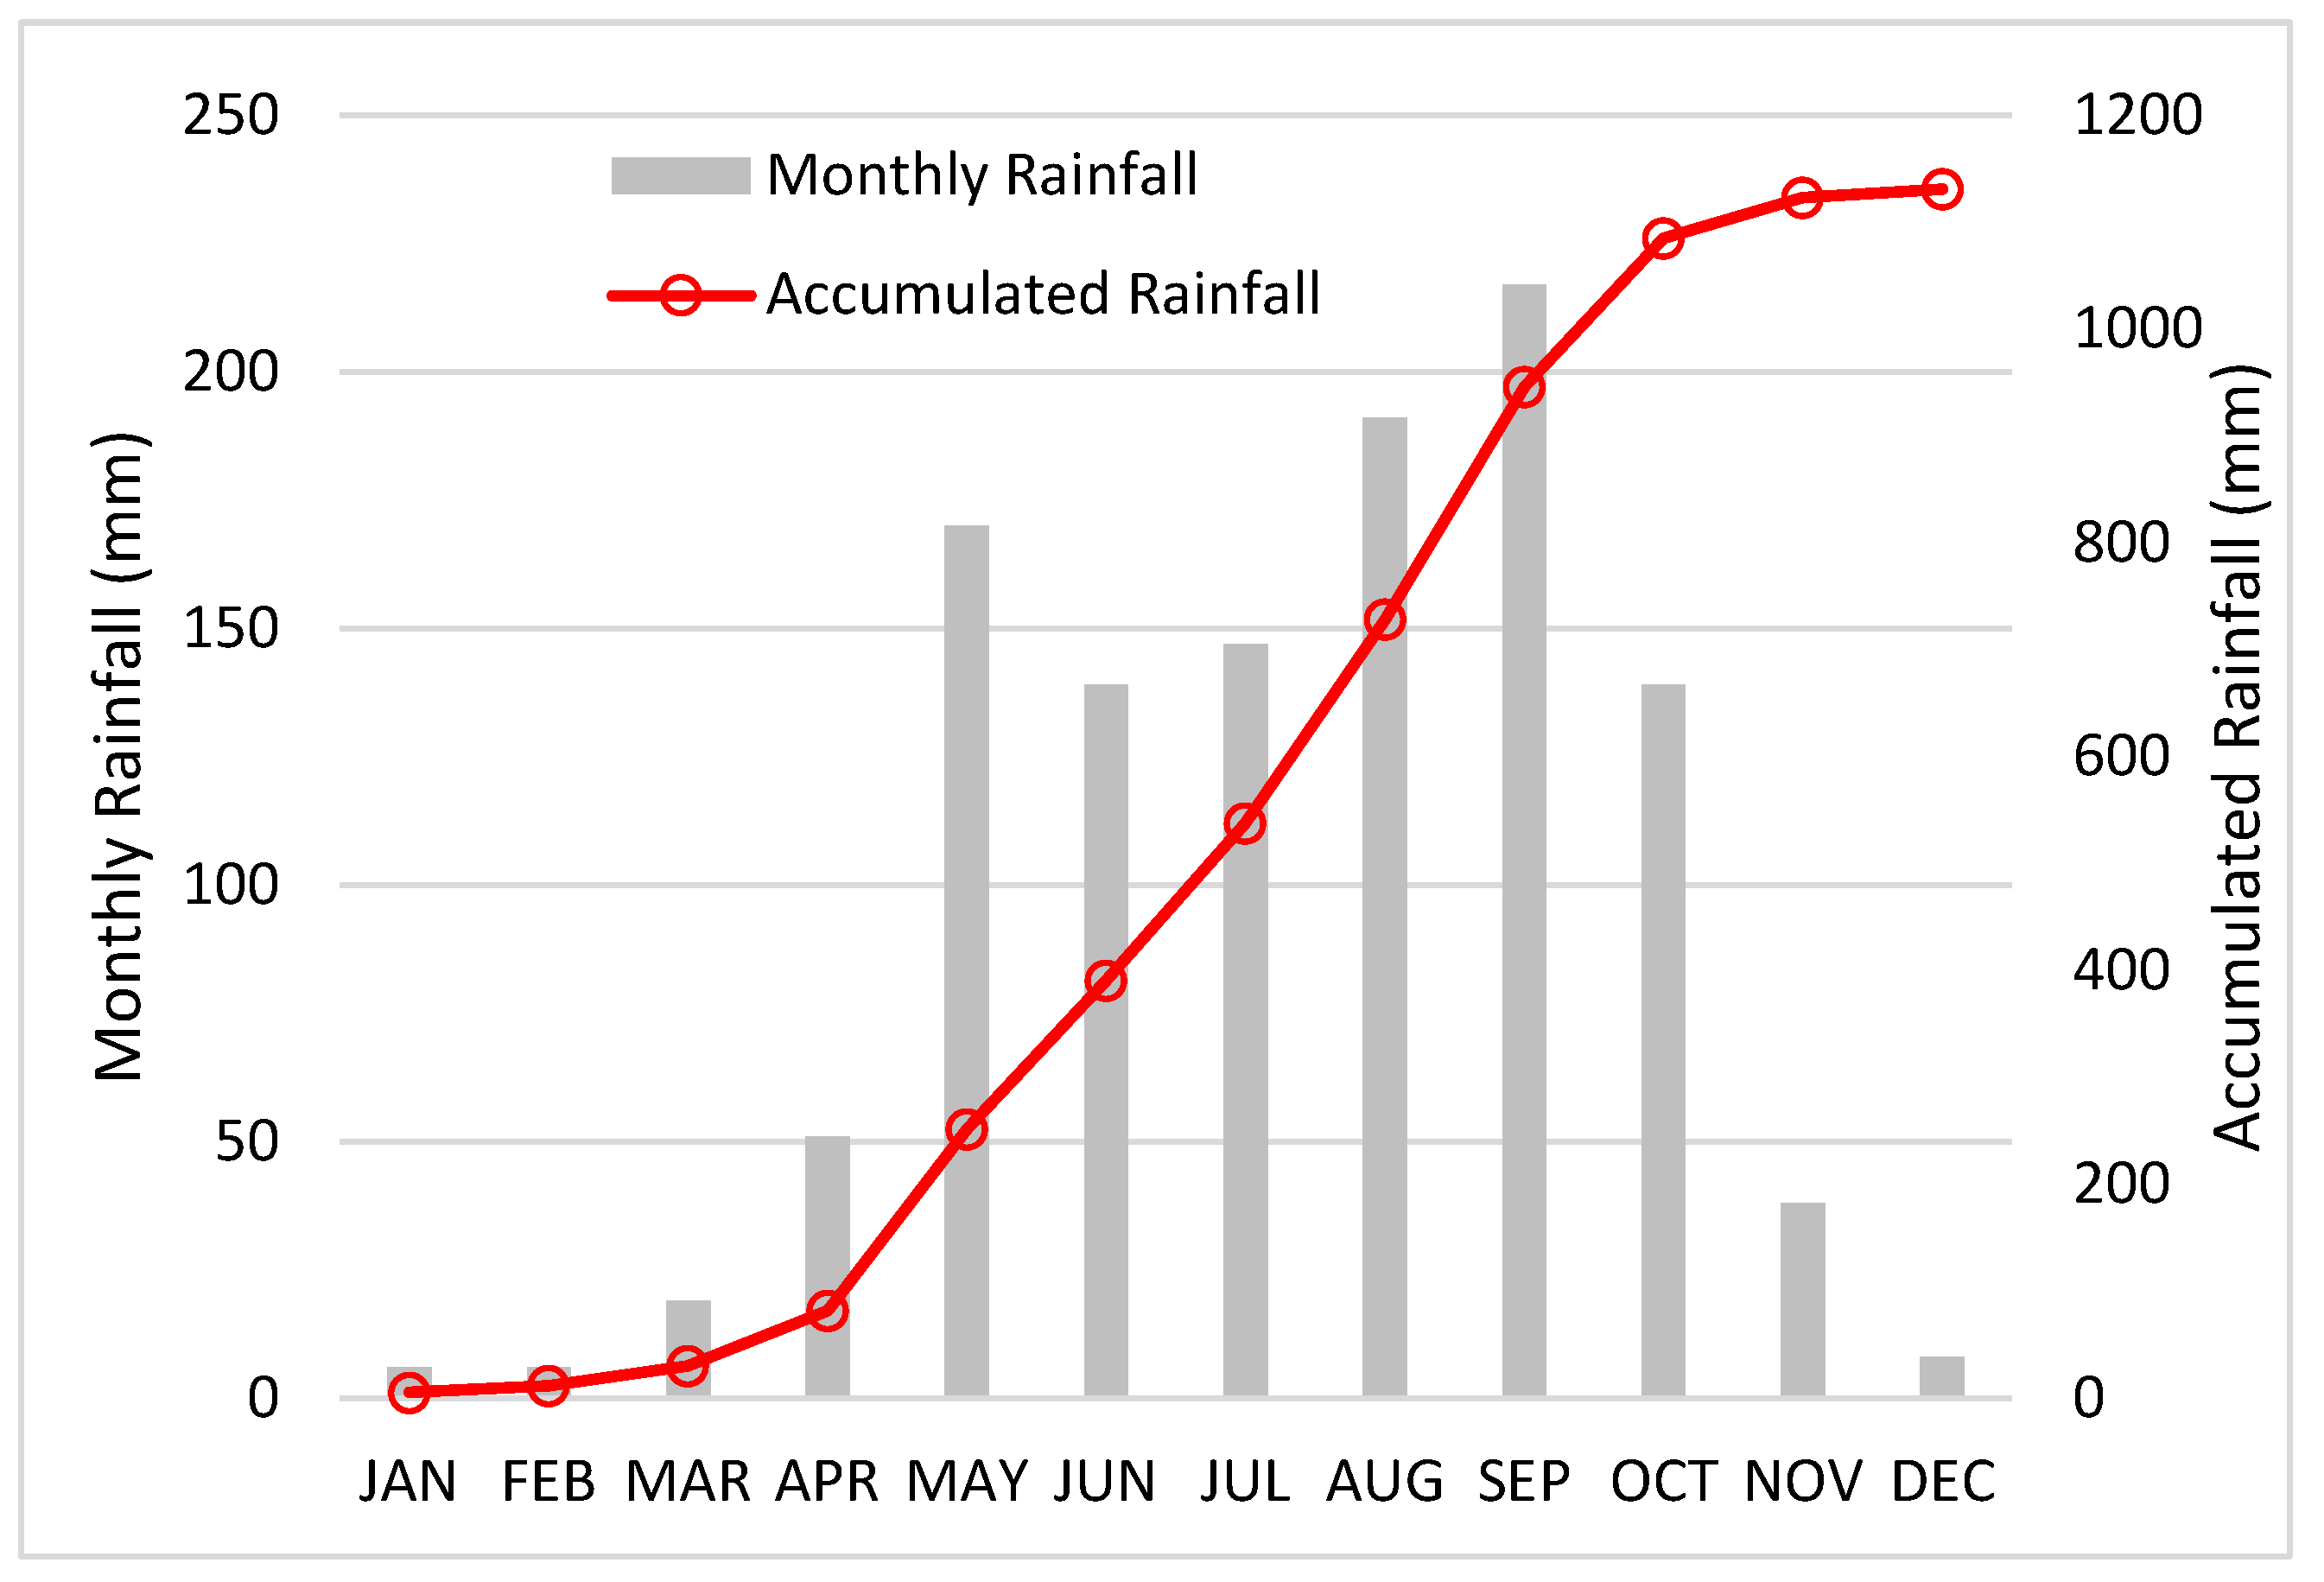
The climate of the PRB is influenced from the Northeast Monsoon in dry season (November to mid-March) and the Southwest Monsoon in wet season (mid-May to September) [33]. Under these conditions, the PRB has three characteristic seasons: (1) summer season (mid-February to mid-May), (2) rainy season (mid-May to October), and (3) winter season (November to mid-February). Annual rainfall in the PRB averages approximately 1131 mm, and more than 90% of rainfall occurs in the wet season [34]. The average monthly rainfall and accumulated rainfall in the PRB are shown in Figure 2.
3. Methods and Materials
This research aimed at analyzing the benefit-cost ratio of sediment resources using Geographic Information System (GIS) data to estimate the benefits and costs from sediment yield in the PRB. The RUSLE was applied to analyze soil erosion in each grid cell. The RUSLE method, based on the USLE, was developed by the US Department of Agriculture. The RUSLE has been broadly used for estimating average annual soil loss in mountains, forests, and agricultural area. The RUSLE is an empirical soil loss model which can be analyzed using Equation (1). The parameters of RUSLE were calculated using a separate equation, of which inputs were obtained from digital elevation model (DEM) and satellite imagery (Table 1).
where
A = R × K × LS × C × P
A is the mean annual soil loss per unit area (Mg/ha∙y);
R is the rainfall erosivity factor (MJ∙mm/ha∙h∙y);
K is the soil erodibility factor (Mg∙h/MJ∙mm);
LS is the topographic factor (dimensionless);
C is the cover-management factor (dimensionless);
P is the conservation practice factor (dimensionless).
The rainfall erosivity factor (R) was analyzed using rainfall data during 2000–2020 (20 years) based on the recommended equation from the Land Development Department of Thailand [35]:
where R is the rainfall erosivity factor and Pr is the mean annual rainfall (mm).
R = (0.4669 × Pr) − 12.141559
The topographic factor (LS) was calculated based on the RUSLE principle using a GIS technique described in previous research. Specifically, the L factor was computed using Equation (3):
In addition, the S factor was estimated using the two conditions:
where is the length of slope, is the degree of slope, L is the slope length factor, and S is the steepness factor.
The conservation practice factor (P) describes the effect of land cover and land use on soil erosion. In this research, the P factor values were used from Wischmeier and Smith [38], where values were classified into six slope categories for crop areas, as shown in Table 2.
Furthermore, the cover-management factor (C) expresses the effect of vegetation cover on soil erosion process. We generated the mean of the Normalized Difference Vegetation Index (NDVI) from the time series MODIS images data for 20 years and used it to estimate the C factor map as shown in Equation (7) and based on [39]:
C = (−0.7388 × NDVI) + 0.4948
The NDVI is an indicator of the green vegetation density which is estimated using the difference between the spectral reflectance values of the near-infrared (NIR) and red (RED) bands of electromagnetic spectrum, as shown in Equation (8):
The erodibility factor (K) expresses the effect of water flow and the soil resistance to particle movement. In previous research, the erodibility factor values varied between 0 to 1 Mg∙h/MJ∙mm [40,41,42,43,44,45,46,47,48,49,50,51,52,53,54,55,56,57]. The soil properties, such as chemistry, texture, organic matter content, and calcium carbonate contents, are very important in the determination of soil erodibility [58]. The USLE and RUSLE K-factor did not consider lime and carbonate contents, which are the most important factors in calcareous soil area of Thailand. As mentioned above, the USLE and RUSLE K-factor models were developed in the United States soil with no carbonate content under heavy rainfall situation [59]. Therefore, using these values in Southeast Asia, where the tropical climate and soil have a high amount of carbonate that makes strong and large soil aggregates, provides poor results for predicting the K factor.
Generally, carbonate rocks are present on all continents. The largest carbonate rock area is found on the largest continent, Asia, where 8.35 million km2 continuous, discontinuous, or mixed carbonate rocks are present, corresponding to 18.6% of Asia’s land surface [60]. In Southeast Asia, limestones cover an area of around 400,000 km2, which are most widespread in Vietnam, Thailand, and Indonesia [61]. Recently, Ostovari et al. [59] indicated that the soil erodibility factor of the Middle East varied from 0.14 to 0.32 Mg∙h/MJ∙mm. Pham et al. [62] analyzed soil erosion in central Vietnam, where soil erodibility varied from 0.18 to 0.32 Mg∙h/MJ∙mm. In Cambodia, the soil erodibility values ranged from 0.26 to 0.3 Mg∙h/MJ∙mm [63].
Therefore, K factors were collected from experiments and field tests from the Land Development of Thailand (LDD).
The estimated sediment yield and sediment deposition were estimated using GIS data and spatial analysis. In addition, sediment yield and sediment deposition were analyzed using a new technique developed by Rangsiwanichpong et al. [17]. Rangsiwanichpong et al. [17] suggested a new technique for estimating sediment yield and sediment deposition in Thailand by modifying the original RUSLE model. They considered the suspended sediment flow from one grid cell to another downstream grid cell as dependent on the sediment yield of the original grid cell from RUSLE method () compared with the sediment yield capacity of the whole catchment (). Sediment capacity is defined as the maximum yield of sediment that is retained in each catchment based on the erosion model. The method can detect soil erosion or sediment deposition areas, respectively, when the actual sediment yield is above or below the sediment capacity. The new technique for sediment yield and deposition analysis can be described using Equations (9)–(12):
where is the sediment yield, is the sediment capacity, represents the parameters in the RUSLE model, is the area of the sub-basin, is the number of datapoints in each sub-basin, is the deposition in cell , and is the degradation in cell .
In addition, this research attempted to estimate sediment costs and benefit. For sediment costs, we integrated the costs of sediment from environmental costs based on research by Schwegler [36]. The environmental costs caused by food wastage were estimated from biodiversity loss and change in ecosystem services. The dredging costs were calculated by the labor costs from the Royal Irrigation Department (RID).
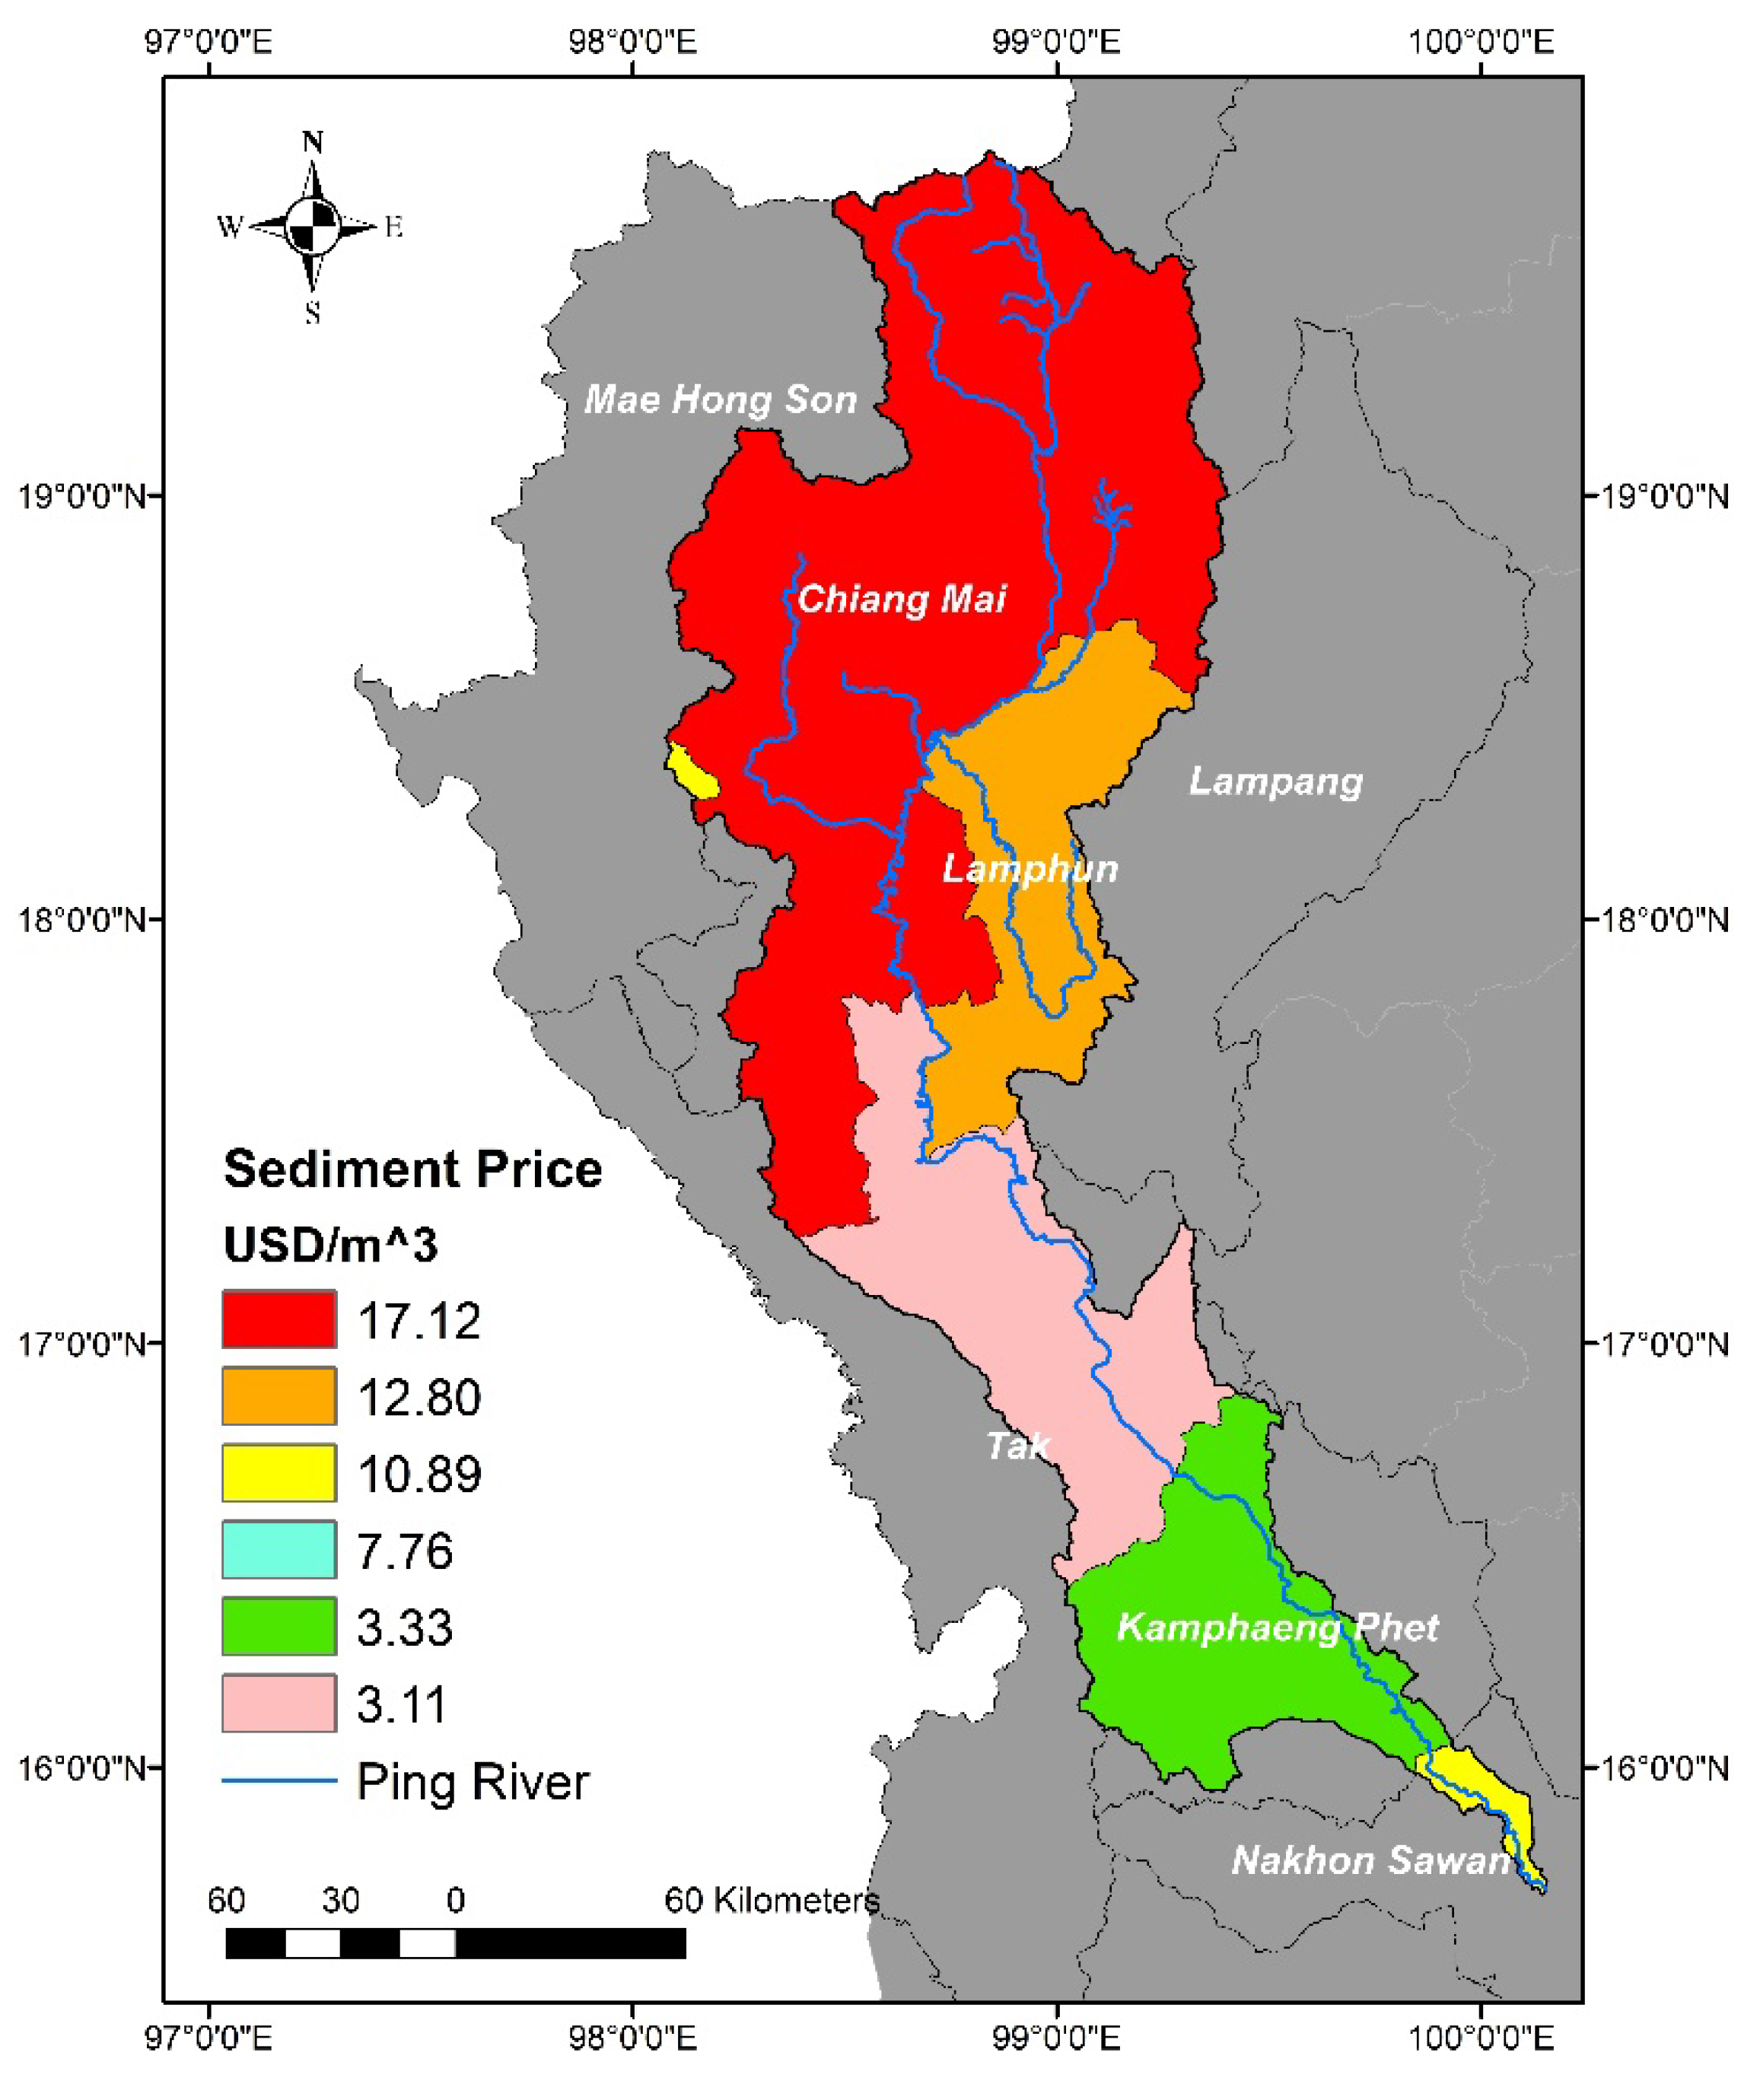
For sediment benefits, the value of direct benefit of sediment was based on the sediment price in each province (Figure 3, Table 3), collected by the Ministry of Commerce [64]. The equation for calculating the sediment cost and sediment benefit are defined in Equation (13) and Equation (14), respectively.
where is the sediment costs (USD/m3), is the environment costs (USD/m3), is the dredging costs (USD/m3), is the volume of sediment (m3/km2), is the benefit of sediment (USD/m3), and is the sediment price in each province (USD/m3).
This research aimed to evaluate the potential of the BCR in a sediment resource project in the PRB area using spatial analysis. The standard BCR formula is fairly simple, as shown in Equation (15):
where is the benefit-cost ratio, is the benefit of sediment in cell , and is the cost of sediment in cell .
In economic terms, if the costs exceed the benefits, then, solely based on this criterion, the project should not proceed. Where the costs equal the benefits, the project should be allowed to proceed, but with little viability. Where the benefits exceed the costs, the project should be allowed to proceed. In the current research, the analysis of sediment benefit and cost, in the PRB, was based on the concept of Rangsiwanichpong’s method [17].
4. Results
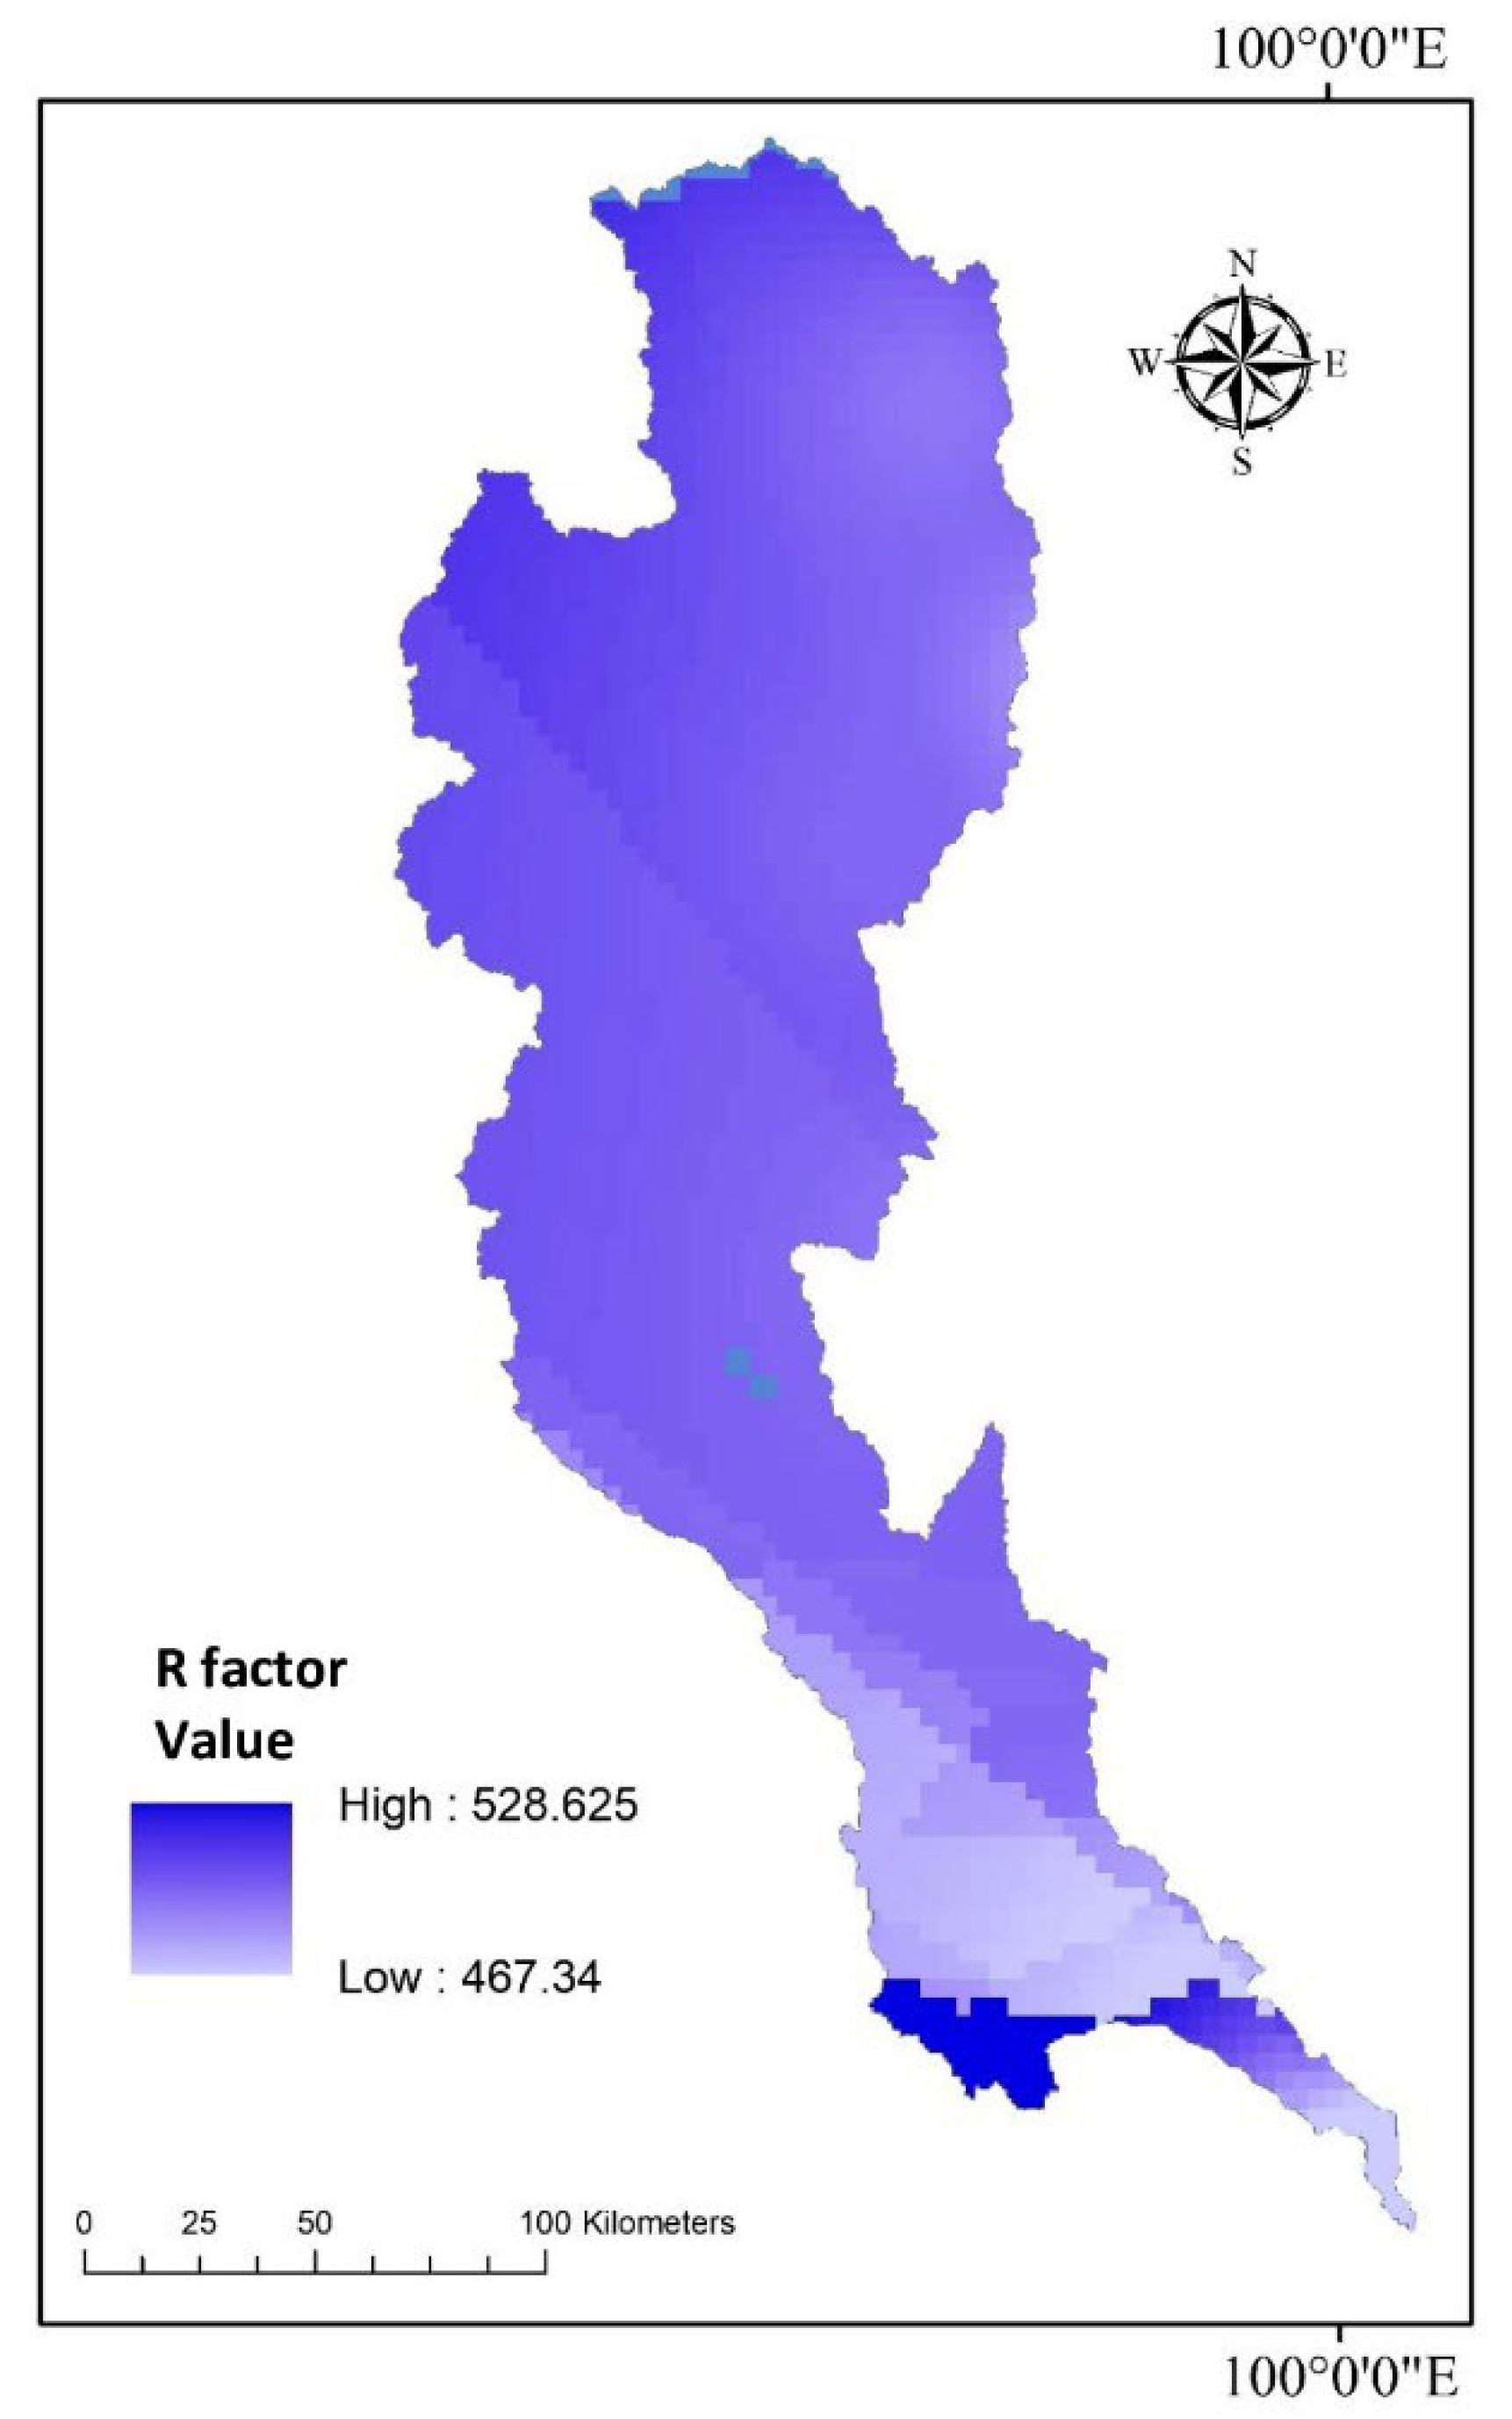
The soil erosion map for the PRB was analyzed using the RUSLE model and GIS data to determine the average annual soil loss. The potential of soil loss was estimated on the basis of five parameters (R, LS, C, K, P) presented in Equation (1). First, the erosivity factor (R) was estimated using annual precipitation data at meteorological stations and then interpolated based on the inverse distance weighted method for 2000–2020. The erosivity factor was in the range 467–528 MJ·mm/ha·h·y (Figure 4).
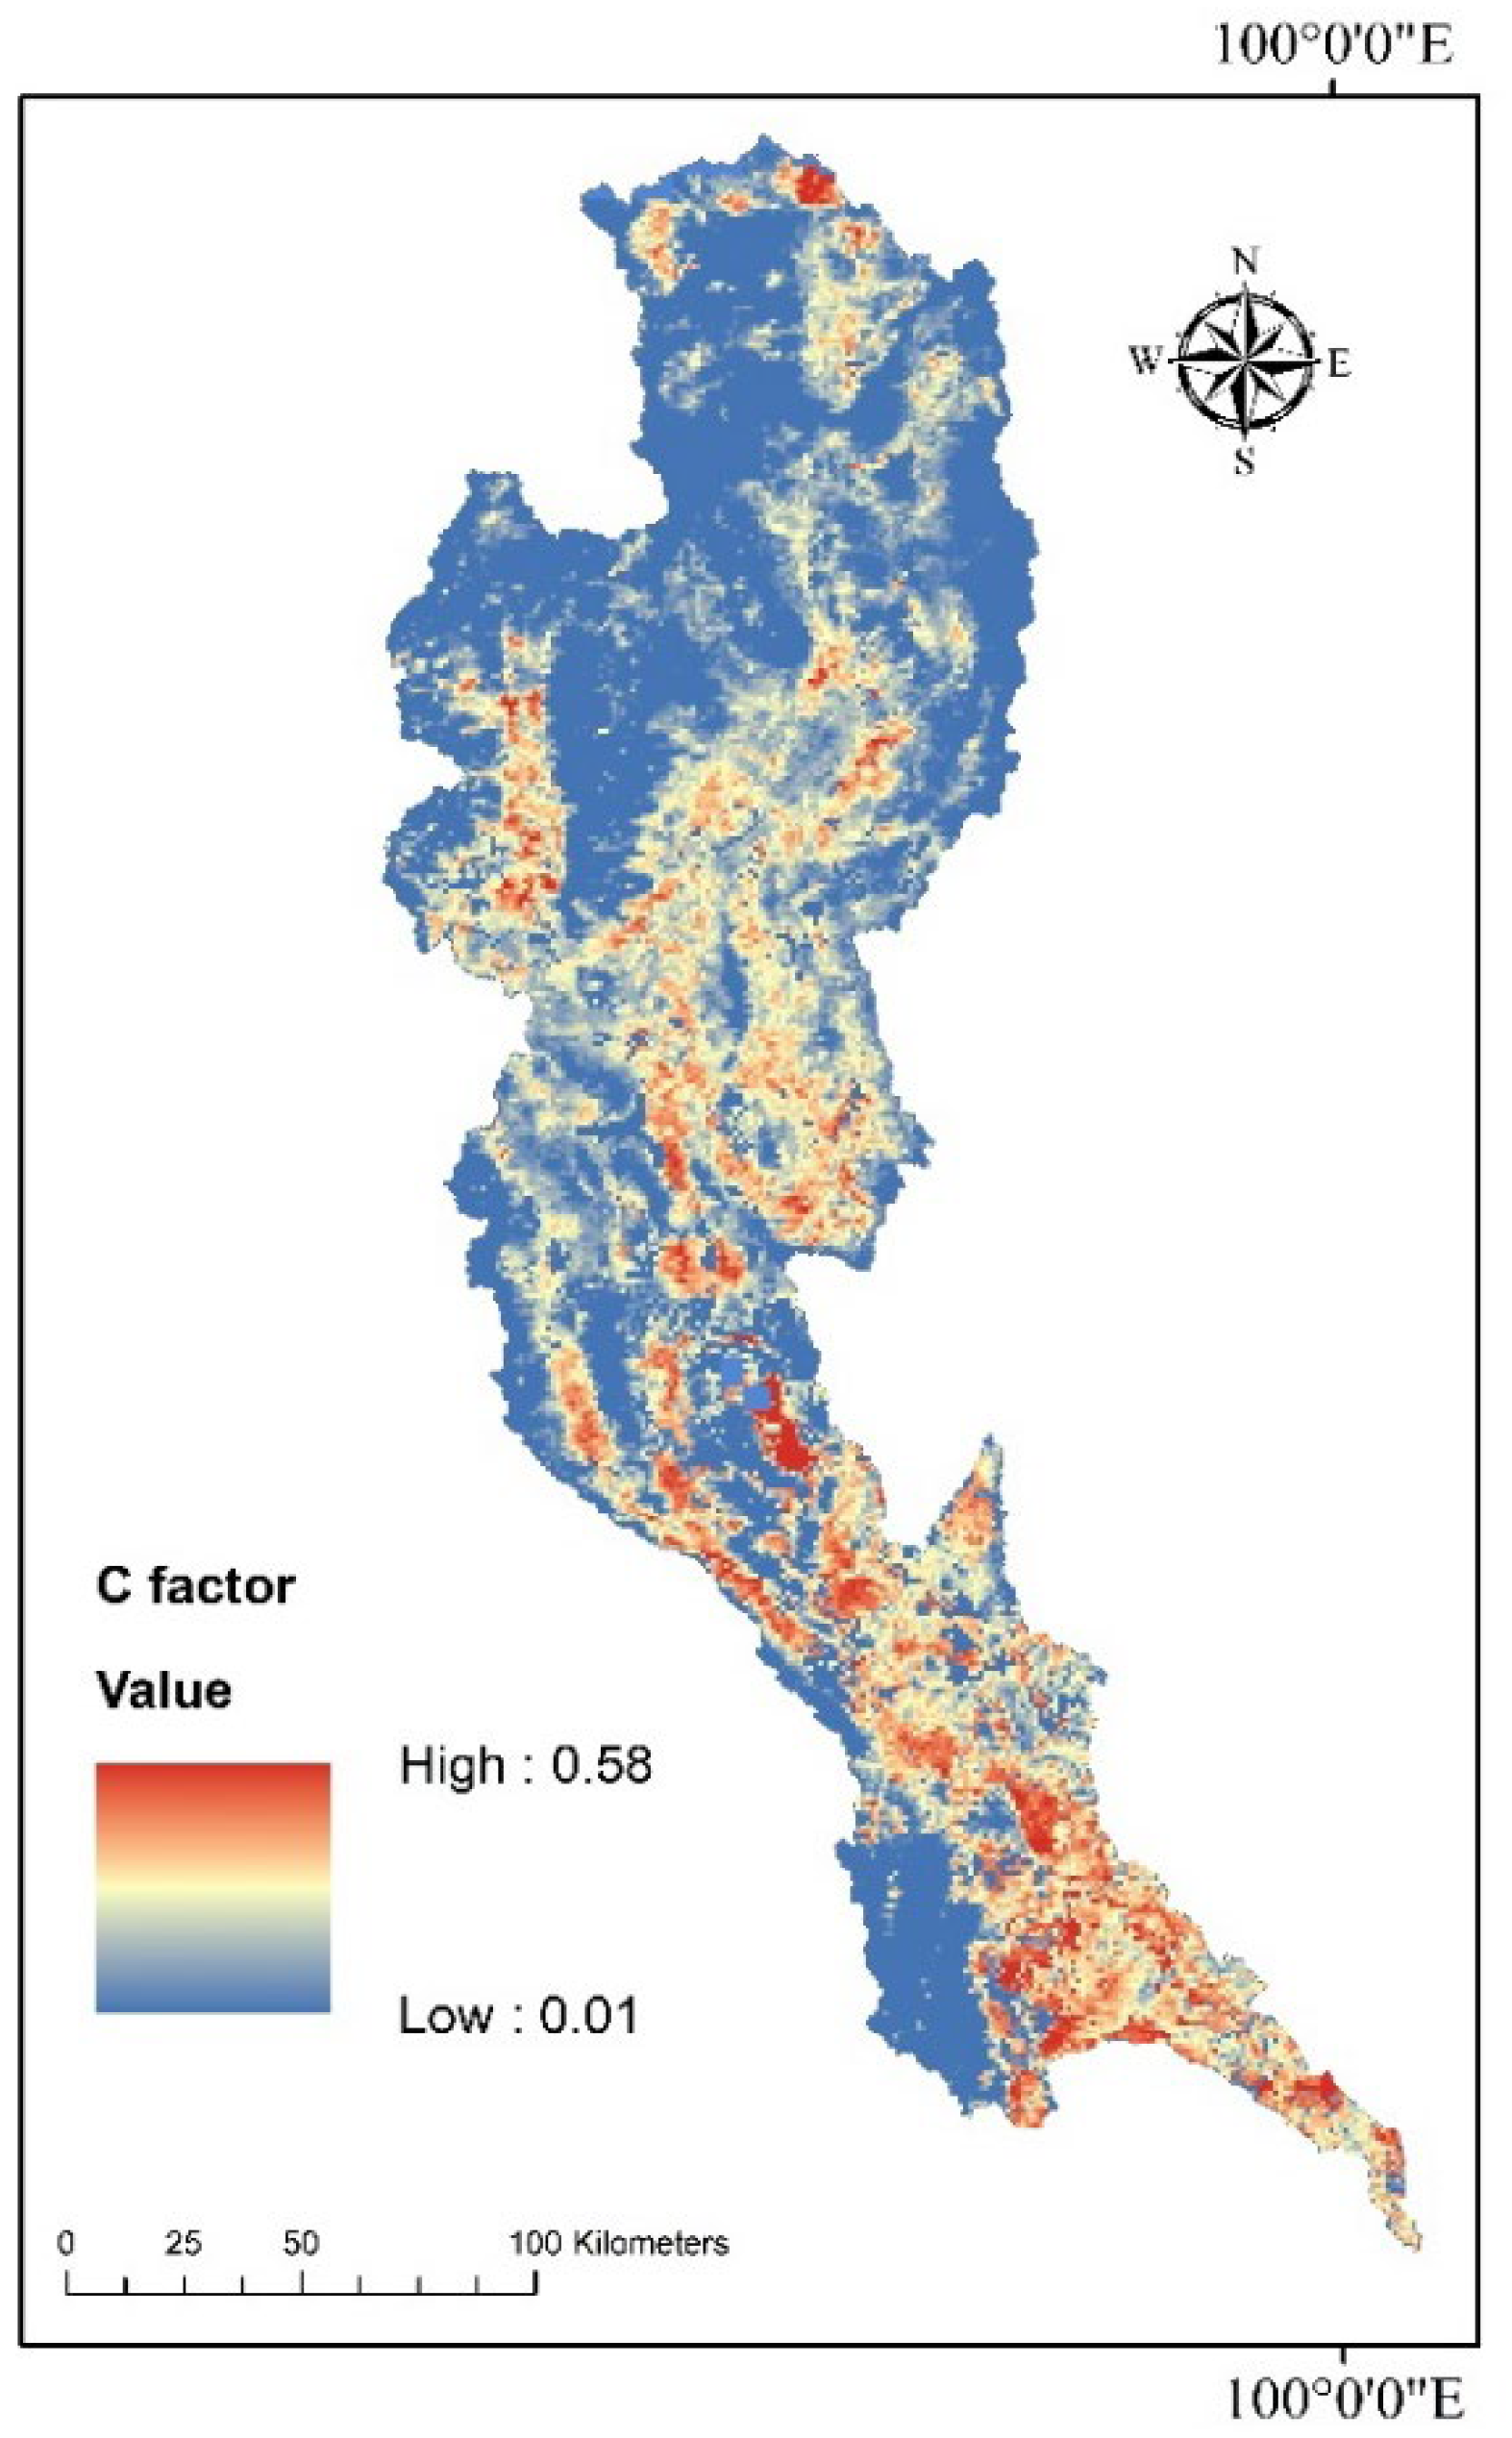
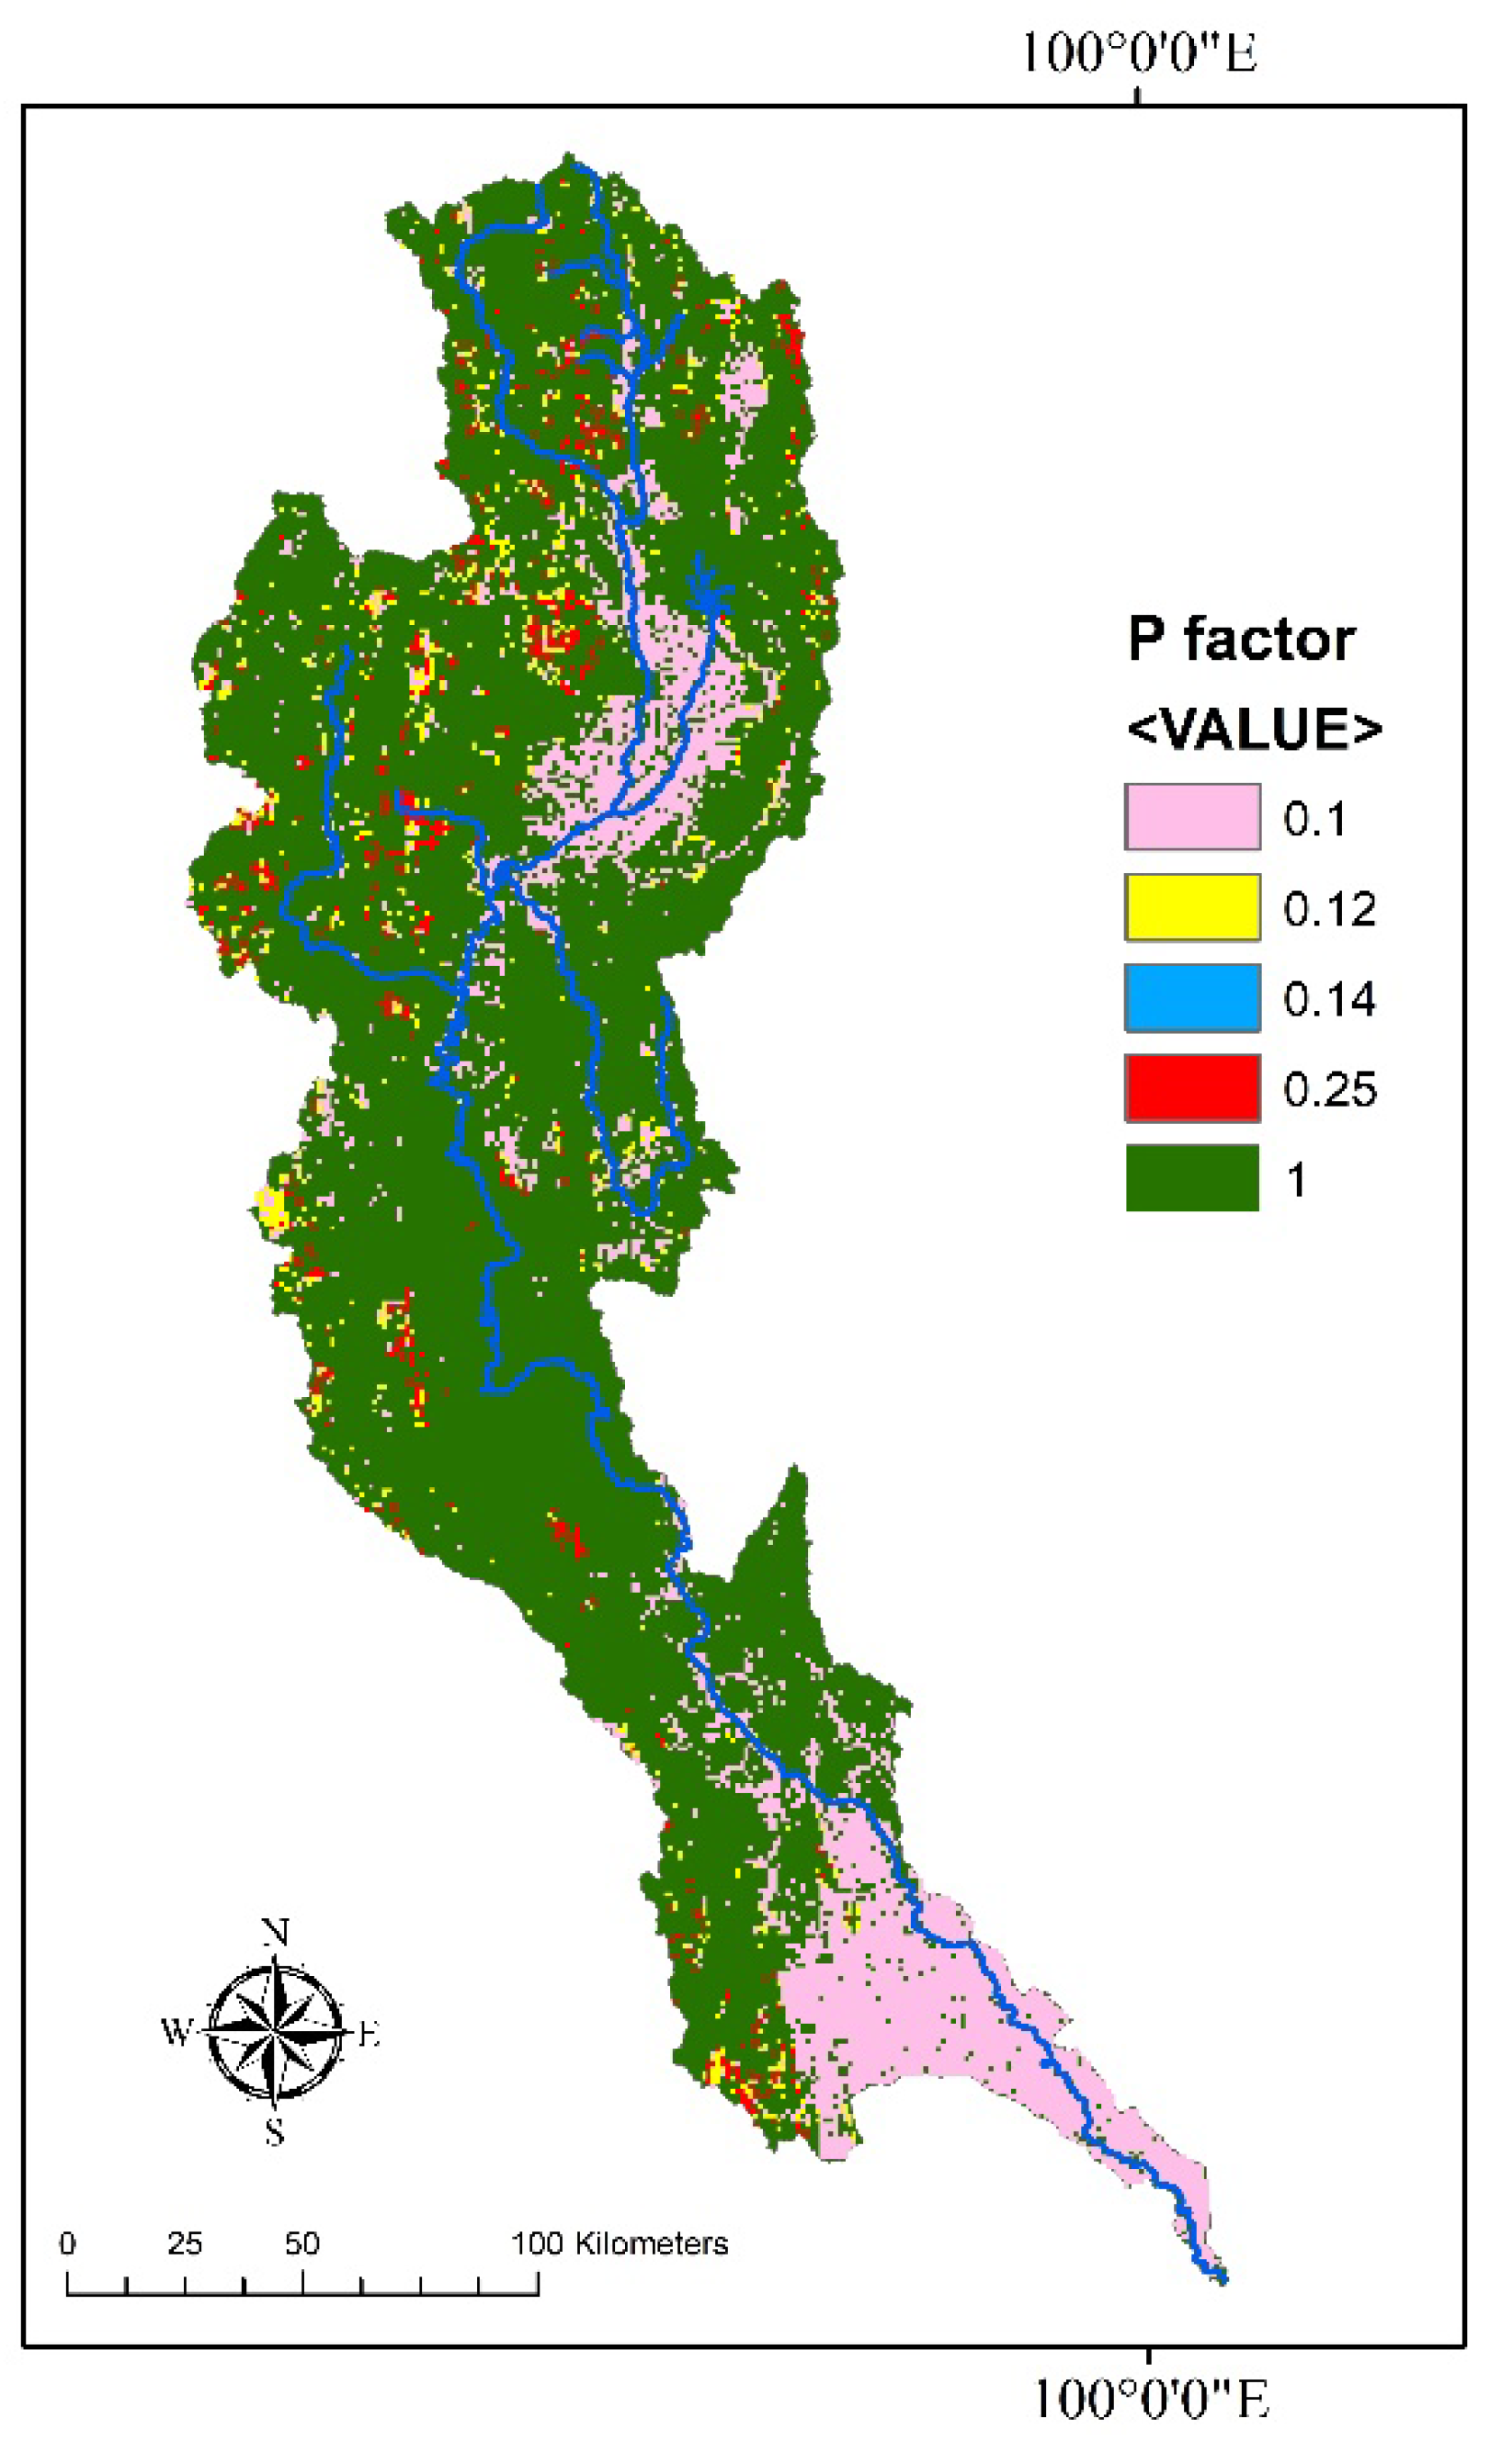
The erodibility factor (K) depends on the soil type data which were collected from the Land Development Department (LDD) of Thailand. The standard K values recommended by LDD were 0.05, 0.19, and 0.3 for clay, silt, and sand, respectively (Figure 5). Furthermore, the topographic factor was based on the topographic data of the PRB and Equations (3)–(6). The LS factor was in the range of 0.03–346 (Figure 6). The high values for the topographic factor were in the mountains of the PRB. In this research, the C factor was calculated from the relationship between the cover-management factor and the NDVI data. Higher C values indicate sparse vegetation cover and therefore greater runoff and soil erosion potential. The results showed that the range for the C factor was between 0.01 and 0.58 (Figure 7). The P factor values from Wischmeier and Smith (1987) [38] were approximately equal to 1 mostly in the upstream area of the PRB (Figure 8), which indicated that erosion management practices have not been applied in these areas.
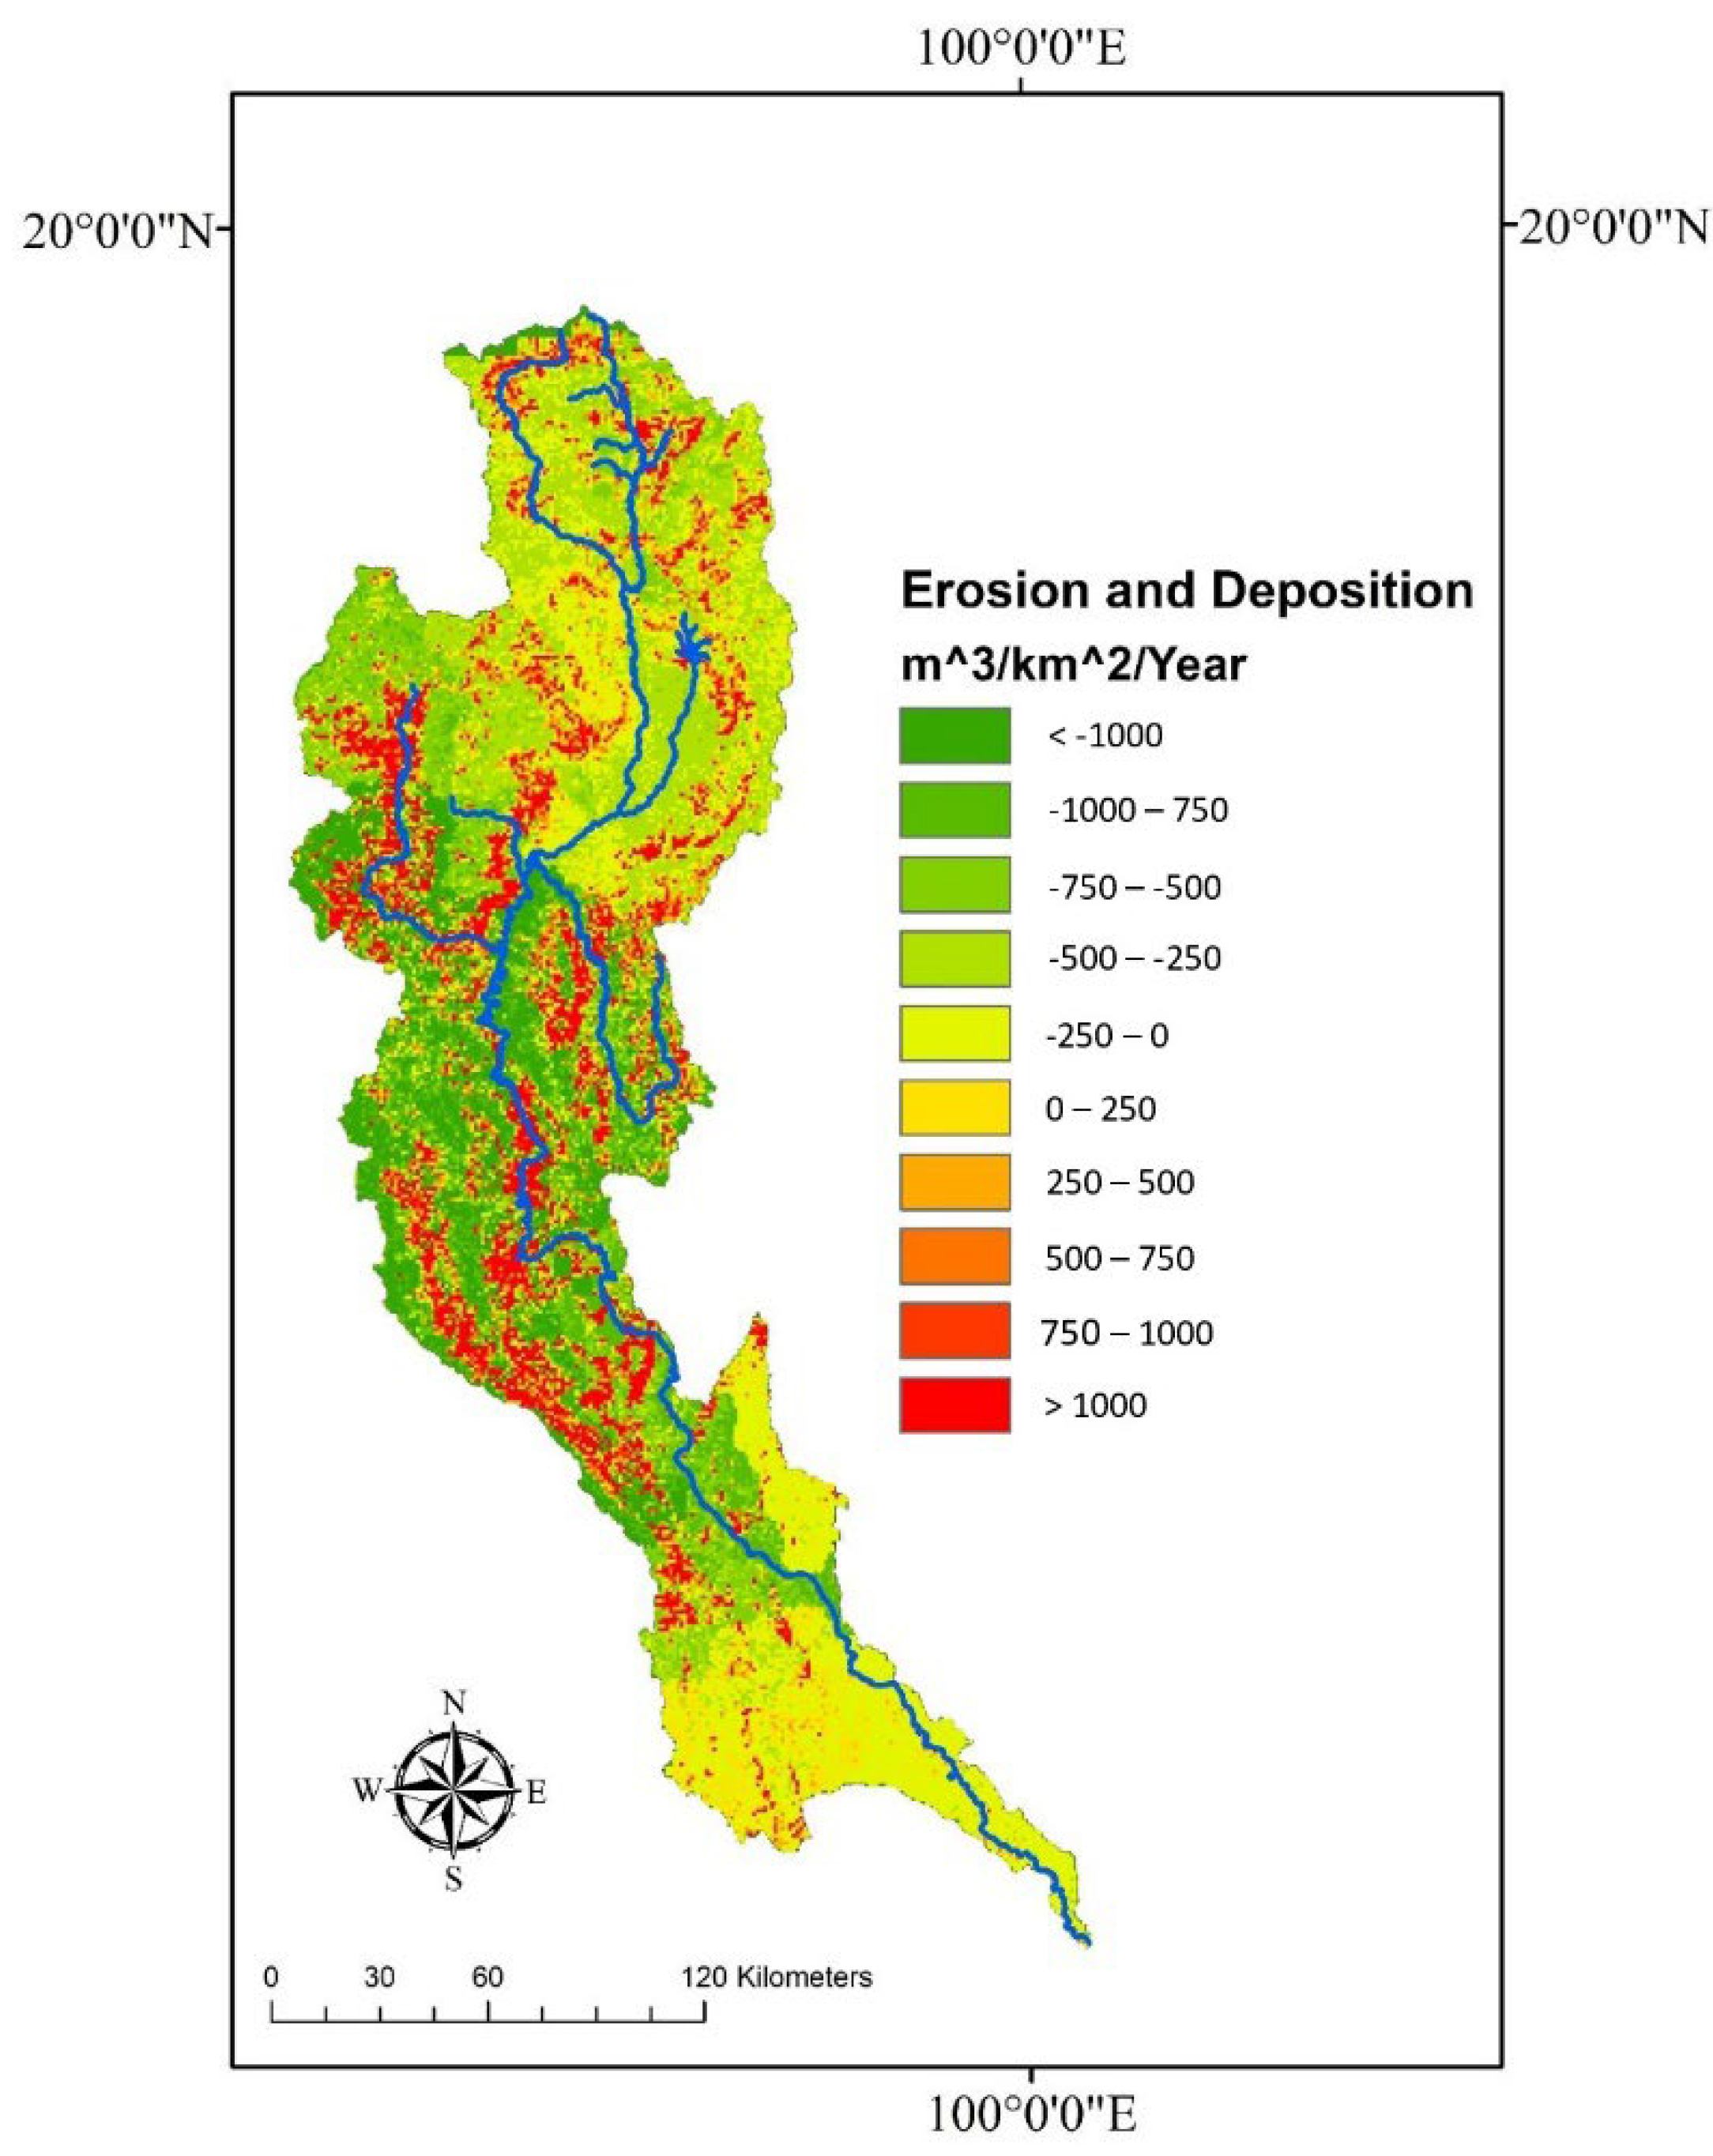
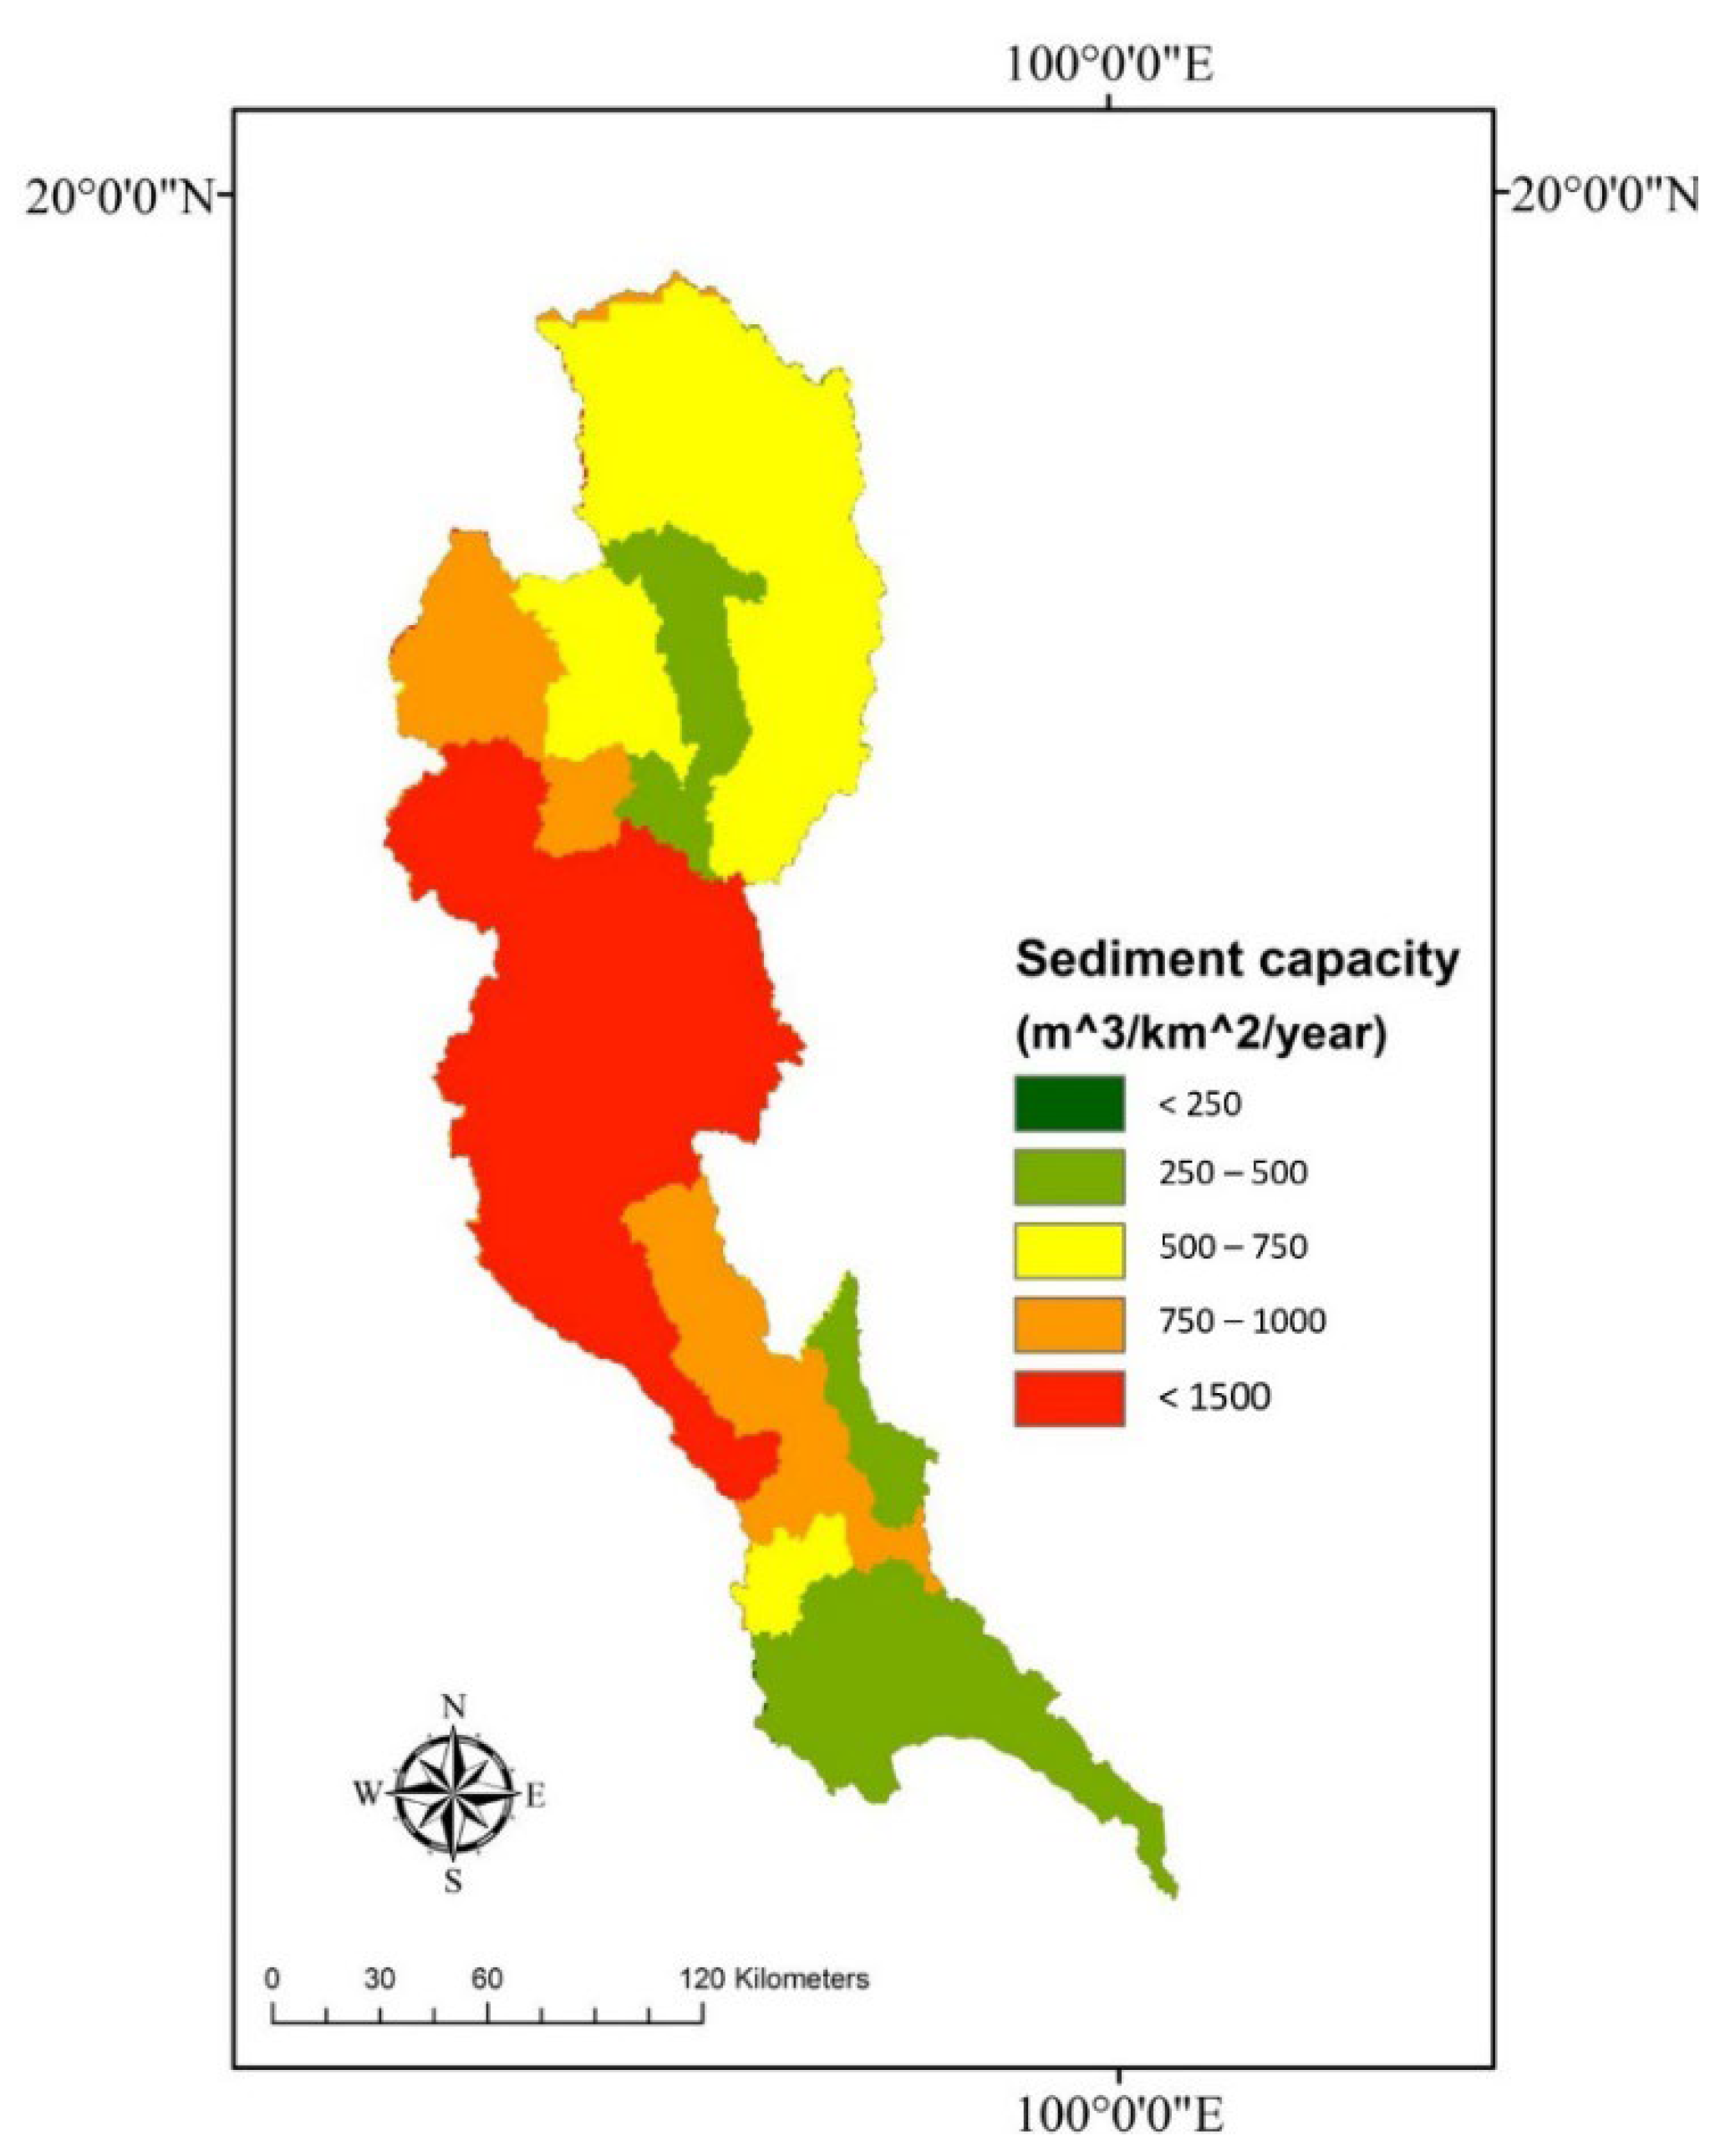
Thus, all the parameters of the RUSLE method were computed for annual soil erosion and sediment capacity in the PRB area are shown in Figure 9 and Figure 10, respectively. Based on the results, the positive and negative values can indicate the zones of soil erosion and sediment deposition, respectively. The soil erosion risk map indicated that the annual soil erosion in the PRB was approximately 825 m3/km2·y. Mostly, the higher rates of soil erosion occurred in the mountainous area of the PRB. In sediment deposition analysis, it is difficult to estimate sediment deposition using GIS data. However, according to the new method described by Rangsiwanichpong et al. [17], the potential annual sediment deposition in the PRB was 530 m3/km2·y, with greater deposition in the middle area of basin, especially in the Bhumibol Dam area (Figure 9).
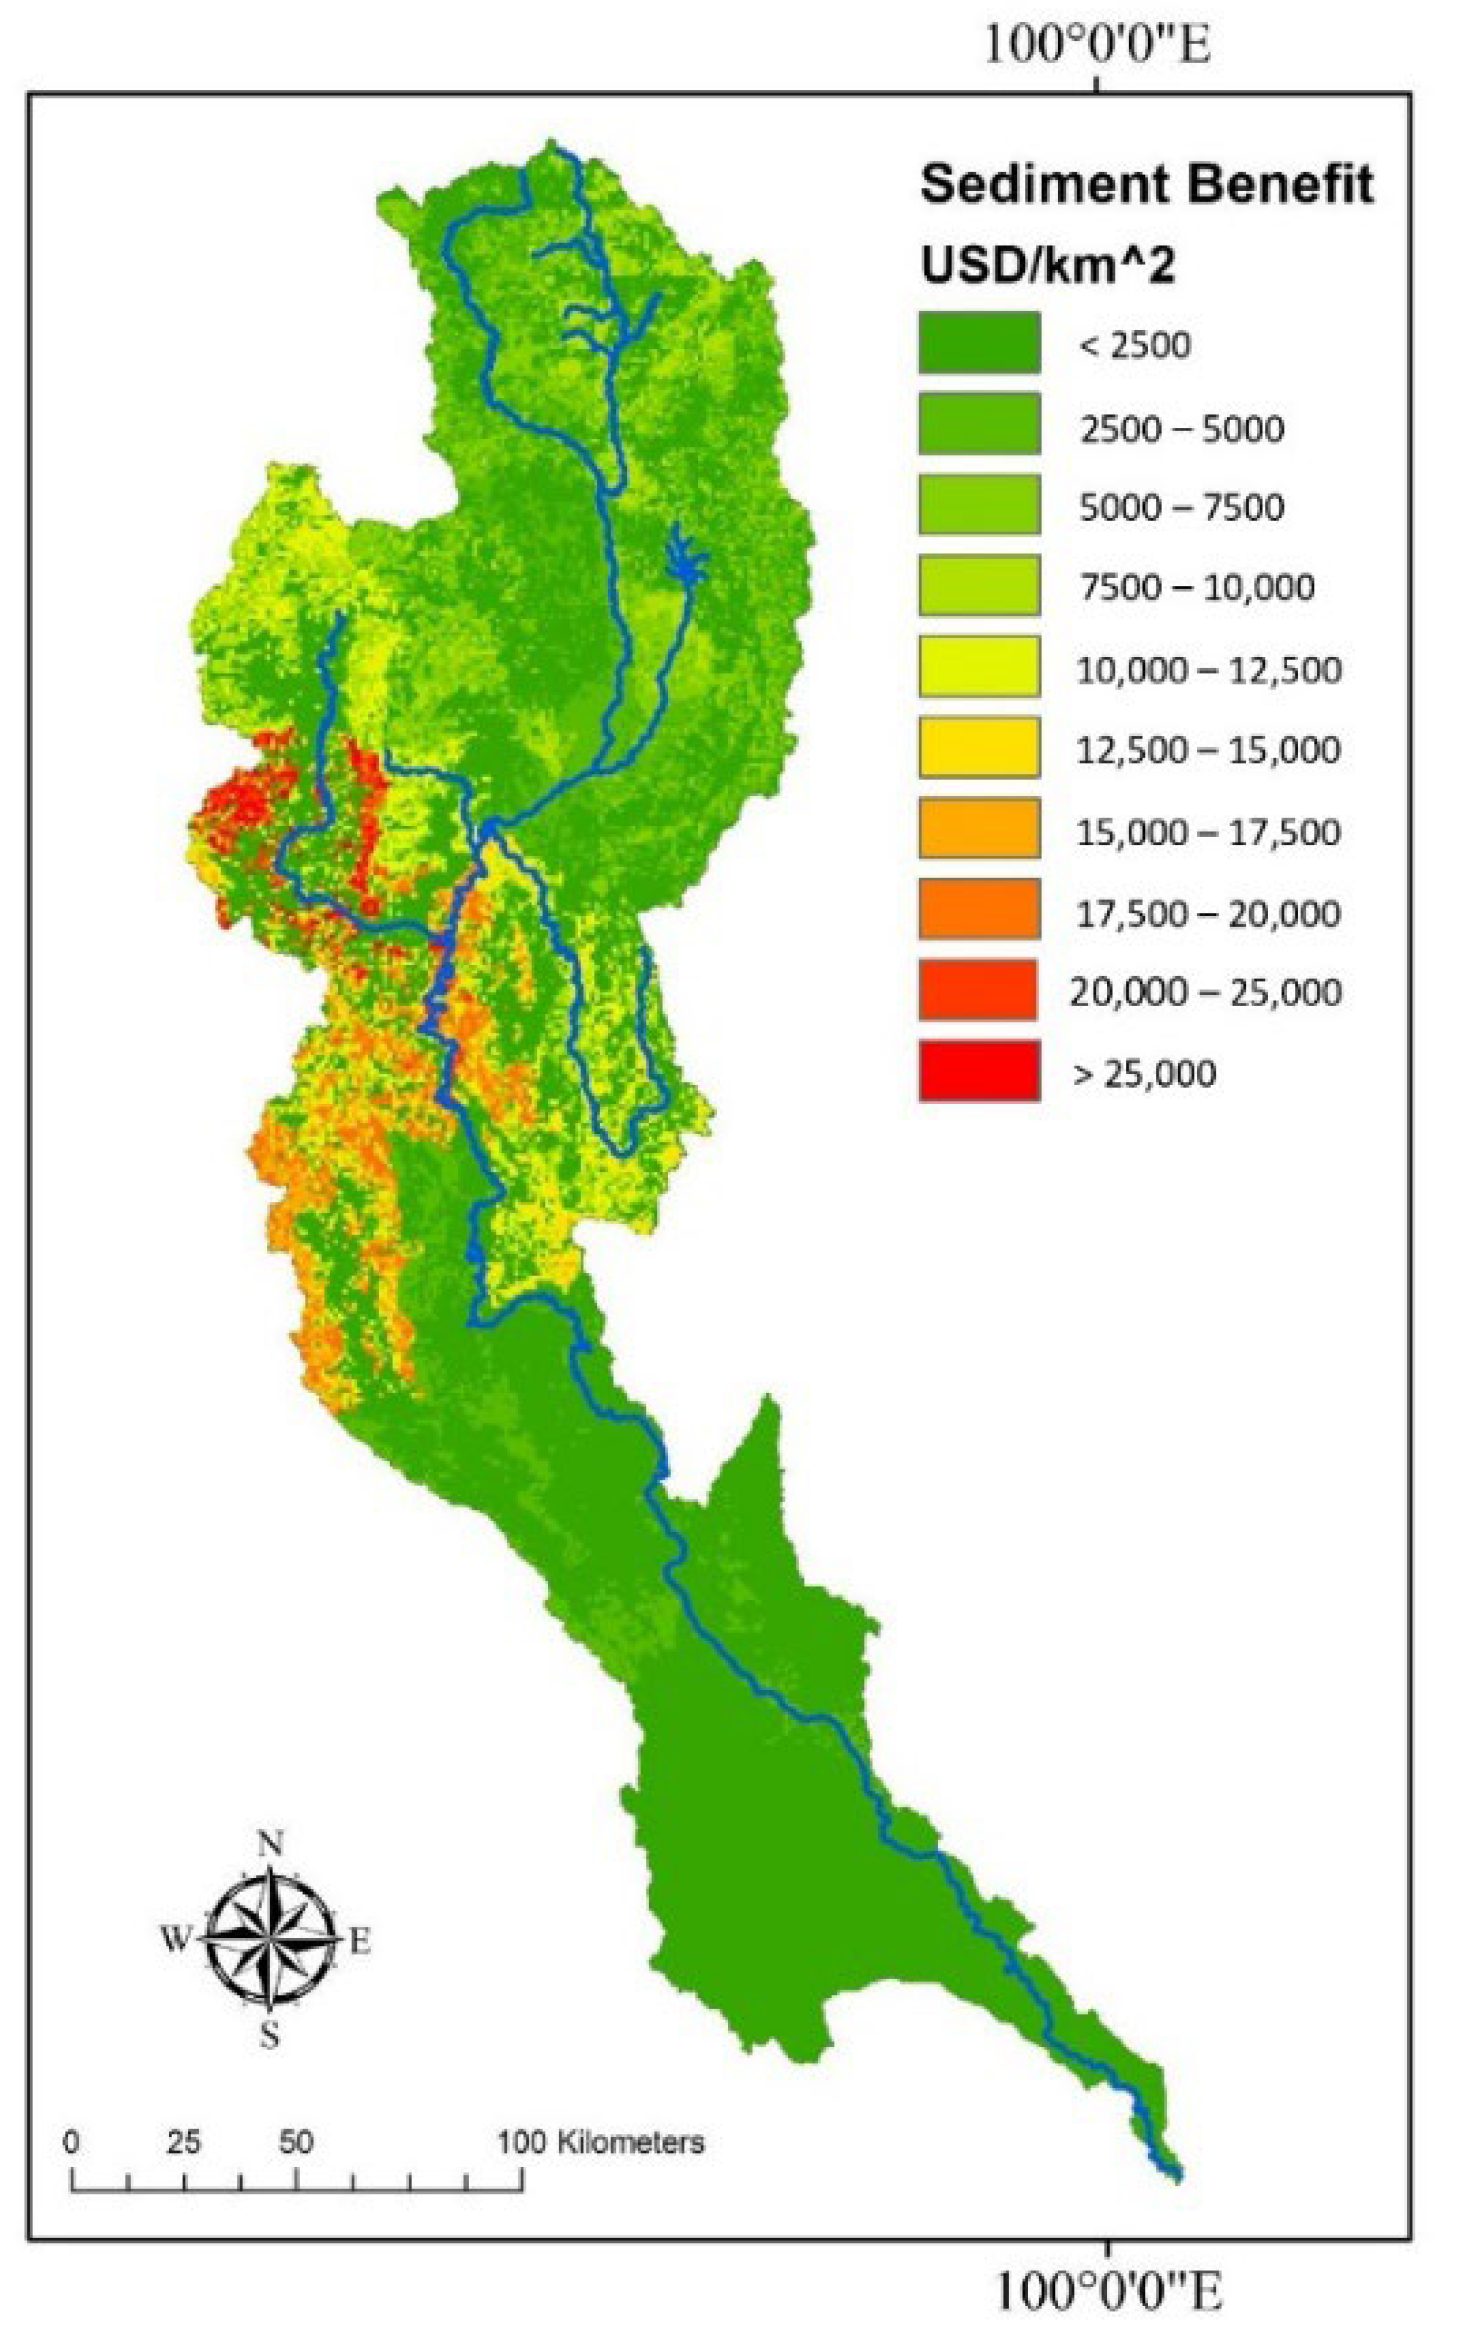
This research focused on the direct benefit of sediment for construction projects or construction material. The sediment benefit was estimated using the sediment price for each province, obtained from the Ministry of Commerce. The benefits and costs were correlated with the volume of sediment or sediment deposition and topography, with greater benefits and costs of sediment being associated with lower elevation areas, mostly with the Ping River boundary.
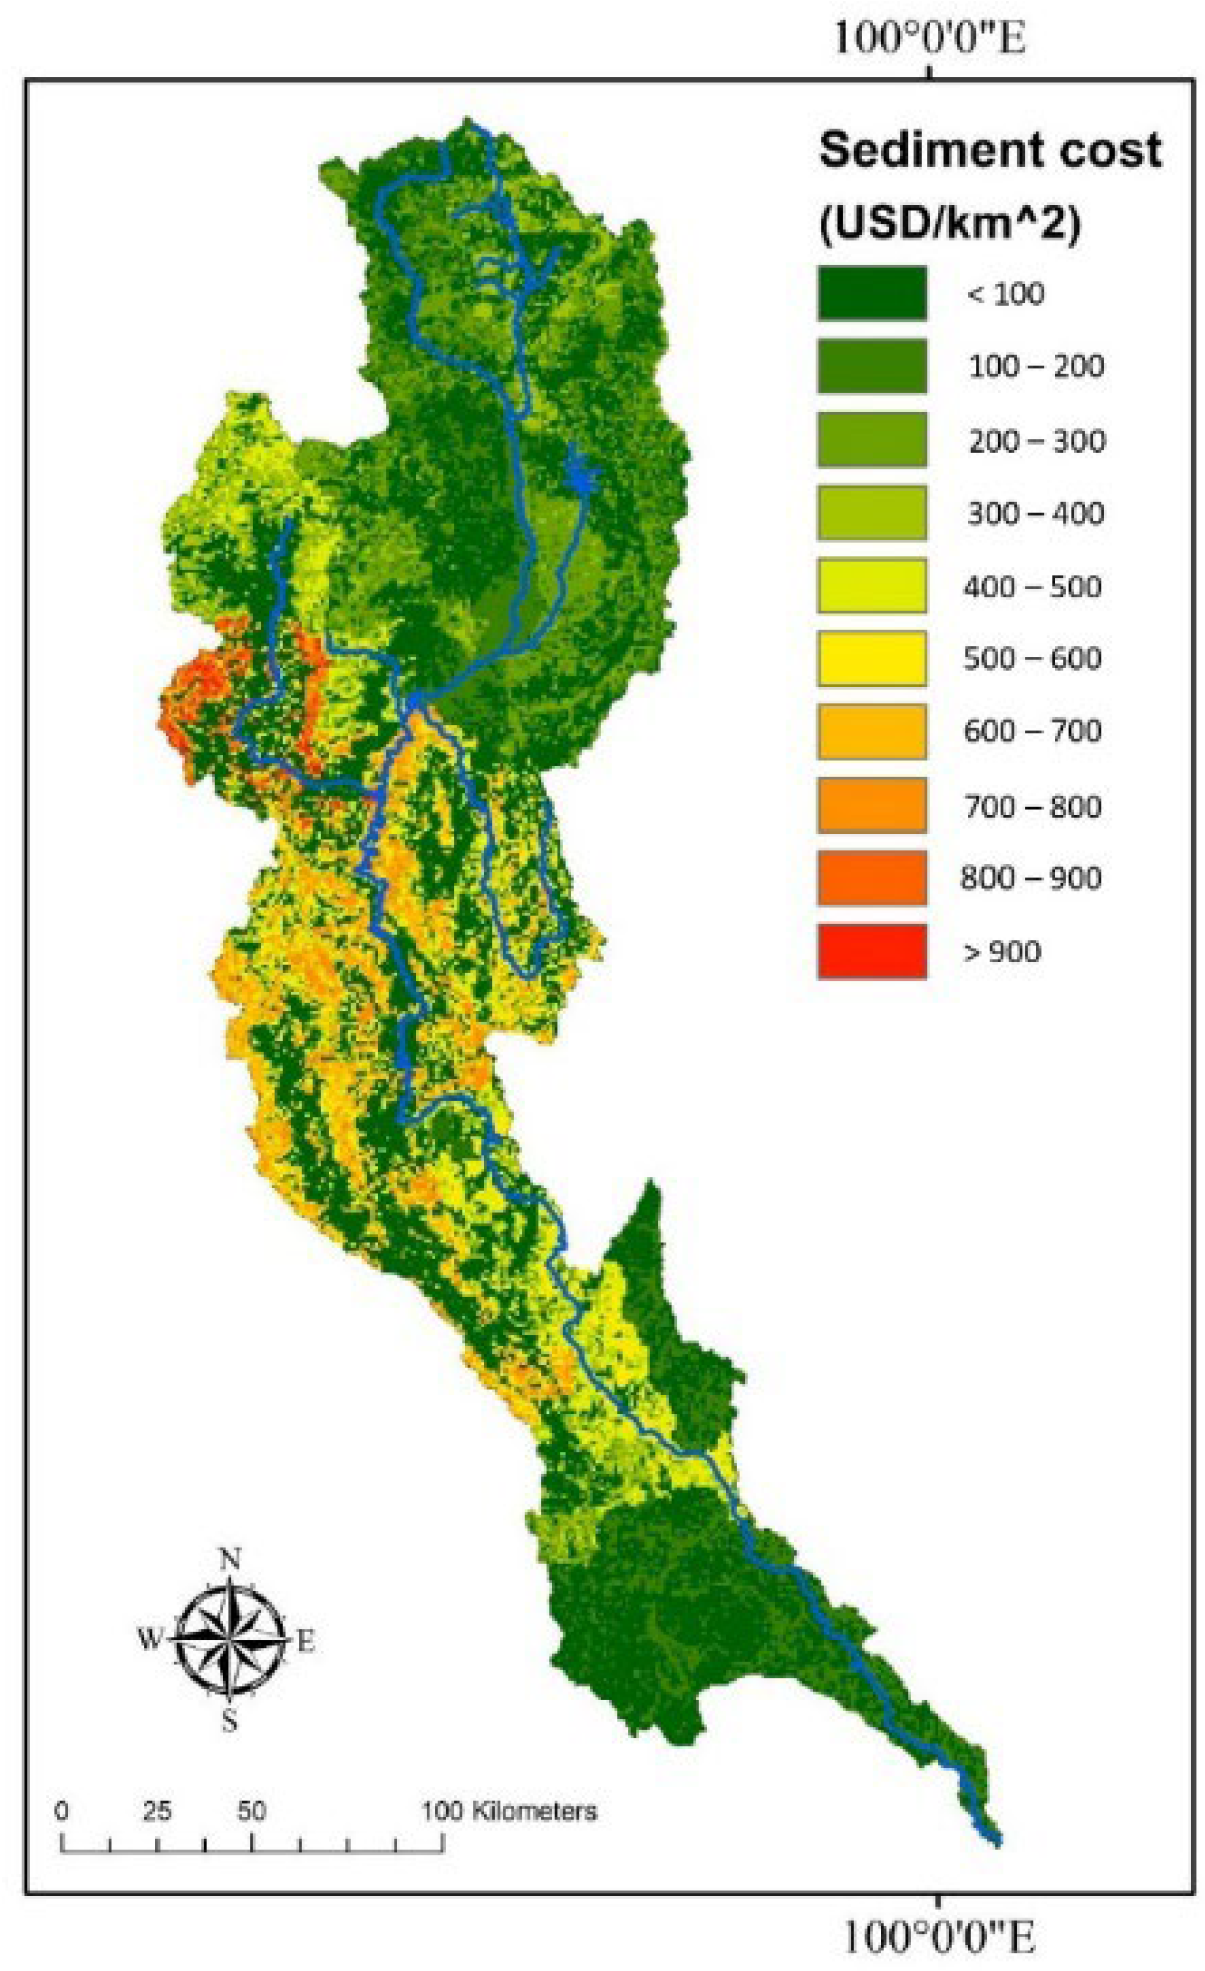
In addition, this study generated cost and benefit of sediment maps, as shown in Figure 11 and Figure 12, respectively. The sediment cost was classified into the water erosion cost and the dredging cost. The water erosion cost included the detachment and removal of soil material by water. Globally, food wastage and environmental costs are caused by water erosion. Schwegler [37] reported that the average world water erosion cost was approximately USD 4/Mg. In addition, locally, the dredging cost was USD 0.6/m3 from the Royal Irrigation Department. The results showed that the average cost of sediments in the PRB was USD 227/km2·y (Figure 11). The average benefit of sediment in the PRB was USD 4280/km2·y (Figure 12).
The BCR in the PRB was generated as a map (Figure 13) which indicated that the BCR was higher than 1 mostly in the upstream area of the Ping River, which was mostly covered by mountainous and forest area, which had a high potential to produce sediment yield and had a lower population than the downstream areas. On the other hand, the BCR was lower than 1 in the downstream area of the Ping River, especially at the hydroelectric plant at Bhumibol dam, due to reduced energy production due to sediment deposition.
5. Discussion
Scientific management of sediment resources is important for the removal of sediment and debris from the bottom of rivers, lakes, canals, and other water bodies. Sedimentation is one problem caused by the natural process of silt and sand washing into downstream areas.
Much of the several million tons of sediment dredged each year from the PRB is disposed in uplands. Recently, several investigations have developed methods for reusing dredged sediments in the manufacturing of construction materials [65,66]. In addition, sediment from rivers, lakes, and reservoirs can be reused as nutrient sources for agriculture. Regarding soil fertilization using sediments with high nutrient content, 25% of costs could be saved compared to application of chemical fertilizers [67].
In Thailand, benefit from sediment products represents approximately 9% of the total economic production of Thailand [30]. For these reasons, the dredged sediment with good location in the PRB is a valuable resource that can be used in economically beneficial ways. Therefore, this research assessed the potential of the BCR for decision-making to establish a reusing dredged sediment project in the PRB. The results showed that there were BCR > 1 values largely in the upstream area of the basin, which was covered by forest and mountainous area. Furthermore, the benefits and costs were related to the amount of sediment deposition and the topography. The results indicated that higher benefits of sediment were linked with lower areas in the study area, mostly along the Ping River boundary in the middle basin. The average benefit of sediment in the PRB was USD 4280/km2·y.
6. Conclusions
This study estimated the potential of BCR of sediment resources in the PRB using remote sensing data and GIS technique. Consequently, the modified RUSLE was used to assess the benefits and costs of sediment yield in the PRB. The results indicated that the good BCR mostly happened in the upstream area of the basin, which was covered by forest and mountainous area. Furthermore, we found that significantly greater benefits of sediment in the PRB were occurring in the lower areas of the upper part due to the fact that rainfall and other precipitation washes soil surface from the tops of mountains to low-elevation areas. The annual benefit of sediment resources in the PRB was USD 4280/km2·y. On the other hand, the annual sediment costs in the PRB are approximately USD 227/km2·y. However, the results of our research present new challenges for the potential of BCR in direct benefit of sediment resources in the PRB. Further research is needed to identify additional indirect sediment resources in the economic valuation.
Author Contributions
Conceptualization, P.R.; methodology, P.R.; software, A.M.M.; formal analysis, P.R.; investigation, P.R.; resources, A.M.M.; data curation, P.R.; writing—original draft preparation, P.R.; writing—review and editing, A.M.M.; visualization, P.R.; supervision, A.M.M.; project administration, P.R.; funding acquisition, P.R. and A.M.M. All authors have read and agreed to the published version of the manuscript.
Funding
This research received no external funding.
Institutional Review Board Statement
Not applicable.
Informed Consent Statement
Not applicable.
Data Availability Statement
New data generated is shared through this article. All other sources of data are cited throughout the paper.
Acknowledgments
This work was financially supported by the Office of the Ministry of Higher Education, Science, Research and Innovation and the Thailand Science Research and Innovation through the Kasetsart University Reinventing University Program 2021. Finally, impossible: I’m possible.
Conflicts of Interest
The authors declare no conflict of interest.
References
- Carkovic, A.B.; Pastén, P.A.; Bonilla, C.A. Sediment composition for the assessment of water erosion and nonpoint source pollution in natural and fire–affected landscapes. Sci. Total Environ. 2015, 512–513, 26–35. [Google Scholar] [CrossRef]
- Han, L.; Wang, L.; Ding, X.; Wen, H.; Yuan, X.; Zhang, W. Similarity quantification of soil parametric data and sites using confidence ellipses. Geosci. Front. 2022, 13, 101280. [Google Scholar] [CrossRef]
- Liu, D.; Liu, H.; Wu, Y.; Zhang, W.; Wang, Y.; Santosh, M. Characterization of geo-material parameters: Gene concept and big data approach in geotechnical engineering. Geosystems Geoenvironment 2022, 1, 100003. [Google Scholar] [CrossRef]
- Zhang, W.; Gu, X.; Tang, L.; Yin, Y.; Liu, D.; Zhang, Y. Application of machine learning, deep learning and optimization algorithms in geoengineering and geoscience: Comprehensive review and future challenge. Gondwana Res. 2022, 109, 1–17. [Google Scholar] [CrossRef]
- Pimentel, D.; Kounang, N. Ecology of Soil Erosion in Ecosystems. Ecosystems 1998, 1, 416–426. [Google Scholar] [CrossRef]
- Durán Zuazo, V.H.; Rodríguez Pleguezuelo, C.R. Soil-erosion and runoff prevention by plant covers. A review. Agron. Sustain. Dev. 2008, 28, 65–86. [Google Scholar] [CrossRef] [Green Version]
- Gelagay, H.S.; Minale, A.S. Soil loss estimation using GIS and remote sensing techniques: A case of Koga watershed, Northwestern Ethiopia. Int. Soil Water Conserv. Res. 2016, 4, 126–136. [Google Scholar] [CrossRef] [Green Version]
- Noori, H.; Siadatmousavi, S.M.; Mojaradi, B. Assessment of sediment yield using RS and GIS at two sub-basins of Dez Watershed, Iran. Int. Soil Water Conserv. Res. 2016, 4, 199–206. [Google Scholar] [CrossRef] [Green Version]
- Renard, K.; Foster, G.; Weesies, G.; McCool, D.; Yoder, D. Predicting soil erosion by water: A guide to conservation planning with the Revised Universal Soil Loss Equation (RUSLE). USDA Agric. Handb. 1997, 703, 26–35. [Google Scholar]
- Chadli, K. Estimation of soil loss using RUSLE model for Sebou watershed (Morocco). Model. Earth Syst. Environ. 2016, 2, 51. [Google Scholar] [CrossRef] [Green Version]
- Sahu, A.; Baghel, T.; Sinha, M.K.; Ahmad, I.; Verma, M.K. Soil Erosion Modeling using Rusle and GIS on Dudhawa Catchment. Int. J. Appl. Environ. 2017, 12, 1147–1158. [Google Scholar]
- Panditharathne, D.L.D.; Abeysingha, N.S.; Nirmanee, K.G.S.; Mallawatantri, A. Application of Revised Universal Soil Loss Equation (RUSLE) model to assess soil erosion in “Kalu Ganga” River Basin in Sri Lanka. Appl. Environ. Soil Sci. 2019, 2019. 4037379. [Google Scholar] [CrossRef] [Green Version]
- Setegn, S.G.; Srinivasan, R.; Dargahi, B.; Melesse, A.M. Spatial delineation of soil erosion vulnerability in the Lake Tana Basin, Ethiopia. Hydrol. Process 2009, 23, 3738–3750. [Google Scholar] [CrossRef]
- Nigussie, T.; Fanta, A.; Melesse, A.M.; Quraishi, S. Modeling rainfall erosivity from daily rainfall events, Upper Blue Nile Basin, Ethiopia. In Nile River Basin; Springer: Berlin/Heidelberg, Germany, 2014; pp. 307–335. [Google Scholar]
- Esmali Ouri, A.; Golshan, M.; Janizadeh, S.; Cerdà, A.; Melesse, A.M. Soil Erosion Susceptibility Mapping in Kozetopraghi Catchment, Iran: A Mixed Approach Using Rainfall Simulator and Data Mining Techniques. Land 2020, 9, 368. [Google Scholar] [CrossRef]
- Gebreslassie, H.G.; Melesse, A.M.; Bishop, K.; Gebremariam, A.G. Linear spectral unmixing algorithm for modelling suspended sediment concentration of flash floods, upper Tekeze River, Ethiopia. Int. J. Sediment Res. 2020, 35, 79–90. [Google Scholar] [CrossRef]
- Rangsiwanichpong, P.; Kazama, S.; Gunawardhana, L. Assessment of sediment yield in Thailand using revised universal soil loss equation and geographic information system techniques. River Res. Appl. 2018, 34, 1113–1122. [Google Scholar] [CrossRef]
- Chuenchum, P.; Xu, M.; Tang, W. Estimation of soil erosion and sediment yield in the Lancang-Mekong River using the Modified Revised Universal Soil Loss Equation and GIS techniques. Water 2020, 12, 135. [Google Scholar] [CrossRef] [Green Version]
- Chuenchum, P.; Xu, M.; Tang, W. Predicted trends of soil erosion and sediment yield from future land use and climate change scenarios in the Lancang–Mekong River by using the modified RUSLE model. Int. Soil Water Conserv. Res. 2020, 8, 213–227. [Google Scholar] [CrossRef]
- Junakova, N.; Junak, J. Alternative reuse of bottom sediments in construction material: Overview. IOP Conf. Ser. Mater. Sci. Eng. 2019, 549, 012038. [Google Scholar] [CrossRef]
- Millrath, K.; Kozlova, S.; Shimanovich, S.; Meyer, C. Beneficial Use of Dredge Material; Progress report prepared for Echo Environmental, Inc.: New York, NY, USA, 2001. [Google Scholar]
- Hamer, K.; Hadeler, A.; Muschalla, T.; Schroter, J.; Timmer, G. Light weight aggregates made from dredged harbour sediments. Leaching behaviour of inorganic pollutants and constructional characteristics. J. Soils Sediments 2003, 4, 284–291. [Google Scholar] [CrossRef]
- Chen, H.J.; Yang, M.D.; Tang, C.W.; Wang, S.Y. Producing synthetic lightweight aggregates from reservoir sediments. Constr. Build Mater. 2012, 28, 387–394. [Google Scholar] [CrossRef]
- Mezencevova, A.; Yeboah, N.N.; Burns, S.E.; Kahn, L.F.; Kurtis, K.E. Utilization of Savannah harbor river sediment as the primary raw material in production of fired brick. J. Environ. Manag. 2012, 113, 128–136. [Google Scholar] [CrossRef] [PubMed]
- Cappuyns, V.; Deweirt, V.; Rousseau, S. Dredged Sediments as a Resource for Brick Production: Possibilities and Barriers from a Consumers’ Perspective. Waste Manag. 2015, 38, 372–380. [Google Scholar] [CrossRef] [PubMed]
- Romero, M.; Andrés, A.; Alonso, R.; Viguri, J.; Rincón, J.M. Valorisation of contaminated marine sediments to produce ceramic construction materials. In Proceedings of the 1st Spanish National Conference on Advances in Materials Recycling and Eco—Energy, Madrid, Spain, 12–13 November 2009. [Google Scholar]
- Kazi Aoual-Benslafa, F.; Kerdal, D.; Ameur, M.; Mekerta, B.; Semcha, A. Durability of mortars made with dredged sediments. Procedia Eng. 2015, 118, 240–250. [Google Scholar] [CrossRef] [Green Version]
- Junakova, N.; Junak, J. Sustainable use of reservoir sediment through partial application in building material. Sustainability 2017, 9, 852. [Google Scholar] [CrossRef] [Green Version]
- Joseph, S.; McGarry, B.; Sajjakulnukit, B.; Sopchokchai, O. A study of Brick Production in Thailand (Issues on Women, Energy, and Environment). TDRI Q. Rev. 1990, 5, 11–15. [Google Scholar]
- Rangsiwanichpong, P.; Kazama, S.; Ekkawatpanit, C.; Gunawardhana, L. Evaluation of Cost and Benefit of Sediment based on Landslide and Erosion Models. Catena 2019, 173, 194–206. [Google Scholar] [CrossRef]
- JICA. The Feasibility Study on Mangrove Revival and Extension Project in the Kingdom of Thailand; Final Report; Agency (JICA), Japan International Cooperation: Tokyo, Japan, 2000. [Google Scholar]
- Wood, S.H.; Ziegler, A. Floodplain sediment from a 100-year-recurrence flood in 2005 of the Ping River in northern Thailand. Hydrol. Earth Syst. Sci. 2008, 12, 959–973. [Google Scholar] [CrossRef] [Green Version]
- Wuthiwongtyothin, S. Investigating statistical bias correction with temporal subsample of the upper Ping River Basin, Thailand. J. Water Clim. Change 2021, 12, 1631–1653. [Google Scholar] [CrossRef]
- Sharma, D.; Gupta, A.D.; Babel, M. Spatial disaggregation of bias-corrected GCM precipitation for improved hydrologic simulation: Ping River Basin, Thailand. Hessd 2007, 11, 1373–1390. [Google Scholar] [CrossRef] [Green Version]
- Thomas, D.E. Developing watershed management organizations in pilot sub-basins of the Ping river basin; Final Report; Office of Natural Resources and Environmental Policy and Planning, Ministry of Natural Resources and Environment: Bangkok, Thailand, 2005. [Google Scholar]
- Erosivity Factor Equation for Thailand, Land Development of Thailand. Available online: https://www.ldd.go.th/Efiles_project/ldd_plannig/erosion/Erosion_recommModel.html (accessed on 7 March 2022).
- Schwegler, P. Economic Valuation of Environmental Costs of Soil Erosion and the Loss of Biodiversity and Ecosystem Services Caused by Food Wastage. Master’s Thesis, ETH Zürich, Zürich, Switzerland, 2014. [Google Scholar]
- Wischmeier, W.H.; Smith, D.D. Predicting Rainfall Erosion Losses: Guide to Conservation Planning; U.S. Department of Agriculture: Washington, DC, USA, 1978. [Google Scholar]
- Farhan, Y.; Zregat, D.; Farhan, I. Spatial estimation of soil erosion risk using RUSLE approach, RS, and GIS techniques: A case study of Kufranja watershed, Northern Jordan. J. Water Resour. Prot. 2013, 5, 1247–1261. [Google Scholar] [CrossRef] [Green Version]
- Wagari, M.; Tamiru, H. RUSLE model based annual soil loss quantification for soil erosion protection: A case of Fincha Catchment, Ethiopia. Air Soil Water Res. 2021, 14, 11786221211046234. [Google Scholar] [CrossRef]
- Hateffard, F.; Mohammed, S.; Alsafadi, K.; Enaruvbe, G.O.; Heideri, A.; Abdo, H.G.; Rodrigo-Comino, J. CMIP5 climate projections and RUSLE-based soil erosion assessment in the central part of Iran. Sci. Rep. 2021, 11, 17. [Google Scholar] [CrossRef]
- Boussadia-Omari, L.; Ouillon, S.; Hirche, A.; Salamani, M.; Guettoche, M.S.; Ihaddaden, A.; Nedjraoui, D. Contribution of phytoecological data to spatialize soil erosion: Application of the RUSLE model in the Algerian atlas. Int. Soil Water Conserv. Res. 2021, 9, 502–519. [Google Scholar] [CrossRef]
- Kongkhiaw, P.; Yossapol, C.; Tantemsapya, N.; Tran, C.N.; Tanang, S. Quantification prediction soil losses in Nakhon Ratchasima, Thailand. Naresuan Univ. J. Sci. Technol. 2021, 29, 78–95. [Google Scholar]
- Tsegaye, L.; Bharti, R. Soil erosion and sediment yield assessment using RUSLE and GIS-based approach in Anjeb watershed, Northwest Ethiopia. SN Appl. Sci. 2021, 3, 19. [Google Scholar] [CrossRef]
- Sirikaew, U.; Seeboonruang, U.; Tanachaichoksirikun, P.; Wattanasetpong, J.; Chulkaivalsucharit, V.; Chen, W. Impact of Climate Change on Soil Erosion in the Lam Phra Phloeng Watershed. Water 2020, 12, 3527. [Google Scholar] [CrossRef]
- Thapa, P. Spatial estimation of soil erosion using RUSLE modeling: A case study of Dolakha district, Nepal. Environ. Syst. Res. 2020, 9, 10. [Google Scholar] [CrossRef]
- Rajbanshi, J.; Bhattacharya, S. Assessment of soil erosion, sediment yield and basin specific controlling factors using RUSLE-SDR and PLSR approach in Konar river basin, India. J. Hydrol. 2020, 587, 124935. [Google Scholar] [CrossRef]
- Olorunfeni, I.E.; Komolafe, A.A.; Fasinmirin, J.T.; Olufayo, A.A.; Akande, S.O. A GIS-based assessment of the potential soil erosion and flood hazard zones in Ekiti State, Southwestern Nigeria using integrated RUSLE and HAND models. Catena 2020, 194, 15. [Google Scholar]
- Hu, S.; Li, L.; Chen, L.; Cheng, L.; Yuan, L.; Huang, X.; Zhang, T. Estimation of Soil Erosion in the Chaohu Lake Basin through Modified Soil Erodibility Combined with Gravel Content in the RUSLE Model. Water 2019, 11, 1806. [Google Scholar] [CrossRef] [Green Version]
- Kidane, M.; Bezie, A.; Kesete, N.; Tolessa, T. The impact of land use and land cover (LULC) dynamics on soil erosion and sediment yield in Ethiopia. Heliyon 2019, 5, 13. [Google Scholar] [CrossRef] [PubMed] [Green Version]
- Belayneh, M.; Yirgu, T.; Tsegaye, D. Potential soil erosion estimation and area prioritization for better conservation planning in Gumara watershed using RUSLE and GIS techniques’. Environ. Syst. Res. 2019, 8, 17. [Google Scholar] [CrossRef] [Green Version]
- Woldemariam, G.W.; Iguala, A.D.; Tekalign, S.; Reddy, R.U. Spatial Modeling of Soil Erosion Risk and Its Implication for Conservation Planning: The Case of the Gobele Watershed, East Hararghe Zone, Ethiopia. Land 2018, 7, 25. [Google Scholar] [CrossRef] [Green Version]
- El Jazouli, A.; Barakat, A.; Ghafiri, A.; El Moutaki, S.; Ettaqy, A.; Khellouk, R. Soil erosion modeled with USLE, GIS, and remote sensing: A case study of Ikkour watershed in Middle Atlas (Morocco). Geosci. Lett. 2017, 4, 12. [Google Scholar] [CrossRef] [Green Version]
- Ganasri, B.P.; Ramesh, H. Assessment of soil erosion by RUSLE model using remote sensing and GIS—A case study of Nethravathi Basin. Geosci. Front. 2016, 7, 953–961. [Google Scholar] [CrossRef] [Green Version]
- Baharawi, J.A.; Elhag, M.; Aldhebiani, A.Y.; Galal, H.K.; Hegazy, A.K.; Alghailani, E. Soil erosion estimation using remote sensing techniques in Wadi Yalamlam Basin, Saudi Arabia. Adv. Mater. Sci. Eng. 2016, 8, 9585962. [Google Scholar]
- Bahadur, K.C.K. Mapping soil erosion susceptibility using remote sensing and GIS: A case of the Upper Nam Wa Watershed, Nan Province, Thailand. Environ. Geol. 2009, 57, 695–705. [Google Scholar] [CrossRef]
- Nam, P.T.; Yang, D.; Kanae, S.; Oki, T.; Musiake, K. Global soil loss estimate using RUSLE model: The use of global spatial datasets on estimating erosive parameters. Geoinformatics 2003, 14, 49–53. [Google Scholar] [CrossRef] [Green Version]
- Bowker, M.A.; Belnap, J.; Chaudhary, V.B.; Johnson, N.C. Revisiting classic water erosion models in drylands: The strong impact of biological soil crusts. Soil Biol. Biochem. 2008, 40, 2309–2319. [Google Scholar] [CrossRef]
- Ostovari, Y.; Moosavi, A.A.; Mozaffari, H.; Poppiel, R.R.; Tayebi, M.; Dematte, J.A.M. Soil Erodibility and Its Influential Factors in the Middle East, Computers in Earth and Environmental Sciences; Elsevier: Amsterdam, The Netherlands, 2022; pp. 441–454. [Google Scholar]
- Goldscheider, N.; Chen, Z.; Auler, A.S.; Bakalowicz, M.; Broda, S.; Drew, D.; Hartman, J.; Jiang, G.; Moosdorf, N.; Stevanovic, Z.; et al. Global distribution of carbonate rocks and karst water resources. Hydrogeol. J. 2020, 28, 1661–1677. [Google Scholar] [CrossRef] [Green Version]
- Clements, R.; Sodhi, N.S.; Schilthuizen, M.; Ng, P.K.L. Limestone Karsts of Southeast Asia: Imperiled Arks of Biodiversity. Bioscience 2006, 56, 733–742. [Google Scholar] [CrossRef] [Green Version]
- Pham, T.G.; Degener, J.; Kappas, M. Integrated universal soil loss equation (USLE) and Geographical Information System (GIS) for soil erosion estimation in A Sap basin: Central Vietnam. Int. Soil Water Conserv. Res. 2018, 6, 99–110. [Google Scholar] [CrossRef]
- Nut, N.; Mihara, M.; Jeong, J.; Ngo, B.; Sigua, G.; Prasad, P.V.V.; Reyes, M.R. Land Use and Land Cover Changes and Its Impact on Soil Erosion in Stung Sangkae Catchment of Cambodia. Sustainability 2021, 13, 9276. [Google Scholar] [CrossRef]
- Sediment Price for Each Province of Thailand, Ministry of Commerce (Thailand). Available online: https://data.moc.go.th/OpenData/CSIProductIndexes (accessed on 15 March 2022).
- Mcdonough, F.M.; Boehm, G.A.; Douglas, W.S. Dredged material management in New Jersey: A multifaceted approach for meeting statewide dredging needs in the 21st century. In Proceedings of the 31st Annual Dredging Seminar, Western Dredging Association, Louisville Kentucky, KY, USA, 16–18 May 1999. [Google Scholar]
- Ali, M.; Robert, M.; Roya, N. Evaluation of Long-Term Performance of Stabilized Sediment for Beneficial Use; Rutgers University: New Brunswick, NJ, USA, 2020. [Google Scholar]
- Braga, B.B.; de Carvalho, T.R.A.; Brosinsky, A.; Foerster, S.; Medeiros, P.H.A. From waste to resource: Cost-benefit analysis of reservoir sediment reuse for soil fertilization in a semiarid catchment. Sci. Total Environ. 2019, 670, 158–169. [Google Scholar] [CrossRef]
Figure 1.
Ping River Basin.

Figure 2.
Monthly and accumulated rainfall in the Ping River Basin.

Figure 3.
Sediment price map for the Ping River Basin.

Figure 4.
Erosivity factor map.

Figure 5.
Erodibility factor map.

Figure 6.
Topographic factor map.

Figure 7.
Cover-management factor map.

Figure 8.
Conservation practice factor.

Figure 9.
Potential of soil erosion and sediment deposition in the PRB.

Figure 10.
Potential of sediment capacity.

Figure 11.
Potential of sediment costs.

Figure 12.
Potential of sediment benefits.

Figure 13.
Benefit-cost ratio of sediment resources in the PRB.


Table 1.
Description of the data sources.
| No | Type of Data | Data Description | Name of Service that Provides the Data |
|---|---|---|---|
| 1 | Digital elevation model (DEM) | 1 km2 resolution. | U.S. Geological Survey. |
| 2 | Land use data | Land use map for the year 2018 was obtained in GIS format. | Land Development Department of Thailand (LDD). |
| 3 | Rainfall data | Monthly rainfall data during 2000–2020. | Thai Meteorological Department (TMD). |
| 4 | Normalized Difference Vegetation Index data (NDVI) | MODIS, MOD13A2 data during 2000–2020. | National Aeronautics and Space Administration (NASA). |
| 5 | Sediment costs | Dredging costs. Water erosion costs. | Royal Irrigation Department of Thailand (RID). Based on research of Schwegler [36]. |
| 6 | Sediment benefits | Sediment price in each province. | The Ministry of Commerce (Thailand). |
| 7 | K factor values | Standard K factor values based on soil type of Thailand (clay: 0.05, silt: 0.19, and sand: 0.3) (5 km2 resolutions). | Land Development Department of Thailand (LDD). |
| 8 | P factor values | P factor values were classified into six slope categories for crop areas. | Based on experiment of Wischmeier and Smith [37]. |
Table 2.
P factor values.
| Land Use Type | Slope (%) | P Factor |
|---|---|---|
| Crop Areas | 0–5 | 0.1 |
| Crop Areas | 5–10 | 0.12 |
| Crop Areas | 10–20 | 0.14 |
| Crop Areas | 20–30 | 0.19 |
| Crop Areas | 30–50 | 0.25 |
| Crop Areas | 50–100 | 0.33 |
| Other | All | 1 |
Table 3.
Sediment price for each province [64].
Table 3.
Sediment price for each province [64].
| Provinces | Price of Sediment (USD/m3) |
|---|---|
| Chiang Mai | 17.12 |
| Lampang | 7.76 |
| Lamphun | 12.80 |
| Mae Hong Son | 10.89 |
| Tak | 3.11 |
| Kamphaeng Phet | 3.33 |
| Nakhon Sawan | 10.89 |
Publisher’s Note: MDPI stays neutral with regard to jurisdictional claims in published maps and institutional affiliations. |
© 2022 by the authors. Licensee MDPI, Basel, Switzerland. This article is an open access article distributed under the terms and conditions of the Creative Commons Attribution (CC BY) license (https://creativecommons.org/licenses/by/4.0/).
Share and Cite
MDPI and ACS Style
Rangsiwanichpong, P.; Melesse, A.M. Analyzing the Benefit-Cost Ratio of Sediment Resources by Remote Sensing Data in the Ping River Basin, Thailand. Water 2022, 14, 2071. https://doi.org/10.3390/w14132071
AMA Style
Rangsiwanichpong P, Melesse AM. Analyzing the Benefit-Cost Ratio of Sediment Resources by Remote Sensing Data in the Ping River Basin, Thailand. Water. 2022; 14(13):2071. https://doi.org/10.3390/w14132071
Chicago/Turabian StyleRangsiwanichpong, Prem, and Assefa M. Melesse. 2022. "Analyzing the Benefit-Cost Ratio of Sediment Resources by Remote Sensing Data in the Ping River Basin, Thailand" Water 14, no. 13: 2071. https://doi.org/10.3390/w14132071
Note that from the first issue of 2016, this journal uses article numbers instead of page numbers. See further details here.