
Improving Environmental DNA Sensitivity for Dreissenid Mussels by Targeting Tandem Repeat Regions of the Mitochondrial Genome


1
Cooperative Institute for Great Lakes Research (CIGLR), University of Michigan, 4840 South State Road, Ann Arbor, MI 48108, USA
2
Stantec Consulting Ltd., 1500 Lake Shore Dr, Columbus, OH 43204, USA
3
Great Lakes Environmental Research Laboratory, National Oceanic and Atmospheric Administration, 4840 South State Road, Ann Arbor, MI 48108, USA
*
Author to whom correspondence should be addressed.
Water 2022, 14(13), 2069; https://doi.org/10.3390/w14132069
Submission received: 22 April 2022
/
Revised: 2 June 2022
/
Accepted: 23 June 2022
/
Published: 28 June 2022
(This article belongs to the Special Issue Ecological Monitoring and Assessment of Freshwater Ecosystems: New Trends and Future Challenges)
Abstract
:The recent genetic revolution through the analysis of aquatic environmental DNA (eDNA) has become a powerful tool for improving the detection of rare and/or invasive species. For the majority of eDNA studies, genetic assays are designed to target mitochondrial genes commonly referred to as “barcode” regions. However, unlike the typical structure of an animal mitochondrial genome, those for the invasive zebra and quagga mussels are greatly expanded with large extended tandem repeat regions. These sections of repeated DNA can appear hundreds of times within the genome compared to a single copy for the mitochondrial barcode genes. This higher number of target copies per mitochondrial genome presents an opportunity to increase eDNA assay sensitivity for these species. Therefore, we designed and evaluated new eDNA assays to target the extended repeat sections for both zebra and quagga mussels. These assays lower the limit of detection of genomic DNA by 100-fold for zebra mussels and 10-fold for quagga mussels. Additionally, these newly developed assays provided longer durations of detection during degradation mesocosm experiments and greater sensitivity for eDNA detection from water samples collected across western Lake Erie compared to standard assays targeting mitochondrial genes. This work illustrates how understanding the complete genomic structure of an organism can improve eDNA analysis.
1. Introduction
The closely related dreissenid bivalve zebra mussel (Dreissena polymorpha, referred to herein as ZM) and quagga mussel (D. rostriformis, referred to herein as QM) are two of the most widely distributed freshwater aquatic invasive species [1,2]. Dreissenid mussels are ecosystem engineers, causing extensive environmental alterations within invaded habitats, such as the sequestration of nutrients, changes to the benthic habitat and structure, increased water clarity via prolific filtration, and changes to the composition and biomass of phytoplankton [1,3,4]. Within North America, the first appearance of both species was reported in the Laurentian Great Lakes, with the discovery of ZMs in 1986 from Lake St. Clair [5] and QMs in 1989 from Lake Erie [6]. Since then, these species have continued their invasional spread to inland water bodies via recreational boating [7]. Furthermore, new invasion pathways have been identified through the aquatic pet and plant trade [8,9], thus posing additional risk.
The early detection of new dreissenid invasions is critical for implementing successful eradication and management strategies [10]. Additionally, monitoring population densities and the invasional front along a waterbody are important for estimating dreissenid-related ecological impacts [11,12]. As a result, many studies have aimed to develop high-sensitivity molecular methods for the detection of new invasions of dreissenid mussels [13]. Initially, molecular methods were aimed at detecting dreissenid veliger larvae from zooplankton tow samples [14]. However, with the recent genetic revolution through the analysis of aquatic environmental DNA (eDNA—the genetic material released from urine, waste, mucus, or sloughed cells), molecular methods are now routinely implemented for detecting aquatic invasive species from free-floating DNA found within the water column [15]. The detection and semi-quantification of dreissenid infestations using eDNA have shown promise in both lacustrine [16,17,18] and riverine habitats [18,19,20,21,22].
Molecular methods for the analysis of eDNA can involve targeted species-specific approaches using the conventional polymerase chain reaction (cPCR) or quantitative PCR (qPCR), or passive approaches utilizing metabarcoding for the detection of general biodiversity [23]. Targeted species-specific assays tend to be more sensitive than broad metabarcoding approaches [22]. Furthermore, cPCR has been found to be a fast and cheap method for the early detection of dreissenid veligers [24]; however, cPCR is typically less sensitive than qPCR [25] and is limited in its quantification output [22]. While qPCR provides the highest molecular sensitivity for eDNA analysis, it has failed to detect ZMs within Lake Superior from locations of low abundance [26]. This suggests that current qPCR assays are potentially unreliable for the detection of expanding invasions within large water bodies. Therefore, it is desirable to have a qPCR assay that targets the most abundant DNA fragment hypothesized to be within the environment to ultimately increase the probability of successful collection in the field and successful detection in the laboratory.
Over the past decade, macrobial eDNA assays have been typically designed for mitochondrial (mt) genes, as the mt-genome is expected to be in higher concentrations than the nuclear (nu) genome within a cell [27] and thus are thought to be found in higher concentrations within the environment. A meta-review of more than 500 published qPCR assays for eDNA analysis has shown that ~98% of assays for the detection of macrobial organisms target a mt-gene, with ~77% of those assays targeting just two genes (cytochrome oxidase I (COI) and cytochrome b (Cyt b)) (data is summarized from [28]). Similarly, of the 29 dreissenid-specific molecular assays, ~72% are designed to target a mt-gene, with ~76% of those targeting COI (Table S1). However, these commonly targeted mt-genes appear as only a single copy within a mt-genome, and thus multi-copy genes (e.g., ribosomal nu-DNA genes) may provide higher sensitivity for eDNA detection. Targeting multi-copy genes within molecular microbial studies has provided increased sensitivity with qPCR analysis [29,30]. Yet, only a few macrobial eDNA studies have compared the sensitivity between single-copy and multi-copy gene targets, with the results suggesting increased sensitivity for multi-copy gene assays for fish [31,32,33] and bivalves [34]. Thus, the development of the most sensitive eDNA assay requires knowledge about the genomic structure (e.g., the gene location and the number of copies per genome) of the taxa of interest.
Recently, genome sequencing has been completed for the entire nu- and mt-genomes of ZMs [35] and for the entire mt-genome of QMs [36]. This new breadth of information provides tremendous insight into the genomic composition and structure of these two species. Unlike the typical structure of other animal mt-genomes, which are ~14–20 kilobases (kb) in length and homoplasmic, dreissenid mt-genomes appear more similar to many plant mt-genomes, which display frequent gene rearrangements, greatly expanded repetitive regions, encode various open reading frames of unknown function, and can be heteroplasmic [35,36]. Of particular interest for eDNA applications, both dreissenid mussels display largely expanded mt-genomes (ZM: ~67 kb and QM: ~46 kb) composed of long extended tandem repeat regions (three repeat regions totaling >50 kb and seven repeat regions totaling > 30 kb, respectively) [35,36]. These extended regions can be repeated hundreds of times per mt-genome, compared to only a single copy for any of the coding mt-genes (e.g., 16S, COI, or Cyt b).
In light of this new whole mt-genomic data, we aimed to develop species-specific qPCR assays that target highly repetitive regions of non-coding mt-DNA. We hypothesized these highly repetitive non-coding mt-DNA sections would be found in higher concentrations within tissue and eDNA water samples compared to any nu- or mt- coding gene region and thus provide higher sensitivity for eDNA sampling. We tested this hypothesis with newly developed qPCR assays across (1) log dilutions of tissue genomic DNA (gDNA), (2) mesocosm experiments consisting of varying abundances of mussels, and (3) water samples collected from Lake Erie with known dreissenid populations. This study demonstrates the potential advantages of increasing the levels of detection and quantification from eDNA when leveraging whole genomic datasets for primer development.
2. Methods
2.1. Estimation of Gene Copy Number per Genome
To estimate the number of copies present within the mt- or nu-genome for each gene region with a developed molecular assay (Table S1), in silico PCR was performed to calculate the number of PCR products of expected size within the mt- and nu-genomes. The number of copies for each nu-gene within the nu-genome (within each of the 16 chromosomes) was calculated using the National Center for Biotechnology Information (NCBI) tool Primer-BLAST (https://www.ncbi.nlm.nih.gov/tools/primer-blast, accessed on 15 October 2021 [37]) against the ZM-assembled nu-genome (BioProject: PRJNA533175). Note that this process does not distinguish functional genes from pseudogenes within the ZM’s genome but rather identifies the number of regions within the genome that would result in PCR amplification. The number of copies for each mt-gene within the mt-genome was calculated using in silico PCR (http://insilico.ehu.eus/user_seqs/, accessed on 15 October 2021) with the assembled mt-genome for each species (ZM BioProject: PRJNA533175, and QMs BioProject: PRJNA666063–accession MW080914).
2.2. Assay Design
Within the ZM’s and QM’s whole mt-genomes, the large tandem repeat sections for each species were identified using the program Tandem Repeat Finder [38]. Potential primers for the tandem repeat sections were identified using the PrimerQuest Tool from Integrated DNA Technologies (IDT; https://www.idtdna.com/PrimerQuest/Home/Index, accessed on 15 October 2021). Assays were further inspected for primer-dimer and heterodimer formation using the OligoAnalyzer Tool from IDT (https://www.idtdna.com/calc/analyzer, accessed on 15 October 2021). One mt tandem repeat assay was chosen for in vitro laboratory validation for each of the two species (Table 1).
2.3. Assay Validation
The two primer pairs were tested for cross-amplification of non-target organisms in silico using the Primer-BLAST tool. The primer pairs were further tested for cross-amplification between the sister taxa by performing qPCR using 1 ng per reaction of gDNA. Total gDNA was extracted from the foot tissue of adult ZMs, or QMs collected from Lake Erie using a Qiagen EZDNA extraction kit following the manufacturer’s protocol. DNA extractions were diluted to 10 ng/µL by quantification on a nanodrop lite with subsequent dilutions using DNase-free water.
To determine the sensitivity of each mtTR assay and previously developed species-specific COI assays [40] (Table 1), serial dilutions of gDNA (ranging from 10 ng to 0.00001 ng per reaction) were amplified using each assay for either the ZM’s or QM’s DNA. Each of the serial dilutions was amplified in triplicates. PCR reactions were run using 2× Fast Plus EvaGreen qPCR Master Mix (CAT #31014, Biotium, Fremont, CA, USA) on an Applied Biosystems QunatStudio Flex 6 Real-Time PCR System. Reactions consisted of 20 µL in volume and included 10 µL 2× Master Mix, 0.5 µL forward and reverse primers at a 10 mM concentration, 6.5 µL diH2O, and 2.5 µL of the sample template. Cycling began with 10 min at 94 °C followed by 40 cycles of 94 °C for 15 s and 60 °C for 60 s. A negative PCR control was run with each plate of samples. Melt curve analysis was completed after each qPCR run for each assay. Melt curves were inspected for a single peak corresponding to the same temperature as the peak from the positive control samples included in each run.
Quantitative PCR assays were evaluated for sensitivity based on the qPCR efficiency, the limit of quantification (LOQ)—defined as the lowest concentration of the target that can be accurately quantified with a coefficient of variance below a threshold of ≤35%—and the limit of detection (LOD)—defined as the lowest concentration of DNA that can be detected in 95% of replicates [39]. PCR amplification efficiency for each assay was calculated following the Minimum Information for Publication of Quantitative Real-time PCR Experiments (MIQE Guidelines) [41]. Using the calibrated standard curves for serial dilutions of gDNA (described above), PCR efficiency was calculated as 10−1/slope − 1, where the slope was calculated from the logarithm of the initial template concentration plotted against the Cq (quantification cycle) for each dilution. The LOD and LOQ were estimated for each qPCR assay using the qPCR_LOD_Calc R script [39].
2.4. Comparisons of Assay Sensitivity
To assess the differences in sensitivity and duration of the detection between COI and mtTR assays, water samples previously collected and processed from mesocosm experiments were further analyzed here [34]. Briefly, three abundance treatments of three replicates (a total of nine mesocosms) were chosen for analysis. These abundance treatments consisted of 2, 12, and 48 mussels, with each mesocosm consisting of equal numbers of ZMs and QMs (i.e., 1, 6, and 24 mussels, respectively). Each tank was covered with saran wrap for the duration of the experiment. The organisms were maintained within the tanks to release eDNA for a duration of 24 h, after which they were removed by a gloved hand. A new glove was worn for each tank. The time after removing the mussels from each tank was defined as time 0. Water samples collected at 0 h and 144 h were analyzed in this study. The water samples were collected after mixing the water within each mesocosm by stirring with a gloved hand for ~3–5 s. Further description of the water collection and eDNA extraction can be found in [34].
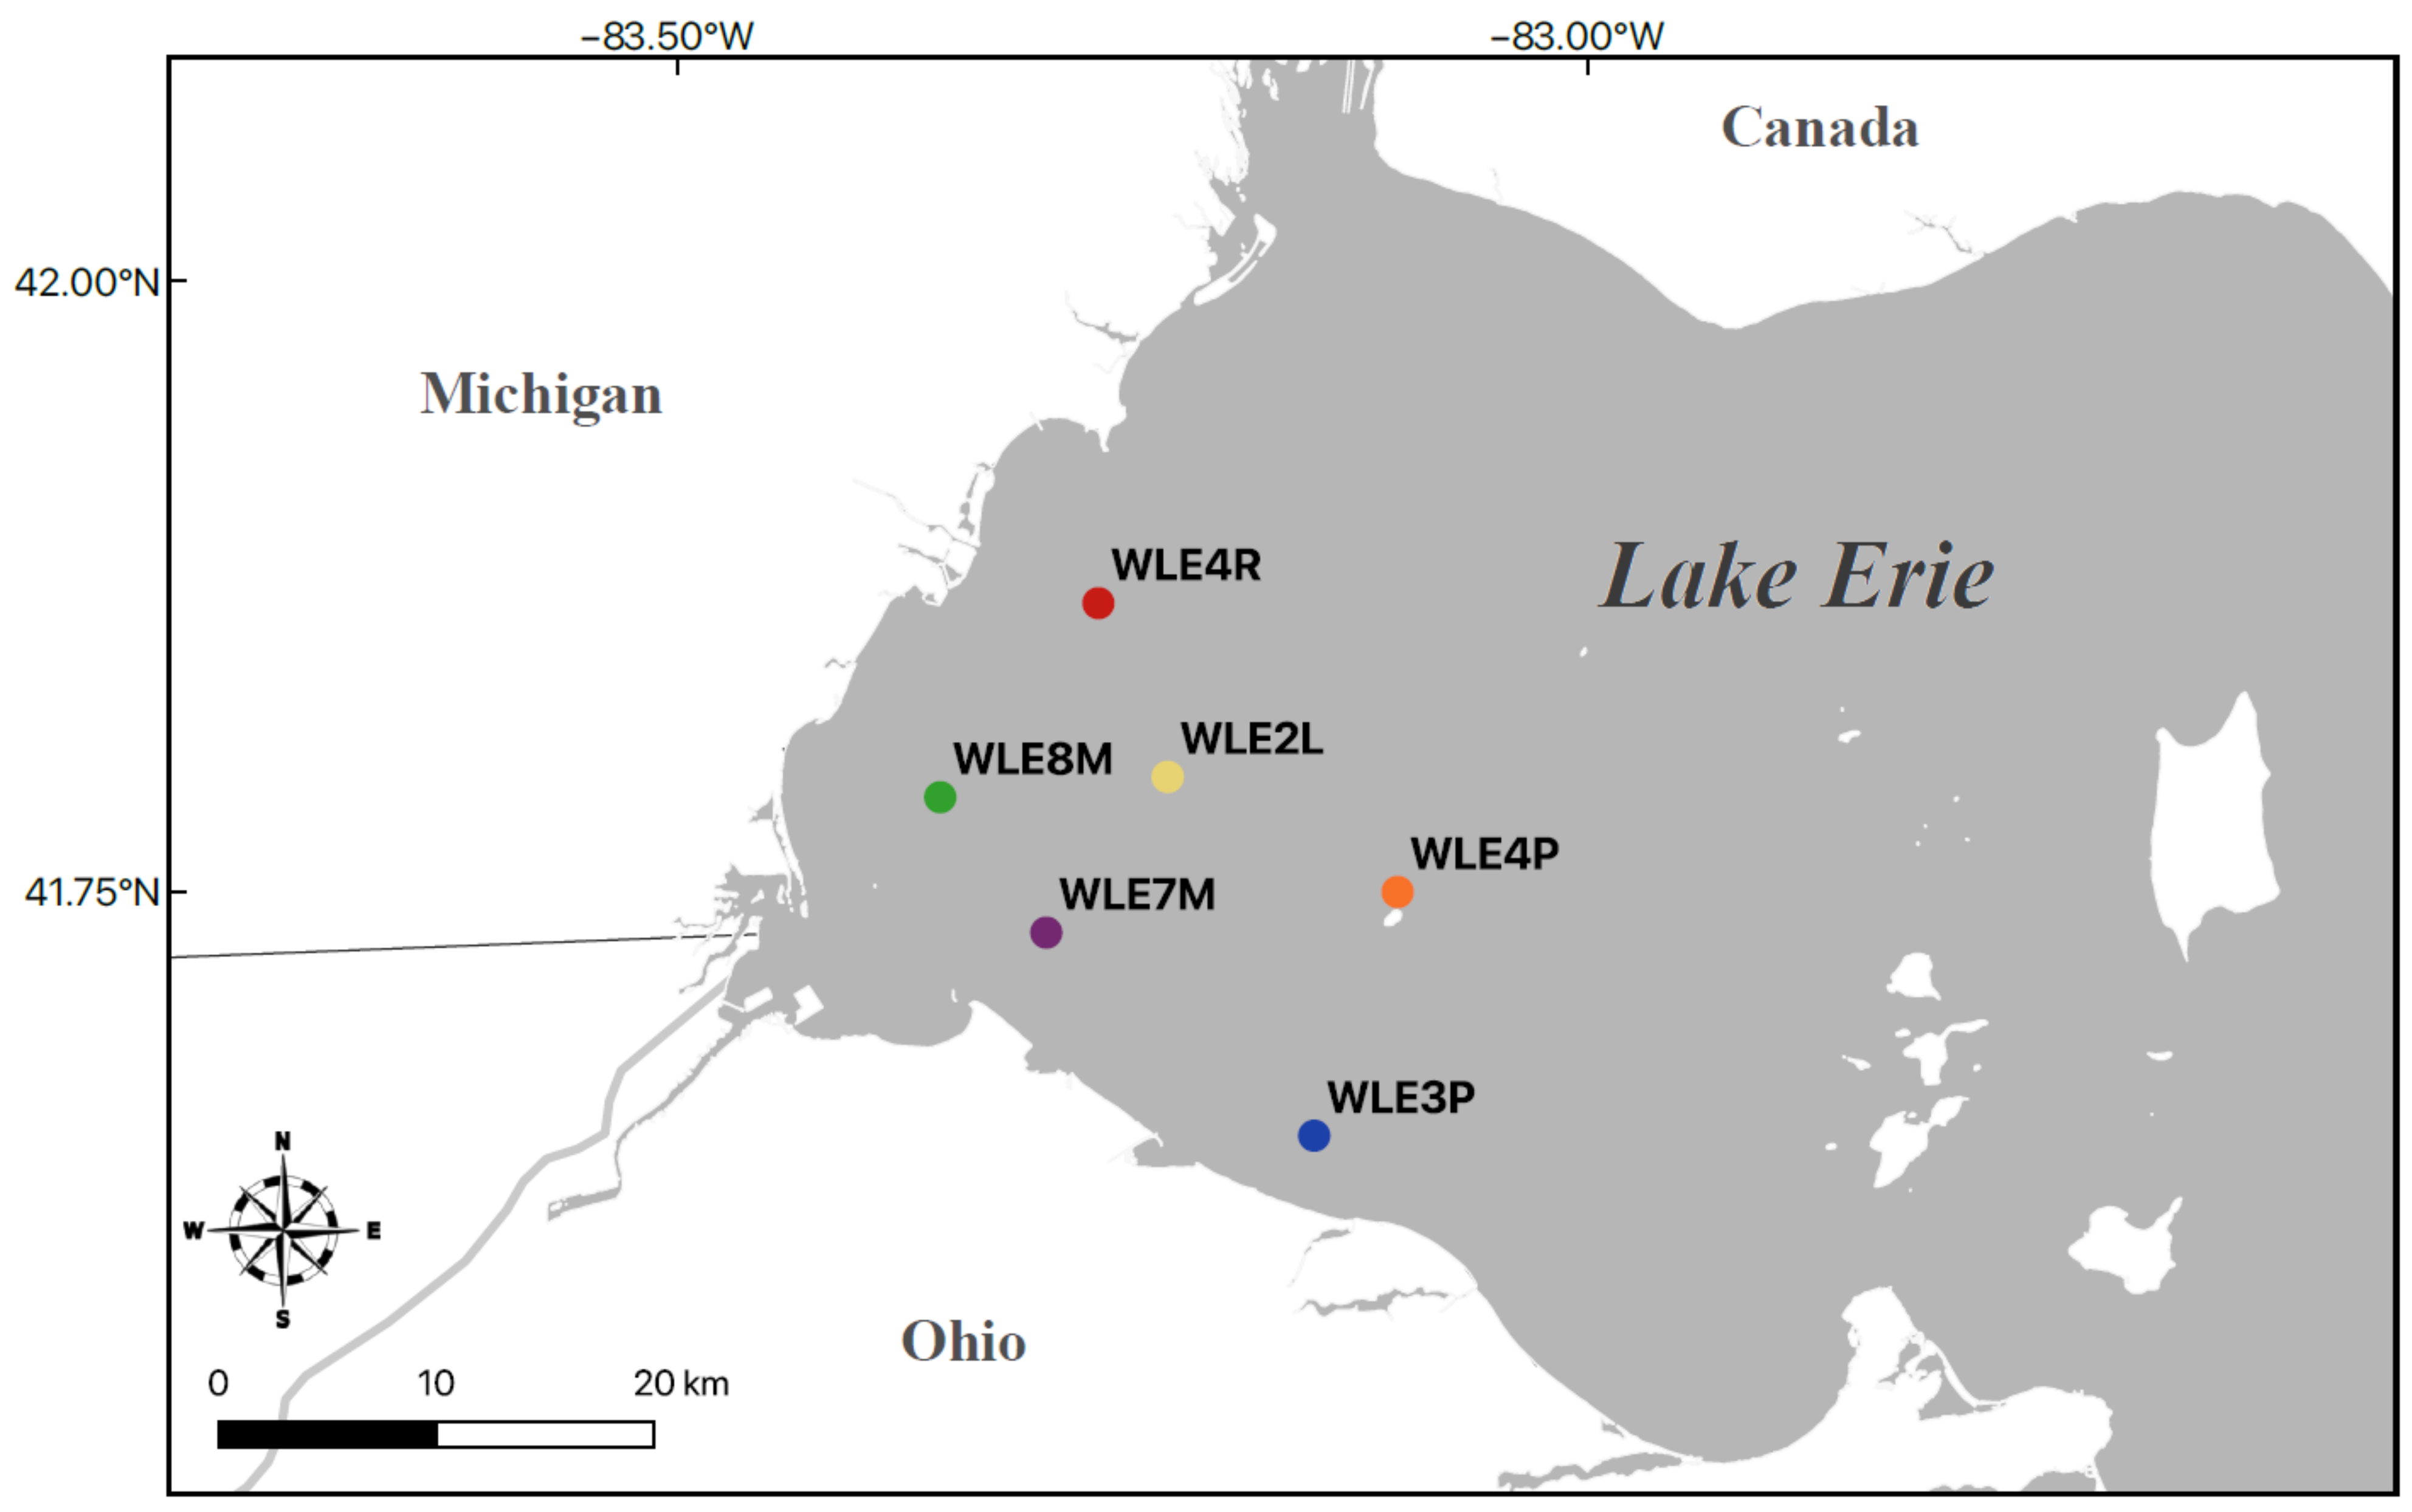
Additionally, detection and assay sensitivity were compared from water samples collected across six sites within western Lake Erie (WLE, Figure 1). Triplicate water samples of 500 mL were collected from ~30 cm below the surface in August of 2019. Water samples were filtered on a 47-mm-diameter glass microfiber filter GF/C (nominal pore size 1.2 µm; GE Healthcare Life Science, Westborough, MA, USA), and eDNA was extracted following a modified Zymo extraction protocol [34]. Water samples were analyzed with the species-specific COI [40] and mtTR assays described above, as well as two genus-specific assays targeting the mt 16S gene and the nu H2B gene regions (Table 1). The 16S gene assay (Dre_16S) was originally designed with a hydrolysis probe [16] but was adopted as a non-probe assay for comparisons in this study. The other three assays (ZM-specific COI and QM-specific COI [40] and the genus-specific H2B (Dre_H2B) [19]) were designed as non-probe assays with EvaGreen-based dye analysis.
PCR conditions followed those listed for the assay validation. Positive standards were constructed for each PCR run using gDNA from ZMs and QMs that was log-diluted from 1 ng to 0.01 ng per reaction. The efficiency of each qPCR run was evaluated by comparing the positive standards to the calibrated standard curve.
The standardized Cq values (40-Cq) from the mesocosm and Lake Erie eDNA samples were compared between the COI and mtTR assays for ZMs and QMs using a Student’s t-test. Additionally, to determine if the COI and mtTR assays provided similar eDNA quantification estimates within the mesocosm and Lake Erie eDNA samples, the concentration of gDNA was quantified from the standard curve for each assay. Linear regression was used to compare estimates of concentrations of gDNA between COI and mtTR assays for both ZMs and QMs.
3. Results
3.1. Copy Number per Genome
The copy number of nu-genes ranged from 6–30 copies per haploid genome, with ribosomal genes displaying the highest copy number (30 copies for 18S and 20 copies for 28S; Table S1). Copies of the 18S gene were found on half of the chromosomes (Chr 2, 3, 4, 5, 7, 9, 12, and 14), while copies of the 28S gene were found on seven of the chromosomes (Chr 2, 3, 4, 5, 6, 9, and 14). Note that these results suggest the presence of pseudogenes for both 18S and 28S within the ZM’s nu-genome, which is common for nu-ribosomal genes among eukaryotes [42]. The two histone genes (H2B and H1) each had 19 copies spread across two chromosomes (Chr 2 and 5), while the MetRS gene had six copies found only on chromosome 5. The gene coding regions within the mt-genome (i.e., 16S, COI, and Cyt b) all displayed the expected single copy per mt-genome (Table S1). The targeted extended repeat regions (Dpo_tr285 and Dro_tr258) within the available mt-genome reference sequences exhibited 115 and 51 copies per mt-genome, respectively (Table 1).
3.2. Assay Specificity
For the newly designed primers for the mt-repeat regions, Primer-BLAST yielded no results for the cross-amplification of any non-target DNA within the NCBI database. Furthermore, no evidence of cross-amplification between sister taxa was observed during the qPCR trials. The melting curve for both primers displayed a single distinct peak with qPCR analysis (ZM = 76 °C and QM = 78 °C).
3.3. Assay Sensitivity—Standard Curves
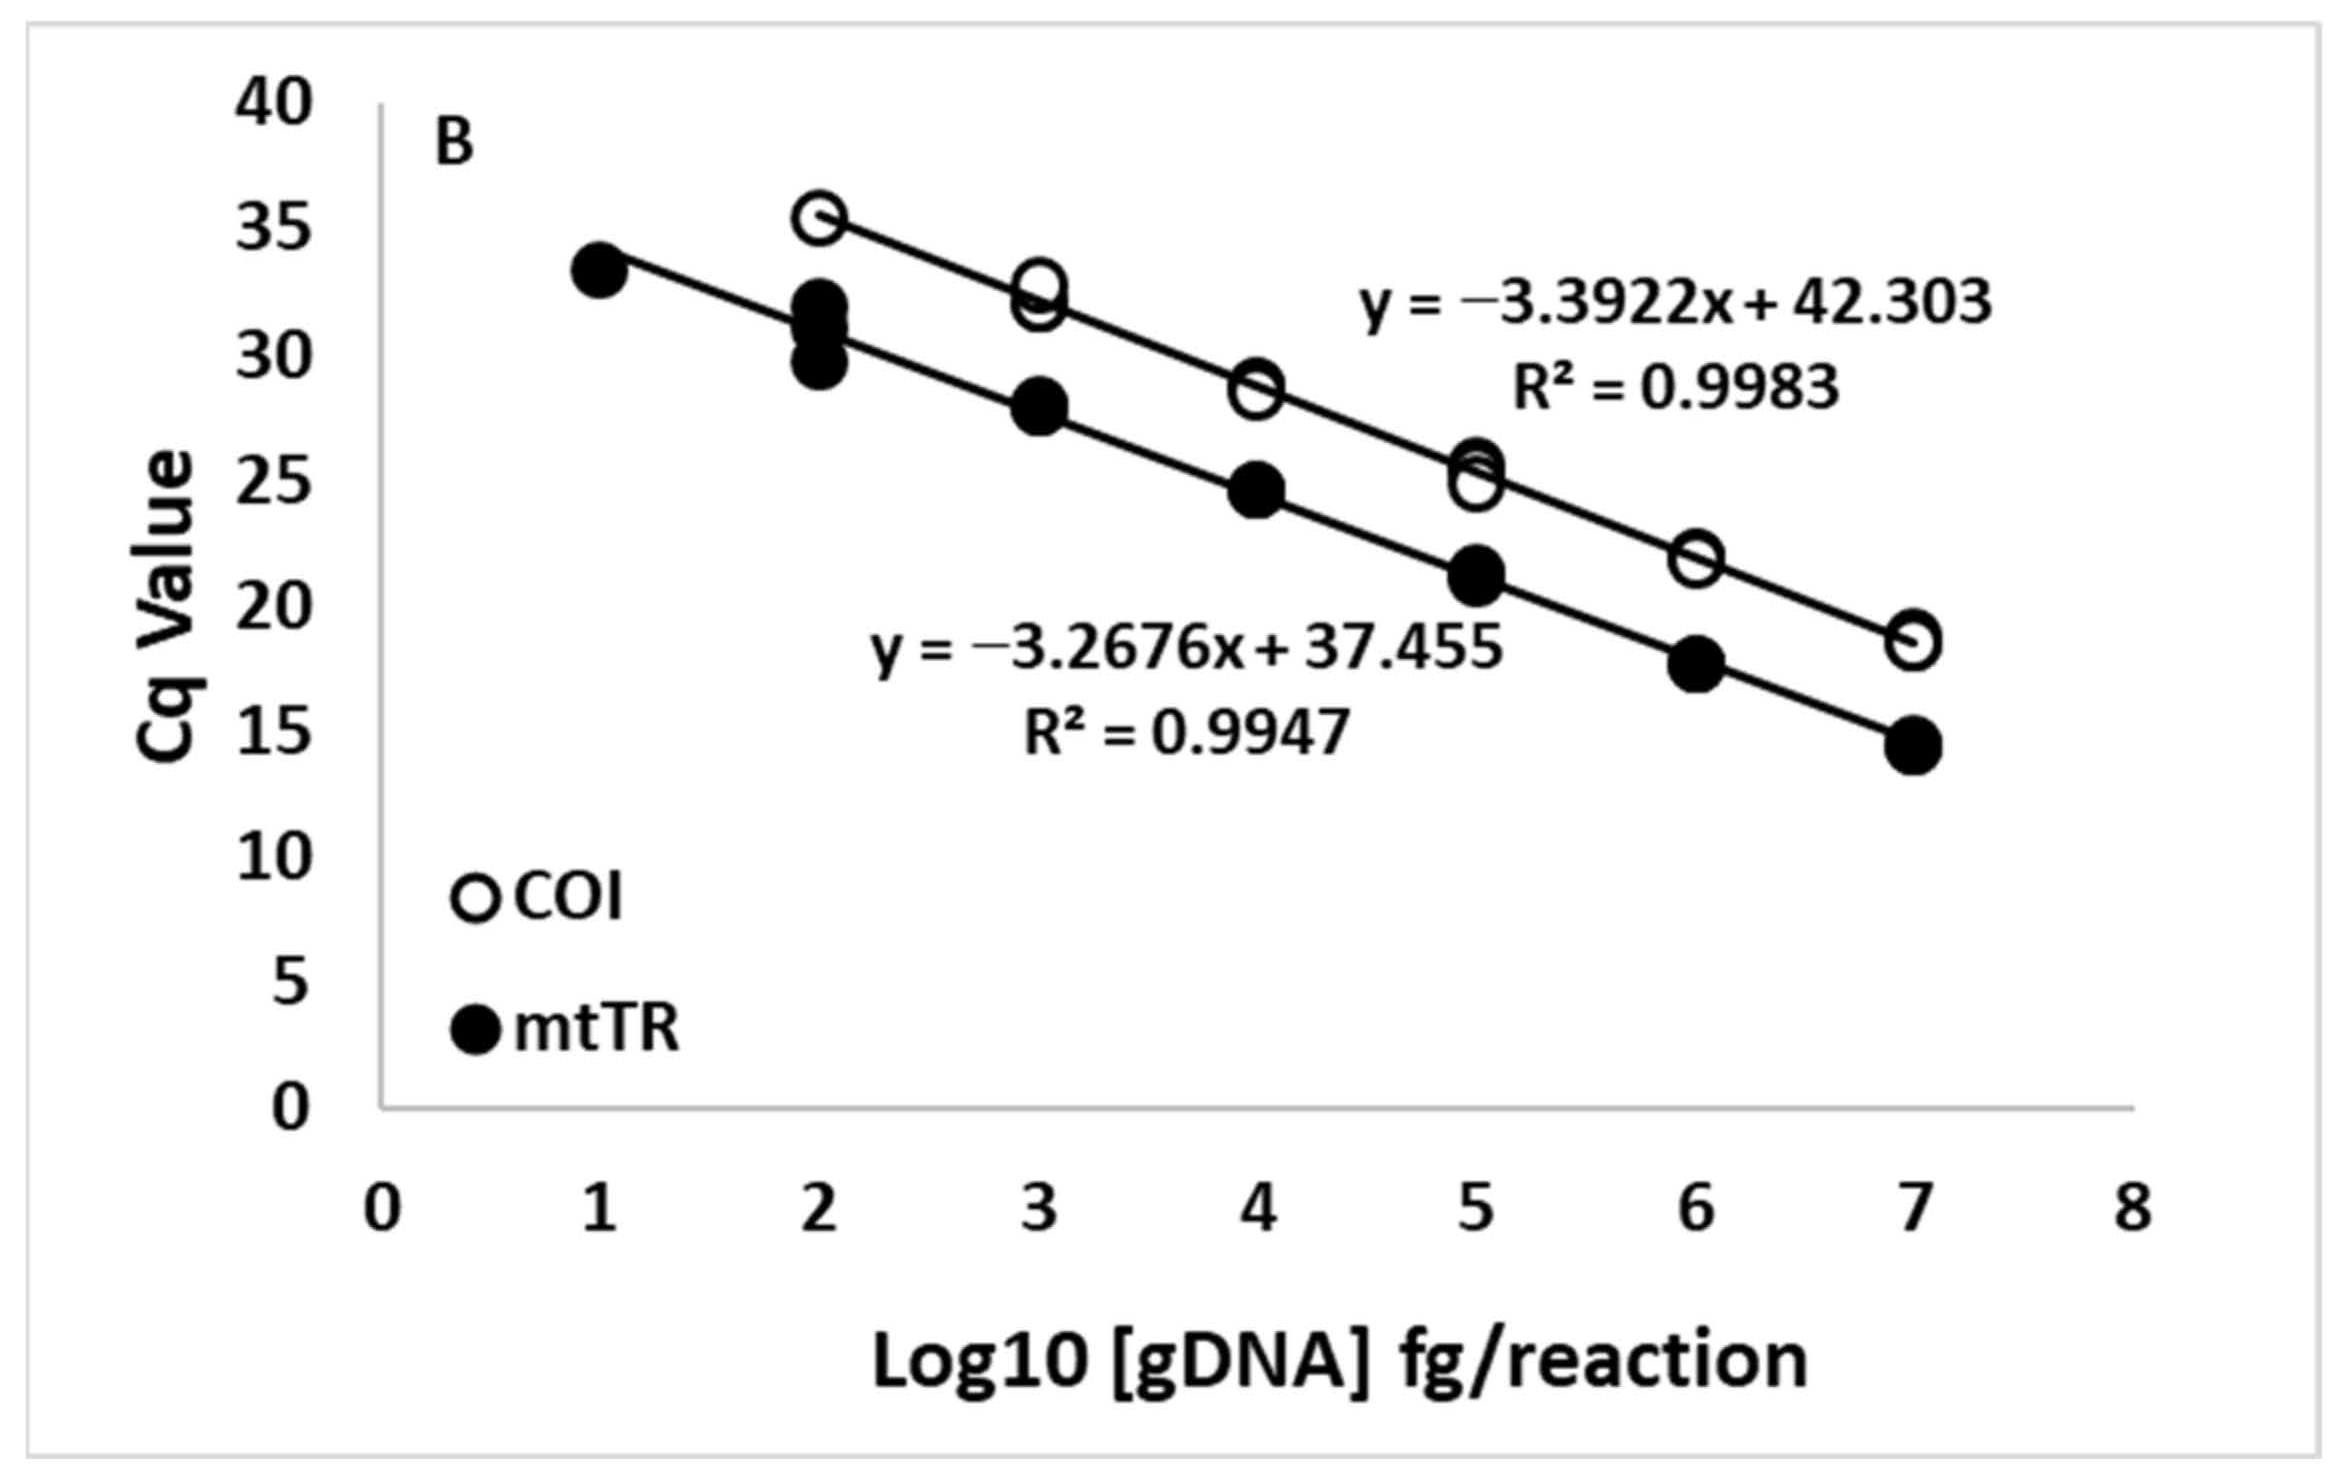
Standard curve analysis using gDNA from the foot tissue estimated high qPCR efficiencies and R2 values for all six assays tested in this study (Table 1). Across the first five standard dilutions (the standards that displayed 100% detection with both the COI and mtTR assays), the mtTR displayed increased sensitivity, as demonstrated by a lower Cq value for both of the species. The ZM’s mtTR assay displayed a shift of 7.05 ± 0.62 Cq values (Figure 2A), while the QM’s mtTR assay displayed a shift of 4.17 ± 0.25 Cq values (Figure 2B).
Additionally, for ZMs, the calculated LOD was determined to be two orders of magnitude lower for the mtTR assay, and LOQ was determined to be one order of magnitude lower for the mtTR assay compared to the COI assay (Table 1). For QMs, the calculated LOD was determined to be one order of magnitude lower for the mtTR assay compared to the COI assay (Table 1).
3.4. Assay Sensitivity—Mesocosm Experiments
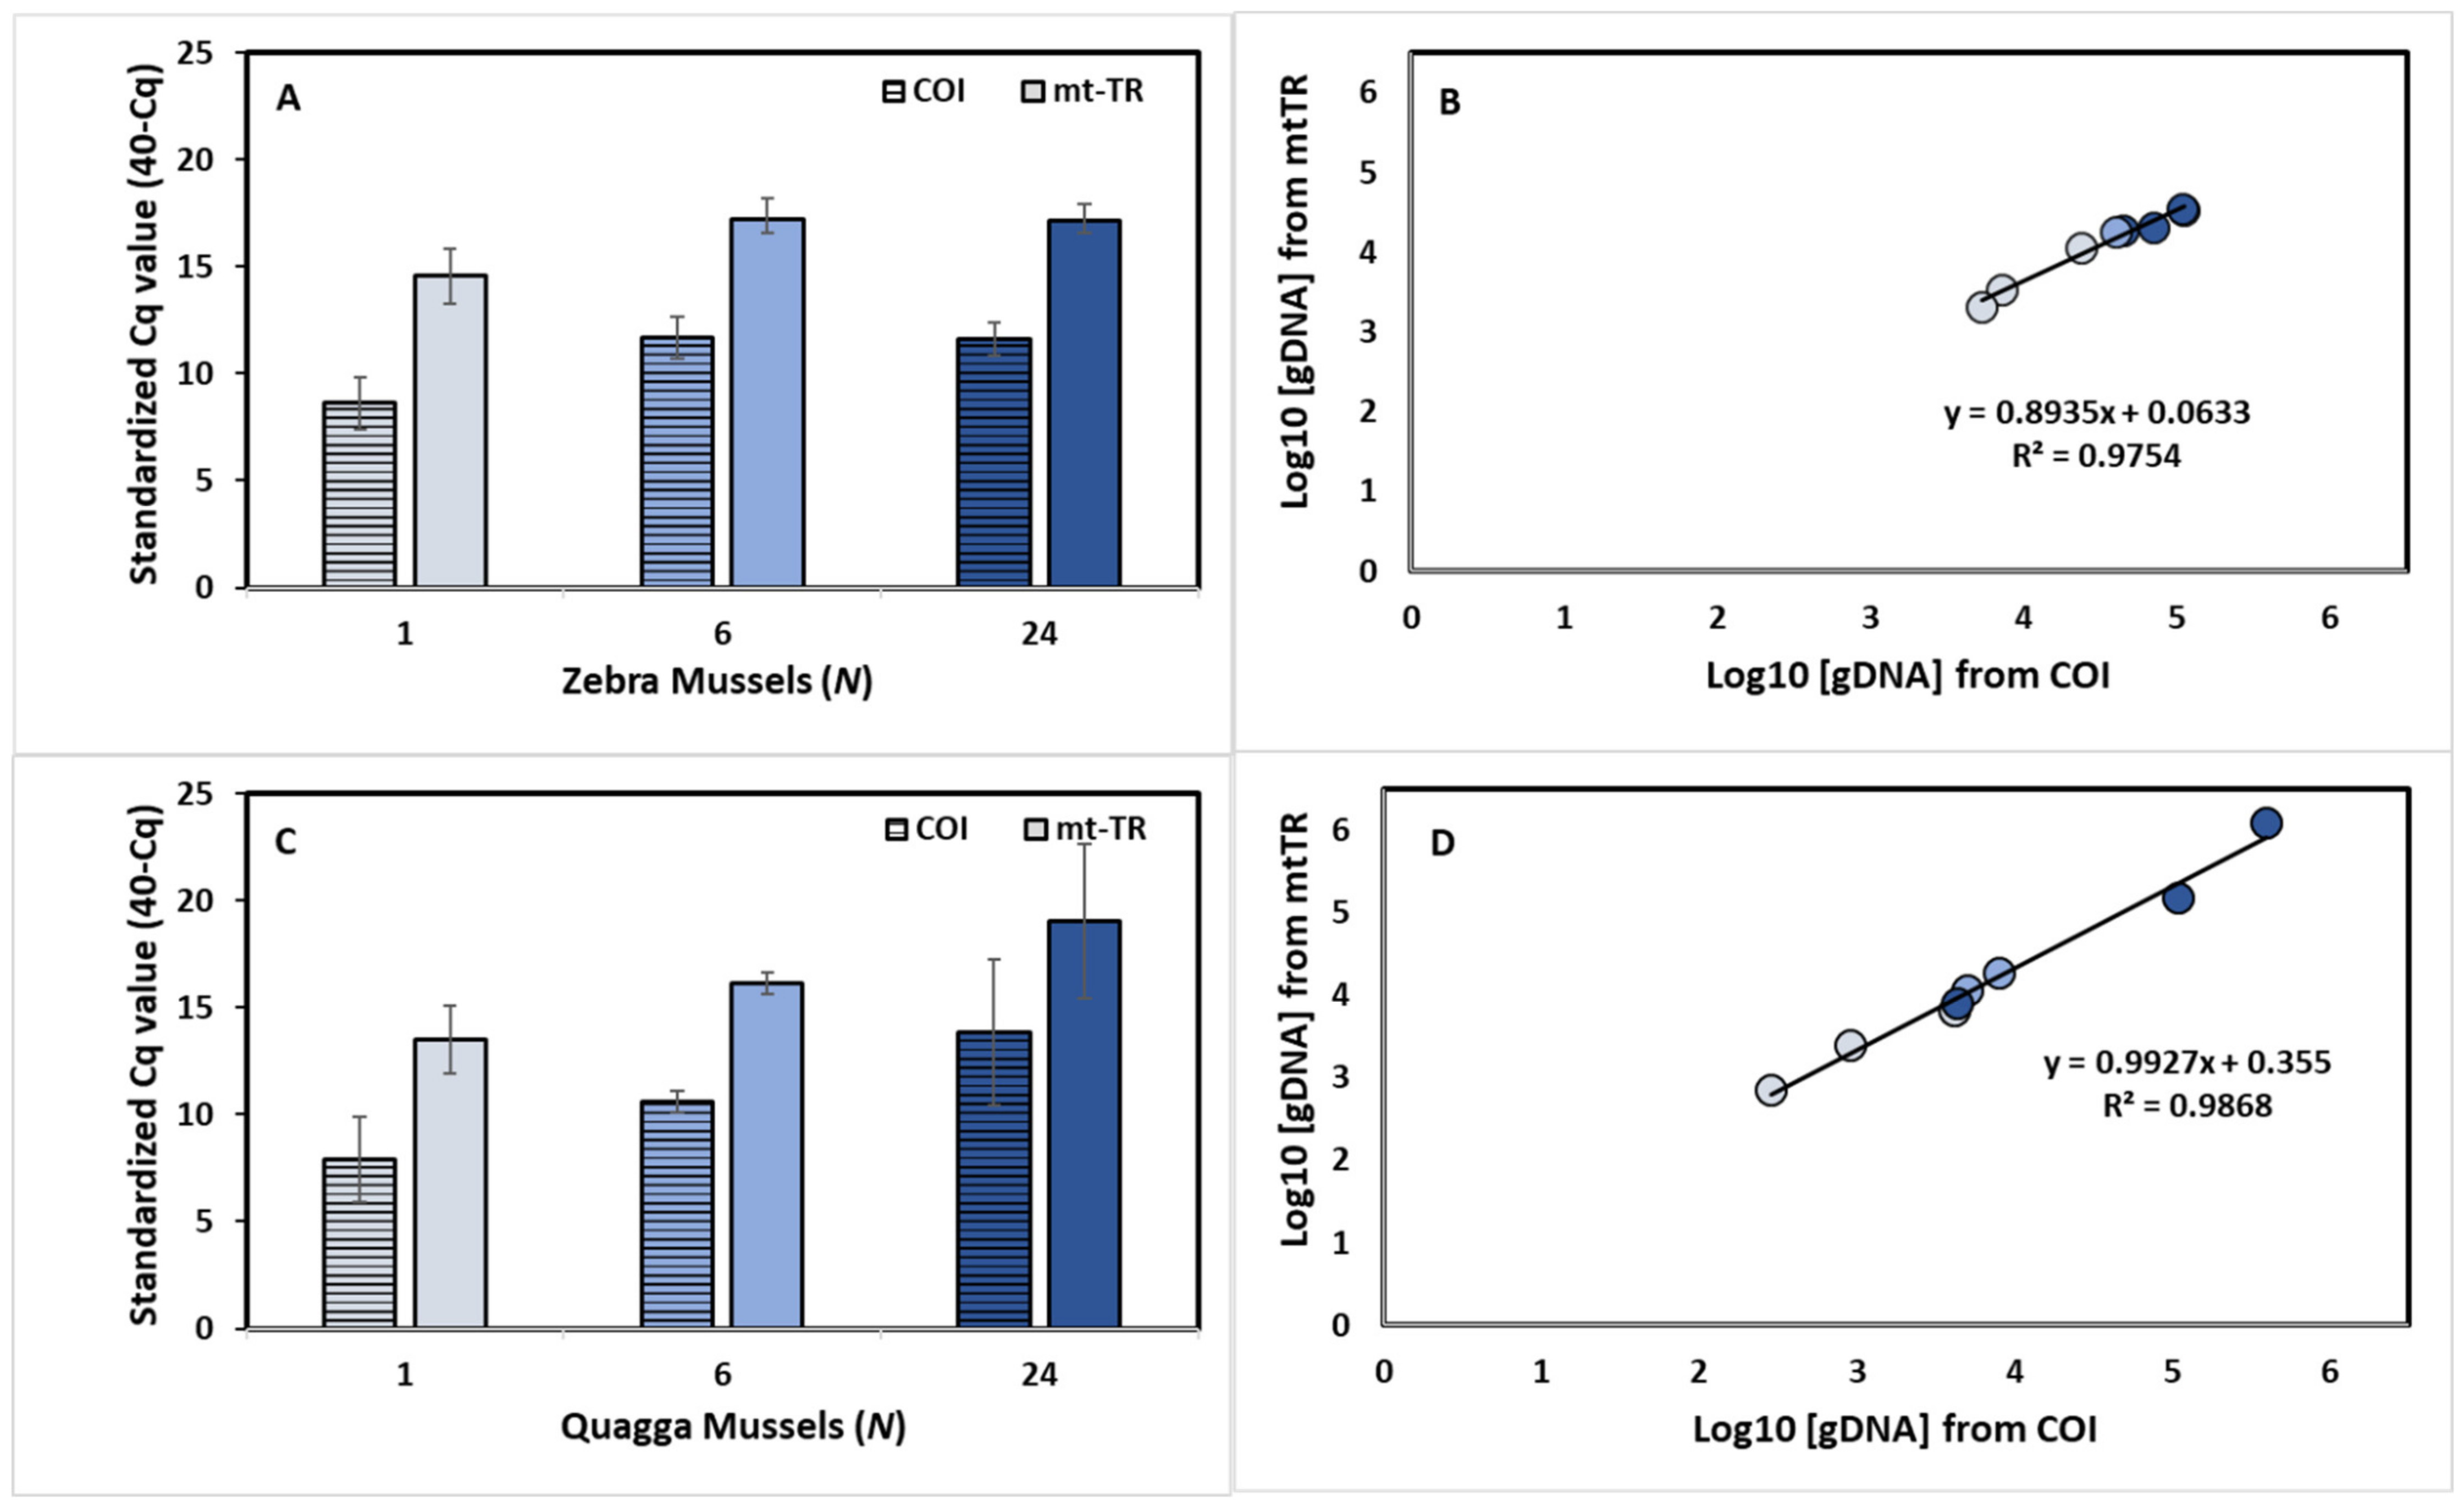
Across all of the mussel abundances at time 0 h, the mtTR assays displayed higher standardized Cq values than the COI assays for both of the species (all of the abundances’ standardized Cq values—ZM: COI = 10.53 ± 1.79, mtTR = 16.20 ± 1.54, p < 0.001 ***; QM: COI = 10.80 ± 3.47, mtTR = 16.23 ± 3.34, p = 0.006 **) (Figure 3A,C). The estimated concentration of the eDNA log10 (fg/uL), calculated based on standard curves, did not differ across the mtTR and COI assays for either of the species (all of the abundances’ eDNA concentrations—ZM: COI = 4.52 ± 0.50, mtTR = 4.10 ± 0.45, p = 0.10; QM: COI = 3.86 ± 1.02, mtTR = 4.19 ± 1.02, p = 0.53) (Figure 3B,D). At the time of 144 h of the eDNA degradation, the COI assay was detected in 44.44% (4/9) of the samples for ZMs and 33.33% (3/9) of the samples for QMs, while the mtTR assay was detected in 89% (8/9) and 100% (9/9) of the samples for ZMs and QMs, respectively.
3.5. Assay Sensitivity—Western Lake Erie
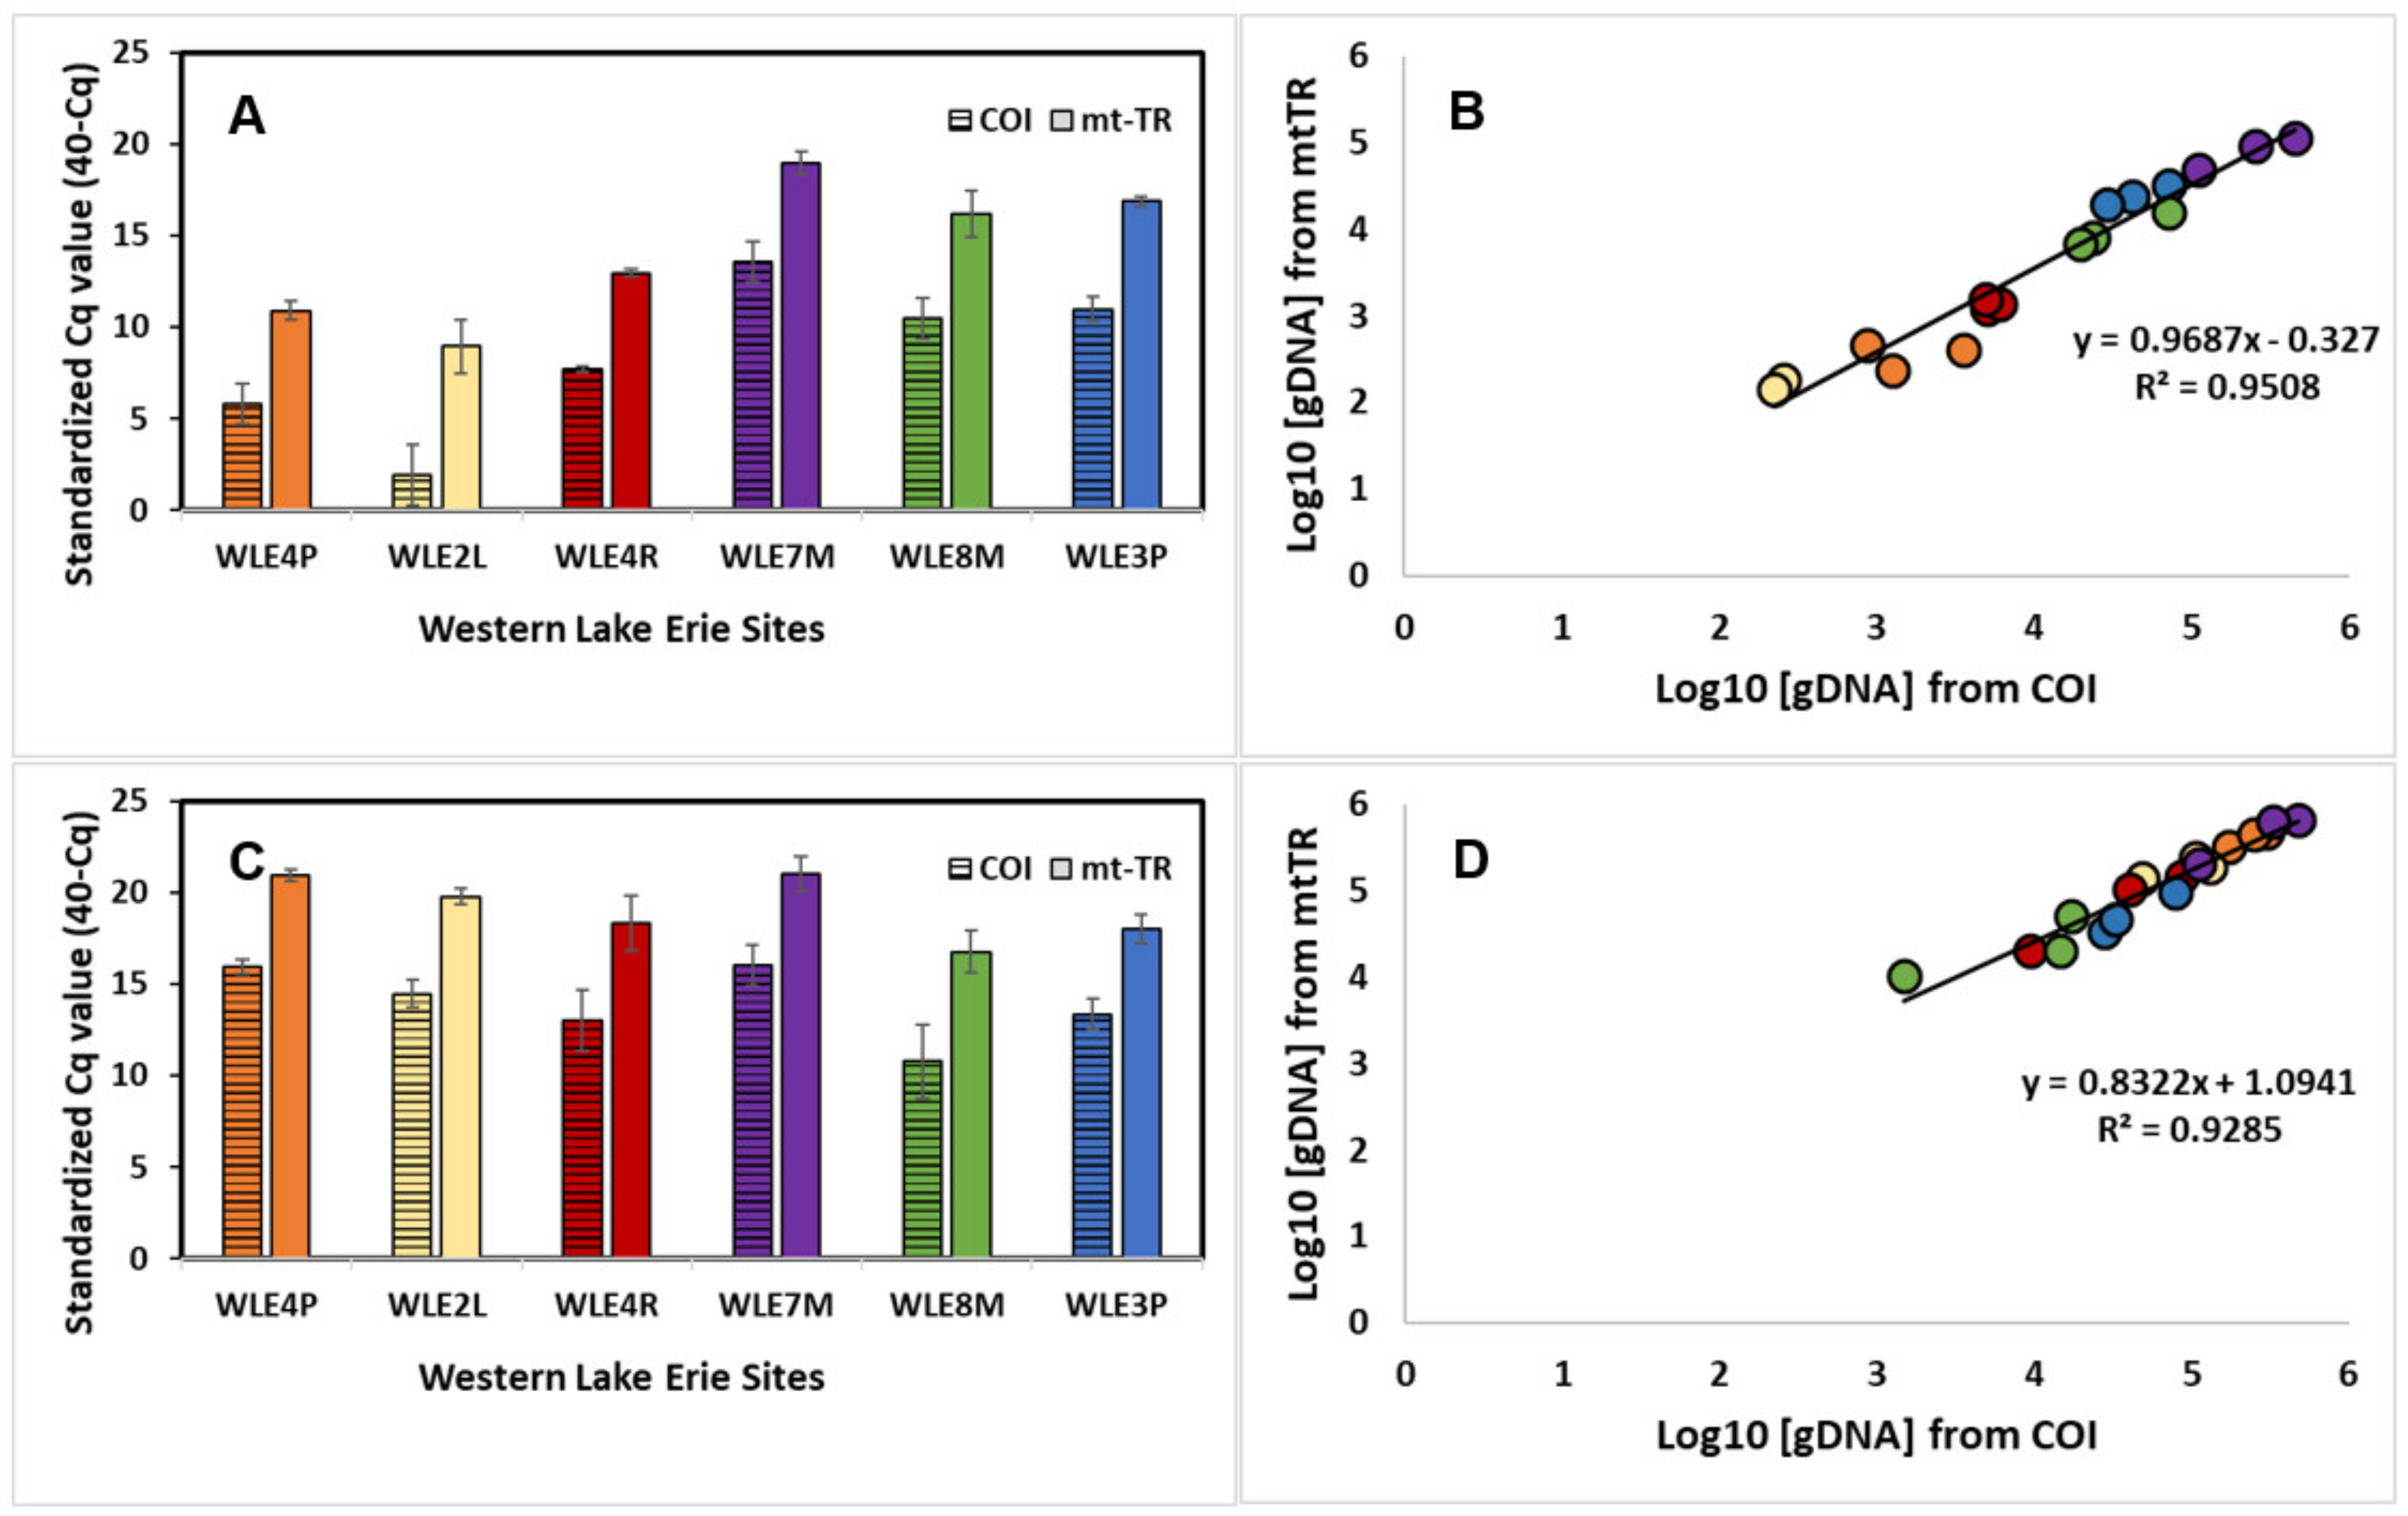
Across the six sampling sites, the standardized Cq values were higher for the mtTR assay compared to the COI for both of the species (all of the sites’ standardized Cq values—ZM: COI = 8.41 ± 4.02, mtTR = 14.12 ± 3.67, p < 0.001 ***; QM: COI = 13.93 ± 2.15, mtTR = 19.13 ± 1.79, p < 0.001 ***) (Figure 4A,C). The estimated concentration of the eDNA log10 (fg/uL), calculated based on tissue extraction standard curves, did not differ across the mtTR and COI for either of the species (all of sites’ standardized eDNA concentrations—ZM: COI = 3.84 ± 1.36, mtTR = 3.50 ± 1.08, p = 0.40; QM: COI = 4.78 ± 0.63, mtTR = 5.08 ± 0.55, p = 0.15) (Figure 4B,D). For both the mtTR and COI assays, ZMs displayed a lower concentration of eDNA compared to QMs across Lake Erie (Figure 5, Figures S1 and S2). Further, ZMs displayed lower eDNA concentrations as sites moved further offshore (Figure 4A and Figure S1). The single-copy genus specific assay (mt-16S) displayed lower standardized Cq values to the QM’s mtTR assay (Figure 5, Figures S1 and S2), while the multi-copy H2B gene assay displayed similar standardized Cq values (Figure 5, Figures S1 and S2).
4. Discussion
As eDNA becomes a standardized sampling methodology for the detection and management of invasive species [10,43], targeting the most abundant genomic fragment can increase the sensitivity of an eDNA assay. Here we demonstrate proof of this concept by taking advantage of the unique structure of the mt-genome of dreissenid mussels. By targeting the tandem repeat regions of the mt-genome, we demonstrated higher sensitivity for the detection of dreissenid eDNA compared to the standard single-copy mt-gene regions (e.g., 16S and COI). Accordingly, the LOD from the tissue gDNA was estimated to be one to two orders of magnitude lower for the mt tandem repeat sections compared to the single-copy COI assays for either of the species. The higher number of copies per cell for these repeat regions allows for a lower total number of cells to be collected within the environment and still achieve a positive detection. While the number of mt-genomes per cell is highly dependent upon the type of tissue, the concentration of the mt-genome is always expected to outnumber the concentration of the nu-genome [44]. Therefore, by targeting a highly repeated section of mt-DNA, we designed species-specific assays targeting the theoretically most abundant DNA region found within a dreissenid mussel cell.
Standard operating procedures for eDNA qPCR assays are beginning to be outlined [28,39,45], and these procedures typically recommend the use of synthetic standards for the analysis of LOD and LOQ [45]. However, while synthetic standards are important for evaluating the efficacy of an eDNA assay in the laboratory, the ability to successfully collect and detect a genetic target from the environment is reliant on the inherent number of target copies found within a cell for the species of interest. Therefore, synthetic standards do not provide the full context of LOD and LOQ in terms of realized copies for various target genes expected to be found within the environment. For example, a qPCR targeting a multi-copy gene for the anthrax pathogen Bacillus anthracis was found to have a similar LOD to the established single-copy assays using synthetic standards; yet the multi-copy gene significantly improved its detection by lowering the Cq threshold by > two cycles [29]. Similarly, our newly developed mtTR assays lowered Cq values by seven and four cycles for ZMs and QMs, respectively. Therefore, these mtTR regions can increase detection rates for eDNA of low population sizes when the concentration of cellular material may be below the detection threshold for standard single-copy gene assays.
While the degradation of the mt-genome is typically slower compared to the nu-genome [33,34,44], it is not known the purpose of these mtTR regions [36] or if they degrade at similar rates to coding regions within the mt-genome. We tested samples collected from a previous mesocosm experiment for the detection of these repeat regions after six days of degradation. While the tandem repeat sections fell below the LOQ for both QMs and ZMs, these two markers still provided high detection rates after six days of degradation, compared to limited detections with the COI assays. This suggests that the high concentrations of the mtTR regions allow for longer time frames of positive detections post- eDNA release. Thus, the longer timeframe allows for an increased detection probability. However, this also presents a potential risk of a false-positive detection relating to the legacy-genomic material or to eDNA transport within a flowing system. Therefore, when an eDNA study focuses on recent presence, such as studies evaluating the success of an eradication event, eDNA analysis may benefit from targeting a faster degrading gene region. In such cases, the use of eRNA may improve the assessments of recent presence, as eRNA has been shown to degrade at expeditated rates [34]. However, because the mtTR assays target non-coding DNA, these mtTR regions are not expected to be translated into RNA within the cell and thus will not be useful with eRNA analysis.
The water samples from Lake Erie were found to have much larger standardized Cq values for the mtTR assay compared to the COI assay for both ZMs and QMs. Additionally, for majority of the sites, the QM mtTR assay provided higher standardized Cq values than the genus-specific 16S gene assay, which amplifies both the ZM’s and QM’s eDNA. This suggests that in some cases, the species-specific mtTR assays can even be more sensitive than a genus-specific single-copy assay. However, the multi-copy genus-specific H2B gene assay provided similarly high standardized Cq values, further suggesting that multi-copy targets greatly improve sensitivity [34]. If monitoring programs are not particularly interested in distinguishing between the two species, the genus-specific H2B target may provide better sensitivity than a species-specific assay to detect low-density dreissenid populations. However, the designed primers in this study allow high sensitivity at the species level, providing improved detection when species-specific information is necessary. For example, in this study, large variations in eDNA concentration was found for ZM, with the highest concentrations occurring in sites nearshore, while QM’s eDNA concentration displayed a much smaller variation across the sites. These patterns of eDNA concentration between the species are not possible with a genus-specific assays.
Unlike single-copy genes, it is unknown how much variation occurs in the number of mtTR repeats within individuals, between individuals, and between populations. Currently, only one mt-genome has been sequenced for both ZMs and QMs; thus, it is not possible to estimate a population and spatial variation within this non-coding region. It is hypothesized that the mt-genome displays some levels of heteroplasmy, whereas the number of repeats can differ between individuals and even between cells within an individual [36]. Therefore, while both mtTR assays displayed increasing DNA concentrations with the mussel abundance across the mesocosms, the unknown level of heteroplasmy may result in misleading abundance estimates when quantifying eDNA with these mtTR assays. Additionally, no mt-genomes have been sequenced for other closely related Dreissena taxa, and thus it is not known if these mtTR assays will cross-amplify with other sister taxa in co-occurring habitats. However, these assays show a clear specificity against the two tested species, with a clear distinction between the ZM’s and QM’s mtTR regions. Continued investigations into the mt-genome structure across geographical populations and between dreissenid taxa will improve the evaluation and interpretation of quantified eDNA from mtTR assays in the future.
While these extended mt-genome repeat regions are rare within the animal kingdom, this study provides proof of concept to increase the efficiency and effectiveness of eDNA by incorporating whole genome information. Additionally, mt tandem repeat regions have recently been discovered in the parasitic worm Schistosoma haematobium [46] and are common among plants [47]. Thus, a similar approach for assay development may be beneficial for improving eDNA detection for a wide range of taxa. Likewise, other studies have shown increased assay sensitivity when targeting a multi-copy nu-gene [31,32,33,34], suggesting that gene copy number should be considered in eDNA assay development. It is important to note that the majority of developed assays target the COI gene region due to the wealth of information available to properly evaluate species-specificity [28,45]; thus, the development of assays targeting other gene regions may be limited until more in-depth genomic databases are developed. This study expresses the need to understand the unique cellular aspects (including the genomic structure) of an organism to develop the most efficient and effective eDNA methodology for detection efforts.
Supplementary Materials
The following are available online at https://www.mdpi.com/article/10.3390/w14132069/s1, Figure S1: The Standardized Cq values (±standard deviation) across water samples collected from six sites in western Lake Erie for ZM_COI, ZM_mtTR, QM_COI, QM_mtTR, Dre_16S, and Dre_H2B. Figure S2: The Standardized Cq values (±standard deviation) for each of the six eDNA assays from triplicate water samples collected at WLE4P, WLE2L, WLE4R, WLE7M, WLE8M, and WLE3P. Table S1: Gene regions across the nuclear (nu-) and mitochondrial (mt-) genomes used for developing diagnostic molecular assays targeting zebra mussel (Dreissena polymorpha), quagga mussel (D. rostriformis), or both [48,49,50,51,52,53,54,55,56].
Author Contributions
N.T.M., H.A.V. and S.R.C. were involved in developing the experimental design. N.T.M. and S.R.C. conducted the experiments. Data analysis was performed by N.T.M. and S.R.C. provided the feedback for the analysis. The first draft was written by N.T.M. All authors have read and agreed to the published version of the manuscript.
Funding
Funding was awarded to the Cooperative Institute for Great Lakes Research (CIGLR) through the NOAA Cooperative Agreement with the University of Michigan (NA17OAR4320152). The CIGLR contribution number is 1195 and the NOAA GLERL contribution number is 2007.
Data Availability Statement
Corresponding to the standard curves of genomic DNA and the qPCR Cq values for the mesocosm and Lake Erie eDNA samples are uploaded to GitHub https://github.com/ntmarshall406/Dreissenid_mtTR_eDNA_Assays, accessed on 15 October 2021.
Acknowledgments
We thank the staff of CIGLR and NOAA GLERL for providing opportunities and assistance with the Lake Erie sample collection. Specifically, we thank Kent Baker for coordinating and Paul Den Uyl for the sample collection during the NOAA GLERL and CIGLR HABs monitoring in western Lake Erie.
Conflicts of Interest
The authors declare no conflict of interest.
References
- Nalepa, T.F.; Schloesser, D.W. (Eds.) Quagga and Zebra Mussels: Biology, Impacts, and Control; CRC Press: Boca Raton, FL, USA, 2013; pp. 9–32. [Google Scholar]
- Marshall, N.T.; Stepien, C.A. The family Dreissenidae. In Freshwater Mollusk Families of the World; Cummings, K., Lydeard, C., Eds.; JHU Press: Baltimore, MD, USA, 2019; pp. 193–196. [Google Scholar]
- Vanderploeg, H.A.; Nalepa, T.F.; Jude, D.J.; Mills, E.L.; Holeck, K.T.; Liebig, J.R.; Grigorovich, I.A.; Ojaveer, H. Dispersal and emerging ecological impacts of Ponto-Caspian species in the Laurentian Great Lakes. Can. J. Fish. Aquat. Sci. 2002, 59, 1209–1228. [Google Scholar] [CrossRef] [Green Version]
- Higgins, S.N.; Zanden, M.J.V. What a difference a species makes: A meta–analysis of dreissenid mussel impacts on freshwater ecosystems. Ecol. Monogr. 2010, 80, 179–196. [Google Scholar] [CrossRef] [Green Version]
- Carlton, J.T. The zebra mussel Dreissena polymorpha found in North America in 1986 and 1987. J. Great Lakes Res. 2008, 34, 770–773. [Google Scholar] [CrossRef]
- May, B.; Marsden, J.E. Genetic identification and implications of another invasive species of dreissenid mussel in the Great Lakes. Can. J. Fish. Aquat. Sci. 1992, 49, 1501–1506. [Google Scholar] [CrossRef]
- De Ventura, L.; Weissert, N.; Tobias, R.; Kopp, K.; Jokela, J. Overland transport of recreational boats as a spreading vector of zebra mussel Dreissena polymorpha. Biol. Invasions 2016, 18, 1451–1466. [Google Scholar] [CrossRef]
- Snyder, M.R.; Stepien, C.A.; Marshall, N.; Scheppler, H.B.; Black, C.L.; Czajkowski, K.P. Detecting aquatic invasive species in bait and pond stores with targeted environmental (e)DNA high-throughput sequencing metabarcode assays: Angler, retailer, and manager implications. Biol. Conserv. 2020, 245, 108430. [Google Scholar] [CrossRef]
- Patoka, J.; Patoková, B. Hitchhiking Exotic Clam: Dreissena polymorpha (Pallas, 1771) transported via the ornamental plant trade. Diversity 2021, 13, 410. [Google Scholar] [CrossRef]
- Sepulveda, A.; Smith, D.; O’Donnell, K.; Owens, N.; White, B.; Richter, C.; Merkes, C.; Wolf, S.; Rau, M.; Neilson, M.; et al. Using structured decision making to evaluate potential management responses to detection of dreissenid mussel (Dreissena spp.) environmental DNA. Manag. Biol. Invasions 2022, 13, 344–368. [Google Scholar] [CrossRef]
- Ginn, B.K.; Bolton, R.; Coulombe, D.; Fleischaker, T.; Yerex, G. Quantifying a shift in benthic dominance from zebra (Dreissena polymorpha) to quagga (Dreissena rostriformis bugensis) mussels in a large, inland lake. J. Great Lakes Res. 2018, 44, 271–282. [Google Scholar] [CrossRef]
- Larson, C.E.; Barge, J.T.; Hatzenbuhler, C.L.; Hoffman, J.C.; Peterson, G.S.; Pilgrim, E.M.; Wiechman, B.; Rees, C.B.; Trebitz, A.S. Invasive Dreissena mussel coastal transport from an already invaded estuary to a nearby archipelago detected in DNA and zooplankton surveys. Front. Mar. Sci. 2022, 9, 818738. [Google Scholar] [CrossRef]
- Feist, S.M.; Lance, R.F. Advanced molecular-based surveillance of quagga and zebra mussels: A review of environmental DNA/RNA (eDNA/eRNA) studies and considerations for future directions. NeoBiota 2021, 66, 117–159. [Google Scholar] [CrossRef]
- Frischer, M.E.; Hansen, A.S.; Wyllie, J.A.; Wimbush, J.; Murray, J.; Nierzwicki-Bauer, S.A. Specific amplification of the 18S rRNA gene as a method to detect zebra mussel (Dreissena polymorpha) larvae in plankton samples. Hydrobiologia 2002, 487, 33–44. [Google Scholar] [CrossRef]
- Sepulveda, A.J.; Nelson, N.M.; Jerde, C.L.; Luikart, G. Are environmental DNA methods ready for aquatic invasive species management? Trends Ecol. Evol. 2020, 35, 668–678. [Google Scholar] [CrossRef]
- Gingera, T.; Bajno, R.; Docker, M.; Reist, J. Environmental DNA as a detection tool for zebra mussels Dreissena polymorpha (Pallas, 1771) at the forefront of an invasion event in Lake Winnipeg, Manitoba, Canada. Manag. Biol. Invasions 2017, 8, 287–300. [Google Scholar] [CrossRef] [Green Version]
- Amberg, J.J.; Merkes, C.M.; Stott, W.; Rees, C.B.; Erickson, R.A. Environmental DNA as a tool to help inform zebra mussel, Dreissena polymorpha, management in inland lakes. Manag. Biol. Invasions 2019, 10, 96–110. [Google Scholar] [CrossRef] [Green Version]
- Marshall, N.; Stepien, C.A. Invasion genetics from eDNA and thousands of larvae: A targeted metabarcoding assay that distinguishes species and population variation of zebra and quagga mussels. Ecol. Evol. 2019, 9, 3515–3538. [Google Scholar] [CrossRef]
- Peñarrubia, L.; Alcaraz, C.; De Vaate, A.B.; Sanz, N.; Pla, C.; Vidal, O.; Viñas, J. Validated methodology for quantifying infestation levels of dreissenid mussels in environmental DNA (eDNA) samples. Sci. Rep. 2016, 6, 39067. [Google Scholar] [CrossRef]
- De Ventura, L.; Kopp, K.; Seppälä, K.; Jokela, J. Tracing the quagga mussel invasion along the Rhine river system using eDNA markers: Early detection and surveillance of invasive zebra and quagga mussels. Manag. Biol. Invasions 2017, 8, 101–112. [Google Scholar] [CrossRef] [Green Version]
- Shogren, A.J.; Tank, J.L.; Egan, S.P.; Bolster, D.; Riis, T. Riverine distribution of mussel environmental DNA reflects a balance among density, transport, and removal processes. Freshw. Biol. 2019, 64, 1467–1479. [Google Scholar] [CrossRef]
- Blackman, R.C.; Ling, K.K.S.; Harper, L.R.; Shum, P.; Hänfling, B.; Lawson-Handley, L. Targeted and passive environmental DNA approaches outperform established methods for detection of quagga mussels, Dreissena rostriformis bugensis in flowing water. Ecol. Evol. 2020, 10, 13248–13259. [Google Scholar] [CrossRef]
- Marshall, N.T.; Stepien, C.A. Macroinvertebrate community diversity and habitat quality relationships along a large river from targeted eDNA metabarcode assays. Environ. DNA 2020, 2, 572–586. [Google Scholar] [CrossRef]
- Johansson, M.L.; Lavigne, S.Y.; Ramcharan, C.W.; Heath, D.D.; MacIsaac, H.J. Detecting a spreading non-indigenous species using multiple methodologies. Lake Reserv. Manag. 2020, 36, 432–443. [Google Scholar] [CrossRef]
- Xia, Z.; Johansson, M.L.; Gao, Y.; Zhang, L.; Haffner, G.D.; MacIsaac, H.J.; Zhan, A. Conventional versus real-time quantitative PCR for rare species detection. Ecol. Evol. 2018, 8, 11799–11807. [Google Scholar] [CrossRef] [PubMed]
- Trebitz, A.S.; Hatzenbuhler, C.L.; Hoffman, J.C.; Meredith, C.S.; Peterson, G.S.; Pilgrim, E.M.; Barge, J.T.; Cotter, A.M.; Wick, M. Dreissena veligers in western Lake Superior—Inference from new low-density detection. J. Great Lakes Res. 2019, 45, 691–699. [Google Scholar] [CrossRef]
- Robin, E.D.; Wong, R. Mitochondrial DNA molecules and virtual number of mitochondria per cell in mammalian cells. J. Cell. Physiol. 1988, 136, 507–513. [Google Scholar] [CrossRef]
- Thalinger, B.; Deiner, K.; Harper, L.R.; Rees, H.C.; Blackman, R.C.; Sint, D.; Traugott, M.; Goldberg, C.S.; Bruce, K. A validation scale to determine the readiness of environmental DNA assays for routine species monitoring. Environ. DNA 2021, 3, 823–836. [Google Scholar] [CrossRef]
- Braun, P.; Nguyen, M.D.-T.; Walter, M.C.; Grass, G. Ultrasensitive Detection of Bacillus anthracis by Real-Time PCR Targeting a Polymorphism in Multi-Copy 16S rRNA Genes and Their Transcripts. Int. J. Mol. Sci. 2021, 22, 12224. [Google Scholar] [CrossRef]
- Shan, J.; Jia, Y.; Teulières, L.; Patel, F.; Clokie, M.R.J. Targeting multicopy prophage genes for the increased detection of Borrelia burgdorferi sensu lato (s.l.), the causative agents of Lyme disease, in blood. Front. Microbiol. 2021, 12, 464. [Google Scholar] [CrossRef]
- Minamoto, T.; Uchii, K.; Takahara, T.; Kitayoshi, T.; Tsuji, S.; Yamanaka, H.; Doi, H. Nuclear internal transcribed spacer-1 as a sensitive genetic marker for environmental DNA studies in common carp Cyprinus carpio. Mol. Ecol. Resour. 2017, 17, 324–333. [Google Scholar] [CrossRef]
- Dysthe, J.C.; Franklin, T.W.; McKelvey, K.S.; Young, M.K.; Schwartz, M.K. An improved environmental DNA assay for bull trout (Salvelinus confluentus) based on the ribosomal internal transcribed spacer I. PLoS ONE 2018, 13, e0206851. [Google Scholar] [CrossRef]
- Jo, T.; Arimoto, M.; Murakami, H.; Masuda, R.; Minamoto, T. Estimating shedding and decay rates of environmental nuclear DNA with relation to water temperature and biomass. Environ. DNA 2020, 2, 140–151. [Google Scholar] [CrossRef] [Green Version]
- Marshall, N.T.; Vanderploeg, H.A.; Chaganti, S.R. Environmental (e)RNA advances the reliability of eDNA by predicting its age. Sci. Rep. 2021, 11, 2769. [Google Scholar] [CrossRef] [PubMed]
- McCartney, M.A.; Auch, B.; Kono, T.; Mallez, S.; Zhang, Y.; Obille, A.; Becker, A.; Abrahante, J.E.; Garbe, J.; Badalamenti, J.P.; et al. The genome of the zebra mussel, Dreissena polymorpha: A resource for comparative genomics, invasion genetics, and biocontrol. G3 Genes Genom. Genet. 2022, 12, jkab423. [Google Scholar] [CrossRef] [PubMed]
- Calcino, A.; Baranyi, C.; Wanninger, A. Heteroplasmy and repeat expansion in the plant-like mitochondrial genome of a bivalve mollusc. bioRxiv 2020, 1–32. [Google Scholar] [CrossRef]
- Ye, J.; Coulouris, G.; Zaretskaya, I.; Cutcutache, I.; Rozen, S.; Madden, T.L. Primer-BLAST: A tool to design target-specific primers for polymerase chain reaction. BMC Bioinform. 2012, 13, 134. [Google Scholar] [CrossRef] [Green Version]
- Benson, G. Tandem repeats finder: A program to analyze DNA sequences. Nucleic Acids Res. 1999, 27, 573–580. [Google Scholar] [CrossRef] [Green Version]
- Klymus, K.E.; Merkes, C.M.; Allison, M.J.; Goldberg, C.S.; Helbing, C.C.; Hunter, M.E.; Jackson, C.A.; Lance, R.F.; Mangan, A.M.; Monroe, E.M.; et al. Reporting the limits of detection and quantification for environmental DNA assays. Environ. DNA 2019, 2, 271–282. [Google Scholar] [CrossRef] [Green Version]
- Blackman, R.; Benucci, M.; Donnelly, R.; Hänfling, B.; Harper, L.; Sellers, G.; Lawson-Handley, L. Simple, sensitive and species-specific assays for detecting quagga and zebra mussels (Dreissena rostriformis bugensis and D. polymorpha) using environmental DNA. Manag. Biol. Invasions 2020, 11, 218–236. [Google Scholar] [CrossRef]
- Bustin, S.A.; Benes, V.; Garson, J.A.; Hellemans, J.; Huggett, J.; Kubista, M.; Mueller, R.; Nolan, T.; Pfaffl, M.W.; Shipley, G.L.; et al. The MIQE Guidelines: Minimum Information for Publication of Quantitative Real-Time PCR Experiments. Clin. Chem. 2009, 55, 611–622. [Google Scholar] [CrossRef] [Green Version]
- Li, Y.; Yang, R.-H.; Jiang, L.; Hu, X.-D.; Wu, Z.-J.; Yao, Y.-J. rRNA pseudogenes in filamentous ascomycetes as revealed by genome data. G3 Genes Genom. Genet. 2017, 7, 2695–2703. [Google Scholar] [CrossRef] [Green Version]
- Morisette, J.; Burgiel, S.; Brantley, K.; Daniel, W.; Darling, J.; Davis, J.; Franklin, T.; Gaddis, K.; Hunter, M.; Lance, R.; et al. Strategic considerations for invasive species managers in the utilization of environmental DNA (eDNA): Steps for incorporating this powerful surveillance tool. Manag. Biol. Invasions 2021, 12, 747–775. [Google Scholar] [CrossRef] [PubMed]
- Jo, T.; Takao, K.; Minamoto, T. Linking the state of environmental DNA to its application for biomonitoring and stock assessment: Targeting mitochondrial/nuclear genes, and different DNA fragment lengths and particle sizes. Environ. DNA 2022, 4, 271–283. [Google Scholar] [CrossRef]
- Langlois, V.S.; Allison, M.J.; Bergman, L.C.; To, T.A.; Helbing, C.C. The need for robust qPCR-based eDNA detection assays in environmental monitoring and species inventories. Environ. DNA 2021, 3, 519–527. [Google Scholar] [CrossRef]
- Kinkar, L.; Gasser, R.; Webster, B.; Rollinson, D.; Littlewood, D.; Chang, B.; Stroehlein, A.; Korhonen, P.; Young, N. Nanopore sequencing resolves elusive long tandem-repeat regions in mitochondrial genomes. Int. J. Mol. Sci. 2021, 22, 1811. [Google Scholar] [CrossRef] [PubMed]
- Wynn, E.L.; Christensen, A.C. Repeats of unusual size in plant mitochondrial genomes: Identification, incidence and evolution. G3 Genes Genom. Genet. 2019, 9, 549–559. [Google Scholar] [CrossRef] [PubMed] [Green Version]
- Williams, M.R.; Stedtfeld, R.D.; Engle, C.; Salach, P.; Fakher, U.; Stedtfeld, T.; Dreelin, E.; Stevenson, R.J.; Latimore, J.; Hashsham, S.A. Isothermal amplification of environmental DNA (eDNA) for direct field-based monitoring and laboratory confirmation of Dreissena sp. PLoS ONE 2017, 12, e0186462. [Google Scholar] [CrossRef]
- Hoy, M.S.; Kelly, K.; Rodriguez, R.J. Development of a molecular diagnostic system to discriminate Dreissena polymorpha (zebra mussel) and Dreissena bugensis (quagga mussel). Mol. Ecol. Resour. 2010, 10, 190–192. [Google Scholar] [CrossRef]
- Ram, J.L.; Karim, A.S.; Acharya, P.; Jagtap, P.; Purohit, S.; Kashian, D.R. Reproduction and genetic detection of veligers in changing Dreissena populations in the Great Lakes. Ecosphere 2011, 2, 1–16. [Google Scholar] [CrossRef]
- Ardura, A.; Zaiko, A.; Borrell, Y.J.; Samuiloviene, A.; Garcia-Vazquez, E. Novel tools for early detection of a global aquatic invasive, the zebra mussel Dreissena polymorpha. Aquatic. Conserv. 2017, 27, 165–176. [Google Scholar] [CrossRef]
- Mahon, A.R.; Barnes, M.A.; Senapati, S.; Feder, J.L.; Darling, J.A.; Chang, H.C.; Lodge, D.M. Molecular detection of invasive species in heterogeneous mixtures using a microfluidic carbon nanotube platform. PLoS ONE 2011, 6, e17280. [Google Scholar] [CrossRef] [Green Version]
- Bronnenhuber, J.E.; Wilson, C.C. Combining species-specific COI primers with environmental DNA analysis for targeted detection of rare freshwater species. Conserv. Genet. Resour. 2013, 5, 971–975. [Google Scholar] [CrossRef]
- Egan, S.P.; Barnes, M.A.; Hwang, C.T.; Mahon, A.R.; Feder, J.L.; Ruggiero, S.T.; Tanner, C.E.; Lodge, D.M. Rapid invasive species detection by combining environmental DNA with light transmission spectroscopy. Conserv. Lett. 2013, 6, 402–409. [Google Scholar] [CrossRef]
- Egan, S.P.; Grey, E.; Olds, B.; Feder, J.L.; Ruggiero, S.T.; Tanner, C.E.; Lodge, D.M. Rapid molecular detection of invasive species in ballast and harbor water by integrating environmental DNA and light transmission spectroscopy. Environ. Sci. Technol. 2015, 49, 4113–4121. [Google Scholar] [CrossRef] [PubMed] [Green Version]
- Sepulveda, A.J.; Amberg, J.J.; Hanson, E. Using environmental DNA to extend the window of early detection for dreissenid mussels. Manag. Biol. Invasion. 2019, 10, 342. [Google Scholar] [CrossRef] [Green Version]
Figure 1.
Map of western Lake Erie displaying the six sampling sites for eDNA water collection.

Figure 2.
Standard curve analysis of log10 [genomic DNA] (fg per reaction) for (A) zebra mussels (Dreissena polymorpha) and (B) quagga mussels (D. rostriformis) for a mitochondrial cytochrome oxidase I (COI) assay (Blackman et al. 2020) (open circles) and a newly developed mitochondrial tandem repeat (mtTR) assay (filled circles).


Figure 3.
Standardized Cq values (±standard deviation) for (A) zebra mussels (Dreissena polymorpha) and (C) quagga mussels (D. rostriformis) for a mitochondrial cytochrome oxidase I (COI) assay (Blackman et al., 2020) (lined bar), and a newly developed mitochondrial tandem repeat (mtTR) assay (filled bar) across the three mesocosm tanks. The relationship of quantified genomic DNA (log10 fg/µL) between the COI and mtTR assay for (B) zebra mussels and (D) quagga mussels.

Figure 4.
Standardized Cq values (±standard deviation) for (A) zebra mussels (Dreissena polymorpha) and (C) quagga mussels (D. rostriformis) for a mitochondrial cytochrome oxidase I (COI) assay (Blackman et al. 2020) (lined bar) and a newly developed mitochondrial tandem repeat (mtTR) assay (filled bar) across the six western Lake Erie sampling sites. The relationship of quantified genomic DNA (log10 of fg/µL) between the COI and mtTR assay for (B) zebra mussels and (D) quagga mussels.

Figure 5.
Mean standardized Cq values (±standard deviation) for each of the six eDNA assays across all water samples collected from western Lake Erie.
Figure 5.
Mean standardized Cq values (±standard deviation) for each of the six eDNA assays across all water samples collected from western Lake Erie.


Table 1.
Species-specific and/or dreissenid-specific primer pairs (F-Forward and R-Reverse) used for quantitative PCR analysis of environmental DNA for (A) zebra mussel (ZM) and (B) quagga mussel (QM). The genomic origin (mitochondrial (mt) or nuclear (nu)) is listed for each gene, as well as the length (base pairs), primer efficiency (%), and R2 for each primer set. Limit of detection (LOD) and limit of quantification (LOQ) are listed in ng of tissue extraction per reaction and were estimated for each qPCR assay using the qPCR_LOD_Calc R script [39].
| Species | Assay | Zebra Mussel Primer | Length (bps) | Efficiency | R2 | LOD | LOQ | Source |
|---|---|---|---|---|---|---|---|---|
| A. ZM | mt-tr285 | F: GTTTTCCAGTTCTTCTGTCG | 97 | 96.83 | 0.990 | 2.2 × 10⁻⁶ | 1.2 × 10⁻⁴ | Present Study |
| R: CTCTCACTTTTTTCCCCTATCCCTC | ||||||||
| mt-COI | F: TAGAGCTAAGGGCACCTGGAA | 73 | 90.63 | 0.990 | 2.5 × 10⁻⁴ | 3.3 × 10⁻³ | [40] | |
| R: AGCCCATGAGTGGTGACAAT | ||||||||
| mt-16S | F: TGGGGCAGTAAGAAGAAAAAAATAA | 141 | 91.00 | 0.995 | 2.5 × 10⁻⁴ | 2.4 × 10⁻³ | [16] | |
| R: CATCGAGGTCGCAAACCG | ||||||||
| nu-H2B | F: CGCGCGCTCCACTGACAAGA | 251 | 88.36 | 0.999 | 2.2 × 10⁻⁶ | 4.1 × 10⁻⁵ | [19] | |
| R: CACCAGGCAGCAGGAGACGC | ||||||||
| B. QM | mt-tr258 | F: TCGGTTCAACGGGATTCCC | 232 | 102.32 | 0.995 | 9.3 × 10⁻⁶ | 2.8 × 10⁻⁴ | Present Study |
| R: CCCCCTTACAAGATTTTCGATTT | ||||||||
| mt-COI | F: GGAAACTGGTTGGTCCCGAT | 188 | 97.16 | 0.998 | 9.8 × 10⁻⁵ | 3.5 × 10⁻⁴ | [40] | |
| R: GGCCCTGAATGCCCCATAAT | ||||||||
| mt-16S | F: TGGGGCAGTAAGAAGAAAAAAATAA | 141 | 101.15 | 0.996 | 5.7 × 10⁻⁵ | 1.1 × 10⁻³ | [16] | |
| R: CATCGAGGTCGCAAACCG | ||||||||
| nu-H2B | F: CGCGCGCTCCACTGACAAGA | 251 | 95.89 | 0.994 | 5.7 × 10⁻⁵ | 1.8 × 10⁻³ | [19] | |
| R: CACCAGGCAGCAGGAGACGC |
Publisher’s Note: MDPI stays neutral with regard to jurisdictional claims in published maps and institutional affiliations. |
© 2022 by the authors. Licensee MDPI, Basel, Switzerland. This article is an open access article distributed under the terms and conditions of the Creative Commons Attribution (CC BY) license (https://creativecommons.org/licenses/by/4.0/).
Share and Cite
MDPI and ACS Style
Marshall, N.T.; Vanderploeg, H.A.; Chaganti, S.R. Improving Environmental DNA Sensitivity for Dreissenid Mussels by Targeting Tandem Repeat Regions of the Mitochondrial Genome. Water 2022, 14, 2069. https://doi.org/10.3390/w14132069
AMA Style
Marshall NT, Vanderploeg HA, Chaganti SR. Improving Environmental DNA Sensitivity for Dreissenid Mussels by Targeting Tandem Repeat Regions of the Mitochondrial Genome. Water. 2022; 14(13):2069. https://doi.org/10.3390/w14132069
Chicago/Turabian StyleMarshall, Nathaniel T., Henry A. Vanderploeg, and Subba Rao Chaganti. 2022. "Improving Environmental DNA Sensitivity for Dreissenid Mussels by Targeting Tandem Repeat Regions of the Mitochondrial Genome" Water 14, no. 13: 2069. https://doi.org/10.3390/w14132069
Note that from the first issue of 2016, this journal uses article numbers instead of page numbers. See further details here.