
Study on Supply–Demand Balance Analysis and Service Flow of Water Resources in Dongjiang River Basin

School of Geography, South China Normal University, Guangzhou 510631, China
*
Author to whom correspondence should be addressed.
Water 2022, 14(13), 2060; https://doi.org/10.3390/w14132060
Submission received: 7 April 2022
/
Revised: 23 June 2022
/
Accepted: 23 June 2022
/
Published: 27 June 2022
(This article belongs to the Topic Water and Soil Management in Adaptation to Climate Change)
Abstract
:The distribution of water resources is usually characterized by spatial heterogeneity, resulting in different water supply and demand pressures within the basin. Therefore, the analysis of water resources supply and demand balance and the mapping of water resources spatial flow can be an effective suggestion for the regional water resources allocation to relieve the regional water pressure. The uneven distribution of water resources in the Dongjiang River Basin is significant, and how to effectively allocate water resources in the Dongjiang River Basin has become a major focus of research. Based on the multi-source data of the Dongjiang River Basin from 2005 to 2020, this paper uses the SWAT model and water demand model to establish the spatial flow model of water resources supply and demand, and uses the subbasin-scale to explore the spatial distribution and flow of water resources supply and demand, obtaining the spatial scope and flow of water resources supply and beneficiary areas in the basin. The results show that (1) the water supply in the Dongjiang River Basin has been decreasing year by year, and the water demand has been increasing from 2005 to 2015, leading to an increase in the imbalance between supply and demand, and there is a significant reduction in industrial water use from 2015 to 2020, resulting in a reduction in the imbalance between water supply and demand; (2) the supply and demand pressure of water resources in the Dongjiang River Basin has obvious spatial heterogeneity, showing that the pressure of water use in the middle and upper reaches is small, while the pressure of water use in the lower reaches is large; (3) under the framework of spatial service flows of water resources supply and demand, this paper obtains three main beneficiary area ranges, which are Dongyuan County of Heyuan City, Yuancheng District of Heyuan City, and the main urban area of Shenzhen Dongguan Huizhou, and specifies the flow of service flows. This study can not only provide reasonable suggestions for water resources allocation in the Dongjiang River Basin but it also provides references for water resources management in other basins.
1. Introduction
In recent years, with the rapid development of the economy and society, the conflict between humans and land has become more and more prominent, and the supply and demand of ecosystem services have become a hotspot in geography and ecology research. The current research on ecosystem services mainly explores the spatial characteristics and spatial aggregation patterns of supply and demand patterns of ecosystem services in the study area by selecting several specific ecosystem services [1,2]. The spatial characteristics and spatial aggregation patterns of ecosystem service supply and demand in the study area can be studied by selecting several specific ecosystem services and analyzing the changes of ecosystem service supply and demand in combination with the ecosystem service matrix of land use in the study area, and obtaining the spatial and temporal evolution characteristics of ecosystem service supply and demand risks [3]. To clarify the transport and transformation of ecosystem services or to establish a spatiotemporal interface between supply and demand, the linkage needs to be made through ecosystem service flows [4,5]. Only by embedding ecosystem service flows into the ecological compensation mechanism can the ESV be truly realized, which is conducive to regional sustainable development [6].
Ecosystem service flow is the process by which a certain ecosystem service is transmitted from a supply area to a beneficiary area in a certain direction under the influence of a driving force [7]. However, most studies on ecosystem service flows are at the stage of conceptual modeling, lacking the simulation and dynamic description of the actual flow model [6]. Kenneth J. Bagstad et al. used an artificially intelligent ecosystem services approach to map and spatialize the supply and demand of carbon sequestration, flood regulation, sediment regulation, and landscape culture [8]. Li et al. calculated the supply and demand of carbon sequestration services in the Guanzhong–Tianshui Economic Zone based on the CASA model and population spatial density and obtained the ecosystem service flows of carbon sequestration services through spatial surface analysis [9]. Zhang et al. quantified the pathways of three ecosystem service flows, namely, soil and water conservation, carbon sequestration, and water supply, based on the atmospheric circulation and water flow in the southwest karst region combined with natural factors [10]. Since water resources are more liquid than other ecosystem services, quantifying the supply and demand of water resources, establishing the spatial and temporal links between water supply and demand, and specifying the direction and flow of water can be an effective way to characterize water service flows [11]. In the current study, the research on water resources supply is relatively mature. The InVEST model [12,13] and SWAT model [14,15] are usually used to evaluate water resources in terms of surface runoff, evapotranspiration, and flood regulation. In comparison to water resources supply services, water resources demand is less well studied, and is mostly based on land use data [16,17] and socioeconomic data [18]. In addition, most of the studies lack the delineation of water supply and beneficiary areas and the visualization of the dynamics of water flow, which leads to the neglect of the role of water flow in resource allocation. At the same time, most of the existing studies take administrative units as an example to conduct research [19,20], ignoring the overall nature of the river basin, or taking the smaller river basins tributaries as the study area [21,22], which does not reflect the water supply, demand, and flow in the whole basin. Therefore, further research on the balance of water supply and demand and spatial flow within a river basin is urgently needed.
As an important water supply area in the Guangdong–Hong Kong–Macao–Great Bay Area, the Dongjiang River straddles Guangdong Province and Jiangxi Province and has a large area with complex internal ecological and environmental problems and prominent water supply and demand conflicts. In view of this, this paper used the SWAT model and water demand model to calculate the supply and demand of water in the Dongjiang River Basin on a subbasin scale, identified the supply and beneficiary areas in the study area, and simulated the spatial flow direction, path, and volume of water resources in the Dongjiang River Basin by combining the surface undulation and water flow direction to obtain the spatial flow pattern of water resources in the Dongjiang River Basin and provide reasonable suggestions for the allocation of water resources in the region.
2. Materials and Methods
2.1. Study Area and Basic Data
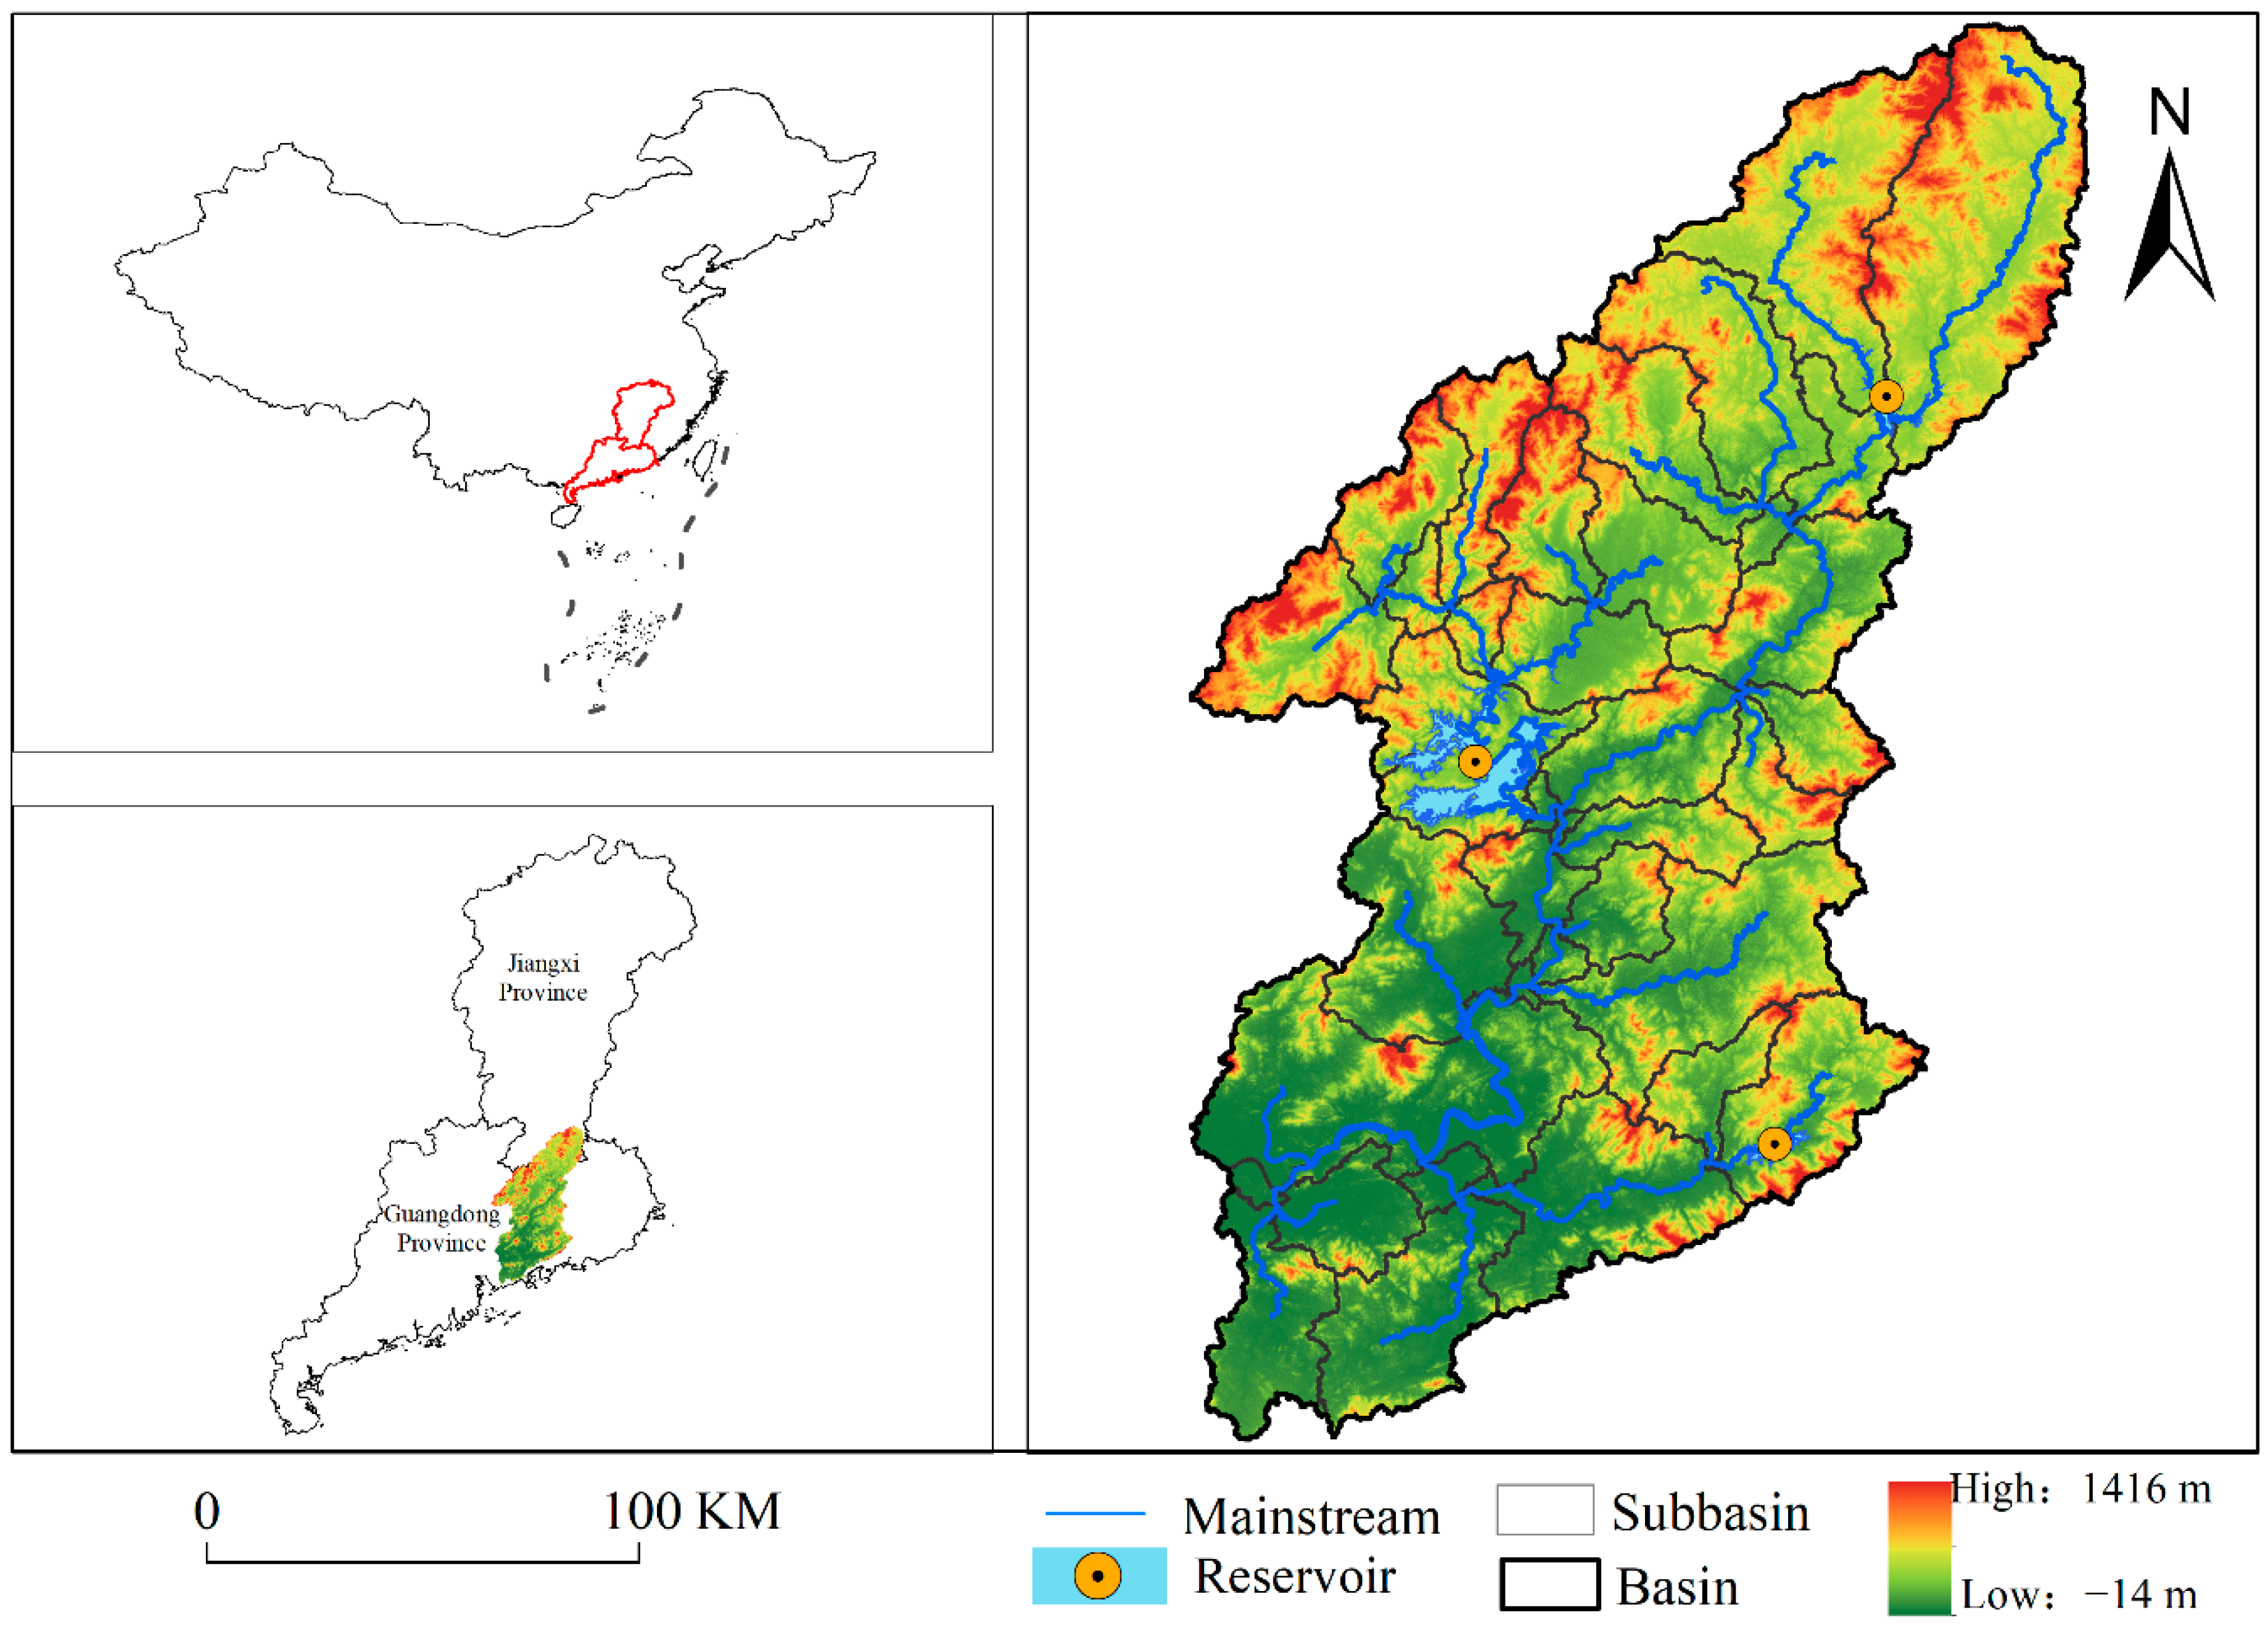
As one of the three major tributaries of the Pearl River basin, the Dongjiang River straddles Jiangxi Province and Guangdong Province, with a longitude range of 114°47′ E–115°52′ E and a latitude range of 24°20′ N–25°12′ N (Figure 1). Beiling Water, Lijiang River, Xinfeng River, Qiu Xiang River, Gongzhuang Water, Xizhi River, Shima River, and Zengtian River are the main tributaries of the Dongjiang basin. The mainstream of Dongjiang is 562 km, of which 127 km is in Jiangxi Province and 435 km is in Guangdong Province, with a total basin area of about 35,340 km2. Shenzhen, Huizhou, and Dongguan in the basin are important parts of the Guangdong–Hong Kong–Macao Greater Bay Area. Dongjiang also serves as an important water supply to Hong Kong, and is an important water supply for Guangdong Province and even South China. The three reservoirs in the basin, Xinfengjiang Reservoir, Fengshuba Reservoir, and Baipenzhu Reservoir, play an important role in regulating the flood and dry flow in the middle and lower reaches of the Dongjiang River and the uneven distribution of water resources in time and space. The data needed for this study are shown in Table 1.
2.2. Water Supply Model
The SWAT model was selected as a tool to calculate the water yield within the basin, which is the basis for conducting the balance of water supply and demand within the basin. Firstly, based on the DEM in the study area [23,24], the minimum catchment area threshold of 40,000 hm2 was used to obtain 41 subbasins. Secondly, land use data, soil data, and slope data of the study area in 2005, 2010, 2015, and 2020 were selected to divide the hydrological corresponding units, and the water yield within each subbasin was obtained by the water balance method. Finally, SWAT-CUP was used to calibrate the water yield results.
2.2.1. Water Supply Calculation
The SWAT model is a long-duration, time-continuous, watershed-distributed hydrologic model calculated daily, and is often used to predict land effects on water, sediment, and chemicals under complex and variable soil types, land use types, and management practices within a watershed [25]. There are eight modules in the model, including hydrology, sediment erosion, crop growth, nutrients, and pesticides, which provide good simulations of hydrologic processes, sediment erosion, agricultural management, and chemical processes in the watershed [26]. In this paper, the hydrology module of the SWAT model is used to calculate the water supply in each subbasin. The principle of calculating water supply in the model is as follows.
where is the water yield (mm), which is the net volume of water leaving the subbasin and remitting to the river segment during the study period. is surface runoff (mm), which is the amount of surface water that sinks into the river segment during the study period. is the lateral flow in the river (mm). is groundwater (mm), which is the amount of water returning to the river segment from the shallow aquifer during the study period. is the average daily water loss from the streambed through the conveyance during the study period (mm); is the pond interception (mm).
2.2.2. Model Calibration
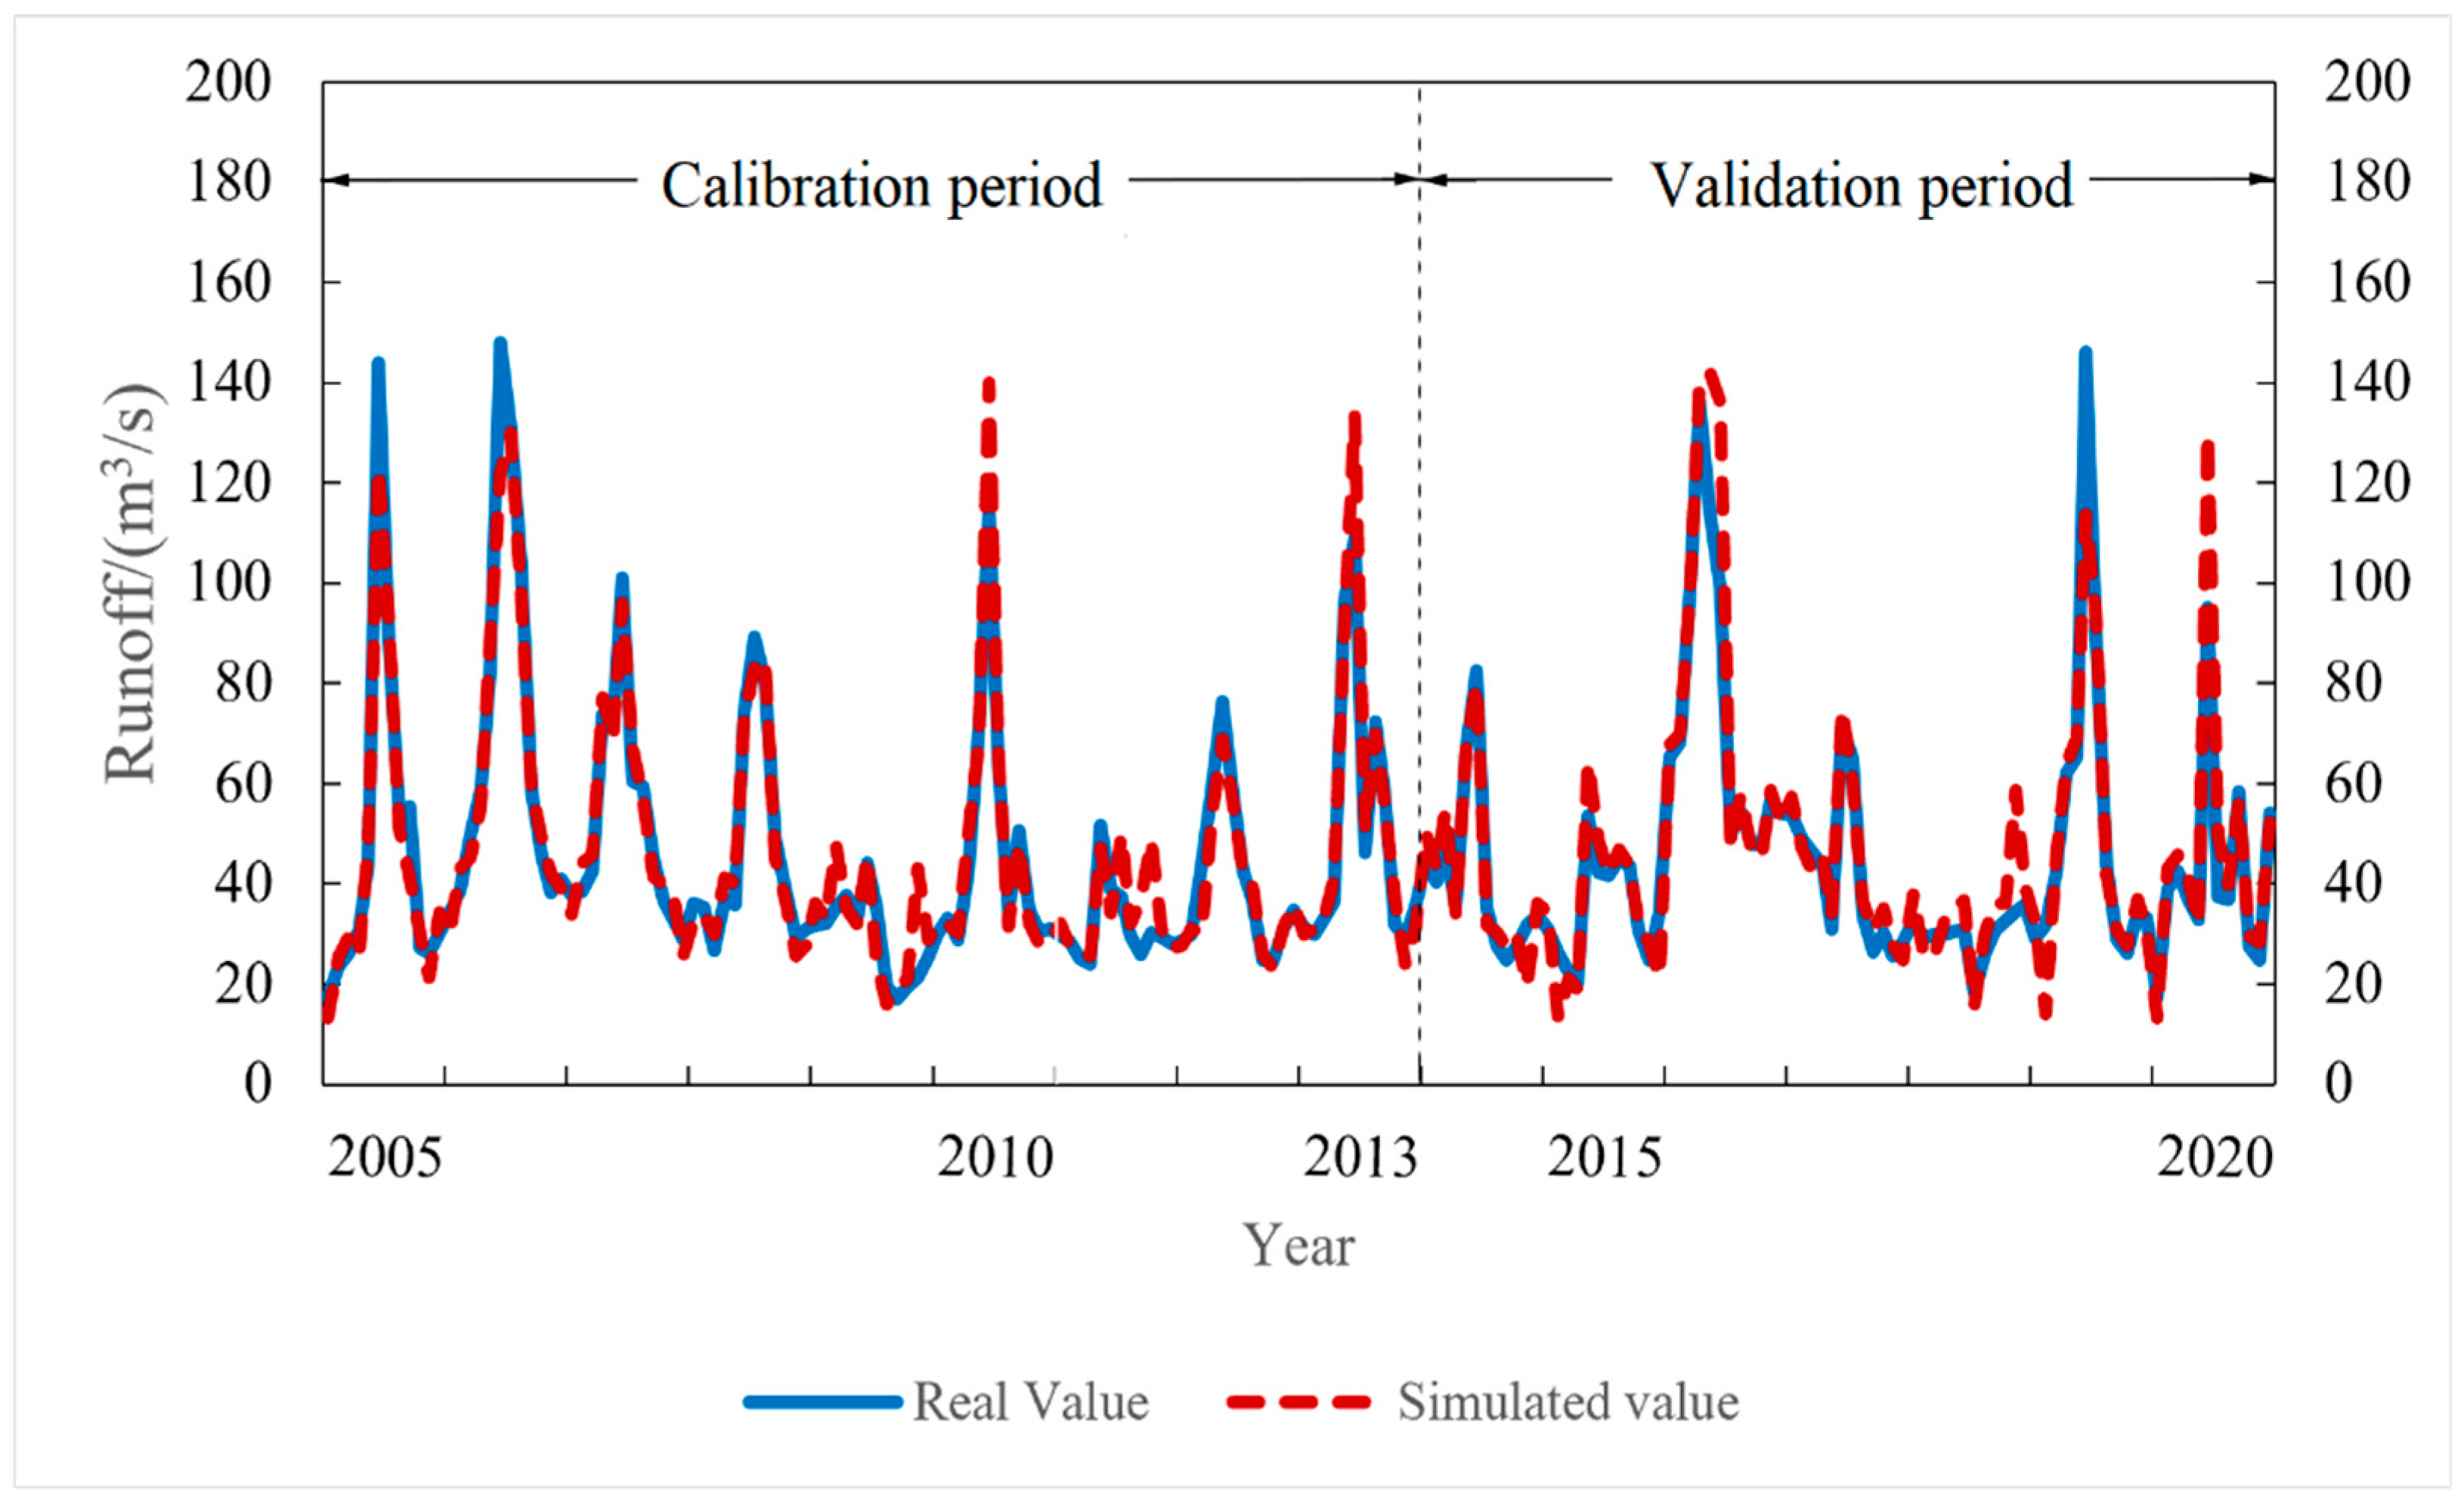
After calculating the water yield in the basin through the hydrology module of SWAT, the results need to be further calibrated. In this paper, the measured runoff data from 2005–2013 and 2014–2020 at two hydrological stations in the study area, Pingshan and Heyuan, are used as the simulation unit of the month for rate determination. The years 2005–2013 are used as the simulation period and the years 2014–2020 are used as the validation period, and SUFI-2 of SWAT-CUP is used as the rate algorithm [27]. The runoff curve coefficient (CN2), baseflow regression coefficient (ALPHA_BF), and groundwater re-evaporation coefficient (GW_REVAP), which are more sensitive parameters within the runoff, were selected with reference to previous studies to rate the runoff data in the basin [28,29]. The detailed tuning methods are shown in the following table (Table 2). As can be seen from the Figure 2, the simulation results obtained from the correction are approximately similar to the measured results. In the simulation period of the rate determination, the R2 and NSE between the simulated and observed values are 0.51 and 0.57, respectively, and the uncertainty indicators of the model are P-factor = 0.35 and R-factor = 1.02; in the validation period of the rate determination, the R2 and NS between the simulated and observed values are 0.57 and 0.67, respectively, and the uncertainty indicators of the model are P-factor = 0.31 and R-factor = 1.03. Thus, it can be shown that the SWAT model constructed in this study can simulate the water yield of the Dongjiang River Basin more accurately.
2.3. Water Demand Model
Water demand calculations are also an important part of modeling the balance of supply and demand and the spatial flow of water resources within a study area. Unlike water supply, water demand calculations need to take into account not only the amount of water required by the natural environment in the study area but also the amount of water demand generated by human activities. Based on the results of existing studies [20,30,31] and the actual situation in the Dongjiang basin, the water demand in the study area is divided into the following areas: agricultural water, industrial water, residential water (including urban and rural residents), and ecological water. Based on the water resources reports provided by the Water Resources Department of Guangdong Province and Jiangxi Province, and combined with the land use data in the study area, the water demand at the subbasin scale was calculated as follows.
where is the total water demand in the region. is the water used for agriculture in the region. is the water used for industry in the region. is the water for residential use in the region. is the water used for ecological environment in the region. is the area of arable land in the region, is the water demand of arable land per unit area. is the total GDP in the study area, and is the water consumption of CNY 10,000 GDP. and are the area of urban residential land and the area of rural residential land in the study area, respectively. and are the water consumption per unit area for urban residents and rural residents, respectively. is the sum of forest and grassland area in the study area, and is the water consumption of ecological environment per unit area.
2.4. Water Supply and Demand Balance and Spatial Flow
The supply–demand balance of water is the relationship between the available water supply and the actual water demand. There are three possible scenarios of water supply–demand relationship: supply is greater than demand, supply is equal to demand, and supply is less than demand. The balance of supply and demand between water resources is relative, and imbalances always exist. When calculating the balance of water supply and demand, the ratio of water supply to water demand is usually used as an important indicator of the balance of water supply and demand, while the values of water supply and water demand are large at the scale of subbasins. With reference to existing studies [3,20], this paper uses the natural logarithm of the water supply and demand ratio as the Freshwater Security Index (FSI) to measure the balance of water supply and demand in the study area, which is calculated as follows:
where is the water supply in the study area, and is the water demand in the study area. When value is greater than 0, it means that the water supply in the study area is greater than the water demand, and the available water resources have certain potential; when value is equal to 0, it means that the water supply in the study area is equal to the water demand, which is a more ideal state of supply and demand. When the value is less than 0, it means that the water supply in the study area is less than the water demand, and if we rely only on the freshwater resources in the region, it may cause a shortage of water resources.
Watersheds have relatively closed boundaries and complex internal ecological environments. Since the ratio of water supply to water demand varies from one subbasin to another, it is important to investigate the spatial flow of water resources in the basin. The terrain undulations are an important condition for the formation of water flow, and human activities around the basin also have a significant impact on the spatial flow characteristics of water flow in the process of water flow. The spatial flow model of water supply and demand in this study have used river runoff as the service flow path to transfer water resources between subbasins, thus achieving the effect of material circulation within the basin [32]. Based on the supply and demand of water resources in each subbasin in the study area, the surplus of water resources in each subbasin is obtained, the supply and beneficiary areas in the basin are obtained, and the basic direction of water resources flow in the basin is roughly mapped according to the flow direction of the mainstream of the Dongjiang basin.
3. Results
3.1. Analysis of Spatial and Temporal Changes in Water Supply and Demand
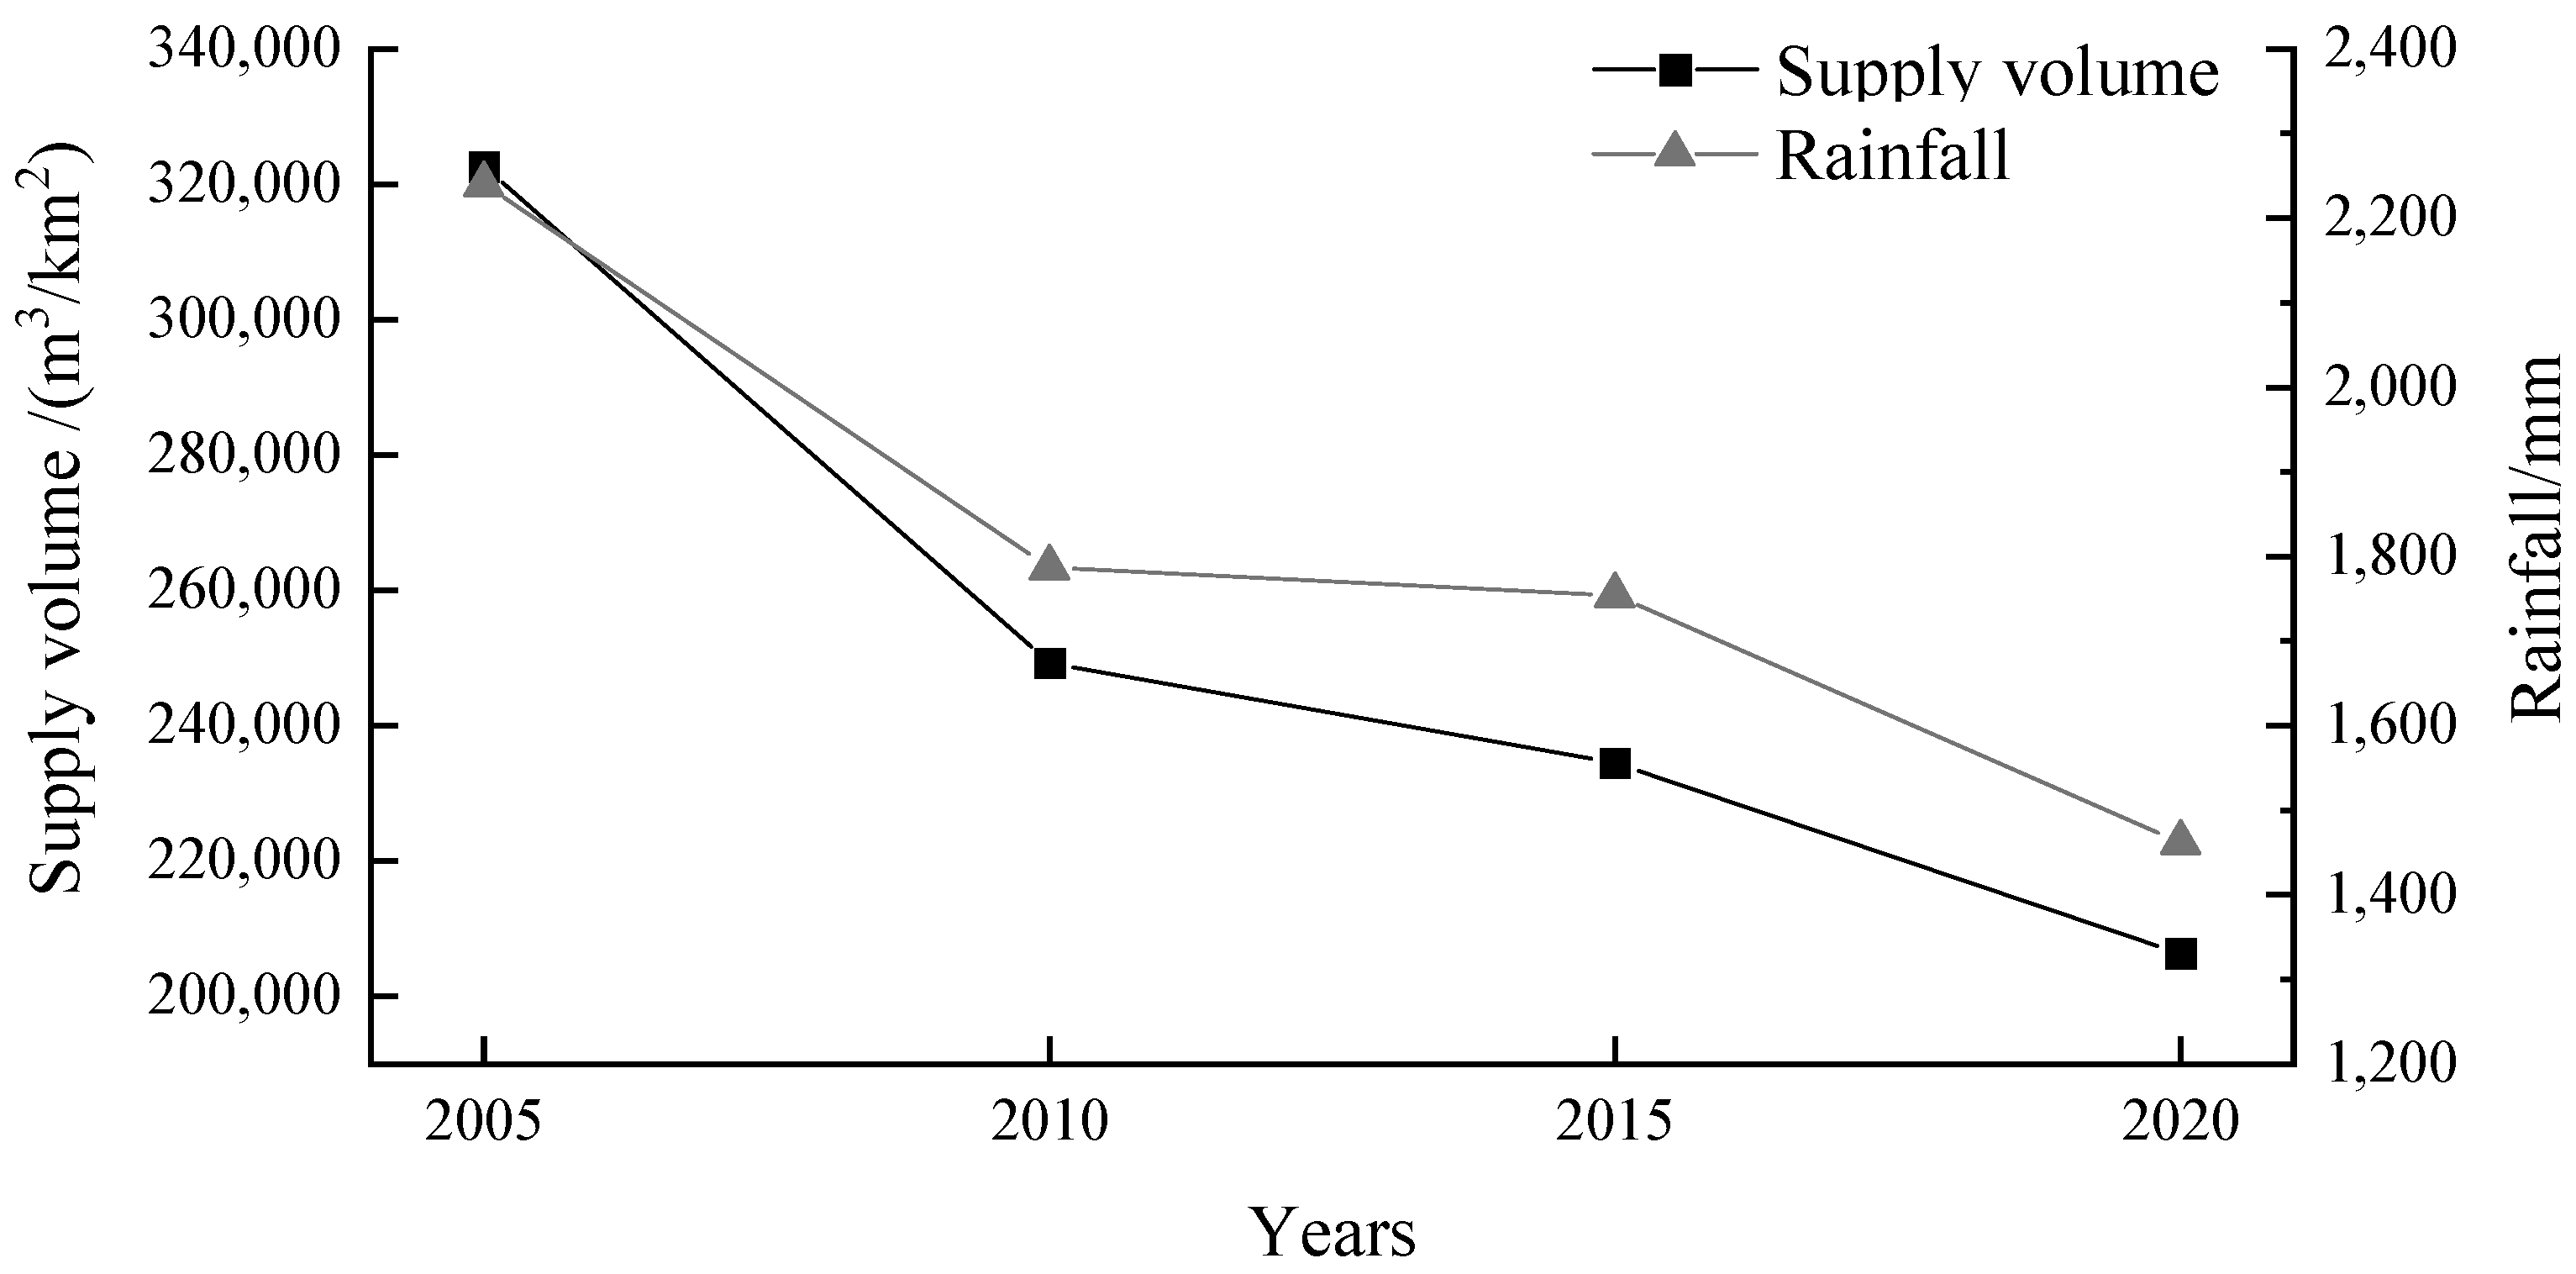
As seen in Figure 3, the water supply in the Dongjiang River Basin decreases year by year from 2005 to 2020. The year 2005 has the highest overall supply with a unit area water yield of 322,594 m3/km2, and the unit area water yield of 28 subbasins is greater than the unit area water yield of the Dongjiang River Basin as a whole. The year 2010 has a unit area water yield of about 249,280 m3/km2, and the unit area water yield of 19 subbasins is greater than the unit area water yield of the basin as a whole. In 2015, the water yield per unit area was 234,502 m3/km2, and the water yield per unit area in 17 subbasins was greater than the water yield per unit area in the basin as a whole. In 2020, the water supply was the lowest, with a water yield per unit of 206,309 m3/km2, and the water yield in each basin unit did not differ significantly. Water yield is influenced by several factors, among which rainfall is the most critical factor affecting water yield in the study area (Figure 4). The average rainfall in the subbasins of the Dongjiang River Basin reached 2240 mm in 2005, especially in June when 10 subbasins received more than 700 mm of rainfall. The average rainfall in the subbasins did not exceed 2000 mm in 2010, 2015, and 2020, with 1787 mm, 1754 mm, and 1462 mm, respectively. From a spatial perspective, 12, 20, 21, 25, 30, and 34 subbasins have larger water yield per unit area and are all located in the middle and lower reaches of the Dongjiang basin. Subbasins 1 and 2, which are located in the upper reaches of the study area, produce less water. Most of the water supply in the basin is unevenly distributed, with high water supply in the lower reaches and low water supply in the middle and upper reaches [30,33]. However, the higher water availability in the Dongjiang River Basin is located in the middle reaches of the basin. The reservoir area has a larger area of water and therefore produces more water [34]. Subbasins 12, 20, 21, and 30 of the basin are located in the middle reaches of Xinfengjiang Reservoir, and subbasin 35 is located in the lower reaches of Baipenzhu Reservoir, all of which have large water areas and therefore also have large water yield. Compared with sandy soils, clayey soils have better water-holding properties [35]. In subbasins 22 and 25, the soils are predominantly clay-grained with a gravel content of no more than 10%, so their water supply capacity is also higher than the average for the study area.
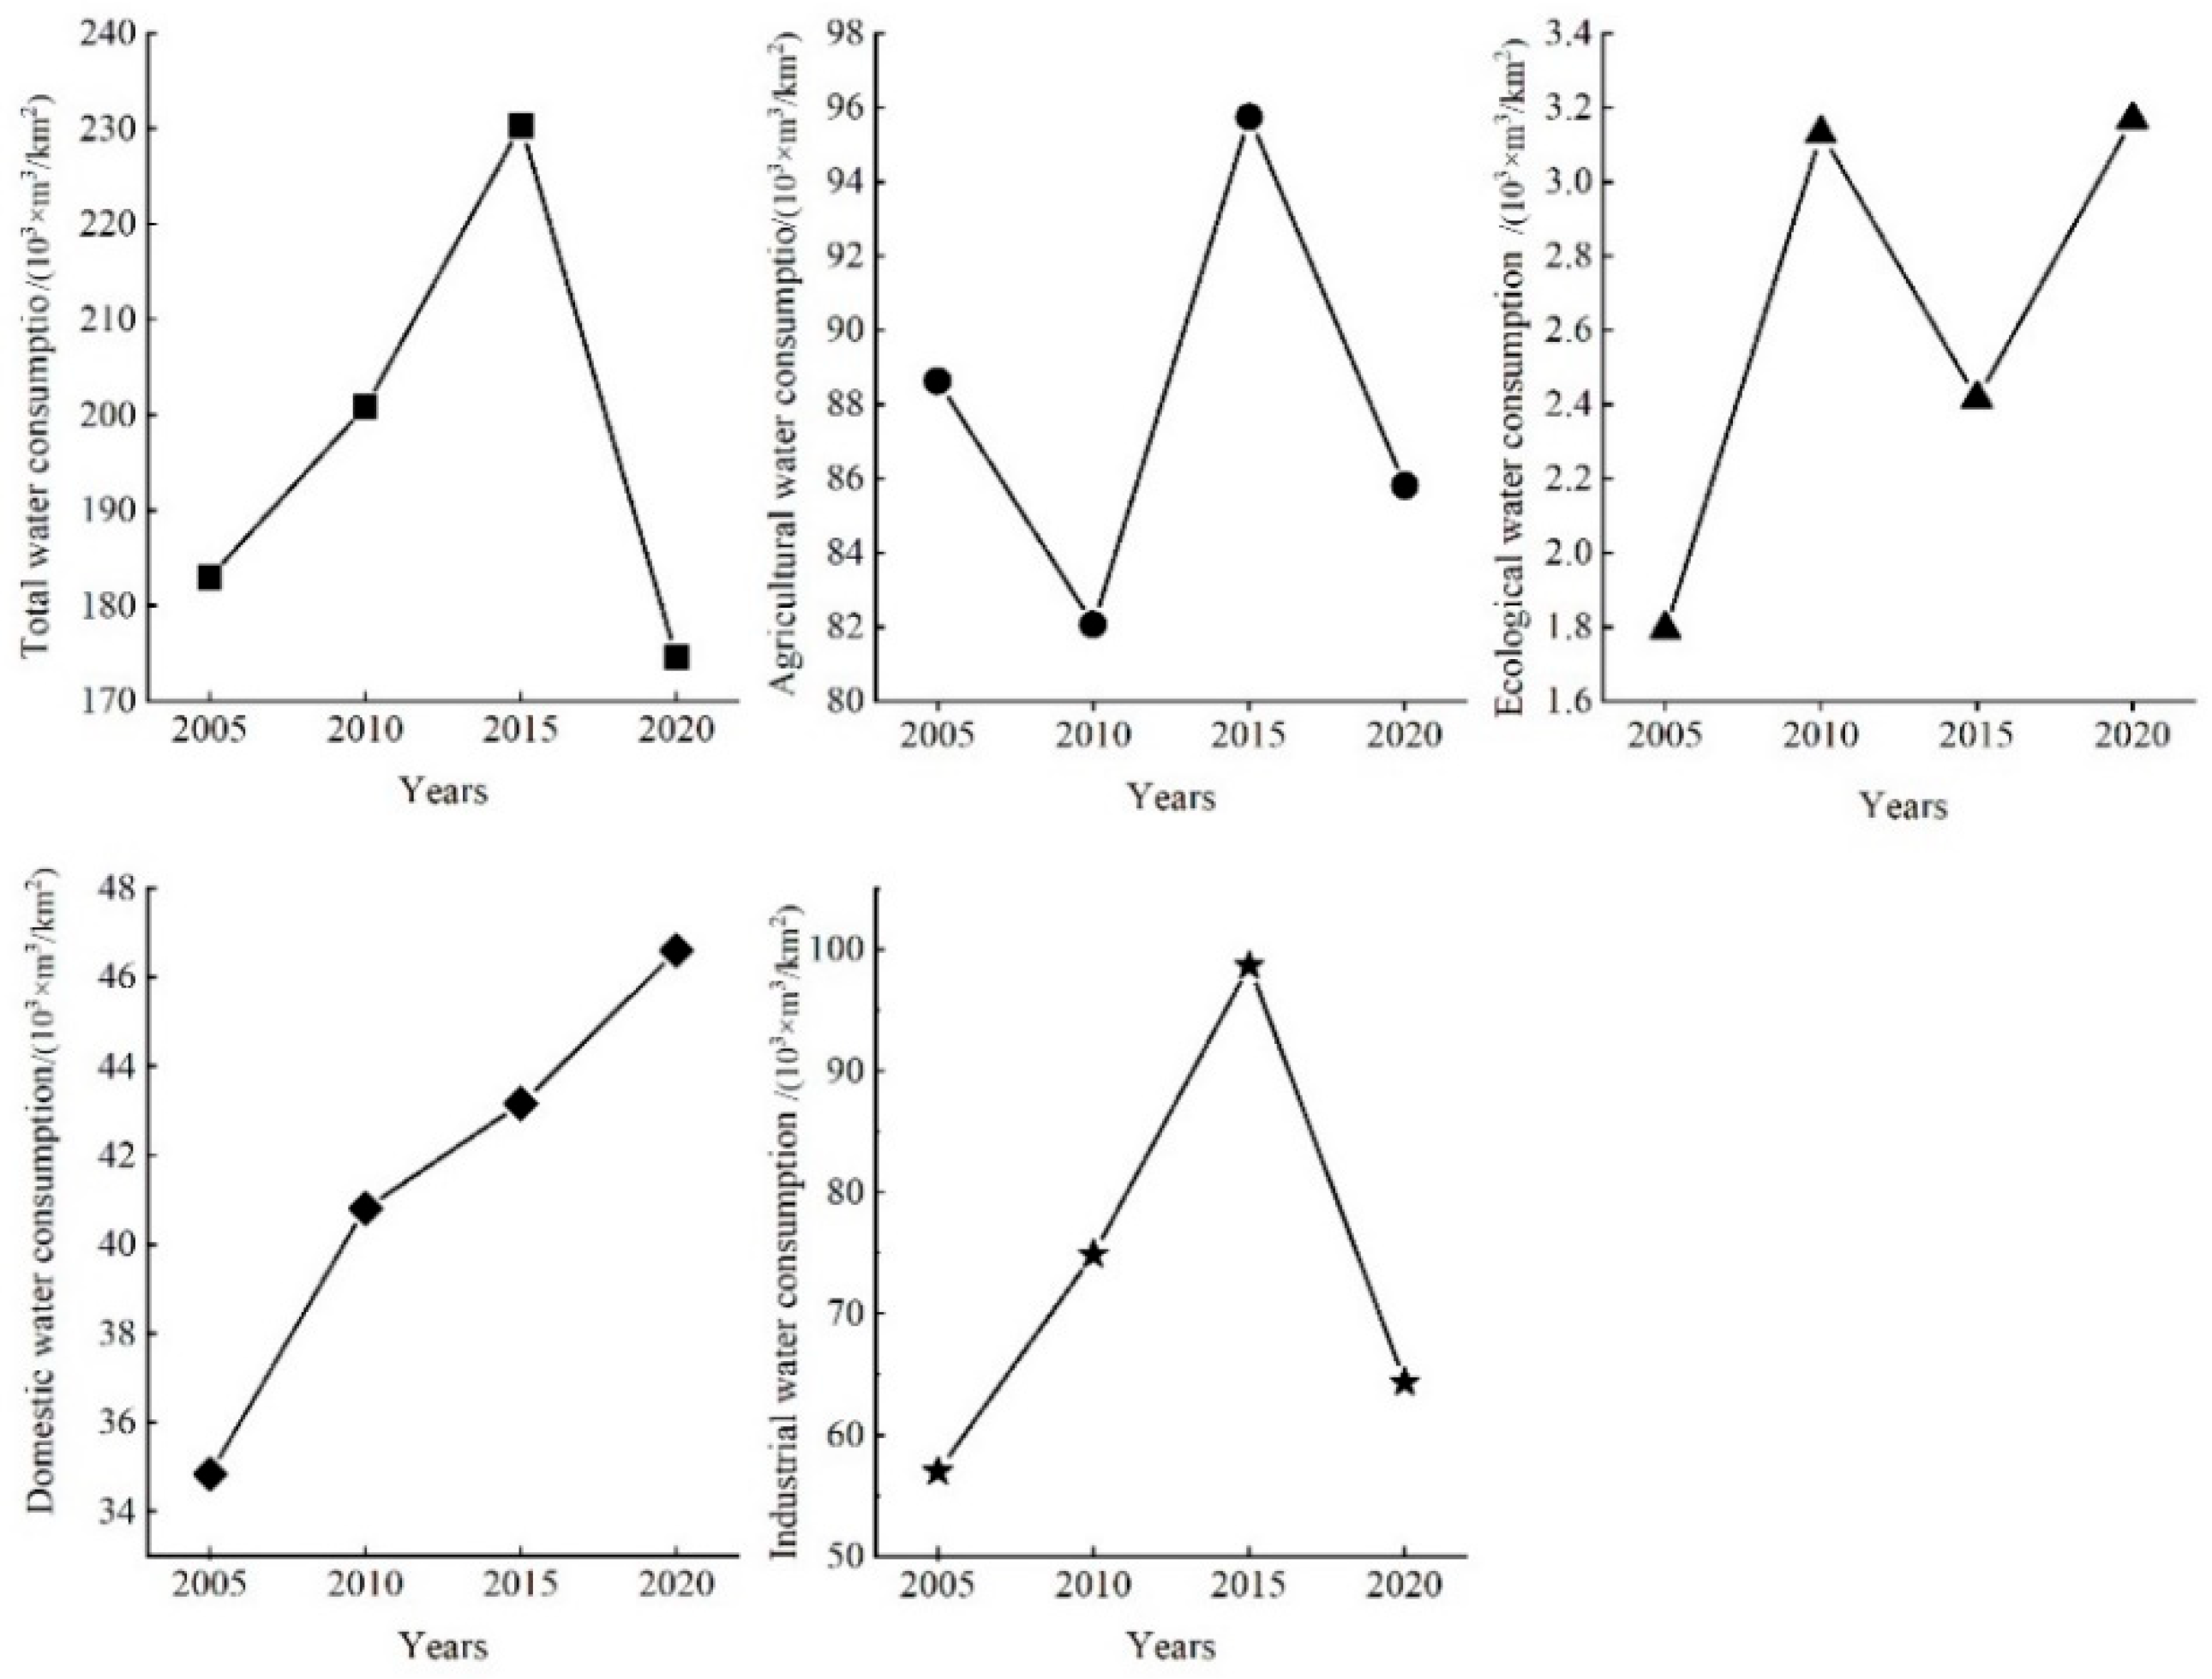
Compared to the supply, the demand for water resources is more influenced by socioeconomic factors. As seen in Figure 5, the water demand in the Dongjiang River Basin shows an increasing trend year by year during 2005–2015, while the water demand in 2020 decreases. As seen in Figure 6, for industrial water use, there was a gradual increase from 2005 to 2015, but with the change in regional development philosophy and the optimization of industrial processes, the demand for industrial water was significantly reduced in the basin in 2020, relieving the pressure on water use in the region to some extent. From a spatial perspective, the land use types in subbasins 6, 10, 13, 18, 20, and 21 are mostly woodlands, grasslands, and water areas, and the area of construction land is relatively small, so the water demand is small, while subbasins 36–41 are located in the lower reaches of the Dongjiang basin, which is the core area of the Guangdong–Hong Kong–Macao Greater Bay Area, with a high proportion of construction land and a high population density, and the water demand for domestic water and industrial water is high, which is the largest water demand area in the study area.
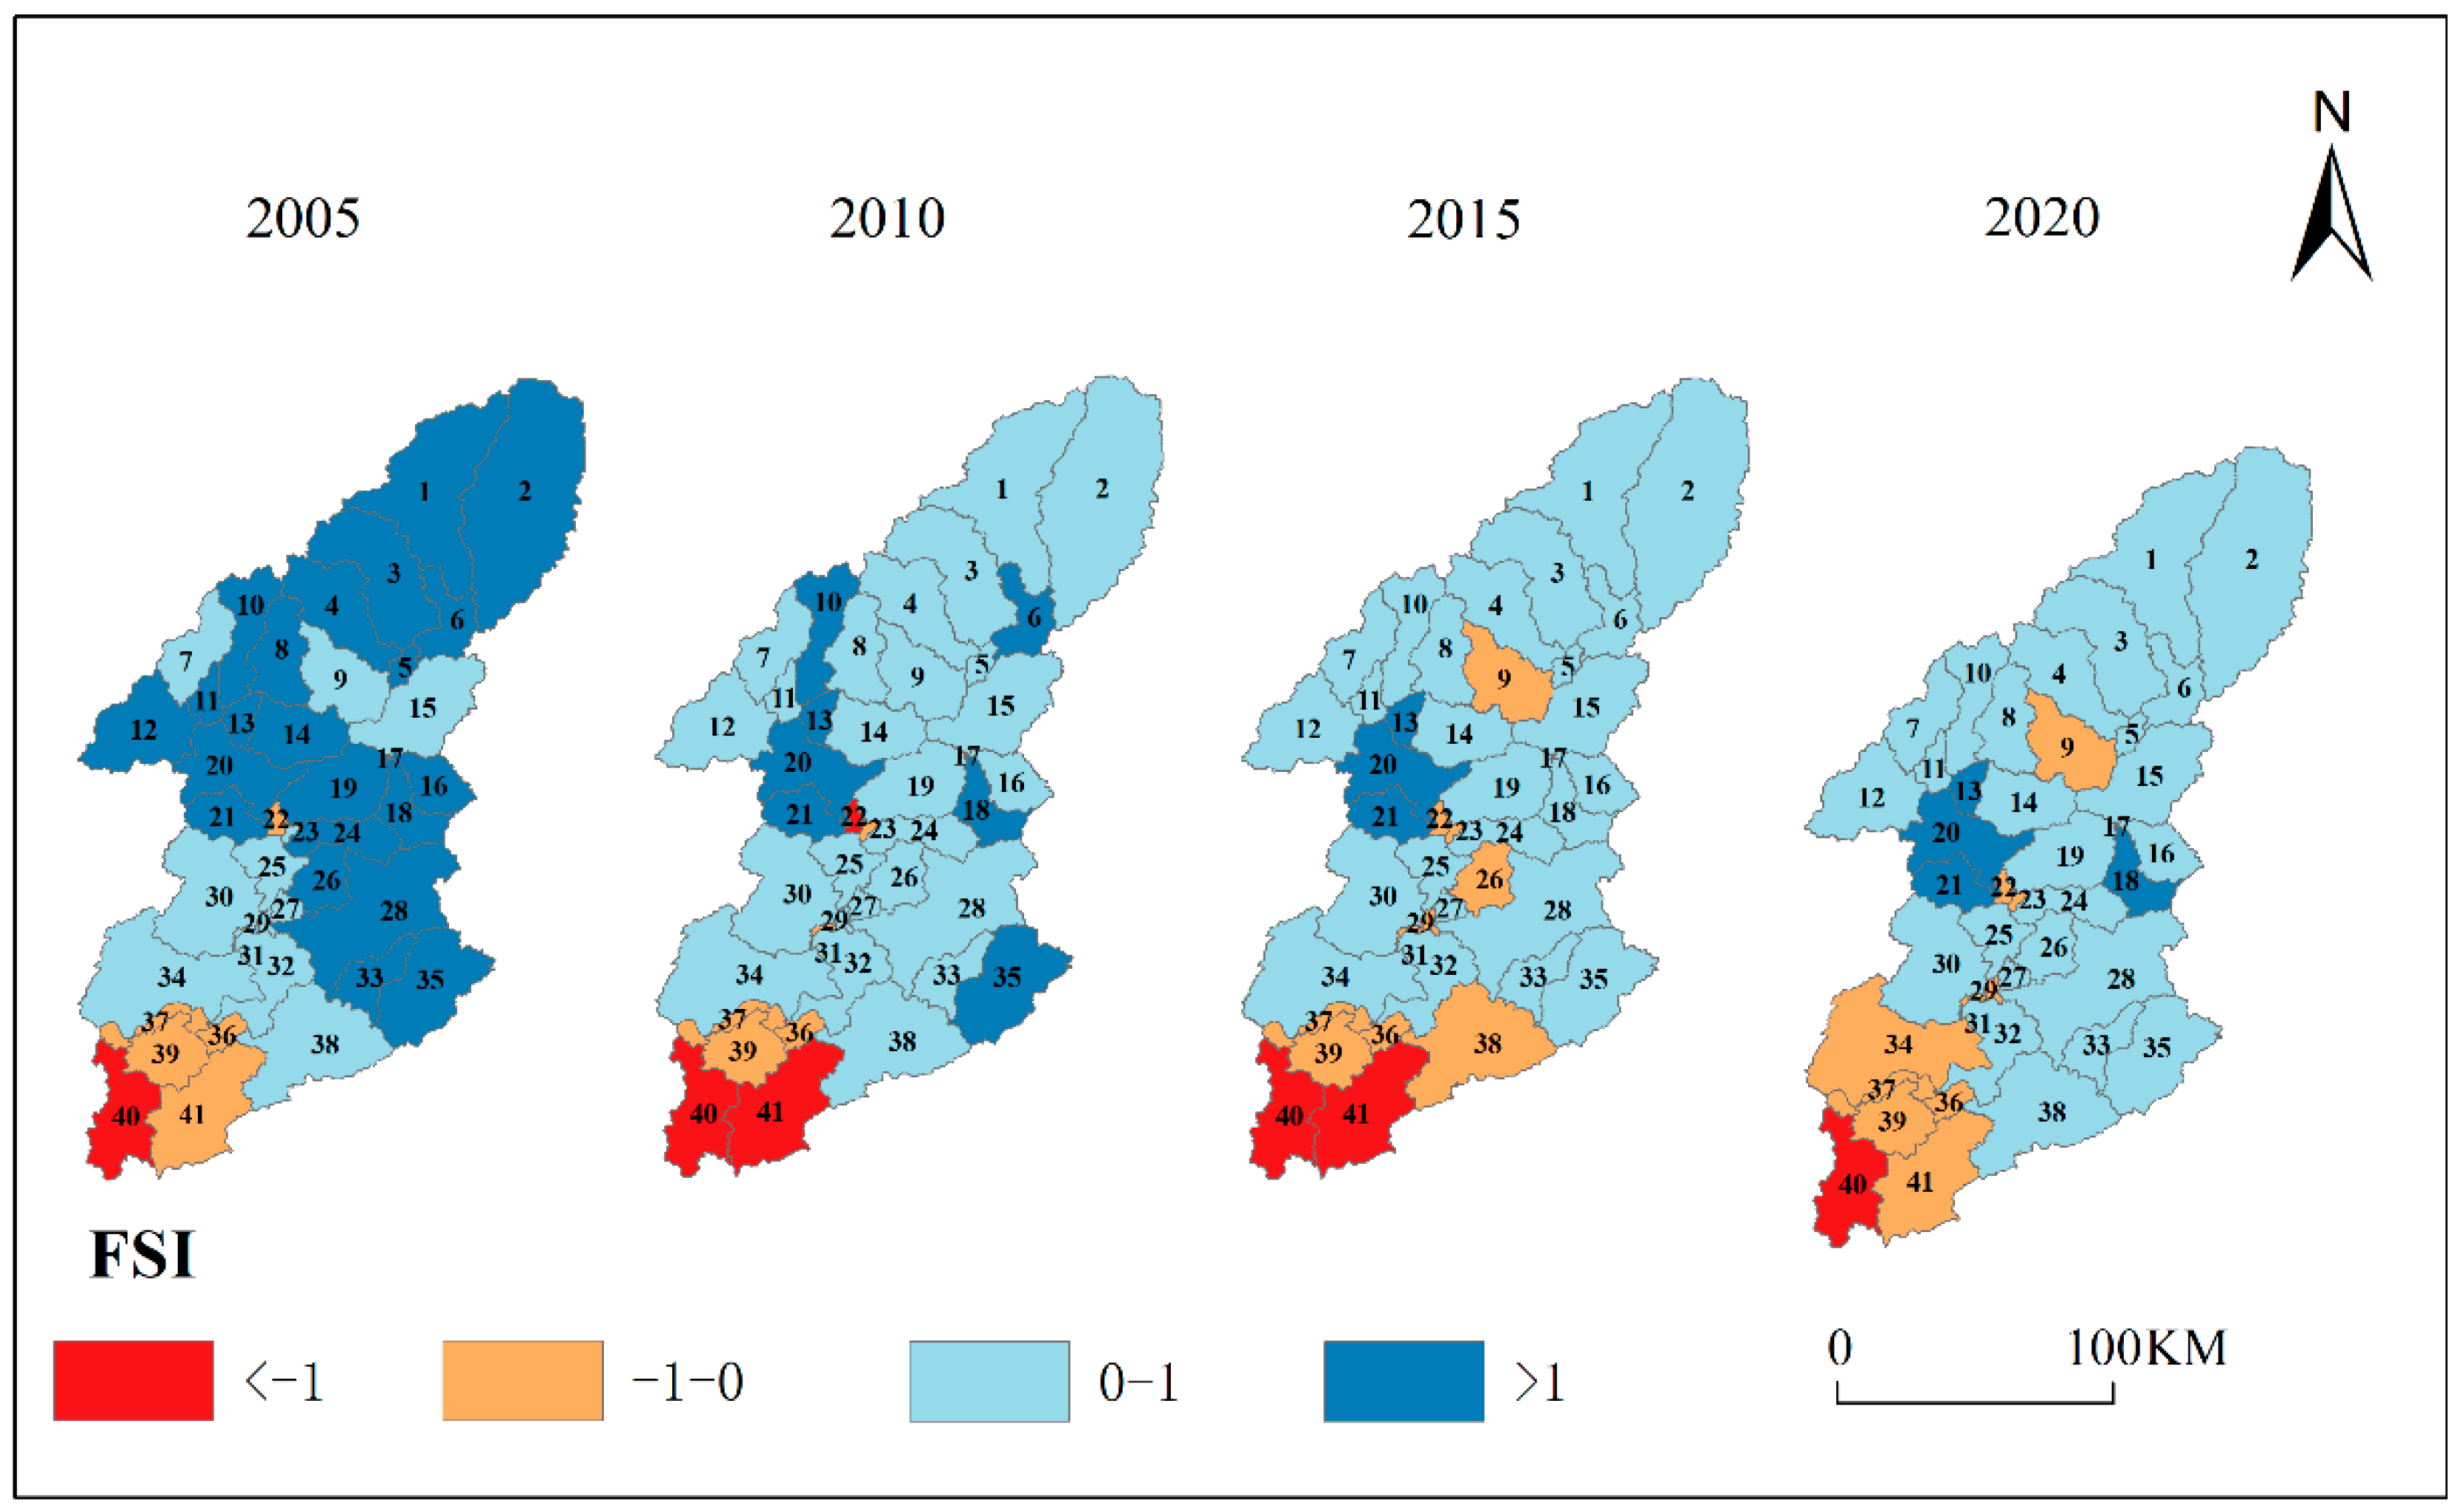
3.2. Analysis of Spatial and Temporal Changes in the Balance of Water Supply and Demand
To better characterize the balance between the supply and demand of water resources in the Dongjiang River Basin, this paper uses a modified water security index (FSI) and classifies it into four levels, <−1, −1–0, 0–1, and >1 (Figure 7). The water security index of the Dongjiang River Basin was greater than zero in all four years, indicating that the region is self-sufficient. From 2005 to 2015, the water security index of the Dongjiang River Basin gradually decreased. In 2005, the FSI of Dongjiang River Basin was 0.567, decreased to 0.217 in 2010, only to 0.018 in 2015, and increased to 0.167 in 2020. There is a sharp decrease in water supply, which is closely related to the precipitation in the study area. From a spatial perspective, the FSI of most subbasins in the middle and upper reaches of the Dongjiang River Basin is greater than 0 while the FSI in the downstream areas are mainly less than 0. The regions with FSI less than 0 in the study area also gradually move from the downstream regions to the whole region. Subbasins 40 and 41 are the areas with the greatest contradiction between water supply and demand in the study area, with the FSI less than −1 in all years except 2005 when the FSI for subbasin 41 was −0.682. Subbasins 22 and 23, where the Yuancheng District of Heyuan City is located, also have high water supply pressure, with FSI values less than 0. Subbasins 13, 20, and 21 have a large area of water with a high water supply and low water demand, so they always have a high FSI and the values are greater than 1.
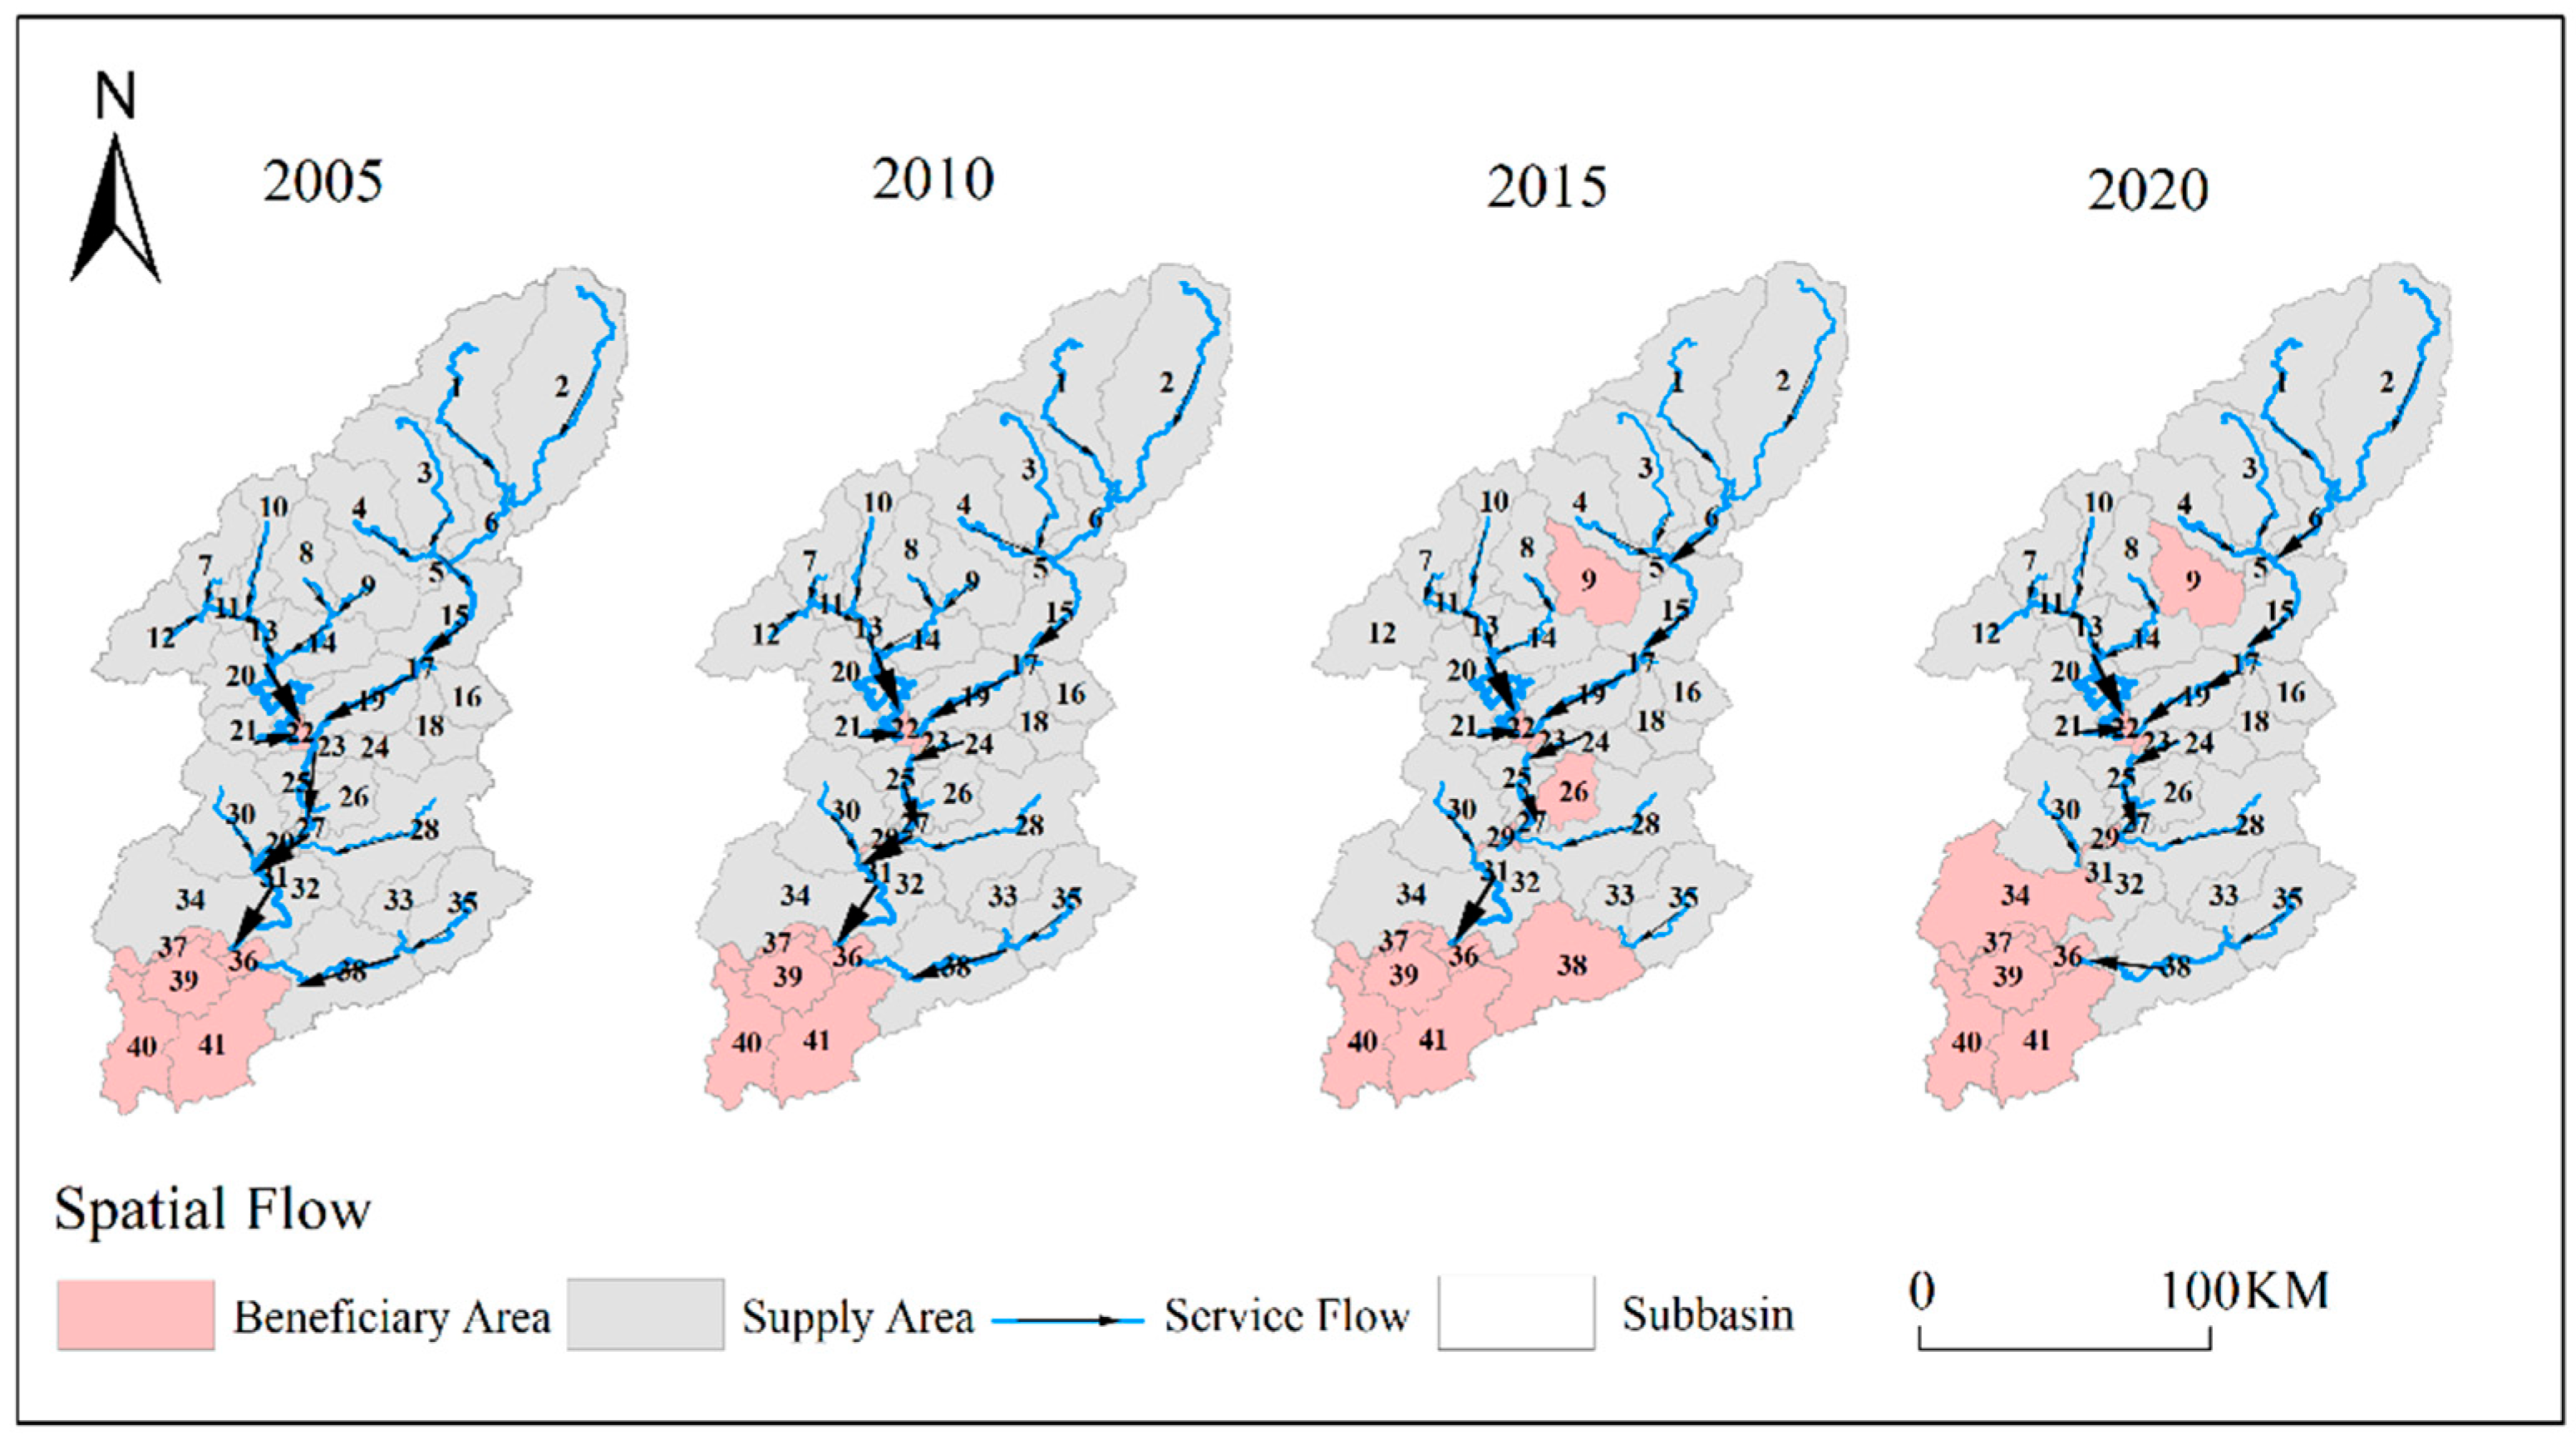
3.3. Water Resources Spatial Flow Simulation and Service Space Definition
Based on the supply and demand balance of water resources in each subbasin, the spatial flow of water resources in the study area is simulated using the Dongjiang River system network as the flow path of ecosystem service flows. As shown in Figure 8, water resources flow from the supply area to the beneficiary area, the arrow indicates the direction of service flow, and the symbol grade indicates the size of service flow. Water resources flow from the supply area to the beneficiary area, with arrows indicating the direction of service flows and symbols indicating the size of service flows. The number of beneficiary areas within the Dongjiang River Basin gradually increases from 2005 to 2015 and remains the same in 2020 compared to 2015. There were only 7 beneficiary areas in 2005, 9 in 2010, and 13 in 2015, increasing the pressure on water supply and demand and increasing the lack of water resources in the region.
Subbasin 17, where Dongyuan County is located, has about 60% of arable land, large agricultural water demand, and a small water supply in the region, so there is large water pressure, while its upstream subbasin still has a surplus after satisfying its water supply and can be used as a supply area for subbasin 17. The water source of the supply area mainly comes from Beiling water and the mainstream of the upstream of Dongjiang River, among which subbasins 1, 2, and 3 have the most supply, and subbasin 17 still has a surplus after receiving water from the upstream subbasin.
Subbasins 22 and 23, where Yuancheng District is located, are large and densely populated, are also under pressure for water use, and are therefore a major beneficiary area within the Dongjiang basin. Subbasins 20 and 21, where the Xinfengjiang Reservoir is located, are the main part of the water supply in subbasins 22 and 23. This beneficiary area part of the supply area has a large variation in the supply within different years; for example, the supply of the Chuantang River in subbasin 14 was 16,961 × 104 m3 in 2005, but in 2015 it was only 2096 × 104 m3, less than 15% of the 2005 supply, which is related to the gradual increase of water consumption in the supply area.
Subbasins 34, 36, 37, 39, 40, and 41, where the urban areas of Dongguan, Shenzhen, and Huizhou are located, are in the Guangdong–Hong Kong–Macao Bay Area, and have a high level of urbanization, high population density, and a high proportion of construction land, and are the areas with the highest water pressure in the study area, as well as the largest beneficiary area. The water source of the supply area mainly comes from the mainstream Dongjiang River as well as the Xizhi River. The water supply from the mainstream of the Dongjiang River is divided into two parts: one part is the supply from subbasins 25 to 32 downstream of the Dongjiang River, and the other part is the surplus water from the beneficiary area where subbasin 17 and subbasins 22 and 23 are located, with the surplus water being the main source of water supply for this beneficiary area. The Xizhi River basin is smaller in size, flowing only through subbasins 33, 35, and 38, but subbasin 35 is the largest supply area within the lower reaches of the main stem of the Dongjiang River and the Xizhi River basin.
Based on this, this paper divides the region into a total of three major beneficiary areas, namely, subbasin 17, subbasins 22 and 23, and subbasins 36, 37, 39, 40, and 4.
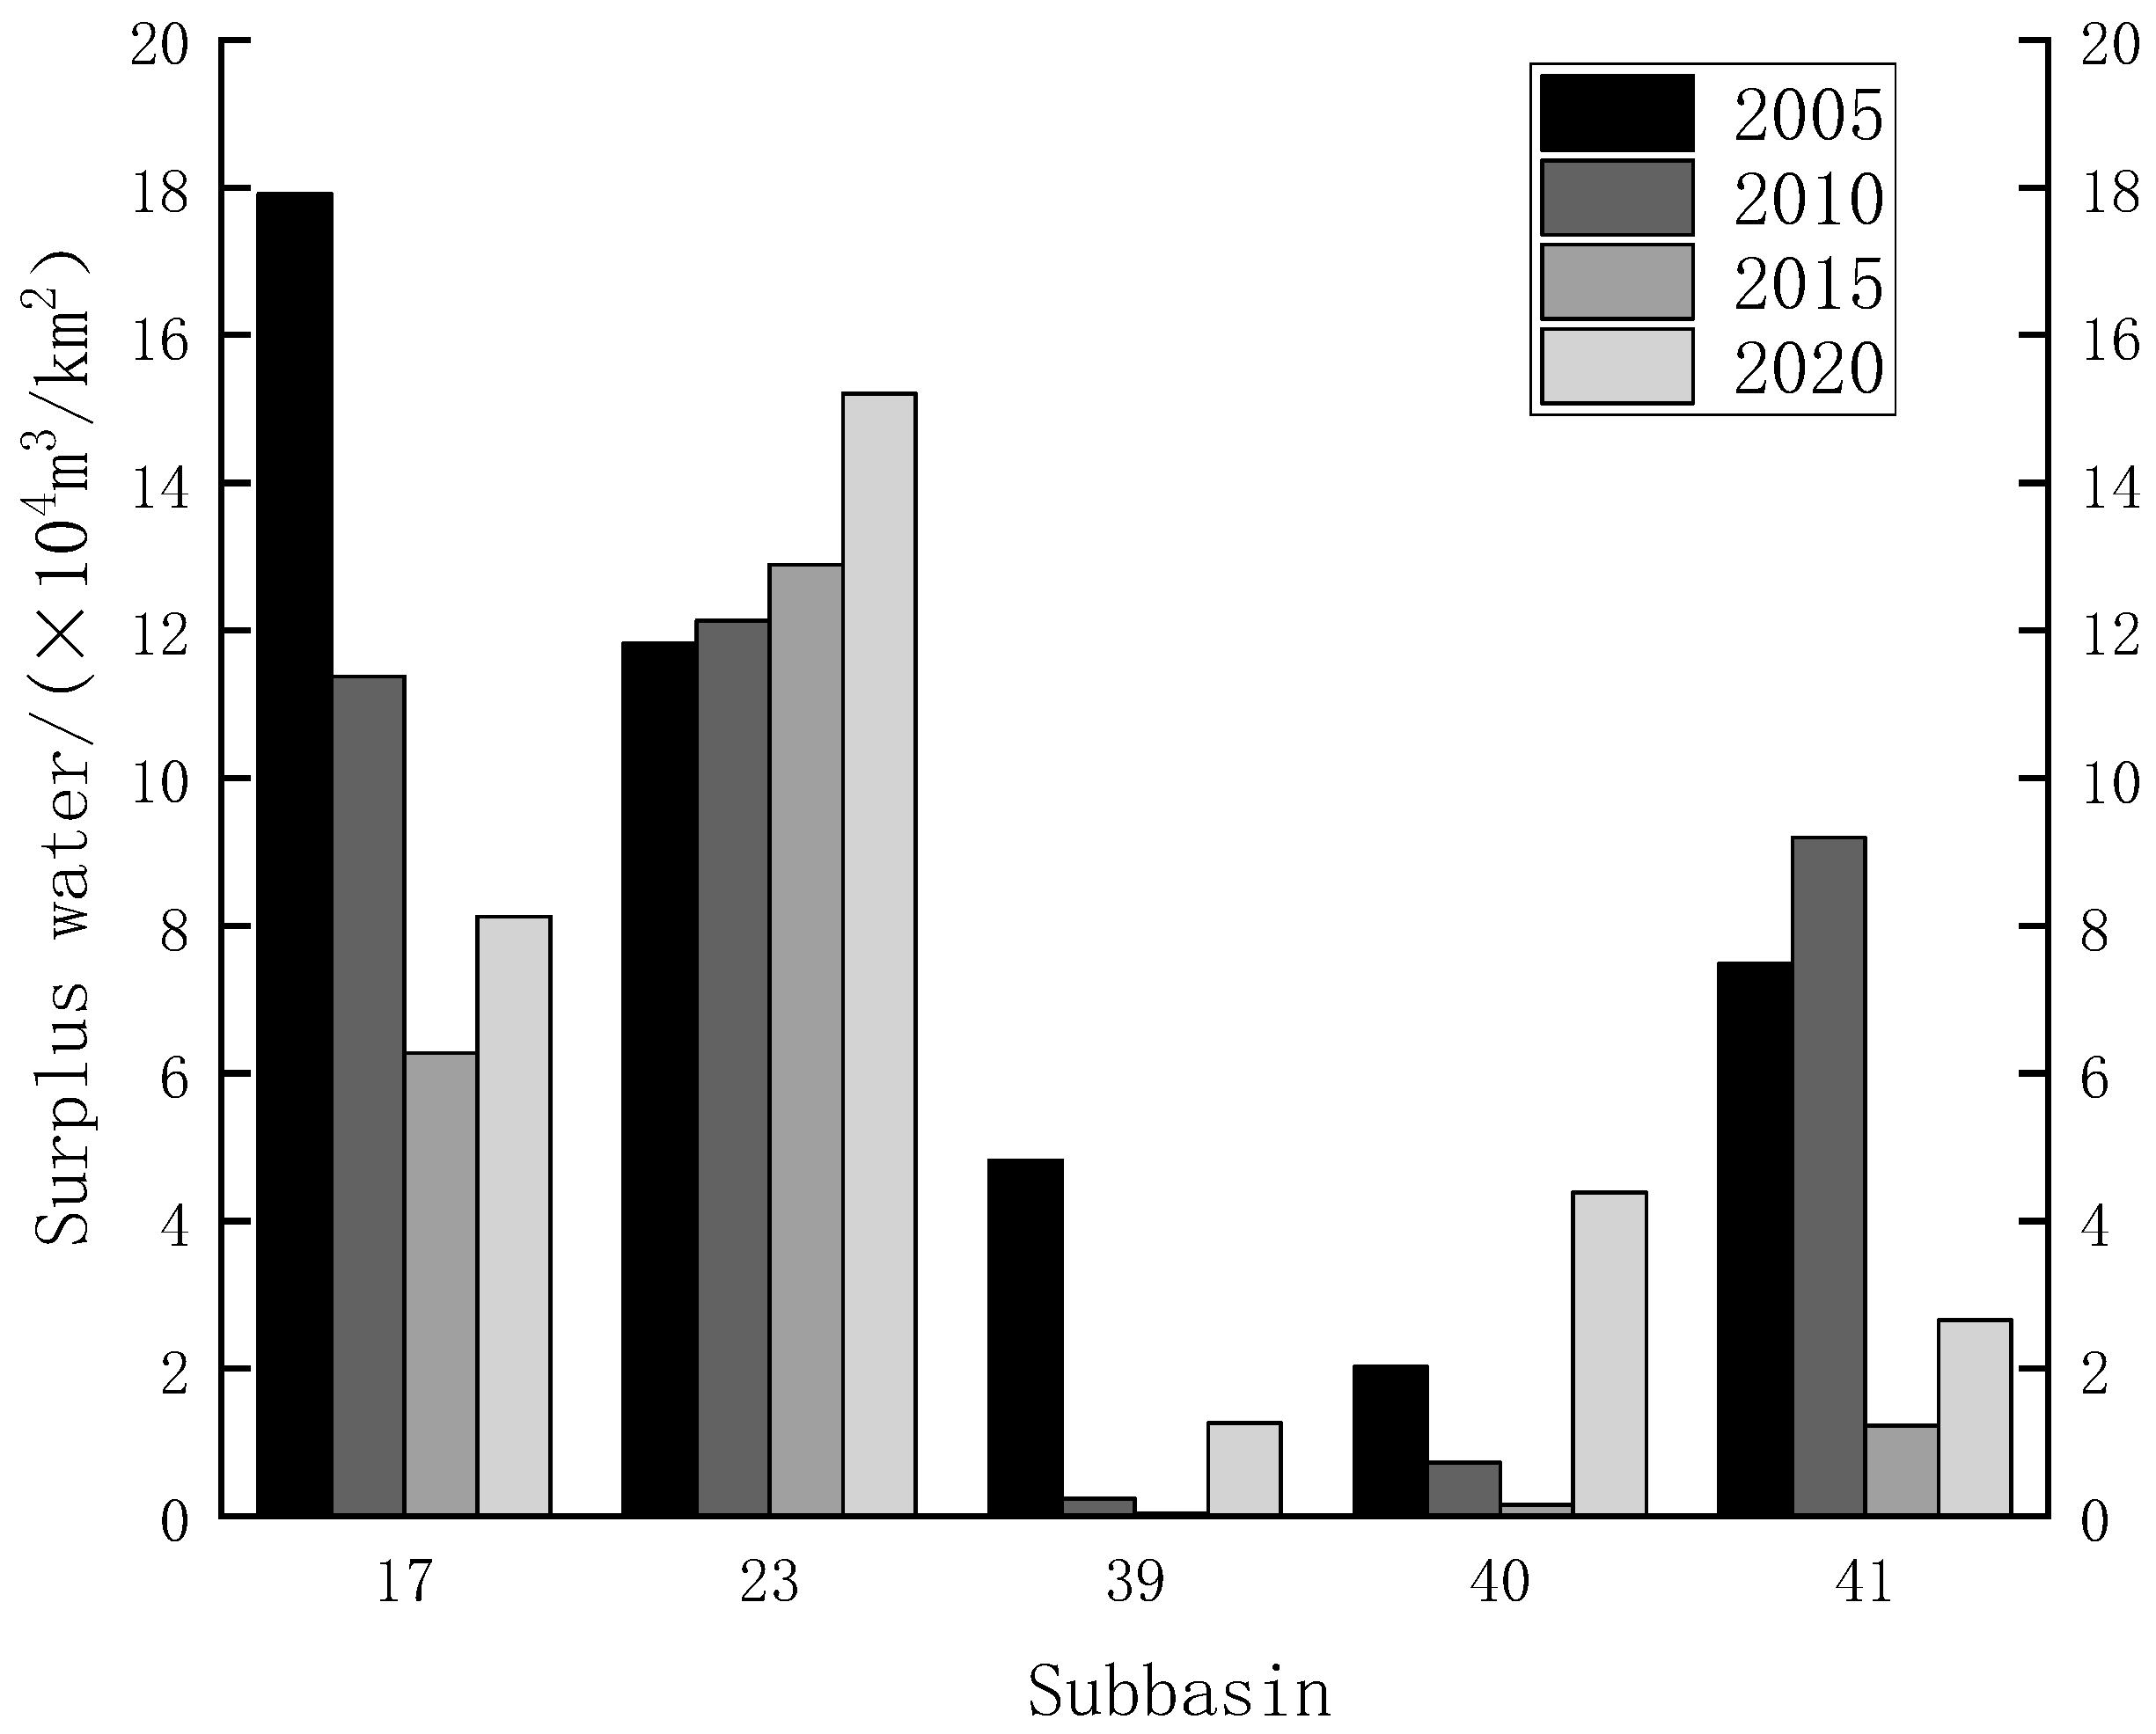
With the gradual increase in water stress in the study area, a small portion of spatial flow also occurred in the study area in 2010, 2015, and 2020, which existed only in two to five adjacent subbasins. Subbasins 30 and 31, located in the mainstream of the Dongjiang River, existed a smaller spatial flow in 2010, 2015, and 2020, with subbasin 31 receiving water supply from subbasin 30 as the beneficiary area. Subbasins 27 and 29, also located in the main stem of the Dongjiang River, also have a small spatial flow in 2015 and 2020, with subbasin 29 receiving water from subbasin 27. There is also a small spatial flow in 2015 and 2020 in the upper part of the Dongjiang basin, the Chuantang River, with subbasin 9 receiving water from subbasin 8. In addition, subbasin 26 also has a small spatial flow with its neighboring subbasins in 2015. The surplus water in the main beneficiary areas for 2005–2020 is shown in Figure 9.
4. Discussion
In this paper, when the spatial flow model of water supply and demand in the Dongjiang River Basin was constructed, we used the distributed hydrological model SWAT model to analyze the hydrological processes in the study area, combine the land use types in the study area, and conduct research at the subbasin scale to analyze the supply, demand, supply-demand balance and spatial flow of water resources in the study area [36]. The SWAT model can objectively reflect the influence of the uneven spatial distribution of climate and substratum on the formation of rainfall-runoff in the basin [37] and can be modified by using some of the measured runoff data in the basin when calculating water supply compared to other models [38]. Therefore, the SWAT model was chosen to calculate the water supply in the Dongjiang River Basin for a long time series. The water demand in a region is divided into two parts: one is the water produced by human production and life, including industrial water, agricultural water, and residential water, and the other is the water used by all plants, animals, and the environment that depend on water for survival and development in nature, mainly ecological water. In this paper, we established a link between water consumption statistics and land use data, and allocated the water consumption to each subbasin by calculating the water consumption of each administrative unit under each land-use type, to obtain the water demand at the subbasin scale [39]. The water demand at the subbasin scale was expressed spatially with Arc GIS. The watershed as a study unit has obvious physical boundaries and is highly integrated internally. When the resources in a watershed are damaged or not managed properly, it can cause ecological and environmental problems [40]. It is a more effective systemic approach to solve environmental problems and achieve sustainable socioeconomic development from a watershed perspective. Therefore, this paper uses the Dongjiang River Basin instead of the administrative boundary to study the supply and demand of water resources and obtains the dynamic changes in water resources flow in the Dongjiang basin. The elevation difference caused by surface undulation is the direct driving force of water flow, while the river channel is the transmission medium of water supply [21]. This paper constructs a spatial flow model of water resources supply and demand in the Dongjiang River Basin based on this model, specifying the supply and beneficiary areas, flow paths, and flow magnitudes in the study area, reflecting the flow of water resources in the basin, and providing reasonable suggestions for resource allocation and water resources management in the study area.
The limited water production capacity within the Dongjiang River Basin requires a reduction in water demand in order to alleviate the high pressure of water supply and demand in the region [31]. Industrial water use in the basin accounts for about 35% of the water demand, so the first step is to reduce industrial water use in the study area [41]. Companies in the region should make technological changes in the water-using and production industries to reduce industrial water use. Secondly, enterprises can improve the repetition rate of industrial water by establishing and improving recycling systems [42]. The main urban areas of cities such as Shenzhen, Dongguan, and Huizhou are located in the lower reaches of the Dongjiang basin, where there is a lot of land for construction and a dense population, so promoting water conservation on all fronts and getting the public into the habit of saving water can also ease the pressure on the Dongjiang River Basin.
There are three shortcomings in the research process. First, the water demand calculation failed to cover all water demand surfaces in social production activities and ecological processes, so the calculated water demand may be smaller than the actual water demand of the area. Secondly, since we can only obtain the water demand of municipal administrative units, when calculating the water demand at the subbasin scale, the water demand of administrative units is distributed equally by area, without taking into account the differences in water use within the region, so the calculated water demand at the subbasin scale may differ from the real water demand. Finally, there may be a part of water flow within the subbasin, so a smaller scale should be chosen for the next study. Human activities are closely linked to natural processes on the surface, and the deployment of water supply cannot ignore the needs of different stakeholder groups in the region and the management strategies for the spatial flow of water resources [43]. There are also differences in flow patterns and the number of beneficiaries in different categories of water supply and demand spatial flow models, and there is a spatial mismatch between supply and demand [44]. In addition, taking into account the views of both the water suppliers and the water users can greatly improve the quality standards of the water service level [45]. Therefore, in future studies of ecosystem service flows, comments from water users, policy factors, and the specific situation of the beneficiary areas should be taken into account.
5. Conclusions
This study provides an empirical case study of analyzing supply and demand balances and mapping service flows of water. Our results showed that the water demand in the Dongjiang watershed continuously increased and was approaching the limit of the capacity of water supply from 2005 to 2015. Especially in 2015, the surplus water in the basin was only 1.16 × 10⁸ m3. Water demand has been the dominant driver determining the surplus and deficit of water service in subbasins after 2005 and its influence has been increasing from 2005 to 2020. Further analysis showed that domestic water and agricultural water are relatively stable parts of water demand, and industrial water determines the amount of water demand. There are three beneficiary areas in the study area, of which Shenzhen Dongguan Huizhou is the largest beneficiary area, whose main source of water comes from the middle reaches of the mainstream of the Dongjiang River. These findings from our study can provide useful information to guide water management in the Dongjiang watershed, particularly in a time of population growth and threats of water scarcity. Despite some limitations, this study made a useful attempt to map the spatial flow of water which can provide ideas for the future study.
Author Contributions
Conceptualization, X.W., Z.Z. and F.L.; methodology, X.W., Z.Z. and F.L.; software, X.W. and S.C.; validation, X.W., Z.Z. and S.C.; formal analysis, X.W., Z.Z. and F.L.; investigation, X.W. and J.D.; resources, X.W. and Y.M.; data curation, X.W. and J.C.; writing—original draft preparation, X.W., Z.Z. and F.L.; writing—review and editing, X.W., Z.Z. and F.L.; visualization, X.W.; supervision, X.W., Z.Z., F.L., S.C., J.D., Y.M. and J.C.; project administration, X.W., Z.Z., F.L., S.C., J.D., Y.M. and J.C. All authors have read and agreed to the published version of the manuscript.
Funding
This research was supported by the National Natural Science Foundation of China (Grant No. 41471147).
Institutional Review Board Statement
The study was conducted according to the guidelines of the Declaration of Helsinki, and approved by School of Geography, South China Normal University.
Data Availability Statement
New data generated is shared through this article. All other sources of data are cited throughout the paper.
Conflicts of Interest
The authors declare no conflict of interest.
References
- Zhan, T.; Yu, Y.; Wu, X. Supply-Demand Spatial Matching of Ecosystem Services in the Huangshui River Basin. Ecol. Sin. 2021, 41, 7260–7272. [Google Scholar]
- Bryan, B.; Ye, Y.; Zhang, J.; Conor, J. Land-Use Change Impacts on Ecosystem Services Value: Incorporating the Scarcity Effects of Supply and Demand Dynamics. Ecosyst. Serv. 2018, 32, 144–157. [Google Scholar] [CrossRef]
- Meng, Q.; Zhang, L.; Wei, H.; Cai, E.; Dong, X. Spatio-Temporal Evolution of the Supply and Demand Risk of Ecosystem Services in the Yihe River Basin Based on Lucc. Acta Ecol. Sin. 2022, 42, 2033–2049. [Google Scholar]
- Liu, H.; Liu, L.; Ren, J.; Bian, Z.; Ding, S. Progress of Quantitative Analysis of Ecosystem Service Flow. Chin. J. Appl. Ecol. 2017, 28, 2723–2730. [Google Scholar]
- Koellnera, T.; Bonnb, A.; Arnholda, S.; Bagstade, K.; Fridmanf, D.; Guerrag, C.; Kastnerh, T.; Kissingerf, M.; Kleemannb, J.; Kuhlickei, C.; et al. Guidance for Assessing Interregional Ecosystem Service Flows. Ecol. Indic. 2019, 105, 92–106. [Google Scholar] [CrossRef]
- Gao, X.; Huang, B.; Hou, Y.; Xu, W.; Zheng, H.; Ma, D.; Ouyang, Z. Using Ecosystem Service Flows to Inform Ecological Compensation: Theory & Application. Int. J. Environ. Res. Public Health 2020, 17, 16. [Google Scholar]
- Bagstad, K.J.; Johnson, G.W.; Voigt, B.; Villa, F. Spatial Dynamics of Ecosystem Service Flows: A Comprehensive Approach to Quantifying Actual Services. Ecosyst. Serv. 2013, 4, 117–125. [Google Scholar] [CrossRef]
- Bagstad, K.J.; Villa, F.; Batker, D.; Harrison-Cox, J.; Voigt, B.; Johnson, G.W. From Theoretical to Actual Ecosystem Services: Mapping Beneficiaries and Spatial Flows in Ecosystem Service Assessments. Ecol. Soc. 2014, 19, 14. [Google Scholar] [CrossRef] [Green Version]
- Li, T.; Li, J.; Wang, Y.; Zeng, L. The Spatial Flow and Pattern Optimization of Carbon Sequestration Ecosystem Service in Guanzhong-Tianshui Economic Region. Sci. Agric. Sin. 2017, 50, 3953–3969. [Google Scholar]
- Zhang, X.; Wang, X.; Cheng, C.; Liu, S.; Zhou, C. Ecosystem Service Flows in Karst Area of China Based on the Relationship between Supply and Demand. Acta Ecol. Sin. 2021, 41, 3368–3380. [Google Scholar]
- Dun, Y.; Yang, C.; Yan, X.; Yang, Y.; Xiao, F.; Liang, S. Review of Researches on Watershed Ecosystem Services River Basin Hengduan Mountain Region. Ecol. Econ. 2019, 35, 179–183. [Google Scholar]
- Wu, R.; Liu, G.; Wen, Y. Spatiotemporal Variations of Water Yield and Water Quality Purification Service Functions in Guanting Reservoir Basin Based on Invest Model. Res. Environ. Sci. 2017, 30, 406–414. [Google Scholar]
- Dai, E.; Wang, Y. Spatial Heterogeneity and Driving Mechanisms of Water Yield Service in the Hengduan Mountain Region. Acta Geogr. Sin. 2020, 75, 607–619. [Google Scholar]
- Liu, J.; Zheng, X.; Fan, J.; Zhao, L. Evaluation of the Value of Water Retention Service in the Middle and Upper Reaches of Hunhe River Based on Swat Model. Chin. J. Appl. Ecol. 2021, 32, 3905–3912. [Google Scholar]
- Tian, F.; Lü, Y.H.; Fu, B.; Yang, Y.; Qiu, G.; Zang, C.; Zhang, L. Effects of Ecological Engineering on Water Balance under Two Different Vegetation Scenarios in the Qilian Mountain, Northwestern China. J. Hydrol. Reg. Stud. 2016, 5, 324–335. [Google Scholar] [CrossRef] [Green Version]
- Tao, Y.; Wang, H.; Ou, W.; Guo, J. A Land-Cover-Based Approach to Assessing Ecosystem Services Supply and Demand Dynamics in the Rapidly Urbanizing Yangtze River Delta Region. Land Use Policy 2018, 72, 250–258. [Google Scholar] [CrossRef]
- Serna-Chavez, H.M.; Schulp, C.J.E.; van Bodegom, P.M.; Bouten, W.; Verburg, P.H.; Davidson, M.D. A Quantitative Framework for Assessing Spatial Flows of Ecosystem Services. Ecol. Indic. 2014, 39, 24–33. [Google Scholar] [CrossRef] [Green Version]
- Vrebos, D.; Staes, J.; Vandenbroucke, T.; D’Haeyer, T.; Johnston, R.; Muhumuza, M.; Kasabeke, C.; Meire, P. Mapping Ecosystem Service Flows with Land Cover Scoring Maps for Data-Scarce Regions. Ecosyst. Serv. 2015, 13, 28–40. [Google Scholar] [CrossRef]
- Li, D.; Wu, S.; Liu, L.; Liang, Z.; Li, S. Evaluating Regional Water Security through a Freshwater Ecosystem Service Flow Model: A Case Study in Beijing-Tianjian-Hebei Region, China. Ecol. Indic. 2017, 81, 159–170. [Google Scholar] [CrossRef]
- Zhang, S.; Meng, X.; Liao, Q. Research on Water Resources and Water Balance in Beijing Processes in an Urbanized Basin. Geogr. Res. 2012, 31, 1991–1997. [Google Scholar]
- Chen, D.; Li, J.; Zhang, Y.; Zhang, C. Quantification and Simulation of Supply, Demand and Flow of Water Provision Service in the Yanhe Watershed, China. Acta Ecol. Sin. 2020, 40, 112–122. [Google Scholar]
- Ren, M.; Mao, D. Supply and Demand Analysis and Service Flow Research of Water Production Service in Lianshui River Basin. Ecol. Sci. 2021, 40, 186–195. [Google Scholar]
- Meng, X.; Wang, H.; Chen, J. Profound Impacts of the China Meteorological Assimilation Driving Datasets for the Swat Model (CMADS). Water 2019, 11, 832. [Google Scholar] [CrossRef] [Green Version]
- Wang, Y.; Lü, H.; Jiang, T. Influence of Watershed Subdivision and Dem Resolution on Swat Runoff Simulation. J. China Hydrol. 2008, 3, 22–25. [Google Scholar] [CrossRef]
- Wang, Z.; Liu, C.; Huang, Y. The Theory of Swat Model and Its Application in Heihe Basin. Prog. Geogr. 2003, 1, 79–86. [Google Scholar] [CrossRef]
- Yang, G.; Hao, F.; Liu, C.; Zhang, X. The Study on Baseflow Estimation and Assessment in Swat—Luohe Basin as an Example. Prog. Geogr. 2003, 5, 463–471. [Google Scholar] [CrossRef]
- Zuo, D.; Xu, Z. Distributed Hydrological Simulation Using Swat and Sufi-12 in the Wei River Bsain. J. Beijing Norm. Univ. (Nat. Sci.) 2012, 48, 490–496. [Google Scholar]
- Qian, K.; Ye, S.; Zhu, Q. Evapotranspiration Simulation with Different Scenarios Analysises of Fangshan District by Swat Model. Trans. Chin. Soc. Agric. Eng. 2011, 27, 99–105. [Google Scholar]
- Wang, Y.; Lü, H.; Shi, Y.; Jiang, T. Lmpacts of Land Use Changes on Hydrological Processes in an Urbanized Basin. J. Nat. Resour. 2009, 24, 30–36. [Google Scholar]
- Ou, W.; Liu, C.; Tao, Y. An Analysis of Spatio-Temporal Evolution of Water Supply and Demand in Taihu Basin. Resour. Environ. Yangtze Basin 2020, 29, 623–633. [Google Scholar]
- Cao, Q.; Bao, C.; Gu, C.; Guan, W. China’s Urbanization Sd Modelling and Simulation Based on Water Resource Constraints. Geogr. Res. 2019, 38, 167–180. [Google Scholar]
- Lin, J.; Huang, J.; Prell, C.; Bryan, B.A. Changes in Supply and Demand Mediate the Effects of Land-Use Change on Freshwater Ecosystem Services Flows. Sci. Total Environ. 2021, 763, 143012. [Google Scholar] [CrossRef] [PubMed]
- Liu, X.; Wen, T.; Zeng, X.; Yan, X.; Zhang, F. Analysis and Spatial Differences of Water Supply and Demand Balance in Yuanhe River Basin. South-North Water Transf. Water 2020, 18, 94–101. [Google Scholar]
- Yang, J.; Xie, B.; Zhang, D. Spatio-Temporal Variation of Water Yield and Its Response to Precipitation and Land Use Change in the Yellow River Basin Based on Invest Model. Chin. J. Appl. Ecol. 2020, 31, 9. [Google Scholar]
- Yang, Z.; Qin, F.; Li, L.; Guo, J.; Wang, Y. Relationship between Soil Particle Multifractals and Water Holding Capacity under Different Erosion Degrees in Feldspathic Sandstone Region. Soils 2021, 53, 620–627. [Google Scholar]
- Pang, J.; Xu, Z.; Liu, C. Swat Model Application: State-of-the-Art Review. Res. Soil Water Conserv. 2007, 3, 31–35. [Google Scholar]
- Priya, R.Y.; Manjula, R. A Review for Comparing Swat and Swat Coupled Models and Its Applications. Mater. Today Proc. 2021, 45, 7190–7194. [Google Scholar] [CrossRef]
- Yan, Y.; Zhang, Z.; Meng, J. Impact of Changes in Land Use and Climate on the Runoff in Liuxihe Watershed Based on Swat Model. Chin. J. Appl. Ecol. 2015, 26, 989–998. [Google Scholar]
- Liao, W.; Deng, H.; Li, R.; Zheng, H. Spatial Patterns of Ecosystem Hydrological Regulation Services and Factors affecting Them in the Yangtze River Basin: Sub-Watershed Scale Analysis. Acta Ecol. Sin. 2018, 38, 412–420. [Google Scholar]
- Qian, C.; Gong, J.; Zhang, J.; Liu, D. Change and Tradeoffs-Synergies Analysis on Watershed Ecosystem Services: A Case Study of Bailongjiang Watershed, Gansu. Acta Geogr. Sin. 2018, 73, 868–879. [Google Scholar]
- Li, Q.; Pei, L.; Sun, L.; Xiao, J. Study on Temporal and Spatial Variation and Influencing Factors of Industrial Water Consumption in Beijing-Tianjin-Hebei Region. Ecol. Econ. 2020, 36, 141–145. [Google Scholar]
- Tang, X.; Li, Z. Research on Industrial Water Efficiency and Water Saving Potential: Taking the Guanzhong Plain Urban Agglomeration as an Example. Ecol. Econ. 2020, 36, 134–140. [Google Scholar]
- Wang, C.; Li, W.; Sun, M.; Wang, Y.; Wang, S. Exploring the Formulation of Ecological Management Policies by Quantifying Interregional Primary Ecosystem Service Flows in Yangtze River Delta Region, China. J. Environ. Manag. 2021, 284, 112042. [Google Scholar] [CrossRef] [PubMed]
- Garau, E.; Pueyo-Ros, J.; Palom, A.R.; Vila-Subiros, J. Follow the Flow: Analysis of Relationships between Water Ecosystem Service Supply Units and Beneficiaries. Appl. Geogr. 2021, 133, 102491. [Google Scholar] [CrossRef]
- Pietrucha-Urbanik, K.; Rak, J.R. Consumers’ Perceptions of the Supply of Tap Water in Crisis Situations. Energies 2020, 13, 3617. [Google Scholar] [CrossRef]
Figure 1.
Study area.

Figure 2.
Simulated and real monthly runoff yield in calibrate period (2005–2013) and validation period (2014–2020).
Figure 2.
Simulated and real monthly runoff yield in calibrate period (2005–2013) and validation period (2014–2020).

Figure 3.
Spatial distribution of water supply per unit area in Dongjiang River Basin from 2005 to 2020.
Figure 3.
Spatial distribution of water supply per unit area in Dongjiang River Basin from 2005 to 2020.

Figure 4.
Variation of water supply and rainfall.

Figure 5.
Spatial distribution of water demand per unit area in the Dongjiang River Basin from 2005 to 2020.
Figure 5.
Spatial distribution of water demand per unit area in the Dongjiang River Basin from 2005 to 2020.

Figure 6.
Water demand by type per unit area.

Figure 7.
Balance of supply and demand of water.

Figure 8.
The spatial flow of water resources.

Figure 9.
The surplus water in the main beneficiary areas for 2005–2020 in Dongjiang basin.


Table 1.
Basic data.
| Data Type | Data Description | Data Source |
|---|---|---|
| DEM data | Resolution 30 m | Geospatial data (https://www.gscloud.cn) accessed on 5 August 2019 |
| Land use data | Resolution 30 m | Center for Resources and Environment, Chinese Academy of Sciences (http://www.resdc.cn) accessed on 1 January 2019 |
| Soil data | Resolution 1000 m | National Earth System Science Data (http://www.geodata.cn) accessed on 1 March 2009 |
| Meteorological data | Rainfall data for 11 stations | China Weather Data Network (http://data.cma.cn) accessed on 4 August 2012 |
| Atmospheric Assimilation Drive Dataset for China [23] | CMADS official website (http://www.cmads.org) accessed on 31 December 2018 | |
| Hydrological data | Runoff data of Heyuan and Pingshan from 2005–2019 | Hydrological Yearbook (http://www.cmads.org) accessed on 31 December 2019 |
| Socioeconomic data | GDP data, water demand data | Statistical Yearbook and Water Resources Bulletin of Guangdong Province and Jiangxi Province (http://www.cmads.org) accessed on 8 October 2021 |
Table 2.
Runoff sensitivity parameters.
| Method of Transfer Change Type | Parameter Name Parameter | Parameter Definition Description | Global Sensitivity Analysis | Range of Values Value Range | Optimal Value | |
|---|---|---|---|---|---|---|
| t-Value | p-Value | |||||
| R | CN2 | Runoff curve coefficient | −2.186 | 0.273 | [−0.2,0.2] | 0.053 |
| V | ALPHA_BF | Baseflow regression coefficient | 1.552 | 0.364 | [0,1] | 0.833 |
| V | GW_DELAY | Groundwater delay days | −1.067 | 0.479 | [30,450] | 324 |
| V | GWQMN | Shallow groundwater runoff coefficient | 0.751 | 0.590 | [0,2] | 1.667 |
| V | GW_REVAP | Groundwater re-evaporation coefficient | 0.751 | 0.590 | [0,0.2] | 0.020 |
| V | ESCO | Soil evaporation compensation factor | 0.447 | 0.732 | [0.8,1] | 0.807 |
| V | CH_N2 | Main River Manning Factor | −1.589 | 0.358 | [0,0.3] | 0.130 |
| V | CH_K2 | Effective hydraulic conductivity of the river | 0.248 | 0.845 | [5,130] | 109.167 |
| V | ALPHA_BNK | The alpha factor of riparian storage | 0.456 | 0.728 | [0,1] | 0.100 |
| R | SOL_AWC | Effective water available to the soil | 1.499 | 0.375 | [−0.2,0.4] | 0.380 |
| R | SOL_K | Saturated hydraulic conductivity | 0.907 | 0.531 | [−0.8,0.8] | 0.640 |
| R | SOL_BD | Soil wet capacity | −3.188 | 0.194 | [−0.5,0.6] | 0.270 |
The method of transfer change type R and V indicate the initial value of the parameter multiplied by 1+ optimal value and the optimal value assigned to the parameter, respectively.
Publisher’s Note: MDPI stays neutral with regard to jurisdictional claims in published maps and institutional affiliations. |
© 2022 by the authors. Licensee MDPI, Basel, Switzerland. This article is an open access article distributed under the terms and conditions of the Creative Commons Attribution (CC BY) license (https://creativecommons.org/licenses/by/4.0/).
Share and Cite
MDPI and ACS Style
Wang, X.; Zhang, Z.; Liu, F.; Chen, S.; Dong, J.; Mao, Y.; Cao, J. Study on Supply–Demand Balance Analysis and Service Flow of Water Resources in Dongjiang River Basin. Water 2022, 14, 2060. https://doi.org/10.3390/w14132060
AMA Style
Wang X, Zhang Z, Liu F, Chen S, Dong J, Mao Y, Cao J. Study on Supply–Demand Balance Analysis and Service Flow of Water Resources in Dongjiang River Basin. Water. 2022; 14(13):2060. https://doi.org/10.3390/w14132060
Chicago/Turabian StyleWang, Xinyi, Zhengdong Zhang, Fangrui Liu, Songjia Chen, Jianbin Dong, Yuanyuan Mao, and Jun Cao. 2022. "Study on Supply–Demand Balance Analysis and Service Flow of Water Resources in Dongjiang River Basin" Water 14, no. 13: 2060. https://doi.org/10.3390/w14132060
Note that from the first issue of 2016, this journal uses article numbers instead of page numbers. See further details here.