
Phytoplankton and Bacterial Communities’ Patterns in a Highly Dynamic Ecosystem (Central Mediterranean Sea)
by
 , , and
Carmela Caroppo
1 ,
,
Filippo Azzaro
2,
Alessandro Bergamasco
3,* ,
,
Gabriella Caruso
2 and
Franco Decembrini
2 1
Section of Taranto, Water Research Institute (CNR-IRSA), National Research Council, Via Roma 3, 74121 Taranto, Italy
2
Section of Messina, Institute of Polar Sciences (CNR-ISP), National Research Council, Spianata S. Raineri 86, 98122 Messina, Italy
3
Section of Venice, Institute of Marine Sciences (CNR-ISMAR), National Research Council, Castello 2737/F, 30122 Venice, Italy
*
Author to whom correspondence should be addressed.
Water 2022, 14(13), 2057; https://doi.org/10.3390/w14132057
Submission received: 12 May 2022
/
Revised: 17 June 2022
/
Accepted: 22 June 2022
/
Published: 27 June 2022
(This article belongs to the Section Oceans and Coastal Zones)
Abstract
:The Straits of Messina (Southern Italy, Mediterranean Sea) are a very complex area: they connect two basins (Tyrrhenian and Ionian) with different hydrographic features and is characterised by upwelling and mixing phenomena. The aim of the study was to evaluate if and how the physical and chemical water conditions and hydrodynamics influenced the phytoplankton and bacterial patterns and the functioning of this ecosystem. During a late winter survey, size-fractionated phytoplankton (from 0.2 to 200 μm) biomass (chlorophyll a), cell densities and species composition as well as total picoplankton abundances, morphotype composition, and activity levels of the enzymes leucine aminopeptidase, β-glucosidase, and alkaline phosphatase were investigated. The obtained results showed a marked diversification among the water masses identified within the Straits area. The analyses of the phytoplankton diversity indices, particularly those based on phylogenetic relationships between species (indices of taxonomic diversity and distinctness), confirmed our findings. In conclusion, the patterns of phytoplankton and bacterial communities provide a suitable approach to evaluate how microbial communities respond to changing environmental scenarios. This tool could be applied to other temperate Mediterranean ecosystems.
1. Introduction
The Straits of Messina are characterised by great hydrographic complexity, even on a short spatial scale (20 km length). They are located in the centre of the Mediterranean Sea and connect two basins, the Ionian and the Tyrrhenian, with different hydrographic features. The occurrence of the upwelling and mixing phenomena, consequent of strong tidal currents, mixes warmer Tyrrhenian Surface Waters (TSW) with cooler nutrient-rich Levantine Intermediate Waters (LIW) [1]. However, the high turbulence and relevant dynamics of the Straits do not allow the establishment of a well-structured phytoplankton community [2]. The development of phytoplankton is fostered by the nutrient enrichment of the rising waters: it is directly linked to the residence time of the organisms in the euphotic layer and inversely correlated to the mixing of the water column [3]. Several studies concerning the influence of the divergence (which pumps nutrient-rich waters into the euphotic layer) on large-sized biota as well as on the primary production process were also performed [3,4,5,6,7]. Conversely, the pelagic microbial community and its dynamics and functioning were scarcely considered [8].
Microorganisms include a huge number of functional types, from phytoplankton to prokaryotes (bacteria, archaea, and cyanobacteria), which are now considered the most abundant living component; they are highly involved in ecosystem functioning, especially in oligotrophic environments where changes in their structure and functioning are expected to have significant relevance in processes like primary production, enzymatic hydrolysis, and remineralization [9,10,11]. Furthermore, it is well known that microbial communities’ biogeography is correlated to different water masses in the whole Mediterranean Sea [12]. According to these considerations, hydrodynamic phenomena, such as upwelling occurring in the Straits of Messina, were expected to significantly affect the phytoplankton and bacterial abundances and metabolism, thus suggesting the possible use of this ecosystem as a natural mesocosm where the effects of water dynamics on microbes-organic matter interactions can be observed.
Previous studies described microbial communities as potential descriptors of environmental quality [13,14,15,16]. As heterotrophic bacteria utilise the available organic carbon substrates [9], both microbial abundance and functions undergo significant changes in response to environmental variability [17,18,19]. Variations in environmental and biological forcings have been related to those in cell morphological traits [20]. Moreover, specific physiological activities can be associated with the distribution of specific morphotypes [21]. Significant relationships between water trophism and cell morphology were also observed [22,23,24], pointing out that microbial morphology can be a suitable marker of changes in the trophic conditions of aquatic ecosystems [20].
Marine phytoplankton organisms are one of the key players in the coastal and open waters as they serve as the basis for marine food webs and contribute approximately 50% to global primary production [25]. The size fractions of the phytoplankton community provide information on the biogeochemical cycles [26,27]. Phytoplankton is characterised by high diversity and encompasses microorganisms highly distant from an evolutionary point of view [28]. It is well known that phytoplankton diversity and community structure influence the functioning of ecosystems [29,30]. However, more information is needed to improve knowledge on relations between phytoplankton diversity and upwelling ecosystem functioning [31].
Phytoplankton responds quickly to environmental forcing [32] and provides effective information on water quality, hydrography, and climate changes [33], and is considered a better indicator of trophic status than nutrient and chlorophyll a contents in water [34]. The most relevant feature of the distribution of phytoplankton communities is their patchiness linked to the variability of growth, predation, buoyancy (sinking), and vertical displacements due to advective processes such as water mixing. The latter affects the nutrient and microorganism distribution and, together with solar radiation, creates suitable conditions for sustaining primary production and diversity [35]. In nutrient-rich upwelling regions productivity is usually very high, although phytoplankton is subjected to contrasting effects: nutrient enrichment and light condition variability through vertical mixing [36].
Metabolic interactions between primary producing photoautotrophic organisms (phytoplankton and cyanobacteria) and heterotrophic organisms (prokaryotes including bacteria and archaea) are crucial to understanding ecosystem functioning [37]. Taking into account that about 50% of the carbon fixed by photosynthesis is processed by bacteria [38], to get a general overview of the interactions among the biological components of the trophic web in the Straits, both phytoplankton and bacterial communities were considered in this study. Particularly, the objective of this research was to evaluate if and how the physical and chemical conditions and hydrodynamics influenced the phytoplankton and bacterial patterns and the ecosystems’ functioning. Specifically, we aimed to describe (1) the abundance and spatial distribution patterns of bacterial and phytoplankton communities in the Straits and neighbouring areas; (2) picoplankton morphotypes and phytoplankton species composition and biodiversity; (3) the autotrophic and heterotrophic processes and their relationships by considering photosynthetic production and microbial decomposition.
2. Materials and Methods
2.1. Study Area
The distinctive trait in the Straits of Messina area is the interaction between the tidal currents and the morpho-bathymetric characteristics [39]. In particular, the presence of a transversal sill at about 80 m depth generates very strong pulsating horizontal currents (max > 2 m s−1, [40]), the formation of turbulent advective gyres [41], and massive upwelling of the Ionian Intermediate Waters (IIW) [7].
Turbulent mixing of the water column is the dominating oceanographic feature in the Straits of Messina, thus a stable seasonal thermocline cannot develop [5,6]. Rather, a two-layer structure develops with the less dense TSW located above that flows southwards and mixes with the upwelled IIW. A peculiar water mass is generated in the Straits (called Messina Mixing Waters, MMW): it exits to the south and can be tracked along the Ionian coast of Sicily up to 150 km of distance [42]. Conversely, the northward residual flow along the Sicilian coast beyond the sill favours the spreading of the just-upwelled IIW towards the Southern Tyrrhenian, where they adjust their depth according to their density [43]. Concentrations and distribution patterns of nutrients reflect the origin and history of water masses.
Plankton communities in the Straits are directly influenced by the above described physical–chemical upwelling features that produce a high concentration of chlorophyll a and primary production in the surrounding waters [7]. The strong contribution of the pico-sized fraction to primary production indicates that these microorganisms are best adapted to the mixing conditions [3,44].
2.2. Sampling
A sampling cruise (SAMCA IV Project) was conducted on board the R/V Urania (from 15–23 February 2004) at 25 hydrographic stations located on transects laying in the Southern Tyrrhenian Sea, Northern Ionian Sea, and the Straits of Messina (37° N–14.0° E and 39° N–16.0° E, Figure 1). Moreover, 81 vertical CTD casts were performed to better characterise the water masses in the area. The sampling was designed to get a snapshot of the microbial structure and functioning under similar tidal conditions in the different basins.
More details on the sampling stations are reported in Table S1.
2.3. Physical–Chemical Parameters
Vertical profiles of temperature (T) and salinity (S) were recorded by a SeaBird 911plus CTD-O-Fl profiler equipped with a Scufa (Turner) fluorometer; CTD was mounted on a Rosette sampler hosting 24 × 10 L Niskin bottles.
2.4. Total and Size-Fractionated Chlorophyll a and Primary Production Rates
Chlorophyll a (chla) and phaeopigment (phaeo) concentrations were measured with a Varian (mod. Cary Eclipse) spectrofluorometer according to the methods described in [42]. Sample aliquots (1.5–2.0 L) were sequentially filtered on polycarbonate (10.0 and 2.0 μm) and on Whatman GF/F filters to separate the micro- (>10.0 μm), nano- (2.0–10.0 μm), and pico-sized phytoplankton (0.2–2.0 μm) fractions. The chla and phaeo pigments were extracted in a 90% acetone solution for 24 h in the dark at 4 °C and total and size-fractionated primary production (PP) were estimated by using the standard 14C labelling technique [47]. Samples (three replicates) were incubated (for 4 h) in an on-deck continuous-seawater-flow incubator equipped with a set of neutral density screens, in order to reproduce the irradiance intensities at the sampling depth. Details of the procedure are reported in [16].
2.5. Prokaryotic Abundance and Morphotypes
Water samples were preserved with formaldehyde at a 2% final concentration and kept at 4 °C until their counting, which was made within four weeks using a Zeiss Standard Axioplan epifluorescence microscope equipped with a mercury vapour (Hg 100) lamp at 1000× magnification.
Photoautotrophic picoplankton (picophytoplankton, PPA) abundance was evaluated by filtering onto 0.2 μm pore-size Millipore black membranes 10 mL volumes in duplicate. Right Under blue light excitation, cyanobacterial cells fluoresced yellow-orange whereas eukaryotic algae fluoresced deep red. A BP 485/20 exciting filter, a FT 510 chromatic beam splitter, and an LP 520 barrier filter were utilised.
Total picoplankton (PPT) concentration was assessed by filtering onto a 0.2 μm pore-size Millipore filter 1 mL in duplicate and staining the filter with DAPI (4,6-diamidino-2 phenyl-indole) [48]. A G 365 exciting filter, an FT 395 chromatic beam splitter, and an LP 420 barrier filter were utilised. The counted PPT cells were distinguished into eight different size classes: three size classes of cocci (0.5, 0.85, and 1.0 μm) and five size classes of rods (1.0, 1.5, 2.0, 2.5, and 3.0 μm).
A minimum of 200 PPA and PPT cells were counted per filter within at least 20 randomly selected fields or more to ensure ±10% confidence levels. The abundance of the heterotrophic picoplankton (PPH) was obtained from the difference between PPT and PPA.
2.6. Larger Phytoplankton Abundance and Species Composition
Water samples (500 mL) were fixed with an acid Lugol’s iodine solution at a 1.0% final dilution, stored at 4 °C, and processed within four weeks. Identification and counting were performed using an inverted microscope (Labovert FS Leitz) equipped with phase contrast following the Utermöhl method [49]. With the term “Larger phytoplankton” we considered the “Utermöhl phytoplankton”, which comprises the nano- (2–20 μm) and micro- (20–200 μm) sized phytoplankton taxa recognizable under light microscopy. Following a preliminary evaluation of phytoplankton cell densities, a variable volume of sample (50–100 mL) was settled in an Utermöhl chamber and analysed at magnifications of 400× and 630×. Phytoplankton cells were counted within 30–60 randomly selected fields or along 1–4 transects; in addition, half of the chamber was examined at 200× magnification to better determine the less abundant species. A minimum of 200 cells was counted per sample to ensure a confidence limit of 14% [50], which is a generally accepted limit, especially for samples collected in oligotrophic waters [51].
2.7. Extracellular Enzyme Activity Rates (EEA)
Total extracellular enzymatic activity (EEA) measurements in terms of leucine aminopeptidase (LAP) alkaline phosphatase (AP) and β-glucosidase (GLU) activity rates were performed according to Hoppe’s method [52] based on the use of fluorogenic substrates. Methylumbelliferyl (MUF)-derived compounds MUF-phosphate and MUF-ß-Glucopyranoside (Sigma-Aldrich Corporate, Merck Life Science, Milan, Italy) for AP and GLU, respectively, and the methylcoumarine (MCA)-derived compound L-leucine-7-amido-4-methylcoumarin hydrochloride (Sigma-Aldrich) for LAP were added to triplicate 10 mL water samples. Five increasing concentrations (from 0.1 to 20 µM) of each fluorogenic substrate were used, according to a multi-concentration method [53], whereas for the blank tube sterile prefiltered seawater was added. After incubation at in situ temperature for 3 h, the fluorescence released from the hydrolysis of the fluorogenic substrate was recorded with a Turner TD 700 fluorometer, equipped with 380–440 and 365–445 nm filters (excitation-emission wavelengths) for Leu-MCA and MUF substrates, respectively. A standard curve with known concentrations of MUF and MCA allowed us to convert the increase in fluorescence into the hydrolysis velocity, reported as Vmax [54].
2.8. Data Processing
2.8.1. Statistical Analysis
CTD data were processed with Ocean Data View (ODV) software [55] to obtain the T/S diagram and the sections of density anomalies and chla from the fluorescence sensor. The agglomeration distance plot of salinity values at different depths guided the formation of four clusters from the 129 pairs of available observations. These four clusters were named according to the dominant water masses: Tyrrhenian Surface Waters—TSW; Mixed Messina Waters—MMW; Intermediate Ionian Waters—IIW; Deep Waters—DW.
To test for significant differences between and within groups of data, one-way ANOVA and parametric (Fisher’s LSD on means) or non-parametric (Kruskal–Wallis on medians, in case of non-homogeneity of variances) tests were used.
The Pearson’s correlations were used to detect relevant pairwise relations, if any [56].
Multivariate SIMPER analysis was applied to compare microbial structure and activities. Compared with common Spearman’s and Pearson’s correlations, multivariate analyses are more suitable approaches to assess links between structure and process in studies focused on the whole microbial community, being the correlation analyses unable to estimate microbial interactions and non-linear responses [57].
2.8.2. Phytoplankton Community Structure and Biodiversity
The spatial distribution of the phytoplankton community was analysed using the PRIMER v.7 software package [58] (Primer-E). The initial matrix comprised all the detected species/morphospecies (N = 106), including the pico-sized Synechococcus/Cyanobium, the phytoflagellates, and the rare taxa (i.e., those with a low relative abundance and low frequency of occurrence) [58]. Bi-dimensional representations of the statistical comparisons among water masses were obtained by non-parametric multidimensional scaling (nMDS) performed on Bray–Curtis similarity matrices (log-transformed data) [58]. The choice of the best level of transformation has been already described in [16]. To evaluate the differences in the phytoplankton community assemblages between different water masses a one-way analysis of similarities (ANOSIM) was applied. In addition, a one-way similarity percentage procedure (SIMPER routine) was used to obtain the percentage contribution of each species/morphospecies to the Bray–Curtis similarity between the groups of samples in three water masses (TSW, MMW, and IIW).
As regards phytoplankton diversity indices, the species richness (S), the Margalef’s species richness index (d) [59], the Shannon–Wiener diversity index (H′ [60], and Pielou’s species evenness index (J′) [61] were determined. Moreover, to evaluate the taxonomic relatedness of different taxa in the communities, the average taxonomic diversity (Δ) and the average taxonomic distinctness (Δ*) were estimated [62] following the AlgaeBase Listing the World’s Algae classification (https://www.algaebase.org, accessed on March 2022). The Δ is defined as the path length through a standard Linnaean phylogenetic tree connecting species whereas the Δ* is the mean taxonomic distance through the tree of all species within a sample [58]. Specimens identified at different taxonomic levels (species, genera, family, order, class, subphylum, phylum, kingdom, and empire) were weighted from 1 to 9, to put more weight in the shorter branch lengths between species [63].
3. Results
3.1. Physical–Chemical Variables
Physical–chemical variables in the different water masses are displayed in Table 1.
T/S diagram (Figure 2a) shows the different water masses that occupy the investigated area in which IIW mix with TSW due to tidal currents. The mixing of these two dissimilar water masses produces the MMW [39].
On the basis of the water’s conservative parameters (T and S), the individual samples, taken for the determination of the microbial component, were assigned to the four water masses, so that the number of samples was different for each of them (Table 1). Three of these water masses corresponded to the above water masses whereas the fourth identified the Deep Waters (DW). The latter included both Tyrrhenian and Ionian deep waters and were distinguished in the lower and upper extremes of salinity (see Figure 2a), corresponding to Tyrrhenian and Ionian waters, respectively.
The average concentration of orthophosphates in the study area was 0.25 ± 0.10 µM with the highest value in MMW (0.26 ± 0.10 µM) and the lowest value in TSW (0.21 ± 0.07 µM) (Table 1). Their concentrations in TSW were significantly lower than in IIW, MMW, and DW (ANOVA, F = 2.90, p < 0.05). For ammonia nitrogen, the overall average concentration was 0.99 ± 0.59 µM, with maxima in the IIW layer (1.03 ± 0.59 µM) and in the MMW (0.94 ± 0.54 µM) without significant differences among the water masses (ANOVA, F = 0.45, p > 0.05). The average concentration of nitric + nitrous nitrogen was 2.30 ± 1.99 µM, with the range spanning from 1.16 ± 0.44 µM in TSW and 2.24 ± 1.11 µM in IIW. DW exhibited significantly and markedly higher concentrations with respect to the other water masses (8.41 ± 3.48 µM). A significantly increasing gradient was found from TSW to IIW, with MMW in between (ANOVA, Kruskal–Wallis test on medians, F = 67.86, p < 0.05). The lowest average concentration of silicates was observed in the TSW (2.08 ± 1.47 µM) and the highest in the DW (6.31 ± 1.62 µM), whereas the overall average concentration in the study area was 2.86 ± 1.58 µM. Similarly to nitric + nitrous nitrogen, for silicates significantly higher values were found in DW than in TSW, MMW, and IIW whereas TSW showed significantly lower values than IIW (ANOVA, F = 28.35, p < 0.05).
As an example of the high hydrodynamism of the area, we reported the vertical profile of the transect between Sicily and Calabria placed on the shallower part (“sill”), where the phenomena were very evident. Figure 2b describes the distribution of water density in the Ganzirri–P. Pezzo transect (see Figure 1); here it is possible to highlight how the IIW, with higher density, upwelled along the Sicilian shore up to 30 m depth. The TSW, in part already mixed to form the MMW, occupied the Calabrian side and the central part of the Strait in the layer of about 40 m depth. Chlorophyll a distribution (from probe fluorescence) displayed an opposite trend to that of water density, with lower concentrations in IIW and higher in TSW, with maxima located at the surface layer along the Calabrian coast.
3.2. Distribution of Size-Fractionated Chlorophyll A, Phaeo-Pigments, and Primary Production
The average chlorophyll a concentration in the study area was 0.115 ± 0.100 μg-chla L−1 with the minimum in IIW (0.065 ± 0.059 μg-chla L−1) and maximum in TSW (0.228 ± 0.095 μg-chla L−1) (Table 1, Figure 3a). Differences among the medians in three water masses were significant (ANOVA, Kruskal–Wallis F = 58.86, p < 0.05, n = 129). Conversely, dimensional spectra did not exhibit significant differences (ANOVA on size fractions, p > 0.05, n = 28) with the picoplankton component contributing on average 62% of the total followed by the nano fraction with 24%.
The functional state of the phytoplankton community expressed by the ratio between chla and phaeo was on average greater than 1 in TSW and IIW (Figure 3b) indicating stronger activity than in MMW (n = 33). This ratio was significantly higher in TSW (ANOVA, F = 13.52, p < 0.01) than in MMW and IIW, which were not significantly different from each other. In particular, although the pico fraction appeared to be the most active in all water masses, it was not significantly different among the water masses, differently from the nano fraction which appeared to be more relatively active in IIW (n = 76).
The average primary production rate in the area was 0.554 ± 0.392 μgC L−1 h−1 with higher and more dispersed values in IIW (0.603 ± 0.446 μgC L−1 h−1) than in TSW (0.442 ± 0.302 μgC L−1 h−1) (Table 1, Figure 3c). Likewise, for chla even the size fractionated production did not exhibit significant differences (ANOVA, p > 0.05, n = 20) with a predominating pico component (77% and 67% in MMW and TSW, respectively).
The specific production (Pb = PP normalised in respect to chla), which expressed the activity of the phytoplankton, indicated that the IIW communities were more active than the TSW ones (Figure 3d), though not significantly (ANOVA, F = 0.98, p > 0.05, n = 17). The Pb of the size fractions showed higher activity of pico and nano components in IIW due to the lower biomass per organism, whereas the Pb of pico and micro fractions prevailed in TSW (pico-sized fraction: 6.3 and micro-sized fraction: 2.6 [μg C (μg chla)−1 h−1]).
3.3. Total Picoplankton Community
PPT showed a mean value of 2.4 ± 1.3 × 10⁸ cells L−1 with values significantly higher in TSW compared with IIW (Table 1); moreover, DW were significantly lower with respect to all the other water masses (ANOVA, Kruskal–Wallis F = 44.87, p < 0.001) (Figure 4a).
From a qualitative point of view (Figure 4b), PPT was mainly represented by the smallest components of the community: cocci (0.5 μm, accounting for 48.5%; 0.85 μm, 10.7% of the total abundances) and rods (1.0 μm, 28.4%; 1.5 μm, 6.8%; 2.0 μm, 3.6% of the total abundances). Significant differences were found for the cocci 0.5 μm (ANOVA, Kruskal–Wallis F = 17.71, p < 0.05) and cocci 0.85 μm (ANOVA, Kruskal–Wallis F = 6.15, p < 0.005) which were both higher in MMW than in IIW. Rods 1.0 μm (ANOVA, Kruskal–Wallis F = 27.16, p < 0.0001) and rods 2.0 μm (ANOVA, Kruskal–Wallis F = 3.6, p < 0.05) were more abundant in TSW than in IIW. DW always showed abundances lower than in other water masses (data not shown). Finally, the abundances of the morphotypes cocci 1.0 μm, rods 1.5, 2.5, and 3.0 μm displayed similar values in all four water masses.
SIMPER analysis confirmed that TSW were significantly different from DW, MMW, and IIW, as shown by the values of squared distance D2 (47.59, 37.25, and 37.20%, respectively), whereas IIW were more similar to DW and MMW (D2 = 10.91 and 23.07% respectively, data not shown).
3.4. Phytoplankton Communities
PPA values were on average 11.5 ± 6.5 × 10⁶ cells L−1 with abundances significantly higher in TSW than in MMW and IIW (TSW > MMW > IIW) (ANOVA, Bonferroni, F = 48.91 p < 0.01) (Table 1, Figure 5a). Intense orange fluorescent round to rod-shaped cells of Synechococcus/Cyanobium type accounted for 99% of the PPA abundances in TSW, MMW, and IIW. The presence of red fluorescent cells, presumably referred to as eukaryotic PPA, was negligible.
Larger phytoplankton abundances ranged between 18.2 and 171.0 × 10³ cells L−1, with average values of 49.9 ± 28.9 × 10³ cells L−1. Significantly higher concentrations were detected in the TSW (p < 0.005), in respect to the other water masses (Figure 5b). Concerning the phytoplankton groups, they did not show significant differences among the three water masses (p > 0.05), except for dinoflagellates that displayed significantly higher abundances (p < 0.05) in TSW with respect to MMW and IIW.
The phytoplankton community was dominated by “other phytoflagellates” that represented on average 78.1 ± 9.8% of the total abundances. They mainly included chloro (40.3%), prasino (11.8%), crypto (7.8%), chryso (4.8%), euglenophyceae (3.9%), and small forms (<10 μm) of uncertain taxonomic identification (10.1%). Diatoms and dinoflagellates averaged 9.6 ± 7.0% and 5.4 ± 3.7%, respectively. Coccolithophore abundances corresponded on average to 6.9 ± 5.2% with the nano-sized Emiliania huxleyi as the dominant species (98.7%).
A total of 106 taxa including 57 diatoms, 43 dinoflagellates, 2 coccolithophores, 3 species classified in the group “other phytoflagellates” and 1 prokaryotic type were identified. Their distribution in all three water masses is shown in Table S2.
Concerning the phytoplankton species distribution, a significant partitioning in all the water masses was found (ANOSIM, R = 0.199, p = 0.1%).
SIMPER analysis revealed that more than 70% of cumulative similarity was only due to three species/morphospecies: Synechococcus/Cyanobium type, nano-sized phytoflagellates and Emiliania huxleyi. Moreover, even if with lower abundances, other taxa were identified in the entire study area. They were mainly represented by diatoms (25 out of 37) with the following species in decreasing order of abundance: Thalassionema bacillare, Asterionellopsis glacialis, Chaetoceros spp., Cylindrotheca closterium, Proboscia alata, Pseudo-nitzschia spp., Rhizosolenia styliformis, Tenuicylindrus belgicus, Thalassiosira sp. In addition, dinoflagellates (Diplopsalis group, Gymnodinium marinum, Gymnodinium spp., Gyrodinium fusiforme, Prorocentrum cordatum) and the silicoflagellate Dictyocha fibula were present in all the water masses (Table S2).
As regards the “distinctive” taxa between the water masses, sixteen species (seven diatoms and nine dinoflagellates) were detected only in the TSW. Among them, the more abundant species were the diatoms Chaetoceros danicus, C. eibenii, C. throndsenii, and Guinardia flaccida, and the dinoflagellates Azadinium caudatum, Lingulodinium polyedra, Oxytoxum mediterraneum, Pentapharsodinium tyrrhenicum, and Tripos spp.
Only seven taxa (four diatoms and three dinoflagellates) were identified exclusively in the MMW: Chaetoceros neglectus, C. similis, C. wighami, Rhizosolenia hebetata f. semispina, Gyrodinium heterostriatum, Katodinium glaucum and Lebouridinium glaucum.
Twenty-two taxa (nine diatoms and thirteen dinoflagellates) were found only in the IIW. In these waters, the more abundant diatoms were Asterolampra grevillei, Bacteriastrum spp., Cerataulina pelagica, Lioloma pacificum, Nitzschia longissima, Rhizosolenia decipiens, Skeletonema costatum complex. The number of dinoflagellates was high with Alexandrium minutum complex, Gymnodinium spp., Pronoctiluca spinifera, Scrippsiella acuminata, Ornithocercus magnificus and Warnowia sp. as representative of the group.
The analysis of the diversity indices evidenced that species richness and Margalef’s and Shannon’s indices exhibited significantly higher values in TSW than in IIW (Figure 6, Table 2), (ANOVA, pd = 0.0123 and pH = 0.025, respectively). On the contrary, average taxonomic diversity and average taxonomic distinctness showed significantly higher values in IIW than in TSW (ANOVA, pΔ = 0.0219 and pΔ* = 0.0889, respectively). There were no significant differences in Pielou’s evenness among the three water masses. Moreover, no significant difference in all the considered diversity indices was detected in MMW.
3.5. Functional Patterns
The microbial metabolism was measured in terms of enzyme activity rates; these were in the magnitude order AP > GLU > LAP. Proteolytic activity values ranged from 0.71 to 2.76 nmol L−1 h−1; whereas phosphatasic activity rates were about one order of magnitude higher, being comprised between 52.03 and 378.99 nmol L−1 h−1. Glycolytic activity values ranged from 4.51 to 14.76 nmol L−1 h−1 (Table 1, Figure 7). Decreasing LAP and AP activity levels were observed from TSW towards IIW whereas, as expected, the lowest metabolic rates were recorded in the Deep Waters (DW). An abrupt decrease in GLU activity rates was also found in DW. Larger variability was observed in AP distribution patterns compared with GLU ones; LAP values were characterised by the lowest spatial variability.
Significant differences were found between TSW and IIW for LAP (ANOVA, F = 14.79, p < 0.005), and AP (ANOVA, F = 51.78, p < 0.0001), but not for GLU (ANOVA, F = 1.16, p > 0.05).
4. Discussion
4.1. Role of the Straits as a Biodiversity Mixer
The high variability of the chemical and biological data measured in the Messina Straits was affected by the complex hydrographic conditions of the study area.
The phytoplankton composition observed in this study reflected that typical of the oligotrophic Mediterranean Sea [32,64,65,66,67]. The dominance of the smallest phytoplankton size fractions (pico- and nano-sized autotrophs) was responsible for the low chlorophyll a values detected in the Straits and it has been already described in the Tyrrhenian Sea [68,69] as well as in the Ionian Sea [70,71,72,73,74] throughout the year. In addition, the prevalence of the nano-sized coccolithophore Emiliania huxleyi, which is commonly monitored in winter in the Ionian and Tyrrhenian Seas, was probably linked to the hydrographic features of these areas resembling open ocean waters [75].
However, even if our data and statistical evaluations demonstrated the dominance of the smallest component of phytoplankton in the entire study area, micro-sized diatoms and dinoflagellates allow us to distinguish different assemblages in the investigated water masses and in particular, in the TSW and IIW. Diatoms are fast-growing species typical of upwelling regions where they are favored for the higher capacity of using intermittent nutrient inputs with respect to other taxa of the same dimension [76]. However, dinoflagellates can also be detected in upwelling areas during transition periods like winter when phytoplankton biomass is low, e.g., [77]. Moreover, the presence of dinoflagellates in this period is supported by their well-known ability to tolerate the vertical velocities of upwelling, offshore, and frontal zones [78].
In the TSW, higher phytoplankton abundances in respect to the other water masses were observed, associated to low levels of nutrients, probably used for their growth. Particularly, dinoflagellates showed abundances slightly higher than in MMW and IIW. Diatoms, significantly correlated with the chla of the micro fraction (r = 0.627), were important components of the assemblages. In fact, their presence seemed to be a prelude to the bloom they sustain and which usually begins in late winter (February–March) [79], as long-term studies [80] have demonstrated.
The available non-limiting light and the nutrient-rich freshwater inputs in this period usually favor the increase in the phytoplankton biomass [80]. In the TSW, the detected taxa mainly belonged to the first stages of succession sensu Margalef [81]. There were small and medium-sized colonial diatoms and numerous dinoflagellates. The most abundant diatom was Thalassionema bacillare, which together with other colonial taxa such as many Chaetoceros species and Pseudo-nitzschia delicatissima group characterises the nearby Gulf of Naples (Southern Tyrrhenian Sea) in the same period [80]. In addition, dinoflagellates were represented by a number of taxa such as Lingulodinium polyedra, Oxytoxum mediterraneum, Pentapharsodinium tyrrhenicum, Prorocentrum micans, Scrippsiella acuminata, Tripos longipes, T. macroceros, and T. trichoceros) [81]. Finally, other taxa, originally described in the Gulf of Naples, such as the diatoms Chaetoceros throndsenii, Tenuicylindrus belgicus, and the dinoflagellates Azadinium cf. dexteroporum and Scrippsiella precaria [80] were found in the study area.
The hydrographic features of the IIW (higher temperature, salinity, and nutrient levels, as well as lower light than in the TSW) were suitable for a great number of species increasing phytoplankton diversity. These findings are in agreement with the high biodiversity of the Ionian and other Eastern Mediterranean basins despite their extreme oligotrophy [82]. Similarly to the TSW, in these waters we found many taxa of the first stages of succession [81]. Besides many diatoms, several dinoflagellates typical of winter temperate open waters, such as those belonging to the orders of Gymnodiniales, Peridiniales and, Prorocentrales [78], were present.
An interesting tool to discriminate the water masses could be the diversity measures, even if in this study their evaluation was controversial because the unidentified smallest components of phytoplankton are numerically dominant with respect to the identified taxa. In these cases, different approaches could be followed: (i) to consider only identified taxa; (ii) to include all data into higher taxonomic levels; (iii) to use all the data with different levels of identification. As already suggested in other studies, e.g., [83], we chose the third possibility, which allowed us to preserve all information on the biodiversity of the assemblages, considering diversity indices as a complementary tool in the characterization of the different water masses.
We analyzed six different diversity indices (number of species, species richness and diversity, evenness, average taxonomic diversity index, and average taxonomic distinctness index) to compare their values in the examined water masses. In our case, the main advantage of using taxonomic diversity index (Δ) and distinctness (Δ*) was related to their lower sensibility to variability in sample size, given that many of the collected samples in the study area were classified as belonging to the IIW. In addition, these indices provide a more intuitive measure of biodiversity than traditional indices because they derive not just from the species abundances but also from the taxonomic distance based on the Linnean phylogenetic tree [58].
All diversity measures were significantly different in TSW and IIW, except the evenness which showed similar values in all three water masses, including MMW. The results demonstrated that larger phytoplankton taxa were in equilibrium and dominance phenomena—like those occurring during bloom events when opportunistic species (i.e., diatoms) tend to dominate over other phytoplankton taxa—were not observed. As evenness (distribution of taxa) responds more quickly than richness (number of taxa) to variation in the environmental conditions [31], this suggests that the MMW were in a “transition phase”.
The significantly higher values of the conventional measures of diversity (number of species, species richness, and Margalef’s index) and the lower values of the taxonomic diversity (Δ) and distinctness (Δ*) indices in the TSW suggest that communities were composed of a high number of very closely-related taxa. The high environmental variability of TSW, due to an increase in nutrients and light, could favor only taxa able to tolerate such conditions. On the contrary, the lower values of the conventional measures of diversity and higher values of the taxonomic diversity (Δ) and distinctness (Δ*) indices in the IIW indicated that this water mass was dominated by species highly diverse from a phylogenetic point of view. The IIW was characterised by a high content of nutrients transported by upwelling phenomena. This feature could have favored the presence of rare species and diversification of ecological niches where phytoplankton taxa less closely related could develop.
Moreover, the analyses of our data demonstrated that MMW were not significantly different from TSW and IIW in terms of species composition as well as diversity measures, suggesting that in late winter this water mass represents a mixer of species coming from very different and diverse water masses, thus promoting diversity. Even if MMW did not show peculiar phytoplankton features, the equilibrium and distribution of taxa evidenced their capacity to cope and exploit the hydrographic perturbations of the Straits area.
In addition to phytoplankton, the prokaryotic community was investigated in this study. Different bacterial morphotypes are known to coexist in pelagic ecosystems [84,85], with a predominance of coccal-shaped bacteria [84,85,86], as in the Strait area. The reason could probably be due to a high surface-to-volume ratio [87] of the cocci-shaped bacteria, which are the morphotype most adapted to low substrate concentrations and predominate in oligotrophic conditions [86]. The Straits of Messina was characterised by a widespread occurrence of small cocci, which were dispersed in the entire study area by the continuous hydrodynamic changes and tidal mixing of Tyrrhenian and Ionian waters. Moreover, in the MMW the occurrence of upwelling waters from the deep introduces additional complexity to this water mass that could mask possible tracing of water masses using the bacterial assemblage. Generally, in upwelling ecosystems, prokaryotic assemblages show a high spatial variability suggesting the importance of oceanographic features and anthropogenic impacts in shaping bacterial community structure [88].
Like in our study, in the Ionian Sea cocci were an important component, as they accounted for 54% of the total bacterial community, reaching percentages of 71% together with coccobacilli [85]. Conversely, in the Northern Adriatic Sea rods and vibrio-like forms were the prevailing morphotypes [89].
Prokaryotic abundances depend on the relative balance between cell growth and frequency of division, which is affected by temperature as well as by nature and composition of the substrates supporting bacterial growth [90]. Small-sized morphotypes dominated in the Straits area and particularly in the TSW where a higher enzymatic activity was recorded with respect to the other water masses, as discussed below.
4.2. Organic Matter Photosynthetic Production and Microbial Decomposition Processes
Other than taxonomic diversity (as estimated by species richness), functional diversity is an important feature of the microbial community.
The specific primary production (Pb) highlighted how in the IIW higher production rates were associated with lower phytoplankton biomass (chla) mainly composed of picoplankton organisms that are better adapted to turbulent conditions [2]. Conversely, in TSW the lower average specific production was related to the presence of larger organisms (nano- and micro-sized autotrophs). The phytoplankton community in the study area showed higher production rates than the poor observations reported by other authors in a different seasonal period. The TSW and IIW systems showed rates about 10 times higher than measured in summer and winter in the Southern Tyrrhenian Sea [72] and in spring and summer in the easternmost Ionian Sea [74]. The MMW displayed a higher rate than that generally measured in this area [2]. Data available in the literature confirmed that the smallest fraction was responsible for approximately 70% of the total PP rates.
The variability of the functional diversity of the microbial assemblage was observed. In the TSW, enhanced enzyme activities were recorded for all the measured enzymes, especially for AP, showing that the heterotrophic metabolism was very active in decomposing proteinaceous and polysaccharidic polymers and especially in mineralizing organic phosphates into PO4. The high AP activity rates suggested that this enzyme provided a source of carbon other than phosphorus, confirming its dual role in the cycles of both elements [53,54]. Enzyme activity rates measured in the Straits were 1–2 magnitude orders higher than AP levels recorded in the Tyrrhenian Sea in the same seasonal period and 1 magnitude lower for LAP [8,91]. Conversely, in the IIW an abrupt decrease in all the assayed enzymes suggests that the microbial metabolism was limited. Although our values were similar to those measured for LAP [92], they exceeded by 1–2 magnitude orders those previously reported in other Ionian areas for AP [19,92,93] and by 3 or 4 times those of GLU [94].
Intermediate levels of microbial activity characterised the MMW, thus confirming that water mixing between two adjacent basins even drove microbial metabolism.
In the DW the enzymatic activity rates decreased significantly, highlighting that the organic polymers were mostly decomposed at surface layers and no organic inputs were provided through lateral advection, as observed in other Mediterranean ecosystems [93,95,96].
A comparative view of the bacterial morphotypes and their metabolic activities for each water mass was provided by SIMPER analysis (Figure 8). In all the water masses GLU predominated compared with LAP; however, in MMW and IIW, substrates of polysaccharidic nature were preferentially decomposed, in contrast with TSW where proteinaceous polymers were actively hydrolysed. Moreover, in the DW the high percentage contribution of LAP and AP to total variability agreed with the relevant role played by microbial decomposition and remineralization processes in deep environments [93].
4.3. Links between Autotrophic and Heterotrophic Microbial Processes
The processes of primary production (PP) and organic matter hydrolysis (LAP + GLU) were compared in this context to evaluate the reciprocal role of the auto- and heterotrophic members of the microbial community within the overall ecosystem functioning.
Figure 9 shows that in IIW the hydrolysis process tends to remain unchanged even at high PP rates, highlighting the uncoupling of these two processes. This behavior indicates that during the sampling period the organic matter was being synthesized, whereas hydrolysis occurred on the organic matter already available in the waters. A different condition was observed in TSW where, as photosynthetic activity increased, the hydrolysis process tended to decrease, indicating an inverse relationship between the two processes. A possible explanation for these different conditions relies on the seasonal lag between the two ecosystems: in the IIW late winter stability was a still present condition, whereas in the TSW the spring phase had already started, supported by an increasing abundance of larger phytoplankton.
The rates of PP and hydrolysis by LAP + GLU measured by the same authors in late spring in the Southern Adriatic Sea [16] and in early spring from the Western and Eastern Mediterranean Sea [97] are used to compare the two functional processes estimated in the Straits of Messina with other Mediterranean areas. As observed in the IIW, in general the two processes appeared to be uncoupled although both act at higher levels due to different considered seasonality and trophic conditions.
5. Conclusions
The results obtained during this study demonstrated that the hydrographic features of a complex and highly dynamic area like the Straits of Messina affected microbial taxonomic and function diversity. Moreover, the integrated evaluation of the quali-quantitative characteristics of total picoplankton and phytoplankton allowed us to discriminate different water masses that identified interconnected sub-systems independently of their geographical location.
The common feature observed in the entire study area was high phytoplankton productivity and biodiversity. However, noticeable differences were evidenced from the analyses of the microbial communities living in the waters of the two basins (Tyrrhenian and Ionian) connected by the Straits. The former basin hosted a productive and metabolically active microbial community composed by many phytoplankton species which seemed to anticipate the spring bloom. On the other hand, the nutrient-rich Ionian waters indicated a typical Mediterranean winter condition, characterised by low metabolic activities and by an autotrophic assemblage consisting of species rather distant from a phylogenetic point of view.
The intermediate levels of diversity and metabolism found in the Straits depicted this ecosystem as an exchange region where the microbial community was not significantly different from that observed in the adjacent basins displaying contrasting patterns. In addition, the different trends of productive to hydrolytic processes observed in the Tyrrhenian and Ionian waters suggest that the microbial function reflected the differences observed in the community composition.
The Straits of Messina therefore held a crucial role as an intermediate area between two sub-basins, also shaping a water mass structure that did not strictly reflect the geographic position: in other words, it favoured the invasion of the Southern Tyrrhenian sub-domain by Ionian waters and the consequent spill-over of species, whereas the southward outflow of nutrient-rich MMW remained confined in the narrow Ionian shelf.
Finally, this study confirms the responsiveness of the microbial community composition and functions to changing environmental scenarios in this upwelling system as well as in similar environments.
Supplementary Materials
The following supporting information can be downloaded at: https://www.mdpi.com/article/10.3390/w14132057/s1, Table S1: Information on the sampling stations during the SAMCA IV cruise; Table S2. Phytoplankton: List of species/taxa found in the Messina Straits area, with particular reference to the TSW (Tyrrhenian Surface Waters), Messina Mixed Waters (MMW), and IIW (Ionian Intermediate Waters).
Author Contributions
Conceptualization, C.C., F.D. and A.B.; methodology, all the authors.; software, C.C., A.B. and G.C.; validation, all the authors; formal analysis, F.A., C.C. and A.B.; investigation, C.C., F.D. and G.C.; resources, F.D.; data curation, all the authors.; writing—original draft preparation, all the authors; writing—review and editing, all the authors; visualization, A.B.; supervision, C.C. All authors have read and agreed to the published version of the manuscript.
Funding
This study is based on original data collected during the Programme Cluster10-SAM (2000–2005) and elaborated within the Project Sustainable Fishery DSS (2011–2016) both funded by the Italian Ministry of Research.
Institutional Review Board Statement
Not applicable.
Informed Consent Statement
Not applicable.
Data Availability Statement
Data are contained within the article and supplementary material.
Acknowledgments
The authors are grateful to the Captain Emanuele Gentile, crew and technicians of the R/V Urania for the excellent support onboard, and to all the colleagues who participated in the cruise and helped with the collection of samples. Special thanks are due to Alessandro Cosenza (CNR-ISP) for supporting data processing with his technical expertise.
Conflicts of Interest
The authors declare no conflict of interest. The funders had no role in the design of the study; in the collection, analyses, or interpretation of data; in the writing of the manuscript, or in the decision to publish the results.
References
- Magazzù, M.; Aubert, M.; Decembrini, F. The effect of tidal movements on planktonic transfer through the Straits of Messina. In The Strait of Messina Ecosystem; Guglielmo, L., Manganaro, A., De Domenico, E., Eds.; Università degli Studi: Messina, Italy, 1995; pp. 191–202. [Google Scholar]
- Magazzù, G.; Decembrini, F. Primary production, biomass and abundance of phototrophic picoplankton in the Mediterranean Sea: A review. Aquat. Microb. Ecol. 1995, 9, 97–104. [Google Scholar] [CrossRef] [Green Version]
- Cescon, B.; Azzaro, F.; Creazzo, S.; Decembrini, F.; Magazzù, G. Processes affecting upwelling and primary productivity of the Straits of Messina. Boll. Geofisica Teor. Appl. 1997, 38, 137–147. [Google Scholar]
- Azzaro, F.; Decembrini, F.; Crisafi, E. Continuous survey of upwelling in the Straits of Messina. Rapp. Comm. Int. Mer Médit. 1995, 34, 167. [Google Scholar]
- Decembrini, F.; Azzaro, F.; Paschini, E.; Magazzù, G. Influence of upwelling phenomena on the phytoplankton production and biomass in the Straits of Messina. In Proceedings of the XII Congress of the Italian Society of Oceanology and Limnology, Isola di Vulcano, 18–21 September 1996, Italy; Picazzo, M., Ed.; Italian Society of Oceanology and Limnology: Genova, Italy, 1998; Volume II, pp. 159–171. Available online: http://www.aiol.info/wp-content/uploads/ATTI_12.2_CONGRESSO_AIOL_1_2.pdf (accessed on 26 March 2022).
- Decembrini, F.; Azzaro, F.; Leonardi, M. Short- and long-term variability of the hydrological characteristics in the coastal waters of a system under high hydrodynamism (Straits of Messina). In Proceedings of the XIII Congress of the Italian Society of Oceanology and Limnology, Portonovo, 28–30 September 1998, Ancona, Italy; Picazzo, M., Ed.; Italian Society of Oceanology and Limnology: Genova, Italy, 1999; Volume 3, pp. 151–158. Available online: http://www.aiol.info/wp-content/uploads/ATTI_13.1_CONGRESSO_AIOL.pdf (accessed on 26 March 2022).
- Azzaro, F.; Decembrini, F.; Raffa, F.; Crisafi, E. Seasonal variability of phytoplankton fluorescence in relation to the Straits of Messina (Sicily) tidal upwelling. Ocean Sci. 2007, 3, 451–460. [Google Scholar] [CrossRef] [Green Version]
- Caruso, G.; Azzaro, F.; La Ferla, R.; De Pasquale, F.; Raffa, F.; Decembrini, F. Microbial enzymatic activities and prokaryotic abundance in the upwelling system of the Straits of Messina (Sicily): Distribution, dynamics and biogeochemical considerations. Adv. Oceanogr. Limnol. 2013, 4, 43–69. [Google Scholar] [CrossRef]
- Azam, F. Microbial control of oceanic carbon flux: The plot thickens. Science 1998, 280, 694–696. [Google Scholar] [CrossRef] [Green Version]
- Cotner, J.; Biddanda, B. Small Players, Large Role: Microbial Influence on Biogeochemical Processes in Pelagic Aquatic Ecosystems. Ecosystems 2002, 5, 105–121. [Google Scholar] [CrossRef]
- Liu, J.; Meng, Z.; Liu, X.; Zhang, X.-H. Microbial assembly, interaction, functioning, activity and diversification: A review derived from community compositional data. Mar. Life Sci. Technol. 2019, 1, 112–128. [Google Scholar] [CrossRef] [Green Version]
- Mapelli, F.; Varela, M.M.; Barbato, M.; Alvariño, R.; Fusi, M.; Álvarez, M.; Merlino, G.; Daffonchio, D.; Borin, S. Biogeography of planktonic bacterial communities across the whole Mediterranean Sea. Ocean Sci. 2013, 9, 585–595. [Google Scholar] [CrossRef] [Green Version]
- Caroppo, C.; Buttino, I.; Camatti, E.; Caruso, G.; De Angelis, R.; Facca, C.; Giovanardi, F.; Lazzara, L.; Mangoni, O.; Magaletti, E. State of the art and perspectives on the use of planktonic communities as indicators of environmental status in relation to the EU Marine Strategy Framework Directive. Biol. Mar. Mediterr. 2013, 20, 65–73. [Google Scholar] [CrossRef]
- Caruso, G.; La Ferla, R.; Azzaro, M.; Zoppini, A.; Marino, G.; Petochi, T.; Corinaldesi, C.; Leonardi, M.; Zaccone, R.; Fonda-Umani, S.; et al. Microbial assemblages for environmental quality assessment: Knowledge, gaps and usefulness in the European Marine Strategy Framework Directive. Crit. Rev. Microbiol. 2016, 42, 883–904. [Google Scholar] [CrossRef] [PubMed]
- Caruso, G.; Azzaro, M.; Caroppo, C.; Decembrini, F.; Monticelli, L.S.; Leonardi, M.; Maimone, G.; Zaccone, R.; La Ferla, R. Microbial community and its potential as descriptor of environmental status. ICES J. Mar. Sci. 2016, 73, 2174–2177. [Google Scholar] [CrossRef] [Green Version]
- Decembrini, F.; Caroppo, C.; Caruso, G.; Bergamasco, A. Linking Microbial Functioning and Trophic Pathways to Ecological Status in a Coastal Mediterranean Ecosystem. Water 2021, 13, 1325. [Google Scholar] [CrossRef]
- Hoppe, H.G.; Arnosti, C.; Herndl, G. Ecological significance of bacterial enzymes in the marine environment. In Enzymes in the Environment, Activity, Ecology and Applications; Burns, R.G., Dick, R.P., Eds.; Marcel Dekker: New York, NY, USA, 2002; pp. 73–107. [Google Scholar]
- Cunha, A.; Almeida, A.; Coelho, F.J.R.C.; Gomes, N.C.M.; Oliveira, V.; Santos, A.L. Bacterial extracellular enzymatic activity in globally changing aquatic ecosystems. In Current Research, Technology and Education Topics in Applied Microbiology and Microbial Biotechnology; Microbiology Book Series No. 2; Méndez-Vila, A., Ed.; Formatex Research Center: Badajoz, Spain, 2010; pp. 124–135. [Google Scholar]
- Caruso, G.; Giacobbe, M.G.; Azzaro, F.; Decembrini, F.; Leonardi, M.; Miserocchi, S.; Cao, X.; Song, C.; Zhou, Y. All-In-One: Microbial Response to Natural and Anthropogenic Forcings in a Coastal Mediterranean Ecosystem, the Syracuse Bay (Ionian Sea, Italy). J. Mar. Sci. Eng. 2022, 10, 19. [Google Scholar] [CrossRef]
- Young, K.D. The selective value of bacterial shape. Microbiol. Mol. Biol. Rev. 2006, 70, 660–703. [Google Scholar] [CrossRef] [PubMed] [Green Version]
- Cottrel, M.T.; Kirchman, D.L. Single-cell analysis of bacterial growth, cell size, and community structure in the Delaware estuary. Aquat. Microb. Ecol. 2004, 34, 139–149. [Google Scholar] [CrossRef] [Green Version]
- Pernthaler, J.; Amann, R. Fate of heterotrophic microbes in pelagic habitats: Focus on populations. Microbiol. Mol. Biol. Rev. 2005, 6, 440–461. [Google Scholar] [CrossRef] [Green Version]
- Racy, F.; Godinho, M.J.L.; Regali-Seleghim, M.H.; Bossolan, N.R.S.; Ferrari, A.C.; Lucca, J.V. Assessment of the applicability of morphological and size diversity indices to bacterial populations of reservoir in different trophic states. Acta Limnol. Bras. 2005, 17, 395–408. [Google Scholar]
- La Ferla, R.; Maimone, G.; Caruso, G.; Azzaro, F.; Azzaro, M.; Decembrini, F.; Cosenza, A.; Leonardi, M.; Paranhos, R. Are prokaryotic cell shape and size suitable to ecosystem characterization? Hydrobiologia 2014, 726, 65–80. [Google Scholar] [CrossRef]
- Falkowski, P.G.; Katz, M.E.; Knoll, A.H.; Quigg, A.; Raven, J.A.; Schofield, O.; Taylor, F.J.R. The evolution of modern eukaryotic phytoplankton. Science 2004, 305, 354–360. [Google Scholar] [CrossRef] [Green Version]
- Finkel, Z.V.; Beardall, J.; Flynn, K.J.; Quigg, A.; Rees, T.A.V.; Raven, J.A. Phytoplankton in a changing world: Cell size and elemental stoichiometry. J. Plankton Res. 2010, 32, 119–137. [Google Scholar] [CrossRef] [Green Version]
- Decembrini, F.; Bergamasco, A.; Mangoni, O. Seasonal characteristics of size-fractionated phytoplankton community and fate of photosynthesized carbon in a sub-Antarctic area (Straits of Magellan). J. Mar. Syst. 2014, 136, 31–41. [Google Scholar] [CrossRef]
- de Vargas, C.; Audic, S.; Henry, N.; Decelle, J.; Mahé, F.; Logares, R.; Lara, E.; Berney, C.; Le Bescot, N.; Probert, I.; et al. Eukaryotic plankton diversity in the sunlit ocean. Science 2015, 348, 1261605. [Google Scholar] [CrossRef] [PubMed] [Green Version]
- Worm, B.; Barbier, E.B.; Beaumont, N.; Duffy, J.E.; Folke, C.; Halpern, B.S.; Jackson, J.B.C.; Lotze, H.K.; Micheli, F.; Palumbi, S.R.; et al. Impacts of biodiversity loss on ocean ecosystem services. Science 2006, 314, 787–790. [Google Scholar] [CrossRef] [Green Version]
- Naeem, S. Ecological consequences of declining biodiversity: A biodiversity-ecosystem function (BEF) framework for marine systems. In Marine Biodiversity and Ecosystem Functioning: Frameworks, Methodologies, and Integration; Solan, M., Aspden, R.J., Paterson, D.M., Eds.; Oxford University Press: Oxford, UK, 2012; pp. 34–51. [Google Scholar]
- Otero, J.; Álvarez-Salgado, X.A.; Bode, A. Phytoplankton Diversity Effect on Ecosystem Functioning in a Coastal Upwelling System. Front. Mar. Sci. 2020, 7, 592255. [Google Scholar] [CrossRef]
- Latasa, M.; Scharek, R.; Vidal, M.; Vila-Reixach, G.; Gutiérrez-Rodríguez, A.; Emelianov, M.; Gasol, J.M. Preferences of phytoplankton groups for waters of different trophic status in the northwestern Mediterranean Sea. Mar. Ecol. Progr. Ser. 2010, 407, 27–42. [Google Scholar] [CrossRef]
- Domingues, R.B.; Barbosa, A.; Galvao, H. Constraints on the Use of Phytoplankton as a Biological Quality Element within the Water Framework Directive in Portoguese Waters. Mar. Pollut. Bull. 2008, 56, 1389–1395. [Google Scholar] [CrossRef]
- Pachés, M.; Romero, I.; Hermosilla, Z.; Martinez-Guijarro, R. PHYMED: An Ecological Classification System for the Water Framework Directive Based on Phytoplankton Community Composition. Ecol. Indic. 2012, 19, 15–23. [Google Scholar] [CrossRef]
- Margalef, R. Turbulence and marine life. Sci. Mar. 1997, 61, 109–123. [Google Scholar]
- Largier, J.L. Upwelling bays: How coastal upwelling controls circulation, habitat, and productivity in bays. Ann. Rev. Mar. Sci. 2020, 12, 20.1–20.33. [Google Scholar] [CrossRef]
- Mayali, X. Editorial: Metabolic Interactions between Bacteria and Phytoplankton. Front. Microbiol. 2018, 9, 727. [Google Scholar] [CrossRef] [PubMed]
- Azam, F.; Malfatti, F. Microbial structuring of marine ecosystems. Nat. Rev. Microbiol. 2007, 5, 782–791. [Google Scholar] [CrossRef] [PubMed]
- Hopkins, T.S. Recent observations on the intermediate and deep-water circulation in the Southern Tyrrhenian Sea. Oceanol. Acta 1988, 9, 41–50. [Google Scholar]
- Bergamasco, A.; Crisafi, E.; Decembrini, F.; Messina, E.; Tamiro, E.; Giunta, G. A Laboratory for the Observation of a Highly-Energetic Coastal Marine System: The Straits of Messina. In Coastal and Marine Spatial Planning. Marine Research at CNR; Brugnoli, E., Cavarretta, G., Mazzola, S., Trincardi, F., Ravaioli, M., Santoleri, R., Eds.; National Research Council: Rome, Italy, 2011; Volume DTA/06-2011, pp. 2185–2202. Available online: https://dta.cnr.it/dta-06-2011-marine-research-at-cnr/ (accessed on 26 March 2022).
- Cucco, A.; Quattrocchi, G.; Olita, A.; Fazioli, L.; Ribotti, A.; Sinerchia, M.; Tedesco, C.; Sorgente, R. Hydrodynamic modelling of coastal seas: The role of tidal dynamics in the Messina Strait, Western Mediterranean Sea. Nat. Hazards Earth Syst. Sci. 2016, 16, 1553–1569. [Google Scholar] [CrossRef] [Green Version]
- Decembrini, F.; Hopkins, T.S.; Azzaro, F. Variability and sustenance of the deep-chlorophyll maximum over a narrow shelf, Augusta gulf (Sicily). Chem. Ecol. 2004, 20, S231–S247. [Google Scholar] [CrossRef]
- Battaglia, P.; Pagano, L.; Consoli, P.; Esposito, V.; Granata, A.; Guglielmo, L.; Pedà, C.; Romeo, T.; Zagami, G.; Vicchio, T.M.; et al. Consumption of mesopelagic prey in the strait of Messina, an upwelling area of the Central Mediterranean Sea: Feeding behaviour of the blue jack mackerel Trachurus picturatus (Bowdich, 1825). Deep-Sea Res. I Oceanogr. Res. Pap. 2020, 155, 103158. [Google Scholar] [CrossRef]
- Azzaro, F.; Cavalli, R.M.; Decembrini, F.; Pignatti, S.; Santella, C. Biochemical and dynamical characteristics of the Messina Straits water by means of hyperspectral data. Hyperspectral Remote Sens. Ocean. 2001, 4154, 240–249. [Google Scholar] [CrossRef]
- Aminot, A.; Chaussepied, M. Manuel des Analyses Chimiques en Milieu Marin; Centre National pour l’Exploitation des Océans: Brest, France, 1983; pp. 1–395. [Google Scholar]
- Strickland, J.D.H.; Parsons, T.R. A Practical Handbook of Seawater Analysis, 2nd ed.; Fisheries Research Board of Canada Bulletin 157; Minister of Supply and Services Canada: Ottawa, ON, Canada, 1972; pp. 1–310. [Google Scholar]
- Steeman-Nielsen, E. The use of radioactive carbon (14C) for measuring organic production in the sea. J. Cons. Int. Explor. Mer 1952, 18, 117–140. [Google Scholar] [CrossRef]
- Porter, K.G.; Feig, Y.S. The use of DAPI for identifying and counting aquatic microflora. Limnol. Oceanogr. 1980, 25, 943–948. [Google Scholar] [CrossRef]
- Edler, L.; Elbrächter, M. The Utermöhl method for quantitative phytoplankton analysis. In Microscopic and Molecular Methods for Quantitative Phytoplankton Analysis; Karlson, B., Cusack, C., Bresnan, E., Eds.; UNESCO IOC Manuals and Guides n. 55; UNESCO: Paris, France, 2010; pp. 13–20. [Google Scholar]
- Andersen, P.; Throndsen, J. Estimating cell numbers. In Manual on Harmful Marine Microalgae; Hallegraeff, G.M., Anderson, D.M., Cembella, A.D., Eds.; UNESCO: Paris, France, 2004; pp. 99–129. [Google Scholar]
- Zingone, A.; Totti, C.; Sarno, D.; Cabrini, M.; Caroppo, C.; Giacobbe, M.G.; Lugliè, A.; Nuccio, C.; Socal, G. Fitoplancton: Metodiche di analisi quali-quantitativa. In Metodologie di Studio del Plancton Marino; Socal, G., Buttino, I., Cabrini, M., Mangoni, O., Penna, A., Totti, C., Eds.; Manuali e Linee Guida ISPRA SIBM: Rome, Italy, 2010; pp. 213–237. ISBN 978-88-448-0427-5. [Google Scholar]
- Hoppe, H.-G. Use of fluorogenic model substrates for extracellular enzyme activity (EEA) measurement of bacteria. In Handbook of Methods in Aquatic Microbial Ecology; Kemp, P.F., Sherr, B.F., Sherr, E.B., Cole, J.J., Eds.; Lewis Publisher: Boca Raton, FL, USA, 1993; pp. 423–432. [Google Scholar]
- Hoppe, H.-G. Phosphatase activity in the sea. Hydrobiologia 2003, 493, 187–200. [Google Scholar] [CrossRef]
- Monticelli, L.S.; Caruso, G.; Decembrini, F.; Caroppo, C.; Fiesoletti, F. Role of prokaryotic biomasses and activities in Carbon and Phosphorus cycles at a coastal, thermohaline front and in offshore waters (Gulf of Manfredonia, Southern Adriatic Sea). Microb. Ecol. 2014, 67, 501–519. [Google Scholar] [CrossRef] [PubMed]
- Schlitzer, R. Ocean Data View. 2001. Available online: https://odv.awi.de/software/download/ (accessed on 26 March 2022).
- Hammer, Ø.; Harper, D.A.T.; Ryan, P.D. PAST: Paleontological Statistics Software package for education and data analysis. Paleontol. Electronica 2001, 4, 1–9. [Google Scholar]
- Bier, R.L.; Bernhardt, E.S.; Boot, C.M.; Graham, E.B.; Hall, E.K.; Lennon, J.T.; Nemergut, D.R.; Osborne, B.B.; Ruiz-González, C.; Schimel, J.P.; et al. Linking microbial community structure and microbial processes: An empirical and conceptual overview. FEMS Microbiol. Ecol. 2015, 91, fiv113. [Google Scholar] [CrossRef] [PubMed]
- Clarke, K.R.; Gorley, R.N.; Somerfield, P.J.; Warwick, R.M. Change in Marine Communities: An Approach to Statistical Analysis and Interpretation, 3rd ed.; PRIMER-E Ltd.: Plymouth, UK, 2014. [Google Scholar]
- Margalef, R. Ecología; Omega: Barcelona, Spain, 1977; pp. 1–951. [Google Scholar]
- Ludwig, J.A.; Reynolds, J.F. Statistical Ecology: A Primer on Methods and Computing; Wiley: New York, NY, USA, 1988; pp. 85–106. [Google Scholar]
- Pielou, E.C. Ecological Diversity; John Wiley & Sons: New York, NY, USA, 1975. [Google Scholar]
- Clarke, K.R.; Warwick, R.M. A taxonomic distinctness index and its statistical properties. J. Appl. Ecol. 1998, 35, 523–531. [Google Scholar] [CrossRef]
- Clarke, K.R.; Warwick, R.M. The taxonomic distinctness measure of biodiversity: Weighting of step lengths between hierarchical levels. Mar. Ecol. Prog. Ser. 1999, 184, 21–29. [Google Scholar] [CrossRef]
- Siokou-Frangou, I.; Christaki, U.; Mazzocchi, M.G.; Montresor, M.; Ribera d’Alcalá, M.; Vaqué, D.; Zingone, A. Plankton in the open Mediterranean Sea: A review. Biogeosciences 2010, 7, 1543–1586. [Google Scholar] [CrossRef] [Green Version]
- Caroppo, C.; Turicchia, S.; Margheri, M.C. Phytoplankton assemblages in coastal waters of the Northern Ionian Sea (eastern Mediterranean), with special reference to cyanobacteria. J. Mar. Biol. Assoc. UK 2006, 86, 927–937. [Google Scholar] [CrossRef]
- Caroppo, C.; Musco, L.; Stabili, L. Planktonic Assemblages in a Coastal Mediterranean Area Subjected to Anthropogenic Pressure. J. Geogr. Nat. Disasters 2014, 4, 121. [Google Scholar] [CrossRef] [Green Version]
- Mena, C.; Reglero, P.; Hidalgo, M.; Sintes, E.; Santiago, R.; Martín, M.; Moyà, G.; Balbín, R. Phytoplankton Community Structure Is Driven by Stratification in the Oligotrophic Mediterranean Sea. Front. Microbiol. 2019, 10, 1698. [Google Scholar] [CrossRef] [Green Version]
- Vidussi, F.; Marty, J.C.; Chiavérini, J. Phytoplankton pigment variations during the transition from spring bloom to oligotrophy in the northwestern Mediterranean sea. Deep-Sea Res. I Oceanogr. Res. Pap. 2000, 47, 423–445. [Google Scholar] [CrossRef]
- Marty, J.C.; Chiavérini, J.; Pizay, M.D.; Avril, B. Seasonal and interannual dynamics of nutrients and phytoplankton pigments in the western Mediterranean Sea at the DYFAMED time-series station (1991–1999). Deep-Sea Res. II Top. Stud. Oceanogr. 2002, 49, 1965–1985. [Google Scholar] [CrossRef]
- Brunet, C.; Casotti, R.; Vantrepotte, V.; Corato, F.; Conversano, F. Picophytoplankton diversity and photoacclimation in the Strait of Sicily (Mediterranean Sea) in summer. I. Mesoscale variations. Aquat. Microb. Ecol. 2006, 44, 127–141. [Google Scholar] [CrossRef]
- Casotti, R.; Landolfi, A.; Brunet, C.; D’Ortenzio, F.; Mangoni, O.; Ribera d’Alcalà, M. Composition and dynamics of the phytoplankton of the Ionian Sea (Eastern Mediterranean). J. Geophy. Res. 2003, 108, 1–17. [Google Scholar] [CrossRef]
- Decembrini, F.; Caroppo, C.; Azzaro, M. Size structure and production of phytoplankton community and carbon pathways channelling in the southern Tyrrhenian sea (Western Mediterranean). Deep-Sea Res. II Top. Stud. Oceanogr. 2009, 56, 687–699. [Google Scholar] [CrossRef]
- Karuza, A.; Caroppo, C.; Camatti, E.; Di Poi, E.; Monti, M.; Stabili, L.; Auriemma, R.; Pansera, M.; Cibic, T.; Del Negro, P. ‘End to end’ planktonic trophic web and its implications for the mussel farms in the Mar Piccolo of Taranto (Ionian Sea, Italy). Environ. Sci. Pollut. Res. 2016, 23, 12707–12724. [Google Scholar] [CrossRef] [PubMed]
- Varkitzi, I.; Psarra, S.; Assimakopoulou, G.; Pavlidou, A.; Krasakopoulou, E.; Velaoras, D.; Papathanassiou, E.; Pagou, K. Phytoplankton dynamics and bloom formation in the oligotrophic Eastern Mediterranean: Field studies in the Aegean, Levantine and Ionian seas. Deep-Sea Res. II Top. Stud. Oceanogr. 2020, 171, 104662. [Google Scholar] [CrossRef]
- Bonomo, S.; Placenti, F.; Quinci, E.M.; Cuttitta, A.; Genovese, S.; Mazzola, S.; Bonanno, A. Living coccolithophores community from Southern Tyrrhenian Sea (Central Mediterranean—Summer 2009). Mar. Micropaleontol. 2017, 131, 10–24. [Google Scholar] [CrossRef]
- Marañón, E. Cell size as a key determinant of phytoplankton metabolism and community structure. Ann. Rev. Mar. Sci. 2015, 7, 241–264. [Google Scholar] [CrossRef] [Green Version]
- Bode, A.; Álvarez-Ossorio, M.T.; Barquero, S.; Lorenzo, J.; Louro, A.; Varela, M. Seasonal variations in upwelling and in the grazing impact of copepods on phytoplankton off A Coruña (Galicia, NW Spain). J. Exp. Mar. Biol. Ecol. 2003, 297, 85–105. [Google Scholar] [CrossRef]
- Smayda, T.S. Turbulence, watermass stratification and harmful algal blooms: An alternative view and frontal zones as “pelagic seed banks”. Harmful Algae 2002, 1, 95–112. [Google Scholar] [CrossRef]
- Martellucci, R.; Salon, S.; Cossarini, G.; Piermattei, V.; Marcelli, M. Coastal phytoplankton bloom dynamics in the Tyrrhenian Sea: Advantage of integrating in situ observations, large-scale analysis and forecast systems. J. Mar. Syst. 2021, 218, 103528. [Google Scholar] [CrossRef]
- Zingone, A.; D’Alelio, D.; Mazzocchi, M.G.; Montresor, M.; Sarno, D.; LTER-MC team. Time series and beyond: Multifaceted plankton research at a marine Mediterranean LTER site. Nat. Conserv. 2019, 34, 273–310. [Google Scholar] [CrossRef] [Green Version]
- Margalef, R. The food web in the pelagic environment. Helgol. Wiss. Meer. 1967, 15, 548–559. [Google Scholar] [CrossRef] [Green Version]
- Bianchi, C.N.; Morri, C. Marine biodiversity of the Mediterranean Sea: Situation, problems and prospects for future research. Mar. Pollut. Bull. 2000, 40, 367–376. [Google Scholar] [CrossRef]
- Antacli, J.C.; Silva, R.I.; Jaureguizar, A.J.; Hernández, D.R.; Mendiolar, M.; Sabatini, M.E.; Akselman, R. Phytoplankton and protozooplankton on the southern Patagonian shelf (Argentina, 47°–55° S) in late summer: Potentially toxic species and community assemblage structure linked to environmental features. J. Sea Res. 2018, 140, 63–80. [Google Scholar] [CrossRef]
- Robarts, R.D.; Zohary, T.; Waiser, M.J.; Yacobi, Y.Z. Bacterial abundance, biomass, and production in relation to phytoplankton biomass in the Levantine Basin of the southeastern Mediterranean Sea. Mar. Ecol. Prog. Ser. 1996, 137, 273–281. [Google Scholar] [CrossRef]
- Acinas, S.G.; Antón, J.; Rodgríguez-Valera, F. Diversity of free-living and attached bacteria in offshore western Mediterranean waters as depicted by analysis of genes encoding 16S rRNA. Appl. Environ. Microbiol. 1999, 65, 514–522. [Google Scholar] [CrossRef] [Green Version]
- La Ferla, R.; Lo Giudice, A.; Maimone, G. Morphology and LPS content for the estimation of marine bacterioplankton biomass in the Ionian Sea. Sci. Mar. 2004, 68, 23–31. [Google Scholar] [CrossRef] [Green Version]
- Jochem, F.J. Morphology and DNA content of bacterioplankton in the northern Gulf of Mexico: Analysis by epifluorescence microscopy and flow cytometry. Aquat. Microb. Ecol. 2001, 25, 179–194. [Google Scholar] [CrossRef]
- Coelho-Souza, S.A.; Araújo, F.V.; Cury, J.C.; Jesus, H.E.; Pereira, G.C.; Guimarães, J.R.D.; Peixoto, R.S.; Dávila, A.M.R.; Rosado, A.S. Bacterial and Archaeal Communities Variability Associated with Upwelling and Anthropogenic Pressures in the Protection Area of Arraial do Cabo (Cabo Frio region-RJ). An. Acad. Bras. Ciênc. 2015, 87, 1737–1750. [Google Scholar] [CrossRef]
- La Ferla, R.; Leonardi, M. Ecological implications of biomass and morphotype variations of bacterioplankton: An example in a coastal zone of the Northern Adriatic Sea (Mediterranean). Mar. Ecol. 2005, 26, 82–88. [Google Scholar] [CrossRef]
- Gasol, J.M.; Del Giorgio, P.A.; Massana, R.; Duarte, C.M. Active versus inactive bacteria: Size-dependence in a coastal marine plankton community. Mar. Ecol. Prog. Ser. 1995, 128, 91–97. [Google Scholar] [CrossRef] [Green Version]
- Tamburini, C.; Garel, M.; Ali, B.A.; Mérigot, B.; Kriwy, P. Distribution and activity of Bacteria and Archea in the different water masses of the Tyrrhenian Sea. Deep-Sea Res. II Top. Stud. Oceanogr. 2009, 56, 700–712. [Google Scholar] [CrossRef]
- La Ferla, R.; Azzaro, M.; Caruso, G.; Monticelli, L.S.; Maimone, G.; Zaccone, R.; Packard, T.T. Prokaryotic abundance and heterotrophic metabolism in the deep Mediterranean Sea. Adv. Oceanogr. Limnol. 2010, 1, 143–166. [Google Scholar] [CrossRef]
- Placenti, F.; Azzaro, M.; Artale, V.; La Ferla, R.; Caruso, G.; Santinelli, C.; Maimone, G.; Monticelli, L.; Quinci, E.M.; Sprovieri, M. Biogeochemical patterns and microbial processes in the Eastern Mediterranean Deep Water of Ionian Sea. Hydrobiologia 2018, 815, 97–112. [Google Scholar] [CrossRef]
- Zaccone, R.; Caruso, G.; Azzaro, M.; Azzaro, F.; Crisafi, E.; Decembrini, F.; De Domenico, E.; De Domenico, M.; La Ferla, R.; Leonardi, M.; et al. Prokaryotic activities and abundance in pelagic areas of the Ionian Sea. Chem. Ecol. 2010, 26 (Suppl. S1), 169–197. [Google Scholar] [CrossRef]
- Azzaro, M.; La Ferla, R.; Maimone, G.; Monticelli, L.S.; Zaccone, R.; Civitarese, G. Prokaryotic dynamics and heterotrophic metabolism in a deep convection site of Eastern Mediterranean Sea (the Southern Adriatic Pit). Cont. Shelf Res. 2012, 44, 106–118. [Google Scholar] [CrossRef]
- Zaccone, R.; Caruso, G. Microbial enzymes in the Mediterranean Sea: Relationship with climate changes. AIMS Microbiol. 2019, 5, 251–271. [Google Scholar] [CrossRef]
- Luna, G.M.; Bianchelli, S.; Decembrini, F.; De Domenico, E.; Danovaro, R.; Dell’Anno, A. The dark portion of the Mediterranean Sea is a bioreactor of organic matter cycling. Glob. Biogeochem. Cycles 2012, 26, GB2017. [Google Scholar] [CrossRef] [Green Version]
Figure 1.
Map of the Straits of Messina area and position of the sampling stations where chemical, bio-chemical, and biological variables were determined.
Figure 1.
Map of the Straits of Messina area and position of the sampling stations where chemical, bio-chemical, and biological variables were determined.

Figure 2.
Physical–chemical variables: (a) T/S diagram of the CTD casts in the study area with indication of the sample position of chemical, bio-chemical and biological parameters in the water masses: TSW (blue), MMW (green), IIW (red), and DW (orange); (b) vertical profiles along the transect Ganzirri–P.ta Pezzo (see Figure 1) of water density (sigma-0) and chlorophyll a (by fluorescence probe).

Figure 3.
Box plots of the total chlorophyll a concentration (a) and ratio with phaeopigments (b); primary production rates (c) and specific production Pb (d) in the TSW (Tyrrhenian Surface Waters), MMW (Messina Mixed Waters), and IIW (Ionian Intermediate Waters).
Figure 3.
Box plots of the total chlorophyll a concentration (a) and ratio with phaeopigments (b); primary production rates (c) and specific production Pb (d) in the TSW (Tyrrhenian Surface Waters), MMW (Messina Mixed Waters), and IIW (Ionian Intermediate Waters).

Figure 4.
Total Picoplankton (PPT) in the four water masses (TSW, Tyrrhenian Surface Waters; MMW, Messina Mixed Waters; IIW, Ionian Intermediate Waters; DW, Deep Waters): (a) Box plots of the abundance values; (b) percentages of the eight morphotypes. C = cocci, r = rods.
Figure 4.
Total Picoplankton (PPT) in the four water masses (TSW, Tyrrhenian Surface Waters; MMW, Messina Mixed Waters; IIW, Ionian Intermediate Waters; DW, Deep Waters): (a) Box plots of the abundance values; (b) percentages of the eight morphotypes. C = cocci, r = rods.

Figure 5.
Box plots of the phytoplankton abundances detected at the TSW (Tyrrhenian Surface Waters), MMW (Messina Mixed Waters), and IIW (Ionian Intermediate Waters): (a) Picophytoplankton; (b) Larger Phytoplankton (Utermöhl fraction).
Figure 5.
Box plots of the phytoplankton abundances detected at the TSW (Tyrrhenian Surface Waters), MMW (Messina Mixed Waters), and IIW (Ionian Intermediate Waters): (a) Picophytoplankton; (b) Larger Phytoplankton (Utermöhl fraction).

Figure 6.
Species richness (S), Δ = average taxonomic diversity, and Δ* = average taxonomic distinctness observed at the TSW (Tyrrhenian Surface Waters), MMW (Messina Mixed Waters) and IIW (Ionian Intermediate Waters).
Figure 6.
Species richness (S), Δ = average taxonomic diversity, and Δ* = average taxonomic distinctness observed at the TSW (Tyrrhenian Surface Waters), MMW (Messina Mixed Waters) and IIW (Ionian Intermediate Waters).

Figure 7.
Enzyme activity patterns: (a) Alkaline Phosphatase (AP), (b) Leucine Aminopeptidase (LAP), and (c) β—glucosidase (GLU) measured at the TSW (Tyrrhenian Surface Waters), MMW (Messina Mixed Waters), IIW (Ionian Intermediate Waters), and DW (Deep Waters).
Figure 7.
Enzyme activity patterns: (a) Alkaline Phosphatase (AP), (b) Leucine Aminopeptidase (LAP), and (c) β—glucosidase (GLU) measured at the TSW (Tyrrhenian Surface Waters), MMW (Messina Mixed Waters), IIW (Ionian Intermediate Waters), and DW (Deep Waters).

Figure 8.
Heat map distribution of the percentage contribution of different size classes of morphotypes (cocci and rods) and enzymatic activities to the total variability in the TSW (Tyrrhenian Surface Waters), MMW (Messina Mixed Waters), IIW (Ionian Intermediate Waters) and DW (Deep Waters). Within TSW, LAP accounts for high percentages (12.4%) like medium-sized rods (27.5%); AP, GLU, and large-sized cocci contributions are similar. In MMW, the role of GLU and AP is comparable whereas that of LAP is marginal like large-sized rods. In the IIW, GLU is a major determinant (up to 24.9%); similar contributions for LAP and large cocci and for AP and small rods are found. In the DW, AP and LAP contribute 50.2 and 35.6% respectively.

Figure 9.
Primary production (PP) plotted vs. organic substrates hydrolysis (LAP + GLU) of: (a) linear regression and R2 measured in TSW (Tyrrhenian Surface Waters) and IIW (Ionian Intermediate Waters); (b) comparison of the ratio between the two processes observed in this study (panel a) with other reference Mediterranean basins such as the Southern Adriatic Sea (S_ADR), the Eastern (E-MED), and the Western Mediterranean Sea (W_MED) (datasets from [7,96]).


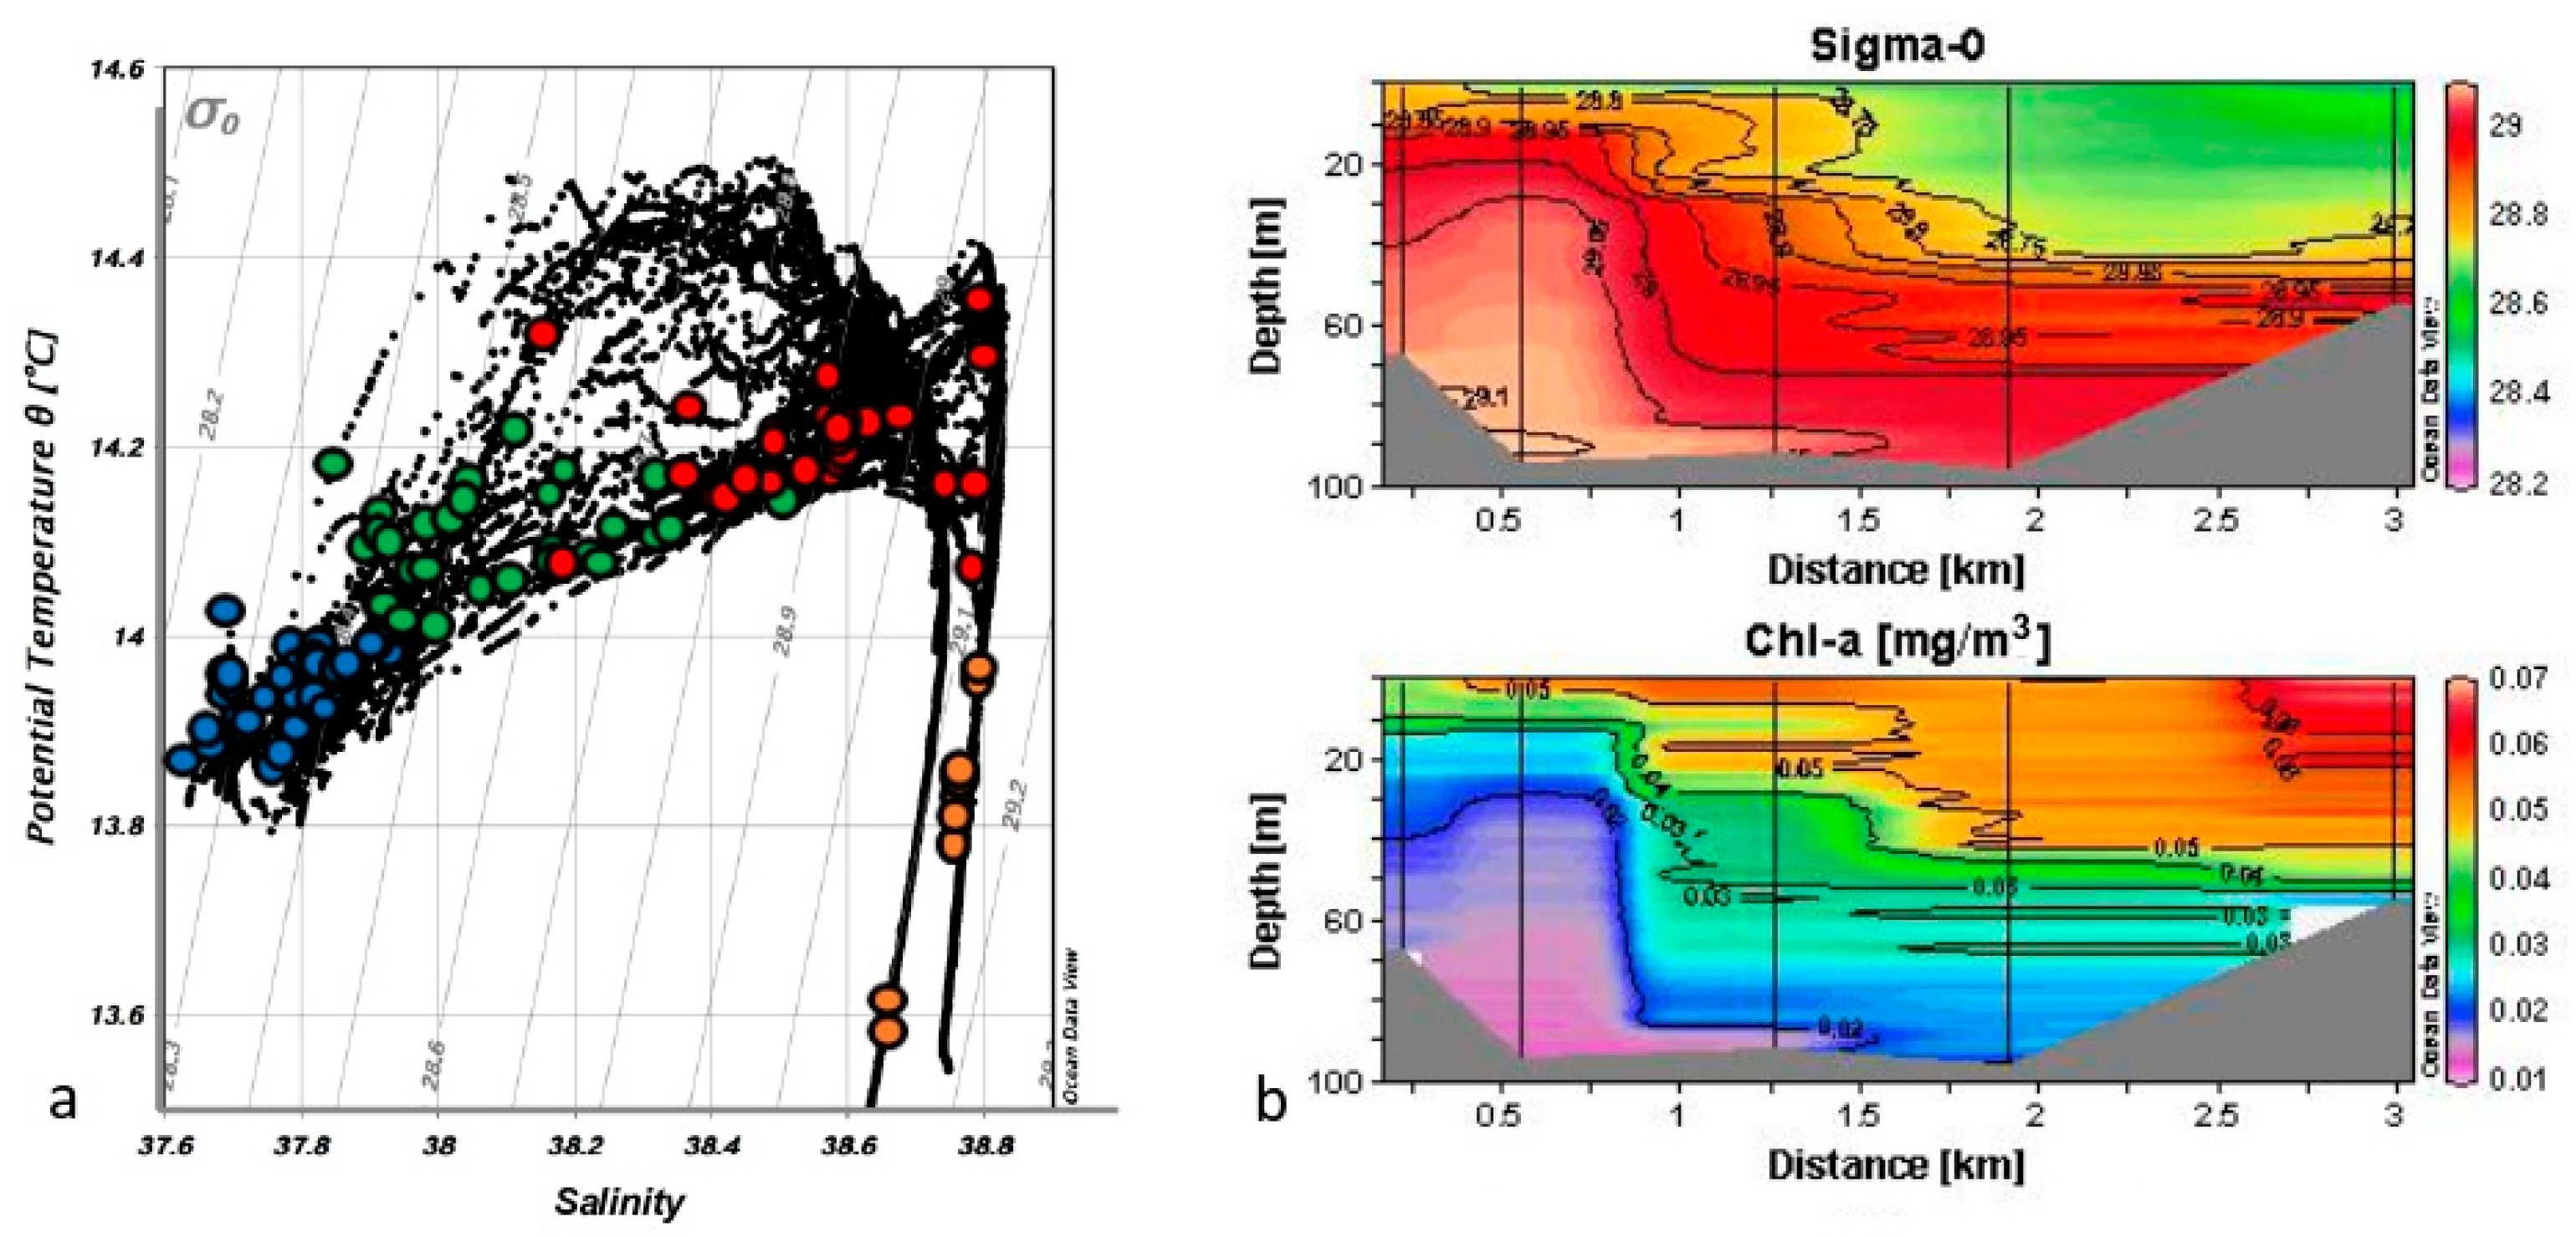
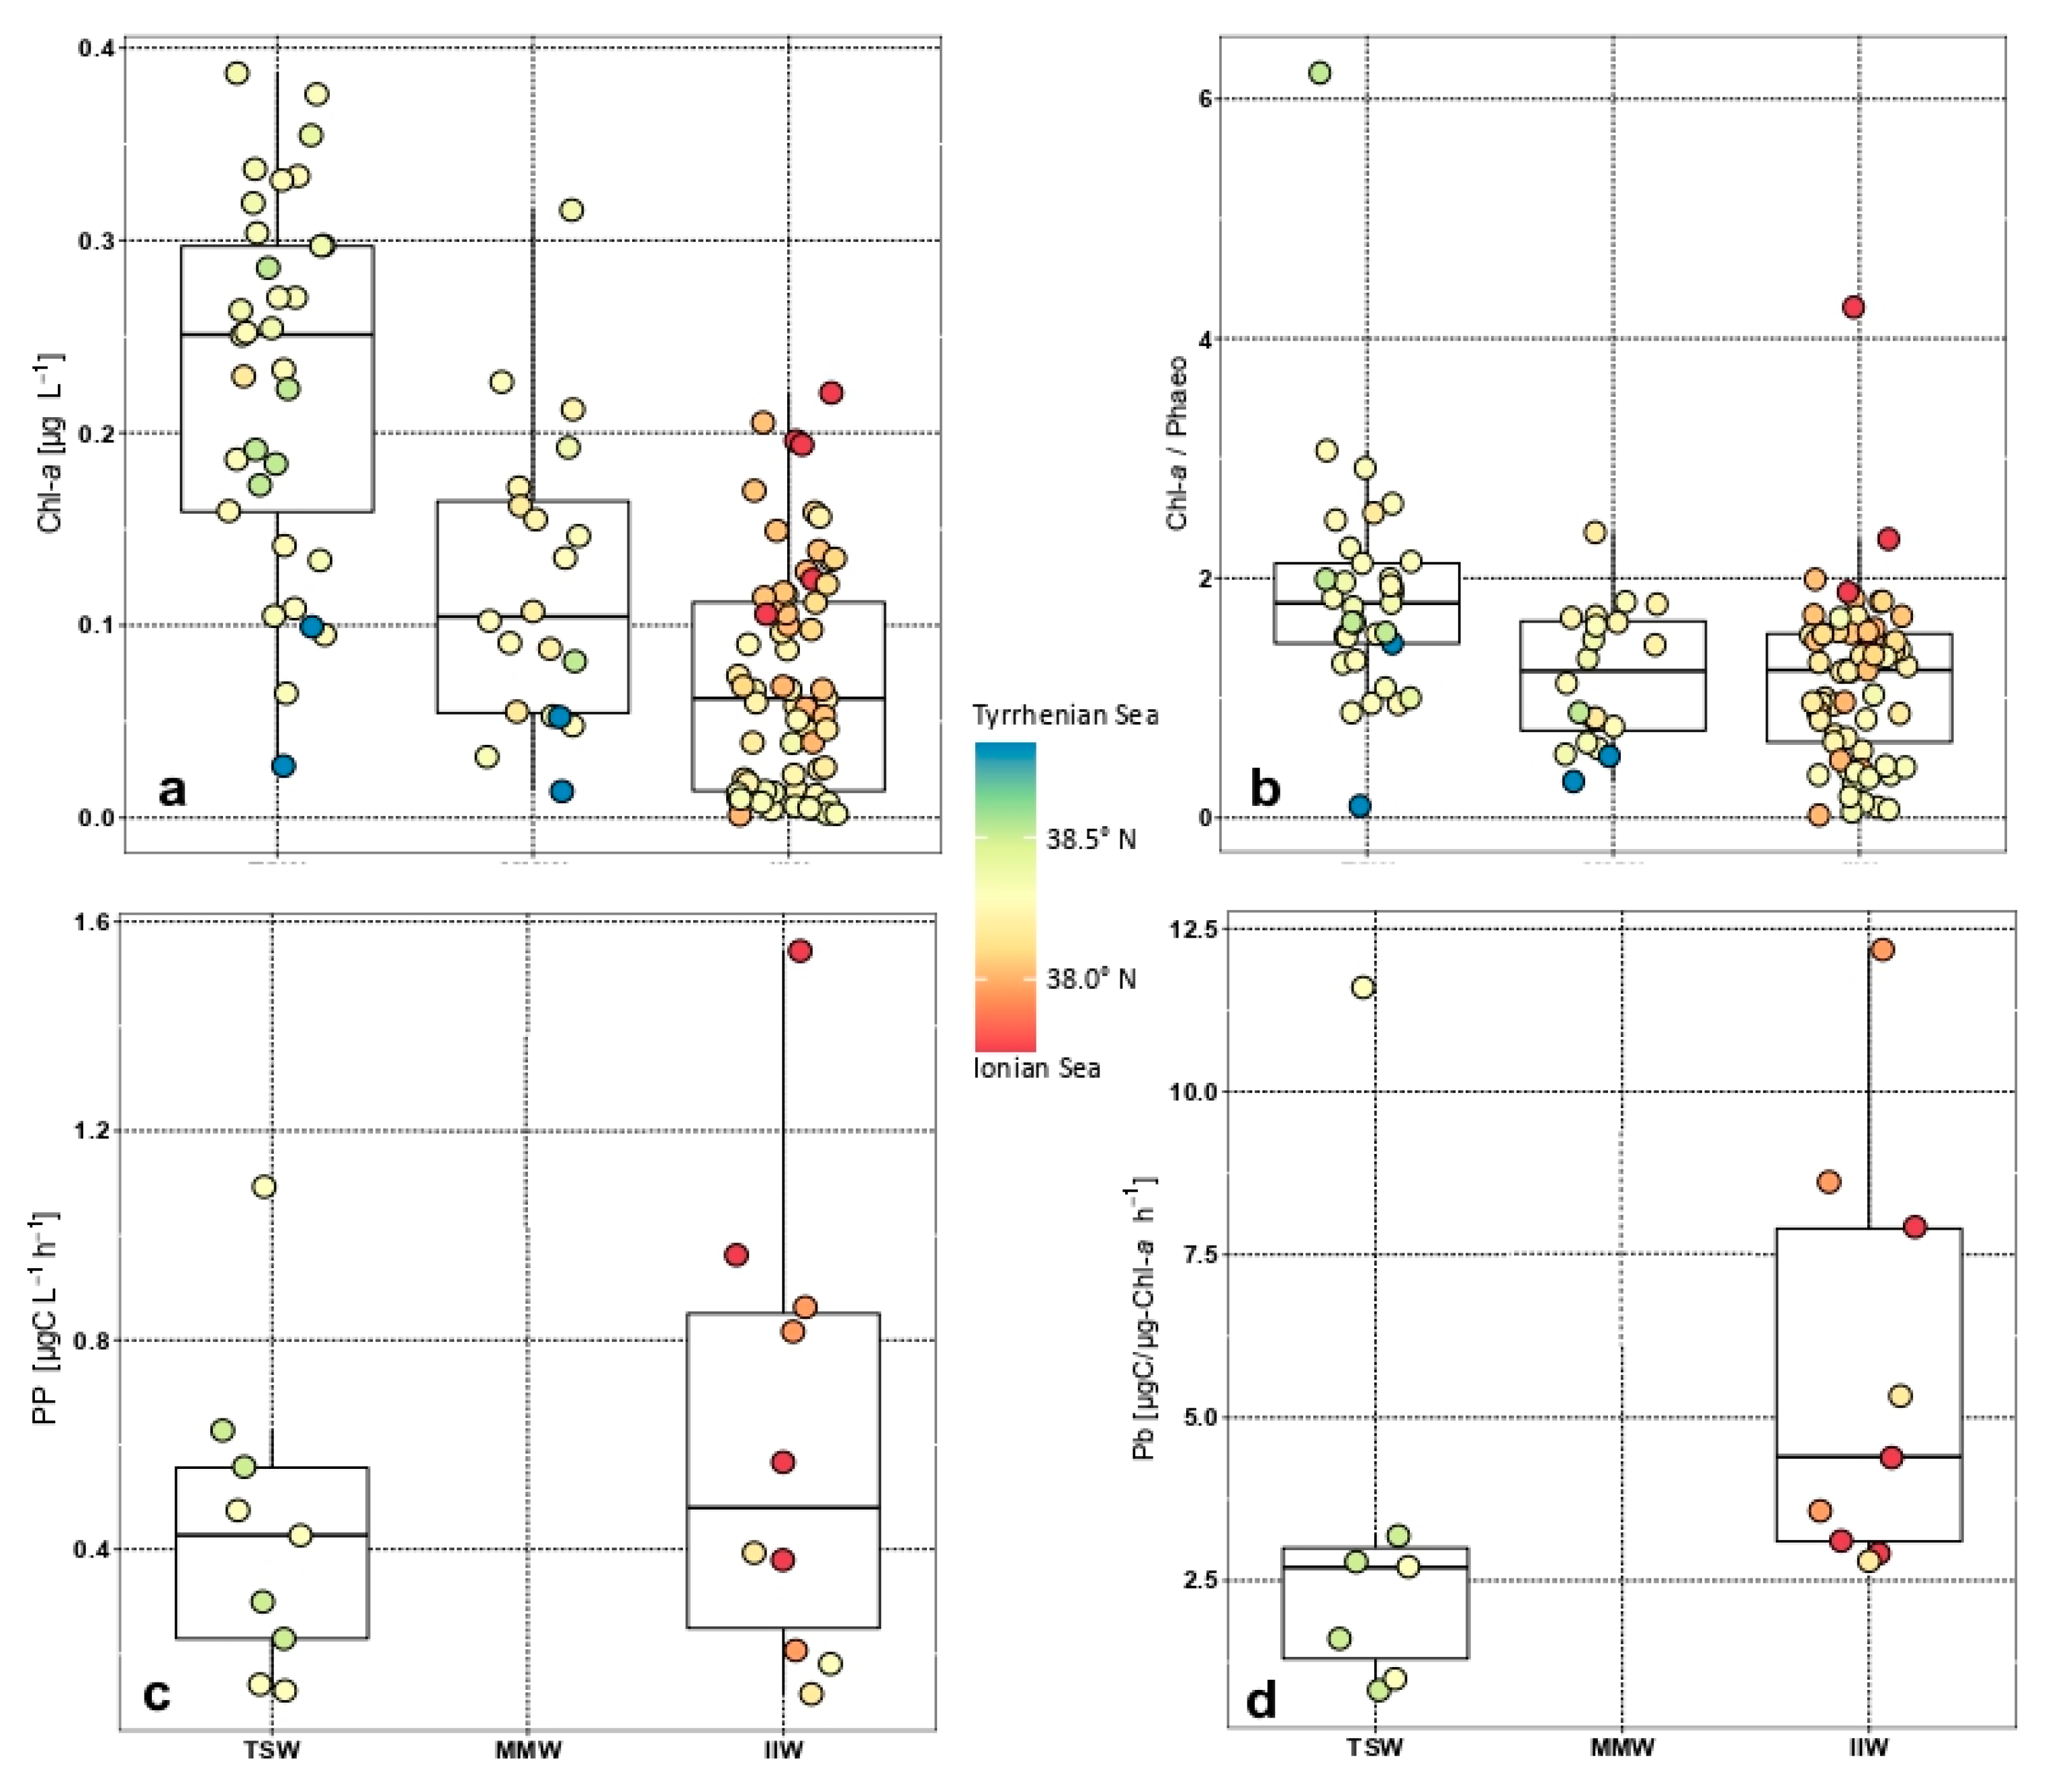
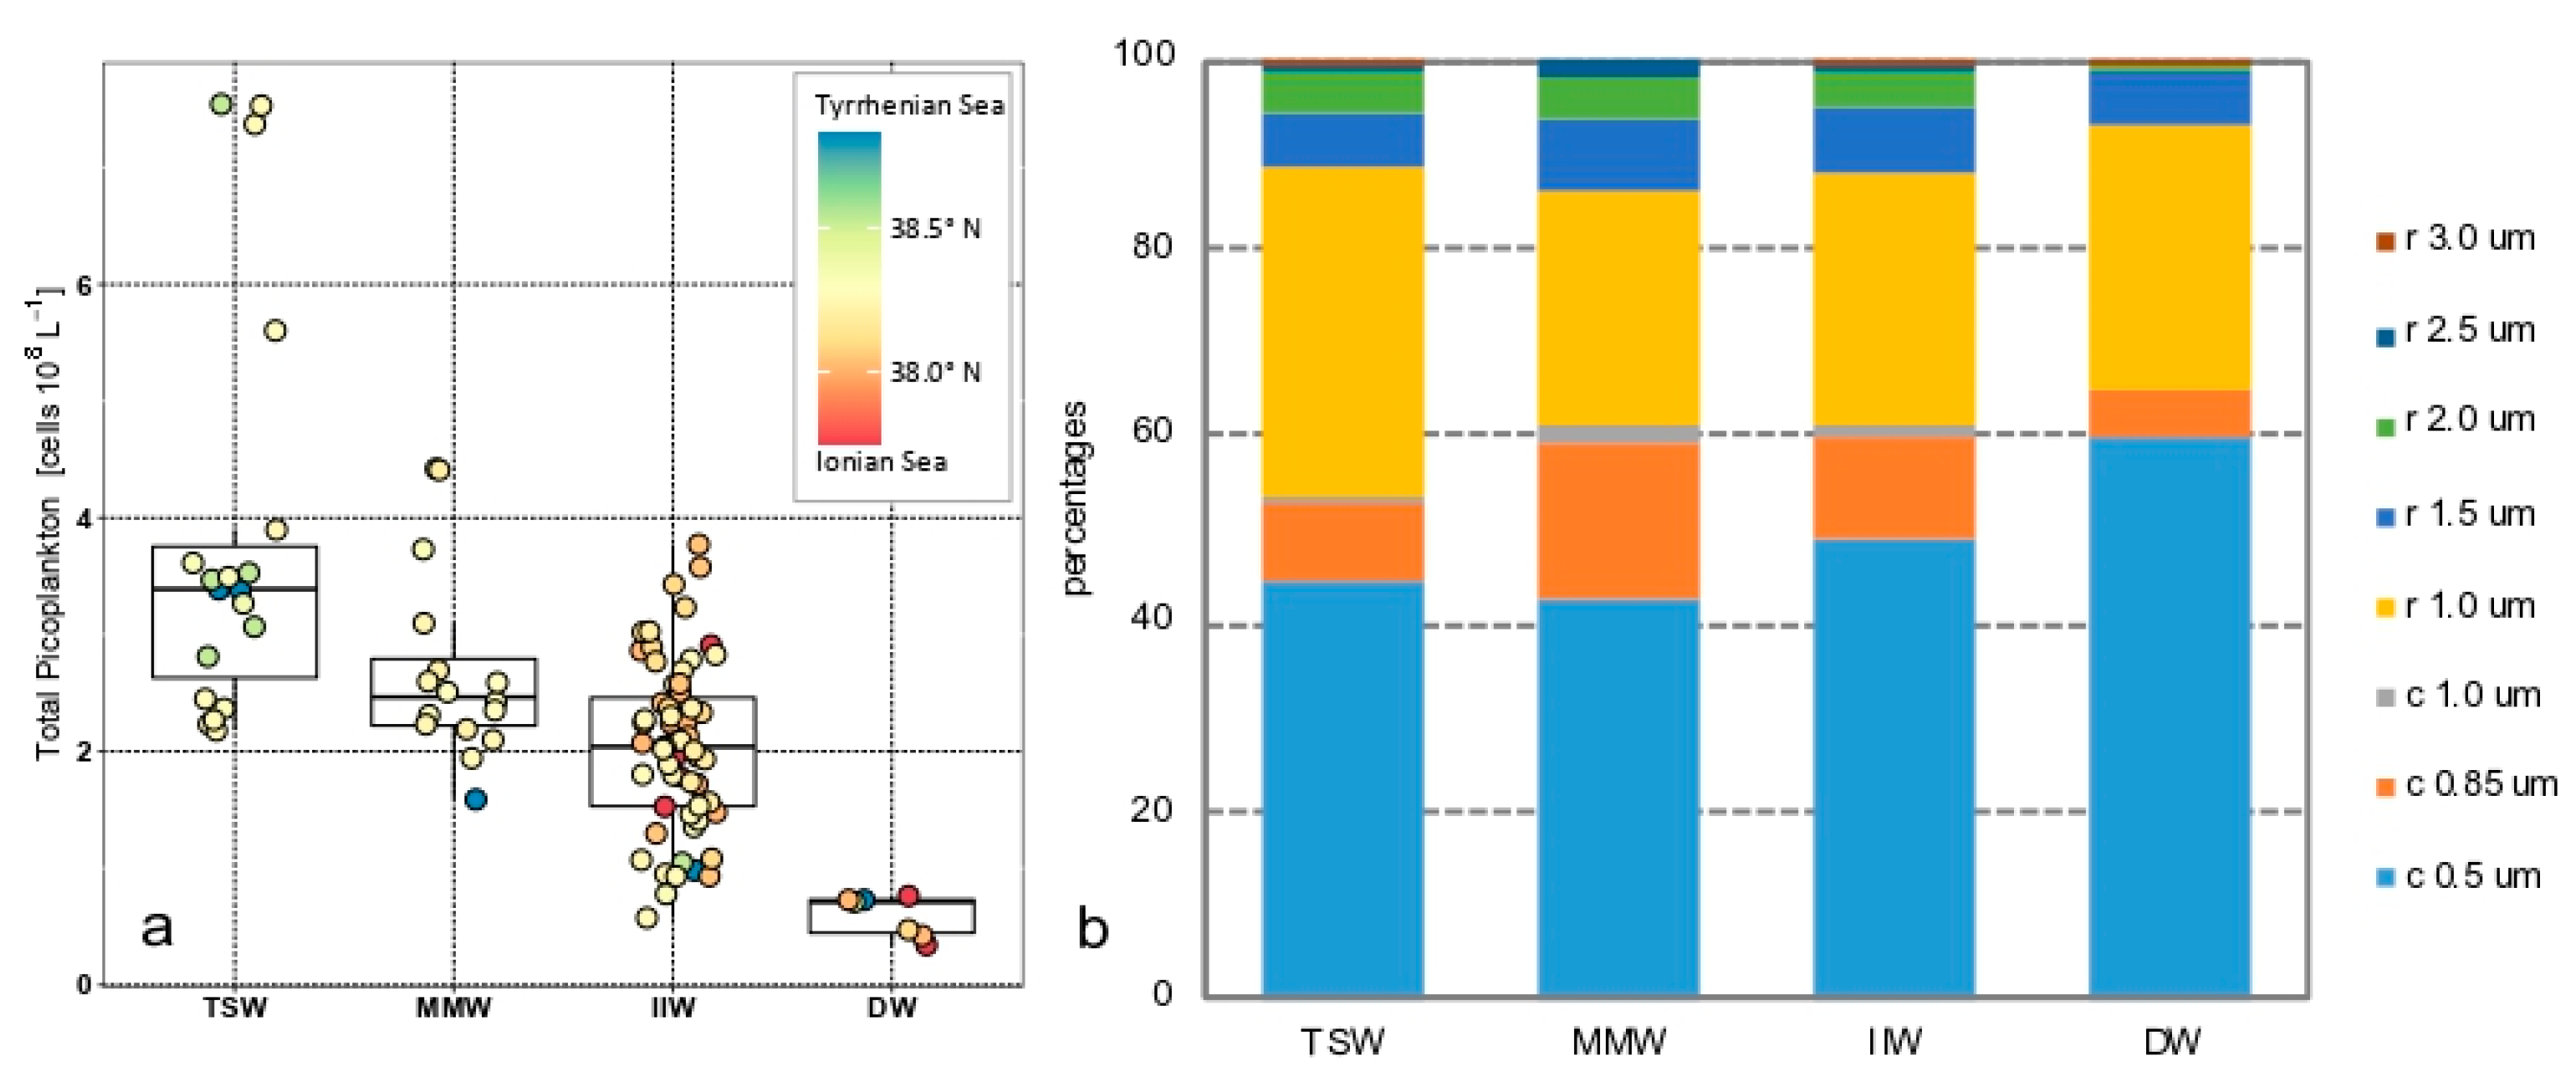
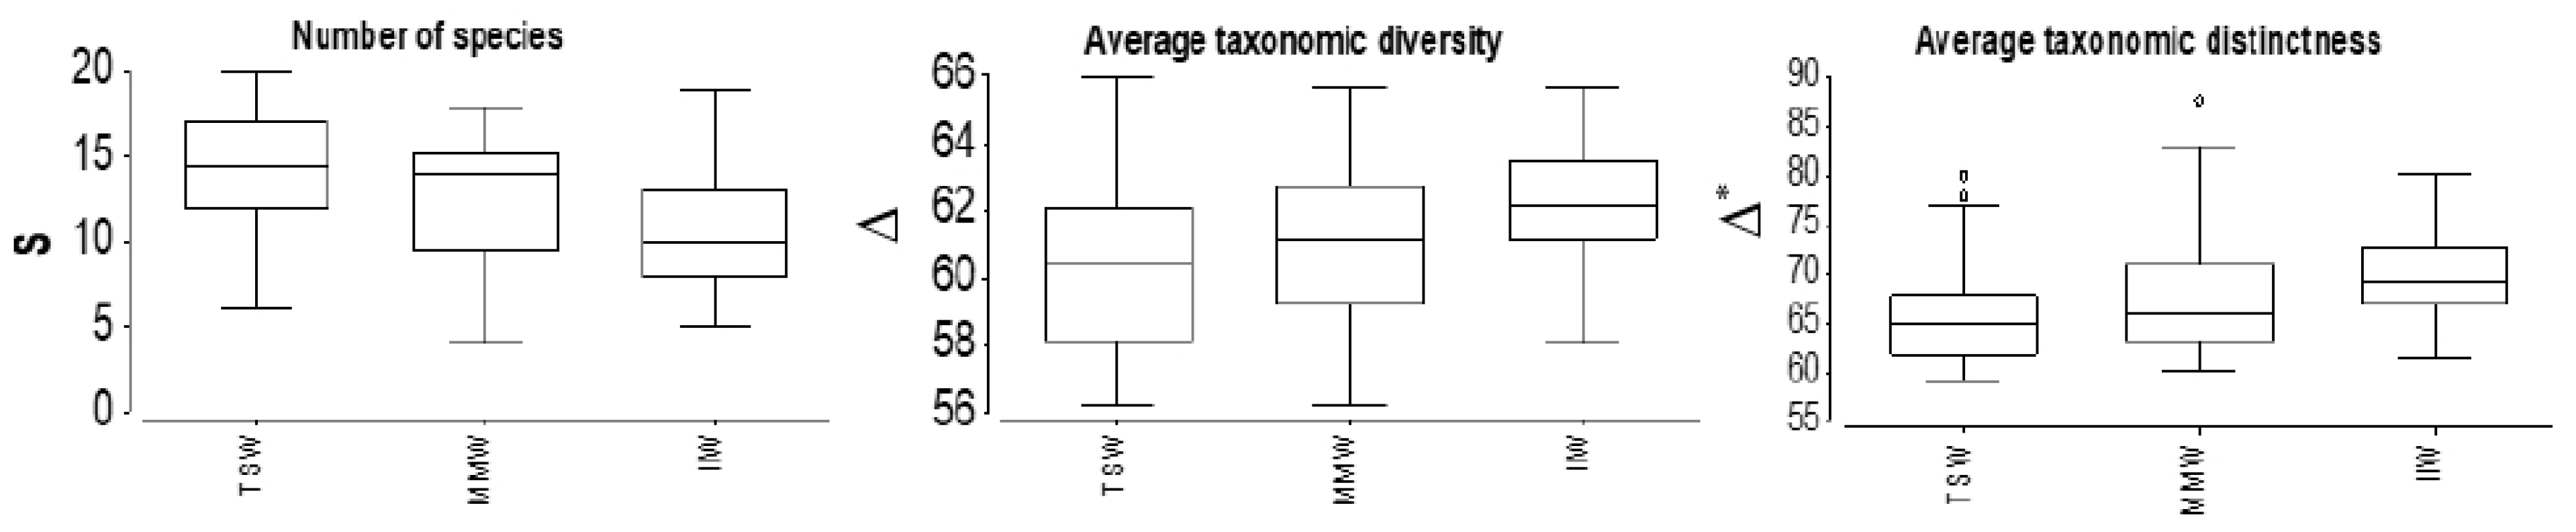
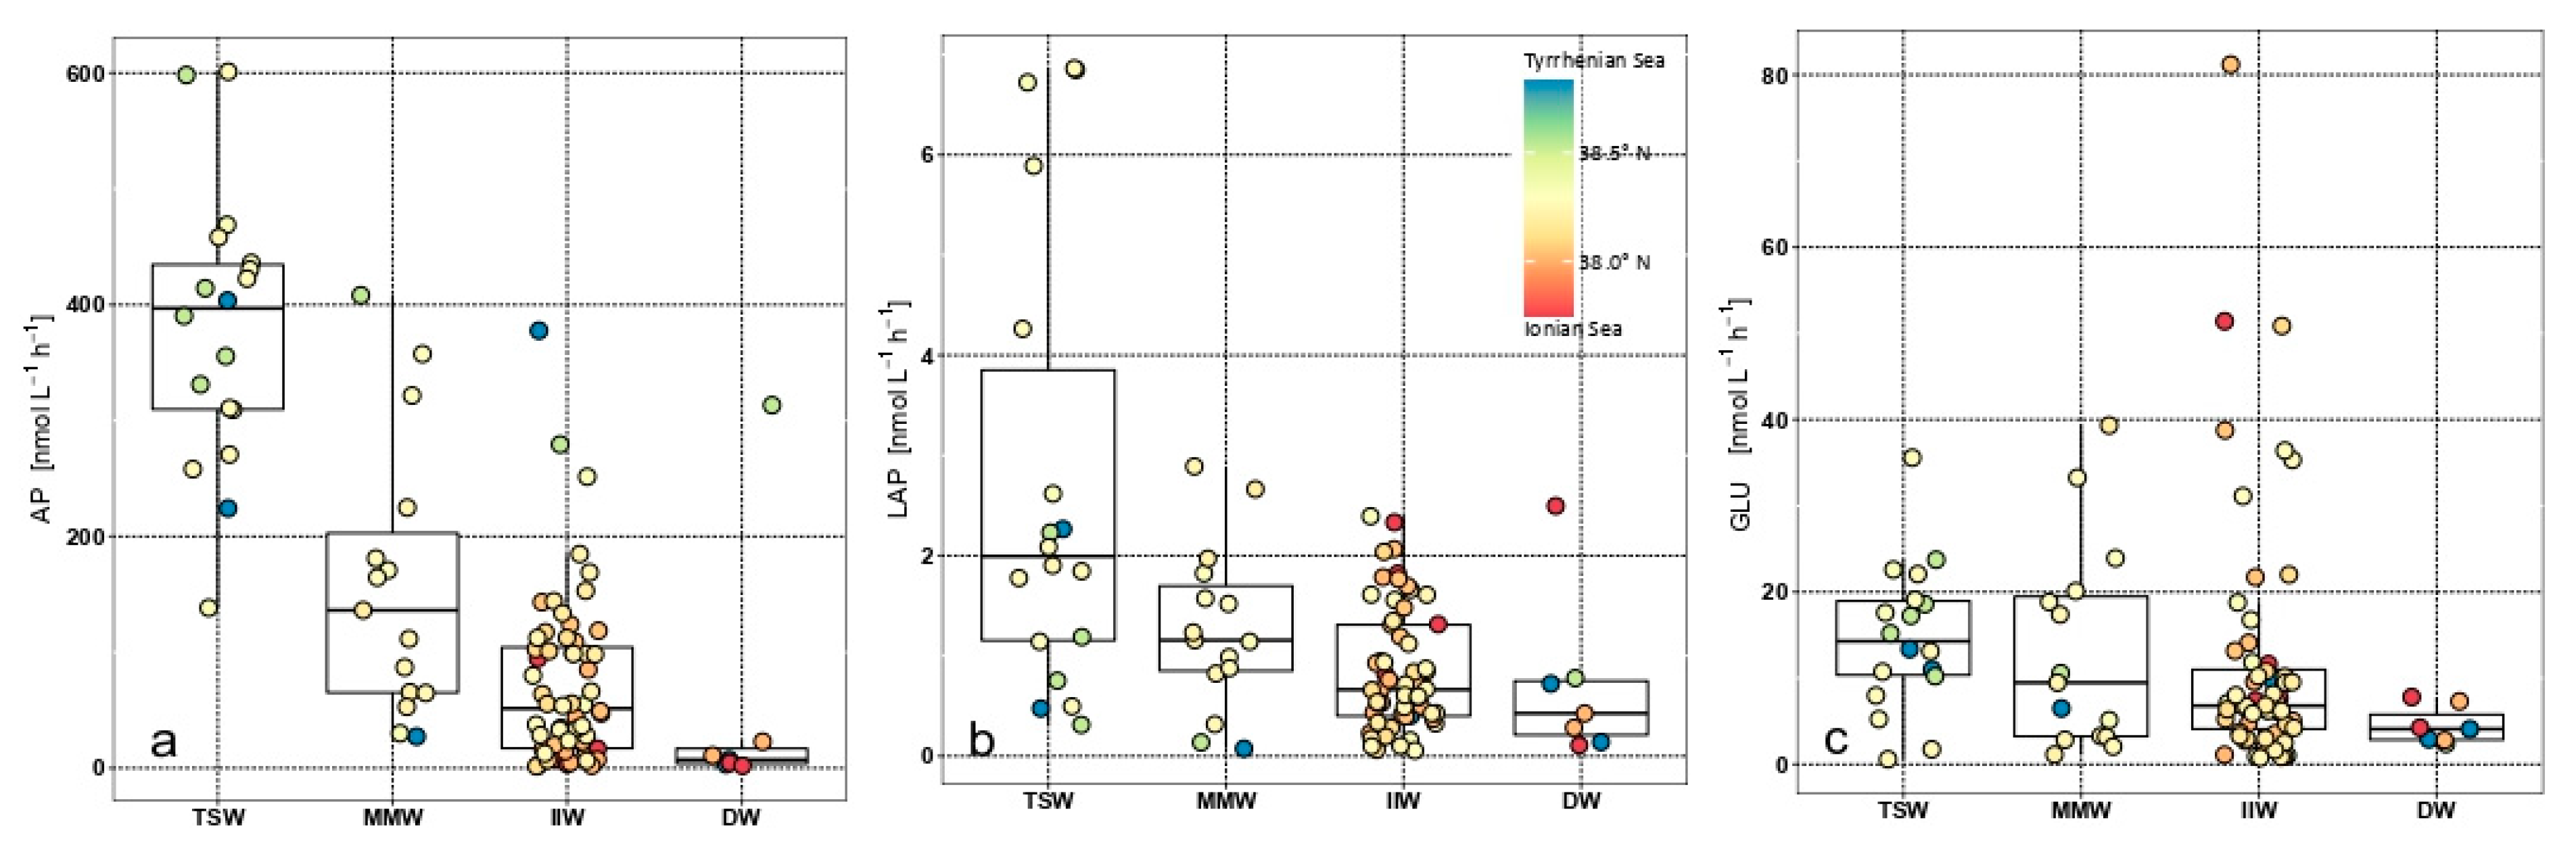
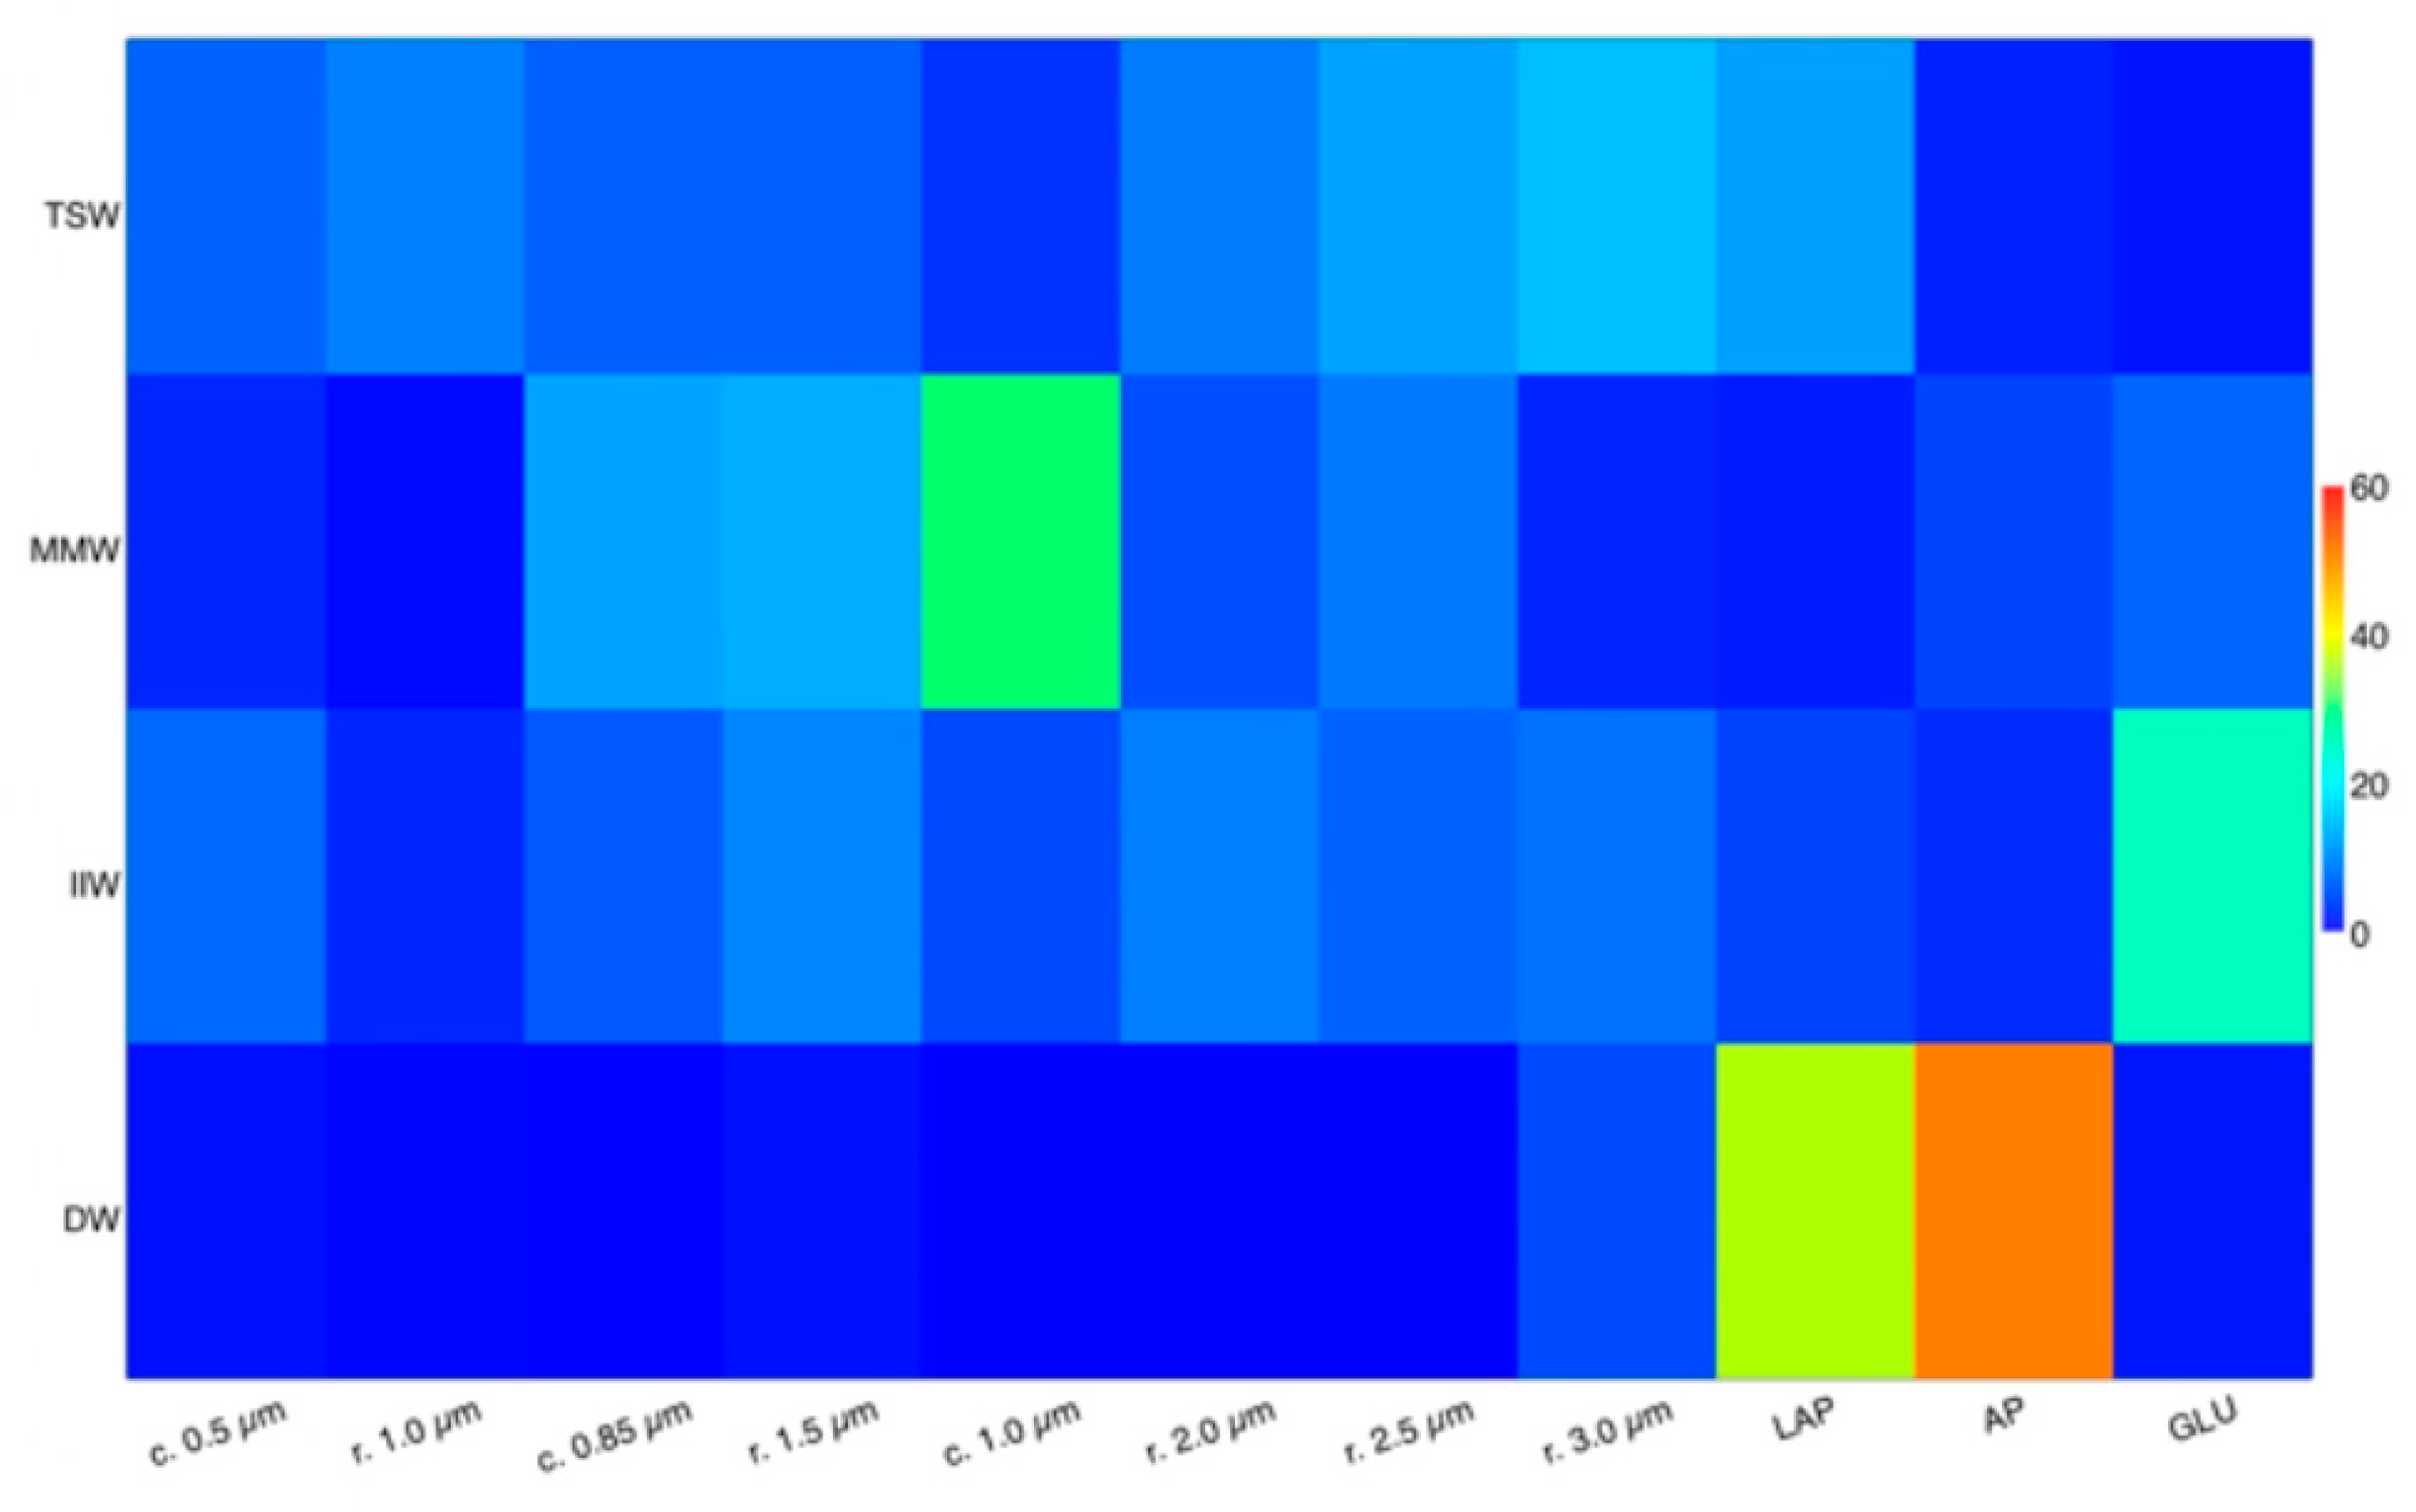
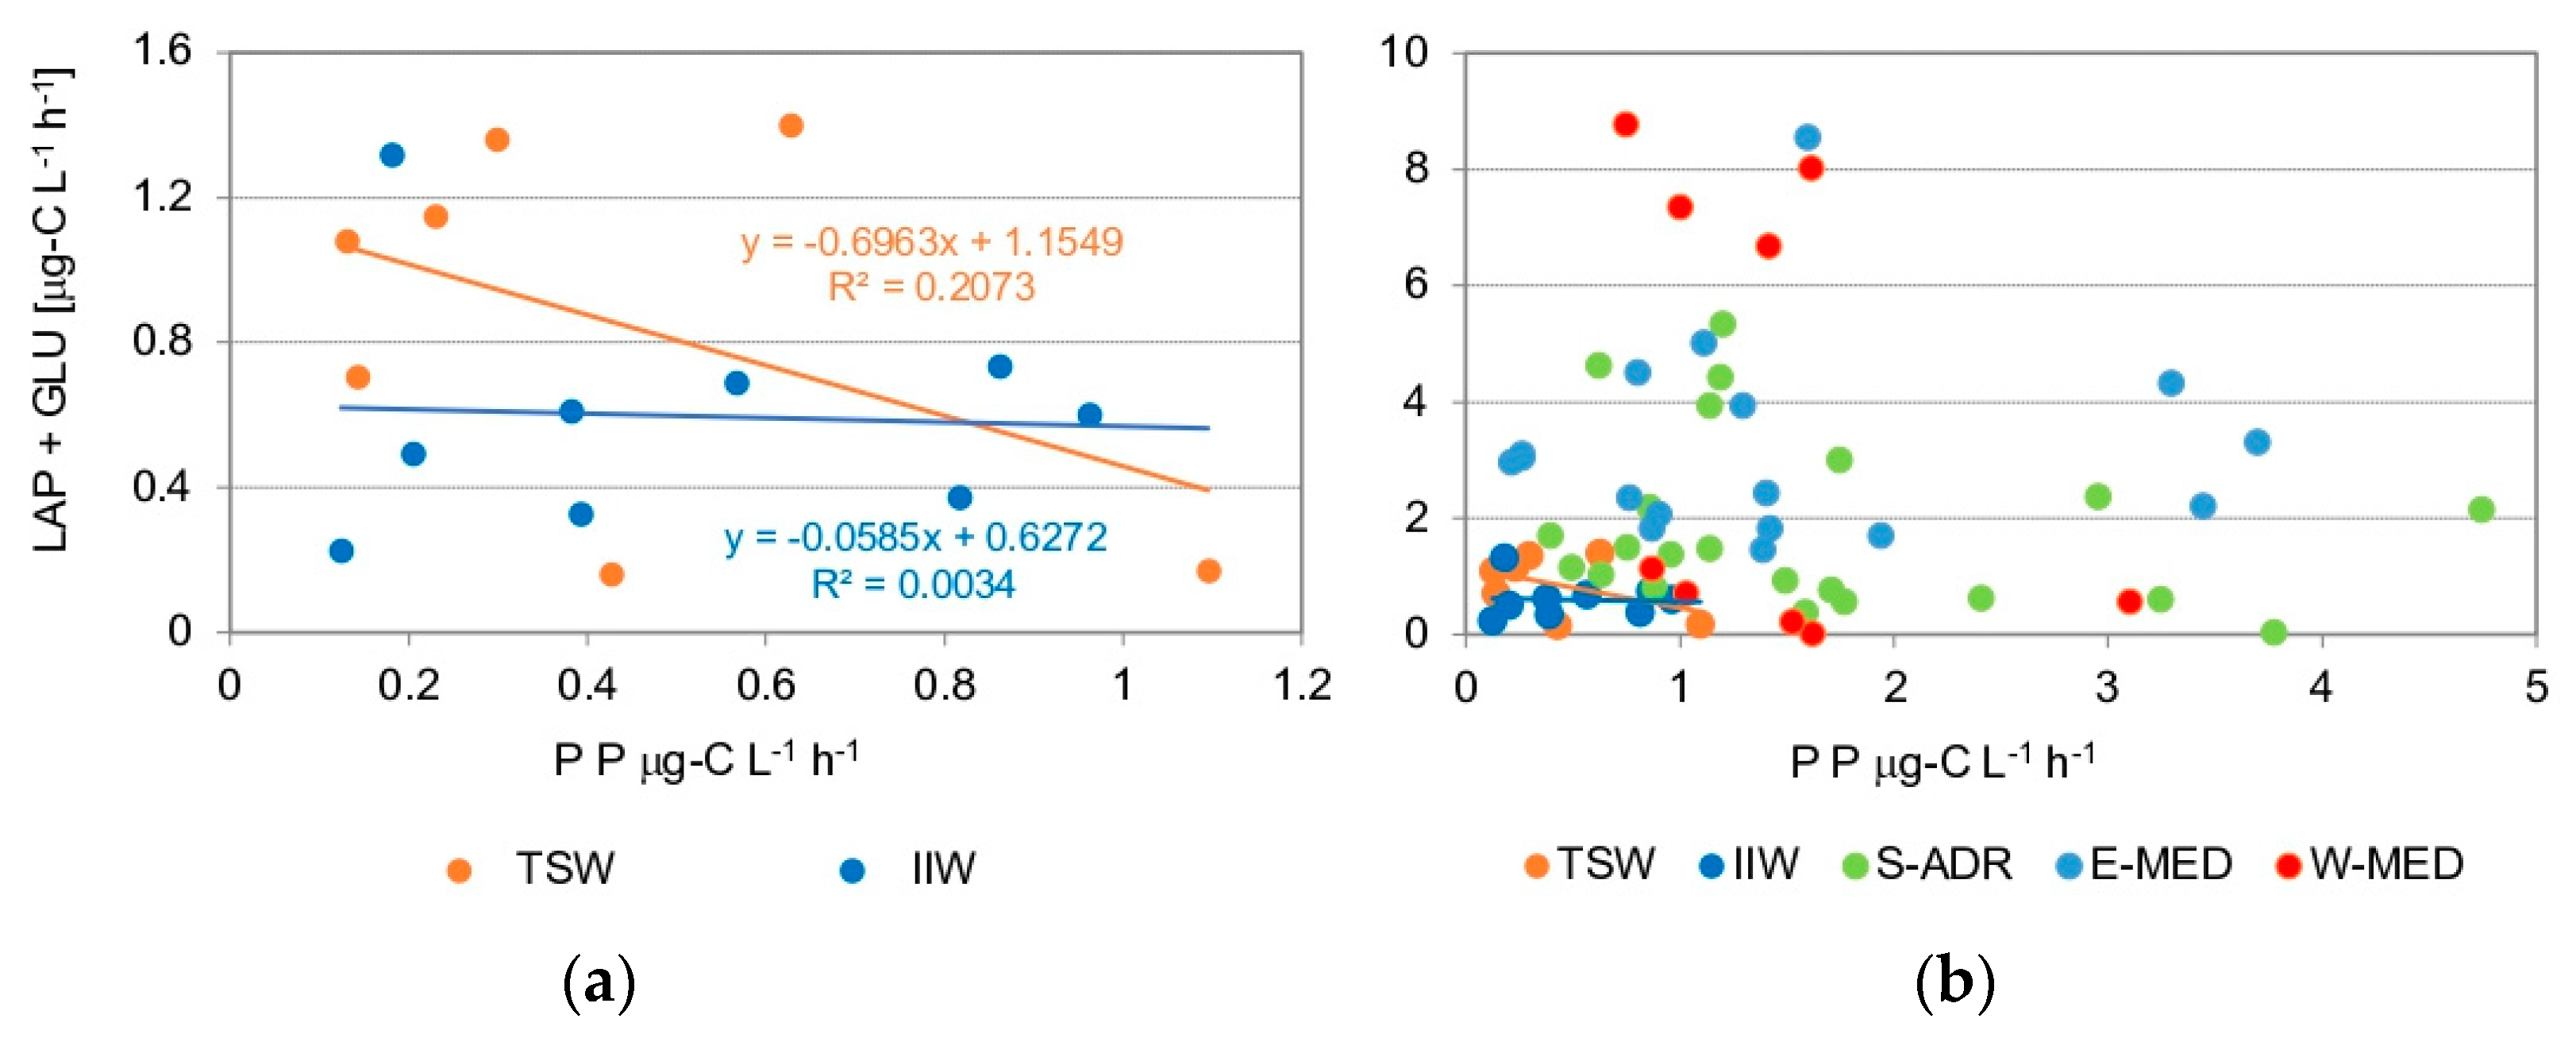
Table 1.
Average (Avg), standard deviation (SD), and number of cases (n) of chemical–physical and biotic parameters measured in the TSW (Tyrrhenian Surface Waters), MMW (Messina Mixed Waters), IIW (Ionian Intermediate Waters), and DW (Deep Waters) in the Straits of Messina area.
Table 1.
Average (Avg), standard deviation (SD), and number of cases (n) of chemical–physical and biotic parameters measured in the TSW (Tyrrhenian Surface Waters), MMW (Messina Mixed Waters), IIW (Ionian Intermediate Waters), and DW (Deep Waters) in the Straits of Messina area.
| System | ||||||||||||||
|---|---|---|---|---|---|---|---|---|---|---|---|---|---|---|
| TSW | MMW | IIW | DW | |||||||||||
| Parameter * | Fraction/Species | Unit | Avg | SD | n | Avg | SD | n | Avg | SD | n | Avg | SD | n |
| T | °C | 13.90 | 0.05 | 35 | 14.09 | 0.06 | 23 | 14.25 | 0.11 | 113 | 13.72 | 0.19 | 10 | |
| S | 37.78 | 0.08 | 35 | 38.06 | 0.15 | 23 | 38.61 | 0.16 | 113 | 38.70 | 0.10 | 10 | ||
| O2 | mL L−1 | 5.50 | 0.05 | 35 | 5.24 | 0.11 | 23 | 4.85 | 0.26 | 113 | 4.36 | 0.10 | 10 | |
| Fluorescence | µg L−1 | 0.075 | 0.017 | 35 | 0.050 | 0.020 | 23 | 0.030 | 0.016 | 113 | 0.013 | 0.001 | 10 | |
| PO4 | Concentration | µM | 0.206 | 0.071 | 34 | 0.263 | 0.101 | 23 | 0.255 | 0.114 | 104 | 0.294 | 0.060 | 10 |
| NH4 | 0.907 | 0.648 | 34 | 0.938 | 0.535 | 23 | 1.030 | 0.590 | 104 | 1.027 | 0.570 | 10 | ||
| NO2 + NO3 | 1.160 | 0.440 | 34 | 1.600 | 0.420 | 23 | 2.244 | 1.116 | 104 | 8.408 | 3.475 | 10 | ||
| Si(OH)4 | 2.077 | 1.470 | 34 | 2.518 | 1.536 | 23 | 2.856 | 1.139 | 104 | 6.314 | 1.622 | 10 | ||
| chla | Total | µg L−1 | 0.228 | 0.095 | 33 | 0.122 | 0.076 | 20 | 0.065 | 0.059 | 76 | |||
| >10 µm | 0.013 | 0.006 | 12 | 0.007 | 0.002 | 6 | 0.010 | 0.012 | 10 | |||||
| 2–10 µm | 0.034 | 0.017 | 12 | 0.020 | 0.013 | 6 | 0.028 | 0.019 | 10 | |||||
| 0.5–2 µm | 0.098 | 0.054 | 12 | 0.056 | 0.046 | 6 | 0.071 | 0.055 | 10 | |||||
| phaeo | Total | µg L−1 | 0.137 | 0.065 | 33 | 0.102 | 0.049 | 20 | 0.052 | 0.029 | 76 | |||
| >10 µm | 0.031 | 0.014 | 12 | 0.052 | 0.057 | 6 | 0.028 | 0.017 | 10 | |||||
| 2–10 µm | 0.040 | 0.036 | 12 | 0.019 | 0.014 | 6 | 0.013 | 0.008 | 10 | |||||
| 0.5–2 µm | 0.035 | 0.022 | 12 | 0.030 | 0.010 | 6 | 0.030 | 0.010 | 10 | |||||
| PP | Total | µgC L−1 h−1 | 0.442 | 0.302 | 9 | 1.069 | 1 | 0.603 | 0.446 | 10 | ||||
| >10 µm | 0.028 | 0.019 | 9 | 0.054 | 1 | 0.026 | 0.012 | 10 | ||||||
| 2–10 µm | 0.073 | 0.094 | 9 | 0.302 | 1 | 0.134 | 0.134 | 10 | ||||||
| 0.5–2 µm | 0.341 | 0.206 | 9 | 0.713 | 1 | 0.443 | 0.308 | 10 | ||||||
| LAP | nmol L−1 h−1 | 2.759 | 2.305 | 18 | 1.279 | 0.828 | 15 | 0.847 | 0.619 | 60 | 0.707 | 0.831 | 7 | |
| AP | 378.99 | 119.36 | 18 | 160.26 | 120.62 | 15 | 72.357 | 73.227 | 60 | 52.029 | 115.42 | 7 | ||
| GLU | 14.760 | 8.533 | 18 | 13.134 | 11.957 | 15 | 11.726 | 14.620 | 60 | 4.507 | 2.197 | 7 | ||
| PPA | Abundance | cells × 106 L−1 | 19.516 | 3.619 | 18 | 13.213 | 5.943 | 12 | 7.812 | 3.913 | 44 | |||
| PPT | cells × 108 L−1 | 3.867 | 1.788 | 19 | 2.699 | 0.824 | 16 | 2.051 | 0.710 | 64 | 0.594 | 0.178 | 7 | |
| Cocci 0.5 µm | 1.806 | 0.895 | 10 | 1.417 | 0.445 | 6 | 0.994 | 0.452 | 29 | 0.343 | 0.117 | 4 | ||
| Cocci 0.85 µm | 0.324 | 0.308 | 10 | 0.543 | 0.306 | 6 | 0.223 | 0.143 | 29 | 0.026 | 0.023 | 4 | ||
| Cocci 1.0 µm | 0.023 | 0.044 | 10 | 0.071 | 0.090 | 6 | 0.015 | 0.023 | 29 | 0.000 | 0.000 | 4 | ||
| PPT | Rods 1.0 µm | cells × 108 L−1 | 1.411 | 0.877 | 10 | 0.830 | 0.251 | 6 | 0.545 | 0.236 | 29 | 0.163 | 0.070 | 4 |
| Rods 1.5 µm | 0.245 | 0.194 | 10 | 0.243 | 0.198 | 6 | 0.143 | 0.103 | 29 | 0.031 | 0.024 | 4 | ||
| Rods 2.0 µm | 0.165 | 0.160 | 10 | 0.160 | 0.098 | 6 | 0.081 | 0.075 | 29 | 0.004 | 0.007 | 4 | ||
| Rods 2.5 µm | 0.048 | 0.107 | 10 | 0.049 | 0.071 | 6 | 0.017 | 0.039 | 29 | 0.000 | 0.000 | 4 | ||
| Rods 3.0 µm | 0.013 | 0.042 | 10 | 0.008 | 0.015 | 6 | 0.006 | 0.015 | 29 | 0.004 | 0.007 | 4 | ||
| Larger Phytoplankton | Total | 69.102 | 40.590 | 18 | 39.580 | 18.002 | 13 | 44.783 | 21.547 | 42 | ||||
| Diatoms | 6.585 | 5.414 | 18 | 4.825 | 2.982 | 13 | 3.595 | 2.770 | 42 | |||||
| Dinoflagellates | cells × 103 L−1 | 3.424 | 1.826 | 18 | 1.992 | 1.425 | 13 | 2.214 | 1.798 | 42 | ||||
| Coccolithophorids | 4.599 | 3.683 | 18 | 2.160 | 2.108 | 13 | 3.568 | 4.756 | 42 | |||||
| Others | 54.495 | 35.758 | 18 | 30.603 | 15.792 | 13 | 35.406 | 16.480 | 42 | |||||
* Acronyms: T = temperature; S = salinity; O2 = dissolved oxygen; PO4 = phosphate; NO2 = nitrite; NO3 = nitrate; Si(OH)4 = silicate; chla = chlorophyll a; phaeo = phaeopigments; PP = primary production; LAP = leucine aminopeptidase; AP = alkaline phosphatase; GLU = beta-glucosidase; PPA = autotrophic picoplankton; PPT = total picoplankton.
Table 2.
Diversity indices in Tyrrhenian Surface Waters (TSW), Messina Mixed Waters (MMW) and Ionian Intermediate Waters (IIW) during the sampling period; S = number of species/morphotypes, d = Margalef’s index, J’ = Pielou’s evenness, H’ = Shannon’s index, Δ = average taxonomic diversity, and Δ* = average taxonomic distinctness. Average ± standard deviation [min, max values].
| TSW | MMW | IIW | |
|---|---|---|---|
| S | 13.89 ± 3.92 [6, 20] | 12.23 ± 4.07 [4, 18] | 8.83 ± 1.98 [6, 12] |
| d | 2.73 ± 0.71 [1.26, 3.78] | 2.44 ± 0.77 [0.82, 3.49] | 2.17 ± 0.61 [1.05, 3.65] |
| J’ | 0.98 ± 0.01 [0.95, 0.98] | 0.97 ± 0.02 [0.93, 0.98] | 0.98 ± 0.01 [0.96, 0.99] |
| H’ | 2.53 ± 0.35 [1.71, 2.95] | 2.38 ± 0.43 [1.29, 2.84] | 2.27 ± 0.31 [1.55, 2.90] |
| Δ | 60.54 ± 2.67 [56.21, 65.95] | 60.80 ± 2.77 [56.25, 65.65] | 62.16 ± 1.88 [58.09, 65.69] |
| Δ* | 66.18 ± 5.65 [59.12, 80.01] | 68.03 ± 7.71 [60.23, 87.72] | 69.59 ± 4.49 [61.43, 80.17] |
Publisher’s Note: MDPI stays neutral with regard to jurisdictional claims in published maps and institutional affiliations. |
© 2022 by the authors. Licensee MDPI, Basel, Switzerland. This article is an open access article distributed under the terms and conditions of the Creative Commons Attribution (CC BY) license (https://creativecommons.org/licenses/by/4.0/).
Share and Cite
MDPI and ACS Style
Caroppo, C.; Azzaro, F.; Bergamasco, A.; Caruso, G.; Decembrini, F. Phytoplankton and Bacterial Communities’ Patterns in a Highly Dynamic Ecosystem (Central Mediterranean Sea). Water 2022, 14, 2057. https://doi.org/10.3390/w14132057
AMA Style
Caroppo C, Azzaro F, Bergamasco A, Caruso G, Decembrini F. Phytoplankton and Bacterial Communities’ Patterns in a Highly Dynamic Ecosystem (Central Mediterranean Sea). Water. 2022; 14(13):2057. https://doi.org/10.3390/w14132057
Chicago/Turabian StyleCaroppo, Carmela, Filippo Azzaro, Alessandro Bergamasco, Gabriella Caruso, and Franco Decembrini. 2022. "Phytoplankton and Bacterial Communities’ Patterns in a Highly Dynamic Ecosystem (Central Mediterranean Sea)" Water 14, no. 13: 2057. https://doi.org/10.3390/w14132057
Note that from the first issue of 2016, this journal uses article numbers instead of page numbers. See further details here.