
Impact of Water Saving Policy on Water Resource and Economy for Hebei, China Based on an Improved Computable General Equilibrium Model

1
Department of Hydraulic Engineering, Tsinghua University, Beijing 100038, China
2
State Key Laboratory of Simulation and Regulation of Water Cycle in River Basin, China Institute of Water Resources and Hydropower Research (IWHR), Beijing 100038, China
3
Wenling Agriculture, Rural and Water Resources Bureau, Wenling 317500, China
*
Author to whom correspondence should be addressed.
Water 2022, 14(13), 2056; https://doi.org/10.3390/w14132056
Submission received: 25 May 2022
/
Revised: 17 June 2022
/
Accepted: 24 June 2022
/
Published: 27 June 2022
(This article belongs to the Section Water Resources Management, Policy and Governance)
Abstract
:Hebei Province of China is facing a severe water resource shortage, making it urgent to formulate economical and effective water conservation policies. However, few studies have focused on analyzing the resource and economic impacts of a water policy. This study developed an improved computable general equilibrium (CGE) model with an extended water resources module as a policy analysis tool. The extended water resources module includes different water resources as commodities and water sectors, and introduces a substitution mechanism among the water resources. Policy scenarios containing different policy types and policy objects were established, including water price, technology (tech) improvement, structure adjustment, and water reuse policies in primary, secondary, and tertiary sectors. The impact on the water resource and economy of the scenarios was analyzed using the CGE model. The recommended policies include: an agricultural technology improvement policy that decreases groundwater usage by 240 hm3; an industrial technology improvement policy under which water usage per 10,000 CNY of industrial added value decreases by 13%; an industrial water reuse policy that increases unconventional water usage by 20%; and a structure adjustment policy to increase the proportion of the tertiary sector. The study provides an analysis tool for simulating and evaluating a water resource policy.
1. Introduction
China is a water-deficient country, and economic growth and industrial transformation have led to a situation where two-thirds of China’s cities suffer from water shortages [1]. Recognizing the ways in which economic and social development constrain water resources, the Chinese government has implemented the Strictest Water Resources Management System, with policies that emphasize conservation first, spatial balance, systematic management, and a government-market two-handed approach to restrict the excessive use of water resources.
Hebei Province is an important part of China’s Beijing-Tianjin-Hebei economic zone. Hebei has a developed economy, a dense population, and an industrial structure with a high proportion of agriculture and water intensive industries. There is a prominent conflict between the supply and demand of water resources. The government of Hebei has formulated a series of water conservation plans and policies to encourage water price reform, water-saving tech transformation, water reuse, and eliminate underdeveloped water intensive industries. Research and the development of water policies provide significant insights for solving water problems [1]. However, there have been few studies on the economic and water resource impacts of these existing water policies.
Water resources are fundamental for the earth’s living systems [2] and are becoming increasingly vulnerable due to population growth, increasing food production, and expanding industrialization [3,4,5]. Some studies [6,7] have found that the poor management of water resources further exacerbates the situation. Current studies on water management include research on water supply and demand [8,9], water quality and quantity [10,11,12], and policy simulation and evaluation [13,14]. Water policies can help drive the effective management of water resources; however, a robust policy framework is needed to ensure that competing water demands are met [15]. Previous studies have simulated and evaluated water resources policy, focusing on economically optimal water allocation options [16,17]. However, most studies have not addressed how different water users impact each other and water resources through economic decisions [18]. Some studies have applied a decision-making model, input–output model, or have coupled multiple models to research the relationship between policy and water resources. J.K. Gilmour et al. [18] developed a model that includes policy and hydrological and agricultural production system modules to study the water policy options in the Yass River catchment. Liu et al. [19] developed a decision-making model to analyze the impact of a drip irrigation under-film (DIUF) promotion policy on water consumption, and evaluated the economic benefits. Liu et al. [14] applied a hydro-economic input–output model to calculate water usage, based on implementing a water-saving policy in Heihe River Basin, China. Their results indicated that water usage by consumers decreased sharply, but water usage by producers decreased slightly. Li et al. [20] used the fuzzy comprehensive evaluation model to calculate the value of water resources and water price of Hubei Province. Their results show that the existing water price was far lower than assessed, and the mechanism of the water price should be improved. These studies generally lack the economic mechanism, making it difficult to reflect the linkages and relationships to the economic system [21].
The computable general equilibrium (CGE) model is an ideal tool for analyzing water policy impacts [22]. The CGE model can broadly reflect the input–output relationships of sectors in the economic system and simulate changes in commodity markets, factor markets, and economic structures under equilibrium conditions. Shan et al. [23] developed a water-embedded computable general equilibrium model to analyze the social-economic impacts of China’s South to North Water Transfer project on the recipient region. Zhao et al. [24] developed a dynamic CGE model for China with a total water constraint module to analyze the impact of water price reform policy on water resources and economics. The results indicated that an increase in the water price decreased the total water usage, and improved water use structure and water use efficiency. Kang [25] developed a dynamic general equilibrium model to analyze agricultural water price policy in Wuwei, China. The results indicated that agricultural water price policy had a weak water saving effect for both surface water and groundwater.
Previous CGE-based water policy studies have commonly focused on water pricing policies and a single industry, and do not compare and discuss different policy objects and policy types. By introducing the extended water module into the CGE model, which includes the substitution mechanism among various water sources, this study further explores linkages between the water usage, the water structure, and the economy. Establishing a set of water policy options that include different policy targets and policy types makes it possible to systematically investigate the policy impact on different aspects of the economy, such as prices, technological changes, and industrial structure adjustment.
The study included: (1) constructing a CGE model for Hebei province as a policy analysis tool; (2) proposing 10 groups of water-saving policy scenarios for different policy objects and types, simulating the policy impact on water resources and economics; and (3) comparing and discussing the scenarios from the perspectives of industry output, water usage, and water use efficiency, and recommending specific scenarios. This study provides a quantitative analysis tool for developing a water-saving policy, and provides a reference for simulating and evaluating policy in other regions.
2. Materials and Methods
2.1. Study Area
Hebei Province is located in the Haihe River Basin on the northern coast of China (Figure 1). The province is an important part of the “capital economic circle” of Beijing, Tianjin, and Hebei, and covers an area of 188,800 km2, with a GDP of CNY 3621 billion (USD 525 billion based on the 2020 exchange rate, with a similar conversion approach taken throughout the paper) and a population of 74.638 million in 2020. Hebei has a temperate monsoon climate. Hebei’s annual average water resource level is 20.469 billion m3. The water resource per capita is 274.24 m3, which is approximately one-seventh of China’s average and far less than the world average. Hebei Province has had to rely on the excessive use of groundwater to meet production and domestic water demands, and has become the province with the most serious groundwater overexploitation in China [26].
Given the water resource shortage challenge, the government of Hebei Province has issued policies, such as the Hebei Water Conservation Action Plan and Ten Measures for Promoting Water-saving in the Whole Society. These policies emphasize practices such as the seasonal fallow of cultivated land, elimination of water-intensive industries, upgrading of water-use technology, and promotion of water supply networks. The formulation and implementation of the water-saving policy is critical to relieve the water shortage in Hebei Province. As such, simulating and evaluating reasonable water-saving policies for Hebei has become an urgent problem to be addressed.
2.2. Model Framework
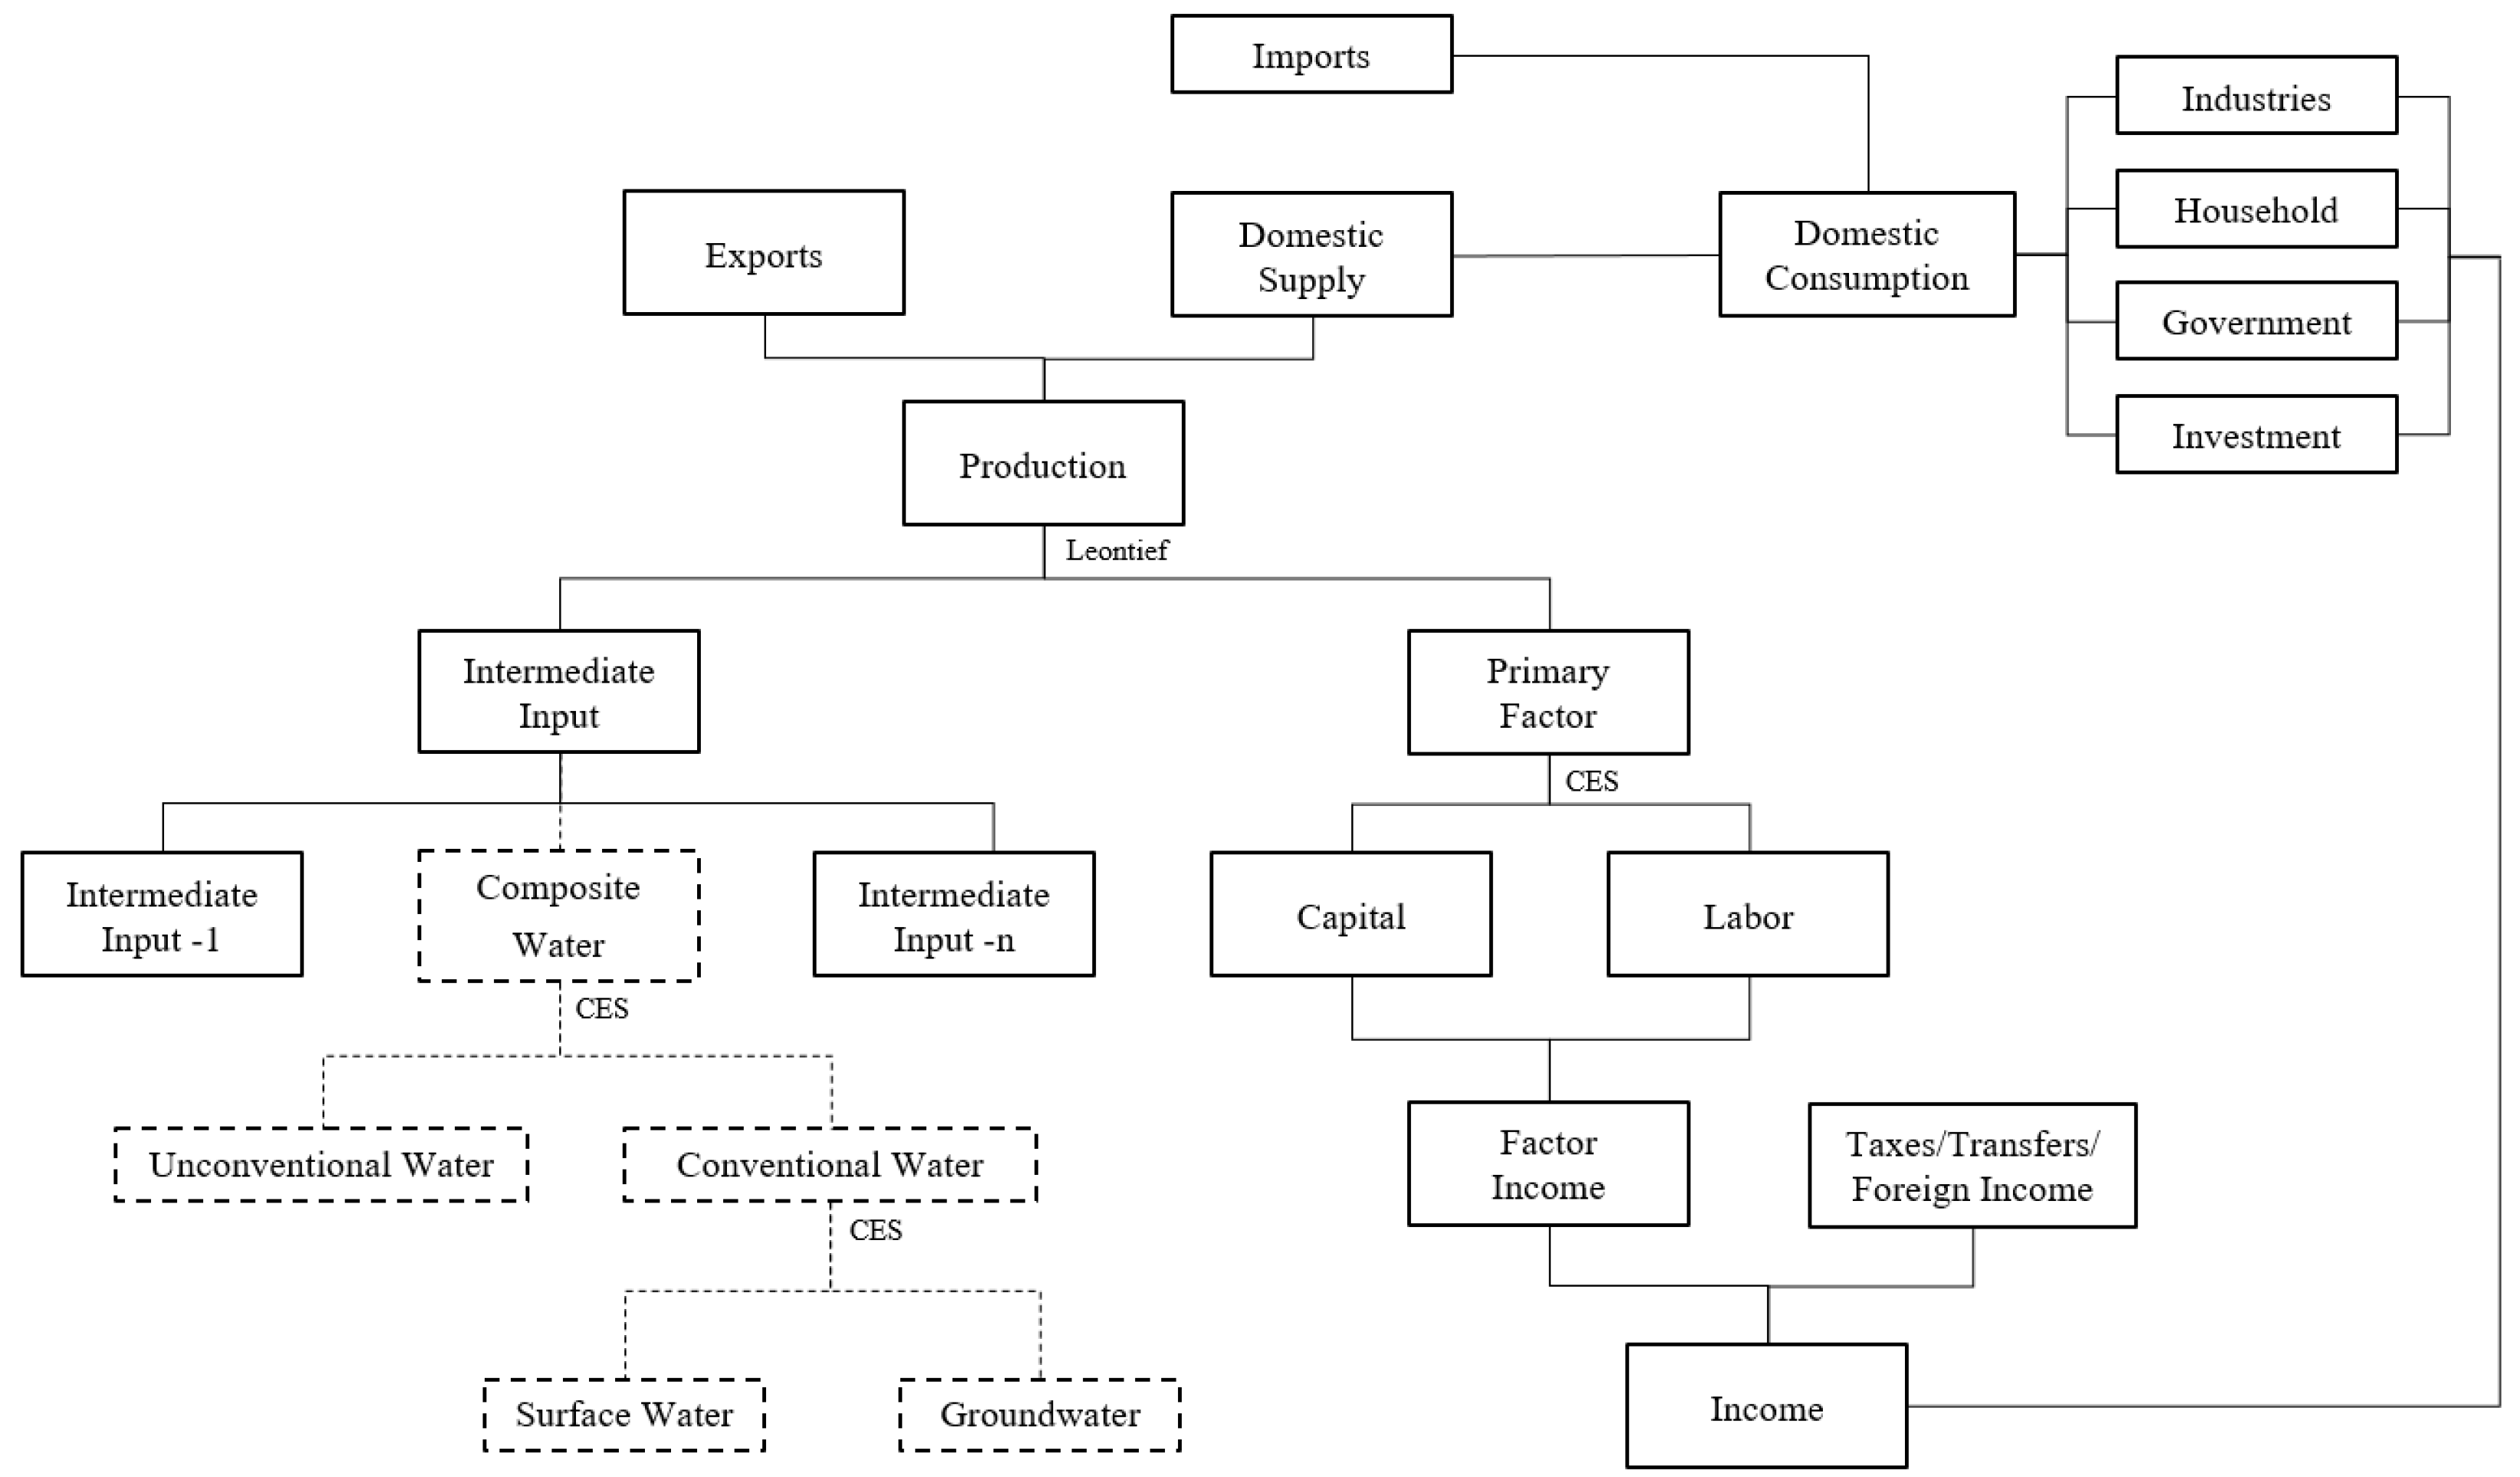
This study adopts a CGE model as the policy analysis tool, and establishes an extended water resources module. Surface water, groundwater, and unconventional water sources are integrated in the model as intermediate inputs, based on Hebei province’s water resource characteristics. Figure 2 provides a schematic of the model structure; the extended water resources module established in this study is represented by the dashed boxes [27].
2.2.1. CGE Model
The CGE model is a widely used tool in policy analysis, covering a large set of simultaneous non-linear equations of economic activities in the economic system, including production, demand, consumption, and income [28]. The variables include the quantity and prices of commodities and factors of production; return on capital; and transportation costs. This system of equations depicts the optimal behavior of economic agents: producers maximize profit under certain cost constraints and technology level, or minimize costs under a certain profit target and technology level; and consumers maximize utility by reasonably choosing a combination of commodities and services within their budget. The system of equations is solved under the constraint of optimal behavior, to obtain the optimal solution for the rational allocation of resources when each market reaches the equilibrium state.
The CGE model allows flexible scenario simulations to analyze changes in certain variables of the economic system caused by policy changes, including changes in the prices and quantities of commodities and factors. This enables an analysis of how certain variables impact changes in other variables and in the entire economic system as a whole.
The ORANI-G model, a practical CGE model for policy analysis, has been widely used in academic research, government policy-making, and other areas [29]. This study adopted the ORANI-G model to establish the CGE model of Hebei. GEMPACK (General Equilibrium Modelling PACKage, developed by Centre of Policy Studies in Melbourne, Australia) software was used to solve the model.
2.2.2. Water Resources Module
CGE models constructed based on an input–output table usually contain only one water sector. As such, they lack the ability to make substitutions among different water sources. Based on Hebei’s water sources, the commodity “water” in the production function is refined into “surface water”, “groundwater,” and “unconventional water”. Based on the substitution intensity of different water commodities, the substitution mechanism between these three types of water is represented using a hierarchical CES function [24], forming the water resource module in Figure 2.
In the model established with the water resource module, the sector output of each industry is the Leontief function of different intermediate inputs (including “composite water”) and primary inputs. The demand for “composite water” is a CES function of “conventional water” and “unconventional water”. The demand for “conventional water” is a CES function of “surface water” and “groundwater”.
The CES function of “conventional water” is expressed as follows:
Equation (1) shows that the demand for conventional water used in sector i is the CES composite of surface water and groundwater. The variable is the sources of conventional water used in sector i. The variable s is the source (s = 1 is surface water; s = 2 is groundwater). The variable is the technological parameters; is the share of different conventional water sources in sector i; and is the constant elasticity of substitution between surface water and groundwater.
The CES function of “composite water” is expressed as follows:
Similar to Equation (1), Equation (2) shows that the demand for composite water used in sector i is the CES composite of conventional water and unconventional water. The variable is the sources of water used in sector i; and s is the source (s = 1 is conventional water; s = 2 is unconventional water). The variable is the technological parameters; is the shares of different water sources in sector i; and is the constant elasticity of substitution between conventional water and unconventional water.
2.3. Basic Data
The basic data adopted in the study included water usage and economic data for Hebei Province. Parameters of the CGE model were assigned according to previous literature and references.
Water usage data were mainly extracted from the 2020 Hebei Water Resources Bulletin [30] published by the Hebei water resources department; water usage data by sectors were further decomposed according to the 2020 Hebei Statistical Yearbook. The water supply volumes by water sources were derived from the Bulletin’s water supply statistics table, and integrated into “surface water”, “groundwater”, and “unconventional water”. The data for “surface water” were derived by combining “local surface water” and “inter-basin transferred water” in the table. The data for “groundwater” were derived from the “groundwater” in the table. The data for “unconventional water” were derived by combining “recycled water” and “other water”. The water usage volumes by sectors were derived from the Bulletin’s water usage statistics table. The water usage data for “Agriculture”, “Industry”, “Construction”, and “Service” sectors were collected, and decomposed into more detailed sectors according to the Computation of Water in the Designated Size Industrial Enterprises by Sector table of the Hebei Statistical Yearbook.
Economic data were mainly extracted from the 42-sector input–output table of Hebei for 2017 and the 2020 Hebei Statistical Yearbook. The input–output table was updated to year 2020 based on data from the 2020 Hebei Statistical Yearbook using the bi-proportional scaling method. Table 1 shows that 42 sectors from the National Economy Industry Classification were merged into 18 model sectors based on sector attributes; the water intensive industries of trade and transport were not merged. The sectors include agriculture, general industries, petroleum, metals, mineral, food, textile, paper, chemical, electricity, surface water industry, groundwater industry, unconventional water industry, construction, trade, transport, general services, and water intensive services.
Model parameters were assigned as follows. The labor demand elasticity was set to 0.243, based on an estimate from the Chinese Academy of Social Sciences [31]. The consumer price elasticity was set to 4.0 [32]. The Frisch parameters were assigned as −2.0 according to the income level of Hebei [33,34]. Other model parameters were adopted from the ORANI-G model database, including the factor substitution elasticity, industry Armington elasticity, and household consumption elasticity.
2.4. Policy Scenarios
Water-saving policy scenarios for different policy objects and types were proposed based on the literature and study area policies, and are detailed in Table 2. The scenario letter “A”, “B”, and “C” denote the policy objects of the primary sector, secondary sector, and tertiary sector, respectively. The scenario numbers “1”, “2”, “3”, and “4” represent policy types: water price, tech improvement, structure adjustment, and water reuse policies, respectively.
Water price policy scenarios were set based on the following. The National Development and Reform Commission and the Ministry of Water Resources issued the National Water Saving Action Plan in 2019. It proposed to comprehensively deepen water price reform. Based on the Huang’s [35] study on the affordability of agricultural water, the water price of grain crops in Hebei province was set at 739.5 CNY per hectare. This is far lower than the general level of affordability, which is 1316.21 CNY per hectare. This indicates there is the potential to increase agricultural water prices. Li [36] found that when water charges make up 3% of the industrial value added, enterprises tend to focus on the water supply. When water charges reach 6.5%, enterprises will focus on water savings. The 2018 Statistical Yearbook of Urban Water Supply indicated that this ratio of water charges to the value added of Hebei’s industrial and service sectors was 0.66% and 0.17%, respectively. This indicates that the water prices in Hebei are generally low. To facilitate comparison between scenarios with different policy objects, a 20% increase in water price was set for all water price policy scenarios.
Tech improvement policy scenarios were set based on a number of targets established by the province. The Hebei Provincial Government issued the Implementation Plan on Accelerating the Development of Water-saving Agriculture in 2021. It proposed encouraging drip irrigation, spray irrigation, and other efficient water-saving technologies, setting aside a 4 million mu water-saving irrigation area by 2025, saving 240 hm3 of groundwater. The Hebei provincial government issued the Full Promotion of the Implementation of the Whole Society Water Conservation in 2021, proposing that the water usage per 10,000 yuan of industrial added value be reduced by 13% by 2025, compared to the 2020 level. The leakage rate of the urban pipe network is targeted to be decreased to 10%.
The structure adjustment policies were set based on the Implementation Plan of the Annual Cultivation Fallow Work in Hebei Province covering recent years and the Beijing-Tianjin-Hebei Industrial Water Conservation Action Plan issued in 2019. Recent changes in the industrial structure were also considered when setting the policy scenario. Policy C3 (structure adjustments across all sectors) combined the policies A3 and B3, and the output loss of these policies were transferred to the tertiary sector.
The water reuse policy was set based on the Beijing-Tianjin-Hebei Industrial Water Conservation Action Plan to increase unconventional water usage by 20%. This target was based on the increasing trend of recycled water usage by industries in Hebei over the years.
3. Results and Discussion
The CGE model to conduct the water-saving policy analysis of Hebei Province was established, and the changes in water usage, sector output, and water usage efficiency under each policy scenario were simulated. Table 3 presents the simulated changes.
3.1. Water Usage
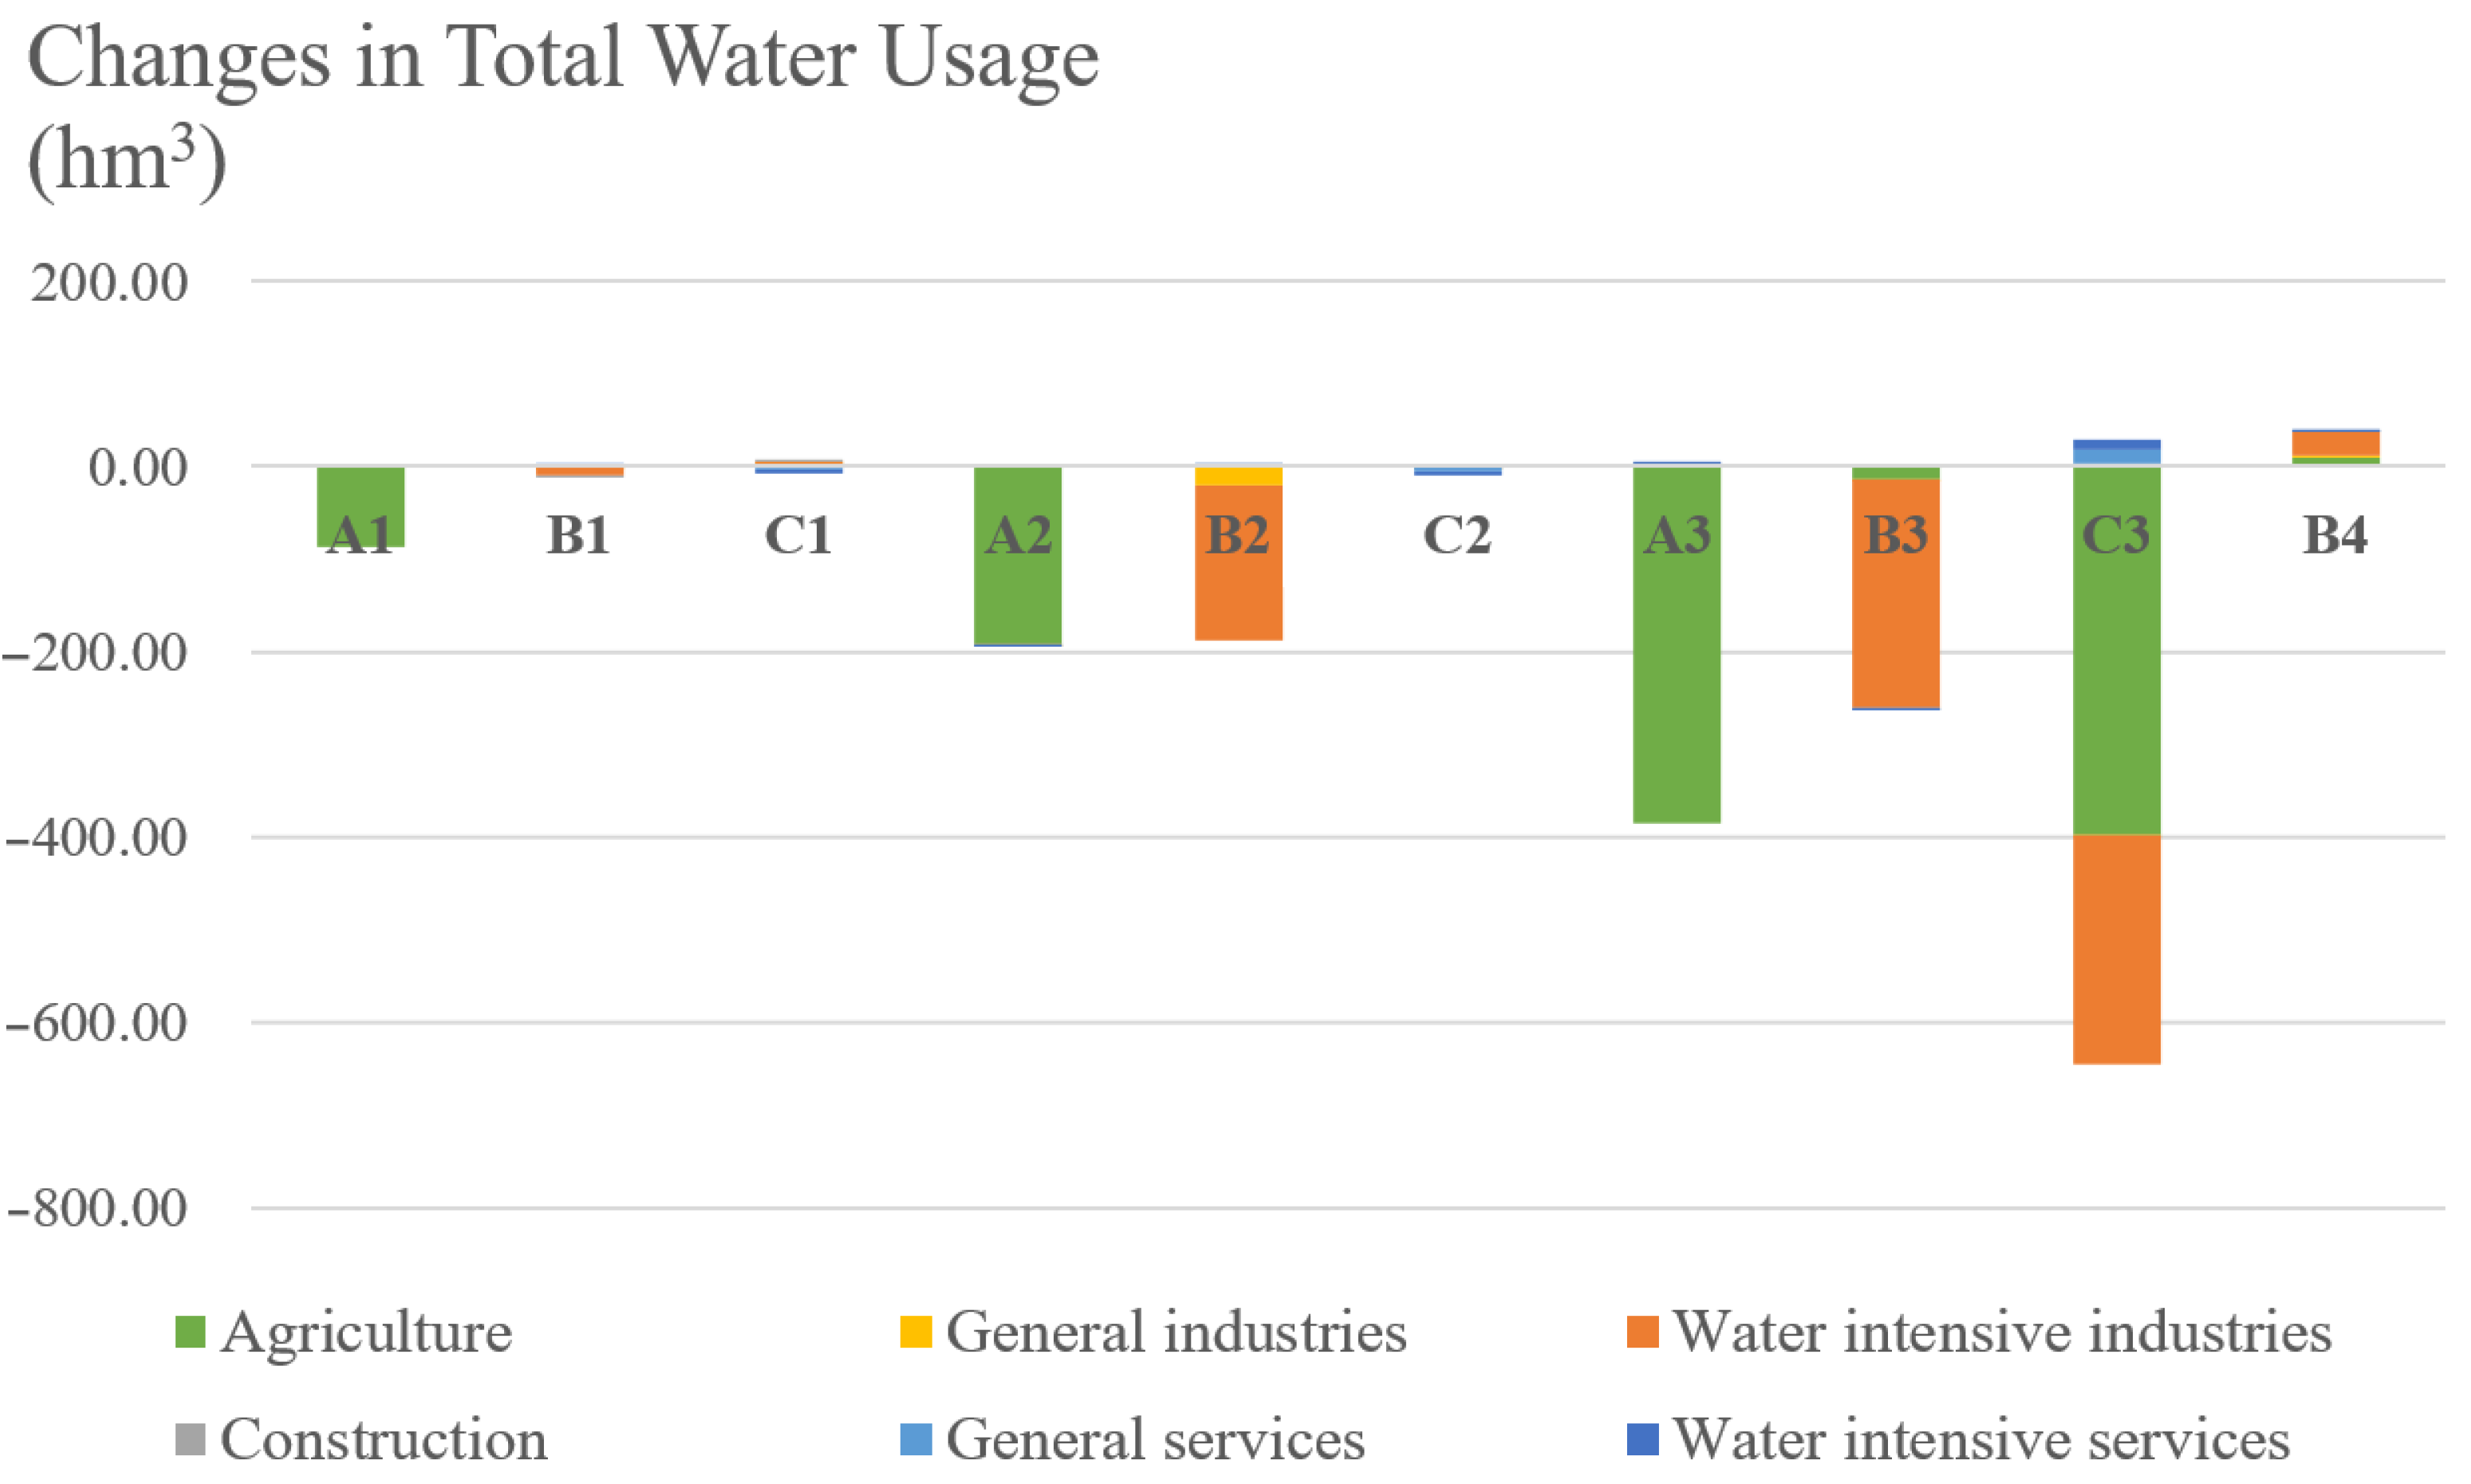
Table 4 and Figure 3 show the changes in total water usage across different industries in response to the different policy scenarios. The water usage of all listed sectors decreases in all scenarios, except for the water reuse scenario B4. For water price scenarios, the change in total water usage ranges from −85.75 to −1.88 hm3. For tech improvement scenarios, the change in total water usage ranges from −191.23 to −9.31 hm3. For structure adjustment scenarios, the change in total water usage ranges from −614.48 to −261.33 hm3. For the water reuse scenario, the total water usage increases by 39.18 hm3 and the unconventional water usage increases by 184.91 hm3.
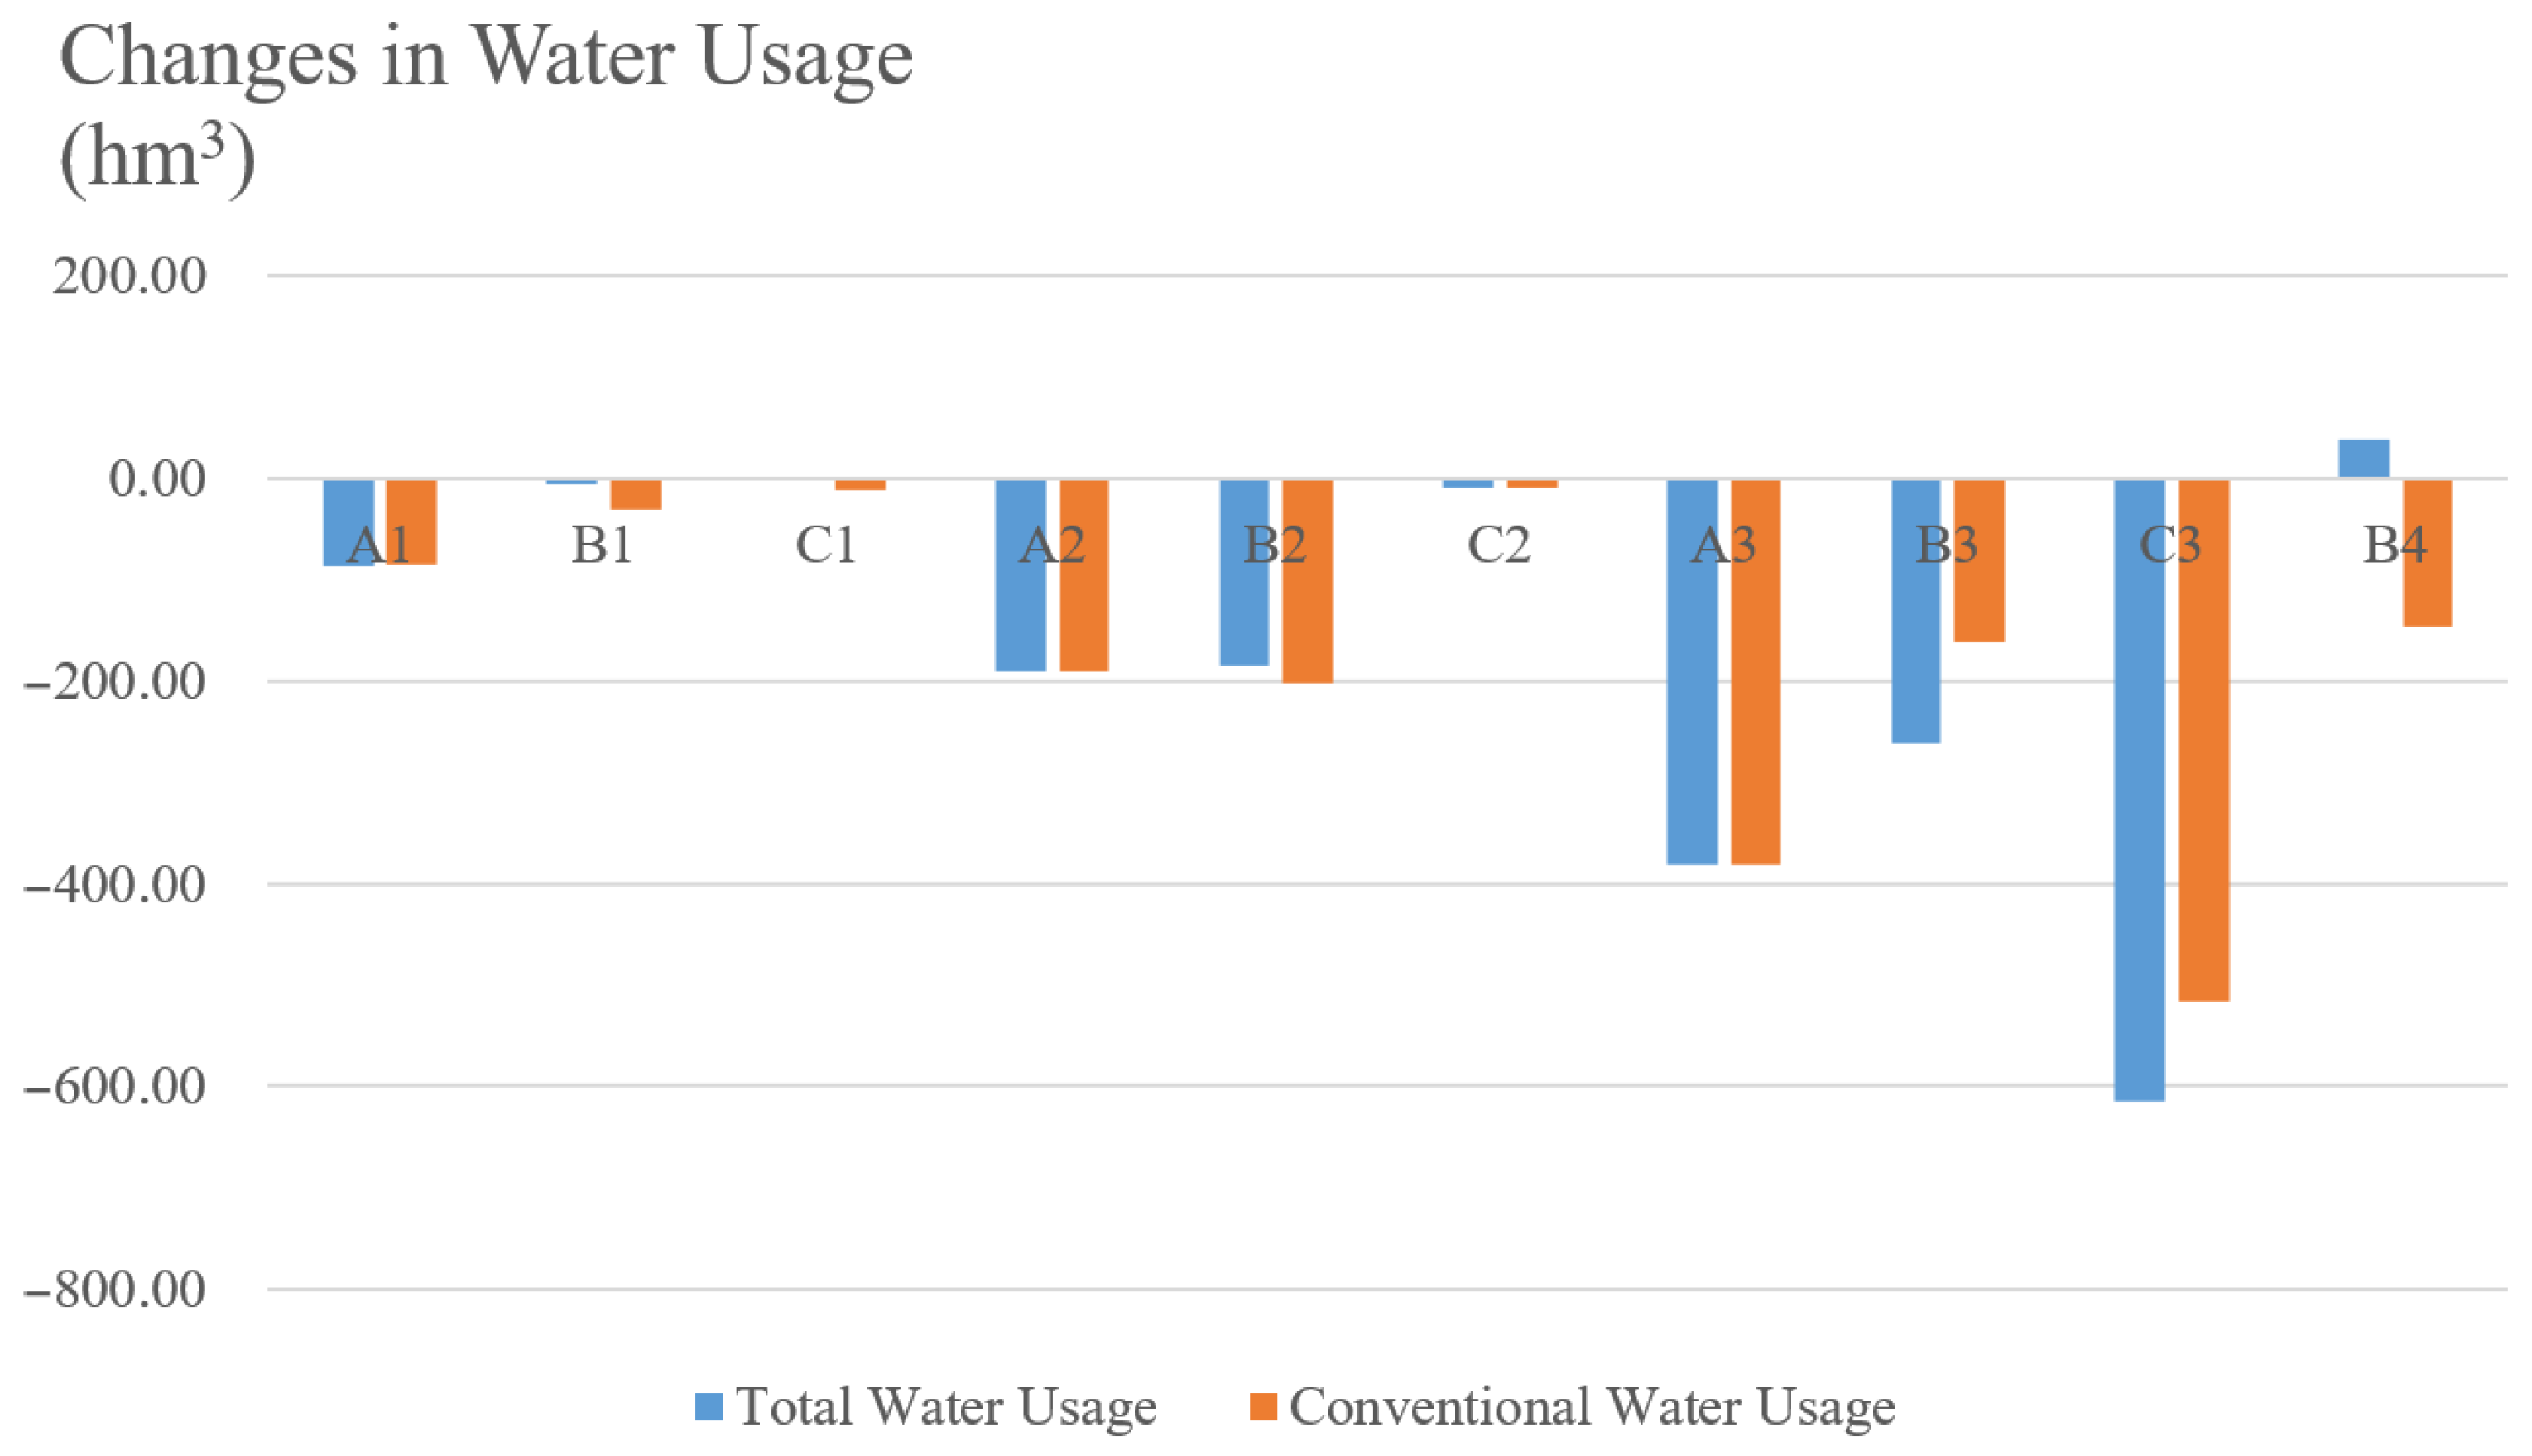
Table 5 and Figure 4 show the changes in water sources for different industries under the different policy scenarios. The use of conventional water sources decreases under all scenarios. For water price scenarios, the change in conventional water usage ranges from −85.66 to −10.81 hm3. For tech improvement scenarios, the change in conventional water usage ranges from −202.93 to −10.14 hm3. For structure adjustment scenarios, the change in conventional water usage ranges from −517.16 to −162.09 hm3. For the water reuse scenario, the conventional water usage decreases by 145.73 hm3.
From the perspective of water-saving effects, the effect generally varies by different policy objects and types. The structure adjustment scenario C3 saves the most water, because this scenario also generates the water-savings amount associated with scenario A3 and B3. The tertiary sectors, whose industries have been transferred from primary and secondary sectors, experience high water efficiency and a minor increase in water usage. Tech improvement and structure adjustment scenarios A3, B3, A2, and B2 save considerable amounts of water, with water-savings amounts exceeding 100 hm3. This is partly because primary and secondary sectors comprise a relatively high proportion of the water usage structure in Hebei. There are no significant water-saving effects under water price scenarios A1, B1, and C1 and the tech improvement of the tertiary sector’s scenario C2. There is a slight increase in the total water usage under scenario B4.
From the perspective of water source structure, the structure generally improves in all scenarios. The water sources structure in the secondary and tertiary sectors includes unconventional water, while the primary sector does not use this source. For water price scenarios, unconventional water usage changes slightly under A1 and increases under scenarios B1 and C1. This is because the demand for surface water and groundwater by the secondary and tertiary sectors can be replaced using unconventional water. For tech improvement, scenario A2 shows the water demand of ground water is shifted to surface water, with the total water usage still decreasing. As for scenarios B2 and C2, the use of surface water and groundwater declines, while the unconventional water usage slightly increases. For the structure adjustment scenarios, due to the shutdown and elimination of water-intensive industries, the corresponding water demand of all water sources declines in proportion to the water sources structure. For the water reuse scenario, a considerable amount of surface water and groundwater can be replaced as the use of unconventional water increases.
3.2. Sector Output
Table 6 and Figure 5 show the changes in sector output from different industries under the different policy scenarios, with the sector output generally varying by different policy objects and types. The sector output is ranked in ascending order (from least to most) as: B3, A3, C1, C3, B4, A2, B1, C2, A1, B2. For water price scenarios, the change in sector output ranges from −10.65 to 59.29 million CNY. For tech improvement scenarios, the change in sector output ranges from 3.31 to 158.09 million CNY. For structure adjustment scenarios, the change in sector output ranges from −131386 to 0 million CNY. For the water reuse scenario, the sector output increases by 1.14 million CNY.
From the perspective of economic effect, the effects of most scenarios are generally positive: tech improvement promotes the economic growth, while the water price policy and structure adjustment may hinder economic growth. More specifically, under the water price policy scenarios, the industry production costs increase. This leads to a decrease in the sector output of the corresponding industries, however, the output from the unshocked industries is expected to increase due to the transfer of capital and labor. The overall sector output increases under water price scenarios A1 and B1, and decreases under water price scenario C1. For tech improvement scenarios, the production cost of the industries decreases. This increases the sector output of the corresponding industry, with other industries also benefitting from the tech improvement. The overall sector output increases under water price scenarios A2, B2, and C2.
The impact on sector output is greater under the structure adjustment scenarios compared to other scenarios. Scenario B3 has a greater negative impact on primary and tertiary sectors, so this scenario should not be adopted on its own, while scenario C3 better eliminates the negative economic impact by shifting the industrial structure to the tertiary sector. This allows water resources to be allocated to high-value industries. For the water reuse scenario, the secondary sector is the main user of the unconventional water, and its output increases as the water supply increases. In contrast, the output from other industries decreases due to the transfer of capital and labor.
3.3. Water Usage Efficiency
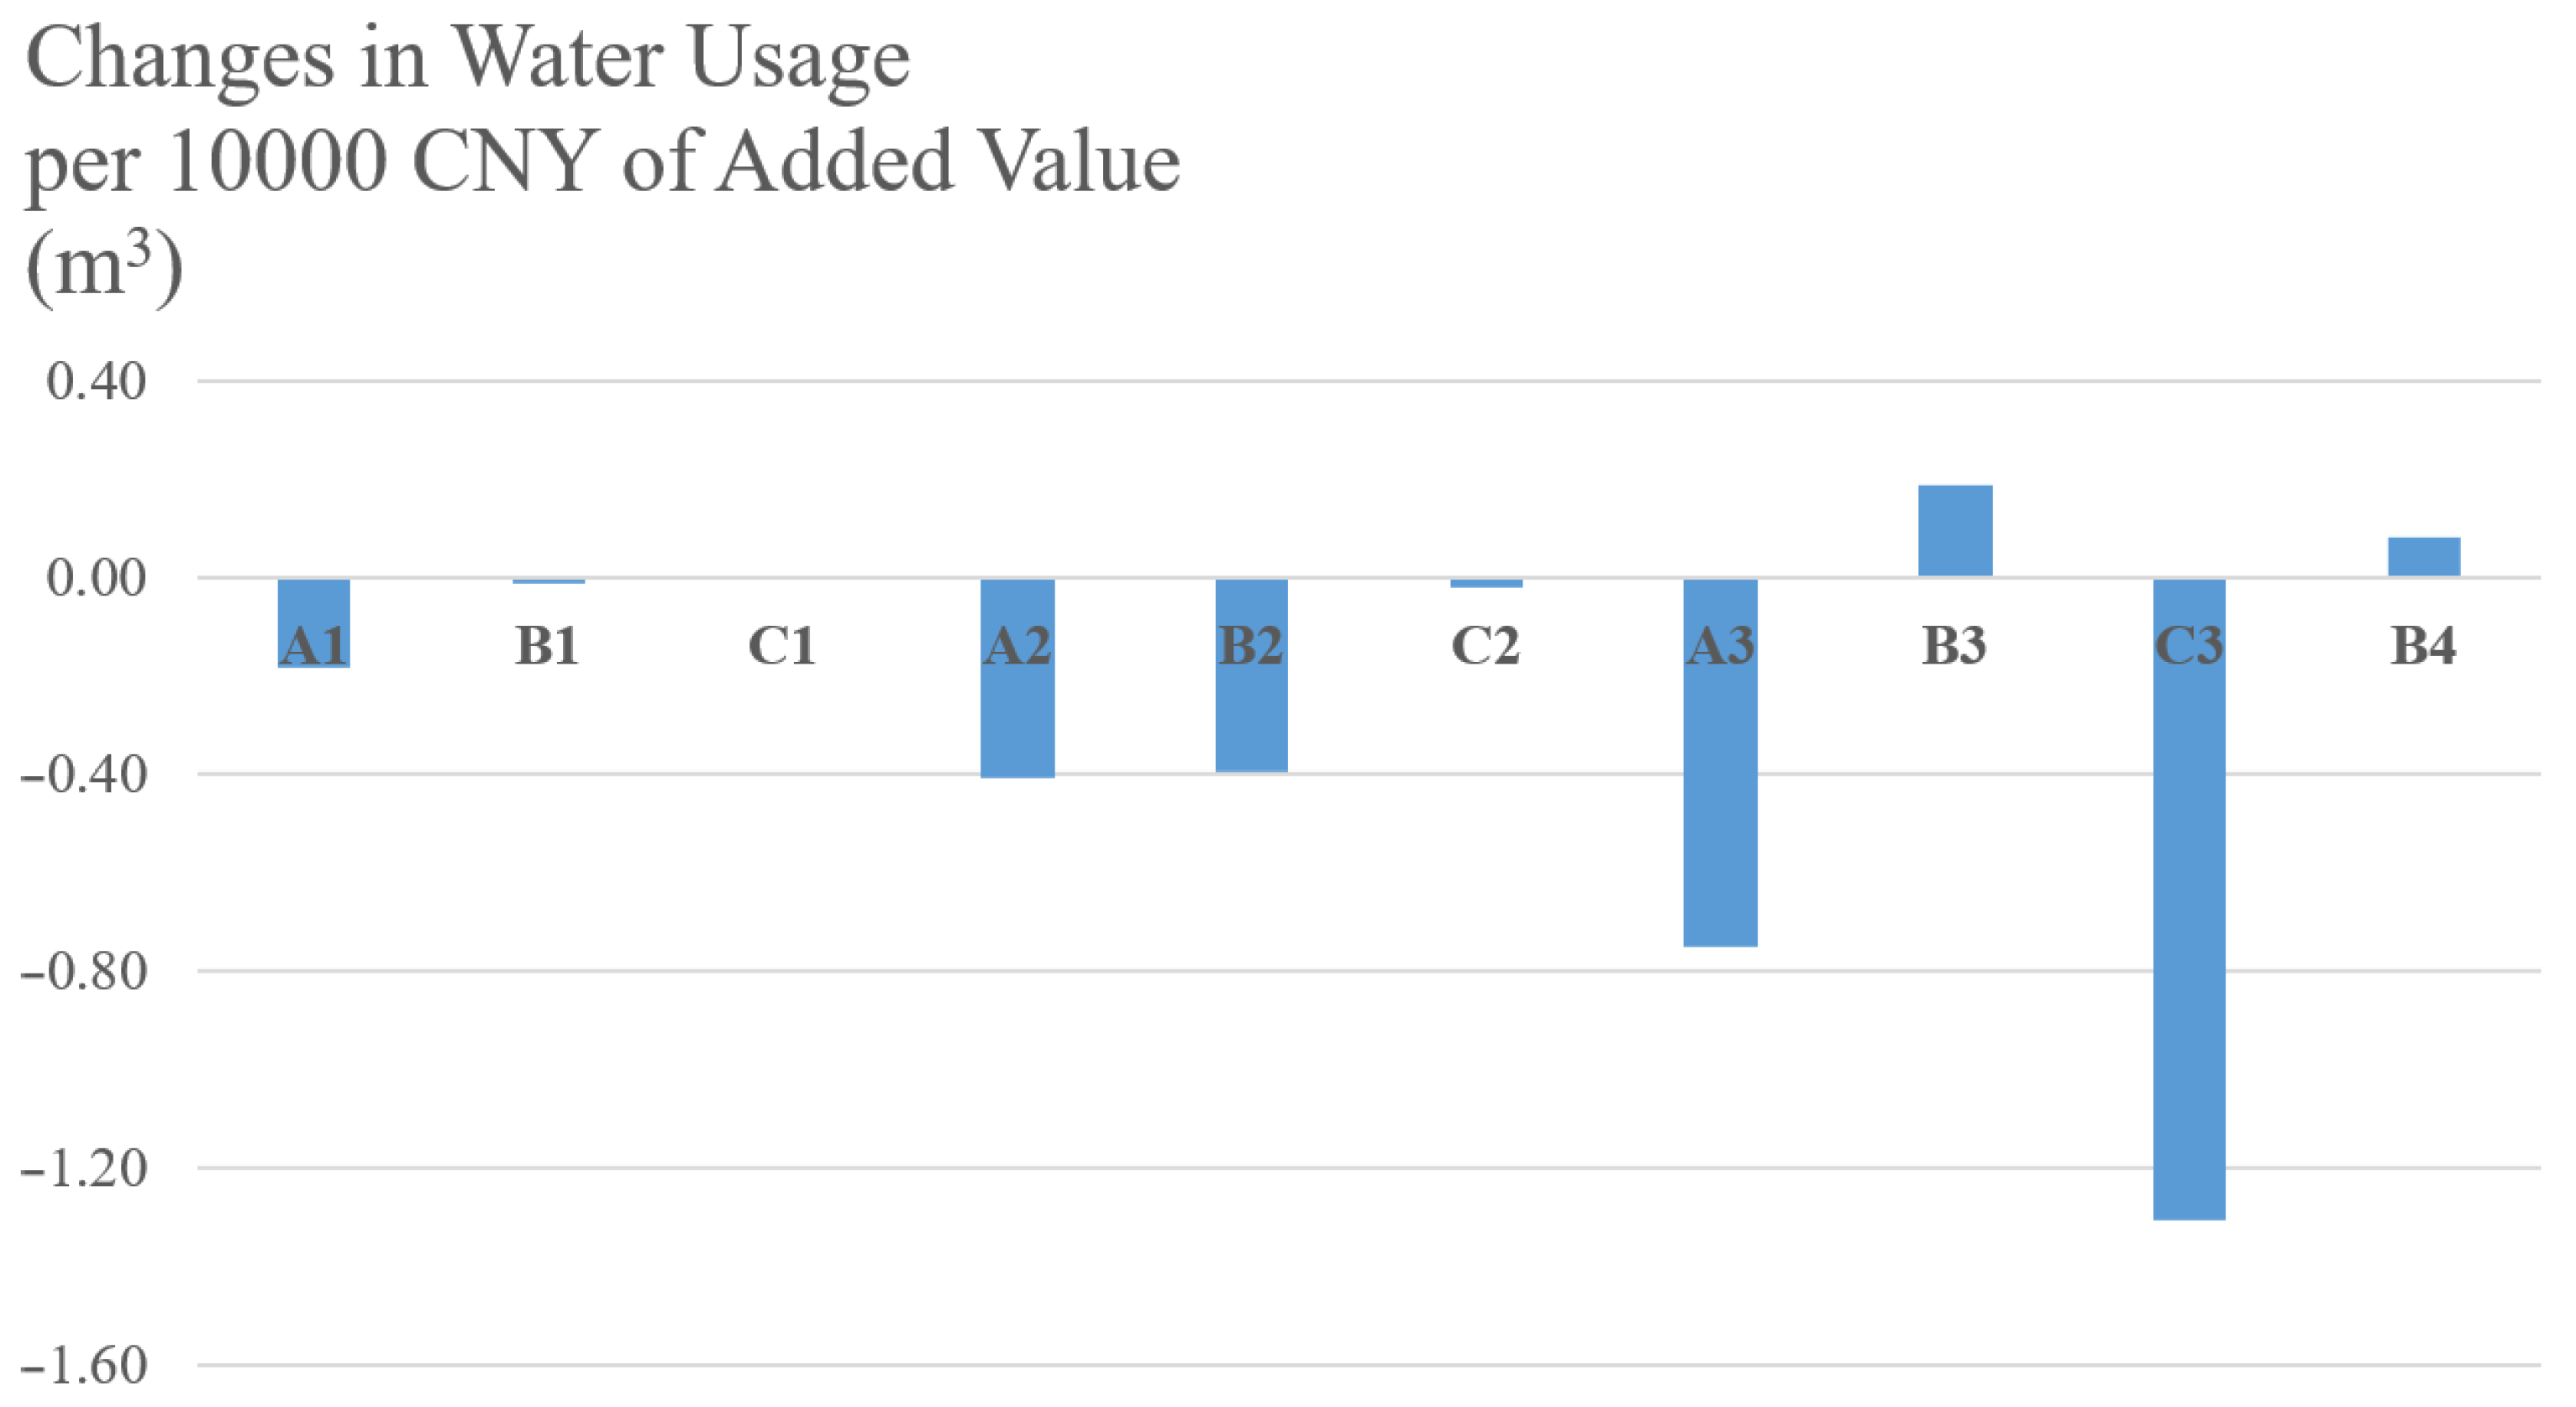
To investigate changes in water usage efficiency under the different policy scenarios, water usage per 10,000 CNY of added value was adopted as the indicator. A lower indicator is associated with a higher level of efficiency. Figure 6 shows the associated changes. For water price scenarios, the change in indicator ranges from −0.18 to 0.00 m3. For tech improvement scenarios, the change in indicator ranges from −0.14 to −0.02 m3. For structure adjustment scenarios, the change in indicator ranges from −1.31 to 0.19 m3. For the water reuse scenario, the indicator increases by 0.08 m3.
From the perspective of water usage efficiency, the water price and tech improvement scenarios improve the efficiency of the corresponding industries, and the overall water usage efficiency also improves. For structure adjustment scenarios, the adjustment of economic structure changes the water usage structure. The water usage efficiency of each individual industry does not change; however, the water resources are transferred to high-efficiency industries, improving the overall water usage efficiency of the economy. The overall water usage efficiency decreases in scenario B3, which is somewhat counter-intuitive. This occurs because of the high proportion of agriculture in the water usage structure of Hebei Province, and the fact that water intensive industries are more water-efficient compared to agriculture. As such, the relocation of water intensive industries makes the regional water usage structure more underdeveloped. For the water reuse scenario, the amount of unconventional water increases, part of the conventional water demand is replaced, and the overall water usage is increased. As such, the water usage efficiency changes slightly.
3.4. Policy Comparison
When comparing the water-saving effects between policy objects, for water price scenarios, the water-saving effect is highest for A1, followed by B1, followed by C1. The price elasticity of the primary sector is far lower than the secondary and tertiary sectors, and water price scenario A1 still saves the most water. This is because agricultural water usage accounts for a large proportion of the total water usage in Hebei Province. Overall, the water price policy has a limited effect in saving water compared to other policies.
For tech improvement scenarios, the water-saving effects of A2 and B2 are higher than C3. This may be due to the intensity and realizability of policy design. Agricultural and industrial water-saving technology improvement can more feasibly achieve water savings, while limited water savings are achieved by controlling leaks in the urban pipe network.
For structure adjustment scenarios, there are considerable water savings effects under scenarios A3 and B3. Scenario C3 results in a limited increase in total water usage compared to the sum of A3 and B3, indicating that the transfer of industries to the tertiary sectors can save water.
For the water reuse scenario, the amount of total water usage increases 39.18 hm3, while the conventional water usage decreases 145.73 hm3, indicating that water savings have a greater effect than the water price policy.
When comparing the water-saving effects between policy types, for the primary sector, the change in total water usage is highest for scenario A3, followed by A2, and then A1; the change in added value is highest for A1, followed by A2, and then A3. In general, scenario A2 is most appropriate for the primary sector. Scenario A3 has a greater negative impact on agricultural output and should not be used alone.
For the secondary sector, the change in total water usage is highest for B3, followed in descending order by B2, B1, and B4; the change in conventional water usage is highest for B2, followed in descending order by B3, B4, and B1. Scenario B1′s water-saving effect is very limited, with the highest change in added value seen in B2, followed by B1 and B3. Scenario B3 has a greater impact on industrial output and should not be used alone. In general, Scenario B2 is most appropriate for the secondary sector, while scenario B4 is appropriate as a supplementary measure. Scenario B3 has a greater negative impact on industrial output and should not be adopted alone.
For the tertiary sector, the change in total water usage is highest for C3, followed by C2 and then C1, with the water-saving effect being very limited with C2 and C1. The change in added value is highest for C2, followed by C3 and C1. In general, Scenario C2 is most appropriate for the tertiary sector.
In general, the study recommends that Hebei Province adopt the following policies: agricultural tech improvement policy A2, industrial tech improvement policy B2, industrial water reuse policy B4, and structure adjustment policy C3.
3.5. Comparison with Previous Studies
This study compared the impacts of water-saving policies on water resources and economic outcomes in terms of the policy type and the policy object. The findings were consistent with previous studies across China. The study concluded that water pricing policies can encourage water savings [24], but the impact is limited, which is consistent with other studies [37,38]. The study concluded that structure adjustment and tech improvements are effective policies for water saving, and that structure adjustment policy has a decisive role in optimizing the water usage structure and improving water use efficiency. This is also consistent with previous studies [39,40]. The study concluded that structure adjustment and tech improvement have a positive impact, while the water pricing policies has a negative impact on economy. This is consistent with other studies [41].
Compared with previous studies, which consider the impact of seasonal changes related to water supply and water quality [42,43], this study mainly considers the macro impact of a water saving policy, and did not analyze the relation between economy, water quantity and quality. This refinement in the model to address both water source and timing, is an opportunity for future research.
In general, compared with previous approaches, this study improves the mechanism associated with assessing the economic impact of water resources in the CGE model and provides a more sophisticated analytical tool for water policy research. If sufficient economic and water usage data are available, this method can be applied to simulate and evaluate water-saving policies in other areas.
4. Conclusions
This study uses Hebei Province, China, as a case study to assess the impacts of water saving policies using an improved CGE model. The study included simulations that assess the impact of different water saving policies on water resources and the economy, providing data to compare and discuss the differences between different types of policies in different sectors. The findings provide a reference for the development of water resources management policies in Hebei Province, and highlight this new approach for water policy research.
The main findings of the study are as follows.
(1) The study establishes a CGE model with an extended water resources module and uses the CES function to represent the substitution mechanism of different water resources. The model reflects the input–output relationship of water resources in the economic system, and simulates the changes in the supply and demand of different types of water resources and the changes in industry output under the water policy scenarios. This provides a quantitative assessment tool to assess the impact of water policy.
(2) The study establishes 10 sets of water-saving policy scenarios, evaluating four types of policies and different policy objects, including water price, tech improvement, structure adjustment, and water reuse policies in primary, secondary, and tertiary sectors. The CGE model is used to simulate the changes in water usage, sector output, and water usage efficiency under each scenario.
(3) The study compares and discusses the difference between policy scenarios, concluding that the following scenarios are most recommended: an agricultural technology improvement policy that decreases groundwater usage by 240 hm3; an industrial tech improvement policy under which water usage per 10,000 CNY of industrial added value decreases by 13%; an industrial water reuse policy to increase the unconventional water usage by 20%; and a structure adjustment policy to increase the proportion of the tertiary sector.
(4) The study concluded that the water price policy has a limited effect on water saving, and that structure adjustment and tech improvement are effective policies for water saving.
This study has some limitations that should be addressed in future research. Due to a lack of data, the water usage data of sectors used in this study are decomposed based on data in the statistical yearbook. This may affect the accuracy of the results. Further, the study analyzed the impact of the policies, but did not consider their costs. Finally, the study did not consider the seasonal differences of the water resources (i.e., water supply and water quality), presenting an opportunity for future model development.
Despite these limitations, this study provides an analysis tool for water resources policy simulation that can be useful for evaluating water resource management alternatives and associated decision making.
Author Contributions
Conceptualization, H.N. and X.L.; Methodology, X.L.; Formal Analysis, G.C.; Funding Acquisition, G.C.; Validation, Y.W.; Writing—Original Draft Preparation, X.L.; Visualization, Y.W.; Writing—Review and Editing, X.L. and P.R.; Supervision, H.N.; Project Administration, H.N. All authors have read and agreed to the published version of the manuscript.
Funding
This research was funded by the Basal Research Fund of China Institute of Water Resources and Hydropower Research, grant number 01882205.
Institutional Review Board Statement
Not applicable.
Informed Consent Statement
Not applicable.
Data Availability Statement
The data presented in this study are available on request from the corresponding author.
Conflicts of Interest
The authors declare no conflict of interest.
References
- Sustainable Development Strategy Research Group; Chinese Academy of Sciences. China Sustainable Development Strategy Report 2007—Water: Governance and Innovation; Science Press: Beijing, China, 2007; ISBN 978-7-03-018603-4. [Google Scholar]
- Zhang, H.; Jin, G.; Yu, Y. Review of river basin water resource management in China. Water 2018, 10, 425. [Google Scholar] [CrossRef] [Green Version]
- Goonetilleke, A.; Liu, A.; Gardner, T. Urban Stormwater Reuse: An Agenda for Sustainable Development; Global Sustainable Development Report; Brief for GSDR–2016 Update; United Nations: New York, NY, USA, 2016. [Google Scholar]
- Carroll, S.; Liu, A.; Dawes, L.; Hargreaves, M.; Goonetilleke, A. Role of land use and seasonal factors in water quality degradation. Water Resour. Manag. 2013, 27, 3433–3440. [Google Scholar] [CrossRef] [Green Version]
- McDonald, R.I.; Webera, K.; Padowskib, J.; Flörkec, M.; Schneiderc, C.; Greend, P.A.; Gleesone, T.; Eckmanf, S.; Lehnerg, B.; Balkh, D.; et al. Water on an urban planet: Urbanization and the reach of urban water infrastructure. Glob. Environ. Change 2014, 27, 96–105. [Google Scholar] [CrossRef] [Green Version]
- United Nations General Assembly. Water for a Sustainable World; The United Nations World Water Development Report; United Nations: New York, NY, USA, 2015. [Google Scholar]
- Goonetilleke, A.; Vithanage, M. Water resources management: Innovation and challenges in a changing world. Water 2017, 9, 281. [Google Scholar] [CrossRef]
- Hao, L.; Sun, G.; Liu, Y.; Qian, H. Integrated modeling of water supply and demand under management options and climate change scenarios in Chifeng City, China. JAWRA J. Am. Water Resour. Assoc. 2015, 51, 655–671. [Google Scholar] [CrossRef]
- Bharati, L.; Smakhtin, V.U.; Anand, B.K. Modeling water supply and demand scenarios: The Godavari–Krishna inter-basin transfer, India. Water Policy 2009, 11, 140–153. [Google Scholar] [CrossRef] [Green Version]
- Nesheim, I.; Sundnes, F.; Enge, C.; Graversgaard, M.; van den Brink, C.; Farrow, L.; Glavan, M.; Hansen, B.; Leitão, I.A.; Rowbottom, J.; et al. Multi-actor platforms in the water–agriculture Nexus: Synergies and long-term meaningful engagement. Water 2021, 13, 3204. [Google Scholar] [CrossRef]
- Castelletti, A.; Yajima, H.; Giuliani, M.; Soncini-Sessa, R.; Weber, E. Planning the optimal operation of a multi-outlet water reservoir with water quality and quantity targets. J. Water Resour. Plan. Manag. 2013, 140, 496–510. [Google Scholar] [CrossRef] [Green Version]
- Ober, J.; Karwot, J.; Rusakov, S. Tap water quality and habits of its use: A comparative analysis in Poland and Ukraine. Energies 2022, 15, 981. [Google Scholar] [CrossRef]
- Nasir, J.; Ashfaq, M.; Baig, I.A.; Punthakey, J.F.; Culas, R.; Ali, A.; Hassan, F.U. Socioeconomic impact assessment of water resources conservation and management to protect groundwater in Punjab, Pakistan. Water 2021, 13, 2672. [Google Scholar] [CrossRef]
- Liu, J.G.; Zhao, X.; Yang, H.; Liu, Q.Y.; Xiao, H.L.; Cheng, G.D. Assessing China’s developing a water-saving society policy at a river basin level: A structural decomposition analysis approach. J. Clean. Prod. 2018, 190, 799–808. [Google Scholar] [CrossRef]
- Mardiste, P.; Martoussevitch, A. European Union Water Initiative National Policy Dialogues Progress Report 2013; United Nations: Geneva, Switzerland, 2014. [Google Scholar]
- Dudley, N.J. Volume sharing of reservoir water. Water Resour. Res. 1988, 24, 641–648. [Google Scholar] [CrossRef]
- Brennan, D.C.; Scoccimarro, M. Issues in defining property rights to improve Australian water markets. Aust. J. Agric. Resour. Econ. 2002, 43, 69–89. [Google Scholar] [CrossRef] [Green Version]
- Gilmour, J.K.; Letcher, R.A.; Jakeman, A.J. Analysis of an integrated model for assessing land and water policy options. Math. Comput. Simul. 2005, 69, 57–77. [Google Scholar] [CrossRef]
- Liu, M.C.; Yang, L.; Min, Q.W. Water-saving irrigation subsidy could increase regional water consumption. J. Clean. Prod. 2019, 213, 283–288. [Google Scholar] [CrossRef]
- Li, J.W.; Wu, Z.; Tian, G.L. Research on water resources pricing model under the water resources–economic high-quality development coupling system: A case study of Hubei Province, China. Water Policy 2022, 24, 363–381. [Google Scholar] [CrossRef]
- Wu, Z. Initial Water Right Allocation and Water Rights Trading Model of Urban and Rural Areas. Master’s Thesis, Wuhan University, Wuhan, China, 2017. [Google Scholar]
- Horridge, M.; Madden, J.; Wittwer, G. The impact of the 2002–2003 drought on Australia. J. Policy Modeling 2005, 27, 285–308. [Google Scholar] [CrossRef]
- Shan, F.; Duan, Z. Water embedded CGE model to assess impacts of south to north water transfer to recipient region. IFAC Proc. Vol. 2005, 38, 54–59. [Google Scholar] [CrossRef] [Green Version]
- Zhao, J.; Ni, H.; Peng, X.; Li, J.; Chen, G.; Liu, J. Impact of water price reform on water conservation and economic growth in China. Econ. Anal. Policy 2016, 51, 90–103. [Google Scholar] [CrossRef]
- Kang, J. Impact Analysis and Subsidy Scheme of Agricultural Water Price Adjustment in Arid Areas. Ph.D. Thesis, China Institute of Water Resources and Hydropower Research, Beijing, China, 2021. [Google Scholar]
- Cui, Z. Following new development concept and taking comprehensive measures for groundwater overdraft reduction in Hebei Province. China Water Resour. 2020, 13, 40–42. [Google Scholar] [CrossRef]
- Lin, X.; Zhang, Z.; Ni, H.; Chen, G.; Ni, G.; Sang, X.; Wang, Y. Impact of water rights transaction in the Beijing-Tianjin-Hebei region in china based on an improved computable general equilibrium model. Water 2021, 13, 2722. [Google Scholar] [CrossRef]
- Bhattacharya, A.; Ghosh, J.; Tezuka, T.; Bhattacharya, T. Assessment of low carbon transport for sustainable development in Bhutan: A general equilibrium approach. Int. J. Public Policy 2018, 14, 64–103. [Google Scholar] [CrossRef]
- Horridge, M. ORANI-G: A General Equilibrium Model of the Australian Economy; Centre of Policy Studies: London, UK; IMPACT Project: Clayton, Australia, 2000; ISBN 0-7326-15232. [Google Scholar]
- Ding, X. Hebei Water Resources Bulletin 2020; Hebei Water Resources Bulletin Editorial Department: Shijiazhuang, China, 2020. [Google Scholar]
- Zhen, Y.; Fan, M. CGE Model and Policy Analysis in China; Social Sciences Academic Press: Beijing, China, 1999; ISBN 978-7-8014-9136-7. [Google Scholar]
- Ni, H.; Wang, H.; Li, J.; Zhang, C.; Zhao, J. Study on Water Supply Price System; China Waterpub Press: Beijing, China, 2016; ISBN 978-7-5170-4157-3. [Google Scholar]
- Liu, J.; Ni, H.; Wang, D.; Huang, X. Analysis of economic effects of Tianjin water resources based on CGE model. J. China Inst. Water Resour. Hydropower Res. 2012, 10, 192–198. [Google Scholar] [CrossRef]
- Shen, D.; Liang, R.; Wang, H.; Yang, X. Theory and Practice of Water Price; The Science Publishing Company: Beijing, China, 1999; ISBN 978-7-0300-7710-3. [Google Scholar]
- Huang, R.; Chen, G.; Wang, D.; Ni, H.; Lin, X.; Qu, Y. Study on affordability of agricultural water price in China. Water Resour. Hydropower Eng. 2022, 53, 1–15. [Google Scholar] [CrossRef]
- Li, C. Analysis on water price bearing capacity of water users of South-to-North Water Transfer Project. Inn. Mong. Sci. Technol. Econ. 2010, 16, 43–45. [Google Scholar] [CrossRef]
- Fan, J.L.; Kong, L.S.; Zhang, X. Synergetic effects of water and climate policy on energy-water nexus in China: A computable general equilibrium analysis. Energy Policy 2018, 123, 308–317. [Google Scholar] [CrossRef]
- Hu, X.; Tang, L.; Liu, Y.; Dong, X. Effectiveness of industrial water price leverage: Based on simultaneous equation model. J. Nat. Resour. 2020, 35, 413–424. [Google Scholar] [CrossRef]
- Chen, W.; Wang, X. Technology progress structure shift and water intensity in Chinese industry: An analysis based on LMDI method. J. Hunan Univ. (Soc. Sci.) 2011, 25, 68–72. [Google Scholar] [CrossRef]
- Guo, L.; Zhang, S. Analysis of industrial water saving and contribution of industrial structure adjustment to water saving in Beijing City. Haihe Water Resour. 2004, 3, 55–58. [Google Scholar] [CrossRef]
- Bai, H.; Tang, K.; Zhang, H.; Yu, Z. Water policy and regional economic development: Evidence from Henan province, China. Water Policy 2021, 23, 397–416. [Google Scholar] [CrossRef]
- Du, L.J.; Chen, G.F.; Liu, C.S.; Wang, X.N.; Liu, J.L.; Wang, H.L. GWAS model-based optimal allocation of water resources in irrigation district. Water Resour. Hydropower Eng. 2020, 51, 26–35. [Google Scholar] [CrossRef]
- Liu, D.H.; Ji, X.X.; Tang, J.F.; Li, H.Y. A fuzzy cooperative game theoretic approach for multinational water resource spatiotemporal allocation. Eur. J. Oper. Res. 2020, 282, 1025–1037. [Google Scholar] [CrossRef]
Figure 1.
Location and basic information about Hebei Province.

Figure 2.
Schematic of the model structure [27].
Figure 2.
Schematic of the model structure [27].

Figure 3.
Changes in total water usage of different industries under policy scenarios.

Figure 4.
Changes in water sources for different industries under policy scenarios.

Figure 5.
Changes in sector output of different industries under policy scenarios.

Figure 6.
Changes in water usage per 10,000 CNY of added value.

Figure 7.
Comparison of water usage under policy scenarios.

Figure 8.
Comparison of sector output under policy scenarios.


Table 1.
Model sectors.
| Sector Classification | Model Sectors | National Economy Industry Classification |
|---|---|---|
| Primary Sector | Agriculture | Agriculture, Forestry, Animal Husbandry, and Fishery |
| Secondary Sector | General industries | Mining and washing of coal; Manufacture of leather, fur, feather, and related products; Processing of timber and furniture; Manufacture of metal products; Manufacture of general purpose machinery; Manufacture of special purpose machinery; Manufacture of transport equipment; Manufacture of electrical machinery and equipment; Manufacture of communication equipment, computers, and other electronic equipment; Manufacture of measuring instruments; Other manufacturing and comprehensive use of waste resources; Repair of metal products, machinery, and equipment; Production and distribution of gas |
| Petroleum | Extraction of petroleum and natural gas; Processing of petroleum, coking, processing of nuclear fuel | |
| Metals | Mining and processing of metal ores; Smelting and processing of metals | |
| Mineral | Mining and processing of nonmetal and other ores; Manuf. of non-metallic mineral products | |
| Food | Food and tobacco processing | |
| Textile | Textile industry | |
| Paper | Manufacture of paper, printing, and articles for culture, education, and sport activity | |
| Chemical | Manufacture of chemical products | |
| Electricity | Production and distribution of electric power and heat power | |
| Surface water industry | Production and distribution of tap water | |
| Groundwater industry | Production and distribution of tap water | |
| Unconventional water industry | Production and distribution of tap water | |
| Construction | Construction | |
| Tertiary Sector | Trade | Wholesale and retail trades |
| Transport | Transport, storage, and postal services | |
| General services | Administration of water, environment, and public facilities; finance; information transfer, software and information technology services; leasing and commercial services; real estate; scientific research and polytechnic services | |
| Water intensive services | Accommodation and catering; culture, sports, and entertainment; education; health care and social work; public administration, social insurance, and social organizations; resident, repair, and other services |
Table 2.
Policy scenario details.
| Scenario Number | Policy Object | Policy Type | Scenario Details |
|---|---|---|---|
| A1 | Primary Sector | Water Price | Conventional water price of primary sector increased by 20% |
| A2 | Primary Sector | Tech Improvement | Groundwater used by primary sector decreased by 240 hm3 |
| A3 | Primary Sector | Structure Adjustment | Output of primary sector decreased by 4% |
| B1 | Secondary Sector | Water Price | Conventional water price of secondary sector increased by 20% |
| B2 | Secondary Sector | Tech Improvement | Water usage per 10,000 CNY of industrial added value decreased by 13% |
| B3 | Secondary Sector | Structure Adjustment | Proportion of water-intensive industrial output to GDP decreased by 2% |
| B4 | Secondary Sector | Water Reuse | Unconventional water usage increased by 20% |
| C1 | Tertiary Sector | Water Price | Conventional water price of tertiary sector increased by 20% |
| C2 | Tertiary Sector | Tech Improvement | Water usage efficiency of tertiary sector increased by 2% |
| C3 | All Sectors | Structure Adjustment | Combining policy A3 and B3; Output loss of policy A3 and B3 transferred to tertiary sector |
Table 3.
Changes in water usage, sector output, and water usage efficiency under policy scenarios.
| Scenarios | A1 | B1 | C1 | A2 | B2 | C2 | A3 | B3 | C3 | B4 |
|---|---|---|---|---|---|---|---|---|---|---|
| Total Water Usage (hm3) | −85.75 | −6.40 | −1.88 | −191.23 | −185.54 | −9.31 | −381 | −261 | −614 | 39.18 |
| Conventional Water Usage (hm3) | −85.66 | −31.51 | −10.81 | −191.22 | −202.93 | −10.14 | −383 | −162 | −517 | −145.73 |
| Sector Output (Million CNY) | 59.29 | 8.60 | −10.65 | 3.31 | 158.09 | 35.60 | −10,641 | −131,386 | 0 | 1.14 |
| Water Usage per 10,000 CNY of Added Value (m3) | −0.18 | −0.01 | 0.00 | −0.41 | −0.40 | −0.02 | −0.75 | 0.19 | −1.31 | 0.08 |
Table 4.
Changes in total water usage of different industries under policy scenarios.
| Scenarios | A1 | B1 | C1 | A2 | B2 | C2 | A3 | B3 | C3 | B4 |
|---|---|---|---|---|---|---|---|---|---|---|
| Agriculture | −85.90 | 2.06 | 4.41 | −191.21 | 1.54 | 0.32 | −385.25 | −12.68 | −396.86 | 9.76 |
| General industries | 0.01 | −1.08 | 0.07 | −0.00 | −20.10 | −0.00 | 0.38 | −0.40 | −0.34 | 1.38 |
| Water intensive industries | 0.08 | −7.59 | 0.58 | −0.01 | −167.15 | 0.06 | 2.02 | −246.69 | −246.60 | 26.56 |
| Construction | 0.00 | −0.00 | 0.00 | −0.00 | 0.00 | −1.07 | 0.01 | −0.00 | 2.87 | 0.01 |
| General services | 0.03 | 0.11 | −3.57 | −0.00 | 0.09 | −4.91 | 0.56 | −0.82 | 15.08 | 0.76 |
| Water intensive services | 0.03 | 0.11 | −3.38 | −0.00 | 0.09 | −3.70 | 0.96 | −0.73 | 11.38 | 0.71 |
| Total | −85.75 | −6.40 | −1.88 | −191.23 | −185.54 | −9.31 | −381.33 | −261.33 | −614.48 | 39.18 |
Table 5.
Changes in water sources of different industries under policy scenarios.
| Scenarios | A1 | B1 | C1 | A2 | B2 | C2 | A3 | B3 | C3 | B4 |
|---|---|---|---|---|---|---|---|---|---|---|
| Conventional Water | −85.66 | −31.51 | −10.81 | −191.22 | −202.93 | −10.14 | −382.57 | −162.09 | −517.16 | −145.73 |
| Conventional Water-Surface Water | −43.77 | −16.13 | −7.35 | 48.78 | −103.19 | −5.94 | −190.17 | −84.23 | −260.38 | −73.92 |
| Conventional Water-Groundwater | −41.89 | −15.38 | −3.46 | −240.00 | −99.74 | −4.20 | −192.40 | −77.86 | −256.77 | −71.81 |
| Unconventional Water | −0.09 | 25.11 | 8.93 | −0.01 | 17.39 | 0.84 | 1.24 | −99.24 | −97.32 | 184.91 |
| Total | −85.75 | −6.40 | −1.88 | −191.23 | −185.54 | −9.31 | −381.33 | −261.33 | −614.48 | 39.18 |
Table 6.
Changes in sector output from different industries under policy scenarios.
| Scenarios | A1 | B1 | C1 | A2 | B2 | C2 | A3 | B3 | C3 | B4 |
|---|---|---|---|---|---|---|---|---|---|---|
| Agriculture | −128.28 | 24.70 | 77.89 | 14.06 | 11.55 | −0.50 | −18,529 | −2718 | −18,529 | −88.96 |
| General industries | 17.15 | −6.92 | 35.83 | −1.02 | 16.81 | 0.15 | 884 | −750 | −721 | 37.78 |
| Water intensive industries | 19.75 | −79.57 | 46.69 | −1.09 | 66.11 | 0.24 | 579 | −117,897 | −117,897 | 361.21 |
| Construction | 0.47 | −25.25 | 9.62 | 0.23 | 9.04 | 2.56 | 32 | −641 | 13,460 | 28.25 |
| General services | 91.53 | 47.36 | −83.51 | −5.96 | 35.27 | 13.53 | 3415 | −6888 | 89,085 | −145.16 |
| Water intensive services | 58.67 | 48.28 | −97.18 | −2.89 | 19.31 | 19.63 | 2978 | −2491 | 34,603 | −191.99 |
| Total | 59.29 | 8.60 | −10.65 | 3.31 | 158.09 | 35.60 | −10,641 | −131,386 | 0 | 1.14 |
Publisher’s Note: MDPI stays neutral with regard to jurisdictional claims in published maps and institutional affiliations. |
© 2022 by the authors. Licensee MDPI, Basel, Switzerland. This article is an open access article distributed under the terms and conditions of the Creative Commons Attribution (CC BY) license (https://creativecommons.org/licenses/by/4.0/).
Share and Cite
MDPI and ACS Style
Lin, X.; Chen, G.; Ni, H.; Wang, Y.; Rao, P. Impact of Water Saving Policy on Water Resource and Economy for Hebei, China Based on an Improved Computable General Equilibrium Model. Water 2022, 14, 2056. https://doi.org/10.3390/w14132056
AMA Style
Lin X, Chen G, Ni H, Wang Y, Rao P. Impact of Water Saving Policy on Water Resource and Economy for Hebei, China Based on an Improved Computable General Equilibrium Model. Water. 2022; 14(13):2056. https://doi.org/10.3390/w14132056
Chicago/Turabian StyleLin, Xichen, Genfa Chen, Hongzhen Ni, Ying Wang, and Pinzeng Rao. 2022. "Impact of Water Saving Policy on Water Resource and Economy for Hebei, China Based on an Improved Computable General Equilibrium Model" Water 14, no. 13: 2056. https://doi.org/10.3390/w14132056
Note that from the first issue of 2016, this journal uses article numbers instead of page numbers. See further details here.