
Random Forest Model Has the Potential for Runoff Simulation and Attribution


Key Laboratory of Agricultural Water Resources, The Innovative Academy of Seed Design, Center for Agricultural Resources Research, Institute of Genetics and Developmental Biology, Chinese Academy of Sciences, 286 Huaizhong Road, Shijiazhuang 050021, China
*
Author to whom correspondence should be addressed.
Water 2022, 14(13), 2053; https://doi.org/10.3390/w14132053
Submission received: 16 May 2022
/
Revised: 21 June 2022
/
Accepted: 22 June 2022
/
Published: 27 June 2022
(This article belongs to the Special Issue Impacts of Climate Change on Water Resources and Water Risks)
Abstract
:Quantifying the impact of climate change and human activities on runoff changes is beneficial for developing sustainable water-management strategies within the local ecosystem. Machine-learning models were widely used in scientific research; yet, whether it is applicable for quantifying the contribution of climate change and human activities to runoff changes is not well understood. To provide a new pathway, we quantified the contribution of climate change and human activities to runoff changes using a machine-learning method (random forest model) in two semi-humid basins in this study. Results show that the random forest model provides good performances for runoff simulation; the contributions of climate change and human activities to runoff changes from 1982 to 2014 were found between 6–9% and 91–94% in the Zijinguan basin, and 31–44% and 56–69% in the Daomaguan basin, respectively. Furthermore, the model performances were also compared with those of well-known elasticity-based and double-mass curve methods, and the results of these models are approximate in the investigated basins, which implies that the random forest model has the potential for runoff simulation and for quantifying the impact of climate change and human activities on runoff changes. This study provides a new methodology for studying the impact of climate change and human activities on runoff changes, and the limited numbers of parameters make this methodology important for further applications to other basins elsewhere. Nevertheless, the physical interpretation should be made with caution and more comprehensive comparison work must be performed to assess the model’s applicability.
1. Introduction
Climate and human activities have altered water-cycle and runoff dynamics regional and globally [1,2,3]. Quantitively understanding the impact of climate change and human activities on runoff changes is a challenge, and there is always a debate about that [4,5]. Climate change can directly affect the hydrological cycle by changing precipitation or evapotranspiration [6,7]. For example, increasing air temperature promotes the evapotranspiration of land surface and therefore, releasing more vapor in the air, which may increase the probability of a rainfall event. However, human activities alter the hydrological cycle in various ways from which the land-use and land-cover change (LULC) is one of the most important indicators [8,9]. With a rising trend of climate change and intensified human activities, the runoffs of many rivers around the world indicate a significant decreasing trend [10,11,12] which threatens regional or global water security. Meanwhile, previous studies indicate that runoff extremes which are driven by climate and anthropogenic changes are increasing, while the spatial pattern of runoff extremes is complex [13,14]. Therefore, it is essential to assess the impact of climate change and human activities on runoff changes, which is important for water-resources planning and management [10,15].
Many efforts have been made to quantify the attribution of runoff changes in different regions [16,17,18]. Generally, the widely used methods can be broadly categorized into three group categories: statistics-based methods, hydrological modeling, and elasticity-based methods [18]. Statistics-based methods intend to assess the attribution of runoff variations by setting different scenarios that rely on the relationships (usually linear relationship) between climate variables (usually precipitation) and runoff [19]. The hydrological-modeling method establishes physically based hydrological models to simulate the runoff dynamics and assesses the impacts of climate change and human activities on runoff changes by comparing different simulations in which climate variables are changed and other variables remain constant [20]. The elasticity-based methods assess the elasticity coefficient of runoff to climate and other variables; thus, the attribution of runoff changes can be estimated [21]. The Budyko framework is the most widely used elasticity-based method [11].
Statistics-based methods which require long time-series runoff and climate data are simple and easy to calculate; however, these methods lack physical mechanisms and require the user data to meet some statistical hypothesis, such as normality assumption [18]. Hydrological-modeling methods take physical processes into consideration; however, these methods always require a larger number of input data and are time-consuming, and uncertainties remain unavoidable due to the complicated model structure and numerous parameters [22]. Long-term datasets are required for elasticity-based methods which are relatively simple, and a physically realistic background can be partly taken into consideration in these methods. However, actual evapotranspiration is difficult to measure, and the empirical method which was used to calculate actual evapotranspiration may also bring uncertainties [18].
Hydrologic processes are characterized as being nonlinear, persistent, and nonstationary. Compared with traditional statistical methods, machine-learning models may better capture the nonlinear features of hydrological systems [23,24]. Some studies indicated that machine-learning models can be a reliable method for hydrological studies [25,26]. For example, as one of the machine-learning methods, the random forest model has been identified to be a useful tool to analyze the impact of different drivers on the hydrological processes and variable importance in flood forecast [27]. However, quantifying the impact of climate change and human activities on runoff changes based on machine-learning methods remains less used and challenging.
This study attempts to use a random forest model to simulate river runoff and quantify the impact of climate change and human activities on runoff changes in two adjacent semi-humid basins. With the purpose of comparing the availability and reliability of machine learning, the double-mass curve and elasticity-based methods were also utilized. The methodology presented in this study sheds light on the potential applicability of the machine-learning model in hydrological studies.
2. Study Area, Data Sets, and Methods
2.1. Study Area
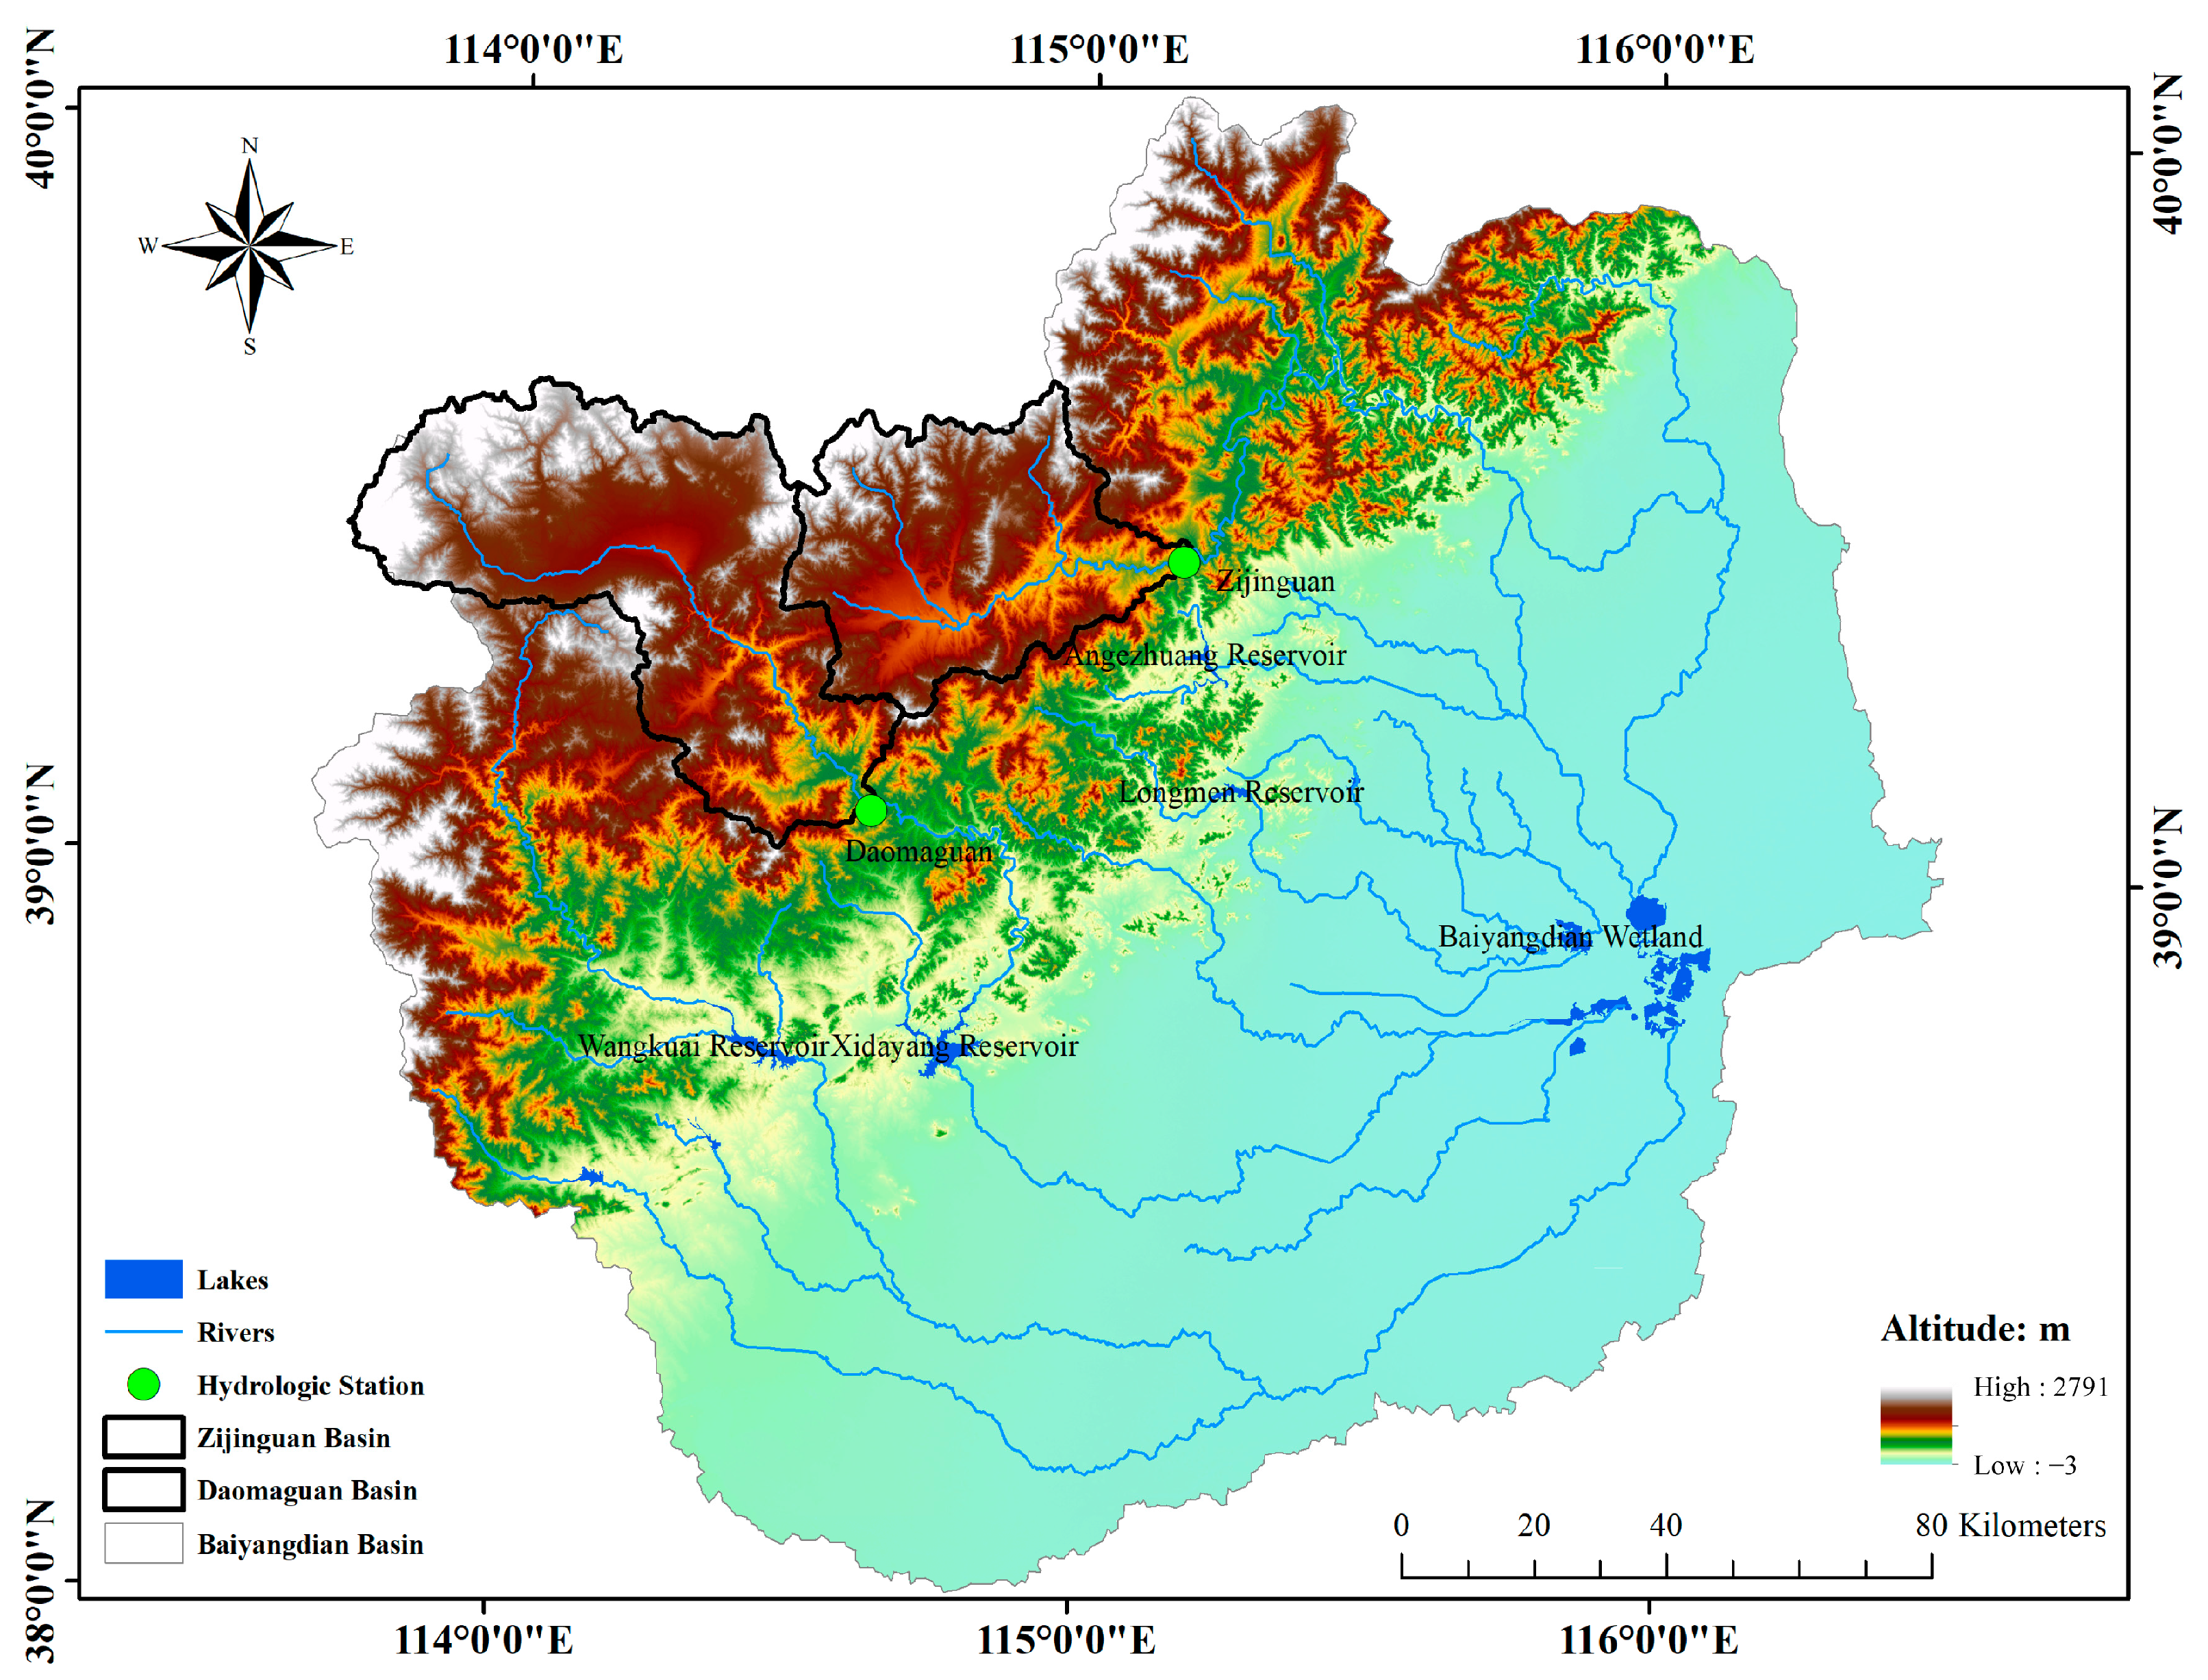
This study focuses on the Daomaguan and Zijinguan basins which are located in the headwater of the Baiyangdian Basin (38.81°–39.66° N, 113.70°–115.21° E) in the North China Plain (NCP). The Daomaguan basin drains an area of 2751 km2 with an elevation ranging from 404 m to 2273 m, while the Zijinguan basin covers an area of 1772 km2 with an elevation ranging from 13 m to 2147 m (Figure 1). Water resources originating from the Daomaguan Basin flow to the Xidayang reservoir, which is of great importance for downstream drinking, irrigation, and ecological restoration. Situated in the Taihang mountains in the NCP, the Daomaguan and Zijinguan basins have a temperate, semi-humid continental climate. There is only one meteorological station within the Daomaguan basin with an annual mean temperature of 7.8 °C and annual precipitation of 414 mm; there is no meteorological station within the Zijinguan basin. About 70% of annual precipitation happens in the wet season (June to September) in these two basins.
2.2. Data Sets
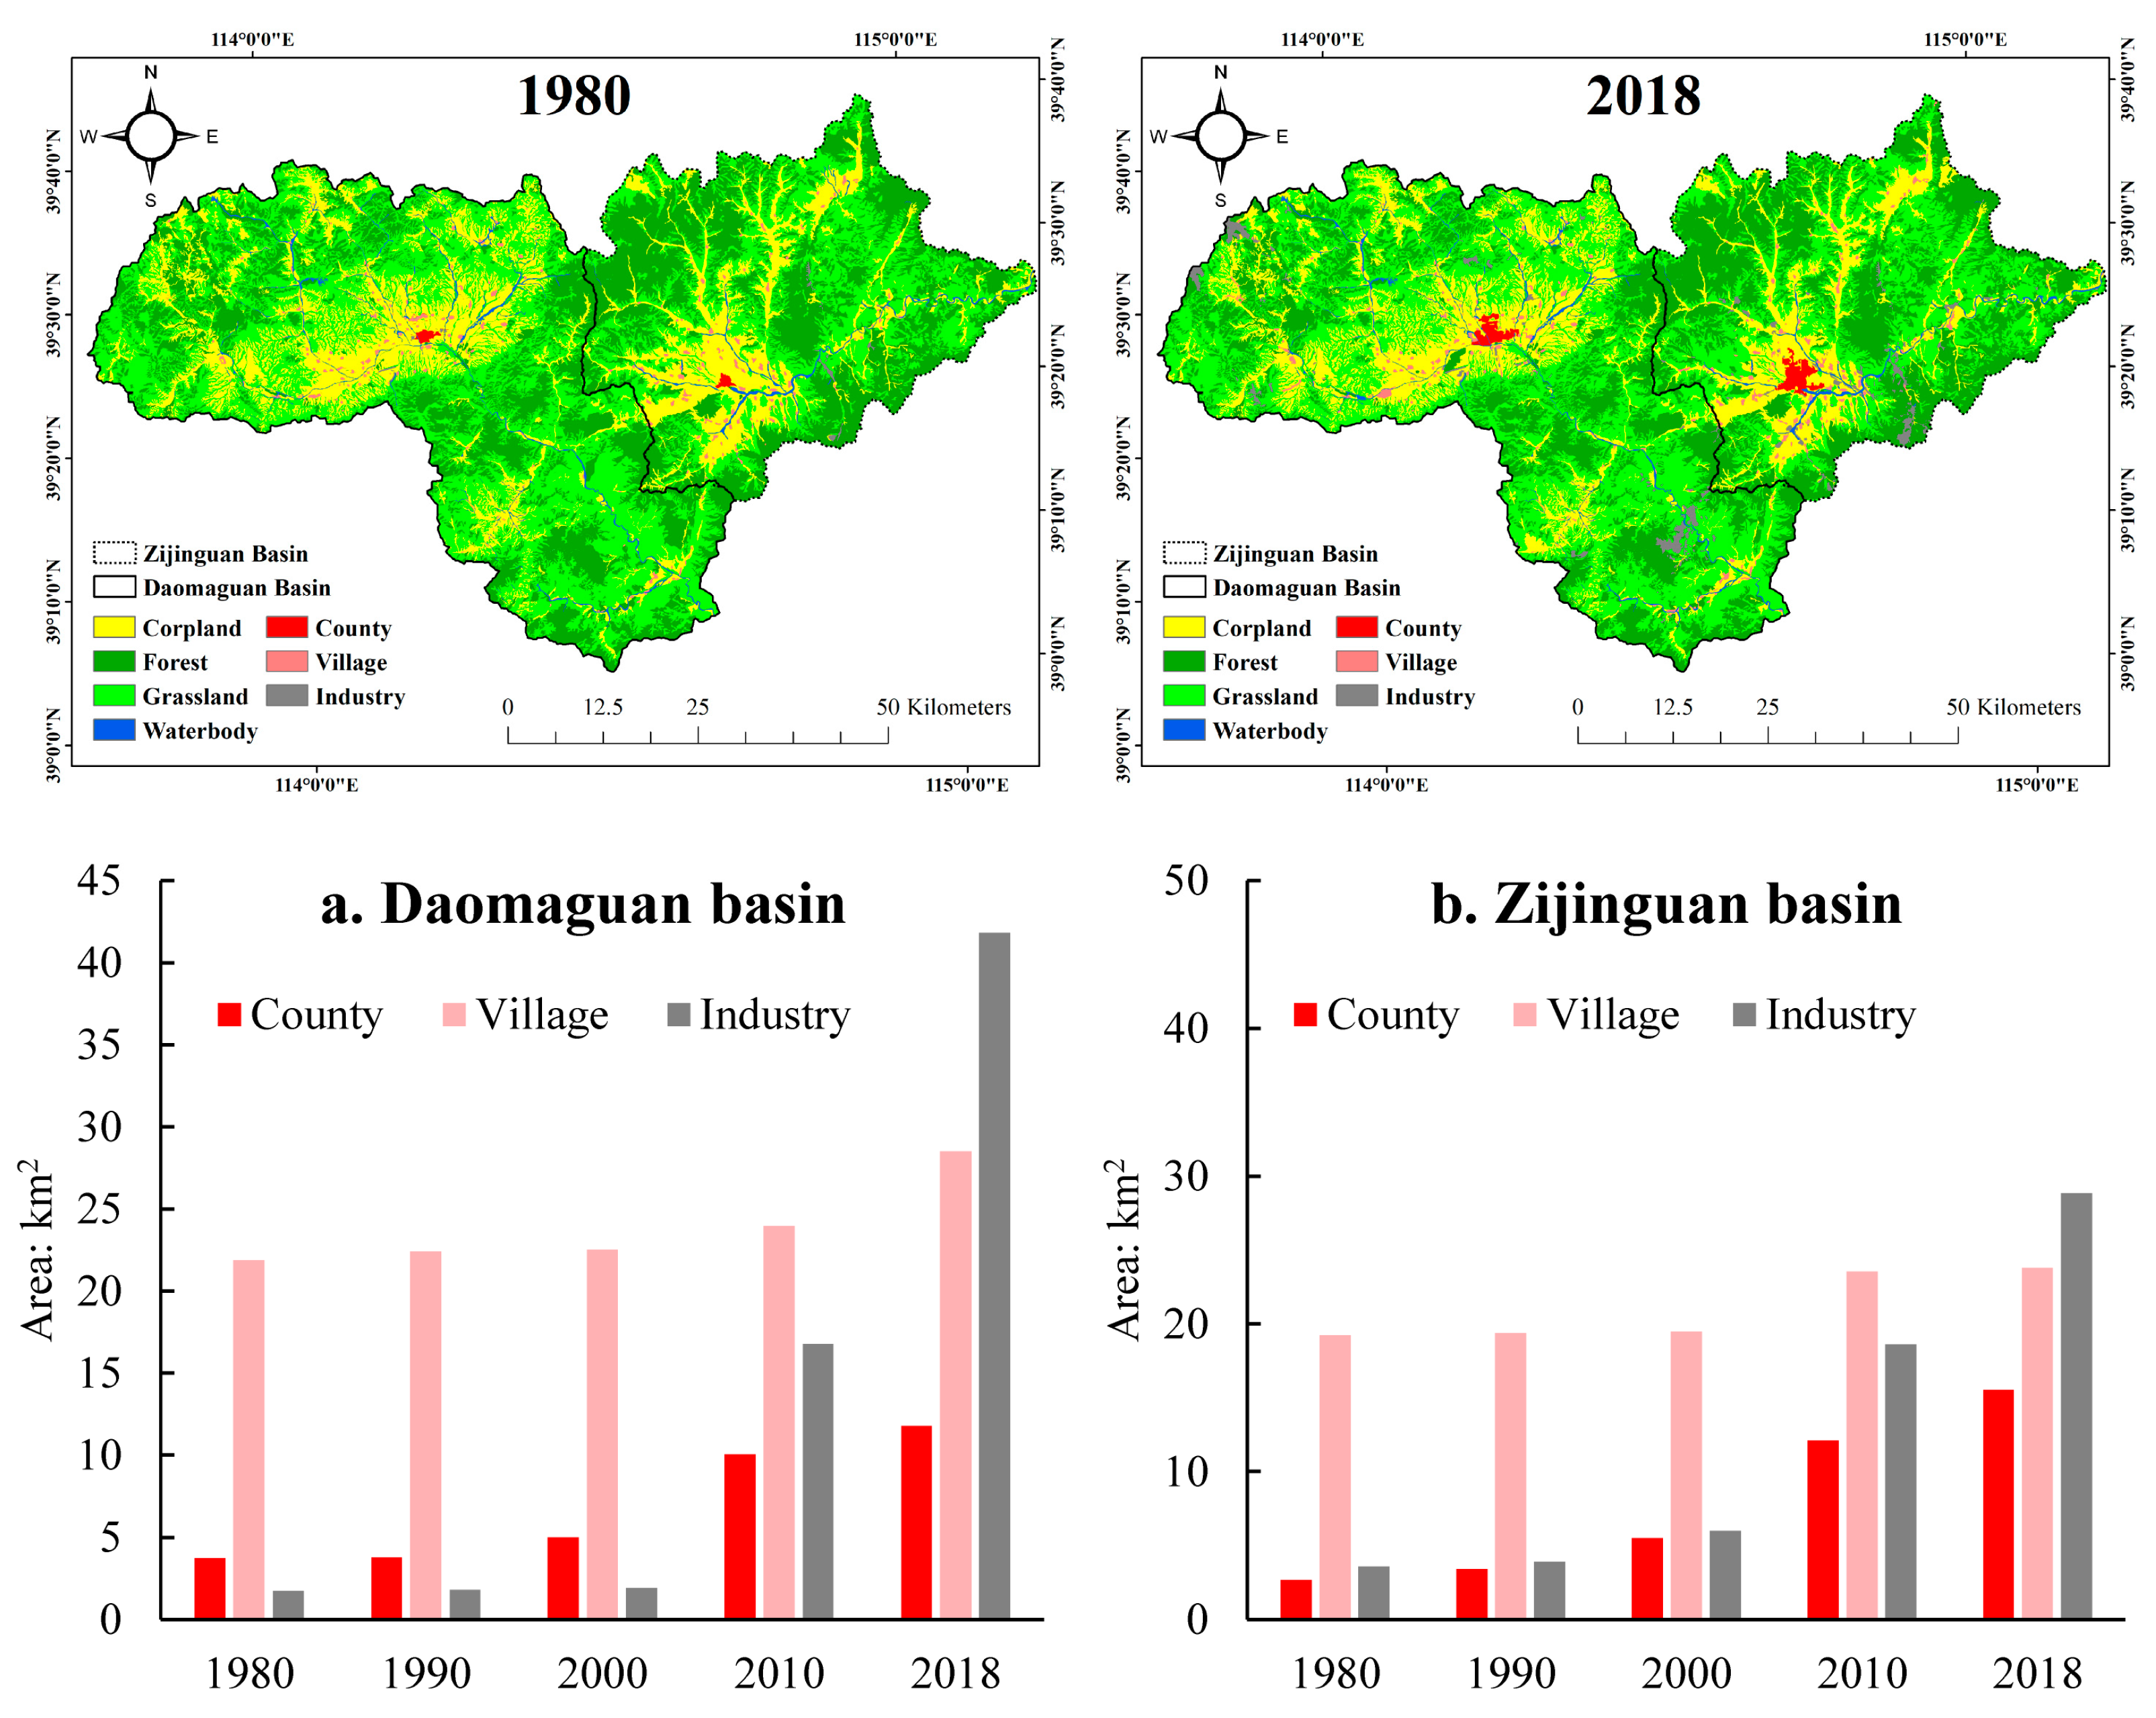
Monthly runoff (R) data from 1982 to 2014 at the Daomaguan and Zijinguan gauge stations were collected from the Hydrological Bureau of the Ministry Water Resource of China. Daily precipitation (P), relative humidity, wind speed, sunshine duration, and the mean, maximum, and minimum air temperatures (T) at the Lingqiu meteorological station came from the China Meteorological Data Service Center (http://data.cma.cn accessed on 21 June 2022). The limited meteorological stations cannot represent the spatial climate in the investigated basins; thus, time-series (1979–2015) grid meteorological data were extracted from the China meteorological forcing dataset (Kun and Jie, 2016). This dataset was found to perform well in China [28]. Monthly actual evapotranspiration data from 1982 to 2014 in the study area were acquired from the terrestrial evapotranspiration dataset across China [29]. The land-use and land-cover (LULC) data with a spatial resolution of 30 × 30 m were obtained from the Geographical Information Monitoring Cloud Platform (http://www.dsac.cn/ accessed on 21 June 2022) (Figure 2). The Normalized Difference Vegetation Index (NDVI) data were derived from https://ecocast.arc.nasa.gov/data/pub/gimms accessed on 11 October 2021.
2.3. Methods
Quantifying the impact of climate change and human activities on runoff changes includes three steps: (1) trend analysis, (2) breakpoint analysis, (3) contribution analysis. Section 2.3.1 introduced the trend and breakpoint analysis, Section 2.3.2 described the elasticity-based method, Section 2.3.3 proposed the machine learning model, and Section 2.3.4 introduced the double-mass curve method.
2.3.1. Trend and Breakpoint Analysis
The Mann–Kendall non-parametric test was widely applied to identify runoff and climate trends in previous studies [30,31,32,33]; it was therefore employed to examine the trends of precipitation, actual evapotranspiration, and runoff in this study. All the breakpoint and trend analyses were performed using R software [34]. The MK test was calculated as follows.
Assuming the X is a time series, X has sample size equal to n. The variable S is expressed as follows:
where xi and xj are the values of time series X, i and j represent the year. When i > j, n represents the length of time and the sgn(xi − xj) is the sign function of xi − xj.
The statistical test variable Za can be calculated by the following formula:
when the absolute value of Za ≤ Z1−b/2, the time series does not have a trend. When the absolute value of Za ≥ Z1−b/2, there is a significant trend in the time series. The Z1−b/2 is the quantile of the standard normal distribution, and b is the significance level of the test.
The slope of the monotonic trend can be estimated by the following formula:
indicates that there is a rising trend, and indicates that there is a decreasing trend.
The non-parametric Pettitt test was employed to identify the breakpoint of the runoff dataset in this study. The non-parametric Pettitt breakpoint test had been widely applied to detect abrupt changes in time series of observed runoff in previous studies [21,35].
In the Pettit test, T and t are the sequence length and breakpoint, respectively. Assuming the X is a time series, the can be written as:
where and are random variables with following in time. The test statistic Ut,T depends on Dij as
The statistic test is assessed for all random variables from 1 to T; then, the most significant change point is selected where the value of || is the largest:
A change point occurs at time t when the statistic KT is significantly different from zero at a given level. The approximate significant level is given by:
Once the p-value is less than the pre-assigned significance level, the data are divided into two sub-series (before and after the location of the change point) with two different distribution functions. The detail of the Pettit test can refer to the following reference [36]. According to the breakpoint of runoff time series, the runoff dataset was divided into two periods: before breakpoint and after breakpoint.
2.3.2. Elasticity-Based Methods
The Budyko framework was adopted firstly to quantify the impact of climate change and anthropogenic activities on runoff changes in this study. In the Budyko framework, runoff changes can be expressed as follows:
where is the runoff variation induced by human activities (such as land use/land cover, agricultural irrigation, rural and urban domestic water use, et al.). The is the runoff change induced by climate change. The represents the difference of measured runoff before and after breakpoint: . The is the annual mean runoff after breakpoint, and is the annual mean runoff before breakpoint.
According to the Budyko hypothesis, the runoff R can be expressed as the difference between precipitation P and actual evapotranspiration E (R = P − E), and annual water balance is calculated as a function of available water and energy. Yang et al. [37] recommended a water energy balance formula on the average annual time scale. Therefore, the actual evapotranspiration can be written as follows:
n is the underlying surface feature parameter. Therefore, the R can be given as:
The runoff changes are made up of precipitation, potential evapotranspiration (ET0), and human activities. Therefore, the runoff changes induced by climate change can consist of precipitation and potential evapotranspiration.
According to the definition from previous research, climate elasticity of runoff is the proportional change in runoff (R) about the change in climatic variables (X) (such as changes in precipitation or potential evapotranspiration) [38]. The formula of is given as:
Based on the theory of total differential equation, we can have the following term:
According to the Budyko hypothesis, the actual evapotranspiration can be expressed as functions of the dryness indices () and . Furthermore, the precipitation and potential evapotranspiration elasticities of runoff can be estimated by the following formula:
The can be generated from Zhang’s equation [39] based on the Budyko hypothesis, . The is a parameter which represents the land cover condition of a region. The was fitted by observed datasets: and . Thus, the precipitation and potential evapotranspiration elasticity coefficients are estimated, and the runoff variation induced by climate change are therefore estimated.
2.3.3. Assessment Based on Random Forest Model
Machine-learning models are increasingly being utilized in hydrological studies [26,40,41,42,43]. We tried to employ the random forest model to quantify the attribution of runoff variation. Bagging is an ensemble-modeling method which is devoted to avoiding the over-fitting of models [43]. Lots of simple models are established by random subsamples of a dataset and are then aggregated in some way, usually by averaging regarding regression and by mode regarding decision making [44]. The random forest model was applied by using the “party” package [45] in R software, and 500 trees were established for each ensemble.
Similar to the framework of linear regression or double-mass curve method [22,46], we established the relationship between climatic and anthropogenic factors and runoff before breakpoint using the random forest model. Unlike the double-mass curve model which only considers precipitation as the independent variable, the random forest model includes more climatic and anthropogenic factors; e.g., precipitation, air temperature, and actual evaporation were regarded as climatic factors, while the area of land-use change (including cropland, forest, grassland, county, village, and industry) and NDVI were regarded as anthropogenic factors. The relationship can be expressed as:
represent precipitation, temperature, and actual evapotranspiration before breakpoint, respectively, which was analyzed in Section 3.1 (the same hereafter). are the area of cropland, forest, grassland, county, village, and industry before breakpoint, respectively. represents the normalized difference vegetation index before breakpoint. The is the runoff before breakpoint. Therefore, climate-driven runoff can be determined by the previous relationship before breakpoint:
represent precipitation, temperature, and actual evaporation after breakpoint, respectively. The anthropogenic factors were kept content after breakpoint in formula 10. The runoff changes are determined by climate and anthropogenic factors. Thus, runoff is the function of climate and anthropogenic factors. When we keep the anthropogenic factors content in the function, the runoff fluctuates, driven only by climate change. Therefore, the Rclimate represents climate-driven runoff after breakpoint. Climate contribution to runoff changes can be calculated from:
In addition, human activity contribution to runoff changes is therefore estimated:
2.3.4. Assessment Based on Double-Mass Curve Method
The double-mass curve method is a simple and practical method which is based on the linear regression between accumulative precipitation and runoff in the period before and after breakpoint. The relationship between accumulative precipitation and runoff can be given as:
The and are the annual runoff and precipitation of the basin, respectively. a represents the rate of change in accumulated runoff with changes in accumulated precipitation, b denotes the intercept, and n is the length of the annual time series.
According to the regression, the runoff driven by climate change can be simulated in the period after breakpoint:
According to the accumulated runoff, the annual runoff can also be estimated in the period after breakpoint. The reconstructed runoff represents climate-driven runoff after breakpoint. Therefore, contributions of climate change and human activities on runoff changes can be calculated based on Equations (18) and (19).
3. Results
3.1. Trends of Climatic, Hydrological, and Anthropogenic Variables
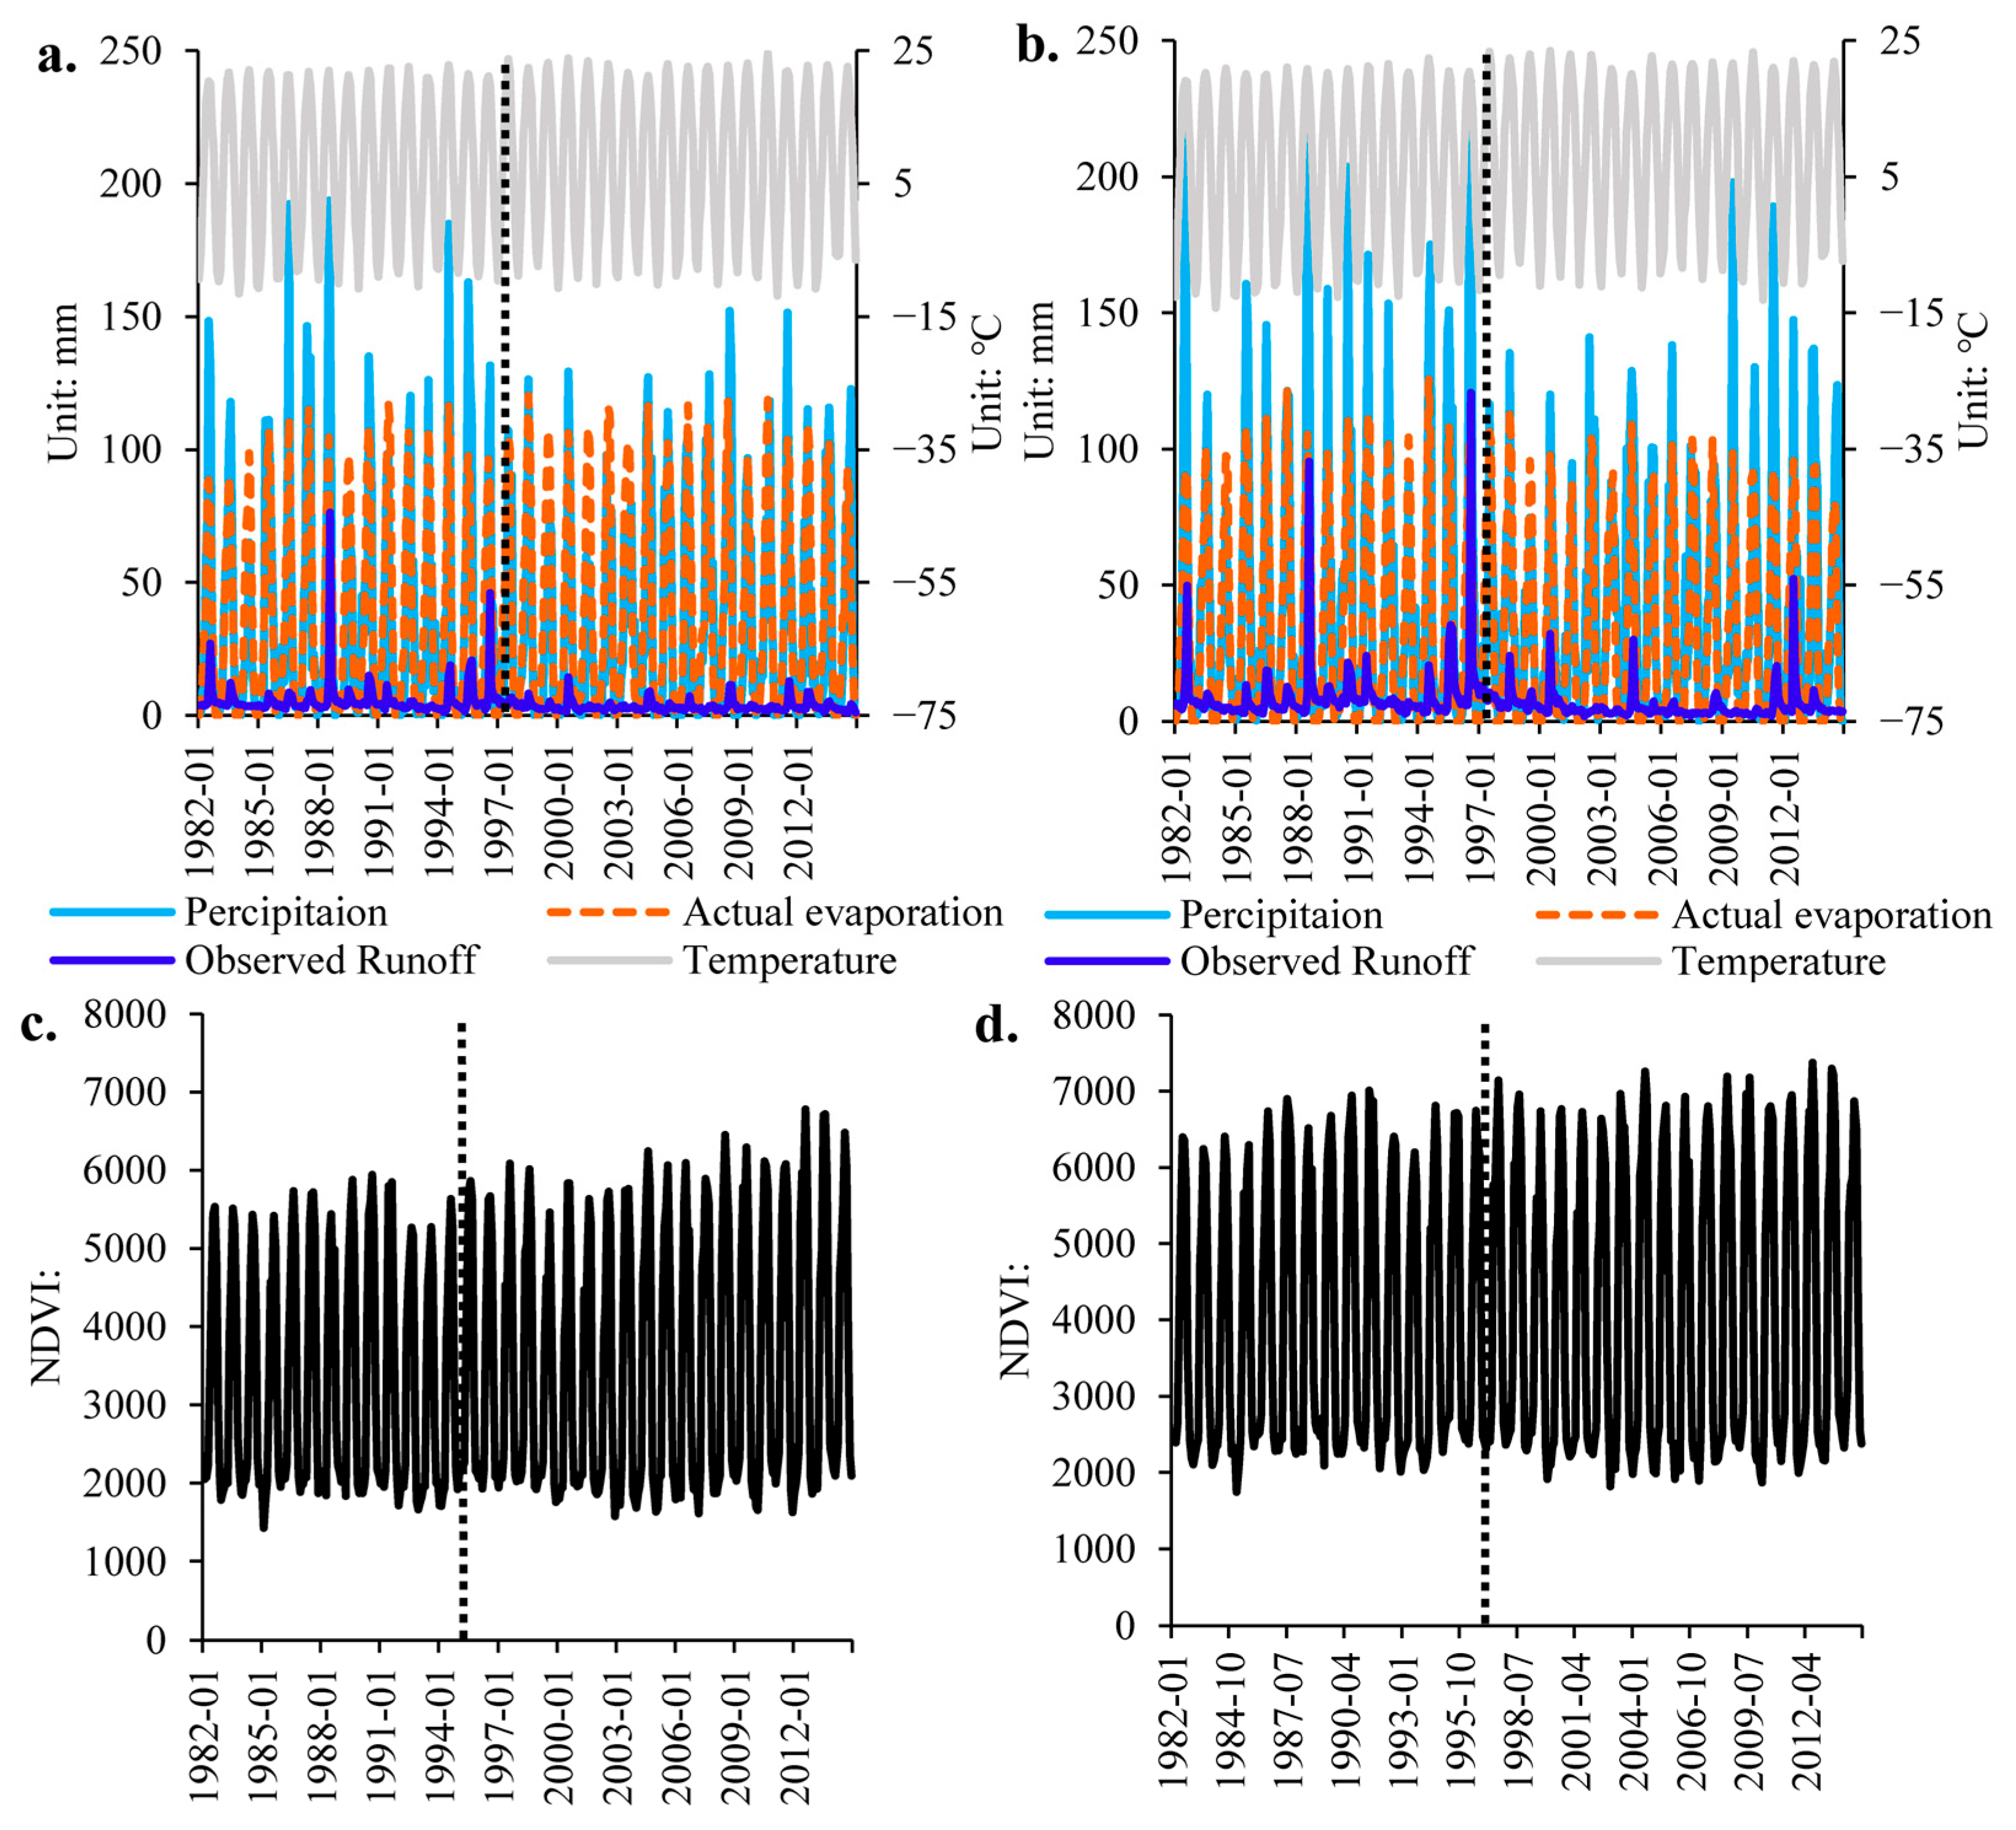
The variation and trend analyses of monthly precipitation, actual evapotranspiration, air temperature, and runoff from 1980 to 2014 are shown in Figure 3 and Table 1. Runoff in the Daomaguan and Zijinguan basins showed a significant decreased tendency from 1982 to 2014; however, the magnitude of runoff decrease was found to be bigger in the Zijinguan basin than in the Daomaguan basin (Table 1). Monthly air temperature, actual evapotranspiration, and NDVI showed an increasing trend in both the Daomaguan and Zijinguan basins. The increasing trend of the air temperature and NDVI are especially more obvious. Monthly precipitation showed a non-significant decreasing trend in the Daomaguan basin, while a non-significant increasing trend was seen in the Zijinguan basin.
The breakpoint of runoff in the Daomaguan and Zijinguan basins were found at 1998 and 2000 based on the Pettit test, respectively, and average annual precipitation decreased 0.71 mm in the Zijinguan basin, while it increased 43.64 mm in the Daomaguan basin from the before- to the after-breakpoint periods (Table 2). However, average annual runoffs were reduced 50.18 mm and 29.76 mm in the Zijinguan and Daomaguan basins from the before- to the after-breakpoint periods, respectively. Averaged annual actual evapotranspiration rose 23.58 mm and 82.41 mm from the before- to the after-breakpoint periods in the two basins, respectively. These two basins were both affected by intense human activities; urbanization and industrialization are possibly the main drivers of land-use and land-cover change (LULC) in the two basins (Figure 2).
3.2. Performance of Different Models
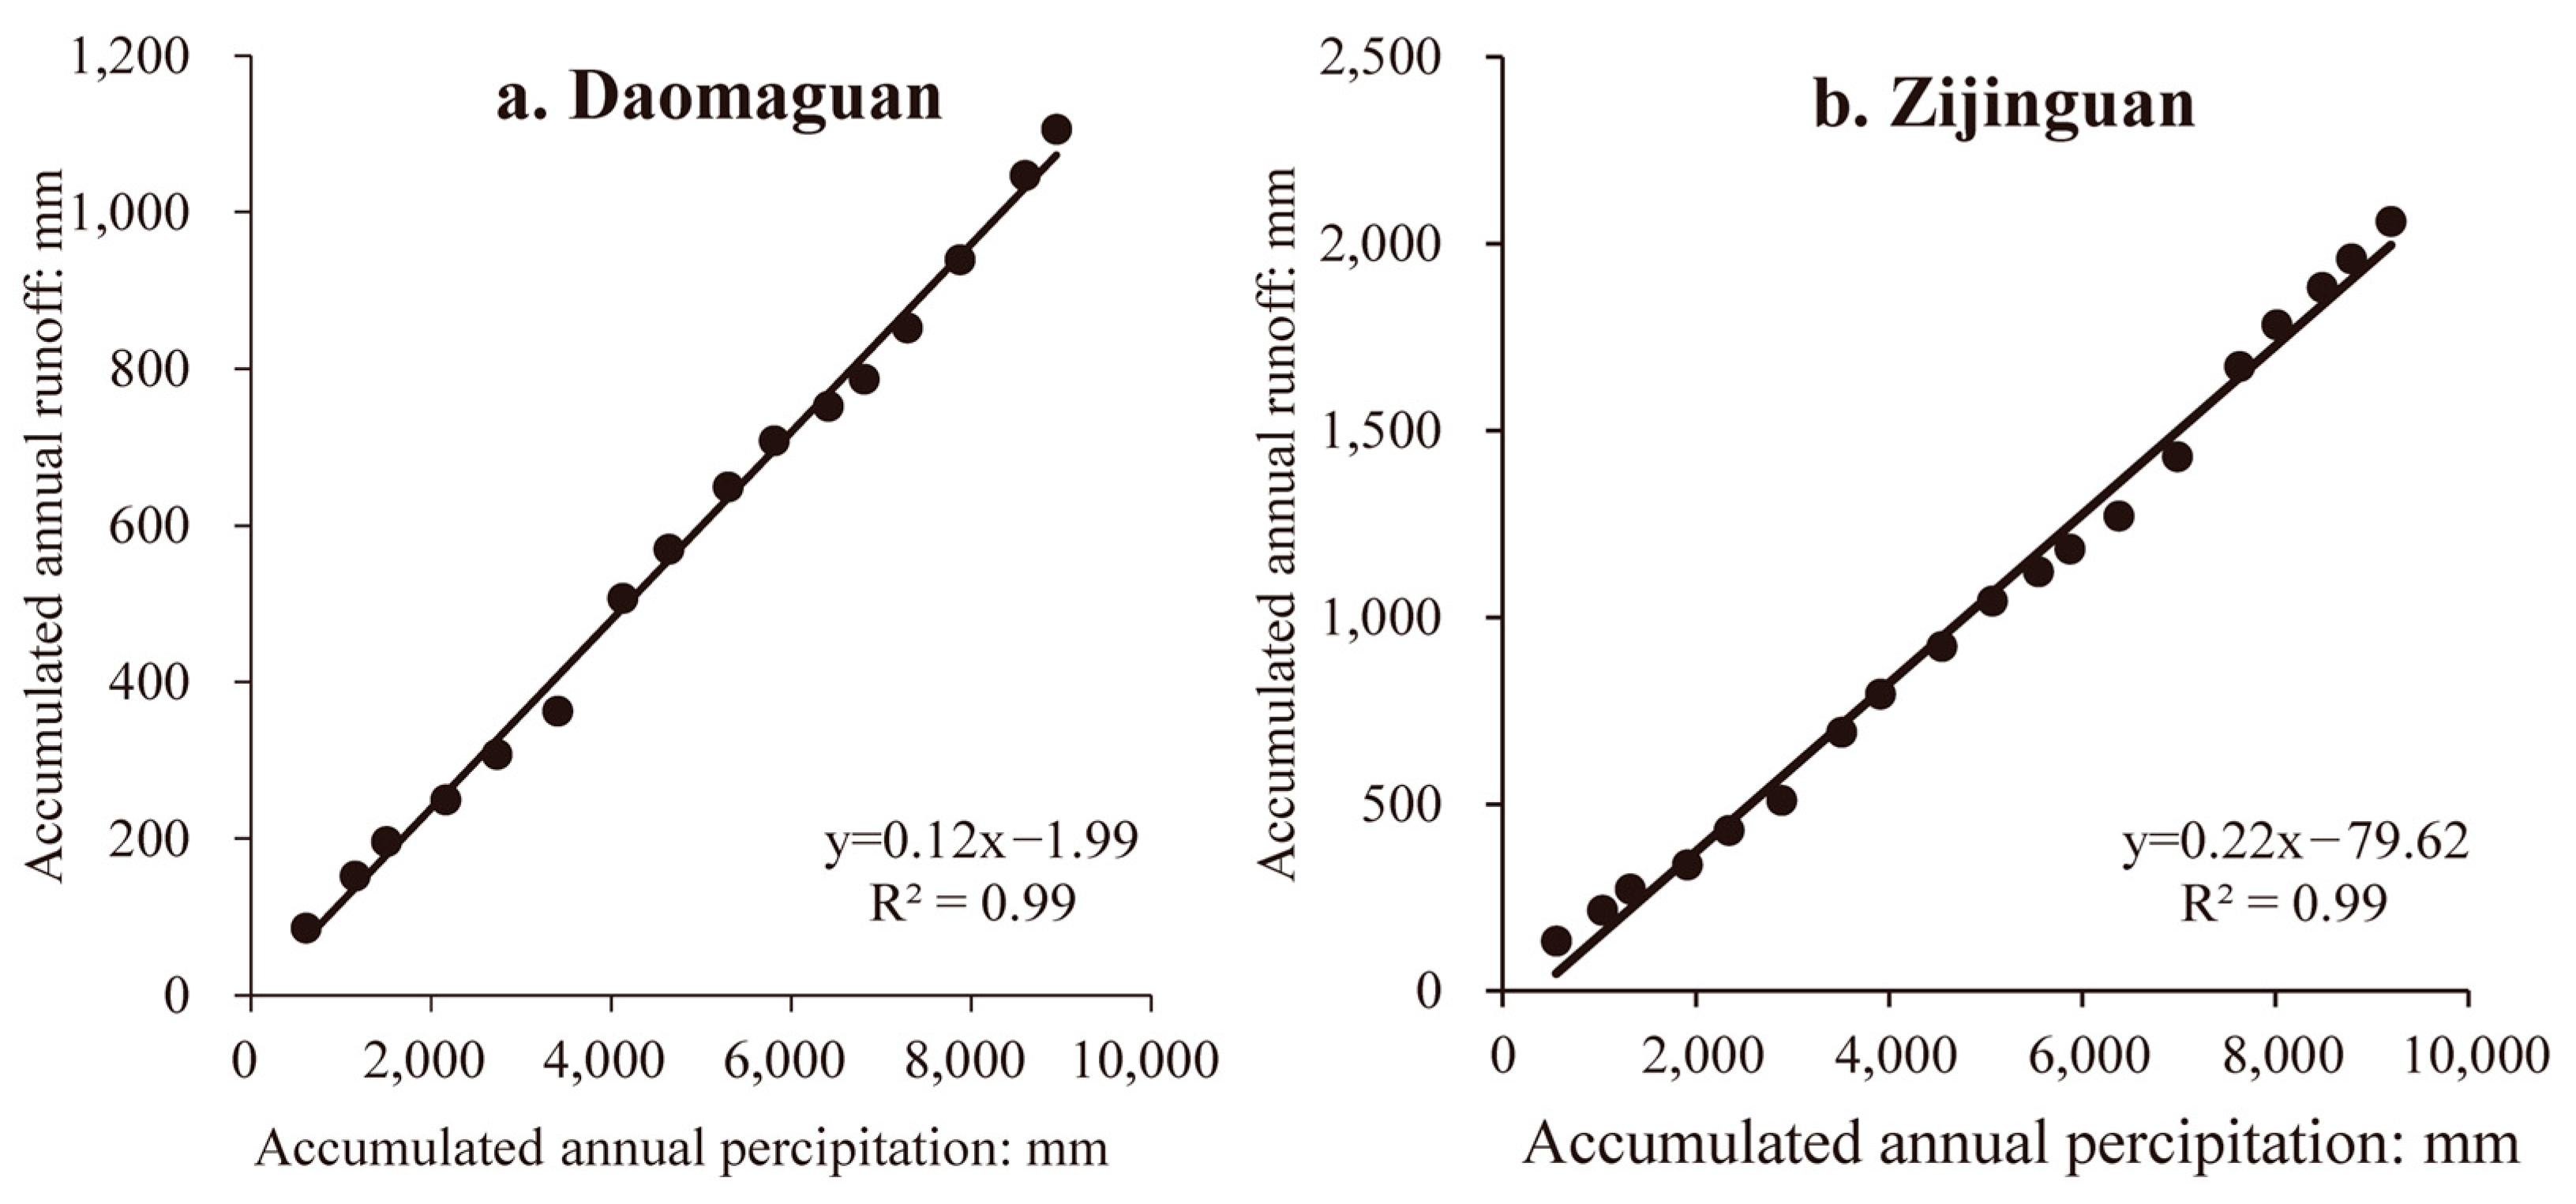
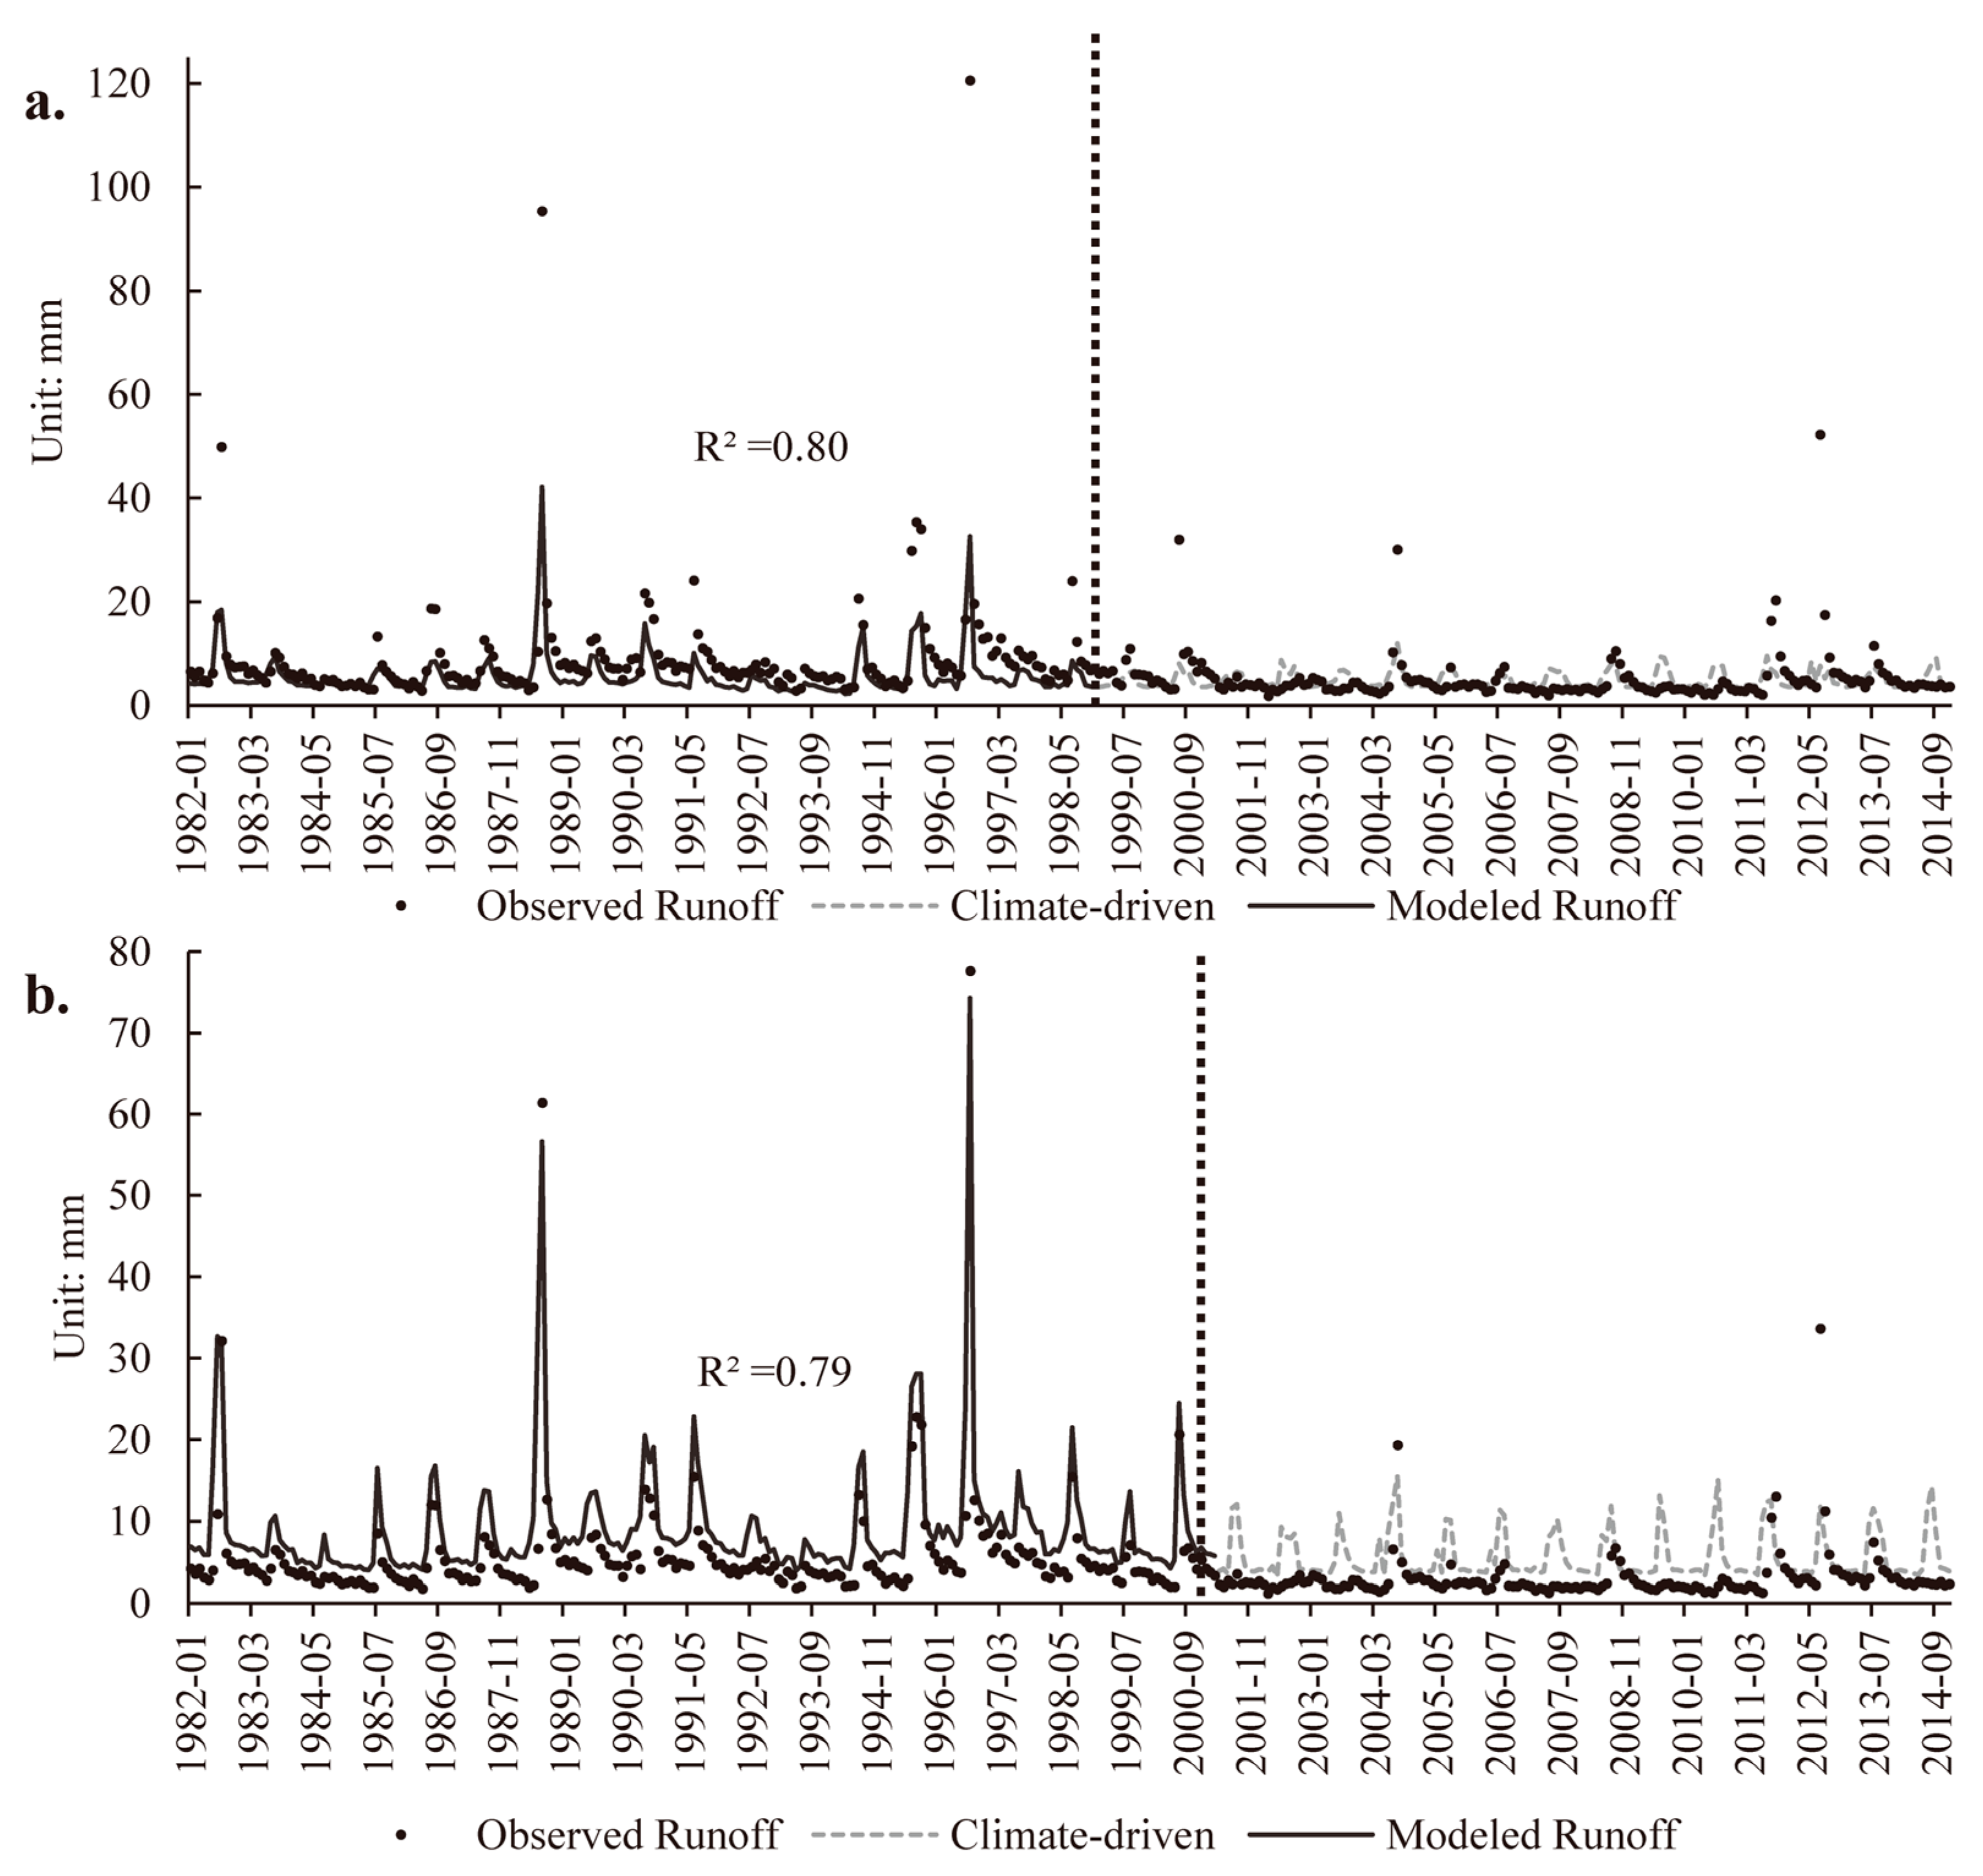
The fitted values for the Budyko hypothesis are 0.84 and 1.80 in the Zijinguan and Daomaguan basins, respectively. The coefficient of determination R2 is used to assess the performance of the linear regression and random forest models. The regression equation and the scatter plot of the double-mass curve method are shown in Figure 4. The R2 of the regression in both the Daomaguan and Zijinguan basins are 0.99, and the change rate of accumulated runoff versus accumulated precipitation in the Zijinguan basin is bigger than in the Daomaguan basin (Figure 4). The performance of the random forest model in the Daomaguan and Zijinguan basins are presented in Figure 5. The R2 of the random forest model is 0.80 for the Daomaguan basin and 0.79 for the Zijinguan basin (Figure 5). The simulated climate-driven runoffs after breakpoint are shown in Figure 5a,b. It indicates that the climate-driven runoff is closer to the observed runoff in the Daomaguan basin (Figure 5a), while the climate-driven runoff is obviously higher than the observed runoff in the Zijinguan basin (Figure 5b).
3.3. Quantifying the Runoff Change Response to Climate Change and Human Activities in the Target Basins
The contribution of climate change and human activities to runoff changes based on three methods in the two basins are summarized in Table 2. From 1982 to 2014, climate change accounts for 31–44%, while human activities account for 56–69% for the runoff decrease in the Daomaguan basin based on three methods (Table 2). The contribution rates calculated from the double-mass curve method (climate change accounts for 31% and human activities accounts for 69%) are approximate to that from the random forest model (climate change accounts for 34% and human activities accounts for 66%). However, the contribution rates estimated by the elasticity-based method are relatively lower (about 10%) than that revealed by the other two methods. Furthermore, the contribution of climate change and human activities to runoff decrease were 6–9% and 91–94% in the Zijinguan basin, respectively (Table 2). The contribution rates which was calculated based on the double-mass curve method are the same as that based on the random forest model; yet, the contribution rates based on the elasticity-based method are slightly lower (3%) than that assessed by the other two methods (Table 2).
The machine-learning model quantified the impact of climate change and human activities on runoff changes based on monthly hydrometeorological data, while the double-mass curve and elasticity-based methods quantifying the attribution of runoff changes rely on annual hydrometeorological data. In general, the results of the three methods are consistent and approximate: human activities are the main driver of the runoff decreases in both the Daomaguan and Zijinguan basins. Furthermore, the runoff changes accounted by human activities in the Zijinguan basin are more obvious than that in the Daomaguan basin.
4. Discussion
Human activities are the main drivers for runoff changes in the target two basins. Human activities accounted for 56–69% for the runoff decrease in the Daomaguan basin, which is generally consistent with previous studies that human activities are accountable for 60–62% of the runoff decrease from 1960 to 2008 using the elasticity-based method and hydrological modeling [46]. It was also found that 62.5% of the runoff decrease was on account of human activities from 1956 to 2005 in the Daomaguan basin, according to the Budyko framework [35]. Previous studies indicated that human activities accounted for 70% for the runoff decrease from 1960 to 2008 in the Zijinguan basin by using the elasticity-based method [35], which was found slightly lower that that revealed by this study that the contribution of human activities on runoff changes are 91–94% in the Zijinguan basin. The choice of the investigated time period may influence the contribution results. The study period in previous research (from 1960 to 2008) was earlier than in this study (from 1982 to 2014) [35], which may be the reason for the contribution of human activities on runoff changes in previous research being slightly lower than our result. By assessing the impact of climate and land-use change on runoff with the Budyko framework in the Haihe basin (study area of this study belongs to the Haihe basin), previous research found that land-use change is the major driving force for runoff changes from 1960 to 2010 in the basin [47], which illustrated that human activities play a vital role in the runoff changes. Particularly, we also found that land use changed significantly in the target basins (Figure 2).
Table 1 and Table 2 show that air temperature, the actual evapotranspiration, ET0, and NDVI increased from before breakpoint to after breakpoint in both of the two basins consistently. The precipitation decreased in the Daomaguan basin and increased in the Zijinguan basin, while the runoff decreased in both the Daomaguan and Zijinguan basins. It implies that the runoff decrease in the Daomaguan basin is more likely to be influenced by climate change than in the Zijinguan basin without considering the impact of human activities. Therefore, runoff changes in the Zijinguan basin are more intensely influenced by human activities than in the Daomaguan basin, which imply that the contribution rates of climate change and human activities on runoff changes decrease based on three methods are reasonable in these two basins. Moreover, Figure 2a,b show that significant urbanization and industrialization appeared in the two basins, but the intensity of urbanization in the Zijinguan basin was higher than in the Daomaguan basin regarding the faster increase in the area of county in the Zijinguan basin. Urbanization may lead to population increase and more water consumed for irrigation or drinking, which will lower the runoff [48]. Hence, it is reasonable that the contribution rate of human activities to runoff decrease in the Zijinguan basin (91–94%) is higher than that in the Daomaguan basin (56–69%).
In general, the results of the three methods are consistent and approximate, which illustrates that the random forest model is applicable in these two basins. The double-mass curve method is simple; however, it only considers precipitation as a driver for runoff changes, which may not be reasonable since other factors (e.g., evapotranspiration, LULC, et al.) may have an important role in influencing the runoff. The complicated model structure and a large amount of input data and parameters may be an imposition on the application of hydrological modelling. Although relatively simple and long-term hydro-climatological data are needed, an elasticity-based method was widely employed due to its physically realistic features [19,21]. The random forest model, as one of the machine-learning methods, is good at solving nonlinear problems and is increasingly employed in hydrology research [24,27]. Furthermore, it is more flexible to assemble more kinds of drivers for runoff changes. This study assessed the applicability of the random forest model in two basins, which sheds light on a new methodology for estimating the contribution of climate change and human activities to runoff changes. However, the time periods and accuracy of datasets may cause uncertainties, and more comparative analyses and tests are still needed in further research.
5. Conclusions
This study attempted to use a random forest model to quantify the impact of climate change and human activities on runoff changes in the Daomaguan and Zijinguan basins and to evaluate the applicability of the machine-learning model by comparing the results with the normally applied double-mass curve and elasticity-based methods. The main conclusions are as follows: (1) human activities account for 56–69% and 91–94% of the runoff decrease in the Daomaguan and Zijinguan basins, respectively; human activities are the driver of the runoff decrease in these two basins; (2) in general, the results of the three methods are consistent and approximate regarding the contribution rate of climate change and human activities on runoff changes; (3) although more comparative assessments are needed, the random forest model may be suitable for quantifying the contribution of climate change and human activities to runoff changes in these basins.
This study sheds light on including machine-learning models in further hydrological studies or other basins elsewhere, which may be important for using and learning from data. However, as the physical mechanism is lacking behind the machine-learning methods, more analysis and careful interpretation are still urgently needed.
Author Contributions
Conceptualization, X.L. and Y.-J.S.; methodology, X.L.; software, X.L.; investigation, X.K.; resources, Y.-J.S.; data curation, X.Z.; writing—original draft preparation, X.L. All authors have read and agreed to the published version of the manuscript.
Funding
This research was funded by [National Key Research and Development Program] grant number [2021YFD1700500], [Natural Science Foundation of Hebei Province] grant number [D2021503001], and [National Natural Science Foundation of China] grant number 42001037. The APC was funded by [2021YFD1700500].
Institutional Review Board Statement
Not applicable.
Informed Consent Statement
Not applicable.
Data Availability Statement
Not applicable.
Acknowledgments
This study was supported by the National Key Research and Development Program (2021YFD1700500), Natural Science Foundation of Hebei Province (D2021503001), and National Natural Science Foundation of China (42001037).
Conflicts of Interest
The authors declare no conflict of interest.
References
- Millán, M.M. Extreme hydrometeorological events and climate change predictions in Europe. J. Hydrol. 2014, 518, 206–224. [Google Scholar] [CrossRef]
- Liang, W.; Bai, D.; Wang, F.; Fu, B.; Yan, J.; Wang, S.; Yang, Y.; Long, D.; Feng, M. Quantifying the impacts of climate change and ecological restoration on streamflow changes based on a Budyko hydrological model in China’s Loess Plateau. Water Resour. Res. 2015, 51, 6500–6519. [Google Scholar] [CrossRef]
- Amin, M.Z.M.; Shaaban, A.J.; Ercan, A.; Ishida, K.; Kavvas, M.L.; Chen, Z.Q.; Jang, S. Future climate change impact assessment of watershed scale hydrologic processes in Peninsular Malaysia by a regional climate model coupled with a physically-based hydrology modelo. Sci. Total Environ. 2017, 575, 12–22. [Google Scholar] [CrossRef] [PubMed]
- Zhou, G.; Wei, X.; Chen, X.; Zhou, P.; Liu, X.; Xiao, Y.; Sun, G.; Scott, D.F.; Zhou, S.; Han, L.; et al. Global pattern for the effect of climate and land cover on water yield. Nat. Commun. 2015, 6, 5918. [Google Scholar] [CrossRef] [PubMed] [Green Version]
- Berghuijs, W.R.; Woods, R.A. Correspondence: Space-time asymmetry undermines water yield assessment. Nat. Commun. 2016, 7, 11603. [Google Scholar] [CrossRef] [Green Version]
- Remondi, F.; Burlando, P.; Vollmer, D. Exploring the hydrological impact of increasing urbanisation on a tropical river catchment of the metropolitan Jakarta, Indonesia. Sustain. Cities Soc. 2016, 20, 210–221. [Google Scholar] [CrossRef]
- Vollmer, D.; Pribadi, D.O.; Remondi, F.; Rustiadi, E.; Grêt-Regamey, A. Prioritizing ecosystem services in rapidly urbanizing river basins: A spatial multi-criteria analytic approach. Sustain. Cities Soc. 2016, 20, 237–252. [Google Scholar] [CrossRef]
- Deng, X.; Shi, Q.; Zhang, Q.; Shi, C.; Yin, F. Impacts of land use and land cover changes on surface energy and water balance in the Heihe River Basin of China, 2000–2010. Phys. Chem. Earth Parts A/B/C 2015, 79, 2–10. [Google Scholar] [CrossRef]
- Yang, W.; Long, D.; Bai, P. Impacts of future land cover and climate changes on runoff in the mostly afforested river basin in North China. J. Hydrol. 2019, 570, 201–219. [Google Scholar] [CrossRef]
- Wang, S.; Yan, M.; Yan, Y.; Shi, C.; He, L. Contributions of climate change and human activities to the changes in runoff increment in different sections of the Yellow River. Quat. Int. 2012, 282, 66–77. [Google Scholar] [CrossRef]
- Zhan, C.S.; Jiang, S.S.; Sun, F.B.; Jia, Y.W.; Niu, C.W.; Yue, W.F. Quantitative contribution of climate change and human activities to runoff changes in the Wei River basin, China. Hydrol. Earth Syst. Sci. 2014, 18, 3069–3077. [Google Scholar] [CrossRef] [Green Version]
- Zhang, H.; Huang, Q.; Zhang, Q.; Gu, L.; Chen, K.; Yu, Q. Changes in the long-term hydrological regimes and the impacts of human activities in the main Wei River, China. Hydrol. Sci. J. 2016, 61, 1054–1068. [Google Scholar] [CrossRef]
- Yin, J.; Gentine, P.; Zhou, S.; Sullivan, S.C.; Wang, R.; Zhang, Y.; Guo, S. Large increase in global storm runoff extremes driven by climate and anthropogenic changes. Nat. Commun. 2018, 9, 4389. [Google Scholar] [CrossRef] [Green Version]
- Gudmundsson, L.; Boulange, J.; Do, H.X.; Gosling, S.N.; Grillakis, M.G.; Koutroulis, A.G.; Leonard, M.; Liu, J.; Schmied, H.M.; Papadimitriou, L.; et al. Globally observed trends in mean and extreme river flow attributed to climate change. Science 2021, 371, 1159. [Google Scholar] [CrossRef] [PubMed]
- Yuan, Y.; Zhang, C.; Zeng, G.; Liang, J.; Guo, S.; Huang, L.; Wu, H.; Hua, S. Quantitative assessment of the contribution of climate variability and human activity to streamflow alteration in Dongting Lake, China. Hydrol. Process. 2016, 30, 1929–1939. [Google Scholar] [CrossRef]
- Yang, H.; Yang, D.; Hu, Q. An error analysis of the Budyko hypothesis for assessing the contribution of climate change to runoff. Water Resour. Res. 2014, 50, 9620–9629. [Google Scholar] [CrossRef]
- Li, Z.; Xu, X.; Yu, B.; Xu, C.; Liu, M.; Wang, K. Quantifying the impacts of climate and human activities on water and sediment discharge in a karst region of southwest China. J. Hydrol. 2016, 542, 836–849. [Google Scholar] [CrossRef]
- Wu, J.; Miao, C.; Zhang, X.; Yang, T.; Duan, Q. Detecting the quantitative hydrological response to changes in climate and human activities. Sci. Total Environ. 2017, 586, 328–337. [Google Scholar] [CrossRef]
- Rakhimova, M.; Liu, T.; Bissenbayeva, S.; Mukanov, Y.; Gafforov, K.S.; Bekpergenova, Z.; Gulakhmadov, A. Assessment of the Impacts of Climate Change and Human Activities on Runoff Using Climate Elasticity Method and General Circulation Model (GCM) in the Buqtyrma River Basin, Kazakhstan. Sustainability 2020, 12, 4968. [Google Scholar] [CrossRef]
- Hu, J.; Ma, J.; Nie, C.; Xue, L.; Zhang, Y.; Ni, F.; Deng, Y.; Liu, J.; Zhou, D.; Li, L.; et al. Attribution Analysis of Runoff Change in Min-Tuo River Basin based on SWAT model simulations, China. Sci. Rep. 2020, 10, 2900. [Google Scholar] [CrossRef] [Green Version]
- He, Y.; Qiu, H.; Song, J.; Zhao, Y.; Zhang, L.; Hu, S.; Hu, Y. Quantitative contribution of climate change and human activities to runoff changes in the Bahe River watershed of the Qinling Mountains, China. Sustain. Cities Soc. 2019, 51, 101729. [Google Scholar] [CrossRef]
- Zhao, G.; Tian, P.; Mu, X.; Jiao, J.; Wang, F.; Gao, P. Quantifying the impact of climate variability and human activities on streamflow in the middle reaches of the Yellow River basin, China. J. Hydrol. 2014, 519, 387–398. [Google Scholar] [CrossRef]
- Maheswaran, R.; Khosa, R. Wavelet–Volterra coupled model for monthly stream flow forecasting. J. Hydrol. 2012, 450, 320–335. [Google Scholar] [CrossRef]
- Ouali, D.; Chebana, F.; Ouarda, T.B.M.J. Fully nonlinear statistical and machine-learning approaches for hydrological frequency estimation at ungauged sites. J. Adv. Model. Earth Syst. 2017, 9, 1292–1306. [Google Scholar] [CrossRef]
- Reichstein, M.; Camps-Valls, G.; Stevens, B.; Jung, M.; Denzler, J.; Carvalhais, N.; Prabhat. Deep learning and process understanding for data-driven Earth system science. Nature 2019, 566, 195–204. [Google Scholar] [CrossRef]
- Tikhamarine, Y.; Souag-Gamane, D.; Ahmed, A.N.; Sammen, S.S.; Kisi, O.; Huang, Y.F.; El-Shafie, A. Rainfall-runoff modelling using improved machine learning methods: Harris hawks optimizer vs. particle swarm optimization. J. Hydrol. 2020, 589, 125133. [Google Scholar] [CrossRef]
- Wang, Z.; Lai, C.; Chen, X.; Yang, B.; Zhao, S.; Bai, X. Flood hazard risk assessment model based on random forest. J. Hydrol. 2015, 527, 1130–1141. [Google Scholar] [CrossRef]
- Kun, Y.; Jie, H. China Meteorological Forcing Dataset (1979–2015). 2016. Available online: https://doi.org/10.3972/westdc.002.2014.db (accessed on 21 June 2022).
- Ma, N.; Jozsef, S.; Zhang, Y.; Liu, W. Terrestrial Evapotranspiration Dataset across China (1982–2017); National Tibetan Plateau Data Center: Beijing, China, 2019. [Google Scholar]
- Mann, H.B. Nonparametric Tests Against Trend. Econometrica 1945, 13, 245–259. [Google Scholar] [CrossRef]
- Kendall, M.G. Rank Correlation Methods, 4th ed.; Charles Griffin: London, UK, 1975. [Google Scholar]
- Li, B.F.; Shi, X.; Lian, L.S.; Chen, Y.N.; Chen, Z.S.; Sun, X.Y. Quantifying the effects of climate variability, direct and indirect land use change, and human activities on runoff. J. Hydrol. 2020, 584, 124684. [Google Scholar] [CrossRef]
- Song, X.Y.; Sun, W.Y.; Zhang, Y.Q.; Song, S.B.; Li, J.Y.; Gao, Y.J. Using hydrological modelling and data-driven approaches to quantify mining activities impacts on centennial streamflow. J. Hydrol. 2020, 585, 124764. [Google Scholar] [CrossRef]
- R Core Team. R: A Language and Environment for Statistical Computing. R Foundation for Statistical Computing: Vienna, Austria, 2019. [Google Scholar]
- Xu, X.; Yang, D.; Yang, H.; Lei, H. Attribution analysis based on the Budyko hypothesis for detecting the dominant cause of runoff decline in Haihe basin. J. Hydrol. 2014, 510, 530–540. [Google Scholar] [CrossRef]
- Pettitt, A.N. A Non-Parametric Approach to the Change-Point. Problem. J. R. Stat. Soc. Ser. C 1979, 28, 126–135. [Google Scholar] [CrossRef]
- Yang, H.; Yang, D.; Lei, Z.; Sun, F. New analytical derivation of the mean annual water-energy balance equation. Water Resour. 2008, 44, 893–897. [Google Scholar] [CrossRef]
- Fu, G.; Charles, S.P.; Chiew, F.H.S. A two-parameter climate elasticity of streamflow index to assess climate change effects on annual streamflow. Water Resour. Res. 2007, 43, 2578–2584. [Google Scholar] [CrossRef]
- Zhang, L.; Dawes, W.R.; Walker, G.R. Response of mean annual evapotranspiration to vegetation changes at catchment scale. Water Resour. Res. 2001, 37, 701–708. [Google Scholar] [CrossRef]
- Chadalawada, J.; Herath, H.; Babovic, V. Hydrologically Informed Machine Learning for Rainfall-Runoff Modeling: A Genetic Programming-Based Toolkit for Automatic Model Induction. Water Resour. Res. 2020, 56, e2019WR026933. [Google Scholar] [CrossRef]
- Oppel, H.; Schumann, A.H. Machine learning based identification of dominant controls on runoff dynamics. Hydrol. Process. 2020, 34, 2450–2465. [Google Scholar] [CrossRef]
- Wen, X.H.; Feng, Q.; Deo, R.C.; Wu, M.; Yin, Z.L.; Yang, L.S.; Singh, V.P. Two-phase extreme learning machines integrated with the complete ensemble empirical mode decomposition with adaptive noise algorithm for multi-scale runoff prediction problems. J. Hydrol. 2019, 570, 167–184. [Google Scholar] [CrossRef]
- Breiman, L. Bagging Predictors. Mach. Learn. 1996, 24, 123–140. [Google Scholar] [CrossRef] [Green Version]
- Kehoe, M.J.; Chun, K.P.; Baulch, H.M. Who Smells? Forecasting Taste and Odor in a Drinking Water Reservoir. Environ. Sci. Technol. 2015, 49, 10984–10992. [Google Scholar] [CrossRef]
- Strobl, C.; Malley, J.; Tutz, G. An Introduction to Recursive Partitioning: Rationale, Application and Characteristics of Classification and Regression Trees, Bagging and Random Forests. Psychol. Methods 2009, 14, 323–348. [Google Scholar] [CrossRef] [PubMed] [Green Version]
- Hu, S.; Zheng, H.; Liu, C.; Yu, J.; Wang, Z. Assessing the Impacts of Climate Variability and Human Activities on Streamflow in the Water Source Area of Baiyangdian Lake. J. Geogr. Sci. 2012, 22, 895–905. [Google Scholar] [CrossRef]
- Shen, Q.; Cong, Z.; Lei, H. Evaluating the impact of climate and underlying surface change on runoff within the Budyko framework: A study across 224 catchments in China. J. Hydrol. 2017, 554, 251–262. [Google Scholar] [CrossRef]
- Amanambu, A.C.; Obarein, O.A.; Mossa, J.; Li, L.; Ayeni, S.S.; Balogun, O.; Oyebamiji, A.; Ochege, F.U. Groundwater system and climate change: Present status and future considerations. J. Hydrol. 2020, 589, 125163. [Google Scholar] [CrossRef]
Figure 1.
Location of the river basins and gauge stations in this study.

Figure 2.
The characteristics and statistics of LULC from 1980 to 2018 in the study area: (a) the Daomaguan basin, (b) the Zijinguan basin.
Figure 2.
The characteristics and statistics of LULC from 1980 to 2018 in the study area: (a) the Daomaguan basin, (b) the Zijinguan basin.

Figure 3.
(a) Monthly trends of precipitation (mm), actual evapotranspiration (mm), runoff (mm), and air temperature (°C) from 1982 to 2014 in the Daomaguan basin; (b) monthly trends of precipitation, actual evapotranspiration, runoff, and air temperature from 1982 to 2014 in the Zijinguan basin; (c) monthly trends of NDVI from 1982 to 2014 in the Daomaguan basin; (d) monthly trends of NDVI from 1982 to 2014 in the Zijinguan basin.

Figure 4.
Results of linear regression between accumulated annual precipitation versus accumulated annual runoff from 1982 to 1998 in the (a) Daomaguan basin and (b) Zijinguan basin.
Figure 4.
Results of linear regression between accumulated annual precipitation versus accumulated annual runoff from 1982 to 1998 in the (a) Daomaguan basin and (b) Zijinguan basin.

Figure 5.
The results of modeled VS observed runoff in the Daomaguan basin (a) and the Zijinguan basin (b).
Figure 5.
The results of modeled VS observed runoff in the Daomaguan basin (a) and the Zijinguan basin (b).


Table 1.
Results of MK trend analysis for precipitation, air temperature, actual evapotranspiration, NDVI and runoff. The “*” represents the significant trend.
Table 1.
Results of MK trend analysis for precipitation, air temperature, actual evapotranspiration, NDVI and runoff. The “*” represents the significant trend.
| Slope | ||
|---|---|---|
| Daomaguan | Zijinguan | |
| Precipitation | −0.003 | 0.003 |
| Air temperature | 0.011 * | 0.006 |
| Actual evapotranspiration | 0.001 | <0.001 |
| NDVI | 0.579 * | 0.359 |
| Runoff | −0.005 * | −0.008 * |
Table 2.
Statistical results of double-mass curve, elasticity-based, and random forest methods including contribution rates, differences in annual averaged P, ET0, and R.
Table 2.
Statistical results of double-mass curve, elasticity-based, and random forest methods including contribution rates, differences in annual averaged P, ET0, and R.
| Data Period | Method | Before and after Breakpointperiods | ΔP (mm) | ΔET0 (mm) | ΔR (mm) | Contribution to Runoff Changes (%) | |
|---|---|---|---|---|---|---|---|
| Human | Climate | ||||||
| Daomaguan Basin | Double-mass curve method | 1982–1998 1999–2014 | −43.64 | 82.41 | −29.76 | 69% | 31% |
| Elasticity-based method | 56% | 44% | |||||
| Random Forest method | 66% | 34% | |||||
| Zijinguan Basin | Double-mass curve method | 1982–2000 2001–2014 | 0.71 | 23.58 | −50.18 | 94% | 6% |
| Elasticity-based method | 91% | 9% | |||||
| Random Forest method | 94% | 6% | |||||
Publisher’s Note: MDPI stays neutral with regard to jurisdictional claims in published maps and institutional affiliations. |
© 2022 by the authors. Licensee MDPI, Basel, Switzerland. This article is an open access article distributed under the terms and conditions of the Creative Commons Attribution (CC BY) license (https://creativecommons.org/licenses/by/4.0/).
Share and Cite
MDPI and ACS Style
Liu, X.; Zhang, X.; Kong, X.; Shen, Y.-J. Random Forest Model Has the Potential for Runoff Simulation and Attribution. Water 2022, 14, 2053. https://doi.org/10.3390/w14132053
AMA Style
Liu X, Zhang X, Kong X, Shen Y-J. Random Forest Model Has the Potential for Runoff Simulation and Attribution. Water. 2022; 14(13):2053. https://doi.org/10.3390/w14132053
Chicago/Turabian StyleLiu, Xia, Xiaolong Zhang, Xiaole Kong, and Yan-Jun Shen. 2022. "Random Forest Model Has the Potential for Runoff Simulation and Attribution" Water 14, no. 13: 2053. https://doi.org/10.3390/w14132053
Note that from the first issue of 2016, this journal uses article numbers instead of page numbers. See further details here.