
Monitoring of Multi-Aspect Drought Severity and Socio-Economic Status in the Semi-Arid Regions of Eastern Tamil Nadu, India

 ,
,  ,
,  , , , , and
Abstract
:1. Introduction
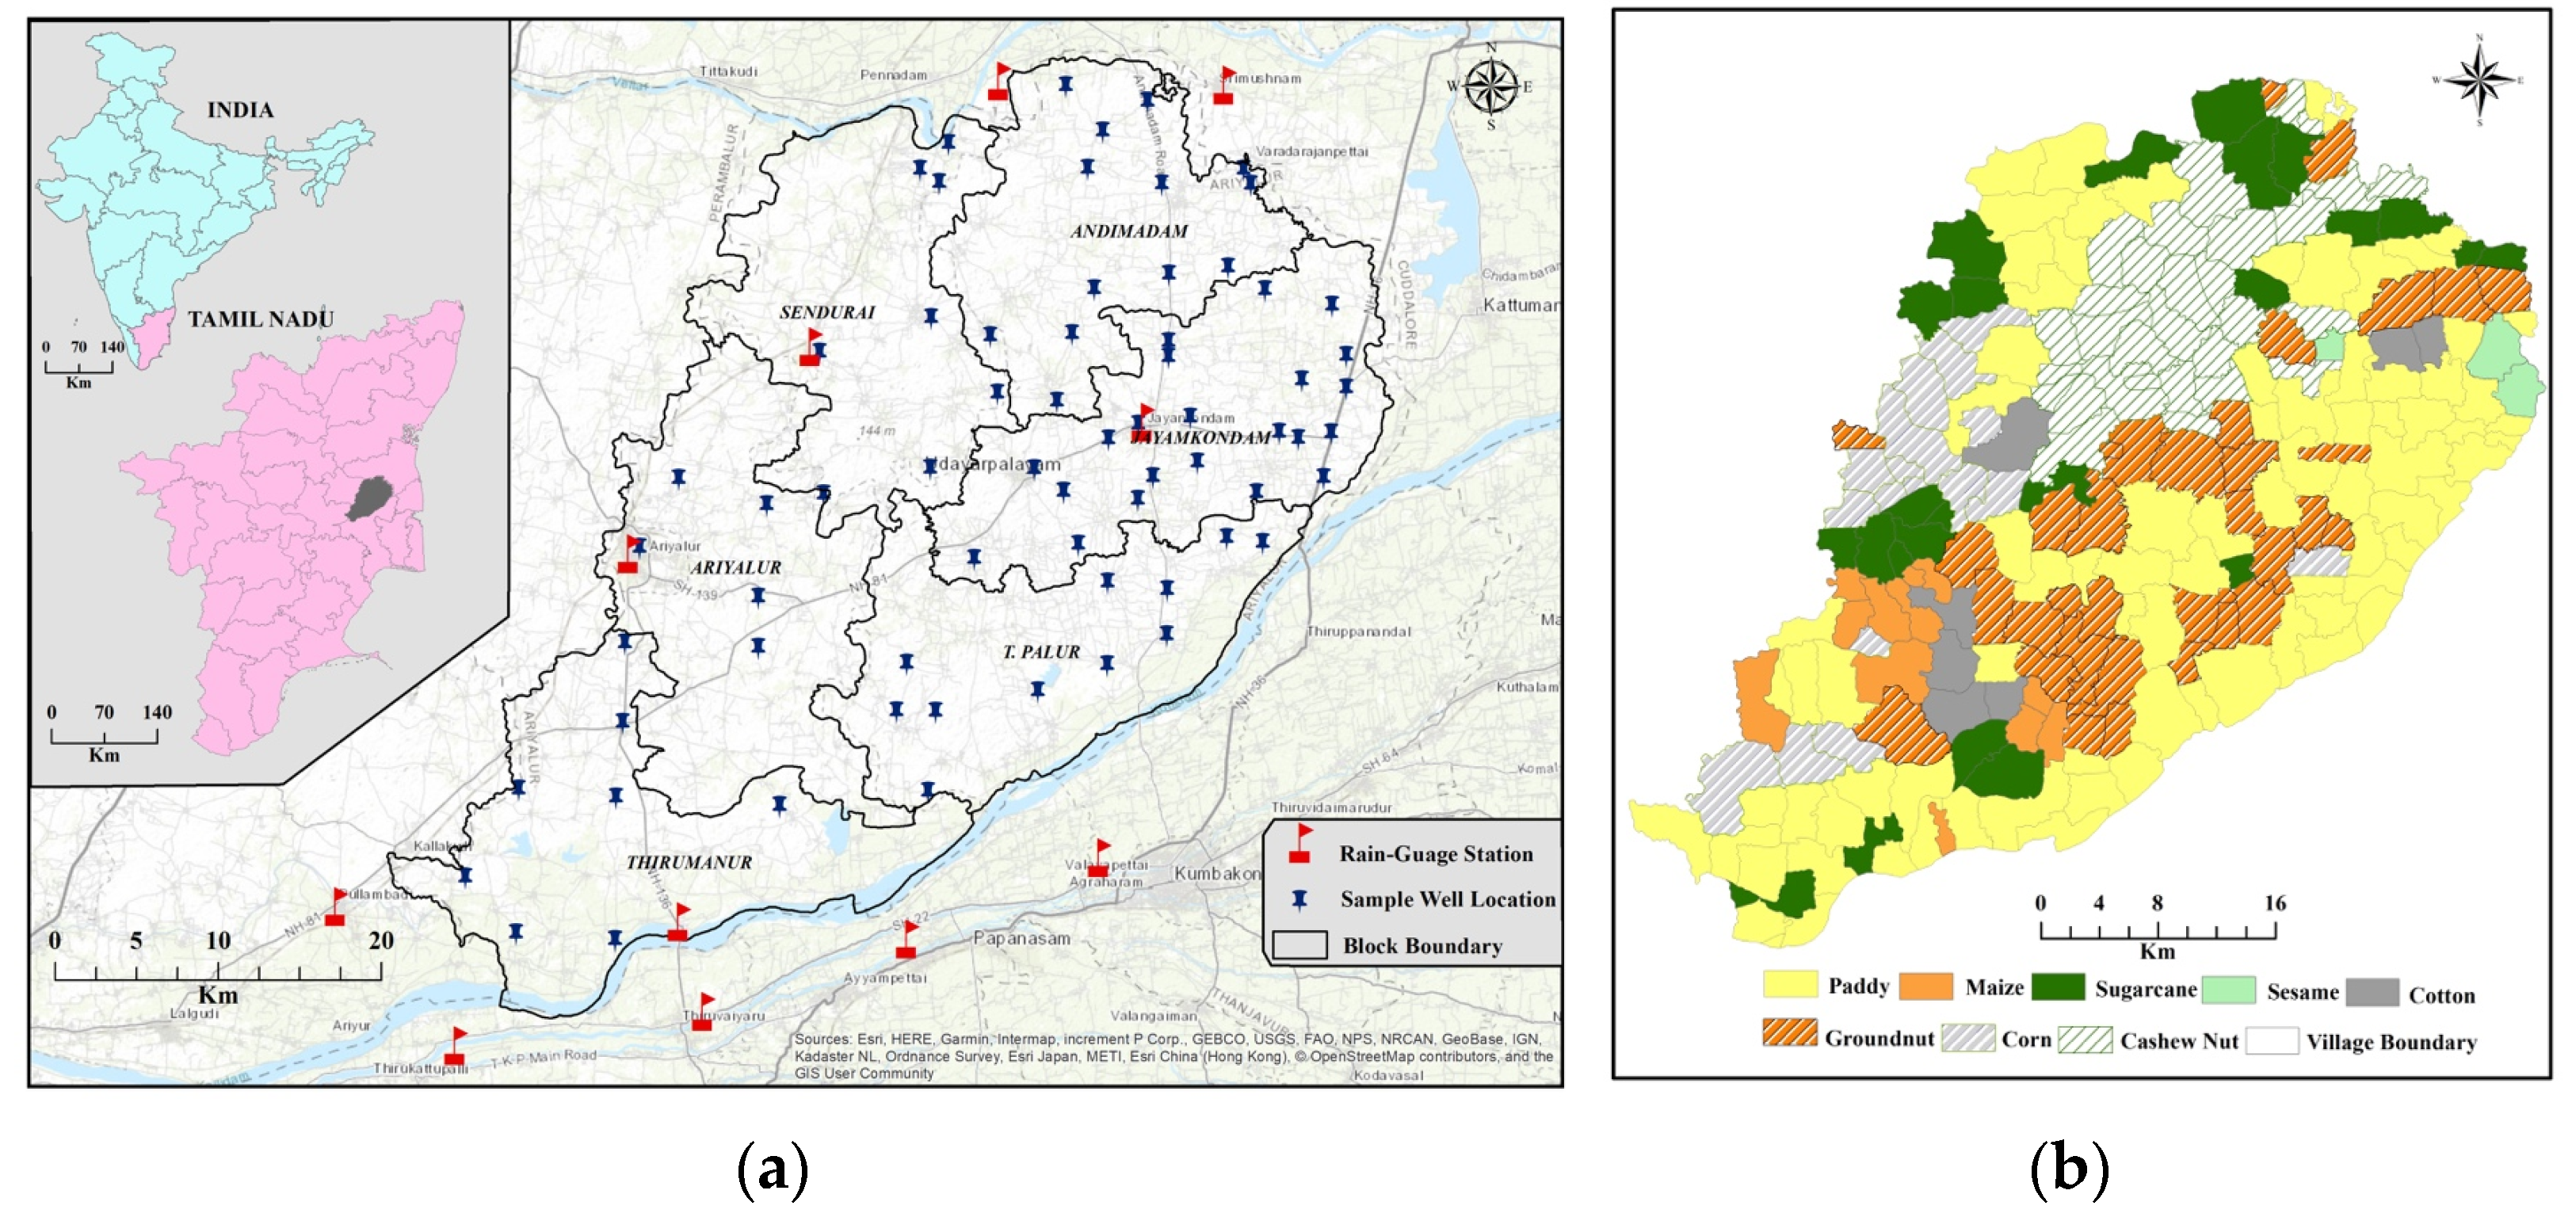
2. Study Area
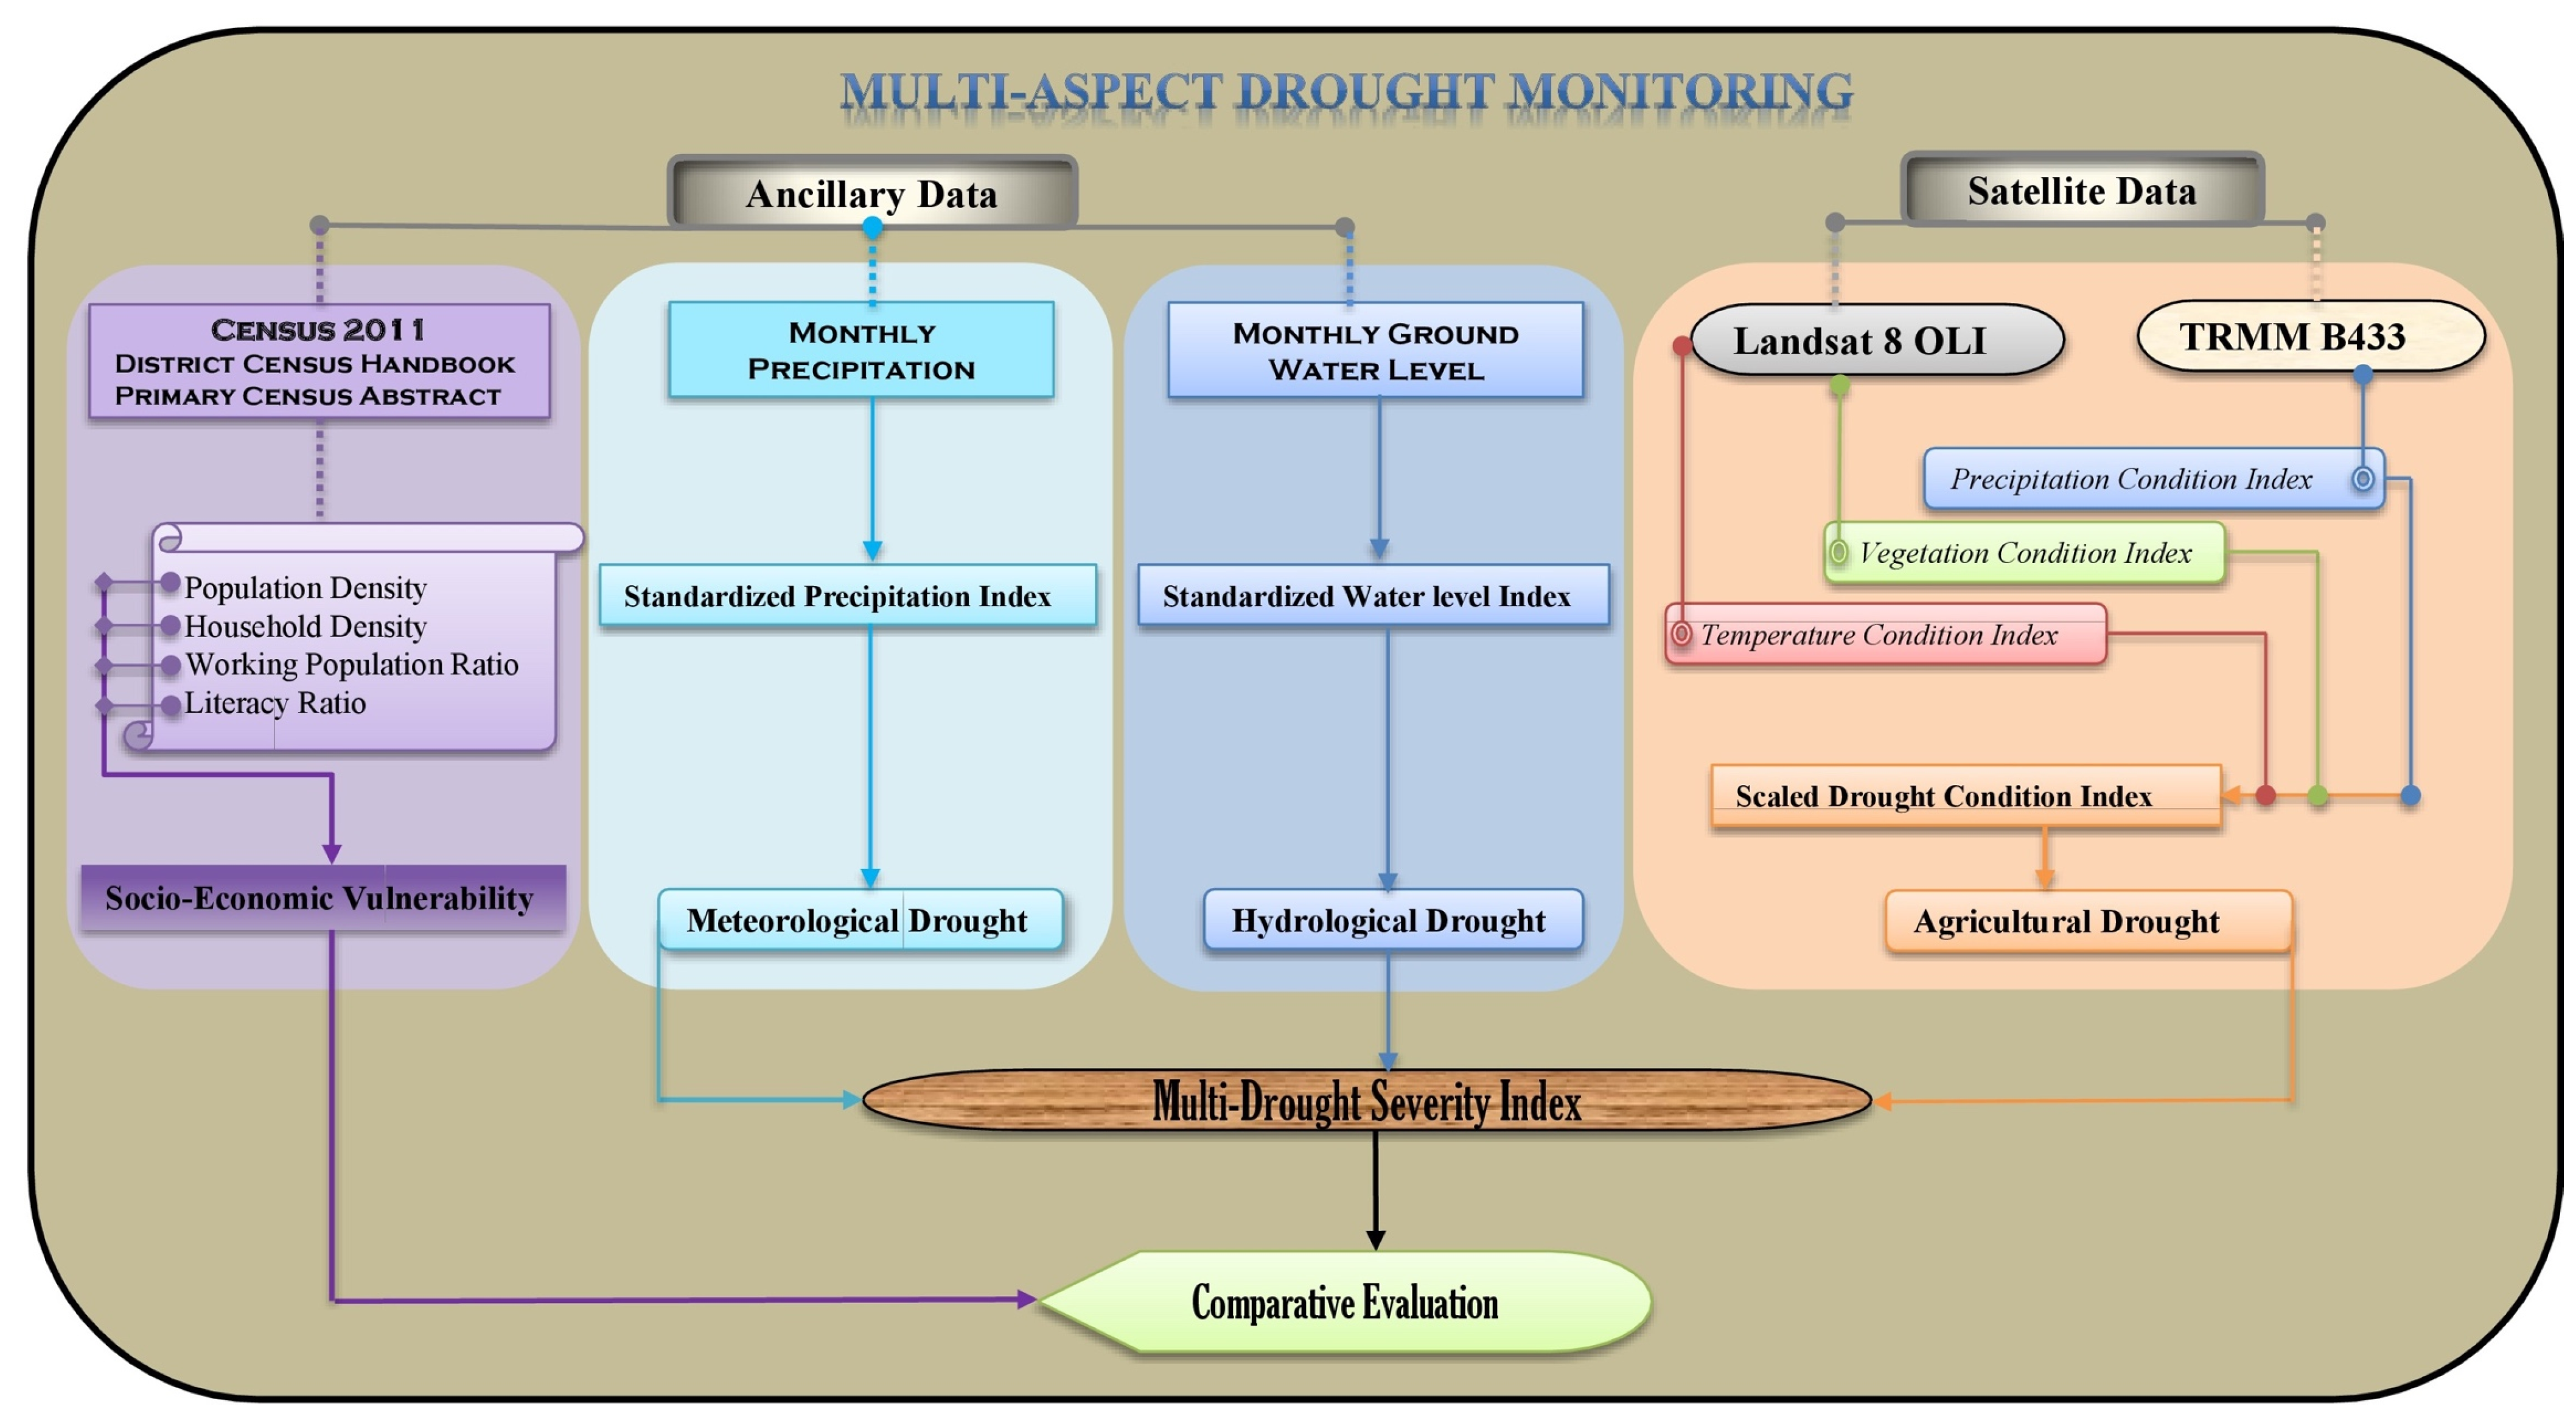
3. Materials and Methods
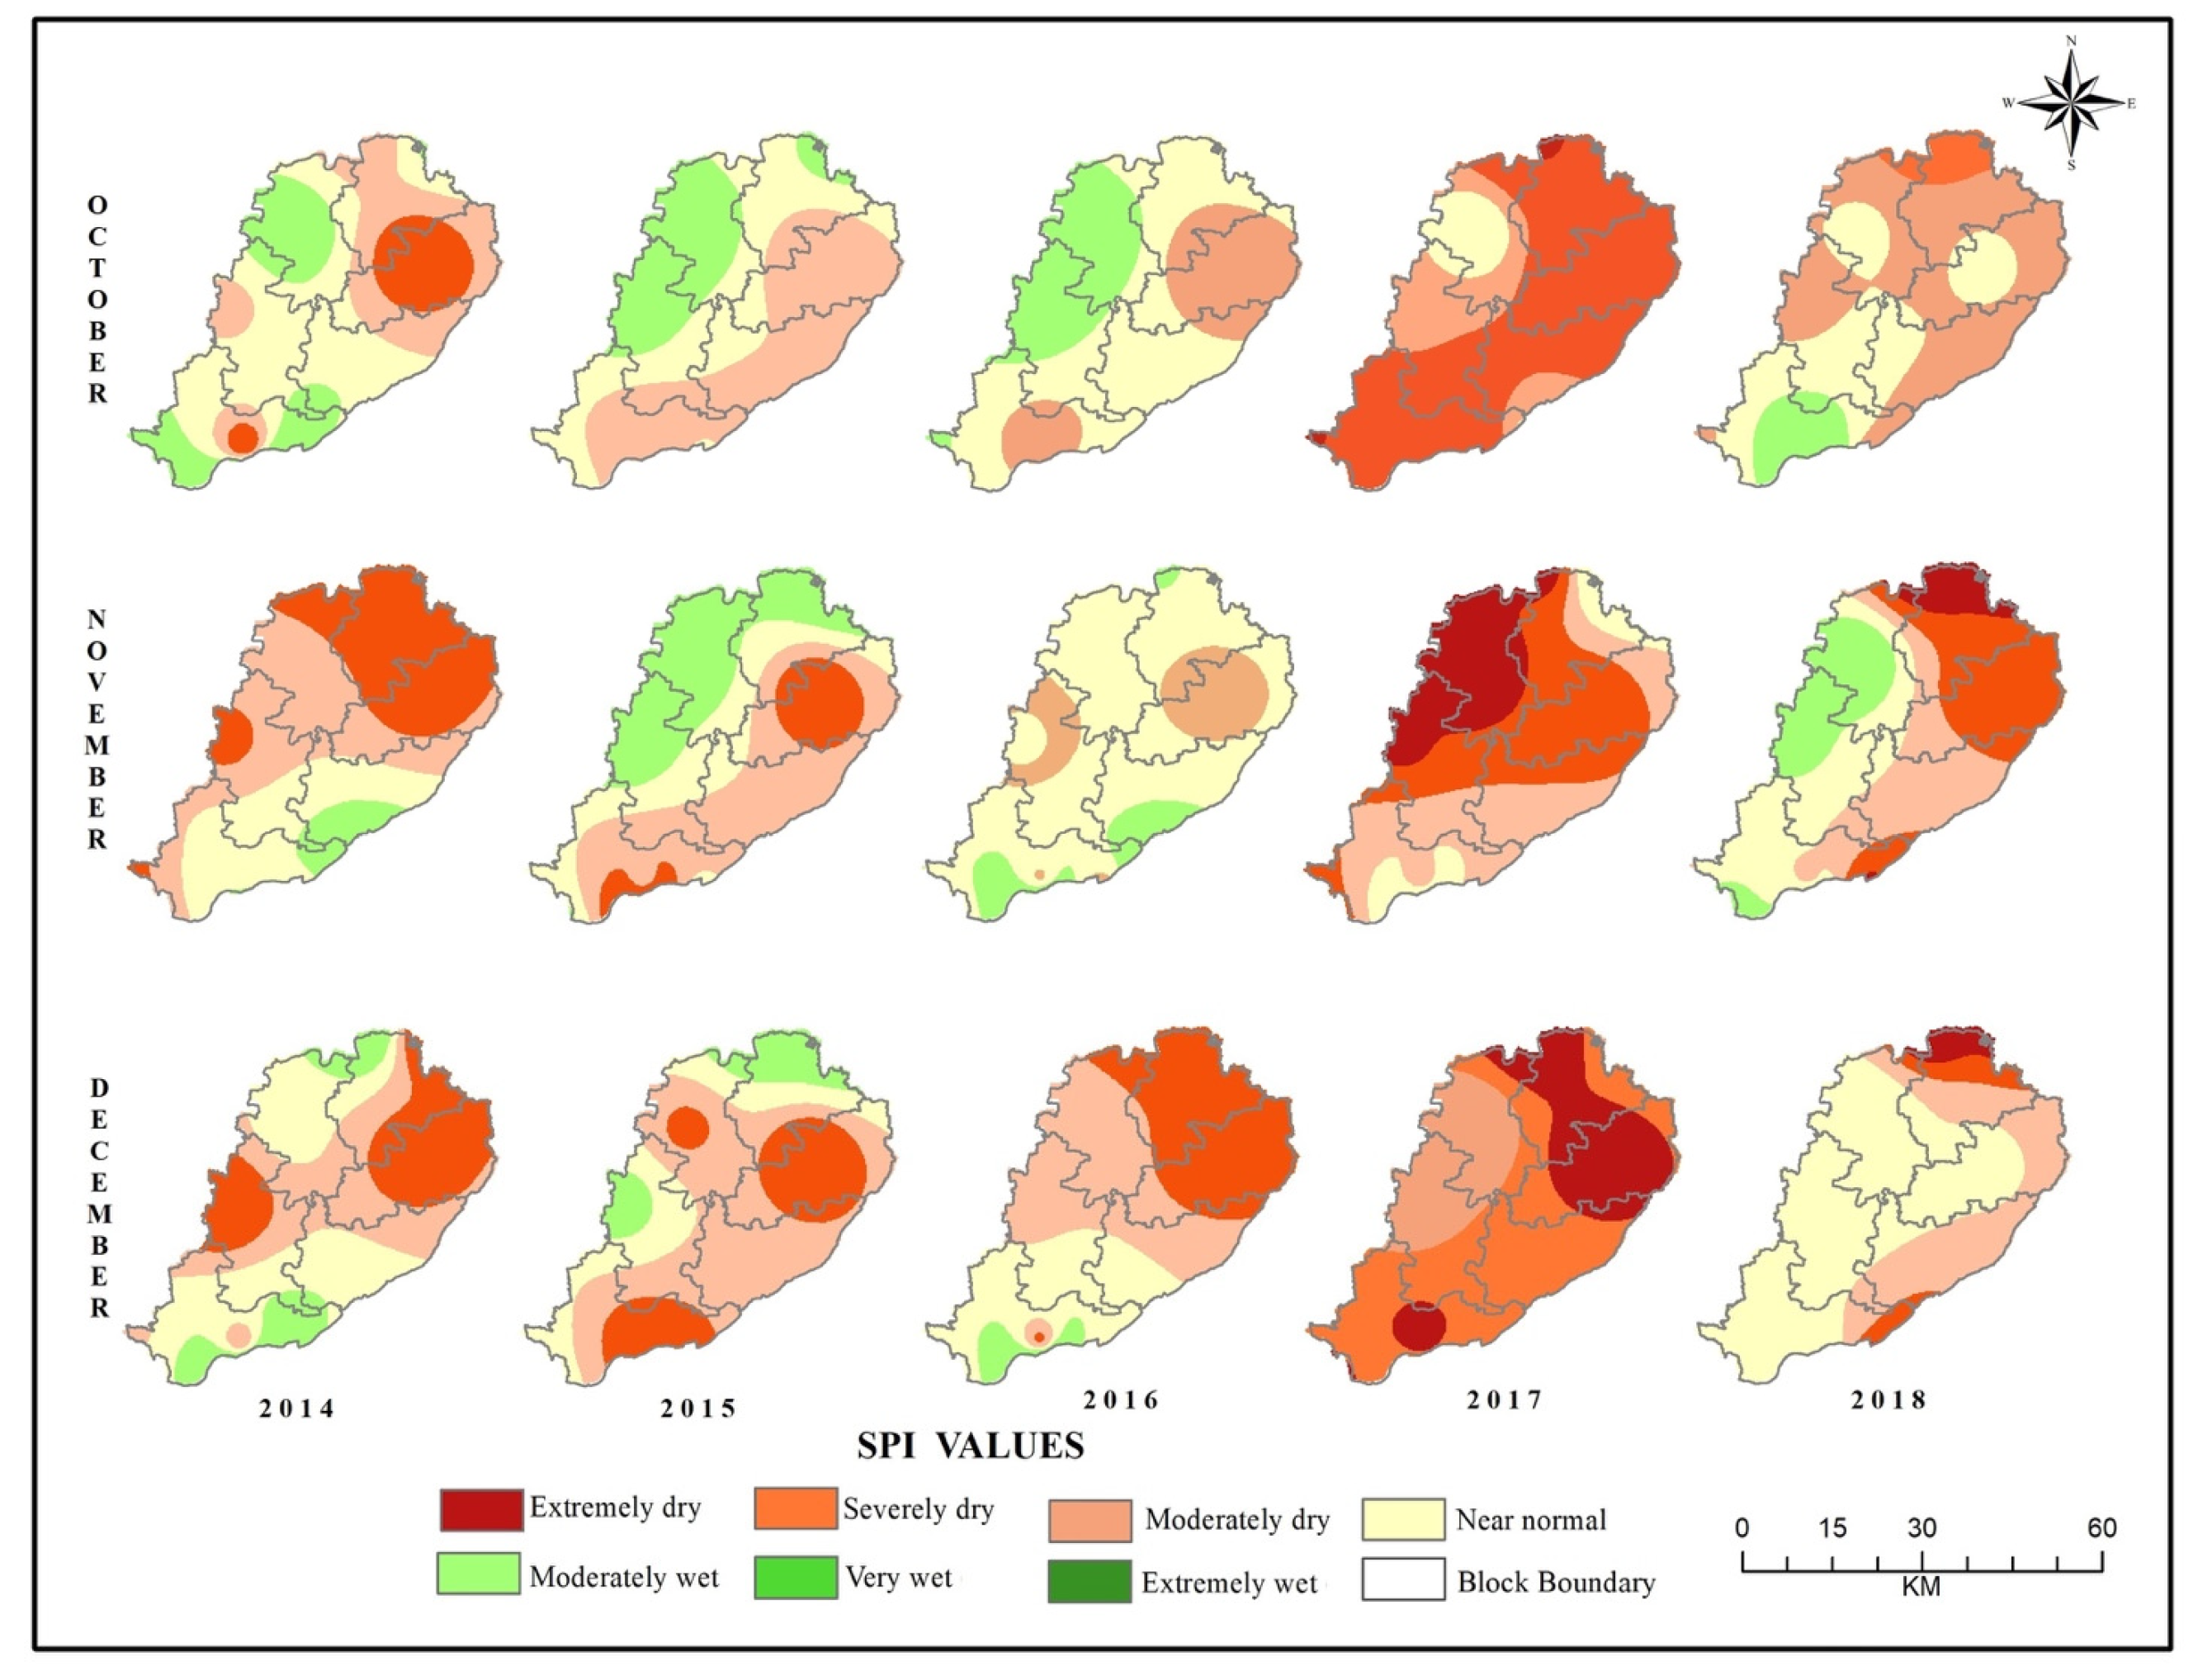
3.1. Meteorological Drought
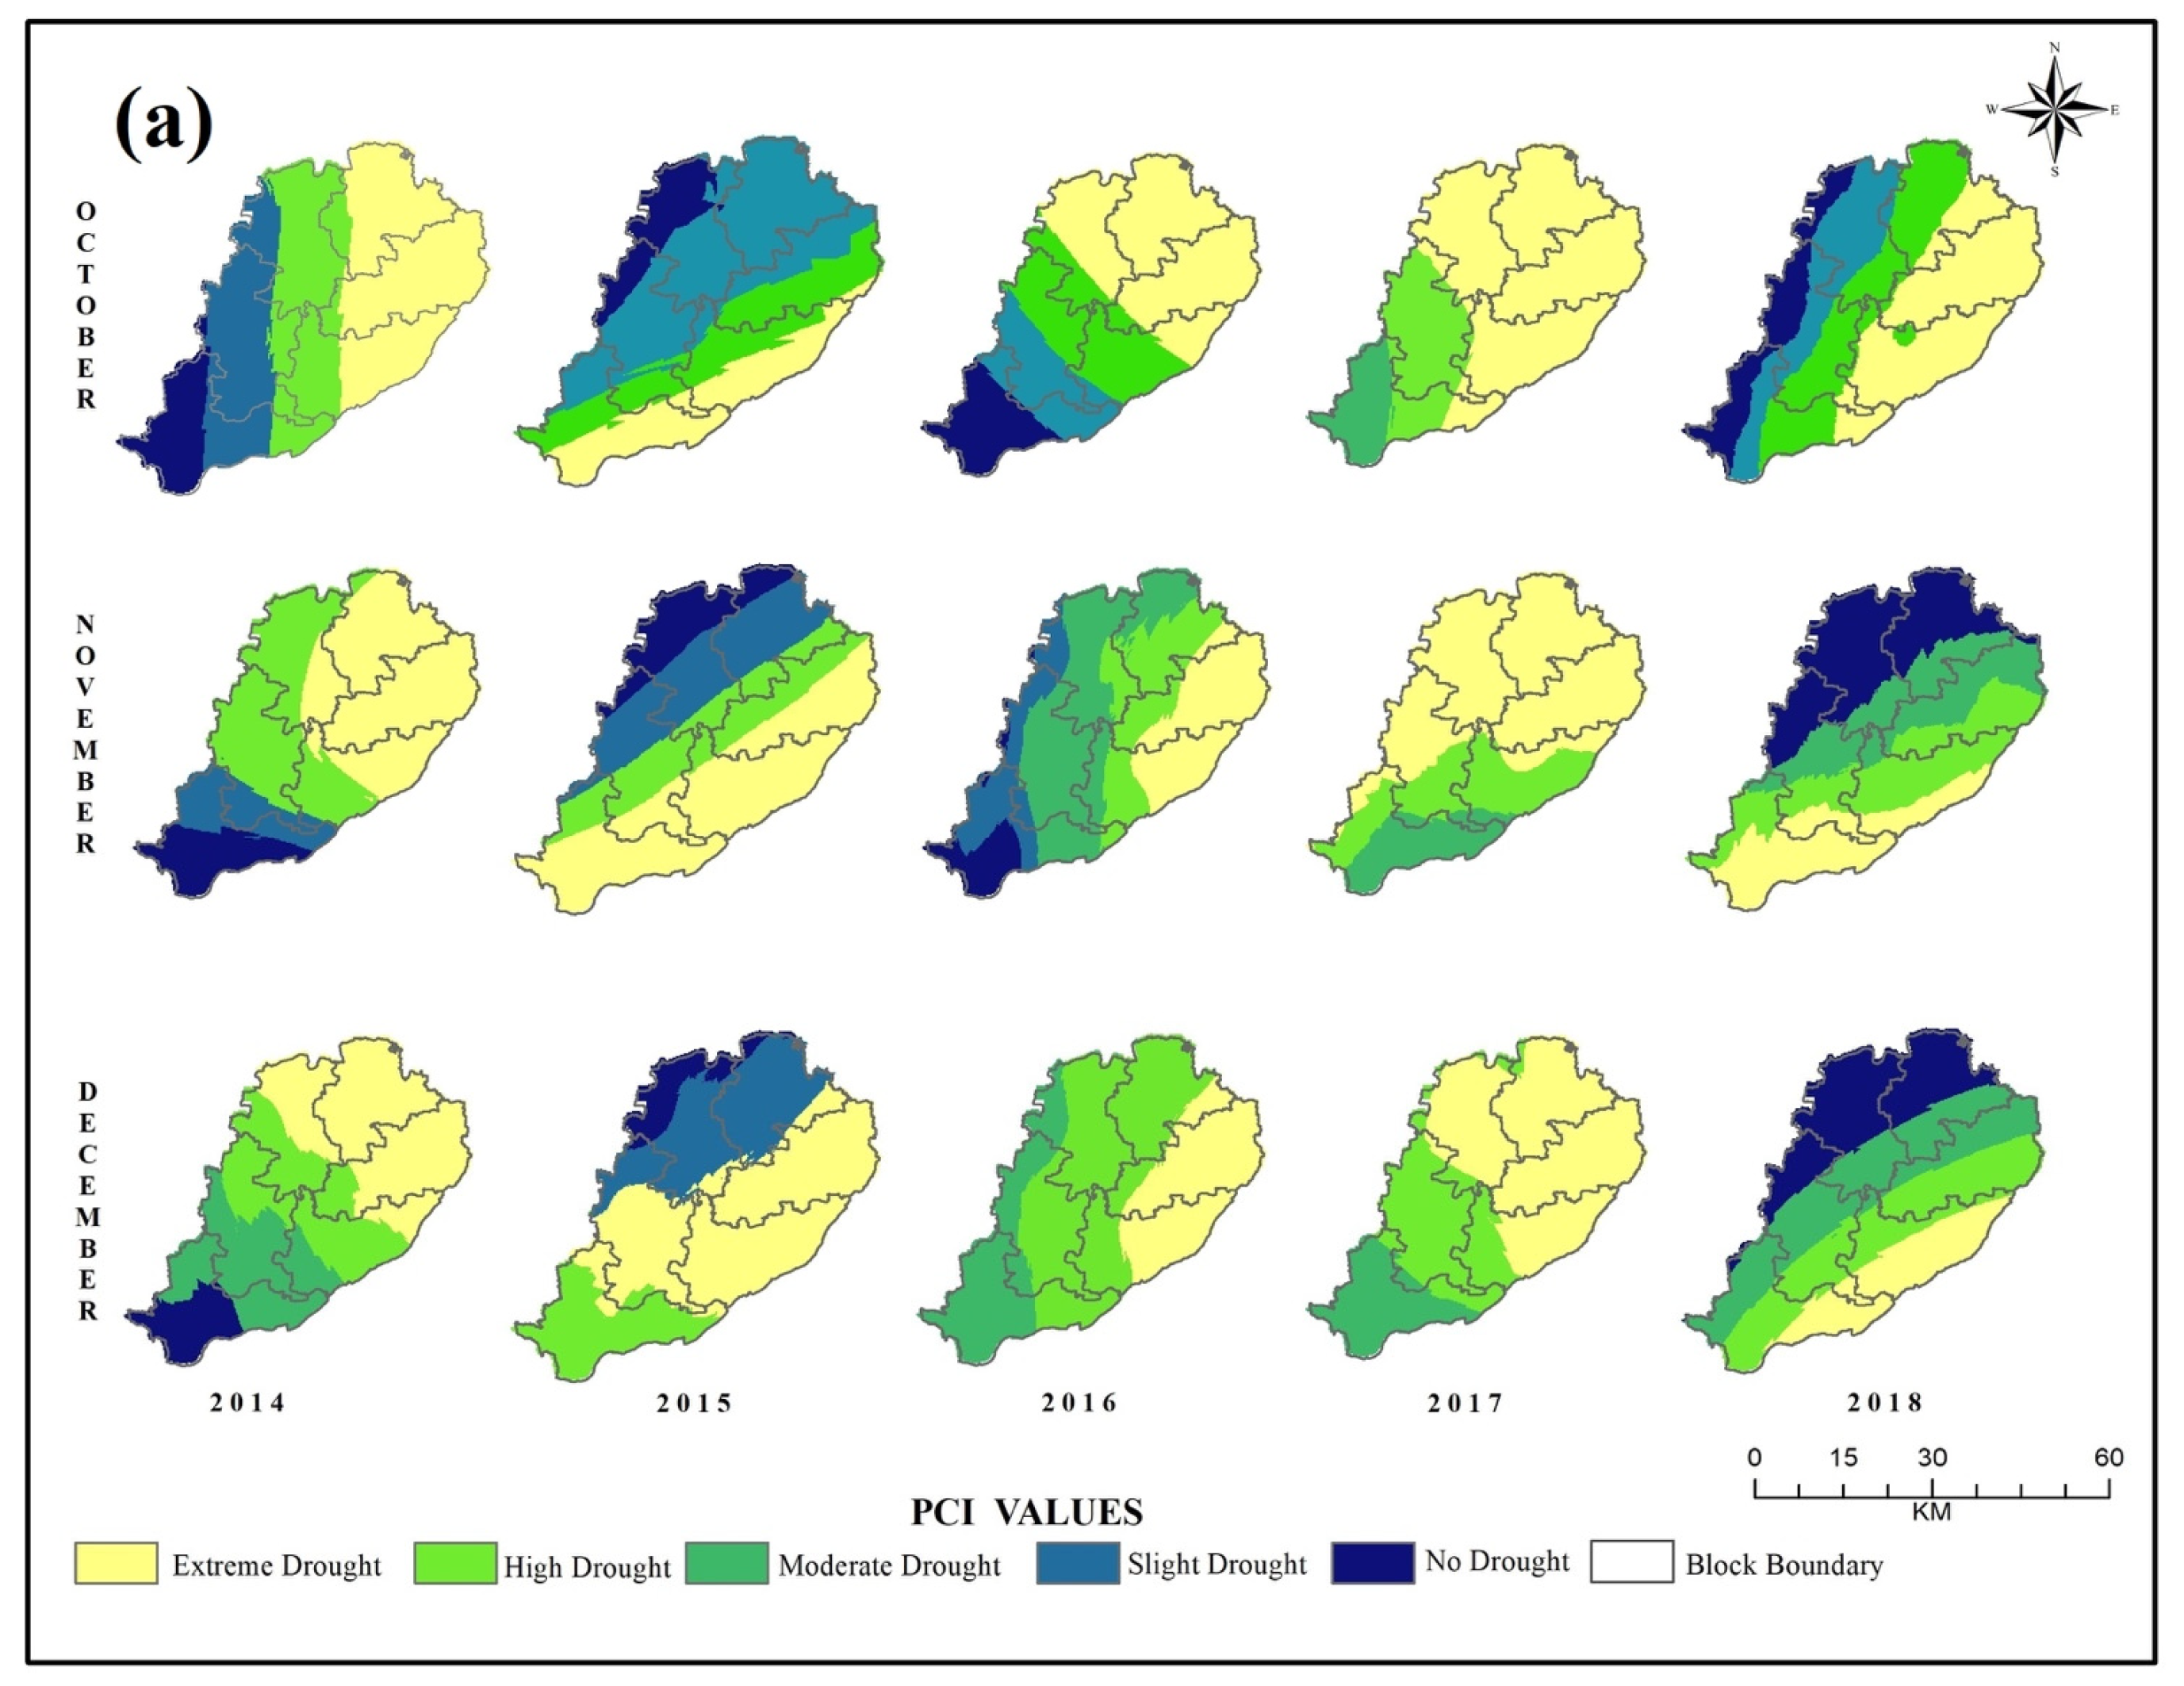
3.2. Agricultural Drought
3.3. Hydrological Drought
3.4. Multi-Drought Severity Index (MDSI)
3.5. Socio-Economic Vulnerability (SEV)

| Formula/Index | Description |
|---|---|
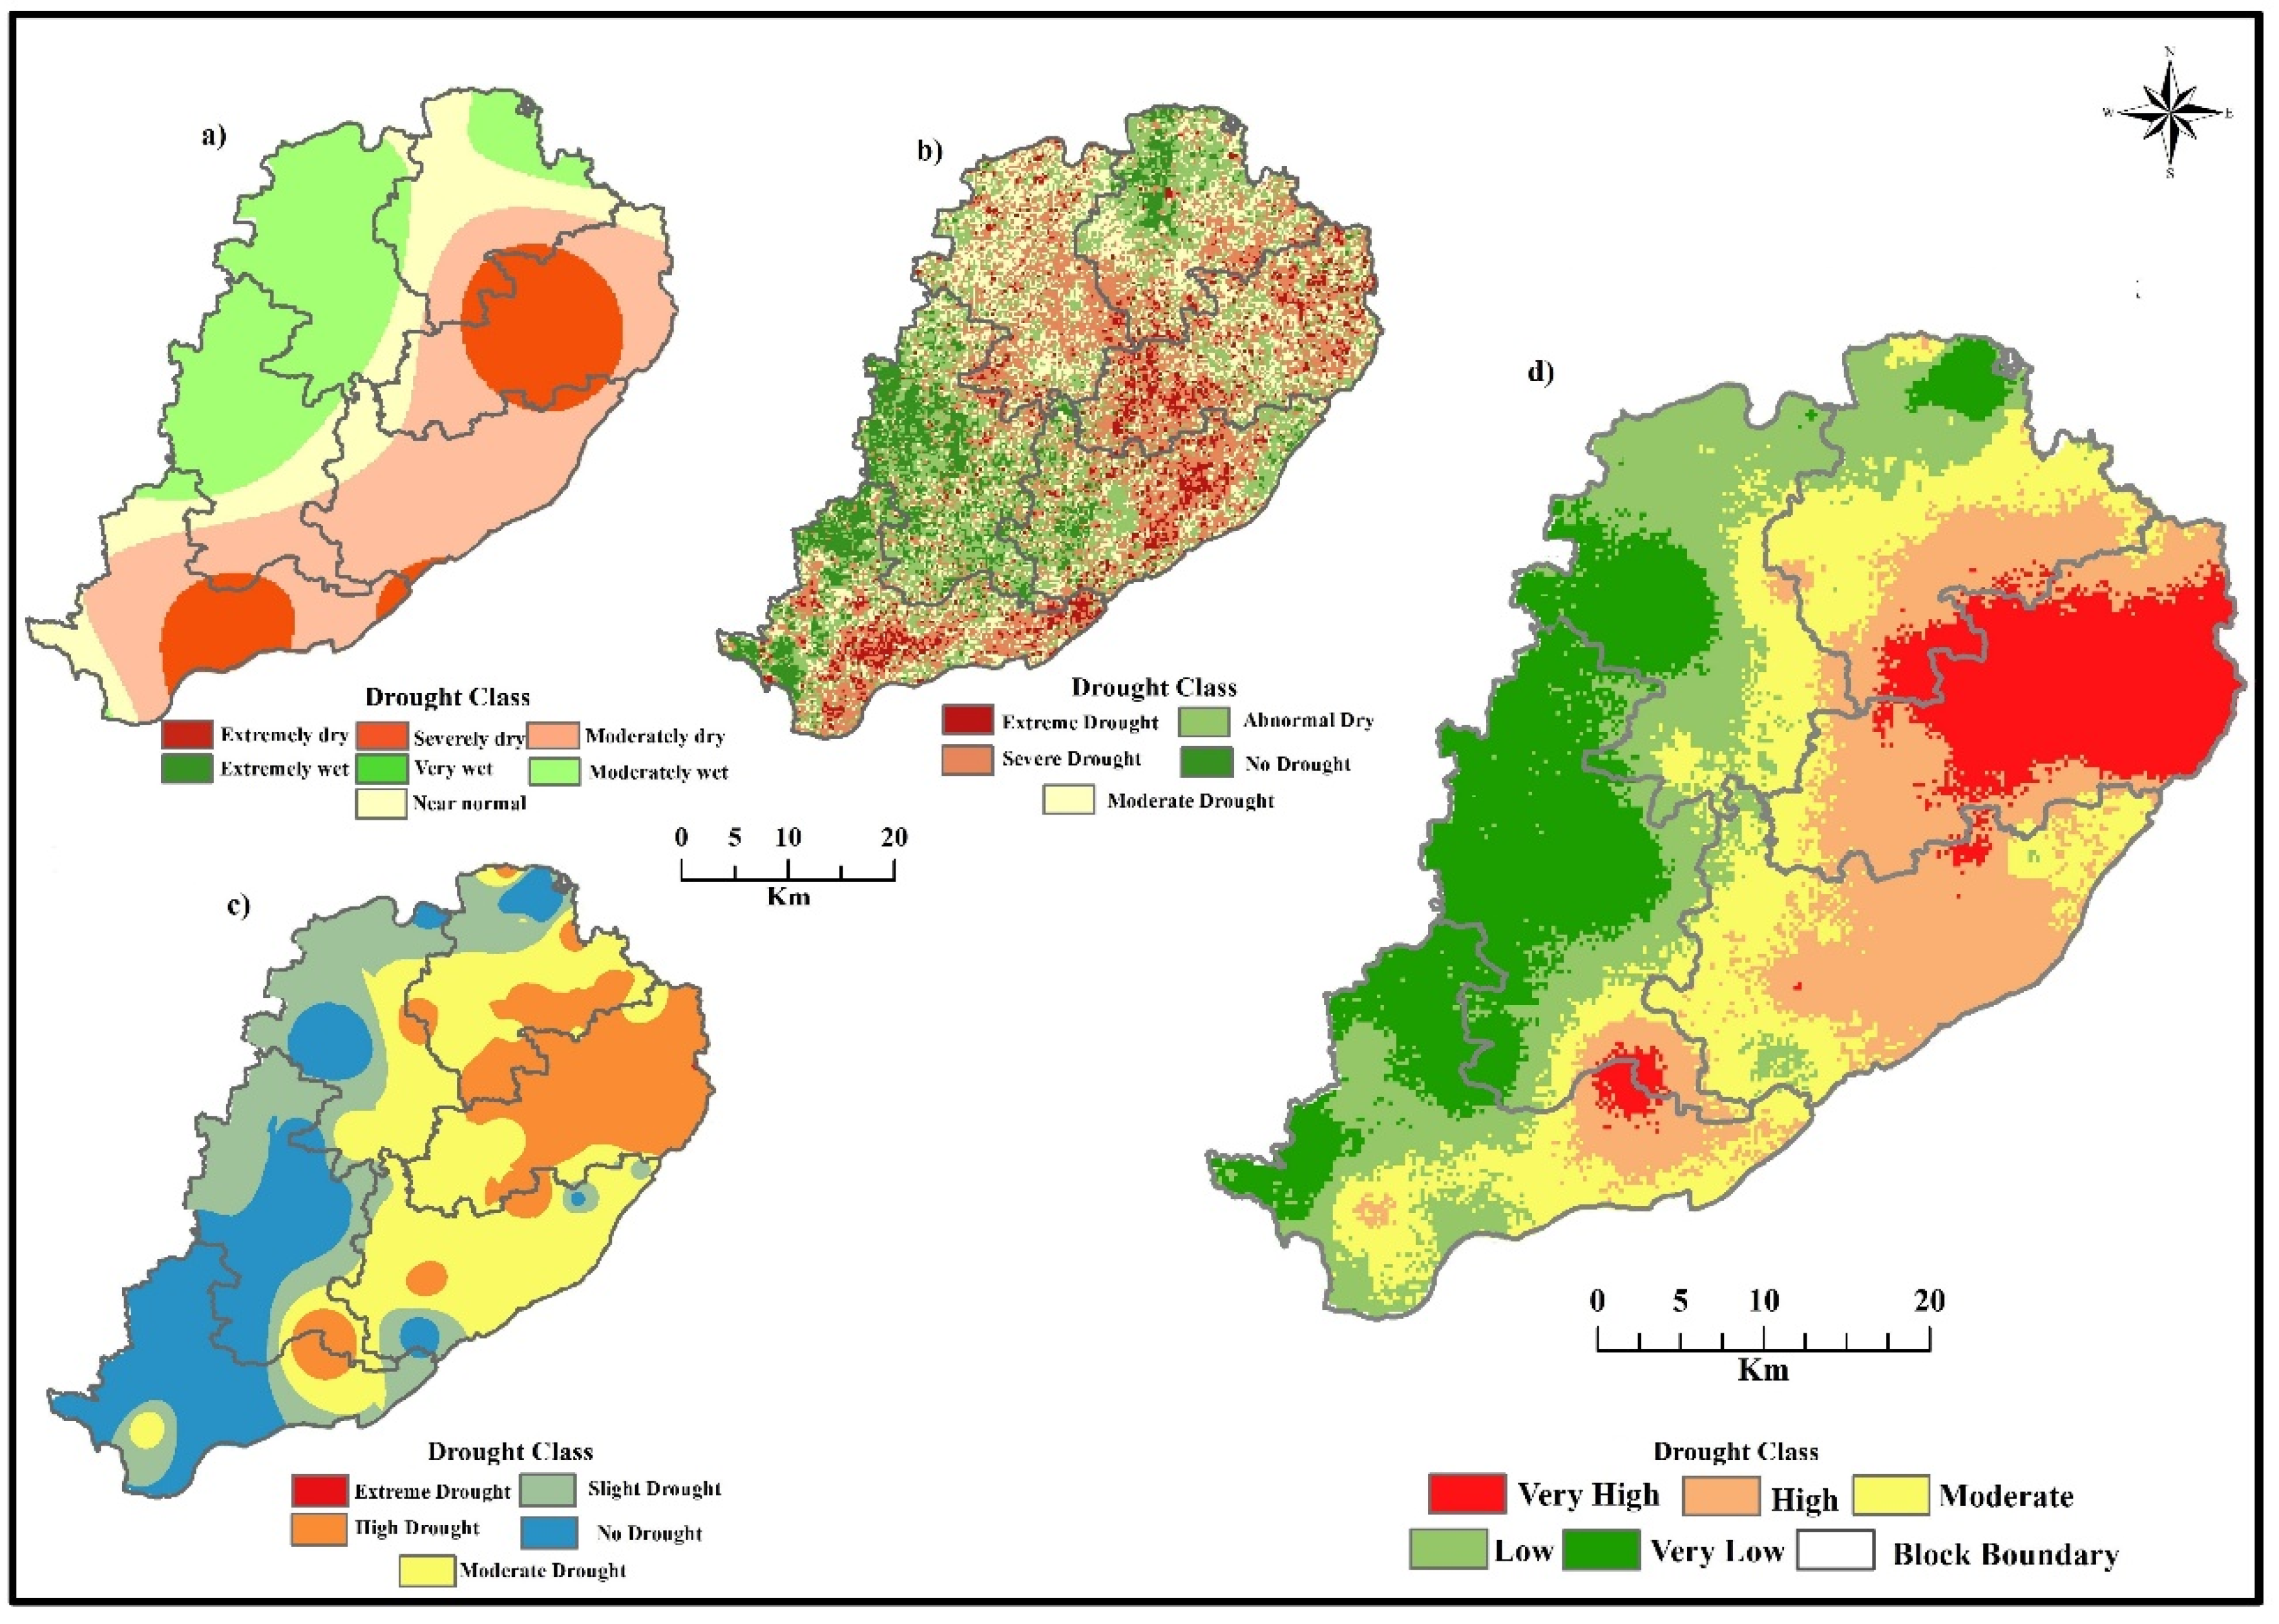
| SPI is standardized precipitation index, Xij is the precipitation of ith month and ith year, Xim is mean of the seasonal precipitation received by the same rain-gauge station, and σ is the standard deviation. It categorizes the severity of meteorological drought into seven major classes, extending from extremely dry to extremely wet (Table 3) [45]. | |
| PCI is precipitation-condition index, TRMM is a pixel value of monthly precipitation, and TRMMmax and TRMMmin are maximum and minimum values of the same months of the year between 2014 and 2018 CE. The intensity of drought severity based on the PCI value ranges from 0 to 1 (Table 4). The values nearerst to 1 are characterized as no drought (wet condition), and values nearest to 0 represent extreme drought [2]. | |
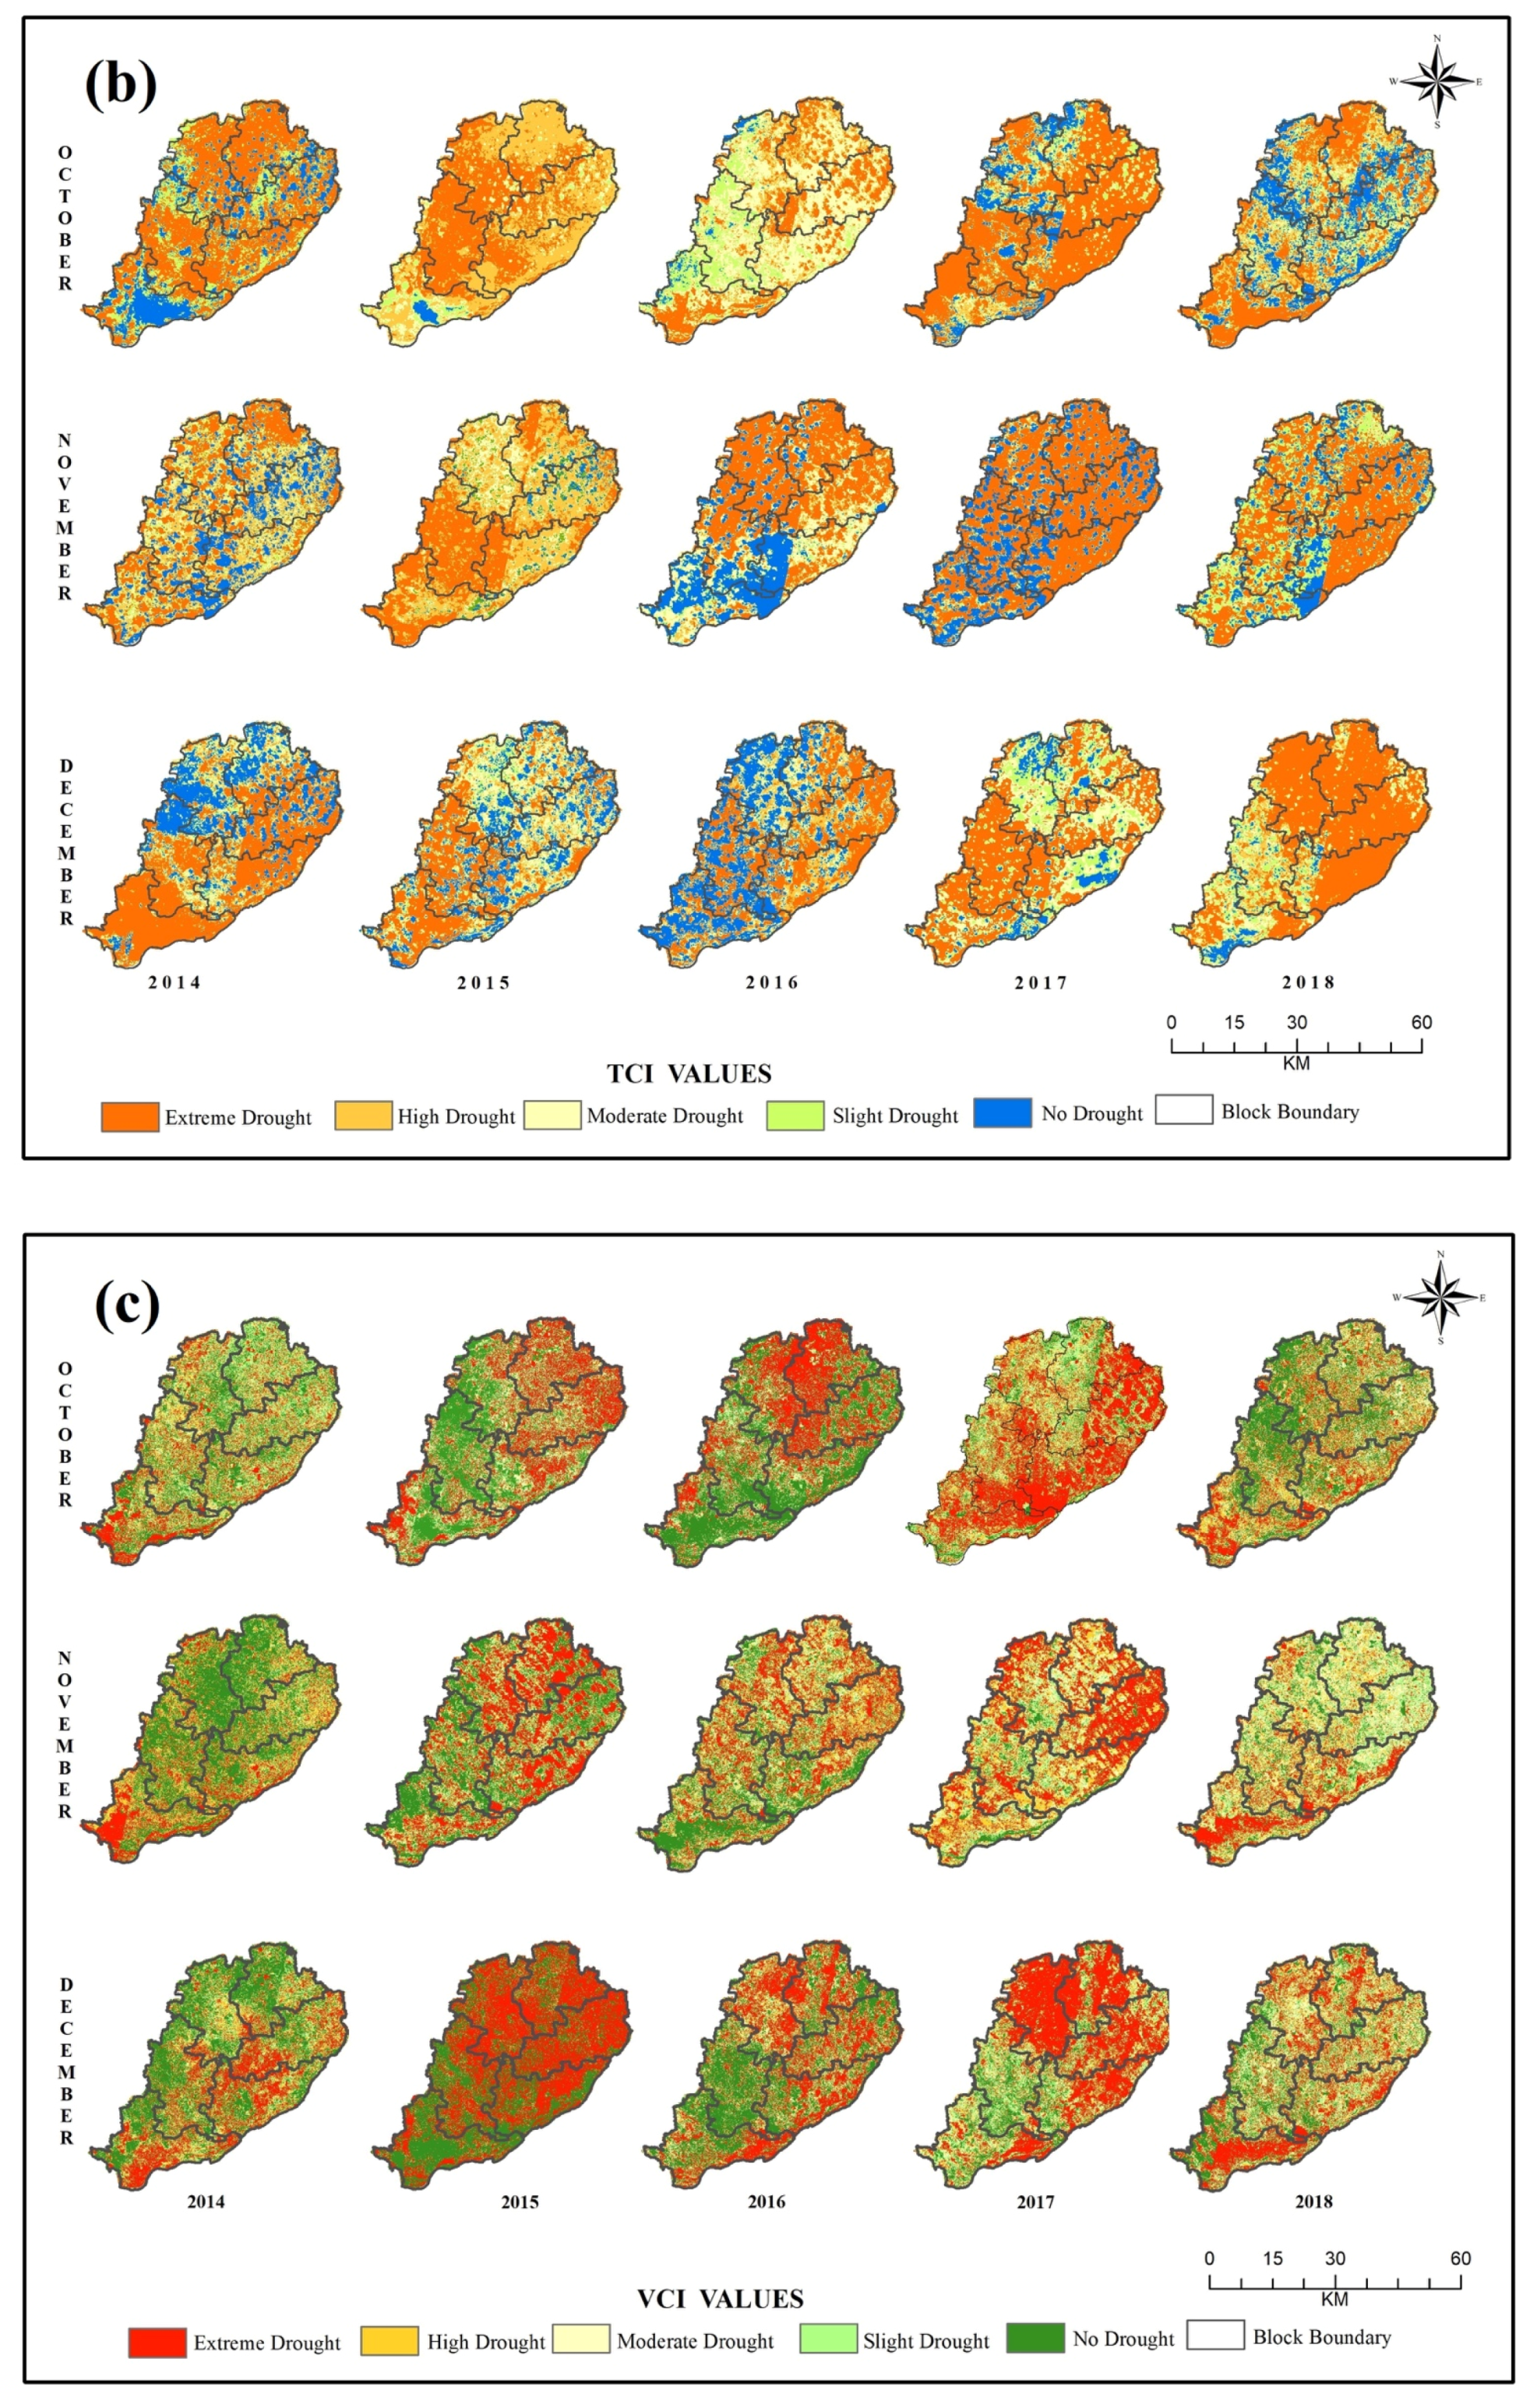
| TCI is temperature-condition index, LSTi is a pixel value of the current month temperature, LSTmax and LSTmin are the absolute maximum and minimum LST values in multiple years. The severity range of TCI values varies from 0 to 1 (Table 4). Values closer or equal to 0 denote dry conditions with abnormal temperatures, and values nearer to 1 represent wet conditions with adequate temperatures [51]. | |
| VCI is vegetation-condition index, NDVIi is pixel range of current month NDVI, and NDVImin and NDVImax are the minimum and maximum values of temporal NDVI. The vegetation stress is indicated with VCI varying from 0 to 1 (Table 4) indicating a range of intense vegetation stress to optimal vegetation conditions [55]. | |
| SDCI is scaled drought-condition index, with the agricultural drought severity varying between 0 and 1 (Table 4). The values nearest to 0 represent extreme drought, and the values nearest to 1 suggest no drought [59]. | |
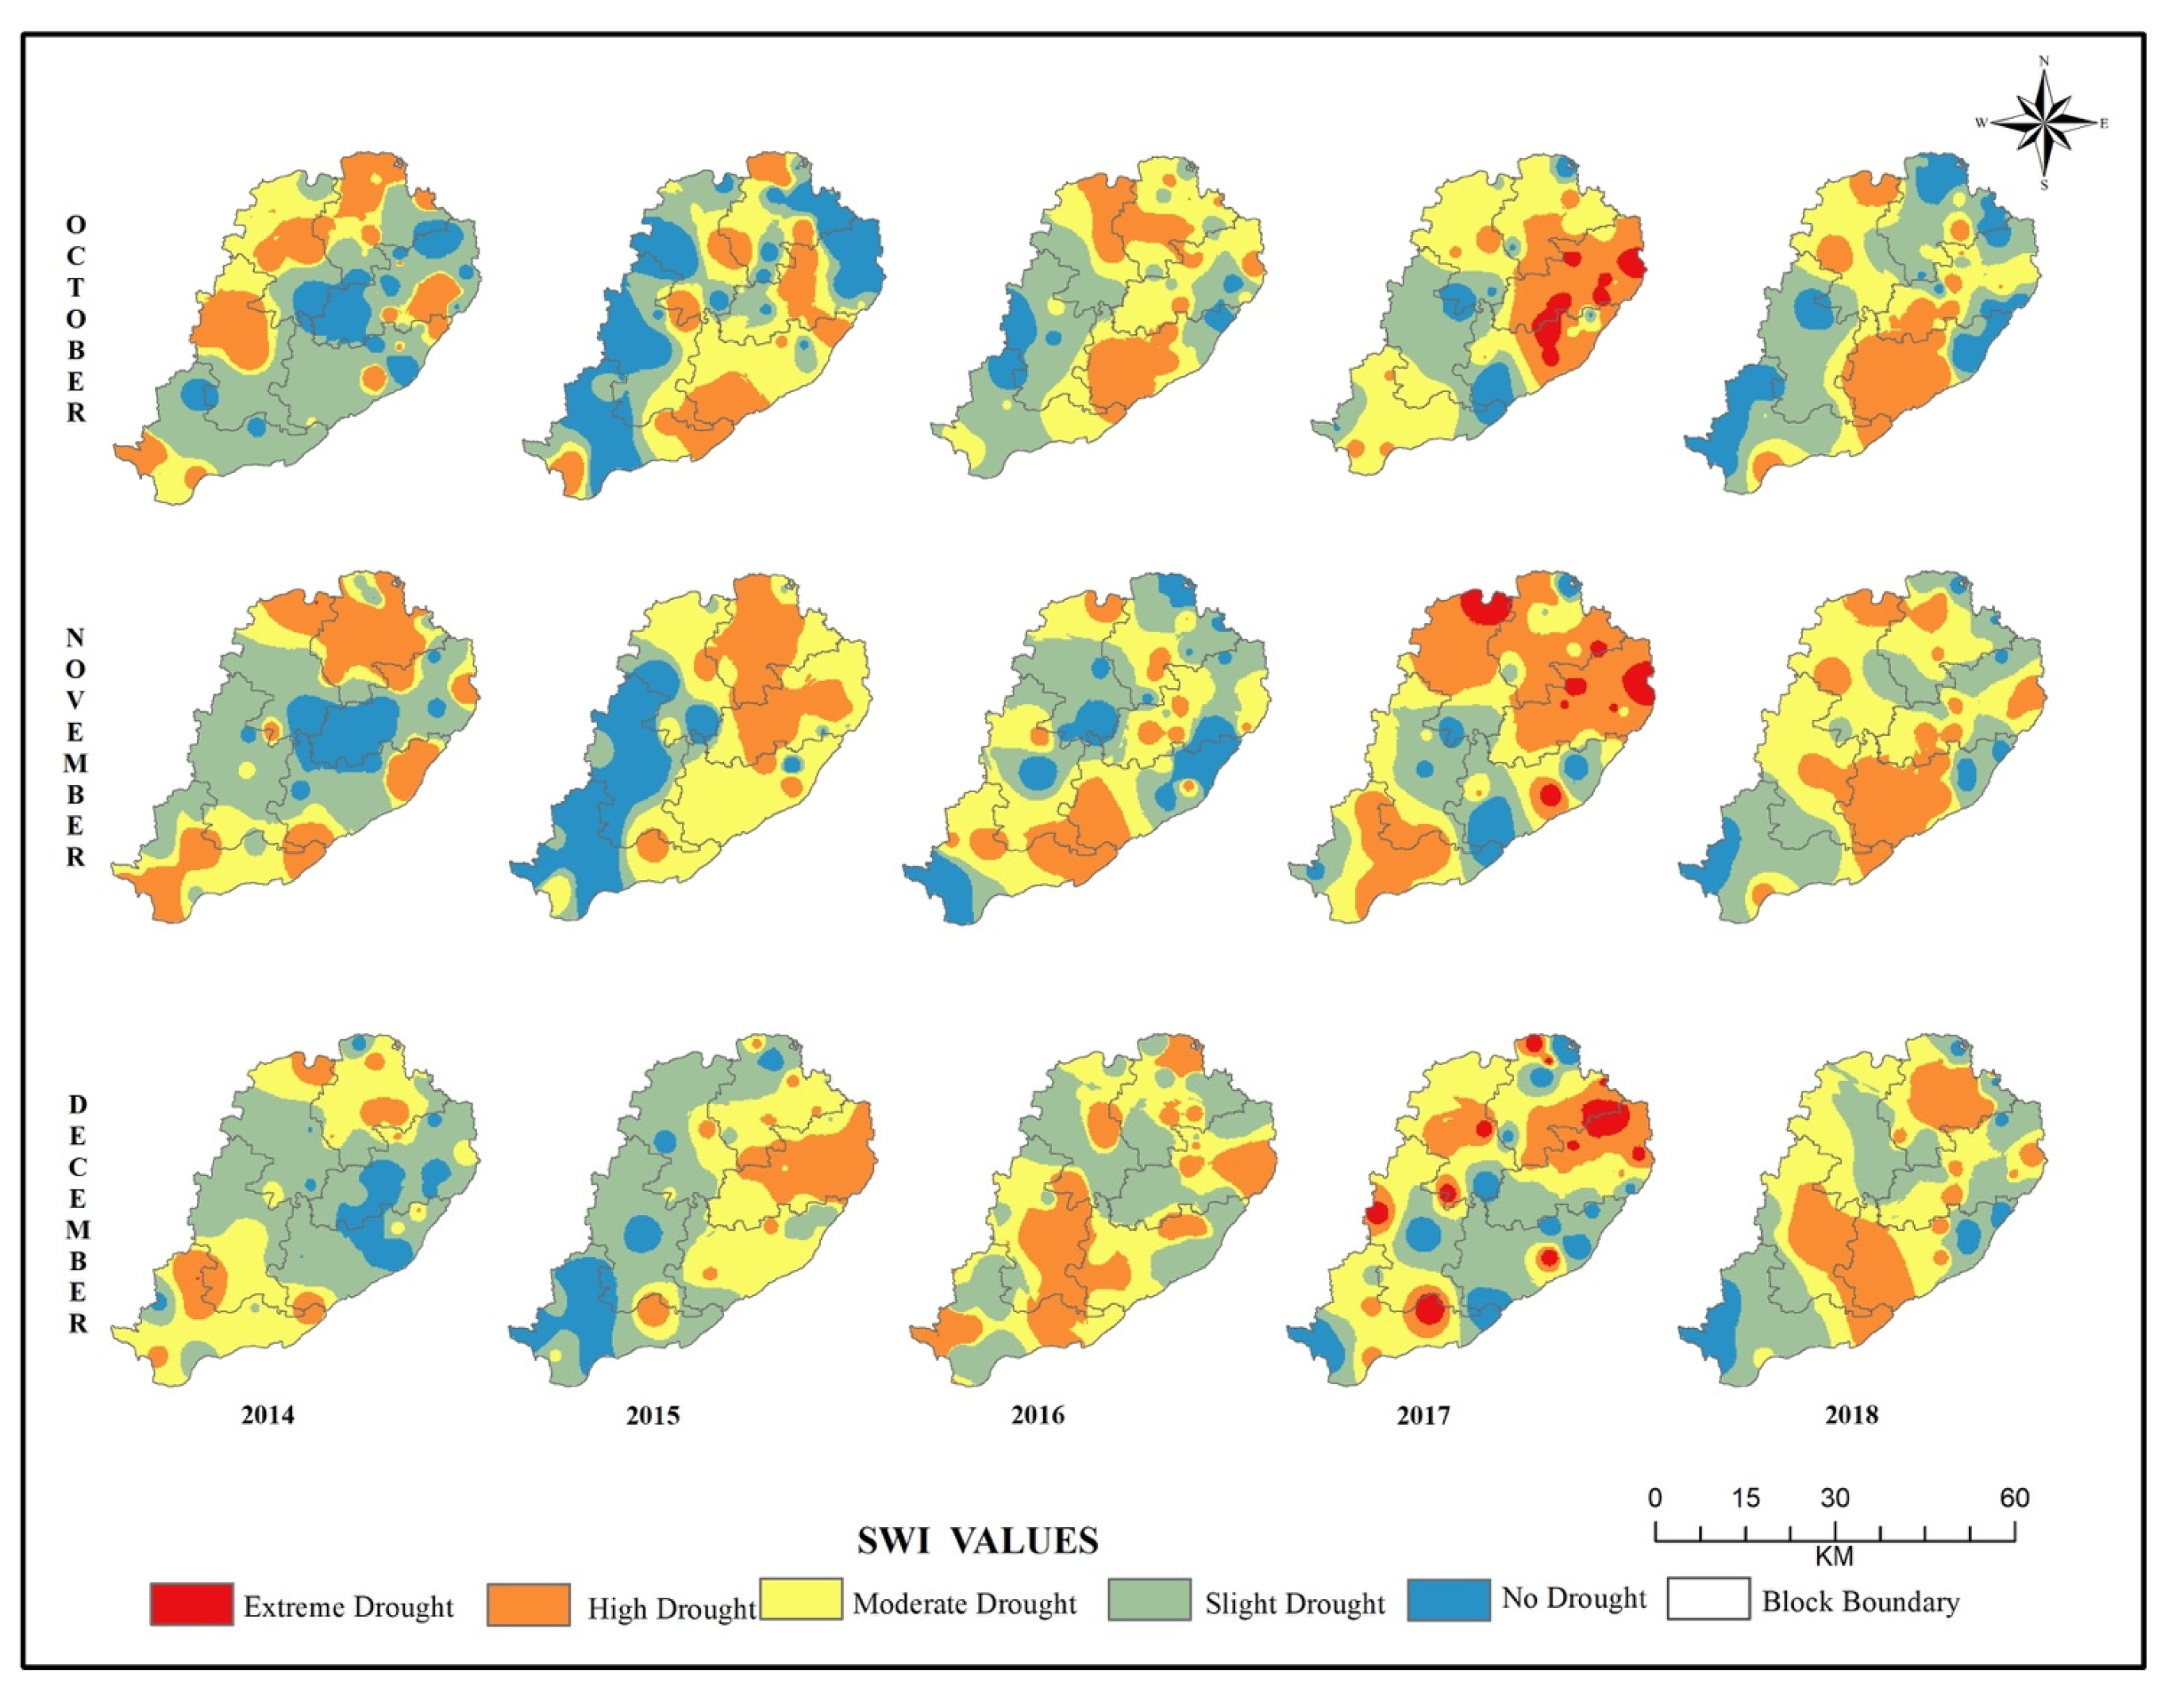
| SWI is standardized water-level index. Wij is a water level of ith month and ith year, Wim is the seasonal mean of the same well, and σ is the standard deviation. The values of SWI varying between 0 and 2 suggest different degrees of t hydrological drought (Table 5) [62]. | |
| The MDSI is multi-drought severity index, and its severity values vary from 0 to 1, reflecting the potential effect of multi-drought. The values nearest to 0 represent extremely unfavorable drought conditions, and vice versa. | |
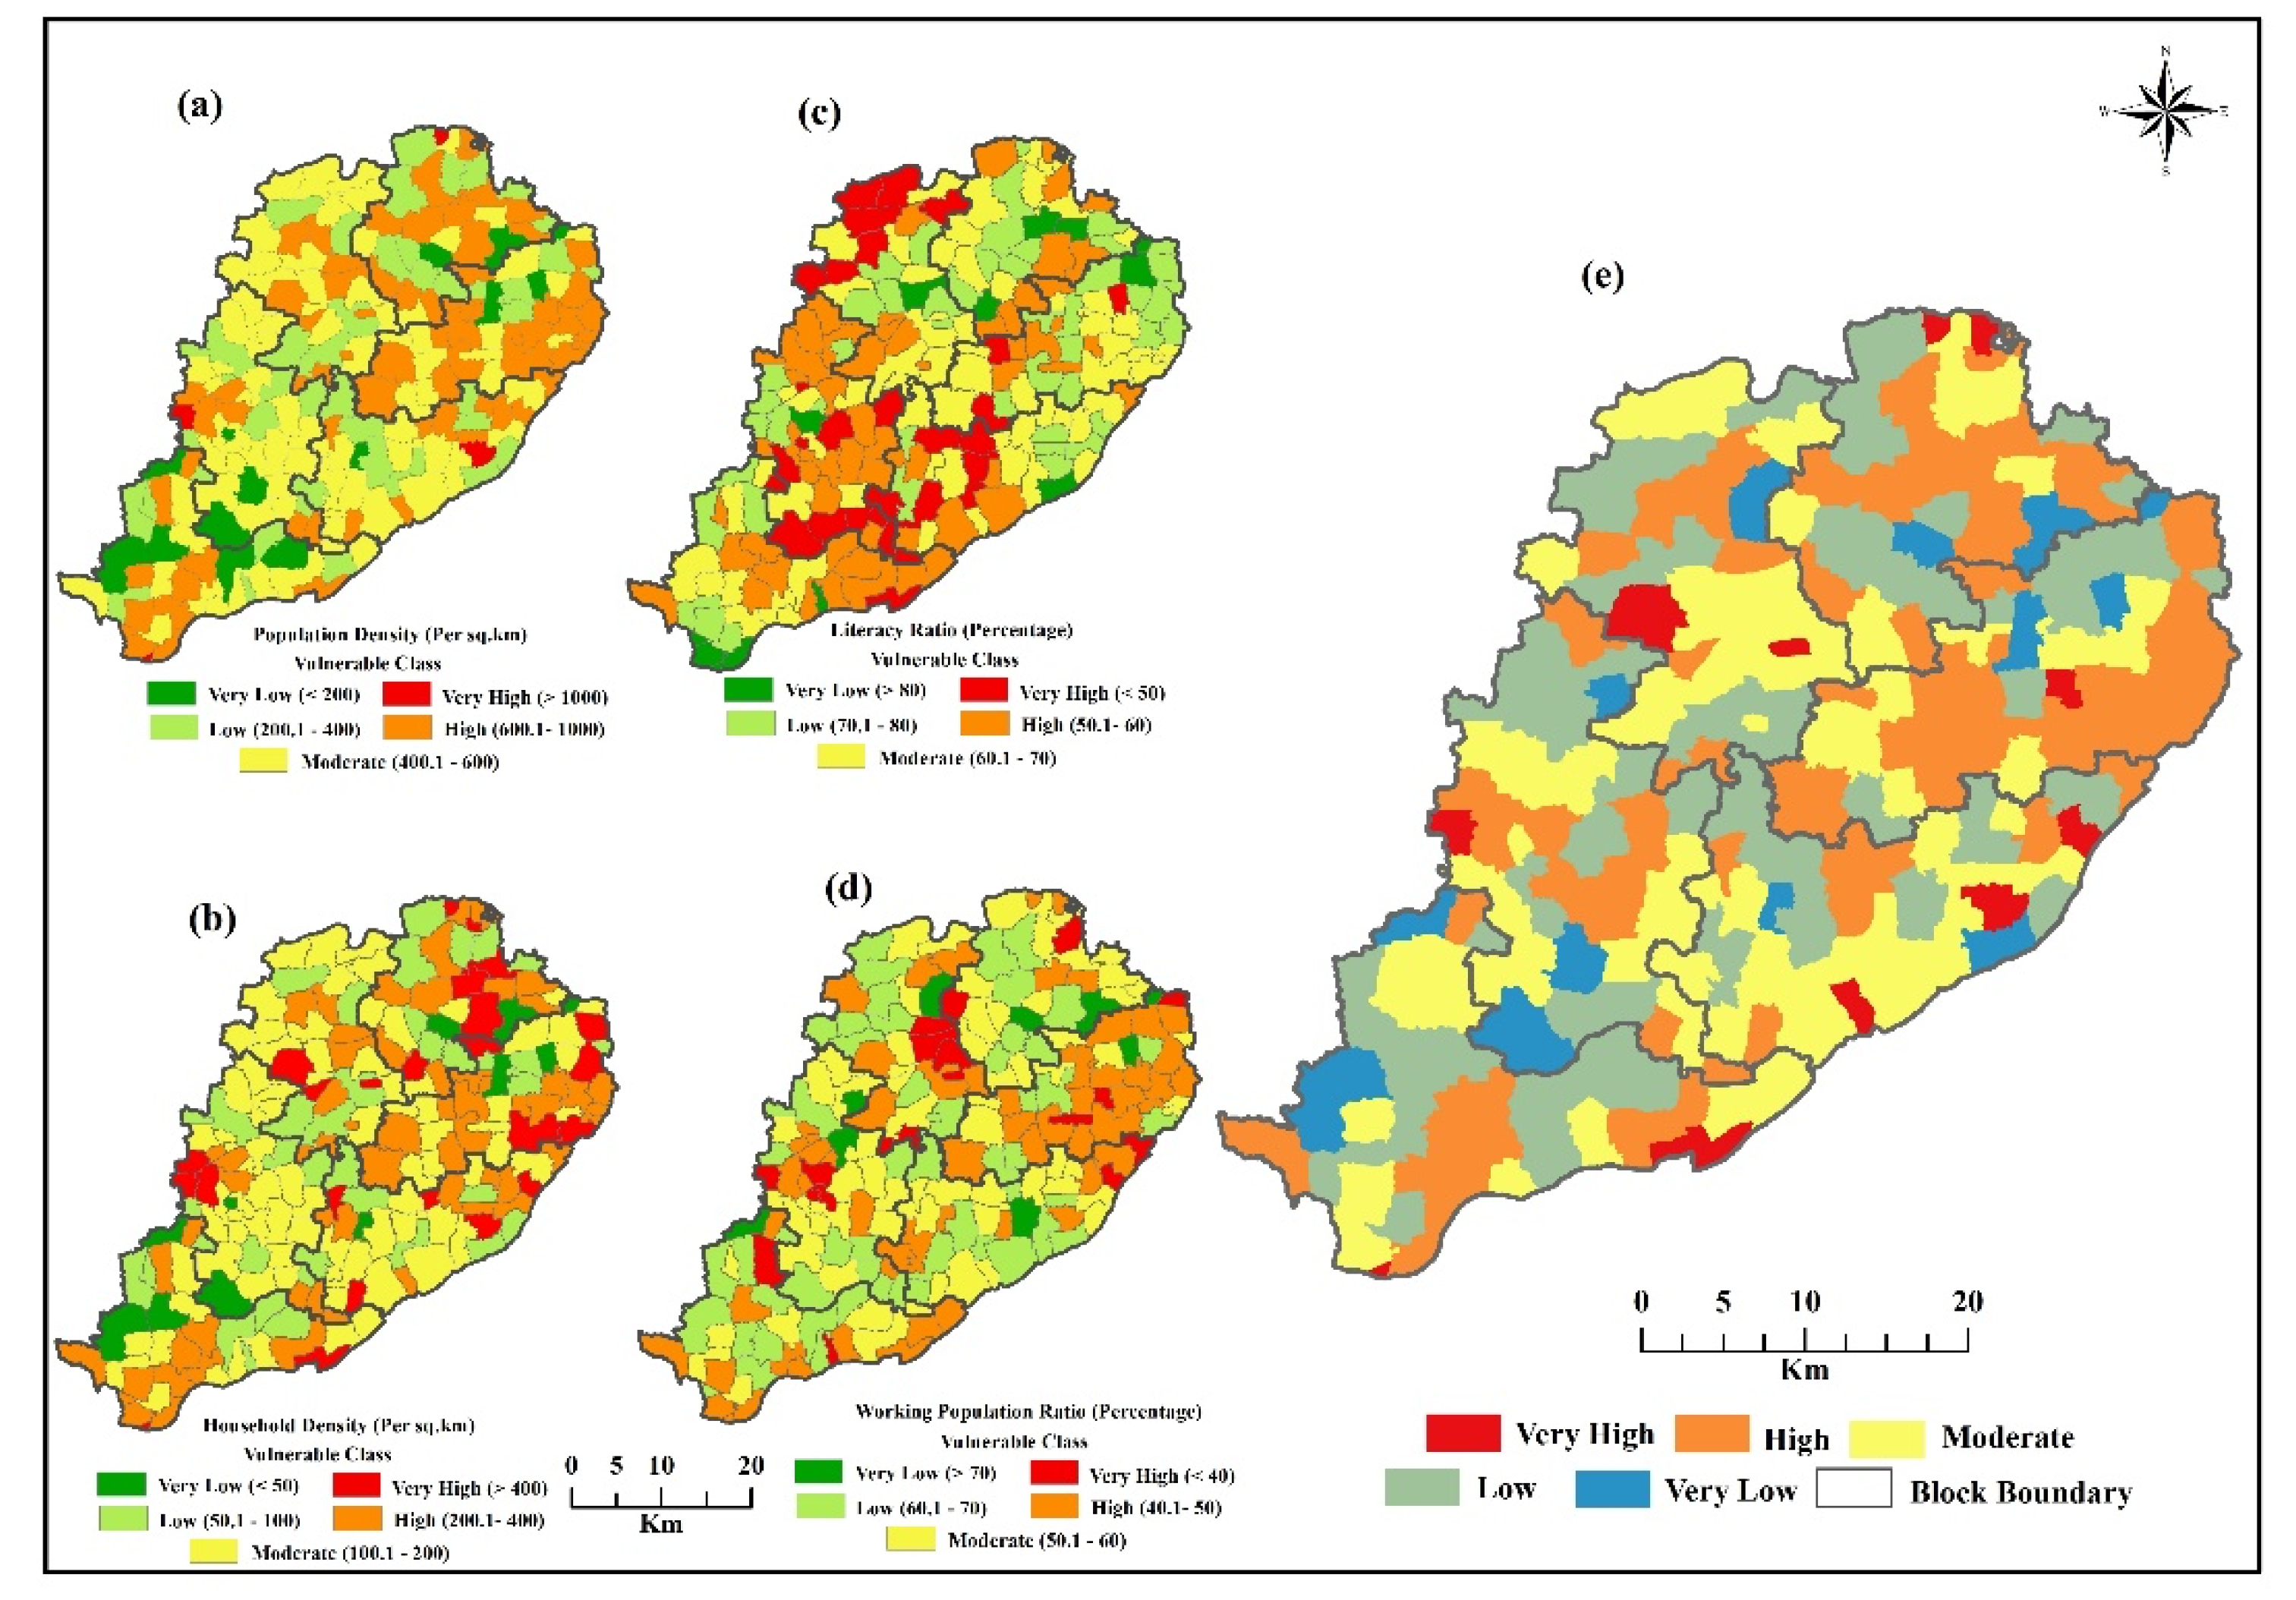
| PD is population density. The total populations of the villages were divided by geographical area (km2) of the village [63]. | |
| HD is household density. The total number of households in each village was divided by geographical area (km2) of the village [36]. | |
| LR is literacy ratio. The total number of literate individuals was divided by total population in the villages [37]. | |
| WPR is working population ratio. The total number of working individuals was divided by total population in the villages. | |
| SEV is socio-economic vulnerability. Summation of normalized PD, HD, LR, and WPR and its severity scale varies from 1 to 5 [67]. |
4. Results
4.1. Meteorological Drought
4.2. Agricultural Drought
4.3. Hydrological Drought
4.4. Socio-Economic Vulnerability (SEV)
4.5. Multi-Drought Severity Index (MDSI)
5. Discussion
- The results exemplify that the socio-economic conditions of the Jayankondan block must be strengthened to manage the existing conditions, as the occurrence of meteorological and hydrological droughts will be more frequent in the near future, due to global warming.
- The high-priority region (i.e., Jayankondan block) requires closer agricultural drought monitoring through the implementation of a real-time early-warning system, through which prediction models can be developed to mitigate the prevalence of drought.
- A multi-cropping pattern and a drought-resistant crop must be used to maintain the sustainability of soil nutrients.
- The region features weak socio-economic conditions, which must be strengthened by increasing the literacy rate and conducting awareness programs for agricultural workers.
- A proper irrigation system should be maintained for seasonal crops, and as a water conservation plan; rainwater harvesting must be implemented to replenish groundwater levels.
- Policymakers should consider investment in agro-based projects (i.e., small-scale water conservation and management) at the micro-level, subsidies for agricultural activities, crop insurance plans, emergency disaster funds, and immediate remedial action during monsoon failure).
6. Conclusions
Author Contributions
Funding
Institutional Review Board Statement
Informed Consent Statement
Data Availability Statement
Acknowledgments
Conflicts of Interest
References
- Jasem, A.H.; Alraggad, M. Assessing Groundwater Vulnerability in Azraq Basin Area by a Modified DRASTIC Index. J. Water Resour. Prot. 2010, 2, 944–951. [Google Scholar] [CrossRef] [Green Version]
- Tian, Q.; Yu, T.; Du, L.; Tian, Q.; Yu, T.; Meng, Q.; Jancso, T.; Udvardy, P.; Huang, Y. A comprehensive drought monitoring method integrating MODIS and TRMM data. Int. J. Appl. Earth Obs. Geoinf. 2013, 23, 245–253. [Google Scholar] [CrossRef]
- Mohammad, A.H.; Almomani, T.; Alhejoj, I. Groundwater Vulnerability for the Surface Outcropping Aquifers in Jordan. J. Environ. Prot. 2015, 6, 250–258. [Google Scholar] [CrossRef] [Green Version]
- Hussein, H. The Guarani Aquifer System, highly present but not high profile: A hydropolitical analysis of transboundary groundwater governance. Environ. Sci. Policy 2018, 83, 54–62. [Google Scholar] [CrossRef] [Green Version]
- Mohammad, A.H.; Jung, H.C.; Odeh, T.; Bhuiyan, C.; Hussein, H. Understanding the impact of droughts in the Yarmouk Basin, Jordan: Monitoring droughts through meteorological and hydrological drought indices. Arab. J. Geosci. 2018, 11, 103. [Google Scholar] [CrossRef] [Green Version]
- Park, S.; Im, J.; Jang, E.; Rhee, J. Drought assessment and monitoring through blending of multi-sensor indices using machine learning approaches for different climate regions. Agric. For. Meteorol. 2016, 216, 157–169. [Google Scholar] [CrossRef]
- Trenberth, K.E.; Dai, A.; Rasmussen, R.M.; Parsons, D.B. The changing character of precipitation. Bull. Am. Meteorol. Soc. 2018, 84, 1205–1217. [Google Scholar] [CrossRef]
- Trenberth, K.E.; Overpeck, J.T.; Solomos, S. Exploring Drought and Its Implications for the Future. Eos Trans. Am. Geophys. Union 2004, 85, 26. [Google Scholar] [CrossRef]
- Wetherald, R.T.; Manabe, S. Detectability of summer dryness caused by greenhouse warming. Clim. Change 1999, 43, 495–511. [Google Scholar] [CrossRef]
- Donald, W.A. Drought as a Natural Hazard: Concepts and Definitions Donald. In Drought: A Global Assessment; Donald, W.A., Ed.; Routledge: London, UK, 2000; pp. 3–18. [Google Scholar]
- Rhee, J.; Im, J.; Park, S. Regional drought monitoring based on multisensor remote sensing. In Remote Sensing of Water Resources, Disasters, and Urban Studies; Thenkabail, P.S., Ed.; CRC Press: Boca Raton, FL, USA, 2015; pp. 401–415. [Google Scholar]
- Dracup, J.A.; Lee, K.S.; Paulson, E.G. On the statistical characteristics of drought events. Water Resour. Res. 1980, 16, 289–300. [Google Scholar] [CrossRef]
- Bhuiyan, C.; Singh, R.P.; Kogan, F.N. Monitoring drought dynamics in the Aravalli region ( India ) using different indices based on ground and remote sensing data. Int. J. Appl. Earth Obs. Geoinf. 2006, 8, 289–302. [Google Scholar] [CrossRef]
- Wilhite, D.A.; Svoboda, M.D.; Hayes, M.J. Understanding the complex impacts of drought: A key to enhancing drought mitigation and preparedness. Water Resour. Manag. 2007, 21, 763–774. [Google Scholar] [CrossRef] [Green Version]
- Kundu, A.; Dwivedi, S.; Dutta, D. Monitoring the vegetation health over India during contrasting monsoon years using satellite remote sensing indices. Arab. J. Geosci. 2016, 9, 144. [Google Scholar] [CrossRef]
- Yu, C.; Li, C.; Xin, Q.; Chen, H.; Zhang, J.; Zhang, F.; Li, X.; Clinton, N.; Huang, X.; Yue, Y.; et al. Dynamic assessment of the impact of drought on agricultural yield and scale-dependent return periods over large geographic regions. Environ. Model. Softw. 2014, 62, 454–464. [Google Scholar] [CrossRef] [Green Version]
- Wilhite, D.A.; Sivakumar, M.V.K.; Wood, D.A. Early Warning Systems for Drought Preparedness and Drought Management. In Proceedings of the Expert Group Meeting, Lisbon, Portugal, 5–7 September 2000; World Meteorological Organization: Lisbon, Portugal, 2000; pp. 161–176. [Google Scholar]
- Mallya, G.; Mishra, V.; Niyogi, D.; Tripathi, S.; Govindaraju, R. Trends and variability of droughts over the Indian monsoon region. Weather Clim. Extrem. 2016, 12, 43–68. [Google Scholar] [CrossRef] [Green Version]
- Bajgain, R.; Xiao, X.; Basara, J.; Wagle, P.; Zhou, Y.; Zhang, Y.; Mahan, H. Assessing agricultural drought in summer over Oklahoma Mesonet sites using the water-related vegetation index from MODIS. Int. J. Biometeorol. 2017, 61, 377–390. [Google Scholar] [CrossRef] [Green Version]
- Zhang, T.; Simelton, E.; Huang, Y.; Shi, Y. A Bayesian assessment of the current irrigation water supplies capacity under projected droughts for the 2030s in China. Agric. For. Meteorol. 2013, 178–179, 56–65. [Google Scholar] [CrossRef]
- Gao, Z.; Wang, Q.; Cao, X.; Gao, W. The responses of vegetation water content (EWT) and assessment of drought monitoring along a coastal region using remote sensing. GIScience Remote Sens. 2014, 51, 1–16. [Google Scholar] [CrossRef]
- Dutta, D.; Kundu, A.; Patel, N.R.; Saha, S.K.; Siddiqui, A.R. Assessment of agricultural drought in Rajasthan (India) using remote sensing derived Vegetation Condition Index (VCI) and Standardized Precipitation Index (SPI). Egypt J. Remote Sens. Sp. Sci. 2015, 18, 53–63. [Google Scholar] [CrossRef] [Green Version]
- Ghaleb, F.; Mario, M.; Sandra, A.N. Regional Landsat-Based Drought Monitoring from 1982 to 2014. Climate 2015, 3, 563–577. [Google Scholar] [CrossRef] [Green Version]
- Sierra-Soler, A.; Adamowski, J.; Malard, J.; Qi, Z.; Saadat, H.; Pingale, S. Assessing agricultural drought at a regional scale using LULC classification, SPI, and vegetation indices: Case study in a rainfed agro-ecosystem in Central Mexico. Geomat. Nat Hazards Risk 2016, 7, 1460–1488. [Google Scholar] [CrossRef] [Green Version]
- Khosravi, H.; Haydari, E.; Shekoohizadegan, S.; Zareie, S. Assessment the Effect of Drought on Vegetation in Desert Area using Landsat Data. Egypt J. Remote Sens. Sp. Sci. 2017, 20, S3–S12. [Google Scholar] [CrossRef] [Green Version]
- Naumann, G.; Dutra, E.; Barbosa, P.; Pappenberger, F.; Wetterhall, F.; VogT, J.V. Comparison of drought indicators derived from multiple data sets over Africa. Hydrol. Earth Syst. Sci. 2014, 18, 1625–1640. [Google Scholar] [CrossRef] [Green Version]
- Santos, C.A.G.; Brasil Neto, R.M.; Passos, J.S.A.; da Silva, R.M. Drought assessment using a TRMM-derived standardized precipitation index for the upper São Francisco River basin, Brazil. Env. Monit. Assess 2017, 189, 250. [Google Scholar] [CrossRef]
- Jiang, S.; Ren, L.; Zhou, M.; Yong, B.; Zhang, Y.; Ma, M. Drought monitoring and reliability evaluation of the latest TMPA precipitation data in the Weihe River Basin, Northwest China. J. Arid. Land 2017, 9, 256–269. [Google Scholar] [CrossRef] [Green Version]
- Winkler, K.; Gessner, U.; Hochschild, V. Identifying droughts affecting agriculture in Africa based on remote sensing time series between 2000–2016: Rainfall anomalies and vegetation condition in the context of ENSO. Remote Sens. 2017, 9, 831. [Google Scholar] [CrossRef] [Green Version]
- Livada, I.; Assimakopoulos, V.D. Spatial and temporal analysis of drought in Greece using the Standardized Precipitation Index (SPI). Theor. Appl. Climatol. 2007, 89, 143–153. [Google Scholar] [CrossRef]
- Cancelliere, A.; Di Mauro, G.; Bonaccorso, B.; Rossi, G. Drought forecasting using the standardized precipitation index. Water Resour. Manag. 2007, 21, 801–819. [Google Scholar] [CrossRef]
- Muthumanickam, D.; Kannan, P.; Kumaraperumal, R.; Natarajan, S.; Sivasamy, R.; Poongodi, C. Drought assessment and monitoring through remote sensing and GIS in western tracts of Tamil Nadu, India. Int. J. Remote Sens. 2011, 32, 5157–5176. [Google Scholar] [CrossRef]
- Cruz-Roa, A.F.; Olaya-Marín, E.J.; Barrios, M.I. Ground and satellite based assessment of meteorological droughts: The Coello river basin case study. Int. J. Appl. Earth Obs. Geoinf. 2017, 62, 114–121. [Google Scholar] [CrossRef]
- Bhavani, P.; Chakravarthi, V.; Roy, P.S.; Joshi, P.K.; Chandrasekar, K. Long-term agricultural performance and climate variability for drought assessment: A regional study from Telangana and Andhra Pradesh states, India. Geomat. Nat Hazards Risk 2017, 8, 822–840. [Google Scholar] [CrossRef] [Green Version]
- Lik, B.; Rodell, M. Evaluation of a model-based groundwater drought indicator in the conterminous U.S. J. Hydrol. 2015, 526, 78–88. [Google Scholar] [CrossRef] [Green Version]
- Aubrecht, C.; Ozceylan, D.; Steinnocher, K.; Freire, S. Multi-level geospatial modeling of human exposure patterns and vulnerability indicators. Nat. Hazards 2013, 68, 147–163. [Google Scholar] [CrossRef]
- Ahsan, M.N.; Warner, J. The socioeconomic vulnerability index: A pragmatic approach for assessing climate change led risks-A case study in the south-western coastal Bangladesh. Int. J. Disaster. Risk Reduct. 2014, 8, 32–49. [Google Scholar] [CrossRef]
- BalaSundareshwaran, A.; Abdul Rahaman, S.; Balasubramani, K.; Kumaraswamy, K.; Ramkumar, M. Habitat Risk Assessment Along Coastal Tamil Nadu, India—An Integrated Methodology for Mitigating Coastal Hazards. In Coastal Zone Management; Ramkumar, M., James, R.A., Menier, D., Kumaraswamy, K., Eds.; Elsevier: Burlington, NJ, USA, 2018. [Google Scholar] [CrossRef]
- Törnros, T.; Menzel, L. Addressing drought conditions under current and future climates in the Jordan River region. Hydrol. Earth Syst. Sci. 2014, 18, 305–318. [Google Scholar] [CrossRef] [Green Version]
- Patel, N.R.; Yadav, K. Monitoring spatio-temporal pattern of drought stress using integrated drought index over Bundelkhand region, India. Nat. Hazards 2015, 77, 663–677. [Google Scholar] [CrossRef]
- Yaduvanshi, A.; Srivastava, P.K.; Pandey, A.C. Integrating TRMM and MODIS satellite with socio-economic vulnerability for monitoring drought risk over a tropical region of India. Phys. Chem. Earth 2015, 83–84, 14–27. [Google Scholar] [CrossRef]
- Kamali, B.; Kouchi, D.H.; Yang, H.; Abbaspour, K. Multilevel drought hazard assessment under climate change scenarios in semi-arid regions-a case study of the karkheh river basin in Iran. Water 2017, 9, 241. [Google Scholar] [CrossRef]
- Park, S.; Seo, E.; Kang, D.; Im, J.; Lee, M.-I. Prediction of drought on pentad scale using remote sensing data and MJO index through random forest over East Asia. Remote Sens. 2018, 10, 1811. [Google Scholar] [CrossRef] [Green Version]
- Gnanachandrasamy, G.; Zhou, Y.; Bagyaraj, M.; Venkatramanan, S.; Ramkumar, T.; Wang, S. Remote Sensing and GIS Based Groundwater Potential Zone Mapping in Ariyalur District, Tamil Nadu. J. Geol. Soc. 2018, 92, 484–490. [Google Scholar] [CrossRef]
- Mckee, T.B.; Doesken, N.J.; Kleist, J. The relationship of drought frequency and duration to time scales. Eighth Conf. Appl. Climatol. 1993, 17, 179–183. [Google Scholar]
- McKee, T.B.; Doesken, N.J.; Kleist, J. Drought monitoring with multiple time scales. In Proceedings of the 9th Conference on Applied Climatology, Dallas, TX, USA, 15–20 January 1995; pp. 233–236. [Google Scholar]
- Oliver, J.E. Monthly Precipitation Distribution: A Comparative Index. Prof. Geogr. 1980, 32, 300–309. [Google Scholar] [CrossRef]
- Yu, H.; Li, L.; Liu, Y.; Li, J. Construction of Comprehensive Drought Monitoring Model in Jing-Jin-Ji Region Based on Multisource Remote Sensing Data. Water 2019, 11, 1077. [Google Scholar] [CrossRef] [Green Version]
- Sur, C.; Park, S.; Kim, T.; Lee, J. Remote Sensing-based Agricultural Drought Monitoring using Hydrometeorological Variables. KSCE J. Civ. Eng. 2019, 23, 5244–5256. [Google Scholar] [CrossRef]
- Zeng, H.; Li, L.; Li, J. The evaluation of TRMM Multisatellite Precipitation Analysis (TMPA) in drought monitoring in the Lancang River Basin. J. Geogr. Sci. 2012, 22, 273–282. [Google Scholar] [CrossRef]
- Kogan, F.N. Application of vegetation index and brightness temperature for drought detection. Adv. Sp. Res. 1995, 15, 91–100. [Google Scholar] [CrossRef]
- Unganai, L.S.; Kogan, F.N. Drought Monitoring and Corn Yield Estimation in Southern Africa from AVHRR Data. Remote Sens. Environ. 1998, 4257, 219–232. [Google Scholar] [CrossRef]
- Rongali, G.; Keshari, A.K.; Gosain, A.K.; Khosa, R. Split-Window Algorithm for Retrieval of Land Surface Temperature Using Landsat 8 Thermal Infrared Data. J. Geovisualizat. Spat. Anal. 2018, 2, 14. [Google Scholar] [CrossRef]
- Venkatesh, R.; Abdul Rahaman, S.; Jegankumar, R.; Masilamani, P. Eco-Environmental Vulnerability Zonation in Essence of Environmental Monitoring and Management. ISPRS Int. Arch. Photogramm. Remote Sens. Spat. Inf. Sci 2020, XLIII-B5-2, 149–155. [Google Scholar] [CrossRef]
- Liu, W.T.; Kogan, F.N. Monitoring regional drought using the Vegetation Condition Index. Int. J. Remote Sens. 1996, 17, 2761–2782. [Google Scholar] [CrossRef]
- Kogan, F.; Gitelson, A.; Zakarin, E.; Spivak, L.; Lebed, L. AVHRR-Based Spectral Vegetation Index for Quantitative Assessment of Vegetation State and Productivity: Calibration and Validation. In Photogrammetric Engineering & Remote Sensing; American Society for Photogrammetry and Remote Sensing: Baton Rouge, LA, USA, 2003; pp. 899–906. [Google Scholar]
- Rouse, J.W.; Haas, R.; Schell, J.; Deering, D. Monitoring vegetation systems in the great plains with ERTS. In Proceedings of the Third Earth Resources Technology Satellite-1 Symposium, Washington, DC, USA, 10–14 December 1973; pp. 309–317. [Google Scholar]
- Abdul Rahaman, S.; Venkatesh, R. Application of Remote Sensing and Google Earth Engine for Monitoring Environmental Degradation in the Nilgiri Biosphere Reserve and Its Ecosystem of Western Ghats, India. ISPRS Int. Arch. Photogramm. Remote Sens. Spat. Inf. Sci. 2020, XLIII-B3-2, 933–940. [Google Scholar] [CrossRef]
- Rhee, J.; Im, J.; Carbone, G.J. Monitoring agricultural drought for arid and humid regions using multi-sensor remote sensing data. Remote Sens. Environ. 2010, 114, 2875–2887. [Google Scholar] [CrossRef]
- Zhang, L.; Jiao, W.; Zhang, H.; Huang, C.; Tong, Q. Remote Sensing of Environment Studying drought phenomena in the Continental United States in 2011 and 2012 using various drought indices. Remote Sens. Environ. 2017, 190, 96–106. [Google Scholar] [CrossRef]
- Cao, Y.; Chen, S.; Wang, L.; Zhu, B.; Lu, T.; Yu, Y. An Agricultural Drought Index for Assessing Droughts Using a Water Balance Method: A Case Study in Jilin Province, Northeast China. Remote Sens. 2019, 11, 1066. [Google Scholar] [CrossRef] [Green Version]
- Bhuiyan, C. Various drought indices for monitoring drought condition in Aravalli terrain of India. In Proceedings of the XXth ISPRS Conference 2004, Istanbul, Turkey, 12–23 July 2014; pp. 907–912. [Google Scholar]
- Brown, J.F.; Wardlow, B.D.; Tadesse, T.; Hayes, M.J.; Reed, B.C. The Vegetation Drought Response Index (VegDRI): A New Integrated Approach for Monitoring Drought Stress in Vegetation. GIScience Remote Sens. 2008, 45, 16–46. [Google Scholar] [CrossRef]
- Tadesse, T.; Wardlow, B.D.; Hayes, M.J.; Svoboda, M.D.; Brown, J.F. The Vegetation Outlook (VegOut): A New Method for Predicting Vegetation Seasonal Greenness. GIScience Remote Sens. 2010, 47, 25–52. [Google Scholar] [CrossRef] [Green Version]
- Heim, R.R., Jr. A review of twentieth-century drought indices used in the United States. Bull. Am. Meteorol. Soc. 2002, 83, 1149–1165. [Google Scholar] [CrossRef] [Green Version]
- Johnson, D.P.; Stanforth, A.; Lulla, V.; Luber, G. Developing an applied extreme heat vulnerability index utilizing socioeconomic and environmental data. Appl. Geogr. 2012, 35, 23–31. [Google Scholar] [CrossRef]
- Balasubramani, K.; Leo George, S.; Anusuya, K.; Venkatesh, R.; Thilagaraj, P.; Gnanappazham, L.; Kumaraswamy, K.; Balasundareshwaran, A.; Praveen, B. Revealing the socio-economic vulnerability and multi-hazard risks at micro-administrative units in the coastal plains of Tamil Nadu, India. Geomat. Nat. Hazards Risk 2021, 12, 605–630. [Google Scholar] [CrossRef]
- Murthy, C.S.; Singh, J.; Kumar, P.; Sesha Sai, M.V.R. Meteorological drought analysis over India using analytical framework on CPC rainfall time series. Nat. Hazards 2016, 81, 573–587. [Google Scholar] [CrossRef]
- Guhathakurta, P.; Menon, P.; Inkane, P.M.; Krishnan, U.; Sable, S.T. Trends and variability of meteorological drought over the districts of India using standardized precipitation index. J. Earth Syst. Sci. 2017, 126, 120. [Google Scholar] [CrossRef] [Green Version]
- Dhiman, S.C. Rejuvenation of Aquifers. In Water Governance: Challenges and Prospects; Springer: Berlin/Heidelberg, Germany, 2019; pp. 187–204. [Google Scholar] [CrossRef]
- Chandrasekar, K.; Sesha Sai, M.V.R.; Roy, P.S.; Jayaraman, V.; Krishnamoorthy, R. Identification of Agricultural Drought Vulnerable Areas of Tamil Nadu, India Using Gis-Based Multi Criteria Analysis. Asian J. Environ. Disaster. Manag. 2014, 1, 40–61. [Google Scholar] [CrossRef]
- Varadan, R.J.; Kumar, P. Mapping agricultural vulnerability of Tamil Nadu, India to climate change: A dynamic approach to take forward the vulnerability assessment methodology. Clim. Change 2015, 129, 159–181. [Google Scholar] [CrossRef]
- Vaani, N.; Porchelvan, P. Monitoring of agricultural drought using fortnightly variation of vegetation condition index (VCI) for the state of Tamil Nadu, India. Int. Arch. Photogramm. Remote Sens. Spat. Inf. Sci. ISPRS Arch. 2018, 42, 159–164. [Google Scholar] [CrossRef] [Green Version]
- Balasundareshwaran, A.; Kumaraswamy, K.; Balasubramani, K. Multi-Hazard Zonation For Effective Management of Disasters in Tamil Nadu. Geosfera Indones. 2020, 5, 65–79. [Google Scholar] [CrossRef]
- Das, P.K.; Das, R.; Das, D.K.; Midya, S.K.; Bandyopadhyay, S.; Raj, U. Quantification of agricultural drought over Indian region: A multivariate phenology-based approach. Nat. Hazards 2020, 101, 255–274. [Google Scholar] [CrossRef]
- Vengateswari, M.; Geethalakshmi, V.; Bhuvaneswari, K.; Jagannathan, R.; Panneerselvam, S. District level drought assessment over Tamil Nadu. Madras Agric. J. 2019, 106, 2016–2018. [Google Scholar] [CrossRef]
- Balaganesh, G.; Malhotra, R.; Sendhil, R.; Sirohi, S.; Maiti, S.; Ponnusamy, K.; Sharma, A.K. Development of composite vulnerability index and district level mapping of climate change induced drought in Tamil Nadu, India. Ecol. Indic. 2020, 113, 106197. [Google Scholar] [CrossRef]
- Arulnangai, R.; Mohamed Sihabudeen, M.; Vivekanand, P.A.; Kamaraj, P. Influence of physico chemical parameters on potability of ground water in ariyalur area of Tamil Nadu, India. Mater. Today Proc. 2020, 24, 923–928. [Google Scholar] [CrossRef]


| S. No. | Data Sets | Variable | Period | Resolution | Source |
|---|---|---|---|---|---|
| 1 | Rainfall | SPI | 1989–2018 | -- | RMC, Chennai |
| 2 | Landsat 8 OLI | NDVI, LST, VCI, TCI | 2014–2018 | 30 m | Earth Explorer |
| 3 | TRMM 3B43 | PCI | 2014–2018 | 27 km | NASA Mirador |
| 4 | Ground Water Level | SWI | 2004–2018 | -- | PWD, Chennai |
| 5 | Census | PD, HD, LR, WPR | 2011 | -- | Census India |
| Drought Classes | SPI Values |
|---|---|
| Extremely dry | <−2 |
| Severely dry | −1.5 to −1.99 |
| Moderately dry | −1.0 to −1.49 |
| Near normal | −0.99 to 0.99 |
| Moderately wet | 1.0 to 1.49 |
| Very wet | 1.5 to 1.99 |
| Extremely wet | >2.0 |
| Drought Classes | Values | PCI | TCI | VCI | SDCI |
|---|---|---|---|---|---|
| Extreme Drought | <0.10 | ||||
| High Drought | 0.11–0.20 | ||||
| Moderate Drought | 0.21–0.30 | ||||
| Slight Drought | 0.31–0.40 | ||||
| No Drought | >0.40 |
| Drought Classes | SWI Values |
|---|---|
| Extremely Drought | >2 |
| High Drought | 1.5 to 1.99 |
| Moderate Drought | 1.0 to 1.49 |
| Slight Drought | 0.99 to 0.00 |
| No Drought | <0 |
Publisher’s Note: MDPI stays neutral with regard to jurisdictional claims in published maps and institutional affiliations. |
© 2022 by the authors. Licensee MDPI, Basel, Switzerland. This article is an open access article distributed under the terms and conditions of the Creative Commons Attribution (CC BY) license (https://creativecommons.org/licenses/by/4.0/).
Share and Cite
Ravichandran, V.; Kantamaneni, K.; Periasamy, T.; Roy, P.D.; Killivalavan, J.; Sundar, S.; Chokkalingam, L.; Palanisamy, M. Monitoring of Multi-Aspect Drought Severity and Socio-Economic Status in the Semi-Arid Regions of Eastern Tamil Nadu, India. Water 2022, 14, 2049. https://doi.org/10.3390/w14132049
Ravichandran V, Kantamaneni K, Periasamy T, Roy PD, Killivalavan J, Sundar S, Chokkalingam L, Palanisamy M. Monitoring of Multi-Aspect Drought Severity and Socio-Economic Status in the Semi-Arid Regions of Eastern Tamil Nadu, India. Water. 2022; 14(13):2049. https://doi.org/10.3390/w14132049
Chicago/Turabian StyleRavichandran, Venkatesh, Komali Kantamaneni, Thilagaraj Periasamy, Priyadarsi D. Roy, Jothiramalingam Killivalavan, Sajimol Sundar, Lakshumanan Chokkalingam, and Masilamani Palanisamy. 2022. "Monitoring of Multi-Aspect Drought Severity and Socio-Economic Status in the Semi-Arid Regions of Eastern Tamil Nadu, India" Water 14, no. 13: 2049. https://doi.org/10.3390/w14132049