
Horizontal Distribution and Carbon Biomass of Planktonic Foraminifera in the Eastern Indian Ocean


1
Institute for Advanced Marine Research, University of Geoscience, Guangzhou 511462, China
2
State Key Laboratory of Biogeology and Environmental Geology, China University of Geosciences (Wuhan), Wuhan 430074, China
3
Research Centre for Indian Ocean Ecosystem, Tianjin University of Science and Technology, Tianjin 300457, China
4
NOAA, National Ocean Service, 331 Fort Johnson Road, Charleston, SC 29412, USA
*
Author to whom correspondence should be addressed.
Water 2022, 14(13), 2048; https://doi.org/10.3390/w14132048
Submission received: 23 April 2022
/
Revised: 1 June 2022
/
Accepted: 1 June 2022
/
Published: 26 June 2022
(This article belongs to the Special Issue Marine Phytoplankton Diversity)
Abstract
:Distribution and carbon biomass of planktonic foraminifera were investigated from the euphotic zone of the Eastern Indian Ocean during a two-month cruise, ‘Shiyan I’ (10 April–13 May 2014). Foraminifera species were collected through plankton net sampling at 44 locations (80.00°–96.10° E, 10.08° N–6.00° S). The temperature (°C) ranged between 12.82 and 31.8 °C, the salinity ranged between 32.5 and 35.5, and chlorophyll-a concentrations ranged between 0.005 µg/L and 0.89 µg/L. A total of 20 taxa were identified based on the spherical chamber shell, spines, and a final whorl which were examined under light microscopy and scanning electron microscopy. Dominant species that were characterized by the high dominant index Y > 0.14–0.46 were Globigerina bulloides, Globigerinoides ruber white, Globigerinella siphonifera, Turborotalita quinqueloba, and Globigerinella calida, contributing to the community up to 86%. The shell size of collected taxa was from 51 to 508 μm and the total carbon biomass was estimated to be between 0.062 µg C m–3 and 26.52 µg C m–3. The high carbon biomass was recorded at two stations in the equator zone. Due to its large size, Globorotalia menardii had total carbon biomass of 3.9 µg C m–3, followed by G. calida 0.68 µg C m−3, Trilobatus sacculifer 0.38 µg C m–3, Orbulina universa 0.56 µg C m–3, and G. ruber white 0.22 µg C m–3, respectively. The Pearson correlation analysis showed that the temperature and chlorophyll-a were two explanatory environmental variables that were found to be highly significant (p < 0.05) and that triggered the distribution and abundance of dominant foraminifera species in the study region. Overall, high abundances and carbon biomass were derived from the euphotic zone and equatorial region of the Eastern Indian Ocean.
1. Introduction
The Eastern Indian Ocean (EIO) is located between 1000 and 1500 km2 and covers the equatorial and southern region of the Indian Ocean, and it is described as being near the northeastern Bay of Bengal (BoB), northeast of the Sumatra coast of Indonesia. The Eastern Indian Ocean has three different water mass characteristics as runoff coastal waters (RRB) from BoB, East Indian Coastal Current (EICC) in the northern zones, and south monsoon current (SMC). The SMC, with an SW orientation interconnected with Wytki jets (WJ’s) currents at the equator, generates the SJC at the coastline near Sumatra, in the northern section [1].
Foraminifera are benthonic and planktonic unicellular micro-organisms that are included in the Rhizaria group [2,3]. They are made up of calcite shell chambers and can be identified based on the number of the final whorl, umbilical-extraumbilical aperture, and porous surfaces with spines and without spines [4]. Planktonic foraminifera are ubiquitous in the tropical and subtropical regions and are found abundantly in the upper 200 m depth [5,6]. They were widely used to predict climate change [7], ocean surface temperature [5,6,7,8,9,10,11], and atmospheric CO2 concentration [12,13,14]. They can survive under high temperatures of 30 °C [15], and some relevant studies have been reported from both coastal and open oceans in tropical regions [16]. The high-temperature effects on the shell pore size and the density [17,18] and any changes in shell morphometry and size [19], can describe the evidence of the past marine sedimentary records in the ocean [20,21].
They are calcite shell organisms that make a major contribution to the global biological and geochemical processes in the oceanic carbon pools [21,22]. They are contributing to the ca. 75% carbonate production in the microzooplankton community [23] and about 23–83% of CaCO3 production is derived from the euphotic zone [24,25,26]. The estimated values of total carbon fluxes are recorded as 6–23 gm−2 y−1 from the Eastern Indian Ocean [8,27]. However, they play an important role in stabilizing the pH of ocean water and controlling acidification [11,28]. They help to contribute CaCO3 to the ‘alkalinity pump’, which transports inorganic carbon from surface water to greater depths while reducing alkalinity [5,6,24,25].
The distribution of planktonic foraminifera is widespread in the world’s oceans, such as the Southern Indian Ocean [8], Eastern North Atlantic, Caribbean, Red Sea, and Arabian Sea [24], and coastal and oxygen minimum zones of the northern equatorial Indian Ocean [29,30]. The plankton tow and core-top sample studies of foraminifera were conducted earlier in 1968 [31] and in 1995 [8] from the Java coast of Indonesia at the north of 15° S along the Eastern Indian Ocean (EIO). We conducted a comprehensive study of a planktonic sampling of foraminifera, recording their distribution and carbon biomass derivation from surface to 200 m depth across three transects, i.e., Bay of Bengal (‘BoB’), near the Sumatra coastline, and south-equator and the equatorial region. Here, we report the baseline studies of planktonic foraminifera, which can be used for further palaeoceanographic studies and environmental monitoring assessments in the Eastern Indian Ocean.
2. Materials and Methods
2.1. Study Area
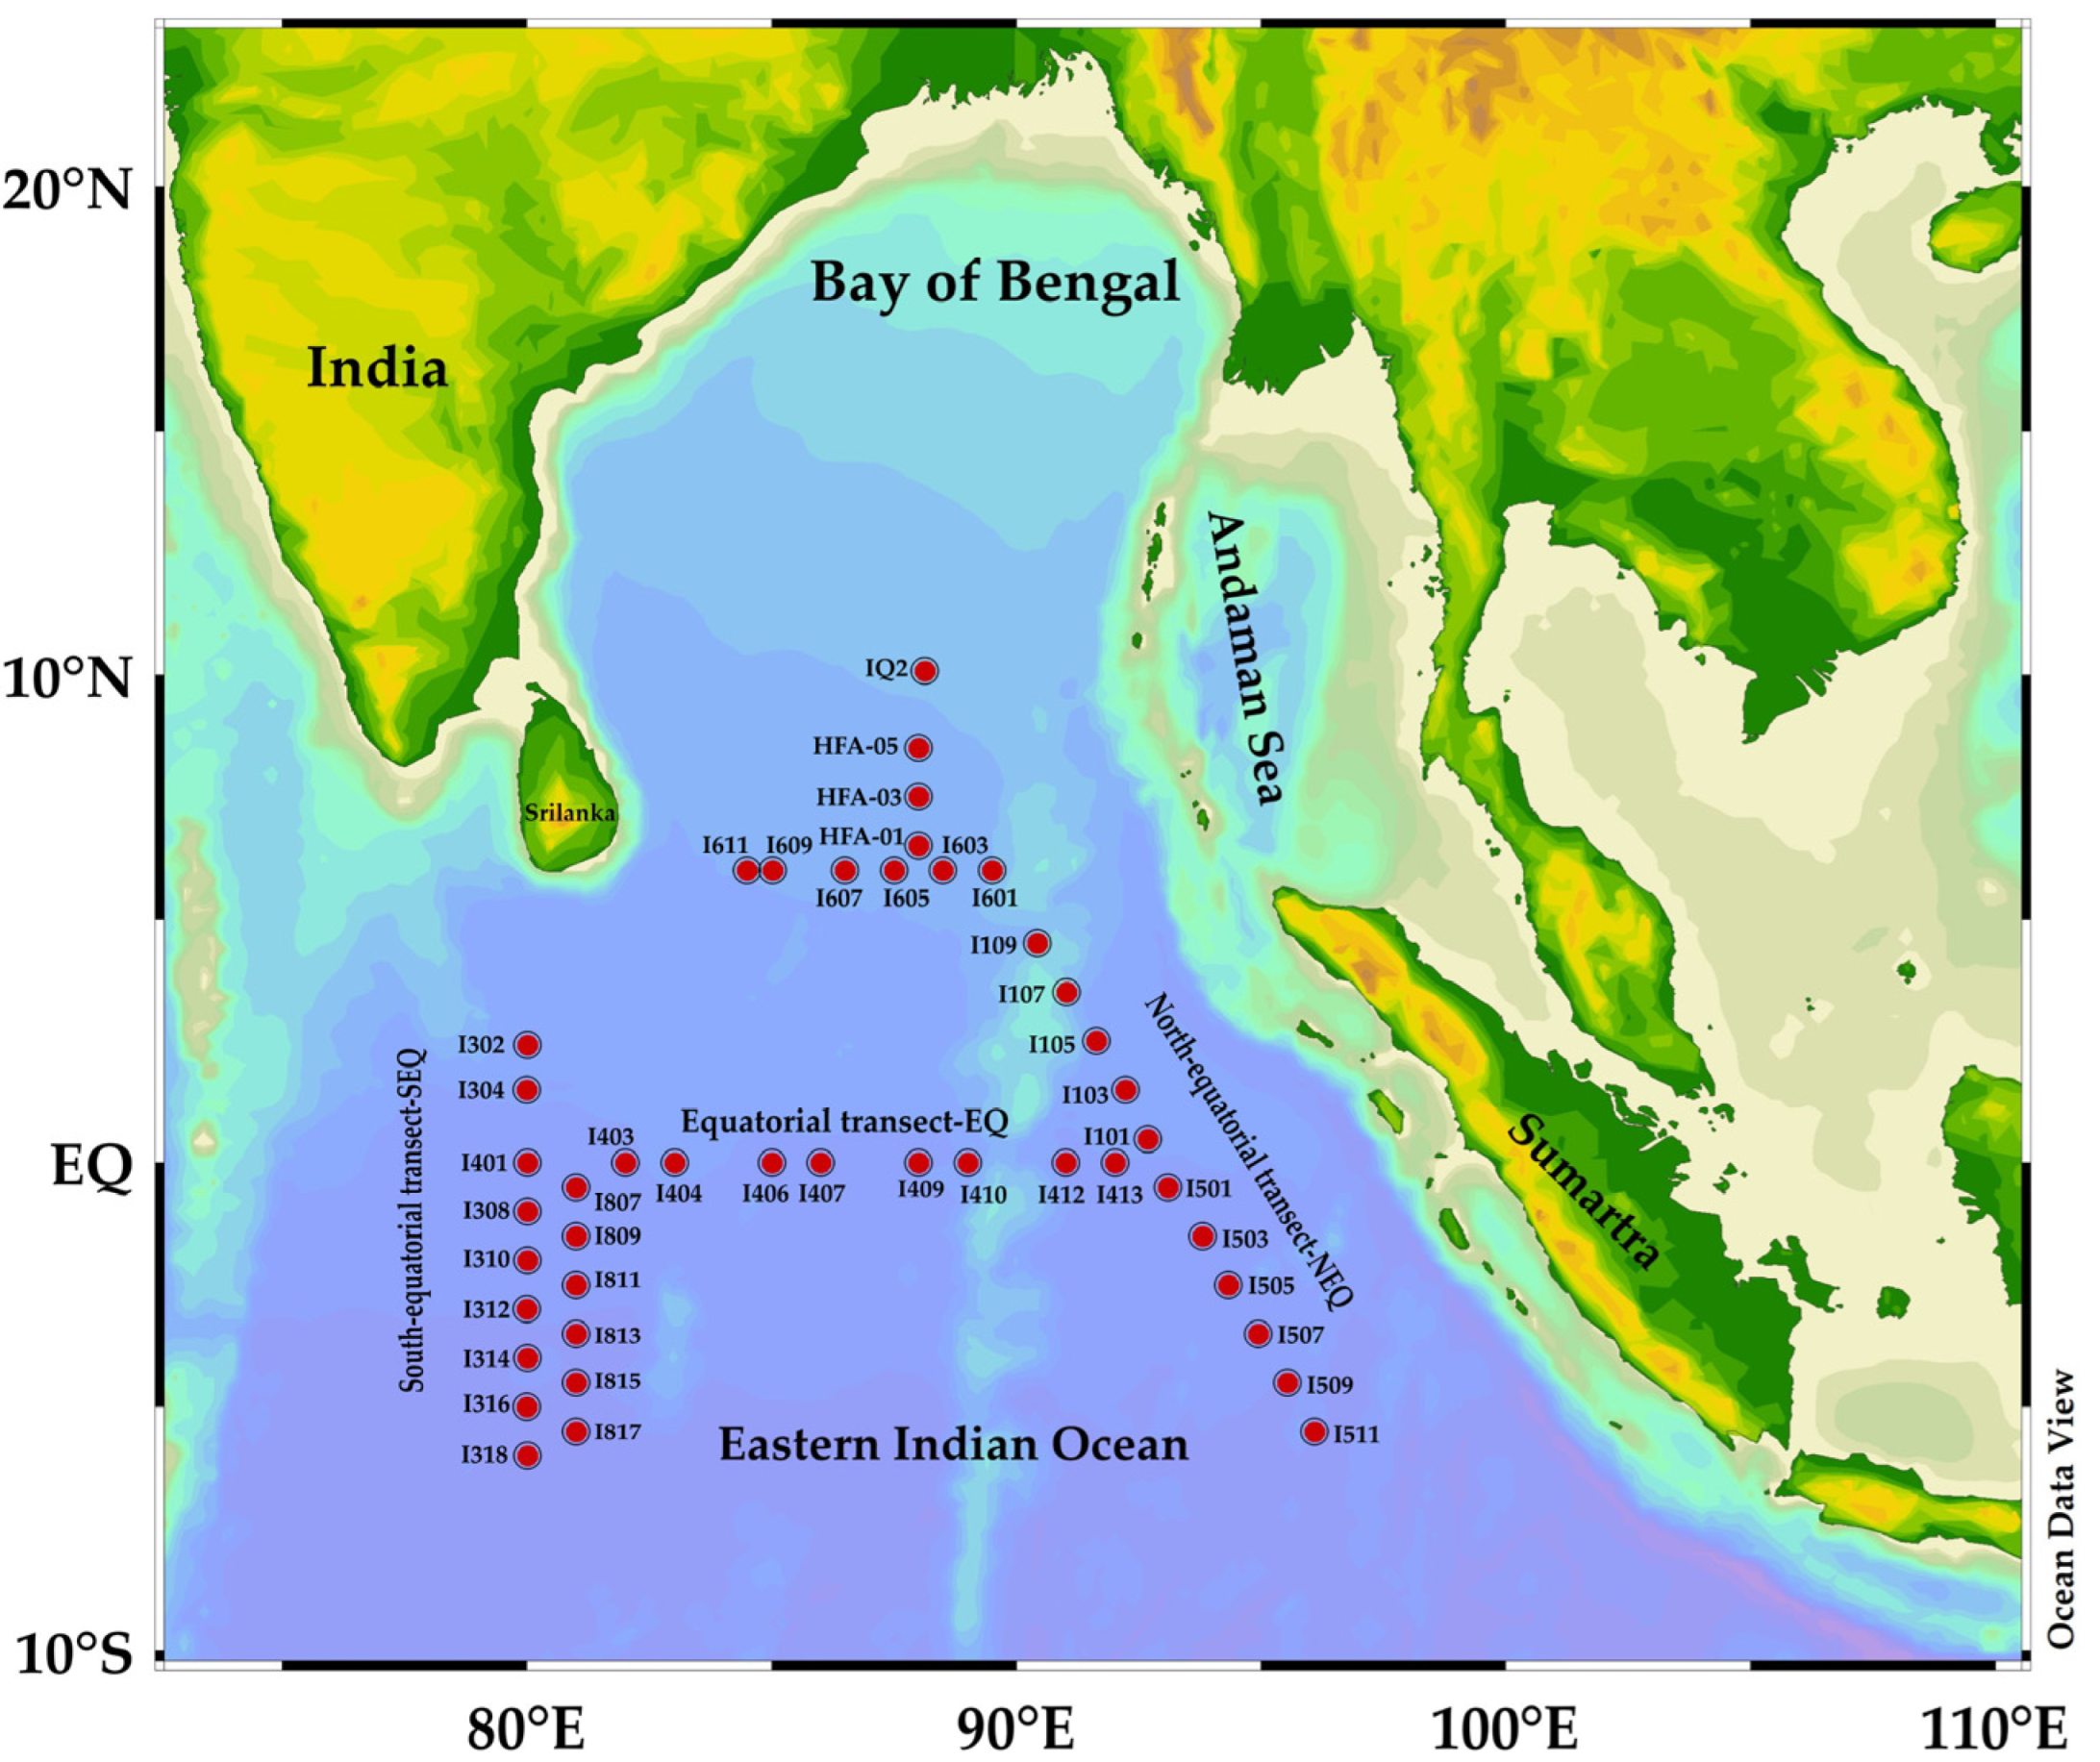
During the cruise Shiyan I (10 April–13 May 2014), samples were collected from the location (80.00°–96.10° E, 10.08° N–6.00° S) in the Eastern Indian Ocean (Figure 1). A total of 44 sampling sites were selected which covered the 17 stations along with the two coastal localities at the northern Bay of Bengal (BoB) and near Sumatra, at the coastline of Indonesia which is located at the transect 90° E (namely, NEQ transect). Fifteen stations cover the two adjacent, north-south lines at the transect 80° E (namely, SEQ transect) and 11 stations at the third transect which partially overlap the equatorial 0° region (namely, EQ transect) (Figure 1).
2.2. CTD Data Collection
An environmental data set was constructed from the Seabird conductivity-temperature-depth (CTD) system (Seabird SBE 911 plus v2). The CTD system was deployed to collect seawater from the ocean’s surface to depths of 25, 50, 75, 100, 150, and 200 m through CTD mounted rosette sampler with 12 5 L Niskin bottles. A standard protocol to measure the chlorophyll-a was employed by using the Strickland and Parsons method [32]. Approximately 500 mL of seawater was filtered on 25-mm diameter Whatman filter paper, then kept in 5 mL of acetone (93%) at 20 °C for 24 h and later analyzed by using a CT, Turner Designs (Trilogy, Sunnyvale, CA, USA) for estimation of chlorophyll-a concentration.
2.3. Plankton Tow Sampling and Cell Counting Method
Samples were retrieved from vertical haul (200 m to surface) using a modified Indian Ocean Standard Plankton Net (20 µm mesh size, 80 cm diameter, 0.5 m2, and total length 470 cm, with a mechanical flow meter) with speed 0.5 m s−1. The samples were immediately fixed with 2% formaldehyde and stored for further microscopic analyses at Dr. Sun’s laboratory (Tianjin University of Marine Science and Technology, Tianjin, China). The plankton net with a small mesh size may be clogged with phytoplankton, other microorganisms, detritus, or other particles when towing, so that they may strongly under-sample the zooplankton population rather than mesozooplankton [33]. Therefore, abundance estimations may be strongly biased. However, in our laboratory, foraminifera species were screened through careful microscopic observation under a Motic version 2 computerized microscope to avoid any other zooplankton species.
For identification and enumeration of cell counts, approximately 3 mL of sub-samples was used to settle into the settling chamber plate following the Utermöhl method [34]. Samples were examined at the 20× and 40× magnification under an inverted light microscope (Motic AE2000, Xiamen, China), which was equipped with a 0.5 m pixel digital camera (Moticam 2506, Xiamen, China). The sample was prepared for further analysis for scanning electron microscopy (SEM), and we used 0.6-µm, pore-size Millipore filter paper to filter the sample and then air dried it for 24 h. Later, the filter paper was mounted on a stub, sputter-coated, and then examined under the JEOL SEMs (JSM-IT300LV, Hitachi, Japan) at the biological building 13, Tianjin University of Science and Technology, TEDA, Tianjin, China.
2.4. Analysis of Diversity Measurements and Calculation Method
To estimate the richness and diversity of foraminifera, Shannon–Wiener diversity index (H′), Pielou’s evenness index (J), and Dominance index (Y) were employed by these equations [34]:
where S is the planktonic foraminifera species of each sample [35]. N is the total number of cells of all species counted; ni is the cell number of species i; Pi = ni/N represents the relative abundance of a given species; fi is the frequency of occurrence of species i in each sample. Species with Y > 0.02 were defined as dominant species [36].
To calculate foraminiferal abundance and biomass for each station, we calculated the total cell counts of the sample divided by filtered seawater volume (100 m−3) from the collected water column at the surface to 200 m.
2.5. Carbon Biomass Conversion Factor
To calculate the biovolume (V), the dimension of diameter of sphere shape shell (μm) was measured and the values were derived by using the formulae by Sun and Liu [34].
Sphere shape formulae V: π/6 × a3.
To calculate the carbon biomass/cell, biovolume (V) is converted to biomass by using a carbon/volume ratio of 0.05 pg C μm−3 and total carbon biomass was calculated by abundance by using the conversion factor 0.089 μg C m−3 [37].
2.6. Graphics and Statistical Analysis
The graphical figures were plotted by using the Ocean Data View program (ODV) and Adobe Illustrator CS 2019. Pearson correlation c° Efficient analysis was computed by using Past 4.03 software. This parametric correlation c° efficient value is used to analyze the significant value (p < 0.05) between species data vs. environmental factors described by Jeffrey’s integrated Bayes factor [38].
3. Results
3.1. Vertical Distribution of Temperature, Salinity, and Chlorophyll-a in the Eastern Indian Ocean
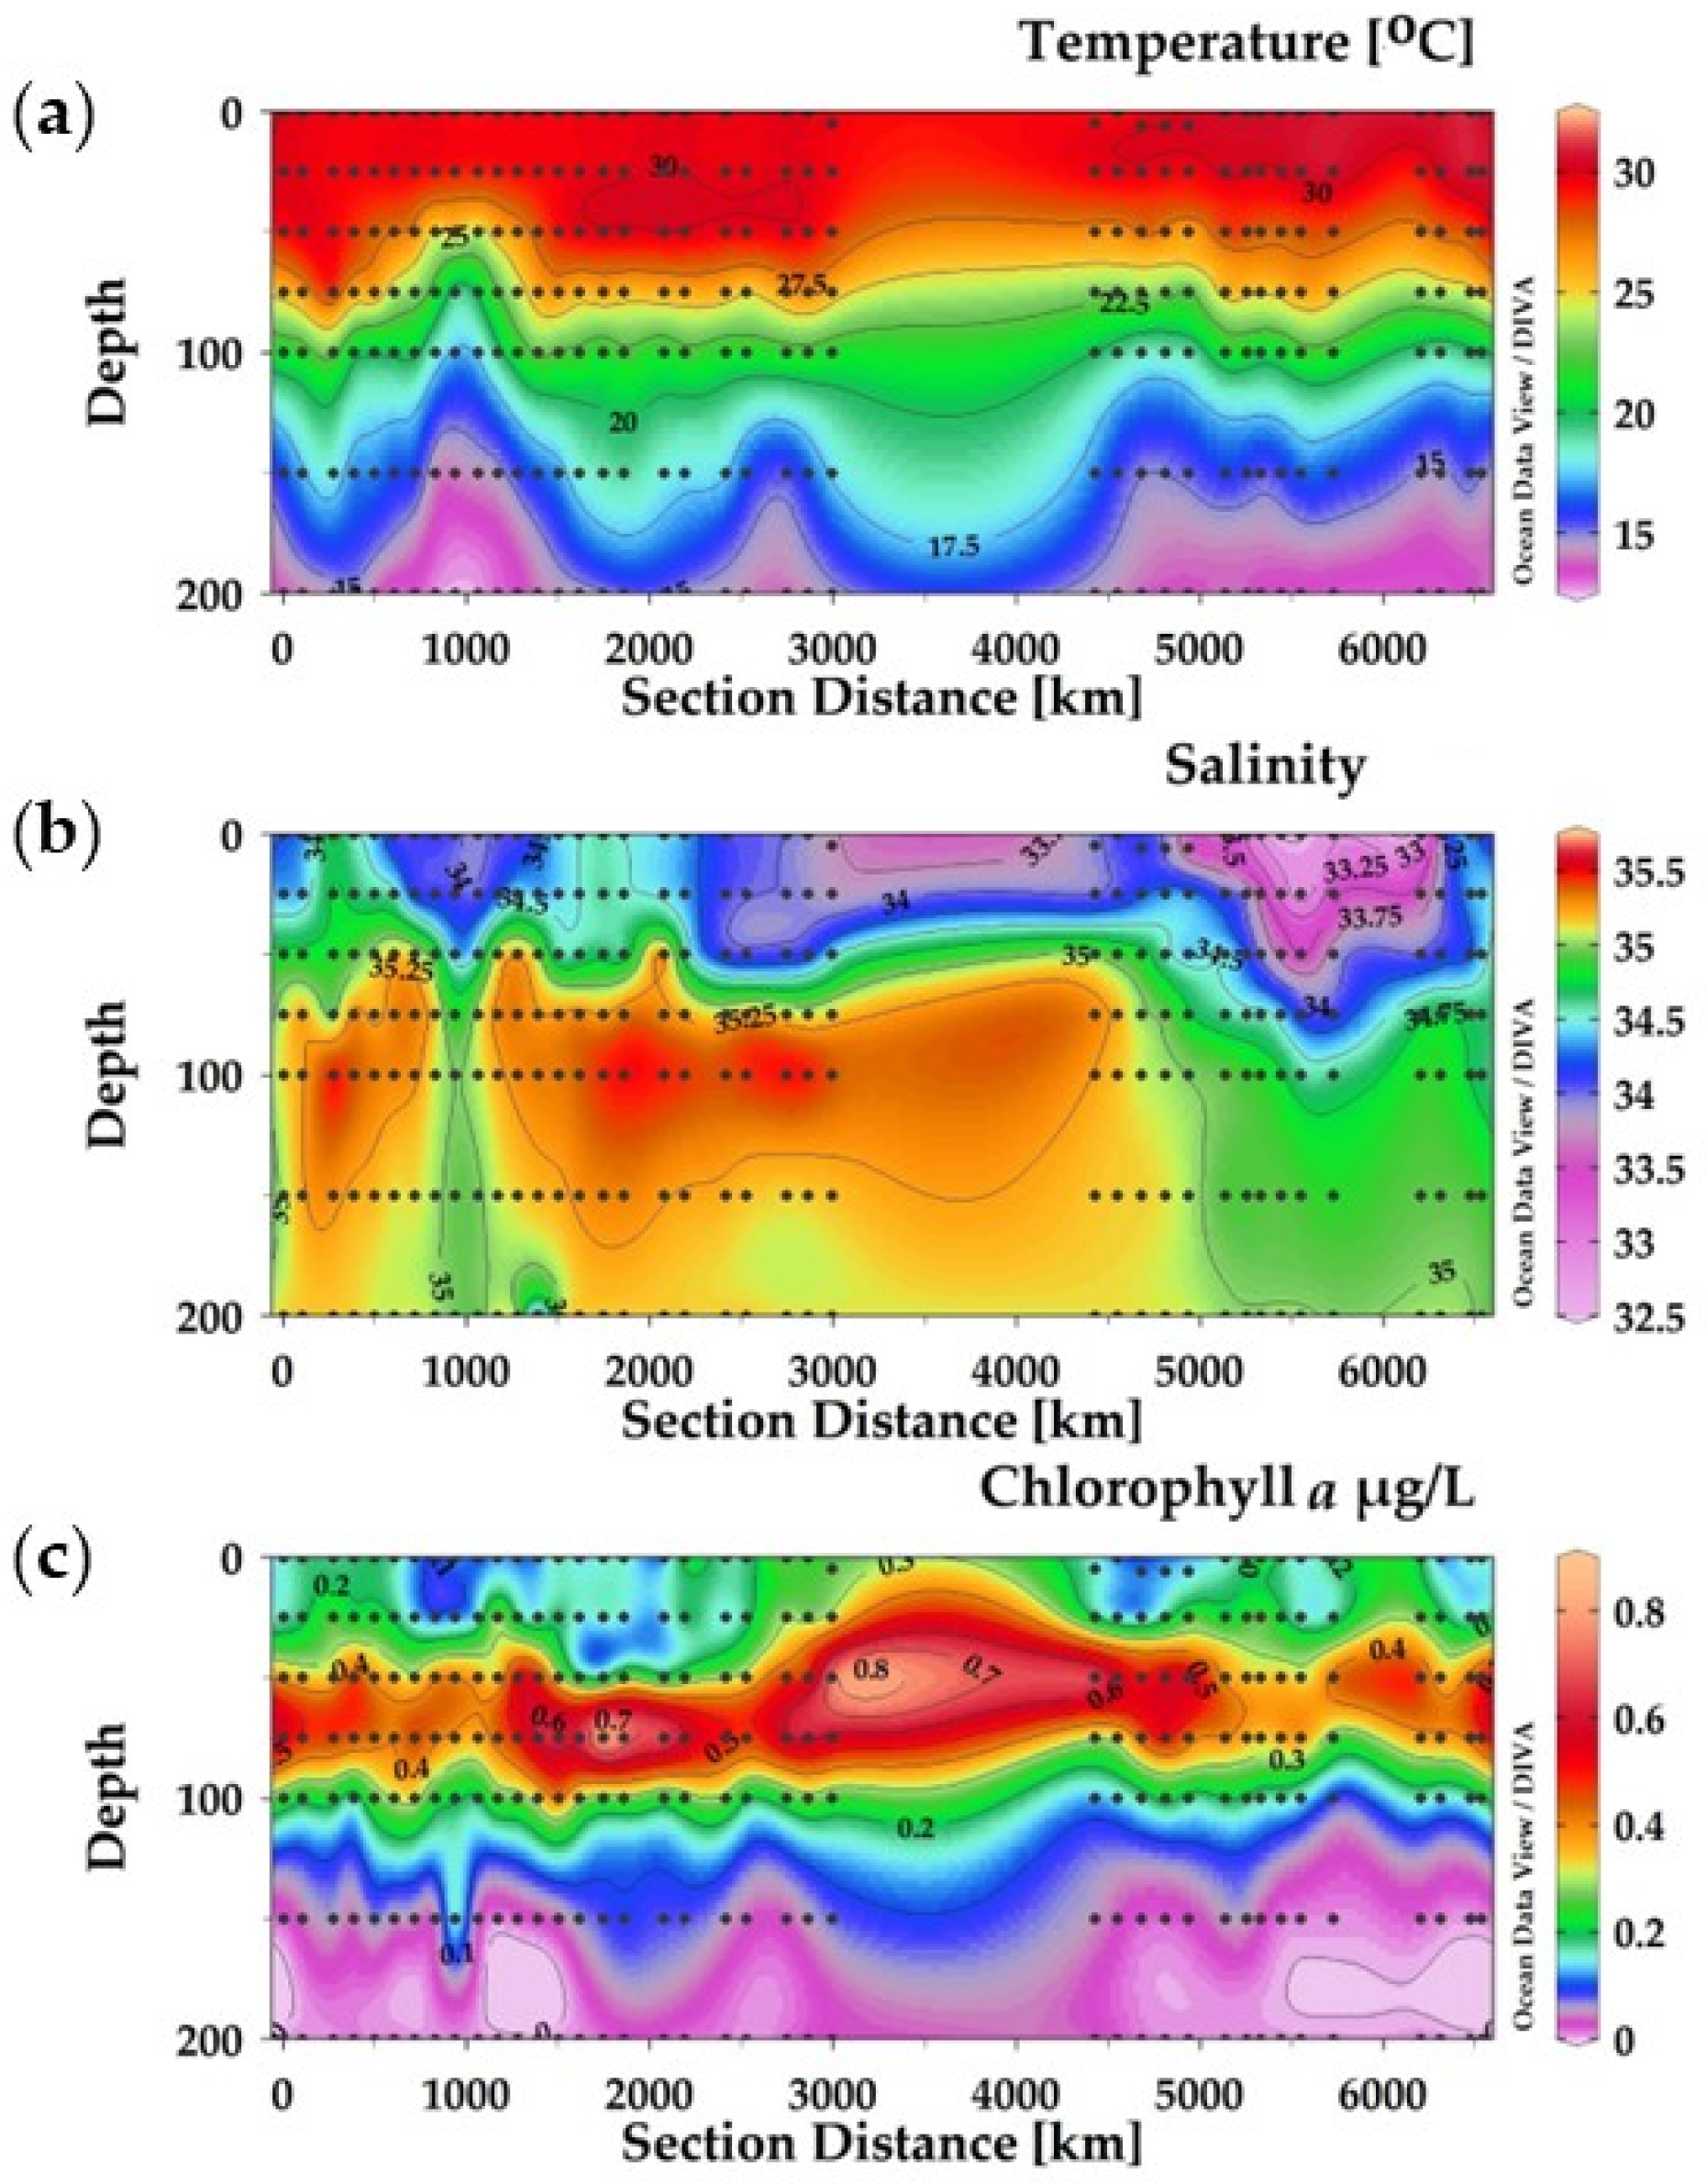
During the sampling time, the temperature ranged from 12.82 °C to 31.82 °C (Figure 2a). The temperature was higher at the surface layers than at lower depths (Figure 2a), whereas it became moderate at 17 °C at the depths of 150 m to 200 m. The salinity ranged between 32.5 and 35.5, with an average with SD of 34.74 ± 0.23 (Figure 2b), with low values in the upper 25 m depth and higher values between 100 and 200 m at the transects equator—0—and the transects SEQ zone—80° E (Figure 2b). The chlorophyll-a ranged from 0.005 µg/L to 0.89 µg/L, with an average with SD of 0.20 ± 3.74. The maximum chlorophyll-a value was recorded in the middle layers, 50 m and 75 m, in the equator zone (Figure 2c).
3.2. Horizontal Distribution of Temperature, Salinity, and Chlorophyll a
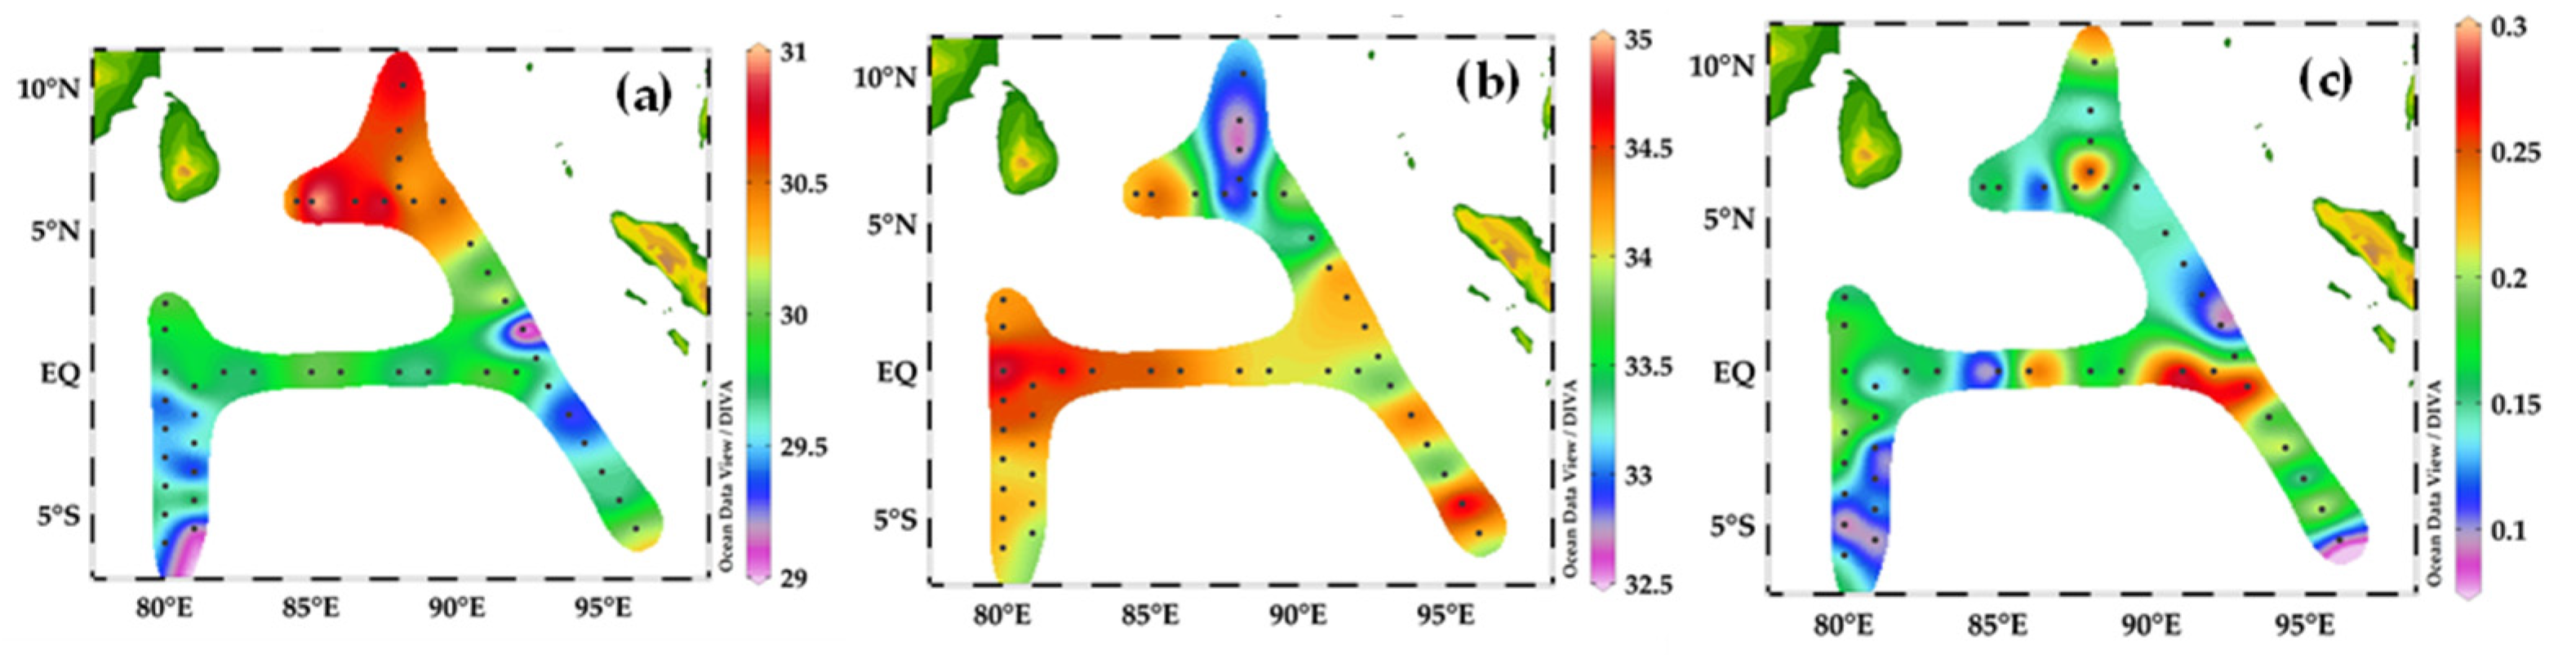
The highest value of temperature was 31.5 °C in the BoB sampling stations HFA01- HFA05 and I501, I503 at the transect 90° E (Figure 3a), and the lowest temperature value in °C was in the SEQ sampling station at transect 80° E. The highest salinity was recorded in the equator area and the lowest salinity (32.5) was recorded in the BoB at the transect area 90° E (Figure 3b). The highest chlorophyll-a value was recorded at stations I501 and I503 along the Sumatra, I403 at the equator, and AH-05 in the BoB region (Figure 3c).
3.3. Community Structure and Diversity Pattern
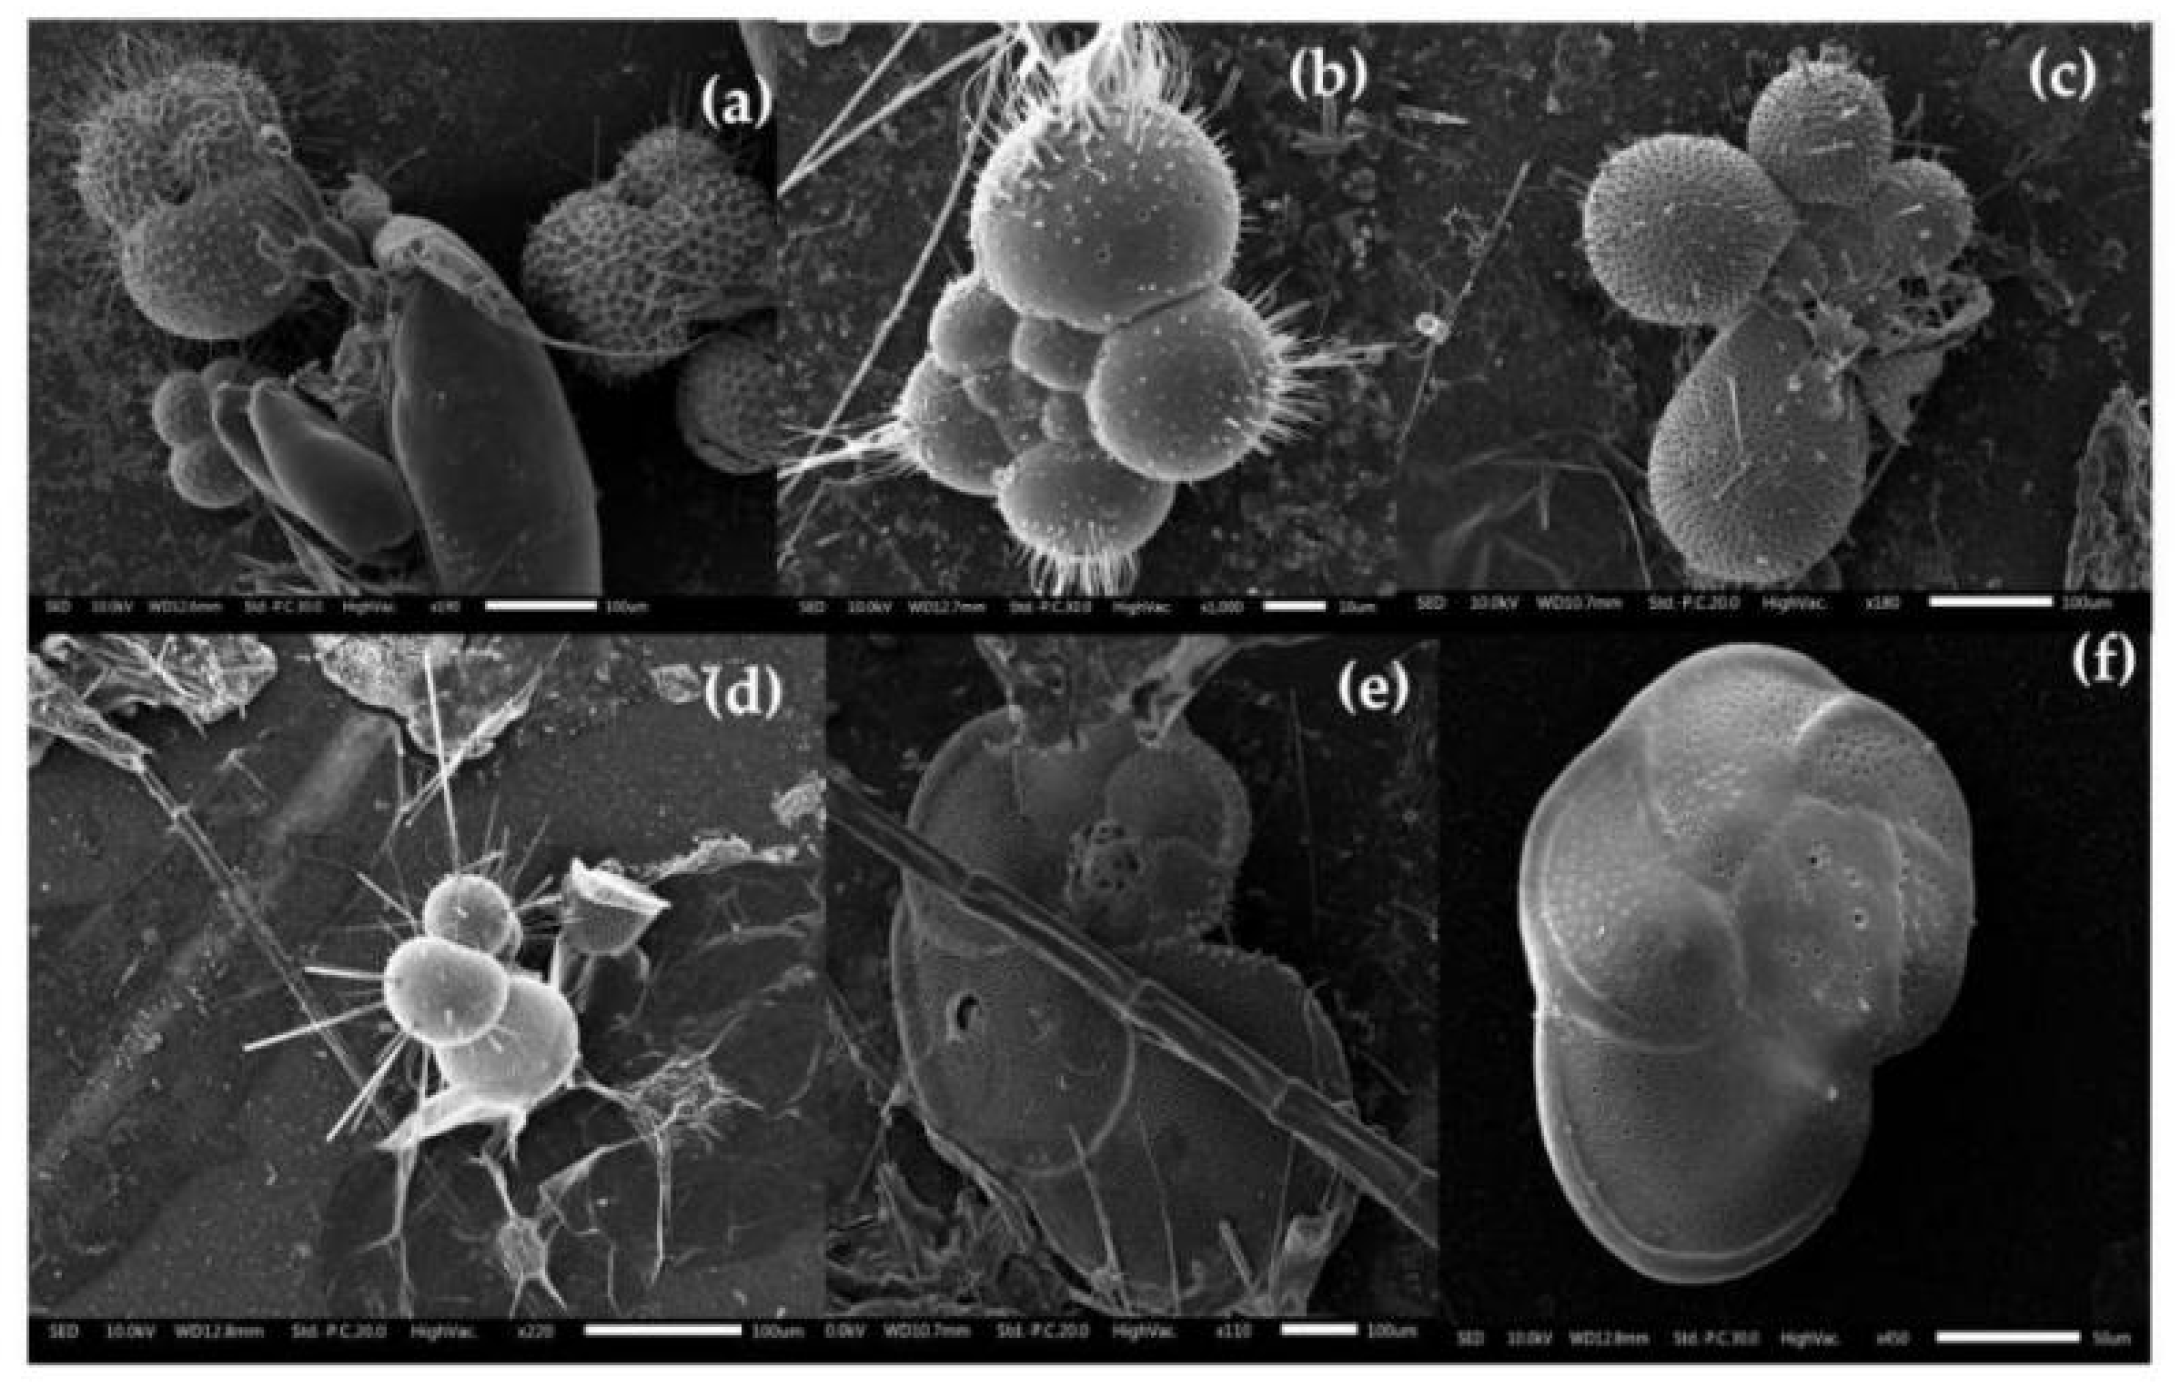
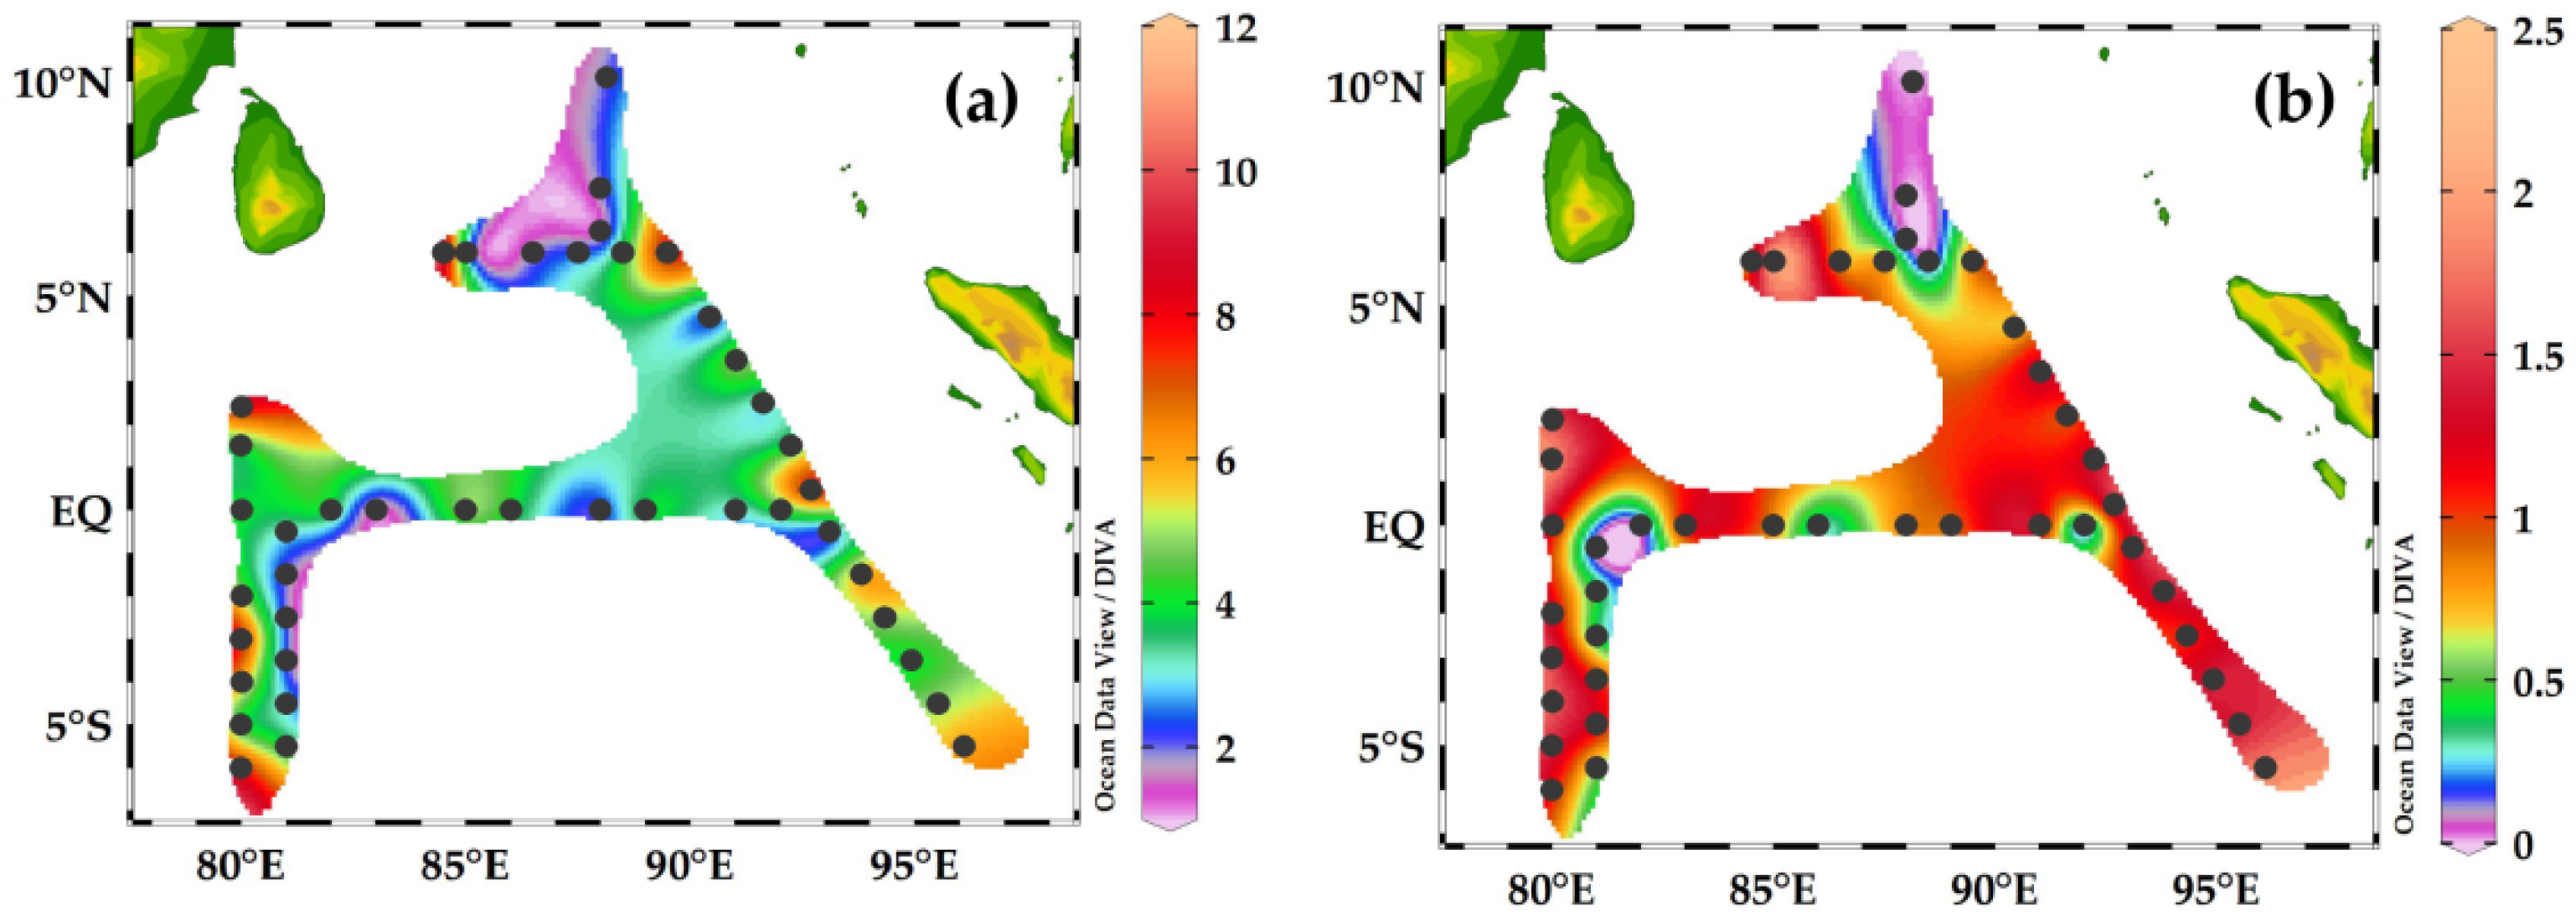
A total of 20 planktonic foraminifera species were collected from the study area (Figure 4). The raw data of each species at each station has been described (Supplementary Table S1). Total species richness was recorded up to 1 to 10 species/sample, and high species richness (10 species) was found from stations I306, I310 in the SEQ, and I505 in the NEQ area (Figure 5a). The diversity ranged from 0.25 to 2.37 H’ and maximum diversity was recorded at Station I607 in the BoB sampling area (Figure 5b), whereas the low diversity was recorded at stations I103, I503, I503, and I505 along with Sumatra coastal area and station I309 in the SEQ transect area, respectively.
3.4. Horizontal Distribution of Foraminifera and Their Contributions to Carbon Biomass
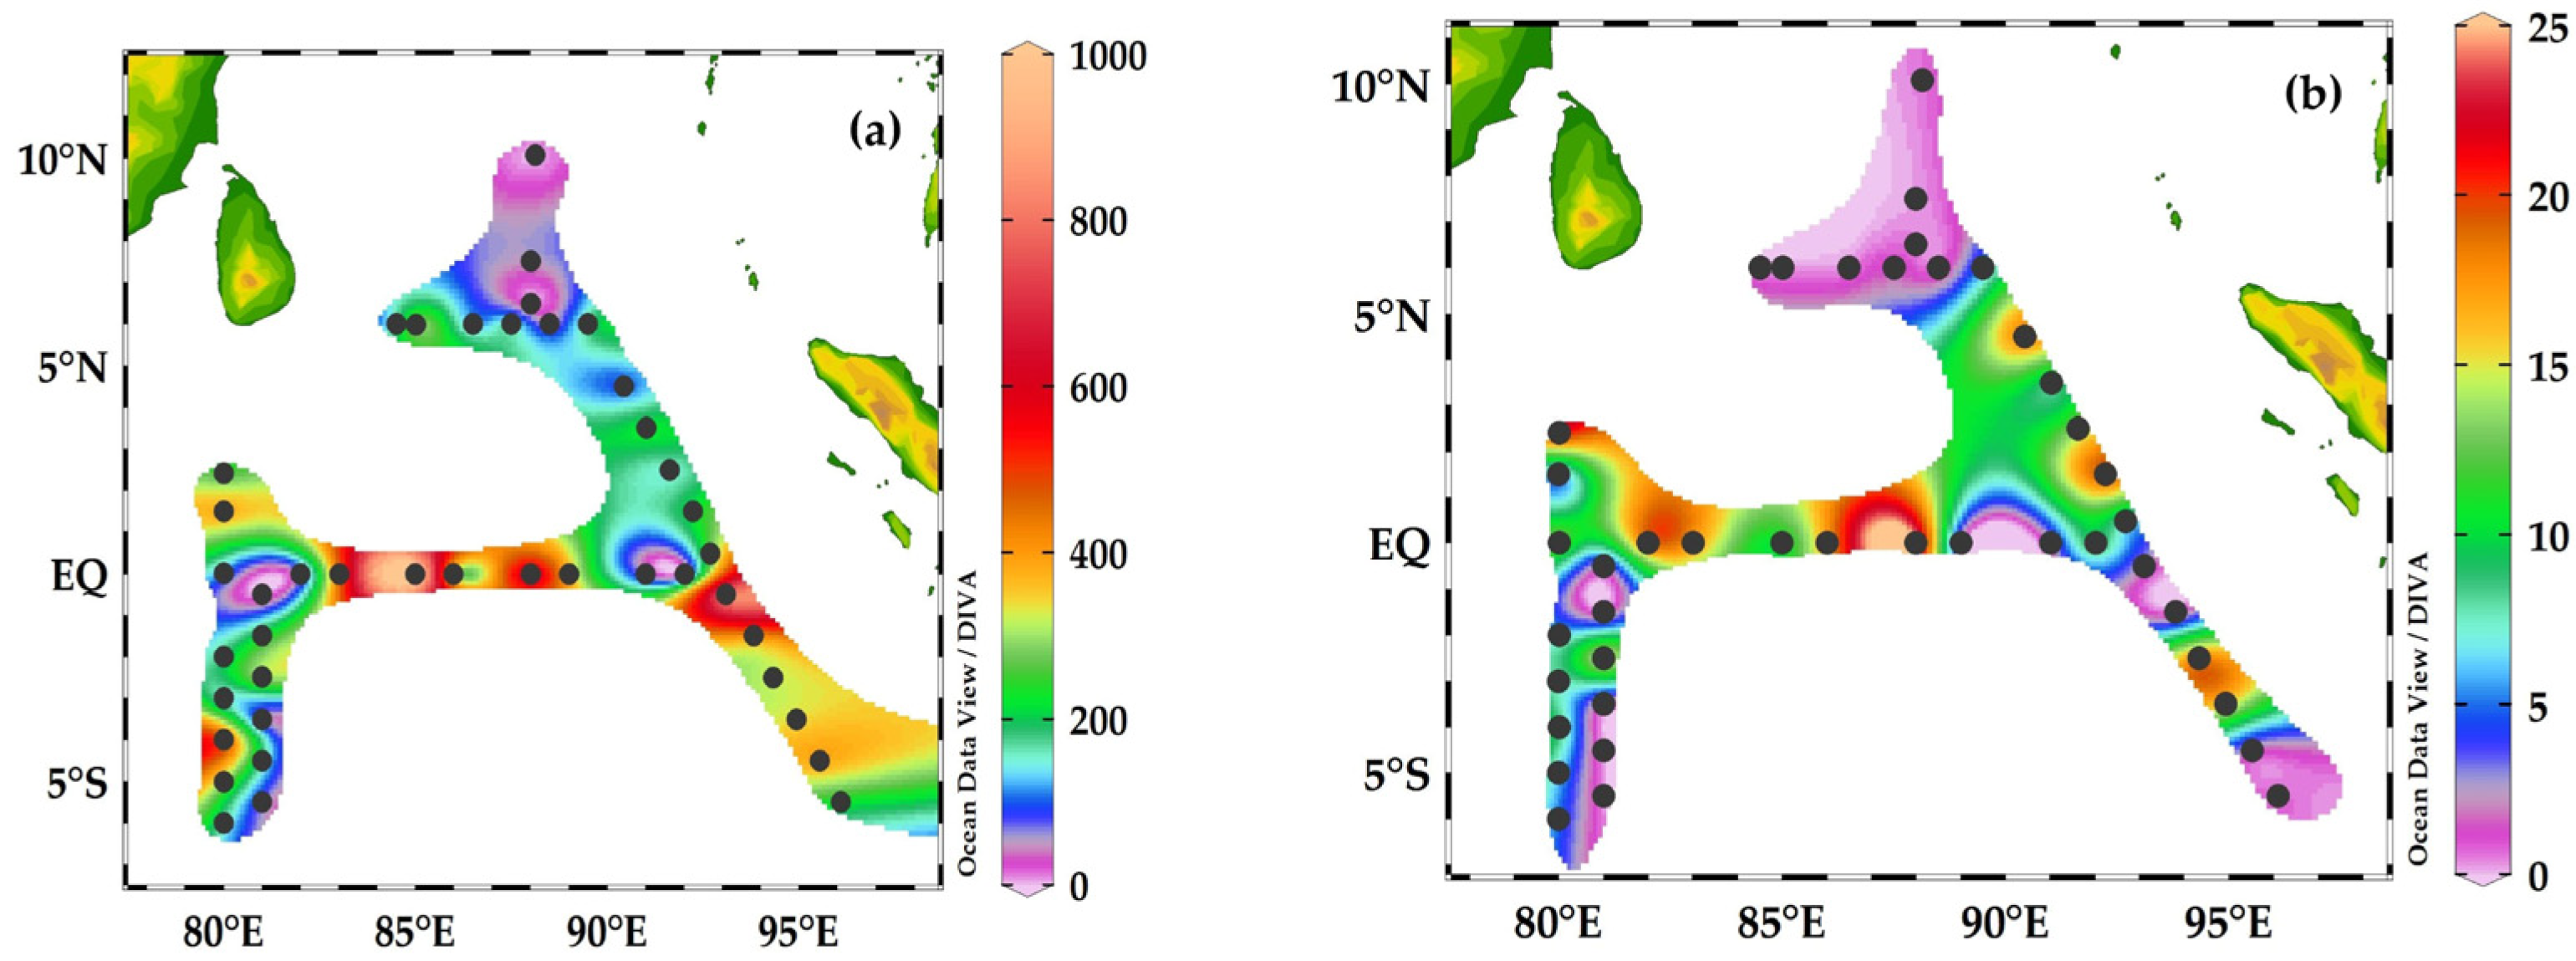
The abundance of foraminifera ranged from 50 to 1000 ind.m−3 (Figure 6a) and the maximum abundance was recorded at stations I404, I406, I407, I409, and I410 in the equator-EQ zone and I314 in the SEQ zone (Figure 6a). The low abundance of 200 ind. m−3 was recorded at stations IQ2 and HAF-01-HAF-05 in the transect 90° E.
The carbon biomass ranged from 0.06 to 25.5 μg C m−3 and high concentrations were recorded at stations I404, I406, and I409 in the equator zone, and low carbon biomass was recorded in the BoB at the transect 90° E (Figure 6b).
The total contribution of foraminifera species to relative abundance, frequency distribution, and dominant index is shown in (Table 1). The most dominant species are Globigerina bulloides and Globigerinoides ruber white with high contribution to total foraminifera between 32 and 38%, followed by 20% of Orcadia riedeli, 18% of Globigerinella siphonifera and Turborotalita quinqueloba, and 12–10% of Globigerinella calida and Orbulina universa (Table 1). The high dominance as Y > 0.40 was recorded for G. bulloides, followed by Y > 0.14 of G. ruber (white) and Y > 0.039 of G. siphonifera whereas the low dominant index was recorded for G. scitula, Globorotalia tumida, G. ungulata, Tenuitella parkerae, T. fleisheri, and T. humilis, respectively (Table 1).
3.5. Carbon Biomass of Planktonic Foraminifera Species in the Eastern Indian Ocean
Biovolume and carbon biomass derivations of identified taxa are summarized in Table 2. Shell diameter ranged from 17 to 88 μm for Dentigloborotalia anfracta, T. humilis, T. quinqueloba, and O. riedeli, 80–306 μm for G. bulloides, G. ruber (white), O. universa, G. calida, and G. menardii, and 200–500 μm recorded for G. tumida (Table 2). G. menardii (mean biovolume = 4.4 × 108 μm3) contributed the maximum and total carbon biomass values of 3.9 μg C m−3, whereas G. ruber white, with mean biovolume = 2.5 × 107 μm3, contributed low carbon biomass 0.22 μg C m−3, respectively (Table 2).
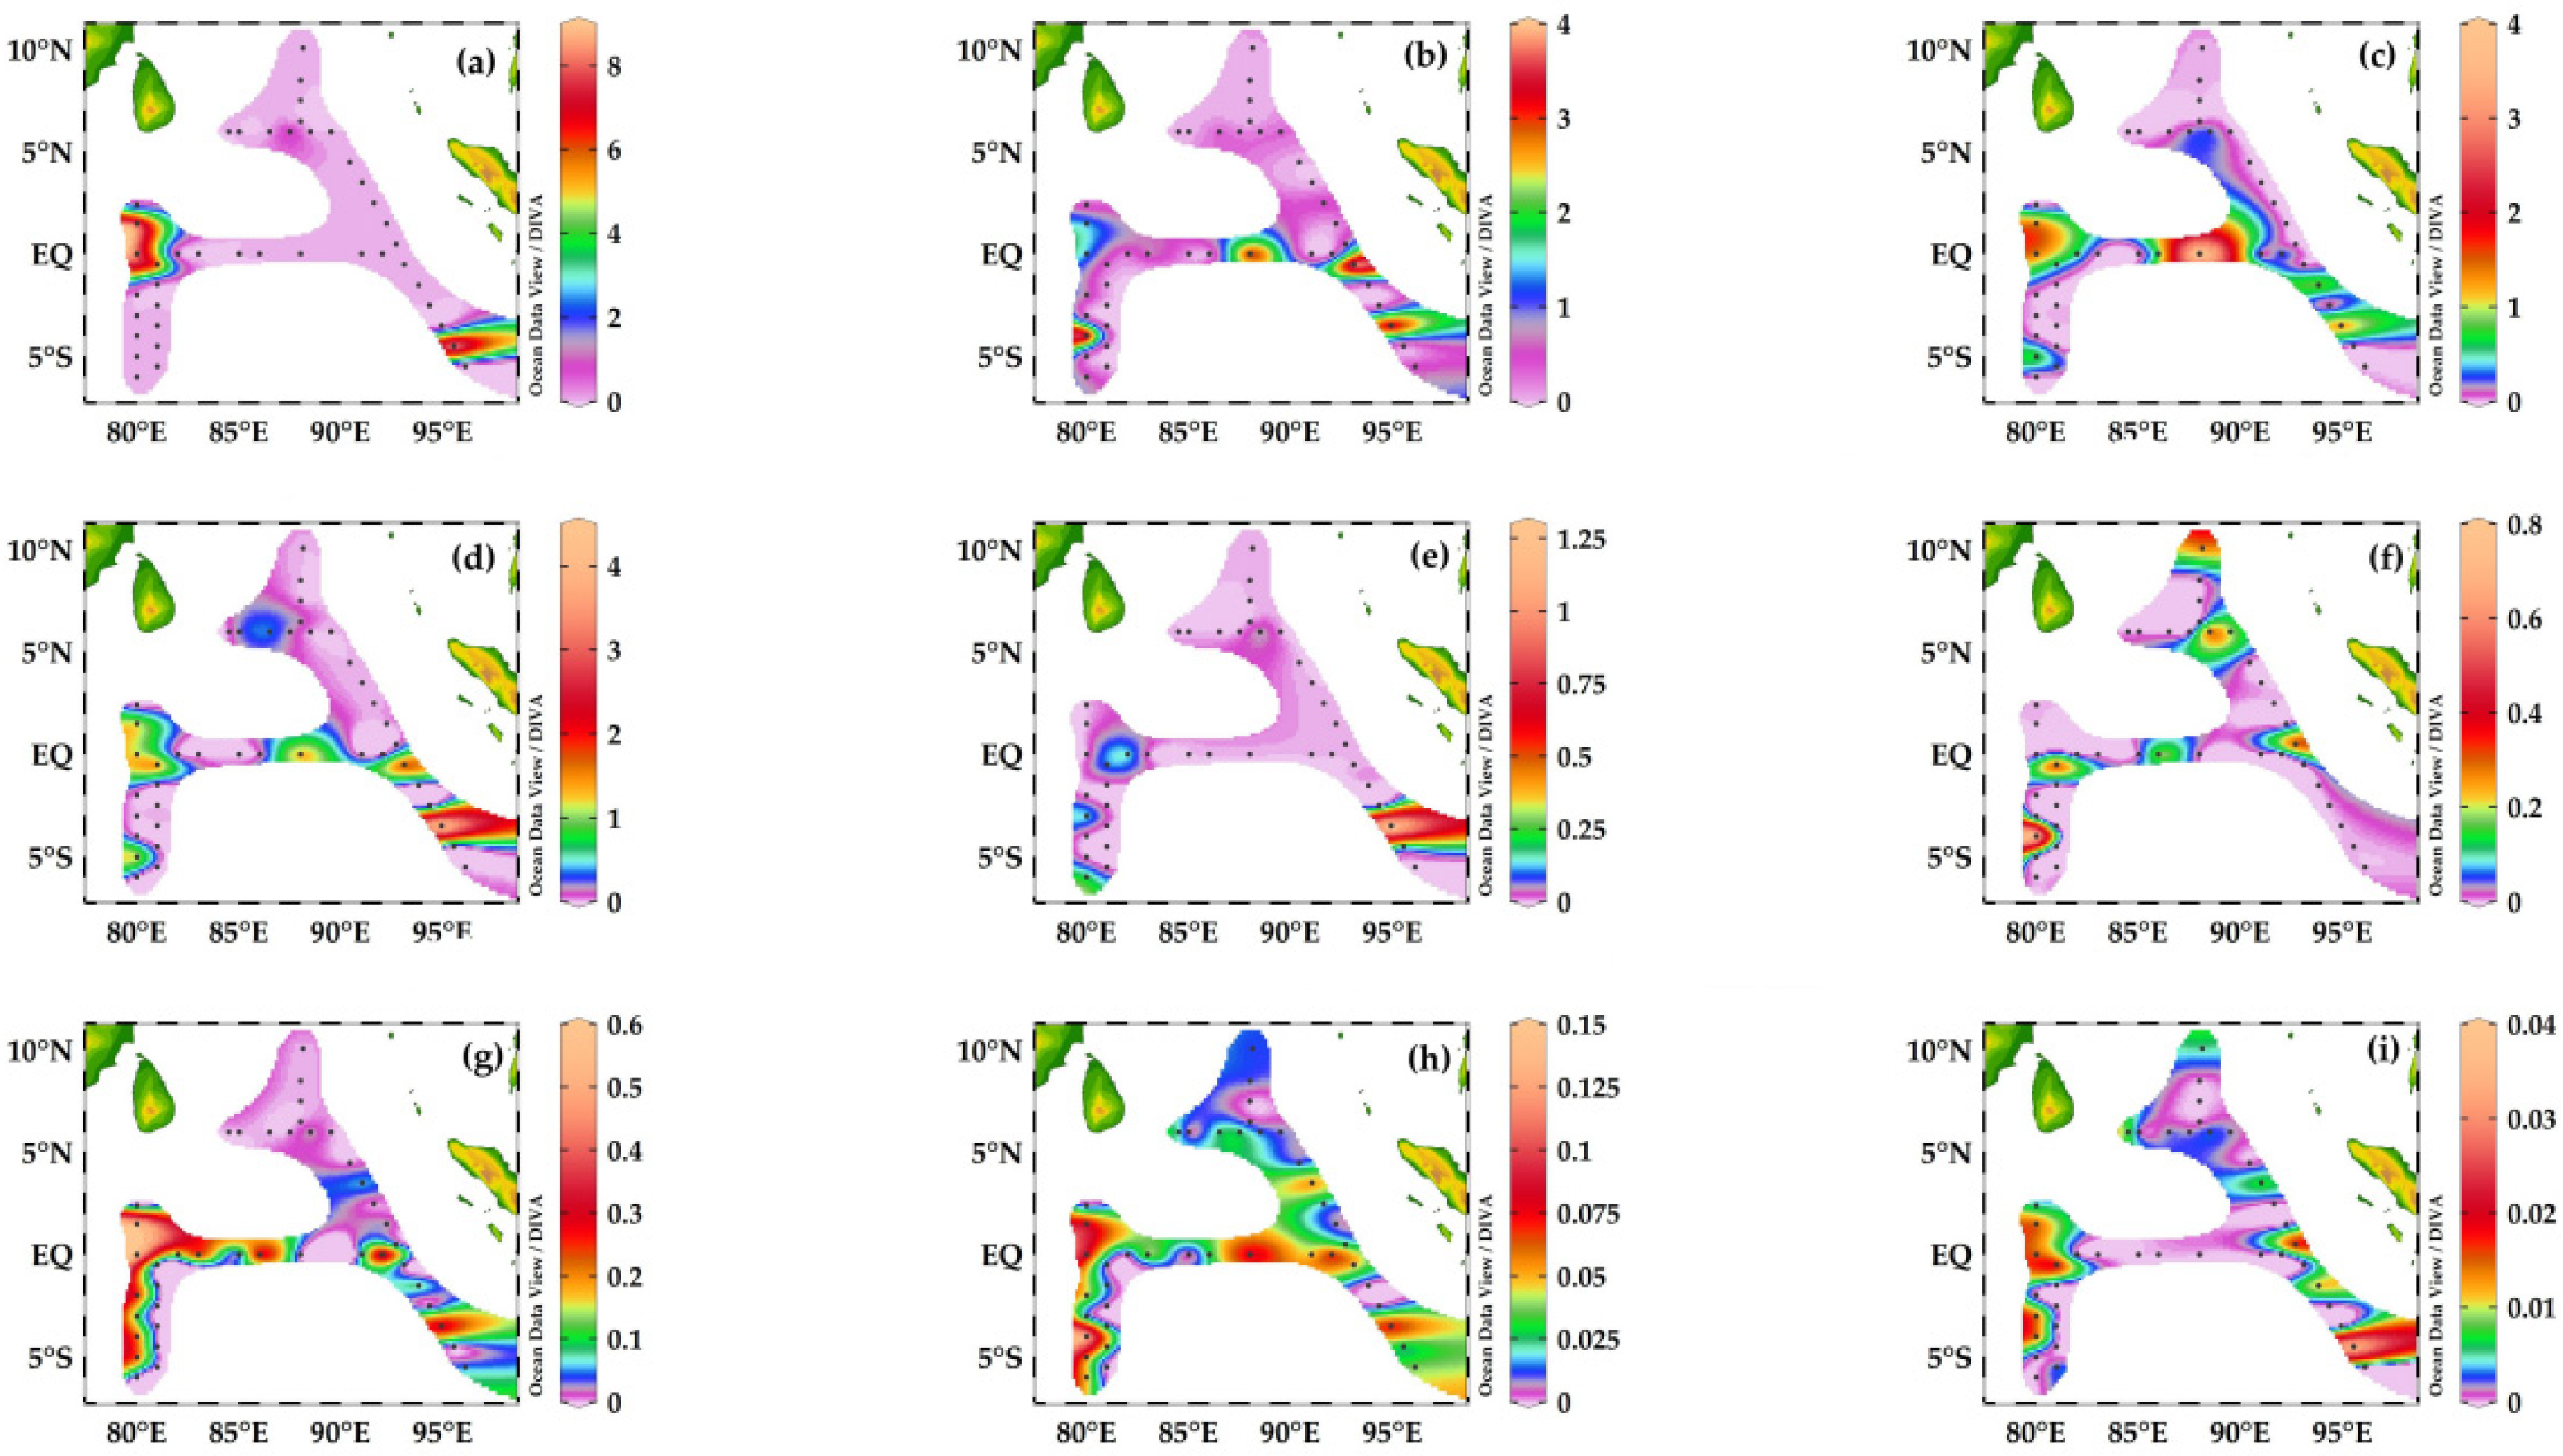
The carbon biomass distribution of each species is shown in Figure 7. G. menardii had maximum carbon biomass of 8.5 μg C m−3 at station 1412, 1306 recorded from transect 80° E, and 6 μg C m−3 at station 1609 recorded from transect 90° E (Figure 7a). The carbon biomass greater than 4 μg C m−3 was recorded for G. ruber (white) at stations I310, I402, I406, and I410, followed by G. calida at station I402 and O. universa at station I410 in the SEQ transect 80° E and EQ transect station (Figure 7b–d). G. glutinata had a biomass of 1 μg C m−3 at Station I410, followed by T. sacculifer with high biomass of 0.8 μg C m−3 at stations I310 and I607; G. siphonifera with high biomass of 0.6 μg C m−3 at Station I306; G. bulloides with high biomass 0.15 μg C m−3 at station I310 (Figure 7e–h); and T. quinqueloba, H. pelagica, G. tumida, and D. anfracta with low biomass between 0.5 and 0.003 μg C m−3 were recorded at the transect EQ (Figure 7i–l). Total carbon biomass was recorded at 3.9 μg C m−3 for G. menardii, 0.68–0.59 μg C m−3 for G. calida and O. universa, 0.38 μg C m−3 for T. sacculifer, and 0.22 μg C m−3 for G. ruber (white) (Table 2).
3.6. Correlation Analysis
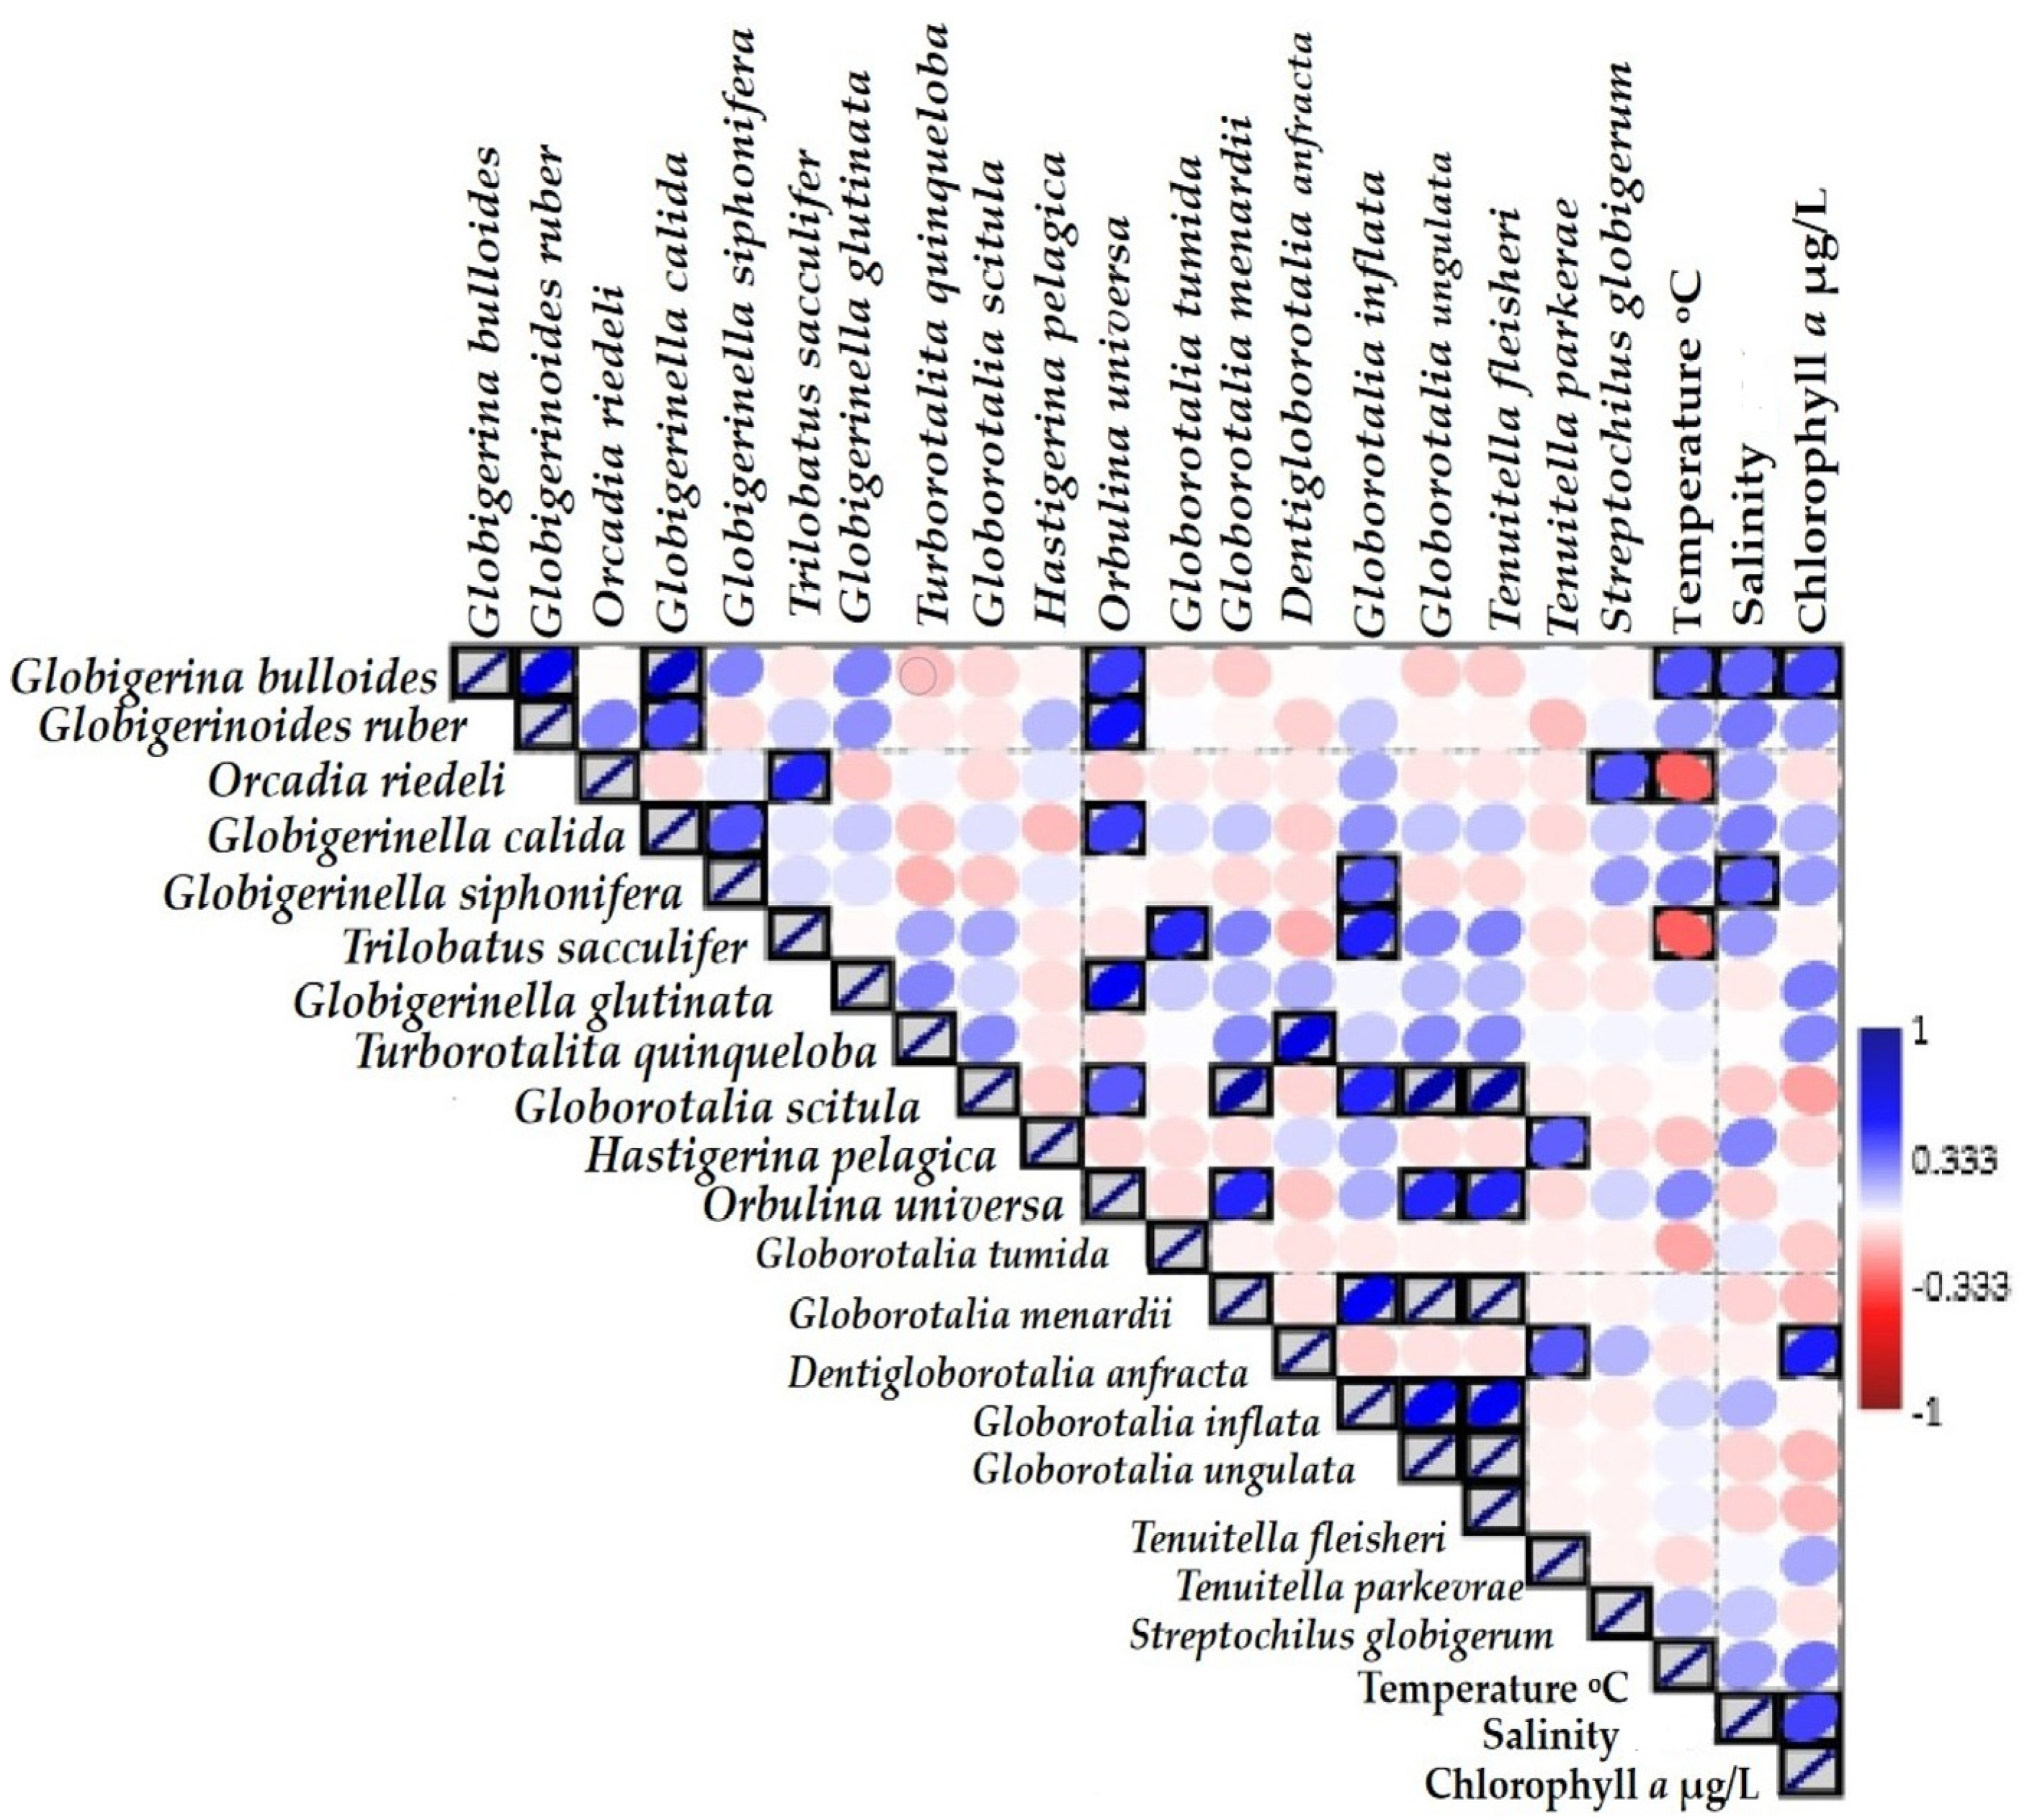
Correlation plots indicate the significant value (p < 0.05) of foraminifera species and three environmental variables in Figure 8. The abundance of most dominant species, G. bulloides, G. ruber, G. siphonifera, and G. calida, showed significant positive correspondence with temperature (R2 = 0.334, 0.196, and 0.20, salinity (R2 = 0307–0.20), and chlorophyll-a (R2 = 0.37, 0.18, 0.15, 0.19) in Table 3. Whereas six other species—O. riedeli, T. sacculifer, G. scitula, H. pelagica, G. tumida, and D. anfracta—showed a negative correlation with temperature (R2 = −0.310, −0.006, −0.12, −0.17). Furthermore, G. glutinata, G. scitula, O. universa, G. menardii, D. anfracta, and T. fleisheri showed a negative correlation with salinity (R2 = −0.04, −0.10, −0.09, −0.01) (Table 3). D. anfracta showed a significant positive correlation with chlorophyll-a (r = 0.44, p < 0.05).
4. Discussion
- (a)
- Foraminifera assemblages, horizontal distribution, and water masses
Planktonic samples in the euphotic zone of the Eastern Indian ocean constituted a diverse population of diatoms [39], tintinnids [40], and radiolarians [41] from the study area 10° N–6° S. Compared to previous studies by Martinez [8], we have undertaken the first detailed ecological studies of foraminifera to community structure analysis, diversity, and carbon biomass estimation in the euphotic zone of the Eastern Indian Ocean. In the present study, the sampling net (20 μm mesh) was used to collect concentrated plankton samples which contain not only microzooplankton but also phytoplankton and organic matter [33]. Therefore, the volume of water filtered (filtration efficiency) can be underestimated and variations in the zooplankton abundances can be overestimated [42]. However, our estimated values of foraminifera abundance data are consistent with other reports of plankton tow sample studies of foraminifera from the oligotrophic waters’ settlings [6,43] and also from polar regions [44,45]. We collected 20 species in the euphotic zone of the Eastern Indian Ocean, and all observed species were non-spinose and spinose subtropical species [4,45]. Among those, G. bulloides, G. ruber (white), and T. sacculifer were the most abundant species (Table 3) which dominated foraminifera in the equatorial region (Figure 5)
Horizontal distribution and abundance of foraminifera showed high diversity and richness around the equator and SEQ zone and low diversity around the northeast zone, BoB (Figure 5 and Figure 6). During the present study, the equatorial area related strongly to mixed-layer chlorophyll-a concentration and high salinities and northeast transects to surface low salinity concentrations and high temperatures, respectively (Figure 2 and Figure 3). In the equatorial region, Wjs currents predominantly appeared in the spring season whereas other currents did not appear [46]. In the spring season, Wjs currents have influenced the diversity and distribution of different protozoans including calcifying protists in the Eastern Indian Ocean [46] and determined the low phytoplankton productivity in the equatorial region, which is characterized by low salinity, high temperature, and a DCM layer [39]. According to Zhang et al. [40], the high DCM has caused great variability in the diversity of eukaryotic protists, such as tintinnids and diatoms in the spring season [39,40]. We can assume that the high abundance of foraminifera during the same cruise sampling area could be the reason for the decline of phytoplankton production in the equatorial region of EIO, due to their preference for a herbivorous diet mainly on diatoms [22,27,47]. In contrast, high chlorophyll-a surface concentration corresponded to low planktonic foraminifera fluxes, which were reported from the northern Red Sea, Gulf of Aqaba (GOA) [48].
Foraminifera assemblages and abundances were relatively low in the northeast transect along with BoB and Sumatra coastal area where many species were scarce (Figure 5) due to the low salinity and the high-temperature factor. Other studies based on surface sediments in the BoB also reported the low abundances of foraminifera in shallow waters due to the salinity variations due to run-off riverine water flow [49]. However, optimum temperature and upwelling condition are considered to be the main controlling factors for increases in foraminifera fluxes in the vicinity of the Eastern Indian Ocean [8]. Other factors, such as predation on planktonic foraminifera and high salinity variation, could be the possible reasons for lowering the foraminifera population in shallow waters in the Indian Ocean [50] because the planktonic foraminifera were found in the gut of invertebrates, pteropods, and other metazoans. Additionally, it is necessary to check the grazing pressure to investigate the tropical status and possible cause of decline population foraminifera in northern sections of the Eastern Indian Ocean.
- (b)
- Contribution of foraminifera to the carbon biomass in the Eastern Indian Ocean
Our data of carbon conversion ratio for each species were described as 0.07 and 0.11 pg C µm−3 in Table 2, which are consistent with the estimated values of foraminifera (0.018 and 0.18 pg C µm−3) [37]. The carbon biomass through biovolume derivation was maximum recorded from small-size species D. anfracta, T. fleisheri, O. riedeli, H. pelagica, T. humilis, and G. bulloides (Table 2), whereas large size species, such as G. menardii, contributed high carbon biomass 3.9 µg C m−3, followed by 0.68–0.56 µg C m−3 for G. calida and 0.68–0.56 µg C m−3 for O. universa. Other species reported a low carbon biomass contribution of 0.15–0.07 µg C m−3, respectively (Table 2). These studies on carbon biomass at the species level based on biovolume and abundance derivation were proposed for the first time in EIO (Figure 7) and, among them, about 188 µm test-size G. menardii demonstrated high biomass in the equatorial region of the Eastern Indian Ocean (This study), which is one of the most common species reported from the equatorial region, Arabian Sea, BoB [51].
We recorded the maximum carbon biomass as 23.82 μg C m−3 in the euphotic zone of EIO from stations I404, I406, and I409 located in the equator region and low biomass distribution toward the north zone (Figure 6b). This is the first carbon biomass study of foraminifera in the EIO and high carbon biomass of foraminifera was obtained due to large shell size species compared to other studies, for example, according to Scheibel and Movellan [23], about 125 µm test-size foraminifera contributed to the biomass 2.93–11.27 μg C m−2 and 8.5–32.7 Tg C yr−1. Globally, the total biomass of foraminifera is reported between 0.413 ± 0.040 μg C µm−3 from the North Atlantic Ocean, Caribbean Sea, Arabian Sea, Gulf of Aden, and Red Sea [52]. Similarly, other studies also showed that high carbon biomass in the equatorial region of the Eastern Indian Ocean was mainly due to the larger cellular sizes of protist picoplankton and Synechococcus (Syn) and their high abundance value [53].
- (c)
- Environmental Factors affecting foraminifera assemblages
A range of environmental variables has been shown to affect the planktonic foraminiferal community composition in other regions [5,16,54]. However, previous estimation correlations values were weaker in the Indian and Pacific Oceans than in the Atlantic Ocean [55]. Our statistical correlation values were found for foraminifera species which dominated through three explanatory variables, such as temperature, salinity, and chlorophyll-a (Figure 8; Table 3). Throughout this study, vertical temperature, salinity, and chlorophyll-a profile (Figure 3a–c) showed insight changes between the upper layer and mixed layers. The surface temperature remains high above 100 m and drastically dropped by ~15 °C across the middle layer of 200 m (Figure 3a). The strong correlation values at p < 0.05 were determined for the abundance of the most dominant species: G. bulloides, G. ruber, O. riedeli, and T. sacculifer with temperature. However, O. riedeli and T. sacculifer were observed to have negative correlation values (Table 3). According to Rutherford et al. [56], warmer surface water provides more distinct niches to 90% of planktonic foraminifera species under high temperatures. We can conclude that species richness and diversity can be impacted by the SST level and by fluctuations in ocean current boundaries.
Salinity is another factor that was observed in inverse relation to temperatures in EIO [1,39,40,53]. The upper ~150 m of the water column coincides with an increase in salinity values (Figure 3b). We observed a negative correlation of G. glutinata, G. scitula, O. universa, G. menardii, D. anfracta, and T. fleisheri abundance with salinity (Table 3). These assemblages were encountered under the north-equator currents and due to diluted water run-off from northern zones, especially BoB and Sumatra Bay of Indonesia. Salinity gradient values fluctuate in all transect areas. Any variations in salinity could interplay and certain planktonic foraminifera species are less capable under high-stress levels, which are harder to interpret [5].
We observed intense surface waters Chl-a maximum at 50–75 m in the mixed layer (Figure 3c). DCM layers in the deepest 50 m, 75 m, and 100 m correspond to a possible explanatory variable in EIO [40], and various pelagic protists were found abundantly in the equatorial region when the DCM layer was well mixed [46]. Moreover, some rarely occurring species, such as D. anfracta, G. glutinata, T. quinqueloba, and O. universa, and highly abundant species, such as G. bulloides and G. ruber, in the equatorial and south-equatorial section showed significant correlations with chlorophyll-a (p < 0.05) (Figure 8). In this study, low temperature, high salinity, and maximum chlorophyll-a concentration in an equatorial transect (‘Lat—0’) caused the high abundance of foraminifera in the Eastern Indian Ocean.
5. Conclusions
Our preliminary studies are based on the diversity, distribution, planktonic foraminifera abundance, and carbon biomass estimation, which were conducted for the first time from the euphotic zone of the Eastern Indian Ocean. Our main findings are as follows:
- (a)
- High abundance and carbon biomass of total foraminifera were recorded in the equatorial region.
- (b)
- Temperature and Chlorophyll-a are two main factors that trigger the dominant foraminifera species at a significant p > 0.05 level.
- (c)
- The foraminifera species with a size of approximately 150–188 μm is considered to be a major exporter of carbon from the Eastern Indian Ocean.
This baseline study will provide a platform for further advanced studies to understand the rate and magnitude of the carbon cycle and constrain the geochemical model of the Eastern Indian Ocean.
Supplementary Materials
The following supporting information can be downloaded at: https://www.mdpi.com/article/10.3390/w14132048/s1, Table S1: The raw data of all foraminifera taxa recovered from the Eastern Indian Ocean cruise ‘Shiyan I’ in 2014.
Author Contributions
J.S. designed the cruise study for community analysis in EIO. C.D. collected the samples on board during the cruise ‘Shiyan I’ in 2014. S.M. performed all the laboratory work including microscopy examination for identification, counting, and writing the manuscript. S.L.M. helped in improving the manuscript in writing. X.Z. performed Chlorophyll-a extraction. All authors have read and agreed to the published version of the manuscript.
Funding
This research was financially supported by Natural Science Foundation of China (Nos. 41876134, 41676112, and 41276124), the Tianjin 131 Innovation Team Program (Nos. 20180314) and the Changjiang Scholar Program of Chinese Ministry of Education (Nos. T2014253) grant to Jun Sun. The study was also partly funded by the National Science Foundation project (Nos. 41406155) through grant to Changling Ding.
Institutional Review Board Statement
Not applicable.
Informed Consent Statement
Not applicable.
Data Availability Statement
The data can be provided on request from the corresponding author.
Acknowledgments
We would also like to thank the Open Cruise Project in the Eastern Indian Ocean of the National Natural Science Foundation of China (NORC2014-10) for sharing their ship time, which was carried out by the RV ‘Shiyan I’ and all foundations for the financial support to conduct this research. We thanks to Jun Sun for his guidelines and supervision for cruise research in the Eastern Indian Ocean, Xiaodong Zhang with providing CTD and Chlorophyll a data, Changling Ding for her assistance with field sampling and Sonia Munir for her contribution to identification, analysis data, statistical calculation, and writing manuscript at Tianjin University of Science and technology, Tianjin, China. We are particularly grateful for the corrections and editing by Steve L. Morton (NOAA, National Ocean Service, Silver Spring, MD, USA) and O. Roger Anderson (Lamont-Doherty Earth Observatory, Columbia University).
Conflicts of Interest
The authors declare no conflict of interest.
References
- Wei, Y.; Zhang, G.; Chen, J.; Wang, J.; Ding, C.; Zhang, X.; Sun, J. Dynamic responses of picophytoplankton to physicochemical variation in the eastern Indian Ocean. Ecol. Evol. 2019, 9, 5003–5017. [Google Scholar] [CrossRef]
- Adl, S.M.; Simpson, G.B.; Farmer, M.A.; Andersen, R.A.; Anderson, O.R.; Barta, J.R.; Bowser, S.S.; Brugerolle, G.; Fensome, R.A.; Fredericq, S.; et al. The new higher-level classification of Eukaryotes with Emphasis on the taxonomy of Protists. J. Eukaryot. Microbiol. 2005, 5, 399–451. [Google Scholar] [CrossRef]
- Hayward, B.W.; Le Coze, F.; Gross, D. World Foraminifera Database. Globigerina World Register of Marine Species. 2018. Available online: https://www.marinespecies.org/aphia.php?p=taxdetails&id=112197 (accessed on 22 April 2022).
- Munir, S.; Sun, J. Modern planktonic foraminifera from the eastern Indian Ocean. Acta Oceanol. Sin. 2018, 37, 46–63. [Google Scholar] [CrossRef]
- Fenton, I.S.; Pearson, P.N.; Dunkley Jones, T.; Purvis, A. Environmental predictors of diversity in recent planktonic foraminifera as recorded in marine sediments. PLoS ONE 2016, 11, e0165522. [Google Scholar] [CrossRef] [Green Version]
- Schiebel, R.; Hemleben, C. Planktic Foraminifers in the Modern Ocean; Springer: Berlin/Heidelberg, Germany, 2017; pp. 1–358. [Google Scholar]
- Giamali, C.; Koskeridou, E.; Antonarakou, A.; Ioakim, C.; Kontakiotis, G.; Karageorgis, A.P.; Roussakis, G.; Karakitsios, V. Multiproxy ecosystem response of abrupt Holocene climatic changes in the northeastern Mediterranean sedimentary archive and hydrologic regime. Quat. Res. 2019, 92, 665–685. [Google Scholar] [CrossRef]
- Martinez, J.I.; Taylor, L.; De Deckker, P.; Barrows, T. Planktonic foraminifera from the Eastern Indian Ocean: Distribution and ecology in relation to the Western Pacific Warm Pool (WPWP). Mar. Micropaleontol. 1998, 34, 121–151. [Google Scholar] [CrossRef]
- Malmgren, B.A.; Kucera, M.; Nyberg, J.; Waelbroeck, C. Comparison of statistical and artificial neural network techniques for estimating past sea surface temperatures from planktonic foraminifer census data. Paleoceanography 2001, 16, 520–530. [Google Scholar] [CrossRef]
- Feldberg, M.J.; Mix, A.C. Planktonic foraminifera, sea surface temperatures, and mechanisms of oceanic change in the Peru and south equatorial currents, 0–150 ka BP. Paleoceanography 2003, 18, 1016. [Google Scholar] [CrossRef]
- Fraile, I.; Schulz, M.; Mulitza, S.; Kucera, M. Predicting the global distribution of planktonic foraminifera using a dynamic ecosystem model. Biogeosciences 2008, 5, 891–911. [Google Scholar] [CrossRef] [Green Version]
- Kroeker, K.J. Impacts of ocean acidification on marine organisms: Quantifying sensitivities and interaction with warming. Global Chang. Biol. 2013, 19, 1884–1896. [Google Scholar] [CrossRef] [Green Version]
- Barker, S.; Elderfield, H. Foraminiferal calcification response to glacial-interglacial changes in atmospheric CO2. Science 2002, 297, 833–836. [Google Scholar] [CrossRef]
- Zarkogiannis, S.D.; Antonarakou, A.; Tripati, A.; Kontakiotis, G.; Mortyn, P.G.; Drinia, H.; Greaves, M. Influence of surface ocean density on planktonic foraminifera calcification. Sci. Rep. 2019, 9, 533. [Google Scholar] [CrossRef] [PubMed]
- Kontakiotis, G.; Efstathiou, E.; Zarkogiannis, S.D.; Besiou, E.; Antonarakou, A. Latitudinal Differentiation among Modern Planktonic Foraminiferal Populations of Central Mediterranean: Species–Specific Distribution Patterns and Size Variability. J. Mar. Sci. Eng. 2021, 9, 551. [Google Scholar] [CrossRef]
- Morey, A.E.; Mix, A.C.; Pisias, N.G. Planktonic foraminiferal assemblages preserved in surface sediments correspond to multiple environment variables. Quat. Sci. Rev. 2005, 24, 925–950. [Google Scholar] [CrossRef]
- Seears, H. Biogeography, and Phylogenetics of the Planktonic Foraminifera. Ph.D. Thesis, University of Nottingham, Nottingham, UK, 2011. [Google Scholar]
- BouDagher-Fadel, M.K. Biostratigraphic and Geological Significance of Planktonic Foraminifera, 2nd ed.; UCL Press: London, UK, 2015. [Google Scholar] [CrossRef] [Green Version]
- Kontakiotis, G.; Butiseacă, G.A.; Antonarakou, A.; Agiadi, K.; Zarkogiannis, S.D.; Krsnik, E.; Besiou, E.; Zachariasse, W.J.; Lourens, L.; Thivaiou, D.; et al. Hypersalinity accompanies tectonic restriction in the eastern Mediterranean prior to the Messinian Salinity Crisis. Palaeogeogr. Palaeoclimatol. Palaeoecol. 2022, 592, 110903. [Google Scholar] [CrossRef]
- Frerichs, W.E.; Heiman, M.E.; Borgman, L.E.; Be, A.W. Latitudal variations in planktonic foraminiferal test porosity. J. Foraminifer. Res. Part 1 Opt. Stud. 1972, 2, 6–13. [Google Scholar] [CrossRef]
- Marshall, B.J.; Thunell, R.C.; Spero, H.J.; Henehan, M.J.; Lorenzoni, L.; Astor, Y. Morphometric and stable isotopic differentiation of Orbulina universa morphotypes from the Cariaco Basin, Venezuela. Mar. Micropaleontol. 2015, 120, 46–64. [Google Scholar] [CrossRef] [Green Version]
- Erez, J. The source of ions for biomineralization in foraminifera and their implications for paleoceanographic proxies. Rev. Min. Geochem. 2003, 54, 115–149. [Google Scholar] [CrossRef] [Green Version]
- Schiebel, R.; Movellan, A. First-order estimate of the planktic foraminifer biomass in the modern ocean. Earth Syst. Sci. Data 2012, 4, 75–89. [Google Scholar] [CrossRef] [Green Version]
- Schiebel, R. Planktic foraminiferal sedimentation and the marine calcite budget. Glob. Biogeochem. Cycles 2002, 16, 1065. [Google Scholar] [CrossRef]
- Schiebel, R.; Barker, S.; Lendt, R.; Thomas, H.; Bollmann, J. Planktic foraminiferal dissolution in the twilight zone. J. Deep-Sea Res. II 2007, 54, 676–686. [Google Scholar] [CrossRef] [Green Version]
- Fabry, V.J.; Seibel, B.A.; Feely, R.A.; Orr, J.C. Impacts of ocean acidification on marine fauna and ecosystem processes. ICES J. Mar. Sci. 2008, 65, 414–432. [Google Scholar] [CrossRef]
- Ramaswamy, V.; Gaye, B. Regional variations in the fluxes of foraminifera carbonate, coccolithophorid carbonate and biogenic opal in the northern Indian Ocean. Deep. -Sea Res. Part I Oceanogr. Res. Pap. 2006, 53, 271–293. [Google Scholar] [CrossRef]
- Langer, M.R. Assessing the contribution of foraminiferan protists to global ocean carbonate production. J. Eukaryot. Microbiol. 2008, 55, 163–169. [Google Scholar] [CrossRef] [PubMed]
- Kleijne, A.; Kroon, D.; Zevenboom, W. Phytoplankton and foraminiferal frequencies in the northern Indian Ocean and Red Sea surface waters. Neth. J. Sea Res. 1989, 24, 531–539. [Google Scholar] [CrossRef]
- Stainbank, S.; Kroon, D.; Ru¨ggeberg, A.; Raddatz, J.; de Leau, E.S.; Zhang, M.; Spezzaferri, S. Controls on planktonic foraminifera apparent calcification depths for the northern equatorial Indian Ocean. PLoS ONE 2019, 14, e0222299. [Google Scholar] [CrossRef] [Green Version]
- Ujiie, H.; Nagase, K. Cluster analysis of living planktonic foraminifera from the south-eastern Indian Ocean. In Proceedings of the 2nd International Planktonic Conference, Rome, Italy; 1971; pp. 1251–1258. [Google Scholar]
- Strickland, J.D.H.; Parsons, T.R. A Practical Handbook of Seawater Analysis; The Alger Press Ltd.: Ottawa, ON, Canada, 1972. [Google Scholar]
- Martin, J.L.; Wildish, D.J. Integrated Water Column versus Niskin Bottle Sampling in the Southwest Bay of Fundy; Canadian Technical Report of Fisheries and Aquatic Sciences 1992(1893); Fisheries and Oceans Canada: Ottawa, ON, Canada, 1992; pp. 18–19.
- Sun, J.; Liu, D.; Qian, S. A quantitative research and analysis method for marine phytoplankton: An introduction to Utermöhl method and its modification. J. Oceanogr. Huanghai Bohai Seas 2002, 20, 105–112. (In Chinese) [Google Scholar]
- Shannon, C.E. A mathematical theory of communications. Bell Syst. Techical. J. 1948, 27, 379–423. [Google Scholar] [CrossRef] [Green Version]
- Xu, Z.L.; Chen, Y.Q. Aggregated intensity of dominant species of zooplankton in autumn in the East China Sea and the Yellow Sea. J. Ecol. 1989, 8, 13–15. (In Chinese) [Google Scholar]
- Michaels, A.F.; Caron, D.A.; Swanberg, N.R.; Howse, F.A.; Michaels, C.M. Planktonic sarcodines (Acantharia, Radiolaria, Foraminifera) in surface waters near Bermuda: Abundance, biomass, and vertical flux. J. Plankton Res. 1995, 17, 131–163. [Google Scholar] [CrossRef]
- Ly, A.; Verhagen, J.; Wagenmakers, E.-J. Harold Jeffreys’s default Bayes factor hypothesis tests: Explanation, extension, and application in psychology. J. Math. Psychol. 2016, 72, 19–32. [Google Scholar] [CrossRef]
- Xue, B.; Sun, J.; Ding, C.; Wang, D. Diatom communities in the equatorial region and its adjacent areas of Eastern Indian Ocean during spring intermonsoon 2014. Haiyang Xuebao 2016, 38, 112–120. [Google Scholar]
- Zhang, C.; Sun, J.; Wang, D.; Song, D.; Zhang, X.; Munir, S. Tintinnid community structure in the eastern equatorial Indian Ocean during the spring inter-monsoon period. Aquat. Biol. 2017, 26, 87–100. [Google Scholar] [CrossRef] [Green Version]
- Munir, S.; Rogers, J.; Zhang, X.; Ding, C.; Sun, J. The Horizontal Distribution of Siliceous Planktonic Radiolarian Community in the Eastern Indian Ocean. Water 2020, 12, 3502. [Google Scholar] [CrossRef]
- Evans, M.S.; Sell, D.W. Mesh size and collection characteristics of 50-cm diameter conical plankton nets. Hydrobiologia 1985, 122, 97–104. [Google Scholar] [CrossRef]
- Schiebel, R.; Hemleben, C. Modern planktic foraminifera. Palaeont Zool. 2005, 79, 135–148. [Google Scholar] [CrossRef] [Green Version]
- Carstens, J.; Hebbeln, D.; Wefer, G. Distribution of planktic foraminifera at the ice margin in the Arctic (Fram Strait). Mar. Micropaleontol 1997, 29, 257–269. [Google Scholar] [CrossRef]
- Taylor, B.J.; Rae, J.W.; Gray, W.R.; Darling, K.F.; Burke, A.; Gersonde, R.; Ziveri, P. Distribution and ecology of planktic foraminifera in the North Pacific: Implications for paleo-reconstructions. Quat. Sci. Rev. 2018, 191, 256–274. [Google Scholar] [CrossRef] [Green Version]
- Liu, H.; Sun, J.; Wang, D.; Zhang, X.; Zhang, C.; Song, S.; Thangaraj, S. Distribution of living Coccolithophores in the eastern Indian Ocean during spring Inter-monsoon. Sci. Rep. 2018, 8, 12488. [Google Scholar] [CrossRef] [PubMed]
- Hemleben, C.; Spindler, M.; Anderson, O.R. Modern Planktonic Foraminifera; Springer Science & Business Media: Berlin, Germany, 1989. [Google Scholar]
- Chernihovsky, N.; Almogi Labin, A.; Kienast, S.S.; Torfstein, A. The daily resolved temperature dependence and structure of planktonic foraminifera blooms. Sci. Rep. 2020, 10, 17456. [Google Scholar] [CrossRef]
- Anbuselvan, N.; Senthil Nathan, D. Distribution and environmental implications of planktonic foraminifera in the surface sediments of the southwestern part of Bay of Bengal, India. J. Sediment. Environ. 2021, 6, 213–235. [Google Scholar] [CrossRef]
- Bradbury, M.G.; Abbott, D.P.; Bovbjerg, R.V.; Mariscal, R.N.; Fielding, W.C.; Barber, R.T.; Pearse, V.B.; Proctor, S.J.; Ogden, J.C.; Wourms, L.R.; et al. Studies in the fauna associated with the deep scattering layers in the equatorial Indian Ocean, conducted on R/V Te Vega during October and December 1964. In Proceedings of the an International Symposium on Biological Sound Scattering in the Ocean, Warrenton, WV, USA, 31 March–2 April 1970; pp. 409–452. [Google Scholar]
- Bé, A.W.H.; Hutson, W.H. Ecology of planktonic foraminifera and biogeographic patterns of life and fossil assemblages in the Indian Ocean. Micropaleontology 1977, 23, 369–414. [Google Scholar] [CrossRef]
- Peeters, F.; Ivanova, E.; Conan, S.; Brummer, G.J.; Ganssen, G.; Troelstra, S.; van Hinte, J. A size analysis of planktic foraminifera from the Arabian Sea. Mar. Micropaleontol. 1999, 36, 31–63. [Google Scholar] [CrossRef]
- Wei, Y.; Sun, J.; Zhang, X.; Wang, J.; Huang, K. Picophytoplankton size and biomass around equatorial eastern Indian Ocean. Microbiol. Open 2019, 8, e00629. [Google Scholar] [CrossRef] [PubMed]
- Tittensor, D.; Mora, C.; Jetz, W.; Lotze, H.; Ricard, D.; Berghe, E.; Worm, B. Global patterns and predictors of marine biodiversity across taxa. Nature 2010, 466, 1098–1101. [Google Scholar] [CrossRef]
- Longhurst, A.R. Ecological Geography of the Sea, 2nd ed.; Academic Press: Cambridge, MA, USA, 2007; p. 542. [Google Scholar]
- Rutherford, S.; D’Hondt, S.; Prell, W. Environmental controls on the geographic distribution of zooplankton diversity. Nature 1999, 400, 749–753. [Google Scholar] [CrossRef]
Figure 1.
Sampling stations along the Eastern Indian Ocean during spring 2014: 17 stations described by divisions, such as north-equatorial region (NEQ) at longitude 90° E, equatorial region (EQ) at latitude 0, and south-equatorial region (SEQ) at longitude 80° E.
Figure 1.
Sampling stations along the Eastern Indian Ocean during spring 2014: 17 stations described by divisions, such as north-equatorial region (NEQ) at longitude 90° E, equatorial region (EQ) at latitude 0, and south-equatorial region (SEQ) at longitude 80° E.

Figure 2.
The vertical section of the temperature (a), salinity (b), and chlorophyll-a (c) in three transects of the Eastern Indian Ocean.
Figure 2.
The vertical section of the temperature (a), salinity (b), and chlorophyll-a (c) in three transects of the Eastern Indian Ocean.

Figure 3.
Sea-surface distribution of temperature (a), salinity (b), and chlorophyll-a concentration (c) in the Eastern Indian Ocean. (a) The highest value of temperature oC in the BoB sampling station at transect 90° E and the lowest value of temperature oC in the SEQ sampling station at transect 80° E. (b) The highest value of salinity in the SEQ sampling station occurs at transect 80° E and the low salinity value occurs at the BoB sampling station at transect 90° E. (c) The high value of Chlorophyll-a μg/L in the equatorial region and the BoB sampling sites at the transect 90° E.

Figure 4.
Scanning electron micrographic plates of some planktonic foraminifera species of EIO [4]. (a) Globigerinoides ruber, (b) Orcadia riedeli, (c) Globigerinella calida, (d) Hastigerina pelagica, (e) Globorotalia menardii, (f) Globorotalia tumida. Scale bar: 10 μm, 50 μm, and 100 μm. Images were adapted with permission from Munir et al. [4]. Copyright 2018 Chinese Society for Oceanography and Springer.

Figure 5.
Species richness (a) and Shannon diversity H’ (b) of foraminifera in the Eastern Indian. Ocean. (a) The distribution of species per sample indicates the high species numbers that occurred in the south-equatorial zone (SEQ) at transect 80° E and low species number/station in the Bay of Bengal (BoB) station at the transect 90° E. (b) Diversity of foraminifera is higher in all transects except for a few stations of BoB.

Figure 6.
The abundance of ind.m−3 (a) and carbon biomass μg C m−3 (b) of foraminifera in the Eastern Indian Ocean. (a) Foraminifera abundance was at a maximum at the equatorial region (EQ) and at a minimum in the BoB station at the transect 90° E. (b) The carbon biomass of foraminifera was also observed to be at a maximum in the equatorial region (EQ) compared to in the BoB sampling sites.

Figure 7.
Horizontal distribution of total carbon biomass/station (μg C m−3) of the foraminiferal species in the Eastern Indian Ocean. (a) Globorotalia menardii; (b) Globigerinoides ruber (white); (c) Globigerinella calida; (d) Orbulina universa; (e) Globigerinella glutinata; (f) Trilobatus sacculifer; (g) Globigerinella siphonifera; (h) Globigerina bulloides; (i) Turborotalita quinqueloba.

Figure 8.
Pearson correlation analysis plots for the dominant foraminifera species with temperature, salinity, and Chlorophyll-a variables. The grey boxes indicate the significant value (p < 0.05), the red dot indicates a negative correlation, and the dark blue dot is the sign of positive correlation values.


Table 1.
Relative abundance (Pi), occurrence/frequency (fi), and dominance indices of (Y) foraminifera species in the survey area. Note that Y is the dominant index from abundance.
Table 1.
Relative abundance (Pi), occurrence/frequency (fi), and dominance indices of (Y) foraminifera species in the survey area. Note that Y is the dominant index from abundance.
| Species | (Pi)% | (fi)% | (Y) |
|---|---|---|---|
| Dentigloborotalia anfracta | 0.091 | 4 | 0.001 |
| Globigerina bulloides | 0.864 | 38 | 0.406 |
| Globigerinoides ruber (white) | 0.727 | 32 | 0.14 |
| Globorotalia scitula | 0.045 | 2 | 0 |
| Globigerinella siphonifera | 0.409 | 18 | 0.039 |
| Globorotalia menardii | 0.114 | 5 | 0.001 |
| Globigerinella calida | 0.273 | 12 | 0.008 |
| Globigerinella glutinata | 0.159 | 7 | 0.004 |
| Globorotalia tumida | 0.045 | 2 | 0 |
| Globorotalia ungulata | 0.023 | 1 | 0 |
| Hastigerina pelagica | 0.159 | 7 | 0.002 |
| Orcadia riedeli | 0.114 | 20 | 0.001 |
| Orbulina universa | 0.227 | 10 | 0.009 |
| Turborotalita quinqueloba | 0.386 | 17 | 0.019 |
| Trilobatus sacculifer | 0.159 | 7 | 0.002 |
| Tenuitella parkerae | 0.023 | 1 | 0 |
| Tenuitella fleisheri | 0.023 | 1 | 0 |
| Turborotalita humilis | 0.023 | 1 | 0 |
Table 2.
The range of shell diameter (µm), the mean value of biovolume (µm3), carbon biomass (pg C µm−3) of foraminifera species and its contribution to total carbon biomass (μg C m−3) in the eastern Indian Ocean.
Table 2.
The range of shell diameter (µm), the mean value of biovolume (µm3), carbon biomass (pg C µm−3) of foraminifera species and its contribution to total carbon biomass (μg C m−3) in the eastern Indian Ocean.
| Species | Shell Size µm | Biovolume | Carbon Biomass/Cell (0.05 pg C µm−3) | Contribution to Total Carbon Biomass |
|---|---|---|---|---|
| (µm3) | μg C m−3 | |||
| Dentigloborotalia anfracta | 57.91–82.32 | 23,255 | 0.117 | 0.0021 |
| Globigerina bulloides | 79.64–281.5 | 77,191 | 0.108 | 0.0069 |
| Globigerinoides ruber (white) | 116–287 | 2,548,920 | 0.087 | 0.2269 |
| Globorotalia scitula | 78–106 | 452,002 | 0.097 | 0.0402 |
| Globigerinella siphonifera | 94–150 | 634,929 | 0.095 | 0.0565 |
| Globorotalia menardii | 188 | 44,897,792 | 0.073 | 3.9959 |
| Globorotalia tumida | 299–508 | 1,775,708 | 0.089 | 0.1580 |
| Globorotalia ungulate | 299 | 67,759 | 0.109 | 0.0054 |
| Tenuitella parkerae | 103 | 113,353 | 0.106 | 0.0101 |
| Turborotalita humilis | 57–63 | 67,800 | 0.109 | 0.0060 |
| Turborotalita quinqueloba | 17–88 | 83,635 | 0.108 | 0.0074 |
| Trilobatus sacculifer | 175–189 | 4,371,861 | 0.085 | 0.3891 |
| Tenuitella fleisheri | 51.57–63.23 | 30,116 | 0.115 | 0.0027 |
| Orcadia riedeli | 65–72.78 | 83,669 | 0.108 | 0.0074 |
| Orbulina universa | 100–290 | 6,386,181 | 0.098 | 0.5684 |
| Hastigerina pelagica | 83–195 | 2,119,619 | 0.104 | 0.1186 |
| Globigerinella calida | 118–303 | 7,712,913 | 0.097 | 0.6864 |
| Globigerinella glutinata | 106–167 | 1,531,128 | 0.106 | 0.1365 |
Table 3.
The Pearson correlation c° efficient values of the dominant foraminifera species and three integrated ocean environmental variables.
Table 3.
The Pearson correlation c° efficient values of the dominant foraminifera species and three integrated ocean environmental variables.
| Species | Temperature °C | Salinity | Chlorophyll a |
|---|---|---|---|
| Globigerina bulloides | 0.334 ** | 0.307 ** | 0.372 ** |
| Globigerinoides ruber (white) | 0.196 | 0.265 | 0.189 |
| Orcadia riedeli | –0.31 | 0.184 | –0.059 |
| Globigerinella calida | 0.206 | 0.251 | 0.153 |
| Globigerinella siphonifera | 0.256 | 0.315 ** | 0.195 |
| Trilobatus sacculifer | –0.31 | 0.204 | –0.02 |
| Globigerinella glutinata | 0.086 | –0.04 | 0.255 |
| Turborotalita quinqueloba | 0.027 | 0 | 0.238 |
| Globorotalia scitula | –0.006 | –0.103 | –0.183 |
| Hastigerina pelagica | –0.121 | 0.241 | –0.083 |
| Orbulina universa | 0.235 | –0.092 | 0.013 |
| Globorotalia tumida | –0.174 | 0.044 | –0.099 |
| Globorotalia menardii | 0.027 | –0.086 | –0.137 |
| Dentigloborotalia anfracta | –0.05 | –0.024 | 0.448 ** |
| Globorotalia inflanta | 0.086 | 0.149 | –0.014 |
| Globorotalia ungulanta | 0.027 | –0.086 | –0.137 |
| Tenuitella fleisheri | 0.027 | –0.086 | –0.137 |
| Tenuitella parakera | –0.069 | 0.015 | 0.171 |
| Streptochilius globigerum | 0.136 | 0.109 | 0.053 |
Figure in bold italics and asterisks ** used for significant at the p < 0.05.
Publisher’s Note: MDPI stays neutral with regard to jurisdictional claims in published maps and institutional affiliations. |
© 2022 by the authors. Licensee MDPI, Basel, Switzerland. This article is an open access article distributed under the terms and conditions of the Creative Commons Attribution (CC BY) license (https://creativecommons.org/licenses/by/4.0/).
Share and Cite
MDPI and ACS Style
Munir, S.; Sun, J.; Morton, S.L.; Zhang, X.; Ding, C. Horizontal Distribution and Carbon Biomass of Planktonic Foraminifera in the Eastern Indian Ocean. Water 2022, 14, 2048. https://doi.org/10.3390/w14132048
AMA Style
Munir S, Sun J, Morton SL, Zhang X, Ding C. Horizontal Distribution and Carbon Biomass of Planktonic Foraminifera in the Eastern Indian Ocean. Water. 2022; 14(13):2048. https://doi.org/10.3390/w14132048
Chicago/Turabian StyleMunir, Sonia, Jun Sun, Steve L. Morton, Xiaodong Zhang, and Changling Ding. 2022. "Horizontal Distribution and Carbon Biomass of Planktonic Foraminifera in the Eastern Indian Ocean" Water 14, no. 13: 2048. https://doi.org/10.3390/w14132048
Note that from the first issue of 2016, this journal uses article numbers instead of page numbers. See further details here.