
Annual Evaluation of 17 Oestrogenic Endocrine Disruptors and Hazard Indexes in the Douro River Estuary—The Atlantic Discharge of the Highest-Flow River of Southwestern Europe


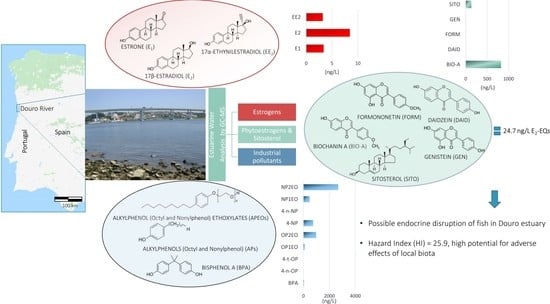
Abstract
:
1. Introduction
2. Materials and Methods
2.1. Chemicals, Materials and Standards
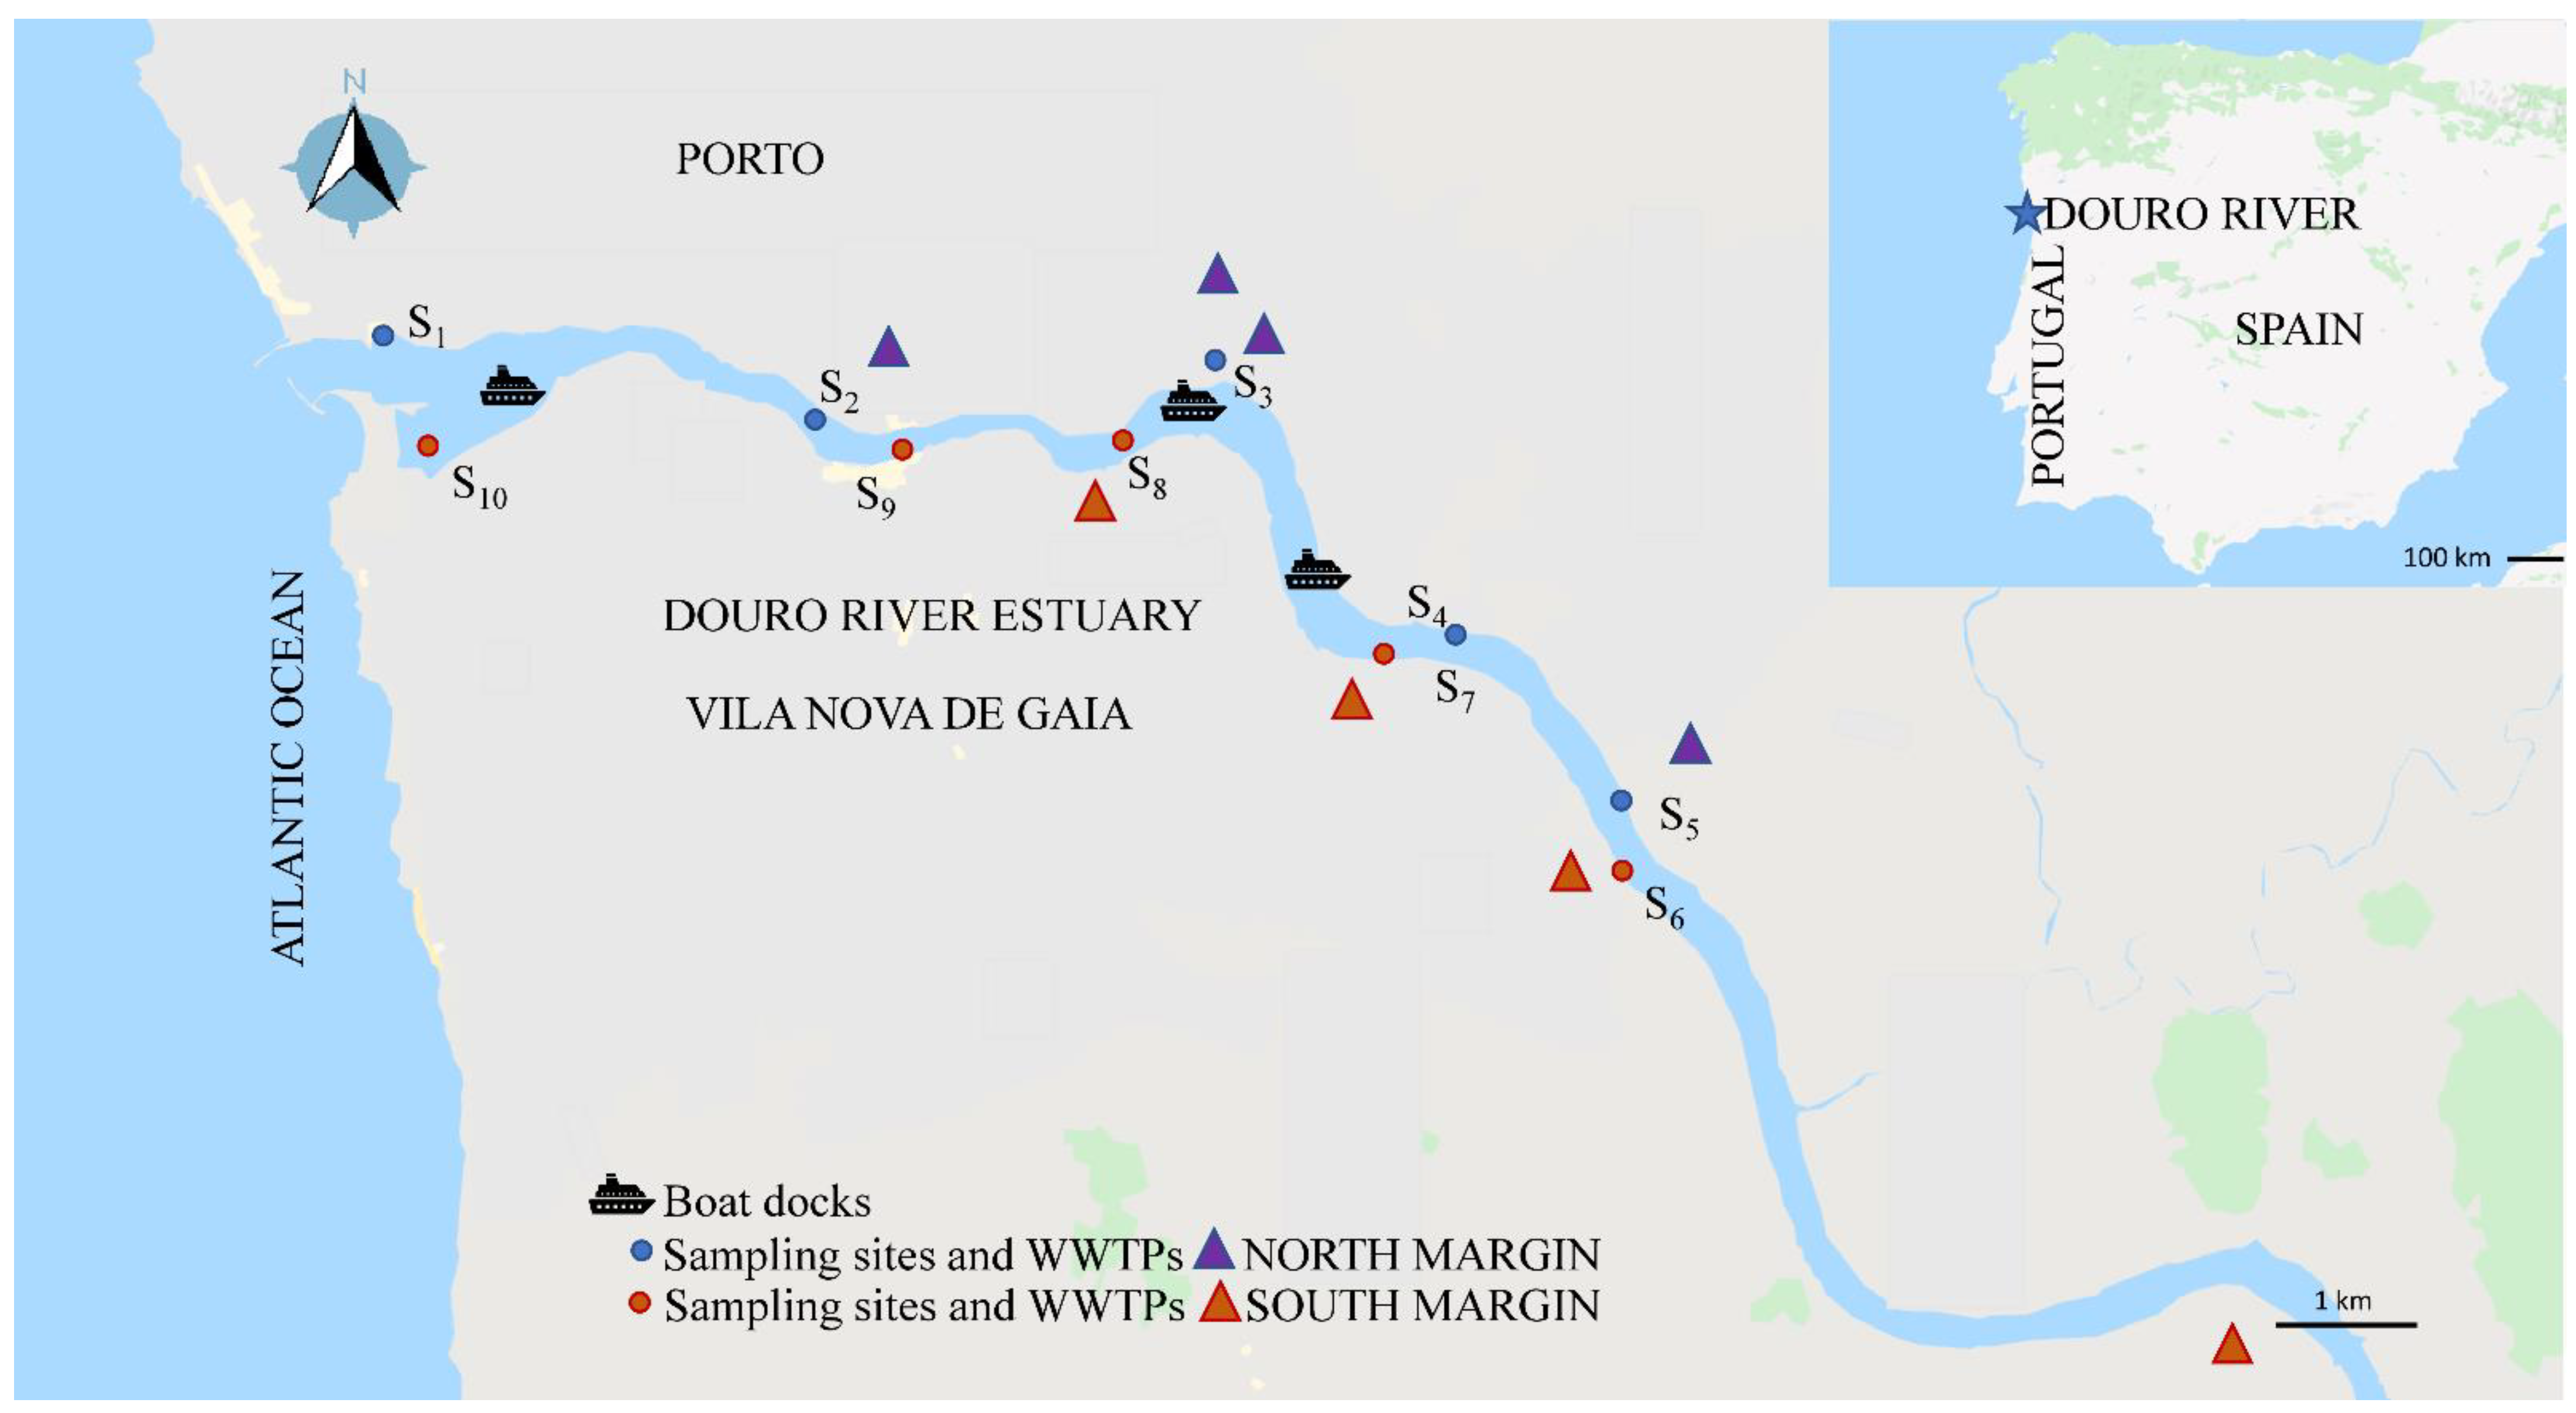
2.2. Sample Collection and Physico-Chemical Parameters
2.2.1. Sample Collection at the North Margin of the Estuary (n = 5)
2.2.2. Sample Collection at the South Margin of the Estuary (n = 5)
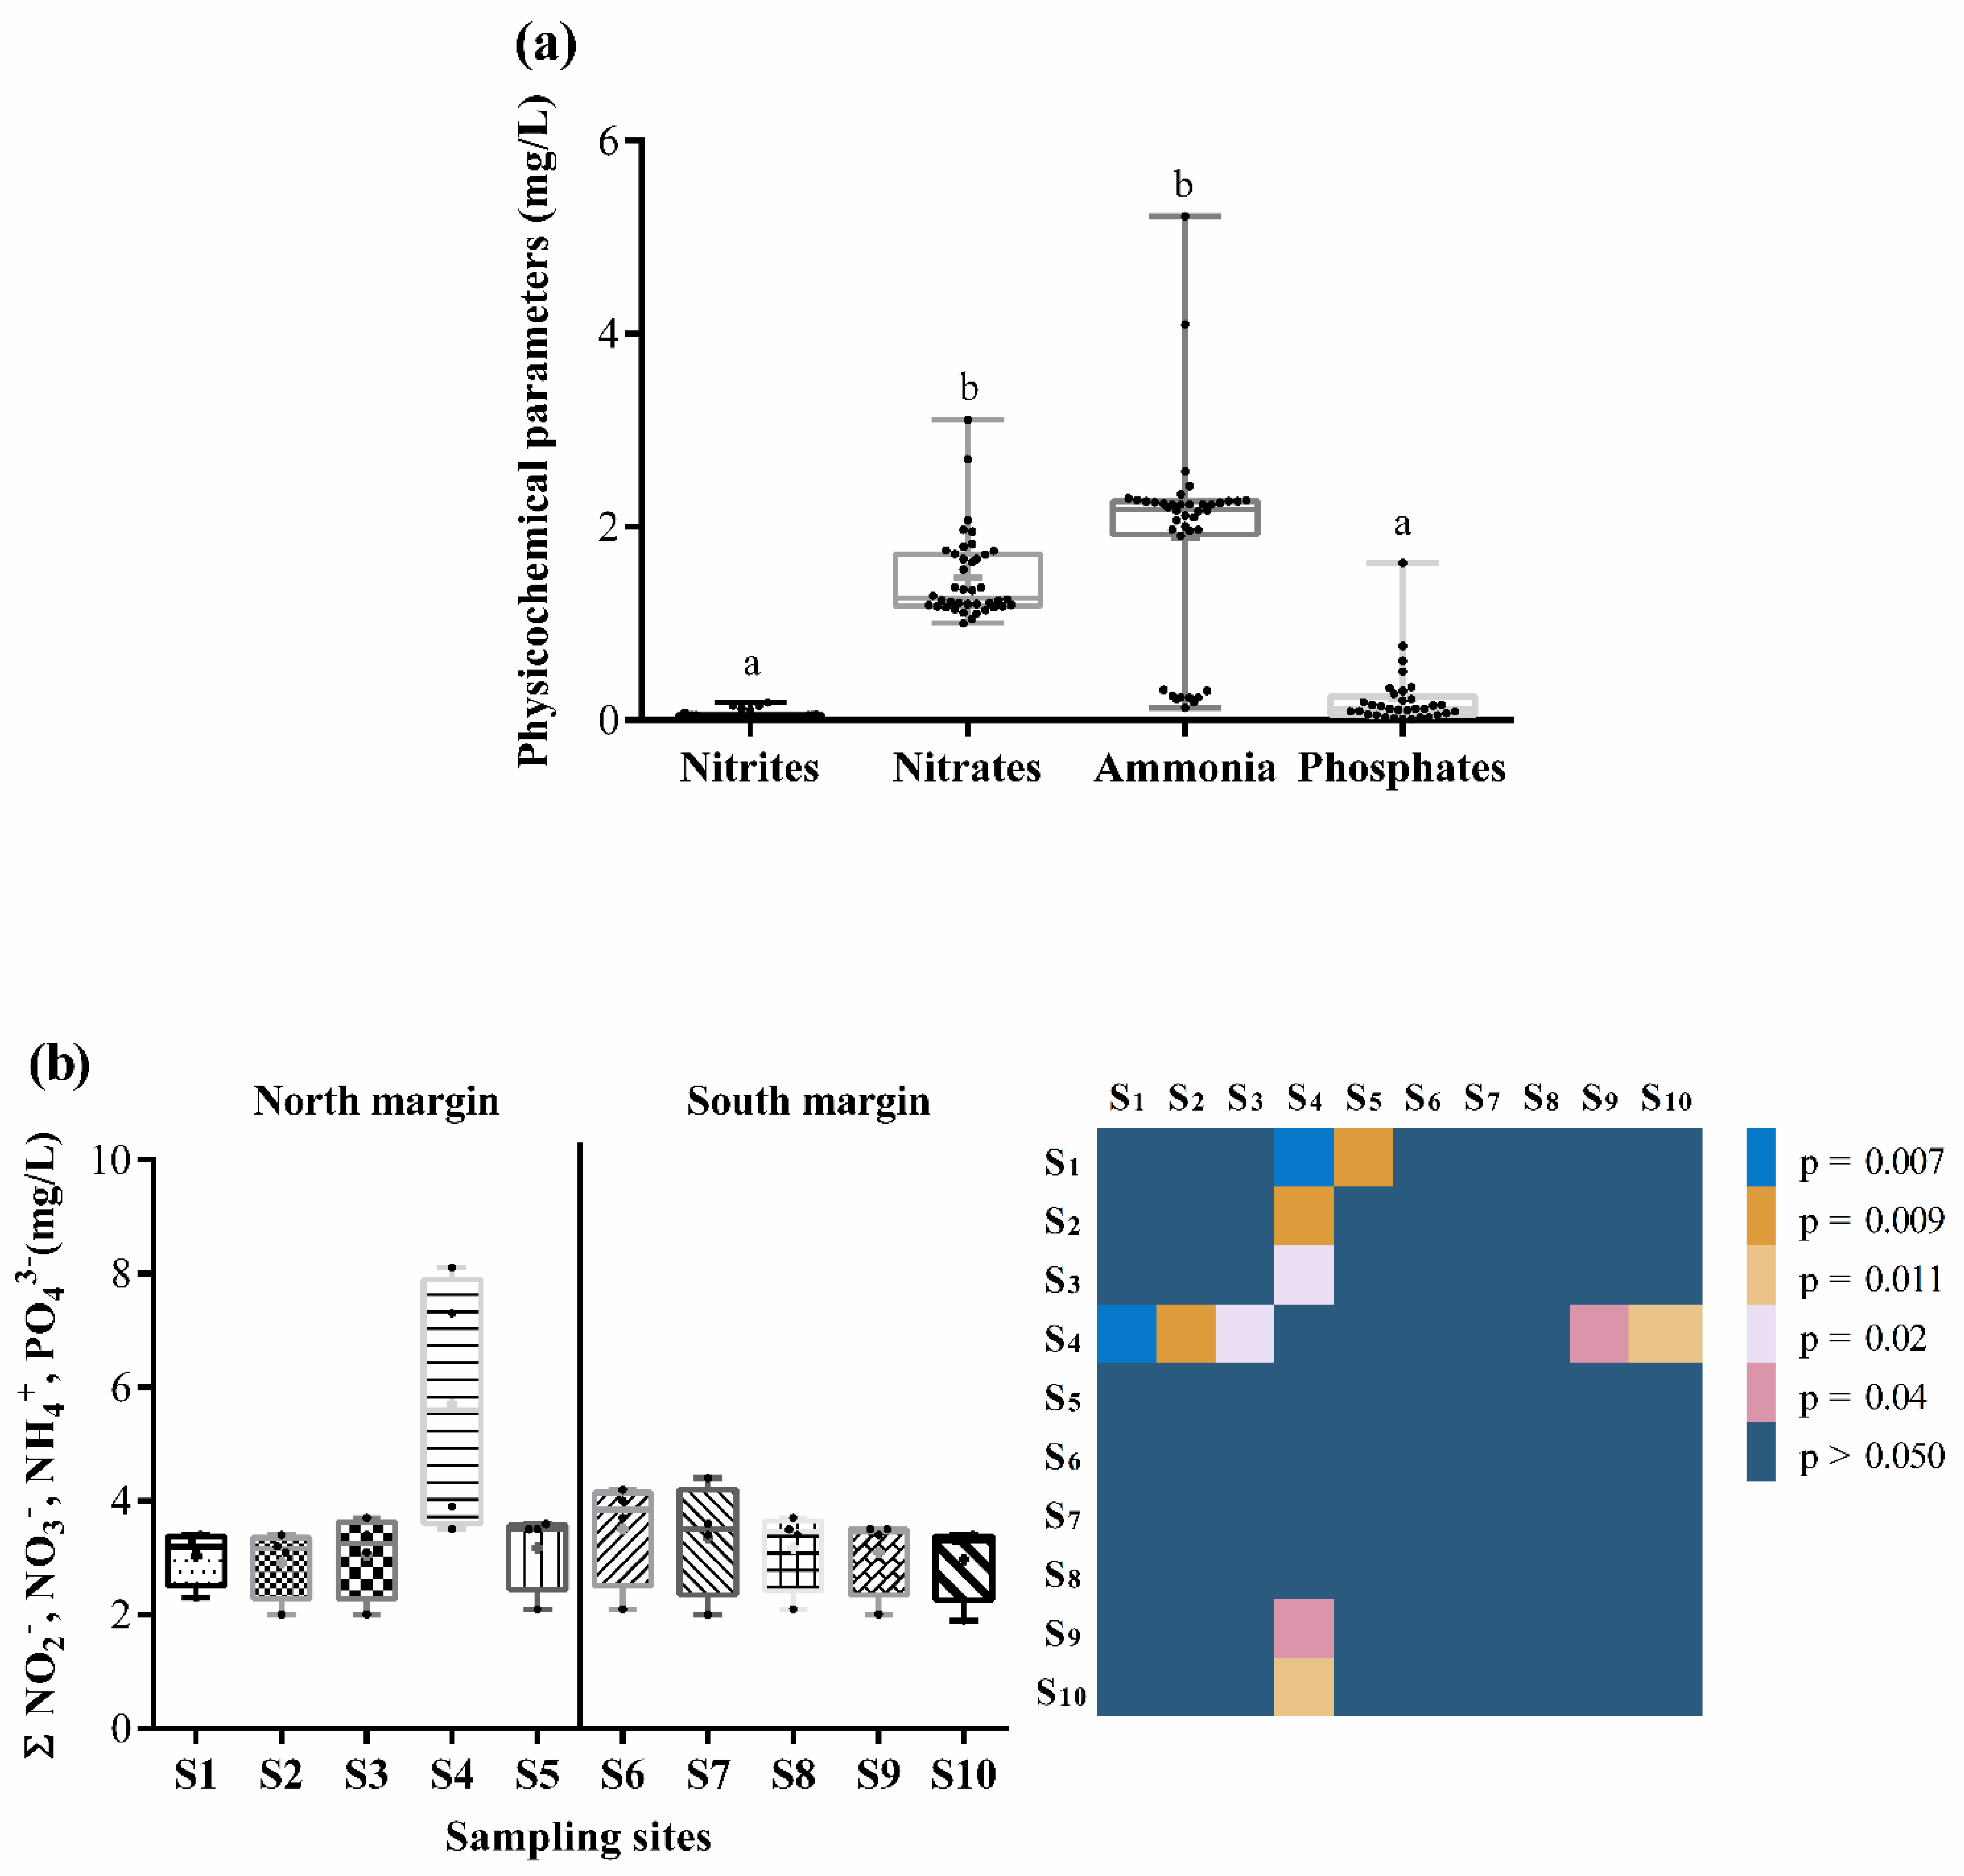
2.2.3. Physico-Chemical Parameters
2.3. Sample Preparation
2.4. Quantification by GC-MS
2.5. Calculation of Oestrogenic Equivalents and Hazard Quotients
2.6. Data Presentation and Statistical Analyses
3. Results
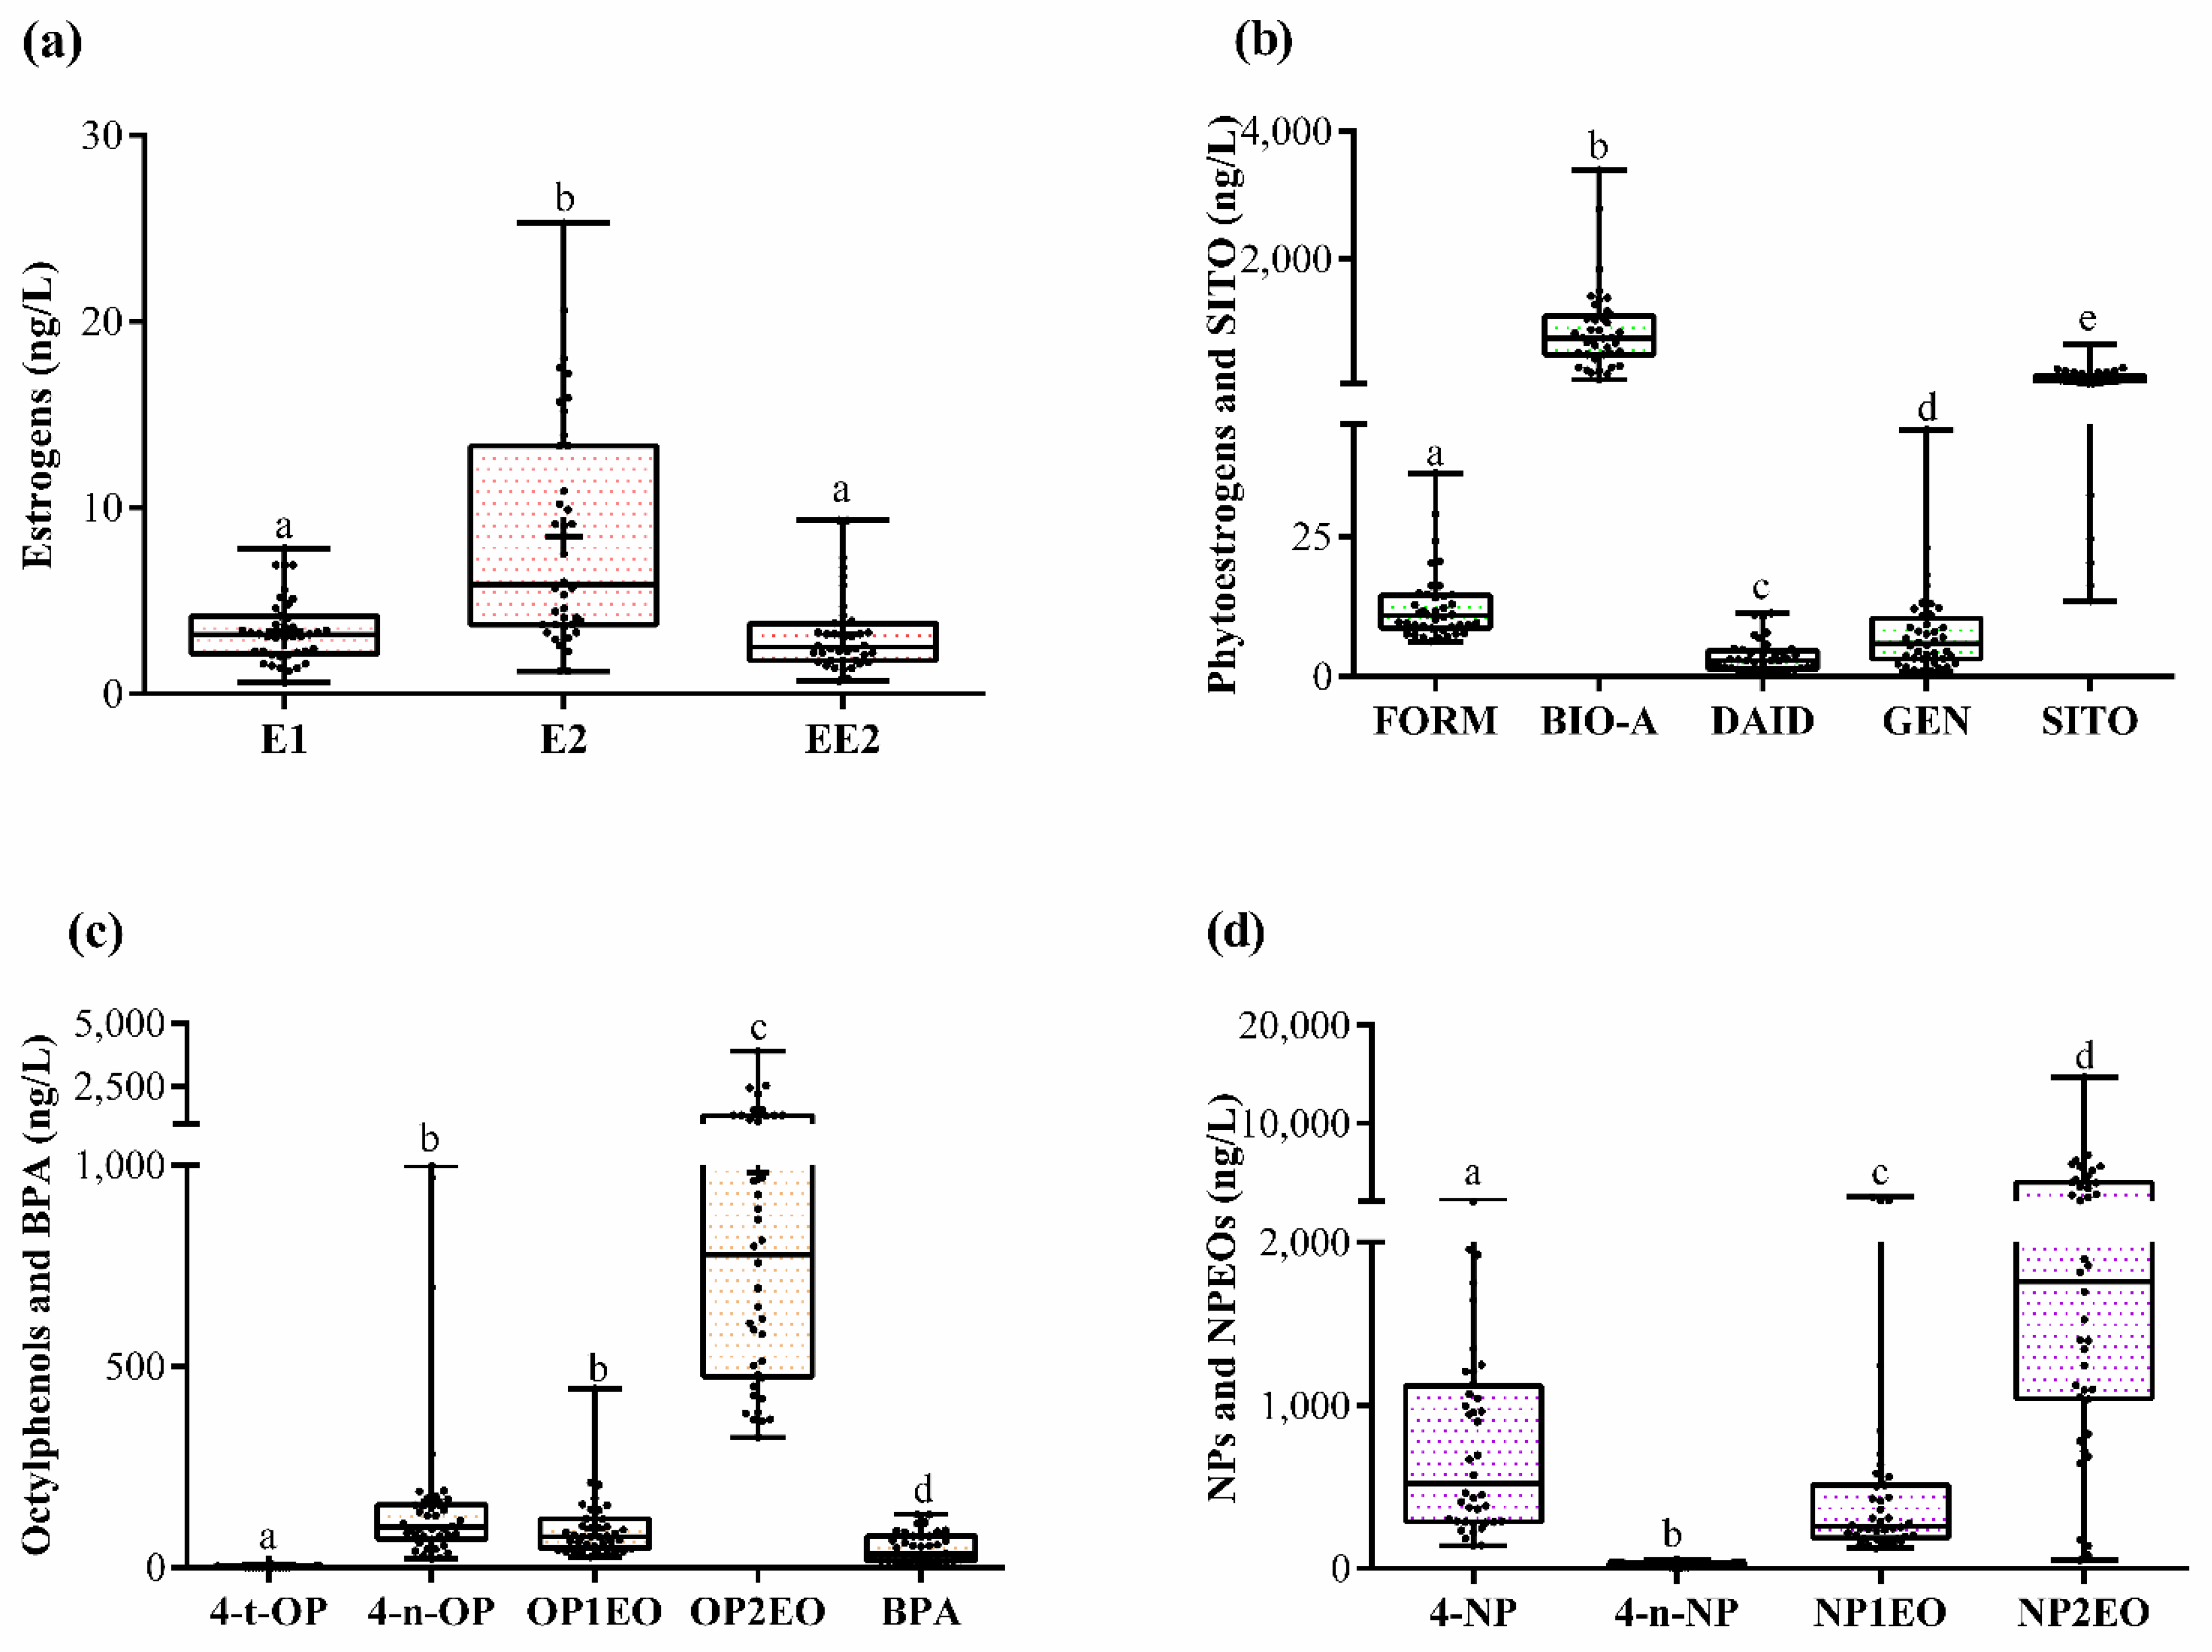
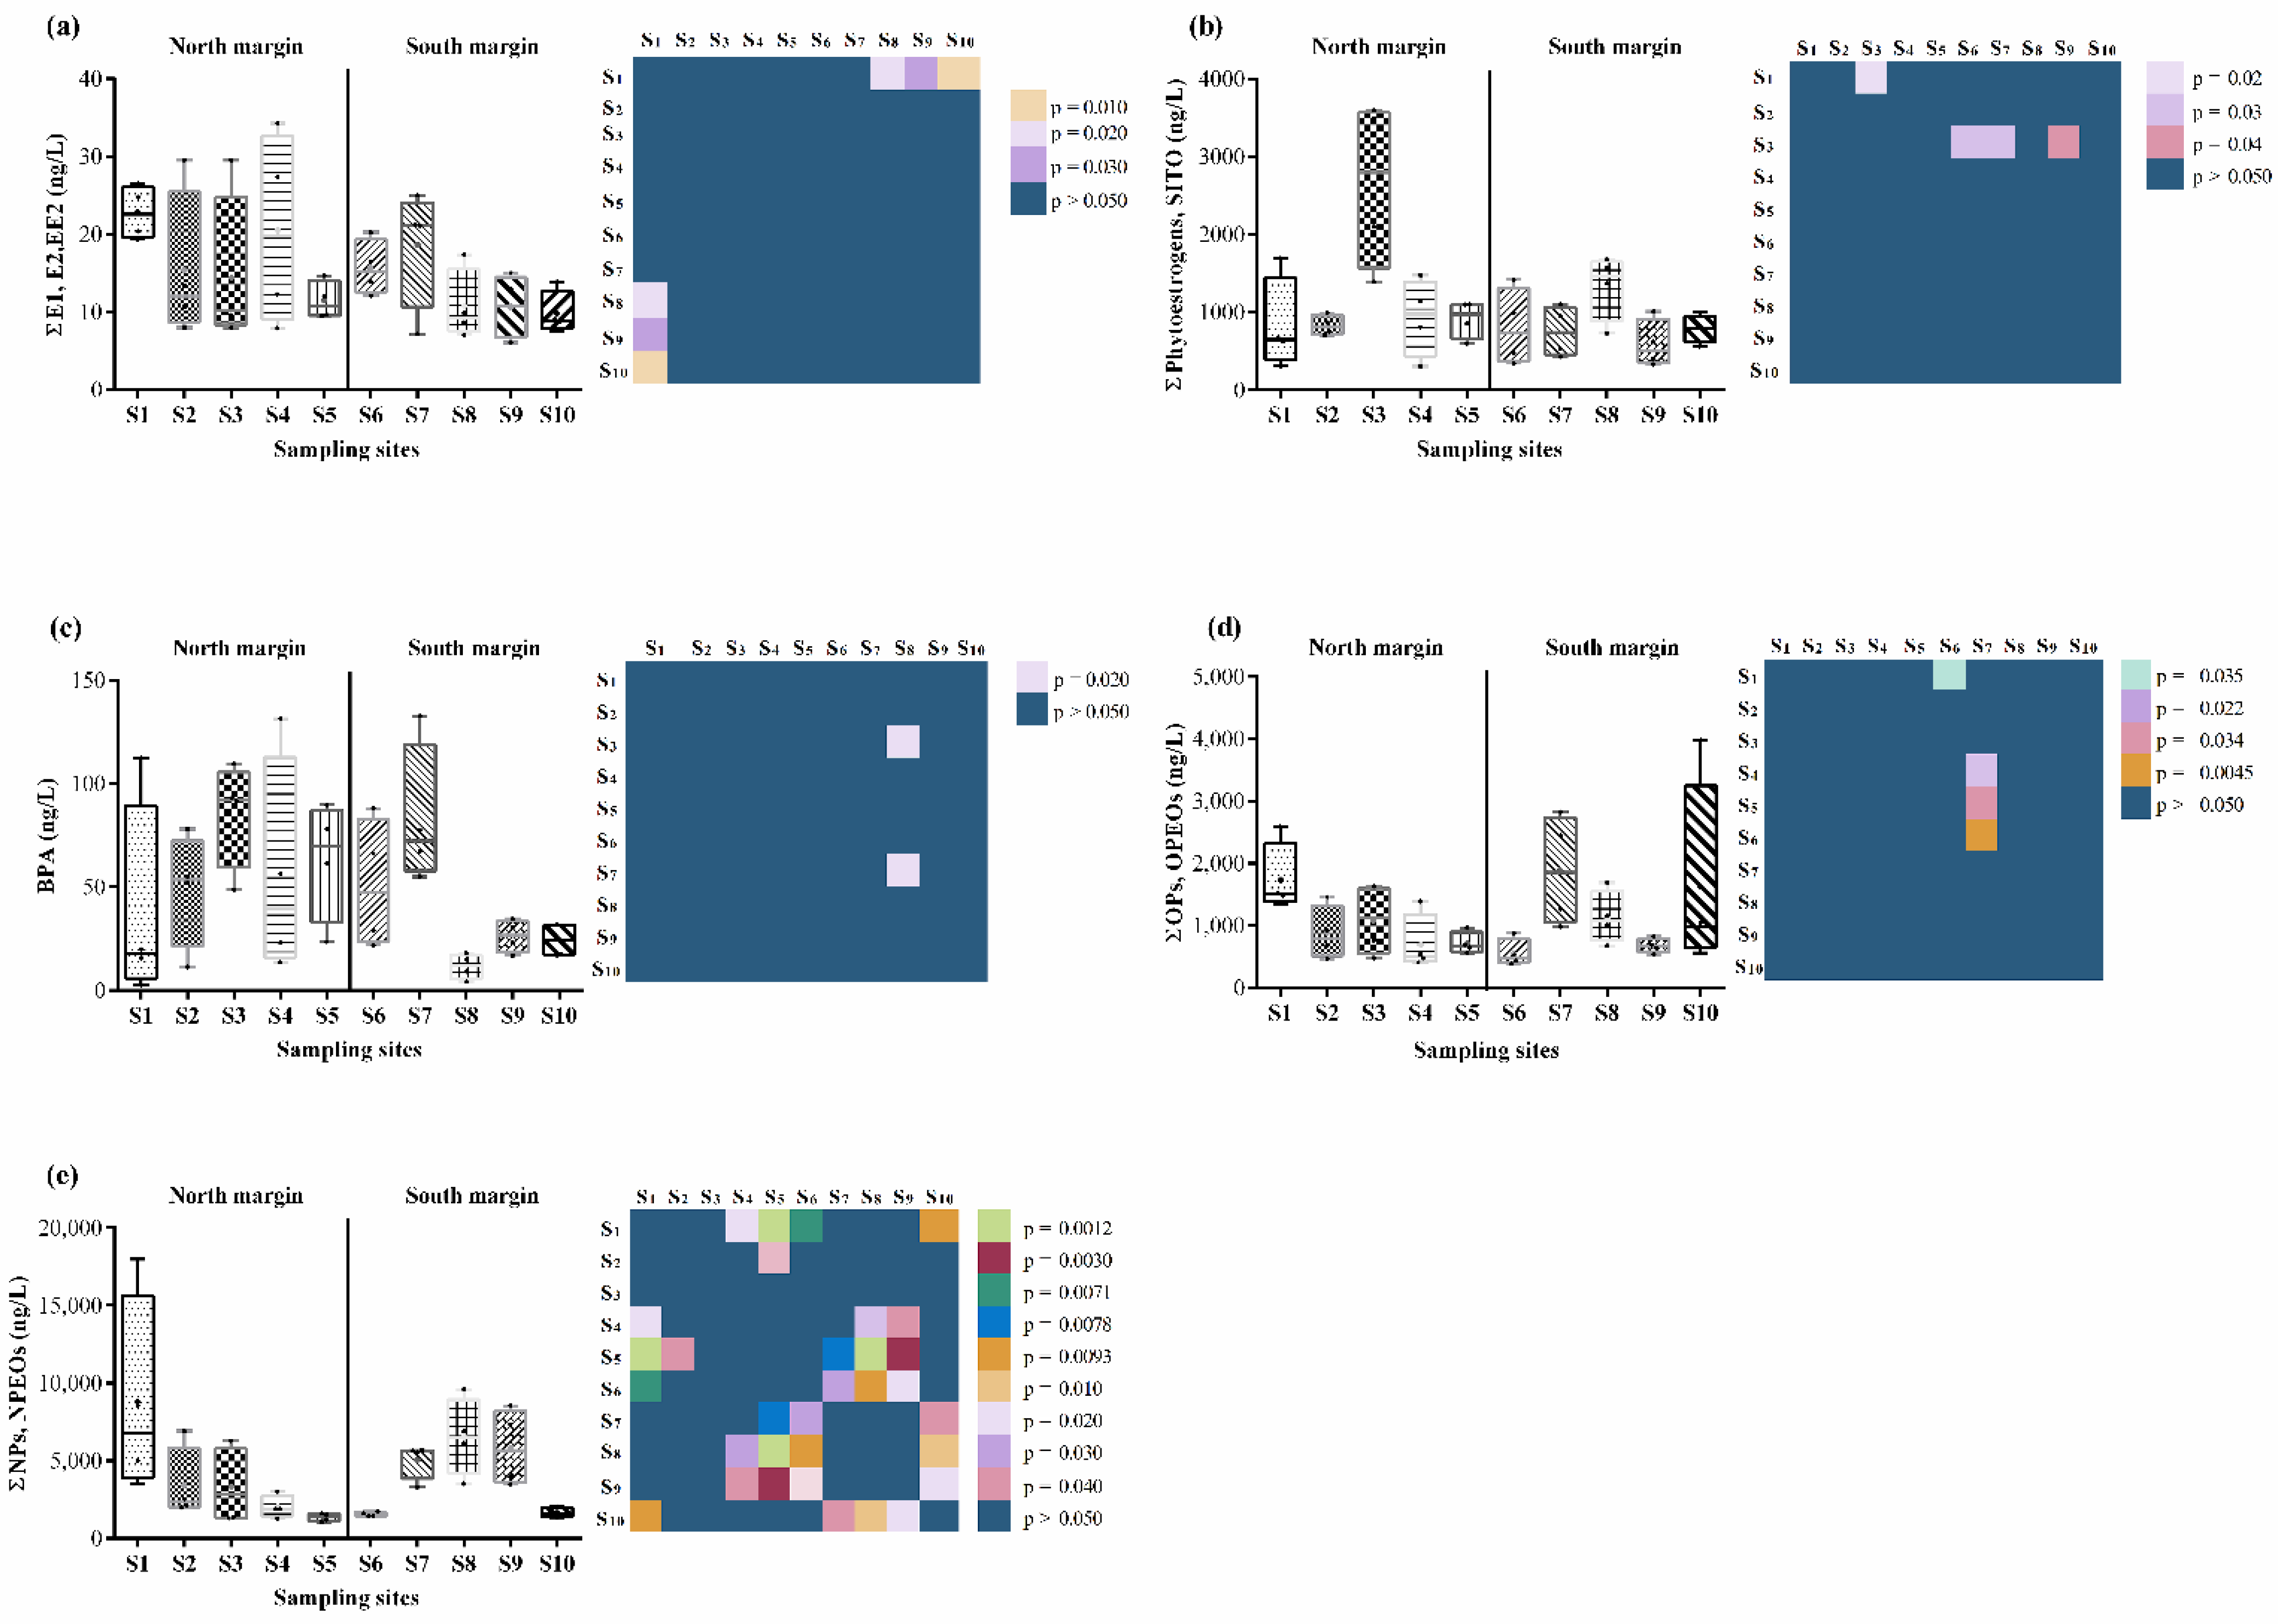
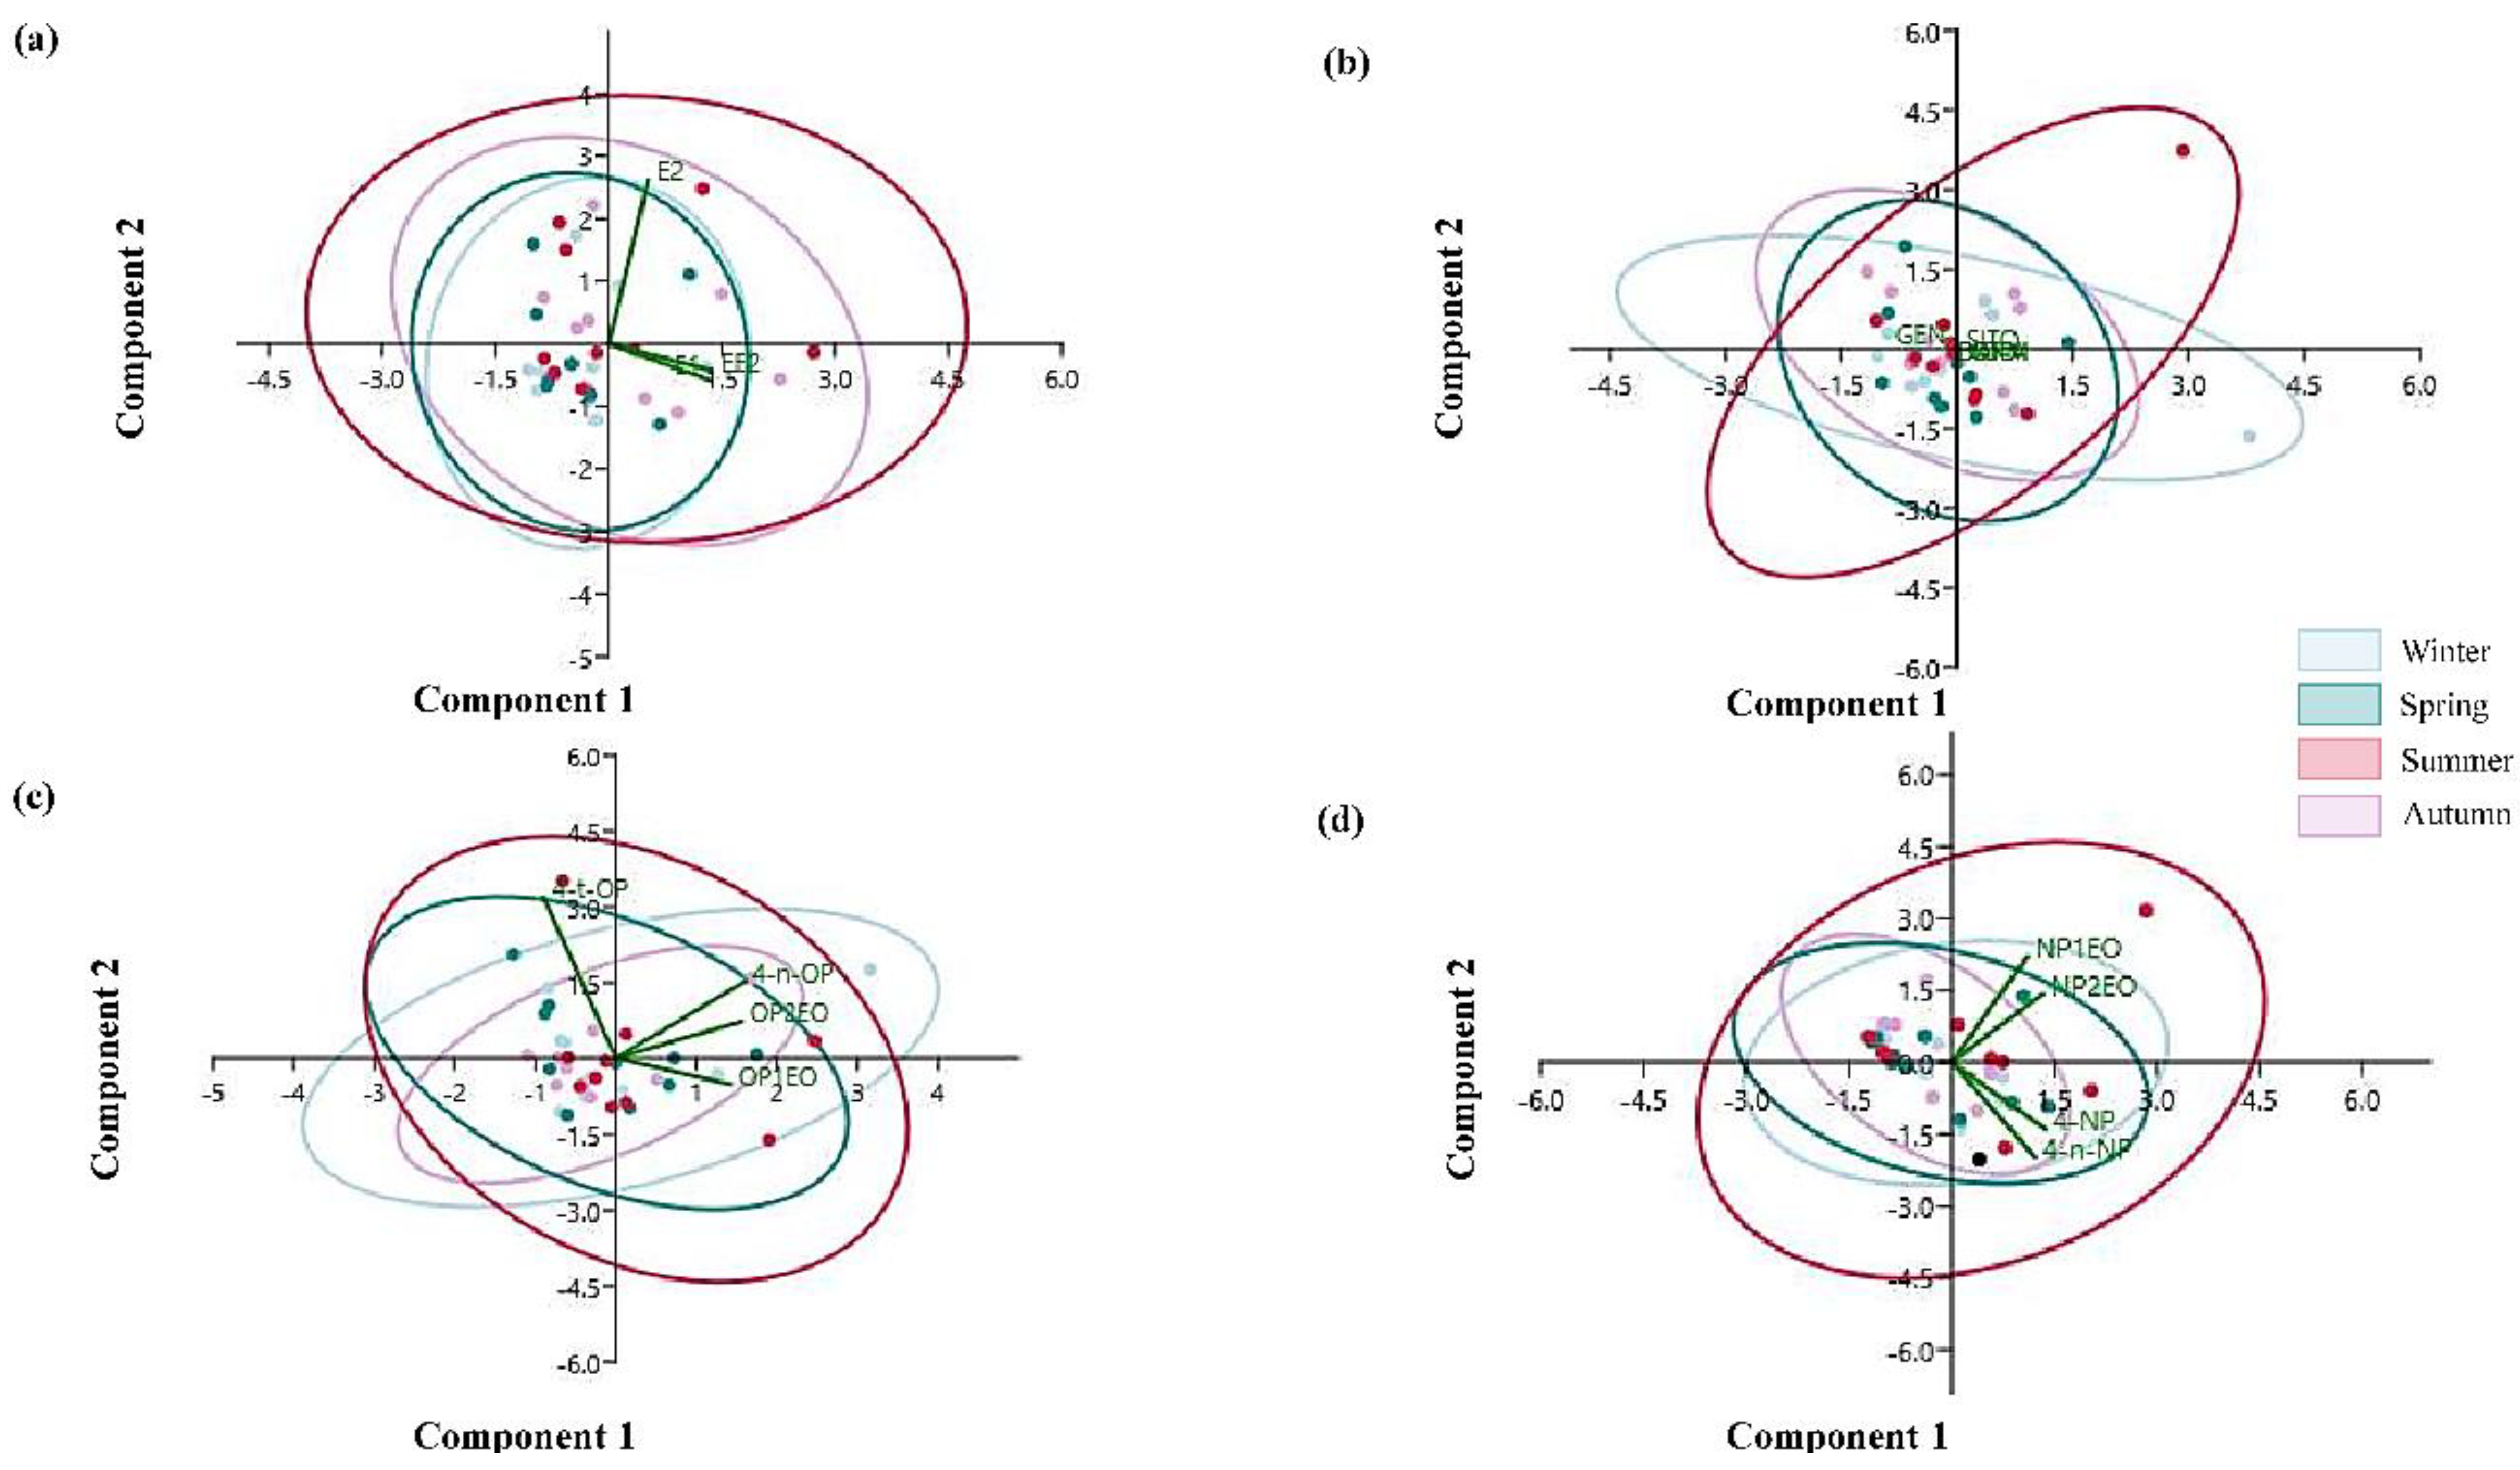
3.1. Oestrogens
3.2. Phytoestrogens and SITO
3.3. Industrial Compounds
3.3.1. BPA
3.3.2. OPs and OPEOs
3.3.3. NPs and NPEOs
3.4. Physicochemical Data
4. Discussion
4.1. Oestrogens
4.2. Phytoestrogens and SITO
4.3. Industrial Compounds
4.4. Physico-Chemical Data
5. Conclusions
Supplementary Materials
Author Contributions
Funding
Data Availability Statement
Conflicts of Interest
References
- WFD. Directive 2000/60/EC of the European Parliament and of the Council. Off. J. Eur. Communities 2000, L327, 1–72. [Google Scholar]
- Moss, T.; Bouleau, G.; Albiac, J.; Slavíkova, L. The EU Water Framework Directive twenty years on: Introducing the special issue. Water Altern. 2020, 13, 446–457. [Google Scholar]
- Rocha, M.J.; Cruzeiro, C.; Rocha, E. Development and validation of a GC-MS method for the evaluation of 17 endocrine disruptor compounds, including phytoestrogens and sitosterol, in coastal waters—Their spatial and seasonal levels in Porto costal region (Portugal). J. Water Health 2013, 11, 281–296. [Google Scholar] [CrossRef] [PubMed]
- Cruzeiro, C.; Amaral, S.; Rocha, E.; Rocha, M.J. Determination of 54 pesticides in waters of the Iberian Douro River estuary and risk assessment of environmentally relevant mixtures using theoretical approaches and Artemia salina and Daphnia magna bioassays. Ecotoxicol. Environ. Saf. 2017, 145, 126–134. [Google Scholar] [CrossRef]
- Rocha, M.J.; Cruzeiro, C.; Ferreira, C.; Rocha, E. Occurrence of endocrine disruptor compounds in the estuary of the Iberian Douro River and nearby Porto Coast (NW Portugal). Toxicol. Environ. Chem. 2012, 94, 252–261. [Google Scholar] [CrossRef]
- European Commission. Decision no 2455/2001/EC of the European Parliament and of the Council of 20 November 2001 establishing the list of priority substances in the field of water policy and amending Directive 2000/60/EC. Off. J. Eur. Communities 2001, L331, 1–17. [Google Scholar]
- European Union. Directive 2013/39/EU of the European Parliament and of the Council of 12 August 2013 amending Directives 2000/60/EC and 2008/105/EC as Regards Priority Substances in the Field of Water Policy Text with EEA Relevance. Off. J. Eur. Union 2013, L226, 1–17. [Google Scholar]
- Leet, J.K.; Gall, H.E.; Sepúlveda, M.S. A review of studies on androgen and estrogen exposure in fish early life stages: Effects on gene and hormonal control of sexual differentiation. J. Appl. Toxicol. 2011, 31, 379–398. [Google Scholar] [CrossRef]
- Azizi, D.; Arif, A.; Blair, D.; Dionne, J.; Filion, Y.; Ouarda, Y.; Pazmino, A.G.; Pulicharla, R.; Rilstone, V.; Tiwari, B.; et al. A comprehensive review on current technologies for removal of endocrine disrupting chemicals from wastewaters. Environ. Res. 2022, 207, 112196. [Google Scholar] [CrossRef]
- Surana, D.; Gupta, J.; Sharma, S.; Kumar, S.; Ghosh, P. A review on advances in removal of endocrine disrupting compounds from aquatic matrices: Future perspectives on utilization of agri-waste based adsorbents. Sci. Total Environ. 2022, 826, 154129. [Google Scholar] [CrossRef]
- Emerson, K.; Russo, R.; Lund, R.; Thurston, R. Aqueous ammonia equilibrium calculations: Effect of pH and temperature. J. Fish. Board Can. 1975, 32, 2379–2383. [Google Scholar] [CrossRef]
- Coldham, N.G.; Dave, M.; Sivapathasundaram, S.; McDonnell, D.P.; Connor, C.; Sauer, M.J. Evaluation of a recombinant yeast cell estrogen screening assay. Environ. Health Perspect. 1997, 105, 734–742. [Google Scholar] [CrossRef]
- Beck, I.-C.; Bruhn, R.; Gandrass, J. Analysis of estrogenic activity in coastal surface waters of the Baltic Sea using the yeast estrogen screen. Chemosphere 2006, 63, 1870–1878. [Google Scholar] [CrossRef] [PubMed]
- Wentsel, R.S.; LaPoint, T.W.; Simini, M.; Checkail, R.T.; Ludwig, D.; Brewer, L. Tri-Service Procedural Guidelines for Ecological Risk Assessments; US Army Edgewood Research, Development, and Engineering Center: Aberdeen Proving Ground, MD, USA, 1996. [Google Scholar]
- Caldwell, D.J.; Mastrocco, F.; Anderson, P.D.; Länge, R.; Sumpter, J.P. Predicted-no-effect concentrations for the steroid oestrogens estrone, 17β-estradiol, estriol, and 17α-ethinylestradiol. Environ. Toxicol. Chem. 2012, 31, 1396–1406. [Google Scholar] [CrossRef] [PubMed]
- EU. European Union Updated Risk Assessment Report. CAS No: 80-05-7. Institute for Health and Consumer Protection, European Chemicals Bureau, European Commission Joint Research Centre: Office for Official Publications of the European Communities. 2008. Available online: https://publications.jrc.ec.europa.eu/repository/bitstream/JRC59988/lbna24589enn.pdf (accessed on 14 June 2022).
- ECHA. 4-(1,1,3,3-Tetramethylbutyl)phenol. European Chemicals Agency. 2020. Available online: https://echa.europa.eu/pt/registration-dossier/-/registered-dossier/15074/5/3/1 (accessed on 14 June 2022).
- EQS. Environmental Quality Standards. Priority Substance No. 25. Octylphenols (Para-tert-octylphenol) CAS-No. 1806-26-4 and 140-66-9. 2005. Available online: https://circabc.europa.eu/sd/a/38053232-85b7-4668-895b-22bf91aca0e3/25_Octylphenols_EQSdatasheet_310705.pdf (accessed on 14 June 2022).
- ECHA. Nonylphenol, Branched, Ethoxylated. European Chemicals Agency. 2020. Available online: https://echa.europa.eu/pt/registration-dossier/-/registered-dossier/2032/6/1 (accessed on 14 June 2022).
- Hammer, Ø.; Harper, D.; Ryan, P. Past: Paleontological Statistics Software Package for Education and Data Analysis. Palaeontologia Electronica 4:1-9. 2001. Available online: https://www.semanticscholar.org/paper/PAST%3A-PALEONTOLOGICAL-STATISTICAL-SOFTWARE-PACKAGE-Hammer-Harper/d17669e4f3f4dd3a180bde84dd54a508d0dc22f4 (accessed on 14 June 2022).
- Croghan, C.; Egeghy, P.P. Methods of Dealing with Values below the Limit of Detection Using SAS; EPA/600/A-03/176; Southeastern SAS User Group: St. Petersburg, FL, USA, 2003. [Google Scholar]
- Rocha, M.J.; Ribeiro, A.B.; Campos, D.; Rocha, E. Temporal-spatial survey of PAHs and PCBs in the Atlantic Iberian northwest coastline, and evaluation of their sources and risks for both humans and aquatic organisms. Chemosphere 2021, 279, 130506. [Google Scholar] [CrossRef] [PubMed]
- Mills, L.; Chichester, C. Review of Evidence: Are Endocrine-Disrupting Chemicals in the Aquatic Environment Impacting Fish Populations? Sci. Total Environ. 2005, 343, 1–34. [Google Scholar] [CrossRef] [PubMed] [Green Version]
- Nazari, E.; Suja, F. Effects of 17β-estradiol (E2) on aqueous organisms and its treatment problem: A review. Rev. Environ. Health 2016, 31, 465–491. [Google Scholar] [CrossRef]
- Rocha, M.; Rocha, E. Estrogenic compounds in estuarine and coastal water environments of the Iberian Western Atlantic coast and selected locations worldwide—Relevancy, trends and challenges in view of the EU Water Framework Directive. In Toxicology Studies—Cells, Drugs and Environment; Andreazza, A., Scola, G., Eds.; IntechOpen: Rijeka, Croatia, 2015; pp. 153–193. [Google Scholar]
- Carrola, S.C.; Fontainhas-Fernandes, A.; Martinho, F.; Rocha, M.J.; Ferreira-Cardoso, J.; Gouveia, A.; Rocha, E. Assessment of intersex severity in grey mullets from three Portuguese estuaries—Preliminary data. Comparative Biochemistry and Physiology A. Mol. Integr. Physiol. 2012, 163, S37. [Google Scholar] [CrossRef]
- Pironti, C.; Ricciardi, M.; Proto, A.; Bianco, P.M.; Montano, L.; Motta, O. Endocrine-disrupting compounds: An overview on their occurrence in the aquatic environment and human exposure. Water 2021, 13, 1347. [Google Scholar] [CrossRef]
- Benassayag, C.; Perrot-Applanat, M.; Ferre, F. Phytooestrogens as modulators of steroid action in target cells. J. Chromatogr. B 2002, 777, 233–248. [Google Scholar] [CrossRef]
- Hoerger, C.C.; Wettstein, F.E.; Hungerbühler, K.; Bucheli, T.D. Occurrence and origin of estrogenic isoflavones in Swiss river waters. Environ. Sci. Technol. 2009, 43, 6151–6157. [Google Scholar] [CrossRef] [PubMed]
- Santos, E.; Carreira, R.; Knoppers, B. Sedimentary sterols as indicators of environmental conditions in Southeastern Guanabara Bay, Brazil. Braz. J. Oceanogr. 2008, 56, 97–113. [Google Scholar] [CrossRef]
- Volkman, J.K.; Revill, A.T.; Holdsworth, D.G.; Fredericks, D. Organic matter sources in an enclosed coastal inlet assessed using lipid biomarkers and stable isotopes. Org. Geochem. 2008, 39, 689–710. [Google Scholar] [CrossRef]
- Ribeiro, C.; Tiritan, M.E.; Rocha, E.; Rocha, M.J. Seasonal and spatial distribution of several endocrine-disrupting compounds in the Douro River estuary, Portugal. Arch. Environ. Contam. Toxicol. 2009, 56, 1–11. [Google Scholar] [CrossRef]
- Crain, D.A.; Eriksen, M.; Iguchi, T.; Jobling, S.; Laufer, H.; LeBlanc, G.A.; Guillette, L.J. An ecological assessment of bisphenol-A: Evidence from comparative biology. Reprod. Toxicol. 2007, 24, 225–239. [Google Scholar] [CrossRef] [PubMed]
- Wintgens, T.; Gallenkemper, M.; Melin, T. Occurrence and removal of endocrine disrupters in landfill leachate treatment plants. Water Sci. Technol. 2003, 48, 127–134. [Google Scholar] [CrossRef] [PubMed]
- Meesters, R.J.W.; Schröder, H.F. Simultaneous determination of 4-nonylphenol and bisphenol A in sewage sludge. Anal. Chem. 2002, 74, 3566–3574. [Google Scholar] [CrossRef]
- Rodrigues, S.M.; Almeida, C.M.R.; Silva, D.; Cunha, J.; Antunes, C.; Freitas, V.; Ramos, S. Microplastic contamination in an urban estuary: Abundance and distribution of microplastics and fish larvae in the Douro estuary. Sci. Total Environ. 2019, 659, 1071–1081. [Google Scholar] [CrossRef]
- Rocha, M.J.; Ribeiro, C.; Ribeiro, M. Development and optimization of a GC-MS method for the evaluation of ooestrogens and persistent pollutants in river and seawater samples. Int. J. Environ. Anal. Chem. 2011, 91, 1191–1205. [Google Scholar] [CrossRef]
- EU. Directive 2003/53/EC of the European Parliament and of the Council of 18 June 2003 amending for the 26th time Council Directive 76/769/EEC relating to restrictions on the marketing and use of certain dangerous substances and preparations (nonylphenol, nonylphenol ethoxylate and cement). Off. J. Eur. Union 2003, L178, 24–27. [Google Scholar]
- Decreto-Lei 218/2015 de 7 de Outubro de 2015. Diário da República Portuguesa. Ministério Do Ambiente 2015, 8667–8685. Available online: https://files.dre.pt/1s/2015/10/19600/0866708685.pdf (accessed on 14 June 2022).
- Pinto, A.L.; Varandas, S.; Coimbra, A.M.; Carrola, J.; Fontaínhas-Fernandes, A. Mullet and gudgeon liver histopathology and macroinvertebrate indexes and metrics upstream and downstream from a wastewater treatment plant (Febros River—Portugal). Environ. Monit. Assess. 2010, 169, 569–585. [Google Scholar] [CrossRef] [PubMed]
- Quercus. Descargas Ilegais de Esgotos de Embarcações Turísticas Provocam Danos Ambientais no Douro. Agricultura e Mar Atual. 2019. Available online: https://agriculturaemar.com/quercus-descargas-ilegais-de-esgotos-de-embarcacoes-turisticas-provocam-danos-ambientais-no-douro/ (accessed on 14 June 2022).
- Priac, A.; Morin-Crini, N.; Druart, C.; Gavoille, S.; Bradu, C.; Lagarrigue, C.; Torri, G.; Winterton, P.; Crini, G. Alkylphenol and alkylphenol polyethoxylates in water and wastewater: A review of options for their elimination. Arab. J. Chem. 2017, 10, S3749–S3773. [Google Scholar] [CrossRef]
- Francis-Floyd, R.; Watson, C.; Petty, D.; Pouder, D. Ammonia in Aquatic Systems. Fisheries and Aquatic Sciences. U.S. Department of Agriculture, UF/IFAS Extension Service, University of Florida, IFAS, Florida A & M University Cooperative Extension Program, and Boards of County Commissioners Cooperating. Nick T. Place, Dean for UF/IFAS Extension 2015, 1–5. Available online: https://edis.ifas.ufl.edu/pdf/FA/FA03100.pdf (accessed on 14 June 2022).
- Environmental Signals 2000. 13. Eutrophication. European Environment Agency. Available online: https://www.eea.europa.eu/publications/signals-2000/page014.html (accessed on 14 June 2022).


| EDCs | LOD (ng/L) | DR (%) | Winter (ng/L) | Spring (ng/L) | Summer (ng/L) | Autumn (ng/L) | Annual Average (ng/L) |
|---|---|---|---|---|---|---|---|
| Oestrogens | |||||||
| E1 | 0.9 | 100 | 3.0 ± 1.1 | 3.1 ± 1.9 | 3.6 ± 2.1 | 3.7 ± 1.7 | 3.4 ± 1.7 |
| E2 | 0.9 | 100 | 6.1 ± 5.6 | 7 ± 5.2 | 11.5 ± 7 | 9.3 ± 5.7 | 8.5 ± 6.1 |
| EE2 | 1.3 | 95 | 2.9 ± 1.4 | 2.2 ± 0.8 | 4 ± 3 | 3.8 ± 2.2 | 3.2 ± 2.1 |
| Phytoestrogens and SITO | |||||||
| BIO-A | 1.3 | 100 | 881 ± 951 | 711 ± 517.4 | 945.9 ± 776.7 | 769.9 ± 558 | 827.1 ± 657.8 |
| DAID | 1.4 | 100 | 3.9 ± 2.8 | 4.5 ± 3.3 | 2.6 ± 1.8 | 3.2 ± 3.1 | 3.6 ± 2.8 |
| FORM | 2.6 | 100 | 12.2 ± 5.1 | 11.4 ± 3.0 | 13.5 ± 7.3 | 12.9 ± 8.8 | 12.5 ± 6.2 |
| GEN | 1.1 | 100 | 9.1 ± 5.5 | 8.3 ± 6.7 | 4.4 ± 2.7 | 9.3 ± 12.6 | 7.8 ± 7.8 |
| SITO | 2.0 | 100 | 118 ± 69.7 | 152.8 ± 78.4 | 104.6 ± 94.7 | 155.8 ± 180.4 | 132.7 ± 112.4 |
| Industrial Pollutants | |||||||
| BPA | 0.7 | 100 | 53.9 ± 44 | 55.1 ± 41.2 | 45.5 ± 35 | 38.5 ± 28.3 | 48.3 ± 36.8 |
| 4-n-OP | 3.5 | 100 | 1.8 ± 1.2 | 1.6 ± 0.7 | 2.3 ± 1.7 | 2.1 ± 2.1 | 2.0 ± 1.5 |
| 4-t-OP | 1.5 | 55 | 19.7 ± 27.6 | 12.7 ± 6.9 | 15.8 ± 19.8 | 18.2 ± 29 | 16.6 ± 21.9 |
| OP1EO | 5.3 | 100 | 95.7 ± 55.5 | 86 ± 34 | 135.1 ± 121 | 70.2 ± 44.8 | 96.8 ± 73.5 |
| OP2EO | 0.9 | 100 | 965 ± 816.2 | 1093 ± 1070.1 | 1104 ± 494.8 | 770.2 ± 420.5 | 983.1 ± 730.7 |
| 4-NP | 5.5 | 100 | 802 ± 594 | 825.5 ± 721 | 829.7 ± 544.1 | 575.3 ± 345.7 | 758.1 ± 555.7 |
| 4-n-NP | 0.6 | 100 | 25.5 ± 11.2 | 20.7 ± 8.7 | 30.3 ± 18.9 | 19.1 ± 12.7 | 23.9 ± 13.6 |
| NP1EO | 1.8 | 100 | 538 ± 704.4 | 449.4 ± 598.3 | 551.2 ± 612.1 | 391.6 ± 319.5 | 482.6 ± 558.2 |
| NP2EO | 2.1 | 100 | 2501 ± 1878 | 1963 ± 1757.4 | 4220 ± 4344.1 | 2067 ± 1728.2 | 2687.7 ± 2723.0 |
| EDCs | Annual Average Concentration (ng/L) | Relative Potency to E2 | E2-EQs (ng/L) | Totals (∑E2-EQ) (ng/L) | PNEC (ng/L) | HQs | HI (∑HQs) | Ref. |
|---|---|---|---|---|---|---|---|---|
| Oestrogens | ||||||||
| E1 | 3.4 | 3.0 × 10⁻¹ | 1.0 | 6.0 | 0.6 | [15] | ||
| E2 | 8.5 | 1.0 | 8.5 | 2.0 | 4.2 | [15] | ||
| EE2 | 3.2 | 1.3 | 4.2 | 13.7 | 1.0 | 3.2 | 8.0 | [15] |
| Phytoestrogens and SITO | ||||||||
| BIO-A | 827.1 | 9.1 × 10⁻³ | 7.5 | - | 3.8 | - | ||
| DAID | 3.6 | 1.3 × 10⁻³ | 4.6 × 10⁻³ | - | 0.0 | - | ||
| FORM | 12.5 | 5.6 × 10⁻³ | 7.0 × 10⁻² | - | 0.0 | - | ||
| GEN | 7.8 | 4.9 × 10⁻² | 3.8 × 10⁻¹ | 8.0 | - | 0.2 | 4.0 | - |
| SITO | 827.1 | 9.1 × 10⁻³ | 7.5 | - | 3.8 | - | ||
| Industrial Pollutants | ||||||||
| BPA | 48.3 | 1.0 × 10⁻⁴ | 4.8 × 10⁻³ | 1.5 × 10³ | 0.03 | [16] | ||
| 4-n-OP | 2.0 | 4.0 × 10⁻⁴ | 7.8 × 10⁻⁴ | 1.2 × 10² | 0.02 | [18] | ||
| 4-t-OP | 16.6 | 1.3 × 10⁻⁵ | 2.2× 10⁻⁴ | 1.0 × 10³ | 0.02 | [16] | ||
| OP1EO | 96.8 | 5.0 × 10⁻⁶ | 4.8 × 10⁻⁴ | 1.2 × 10² | 0.79 | [16] | ||
| OP2EO | 983.1 | 5.0 × 10⁻⁶ | 4.9 × 10⁻³ | 1.2× 10² | 8.06 | [18] | ||
| 4-NP | 758.1 | 4.0 × 10⁻³ | 3.0 | 8.0 × 10² | 0.95 | [17] | ||
| 4-n-NP | 23.9 | 5.0 × 10⁻⁵ | 1.2 × 10⁻³ | 8.0× 10² | 0.03 | [19] | ||
| NP1EO | 482.7 | 6.3 × 10⁻⁷ | 3.0× 10⁻⁴ | 8.0× 10² | 0.60 | [19] | ||
| NP2EO | 2687.7 | 6.3 × 10⁻⁷ | 1.7 × 10⁻³ | 3.0 | 8.0× 10² | 3.36 | 13.9 | [19] |
| Totals | E2-EQs = | 24.7 | HI = | 25.9 | ||||
| Seasons | Winter | Spring | Summer | Autumn |
|---|---|---|---|---|
| T (°C) | 11.9 ± 0.7 | 17.0 ± 0.9 | 22.3 ± 1.4 | 15.4 ± 0.7 |
| Salinity (PSU) | 2.4 ± 2.1 | 3.3 ± 2.8 | 10.5 ± 3.4 | 2.9 ± 3.4 |
| pH | 7.5 ± 0.2 | 7.5 ± 0.3 | 7.5 ± 0.3 | 7.1 ± 0.3 |
| NO3− (mg/L) | 1.9 ± 0.4 | 1.5 ± 0.5 | 1.2 ± 0.1 | 1.3 ± 0.3 |
| NO2− (mg/L) | 0.09 ± 0.05 | 0.03 ± 0.04 | 0.04 ± 0.01 | 0.03 ± 0.01 |
| NH4+ (mg/L) | 0.6 ± 1.2 | 2.5 ± 0.9 | 2.3 ± 0.0 | 2.2 ± 0.2 |
| Unionized ammonia (mg/L) | 0.004 ± 0.01 | 0.031 ± 0.02 | 0.052 ± 0.04 | 0.010 ± 0.01 |
| NH3 (mg/L) | 0.004 ± 0.01 | 0.031 ± 0.02 | 0.052 ± 0.04 | 0.010 ± 0.01 |
| PO43− (mg/L) | 0.14 ± 0.2 | 0.04 ± 0.0 | 0.16 ± 0.1 | 0.23 ±0.2 |
Publisher’s Note: MDPI stays neutral with regard to jurisdictional claims in published maps and institutional affiliations. |
© 2022 by the authors. Licensee MDPI, Basel, Switzerland. This article is an open access article distributed under the terms and conditions of the Creative Commons Attribution (CC BY) license (https://creativecommons.org/licenses/by/4.0/).
Share and Cite
Rocha, M.J.; Silva, F.; Rocha, E. Annual Evaluation of 17 Oestrogenic Endocrine Disruptors and Hazard Indexes in the Douro River Estuary—The Atlantic Discharge of the Highest-Flow River of Southwestern Europe. Water 2022, 14, 2046. https://doi.org/10.3390/w14132046
Rocha MJ, Silva F, Rocha E. Annual Evaluation of 17 Oestrogenic Endocrine Disruptors and Hazard Indexes in the Douro River Estuary—The Atlantic Discharge of the Highest-Flow River of Southwestern Europe. Water. 2022; 14(13):2046. https://doi.org/10.3390/w14132046
Chicago/Turabian StyleRocha, Maria João, Frederico Silva, and Eduardo Rocha. 2022. "Annual Evaluation of 17 Oestrogenic Endocrine Disruptors and Hazard Indexes in the Douro River Estuary—The Atlantic Discharge of the Highest-Flow River of Southwestern Europe" Water 14, no. 13: 2046. https://doi.org/10.3390/w14132046