Article

Quality of Bottom Sediments of Sołtmany Lake (Masurian Lake District, Poland) in the Light of Geochemical and Ecotoxicological Criteria—Case Study

1
Department of Geomorphology and Geoarchaeology, Institute of Geography and Environmental Sciences, Jan Kochanowski University, 7 Uniwersytecka St., 25-406 Kielce, Poland
2
Faculty of Environmental Engineering, Geomatics and Power Engineering, Kielce University of Technology, Al. Tysiąclecia Państwa Polskiego 7, 25-314 Kielce, Poland
*
Author to whom correspondence should be addressed.
Water 2022, 14(13), 2045; https://doi.org/10.3390/w14132045
Submission received: 19 May 2022 / Revised: 14 June 2022 / Accepted: 22 June 2022 / Published: 26 June 2022
(This article belongs to the Special Issue Water Quality in Agricultural Watersheds)

Abstract

:
The quality of bottom sediment is important for the condition of aquatic environments. High levels of potentially harmful components in sediments negatively affect the quality of surface water environments. Lake bottom sediments are commonly used to control the quality of the environment in terms of both heavy metals and harmful organic compounds. This paper presents new data on the compositions of bottom sediments from Sołtmany Lake, located in the Masurian Lake District (Poland). The aim of this study was to determine the physicochemical properties of bottom sediments and to assess their quality based on geochemical and ecotoxicological criteria. The field study was conducted in July 2021. Thirty sediment samples were collected for analysis from six study sites located in the upper central and lower part of the reservoir. Contamination of the bottom sediments with trace metals was determined on the basis of the geoaccumulation index (Igeo), while an ecological risk assessment was carried out on the basis of calculated values of TEC (Threshold Effect Concentration) and PEC (Probable Effect Concentration) indices. The study shows that the concentration of trace metals in sediments was characterised by slight variation and that the maximum values did not exceed: 1.1 mg·kg−1 for Cd, 8.7 mg·kg−1 for Cr, 10.9 mg·kg−1 for Cu, 7.7 mg·kg−1 for Ni, 12.9 mg·kg−1 for Pb and 52.3 mg·kg−1 for Zn. The analyses further showed that the concentration of trace elements in the sediment surface layer increased in the following order: Zn > Pb > Cu > Ni > Cr > Cd. The maximum pH value of H2O was 7.1, while that of KCl was 7.0. The maximum values of Corg, Ntot, P2O5, K2O and Mg were, respectively: 6.1 g·kg−1, 1.4 g·kg−1, 40.2 mg·100 g−1, 31.2 mg·100 g−1 and 35.1 mg·100 g−1. The assessment of the degree of lake pollution is essential for the conservation of biodiversity and the organisation of environmental management activities.

1. Introduction

Sediments are formed on the bottom of lakes as a result of the sedimentation of mineral and organic suspensions from erosion, as well as components precipitated from water. Bottom sediments have a number of functions in aquatic ecosystems, including providing a habitat for many organisms, participating in the biogeochemical process of element circulation, and being the site of deposition and transformation of many compounds found in the water. Due to the structure of sediments, they form a natural geosorbent in which pollutants introduced to aquatic environments are stored. The literature on bottom sediments is very rich and varied. It addresses issues related to their classification, genesis, research methodology, physicochemical properties, their contaminants and management methods [1,2,3,4,5,6,7,8,9,10,11]. The quality of bottom sediments in lakes depends on both natural and anthropogenic factors [12]. In non-industrialised areas, the composition of sediments accumulating on the bottom, including the concentration of trace elements, depends on the lithological structure of the given catchment and climatic conditions, which determine the course of weathering processes and the activation of elements. The enrichment of sediments in potentially toxic metals observed in industrialised areas is primarily the result of anthropogenic activities: the way the catchment is used, discharge of wastewater and emission of pollutants into the atmosphere, which enter surface waters as a result of wet deposition and surface runoff [12,13]. Metals accumulated in bottom sediments can be released into water bodies through various chemical and biochemical processes or can be taken up directly from the sediments by benthic organisms [14]. Pollution with trace elements is considered a serious threat to the biosphere due to their toxicity, persistence and bioaccumulation capacity [1,15]. High concentrations of contaminants in bottom sediments may be potentially toxic to aquatic organisms. They may also pose a risk of toxic effects to terrestrial organisms if sediments are not properly managed. Therefore, the classification and verification of the degree of contamination and pollution of lakes is essential for the preservation of biodiversity and the organisation of environmental management activities [16].
In addition, the status of nutrients (nitrogen and phosphorus) in sediments is crucial for assessing the overall quality of lakes. Elevated nutrient loadings accelerate eutrophication and generate harmful consequences in the natural ecosystem [17].
Lake sediments are commonly used to monitor environmental quality for contamination by both heavy metals and harmful organic compounds. The distribution of trace metals—Corg, Ntot, P2O5, K2O and Mg—in lakes should be monitored and the relationships between distributions and regional developments should be compared. Sołtmany Lake, which is located in the Protected Landscape Area of the Land of the Great Masurian Lakes, in the agricultural and tourist catchment area, was chosen for a case study to understand the effects of human activities on the ecosystem around the sampled points. Studies on the physicochemical properties of lake sediments can reveal anthropogenic effects on the natural environment of the catchment and reservoir. This is particularly important from the perspective of issues related to water conservation and protection from pollution. This study provides a technical basis for environmental and ecological research.
Currently, key studies on trace metal concentrations in bottom sediments include, among others, potential ecological risk and toxicity assessments [14,18,19]. The criteria used to determine the potential ecological risk of bottom sediments include: the geochemical criterion, which allows assessment of the contamination degree of bottom sediments in relation to the geochemical background, i.e., the content of elements present in sediments under natural conditions [20,21]; the ecotoxicological criterion, which allows assessment of the impact of contaminated sediments on aquatic organisms [22]; threshold effect concentration (TEC) and probable effect concentration (PEC) values; and the geoaccumulation index (Igeo) [23].
The aim of this study was (i) to determine the physicochemical properties of bottom sediments (pH, granulometric composition, Corg., Ntot., P2O5, K2O, Mg), (ii) to determine the concentrations of trace metals (Cd, Cr, Cu, Ni, Pb, Zn) in bottom sediments, (iii) to assess the quality of bottom sediments based on geochemical and ecotoxicological criteria (comparison of values with the geochemical background, geochemical quality classes according to Bojakowska, Igeo, TEC, PEC).

2. Materials and Methods

2.1. Study Area

Sołtmany Lake is located in Ełk Lake District, within the administrative borders of Kruklanki Commune, in Giżycko County, Warmian-Masurian Voivodeship (Figure 1). The basic parameters of Sołtmany Lake are presented in Table 1.
Sołtmany Lake is a lake in the course of the Sapina River. The river, flowing from the edges of Borecka Forest (from the Żywy Lake), flows into the eastern part of the reservoir, whereas the outflow flows westwards to Żywki Lake. The lake has an oblong shape; the western part of the reservoir is visibly deeper (12.5 m), separated from the eastern part, which is shallower (5.0 m), by three islands. The shoreline of the lake, about 8.5 km long, is moderately developed. The bottom is hard and silty in places. It is situated 130.4 m above sea level, within the Protected Landscape Area of the Land of the Great Masurian Lakes, and its volume is 9,946 thousand m3. The northern part of the basin, with a total area of 36.3 km2, is covered by the forests of the Borecka Forest. The remaining area is covered by agricultural land. In the direct catchment, with an area of 8.2 km2, the largest share is taken by arable land (approximately 90%). The remaining part is occupied by mixed crops and rural buildings. The primary economic function of the area in question is agriculture and tourism. Agriculture is based on individual farms, generally family farms, focused on cereal and potato cultivation. There is a lack of larger-scale farming. Some agricultural land has not been cultivated for several years. The tourist and landscape values of Borecka Forest and the lakes have led to the construction of individual tourist and recreational buildings around them. There are no holiday resorts or camping sites in the catchment area. A small village named Sołtmany is located on the lake, which lacks a sanitary sewage system (sewage from septic tanks is taken to a treatment plant in Wydminy) [24,25].
Table 1. Parameters of Sołtmany Lake [26].
Lake NameCatchment AreaTotal Catchment Area (km2)Water Table Area (ha)Length (m)Width (m)DepthVolume (Thousand m3)
MaxMin
SołtmanyWęgorapa-Pręgoła36.31812600104012.55.59946
According to Polish physicogeographic classification, Sołtmany Lake is situated within the Eastern Baltic Lake District sub-province, in the Masurian Lake District microregion and the Elk Lake District mesoregion [27]. The Ełk Lake District proper, with a moraine and upland landscape, also known as Masuria Garbatia, is quite a morphologically diverse area located east of the Great Masurian Lakes and south of the Szeskie Hills. The Sołtmany Lake area is located in a post-glacial upland with a very diversified relief, characteristic of young post-glacial landscapes, with numerous hills of moraines, kames and eskers, as well as lake depressions, kettles and post-glacial gullies reaching heights from 130 m to 223 m above sea level [26]. The present-day surface overlying Pleistocene sediments is primarily erosional in nature (water erosion and exfoliation). At the end of the Pleistocene and during the Holocene, deluvial and lacustrine (older) sediments were formed in the area. Lake sands, silts and clays occurring at Sołtmany Lake on its southern side, lie more than 6 m above the water level [28].
The climate of the Sołtmany Lake area is a transitional climate, between maritime and terrestrial, locally diversified by the influence of nearby lakes, remaining mostly within the range of polar maritime air masses, gradually losing their primary characteristics, with an average annual pressure of 1013 hPa (reduced to sea level). It is the coldest climatic district of lowland Poland with an annual isotherm of +6.5 °C, a January isotherm of −5.5 °C and a July isotherm of +17 °C to +18 °C. Precipitation feeds the area at an average annual rate of 640–660 mm. The values of the average annual sums of field evaporation are 520–540 mm, of which the average sums of the summer half-year are 380–400 mm and of the winter half-year are 110–120 mm. Snow cover remains on average from 90 days to 110 days, there are more than 130 frost days and the vegetation period lasts 180–190 days [26]. The results of environmental monitoring carried out within the Integrated Environmental Monitoring program at the Comprehensive Environmental Monitoring Station Puszcza Borecka (approximately 8 km in a straight line from Sołtmany Lake) conducted by the Institute of Environmental Protection—State Research Institute in Warsaw showed that the mean annual air temperature in 2020 was higher (9.1 °C) than the multi-year average for the period 1994–2019 (7.3 °C). The total precipitation in 2020 was 616.1 mm compared to the multi-year average for 1994–2019 of 689.2 mm [29].

2.2. Bottom Sediment Sampling and Chemical Analysis

Bottom sediment samples from Sołtmany Lake were collected once, in July 2021, using a jaw scoop. Thirty samples of the top 5 cm of silt were collected for laboratory analysis from 6 selected study sites (samples from each site were averaged in situ) (Figure 1). After collection, the silts were placed in polyethylene containers and sealed tightly. In the laboratory, the collected material was dried at room temperature (approximately 20 °C). Then, the samples were sieved through a sieve with a mesh diameter of 2 mm. Finely powdered sediment subsamples (of approximately 1 g each) were dissolved in 15 mL of concentrated hydrochloric acid and 5 mL of concentrated nitric acid (3:1 ratio aqua regia). The mixture was digested at 120 °C for 1–2 h. Upon cooling, the solution was diluted to 30 mL with deionised water and filtered using filter paper. In the material prepared in this way the concentration of trace metals (Cd, Cr, Cu, Ni, Pb, Zn) was determined by inductively coupled plasma atomic emission spectrometry (ICP-AES). A Thermo Scientific spectrometer was used for the analyses. Detection limits for individual elements were: Cd—0.1 mg·kg−1, Cu—0.1 mg·kg−1, Cr—0.2 mg·kg−1, Ni—0.3 mg·kg−1, Pb—0.3 mg·kg−1 and Zn—0.2 mg·kg−1. The accuracy of analytical methods and procedures used was assessed using certified reference materials, such as Metals of sediment CRMO 15-050 and Loamy Sand 4 CRMO 36-050. The measured and certified values of element/compound concentrations were compared (Table 2). All of the results obtained for the reference materials were statistically similar to the certified values (p < 0.05). The relative standard deviations of the measured replicates were all within ±5%.
The content of total nitrogen was determined by a modified Kjeldahl method, according to PN-ISO 11261:2002, using a BÜCHI 323 mineralizer and a BÜCHI 323 distillation apparatus. The method consists of the mineralization of nitrogen in an acid medium to ammonium salt, followed by the distillation of bound ammonia and the determination of its amount in the distillate [30]. The content of available forms of phosphorus P2O5 and potassium K2O was determined by the Egner–Riehm method, which consists of the extraction of phosphorus compounds from sediment by means of calcium lactate acidified with hydrochloric acid (CH3·CHOH·COO)2Ca). Magnesium content was determined by the Schachtschabel method (extraction with calcium chloride solution), while Corg was determined by the Tiurin method [31]. Bottom sediment pH was determined based on pH values determined for 1 mol KCl·dm−3 and H2O potentiometrically using a combination electrode [31]. Sediment granulometric composition was determined using Mastersizer 2000 laser granulometry.

2.3. Assessment of Sediment Contamination

The geoaccumulation index (Igeo) proposed by Müller (1969) [23] was used to assess the degree of metal contamination in sediments. The index consists of seven classes, the highest of which reflects a 100-fold enrichment relative to the geochemical background (Table 3):
Igeo = log2(Cn/1.5Bn)
where: Cn—concentration of the analysed metal in sediment, Bn—geochemical background for the analysed metal (Cd = 0.5 mg·kg−1, Cr = 5 mg·kg−1, Cu = 6 mg·kg−1, Ni = 5 mg·kg−1, Pb = 10 mg·kg−1, Zn = 48 mg·kg−1 [20]), 1.5—factor taking into account the lithological variability of the catchment.
Assessment of bottom sediment contamination with trace metals was also carried out based on geochemical quality classes, according to Bojakowska (2001) [20] (Table 4).
A bottom sediment ecotoxicity assessment to determine the effects of contaminated sediments on aquatic organisms was conducted based on Threshold Effect Concentration (TEC) and Probable Effect Concentration (PEC) values. The TEC is a threshold value used to identify contaminant concentrations below which no adverse effects on benthic organisms are expected, while the PEC is a probable value that identifies the concentration above which adverse effects on benthic organisms are expected [5,22]. Trace metal concentrations from each measurement point were compared to the corresponding TEC and PEC values (Table 5).

2.4. Statistical Analysis

The obtained index values were characterised using the arithmetic mean, standard deviation, and minimum and maximum values. To assess the strength and direction of statistical relationships between the studied variables (the values of the studied indicators, due to their distribution deviating from normal), Spearman’s correlation coefficients were calculated, considering a level of p < 0.05 as statistically significant. In order to verify the null hypothesis, Ho: rs = 0, a statistic (U) of the following form was used:
U = r s 1 n 1
where: rs—value of Spearman correlation coefficient, n—sample size (n = 6).

3. Results

3.1. Granulometric Composition

Bottom sediments collected from Sołtmany Lake were characterised by low grain size variation. Both in the inlet, middle and outlet parts of the reservoir, the deposited materials were characterised by high sand fractions (63–74%). In all bottom sediment samples, the proportion of grains of the silt fraction did not exceed 27% by weight, while that of the clay fraction was 11% (Table 6). The obtained results for the granulometric composition of bottom sediments corresponded to the results of sediment studies for reservoirs in catchments with large percentages of forested areas [32]. In reservoirs in forested catchments, bottom sediments are generally sandy, while silt and clay sediments are more characteristic of agriculturally used catchments.

3.2. Physicochemical Properties of Bottom Sediments

The physicochemical properties of bottom sediments in Sołtmany Lake are presented in Table 7.
The pH of sediments was not very well-differentiated, mostly weakly acidic or on the verge of neutral, which was reflected in the pHH2O values in the range of 6.7–7.1 and in the pHKCl values in the range of 6.5–7.0. The lowest pH values were found in the samples collected from point 2, while the highest values were obtained from points 3 and 5. The sediments showed great diversity in basic chemical properties. The average values of Corg., Ntot., P2O5, K2O and Mg were 4.2 g·kg−1, 0.9 g·kg−1, 27.3, 22.2 and 26.0 mg·100 g−1, respectively. The range of Corg. values in the bottom sediment samples was 2.7–6.1 g·kg−1. The Ntot. content was in the range of 0.4–1.4 g·kg−1. The highest contents of P2O5 and K2O were 40.2 and 31.2 mg·100 g−1, respectively, while the lowest contents were 16.4 and 12.9 mg·100 g−1, respectively. The range of Mg values in the bottom sediment samples was 13.9–35.1 mg·100 g−1 (Figure 2).
Trace element concentrations in the sediments ranged from 0.6 to 1.1 mg Cd·kg−1, 4.0 to 8.7 mg Cr·kg−1, 6.1 to 10.9 mg Cu·kg−1, 5.1 to 7.7 mg Ni·kg−1, 9.0 to 12.9 mg Pb·kg−1 and 32.2 to 52.3 mg Zn·kg−1 (Table 7, Figure 2). The study indicated that the percentages of Zn, Pb, Cu, Ni, Cr, Cd in the samples collected from site 1 (near the northern shore), site 2 (the northern, deepest, part of the reservoir), site 3 (the central, deepest part of the reservoir), site 4 (the central part of the lake), site 5 (the central part of the lake) and site 6 (near the eastern shore) were 54–60%, 10–17%, 10–12%, 8–9%, 6–11% and 1%, respectively.
The analyses showed that the accumulation of trace elements in the surface layer of Sołtmany Lake sediments increased in the following series: Zn > Pb > Cu > Ni > Cr > Cd. The average concentrations of Zn, Pb, Cu, Ni, Cr and Cd were 42.2, 10.8, 8.0, 6.2, 6.1 and 0.8 mg·kg−1, respectively.

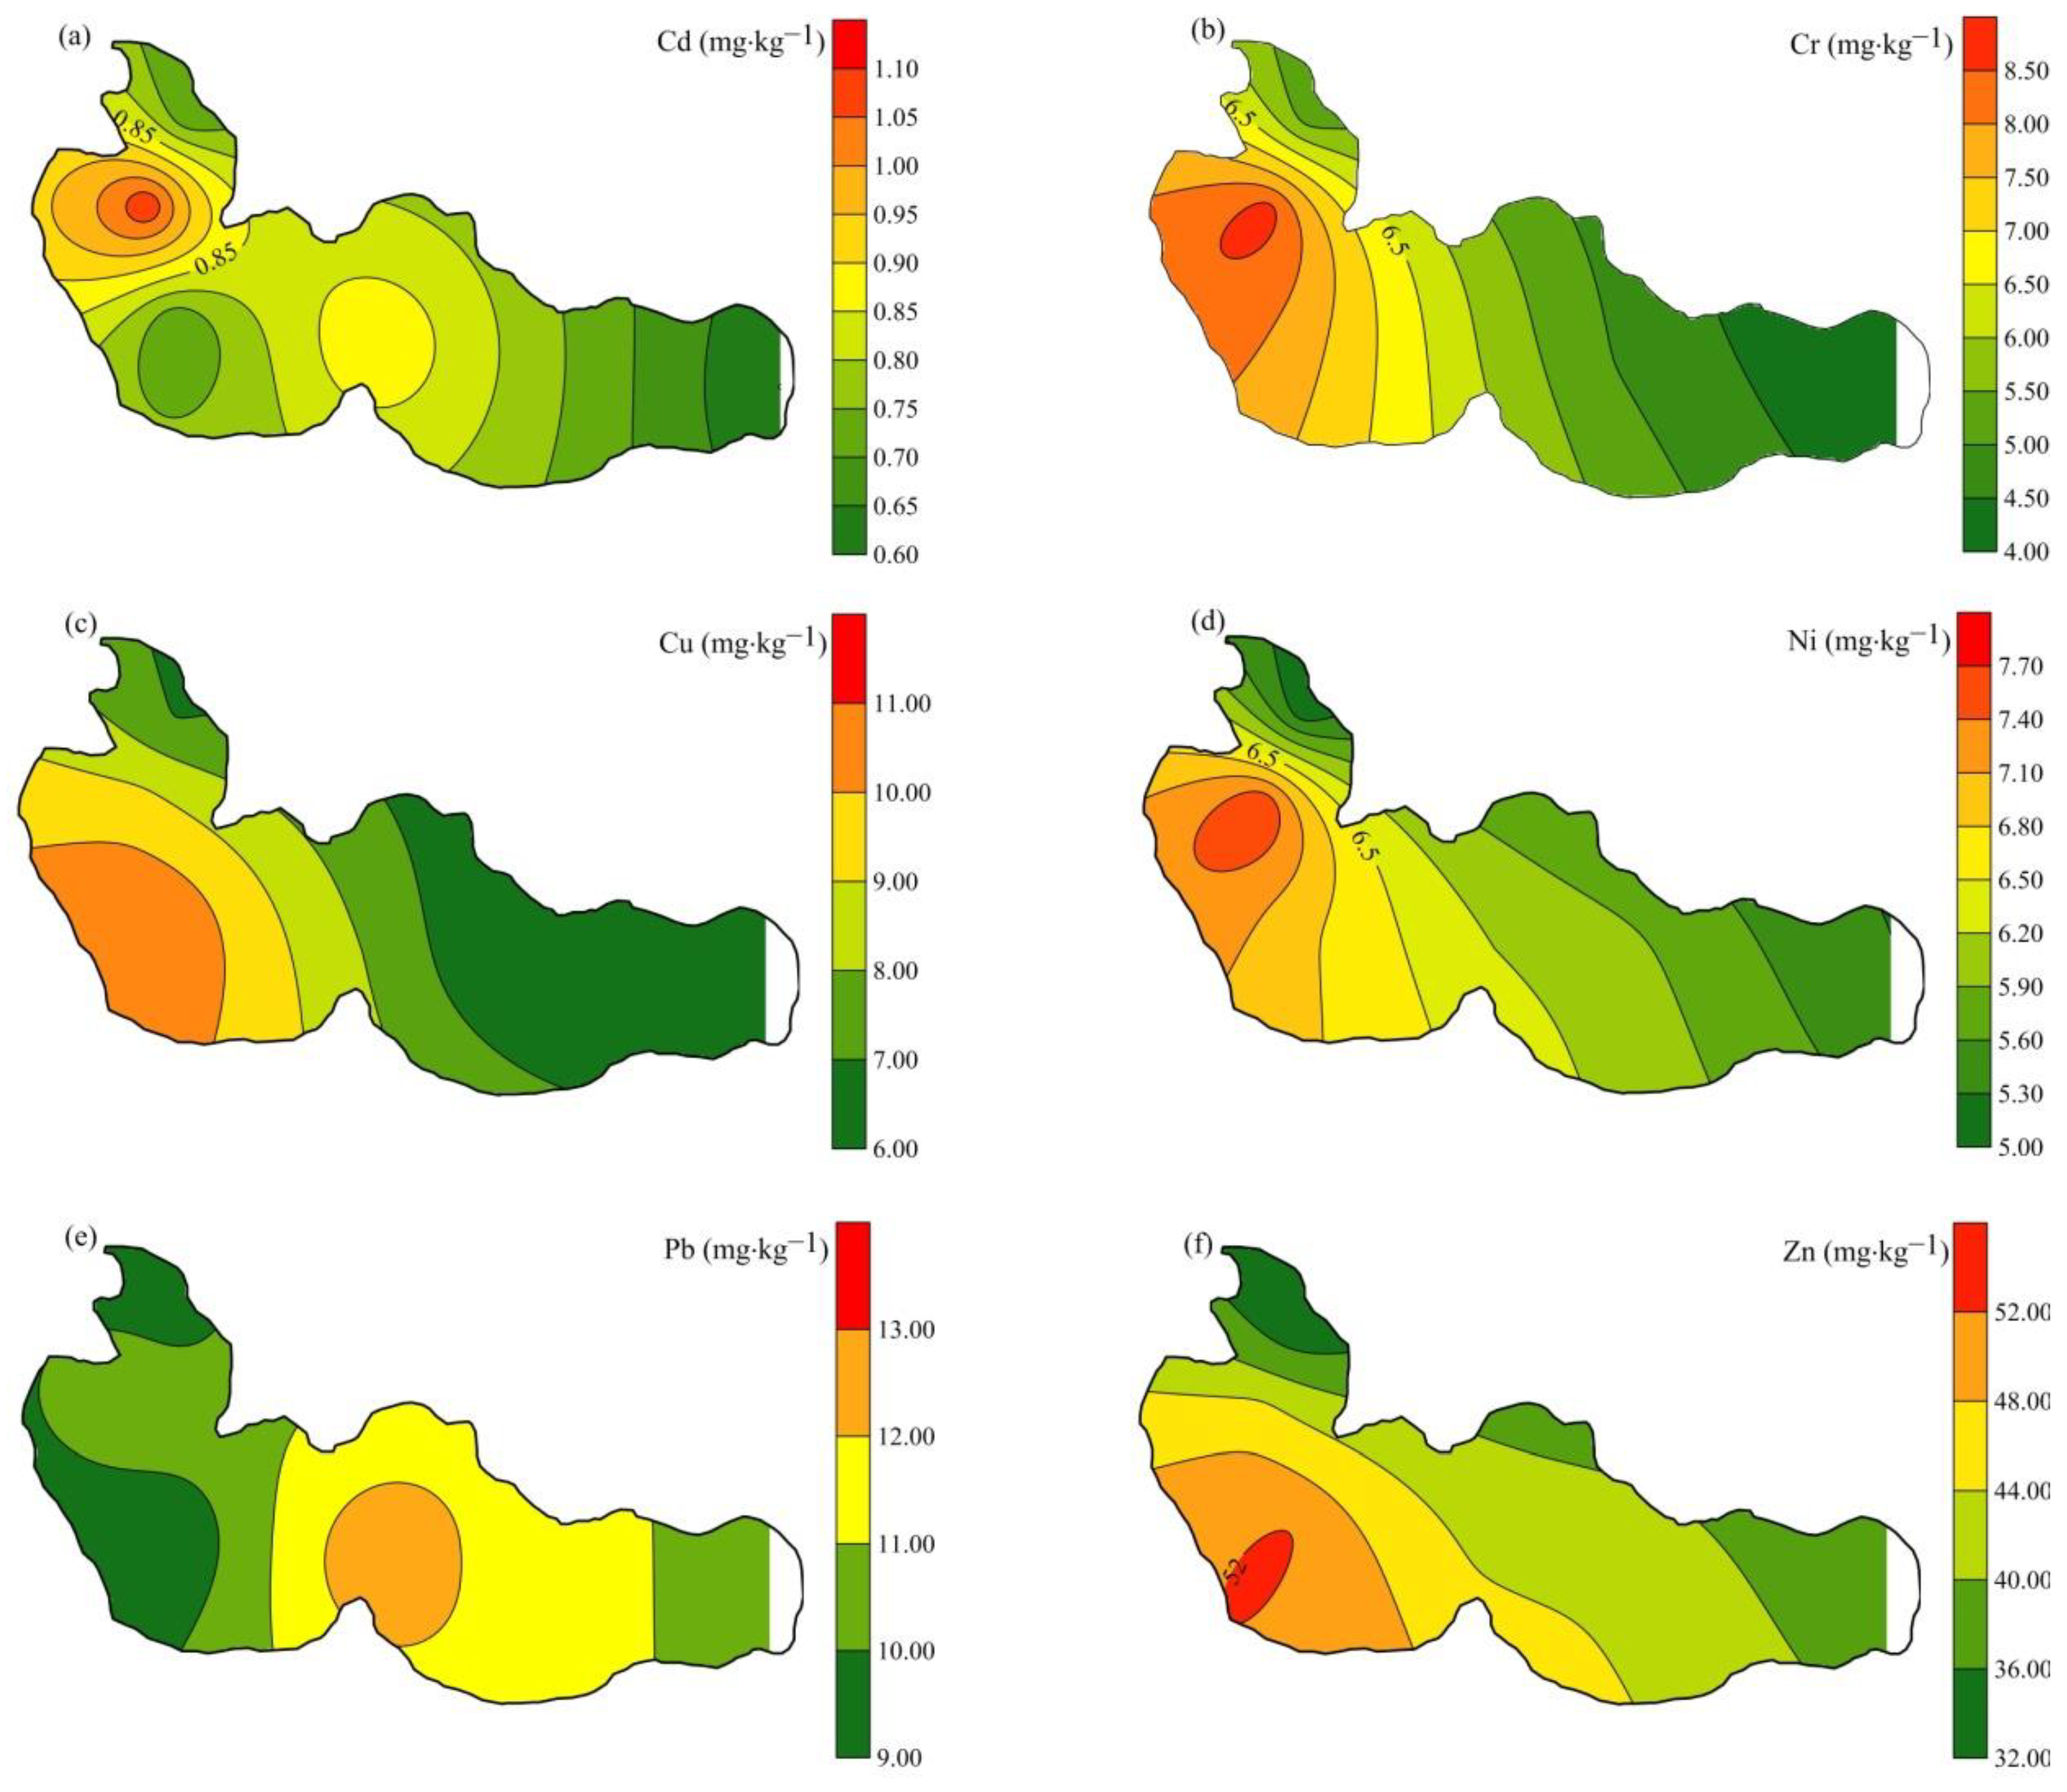
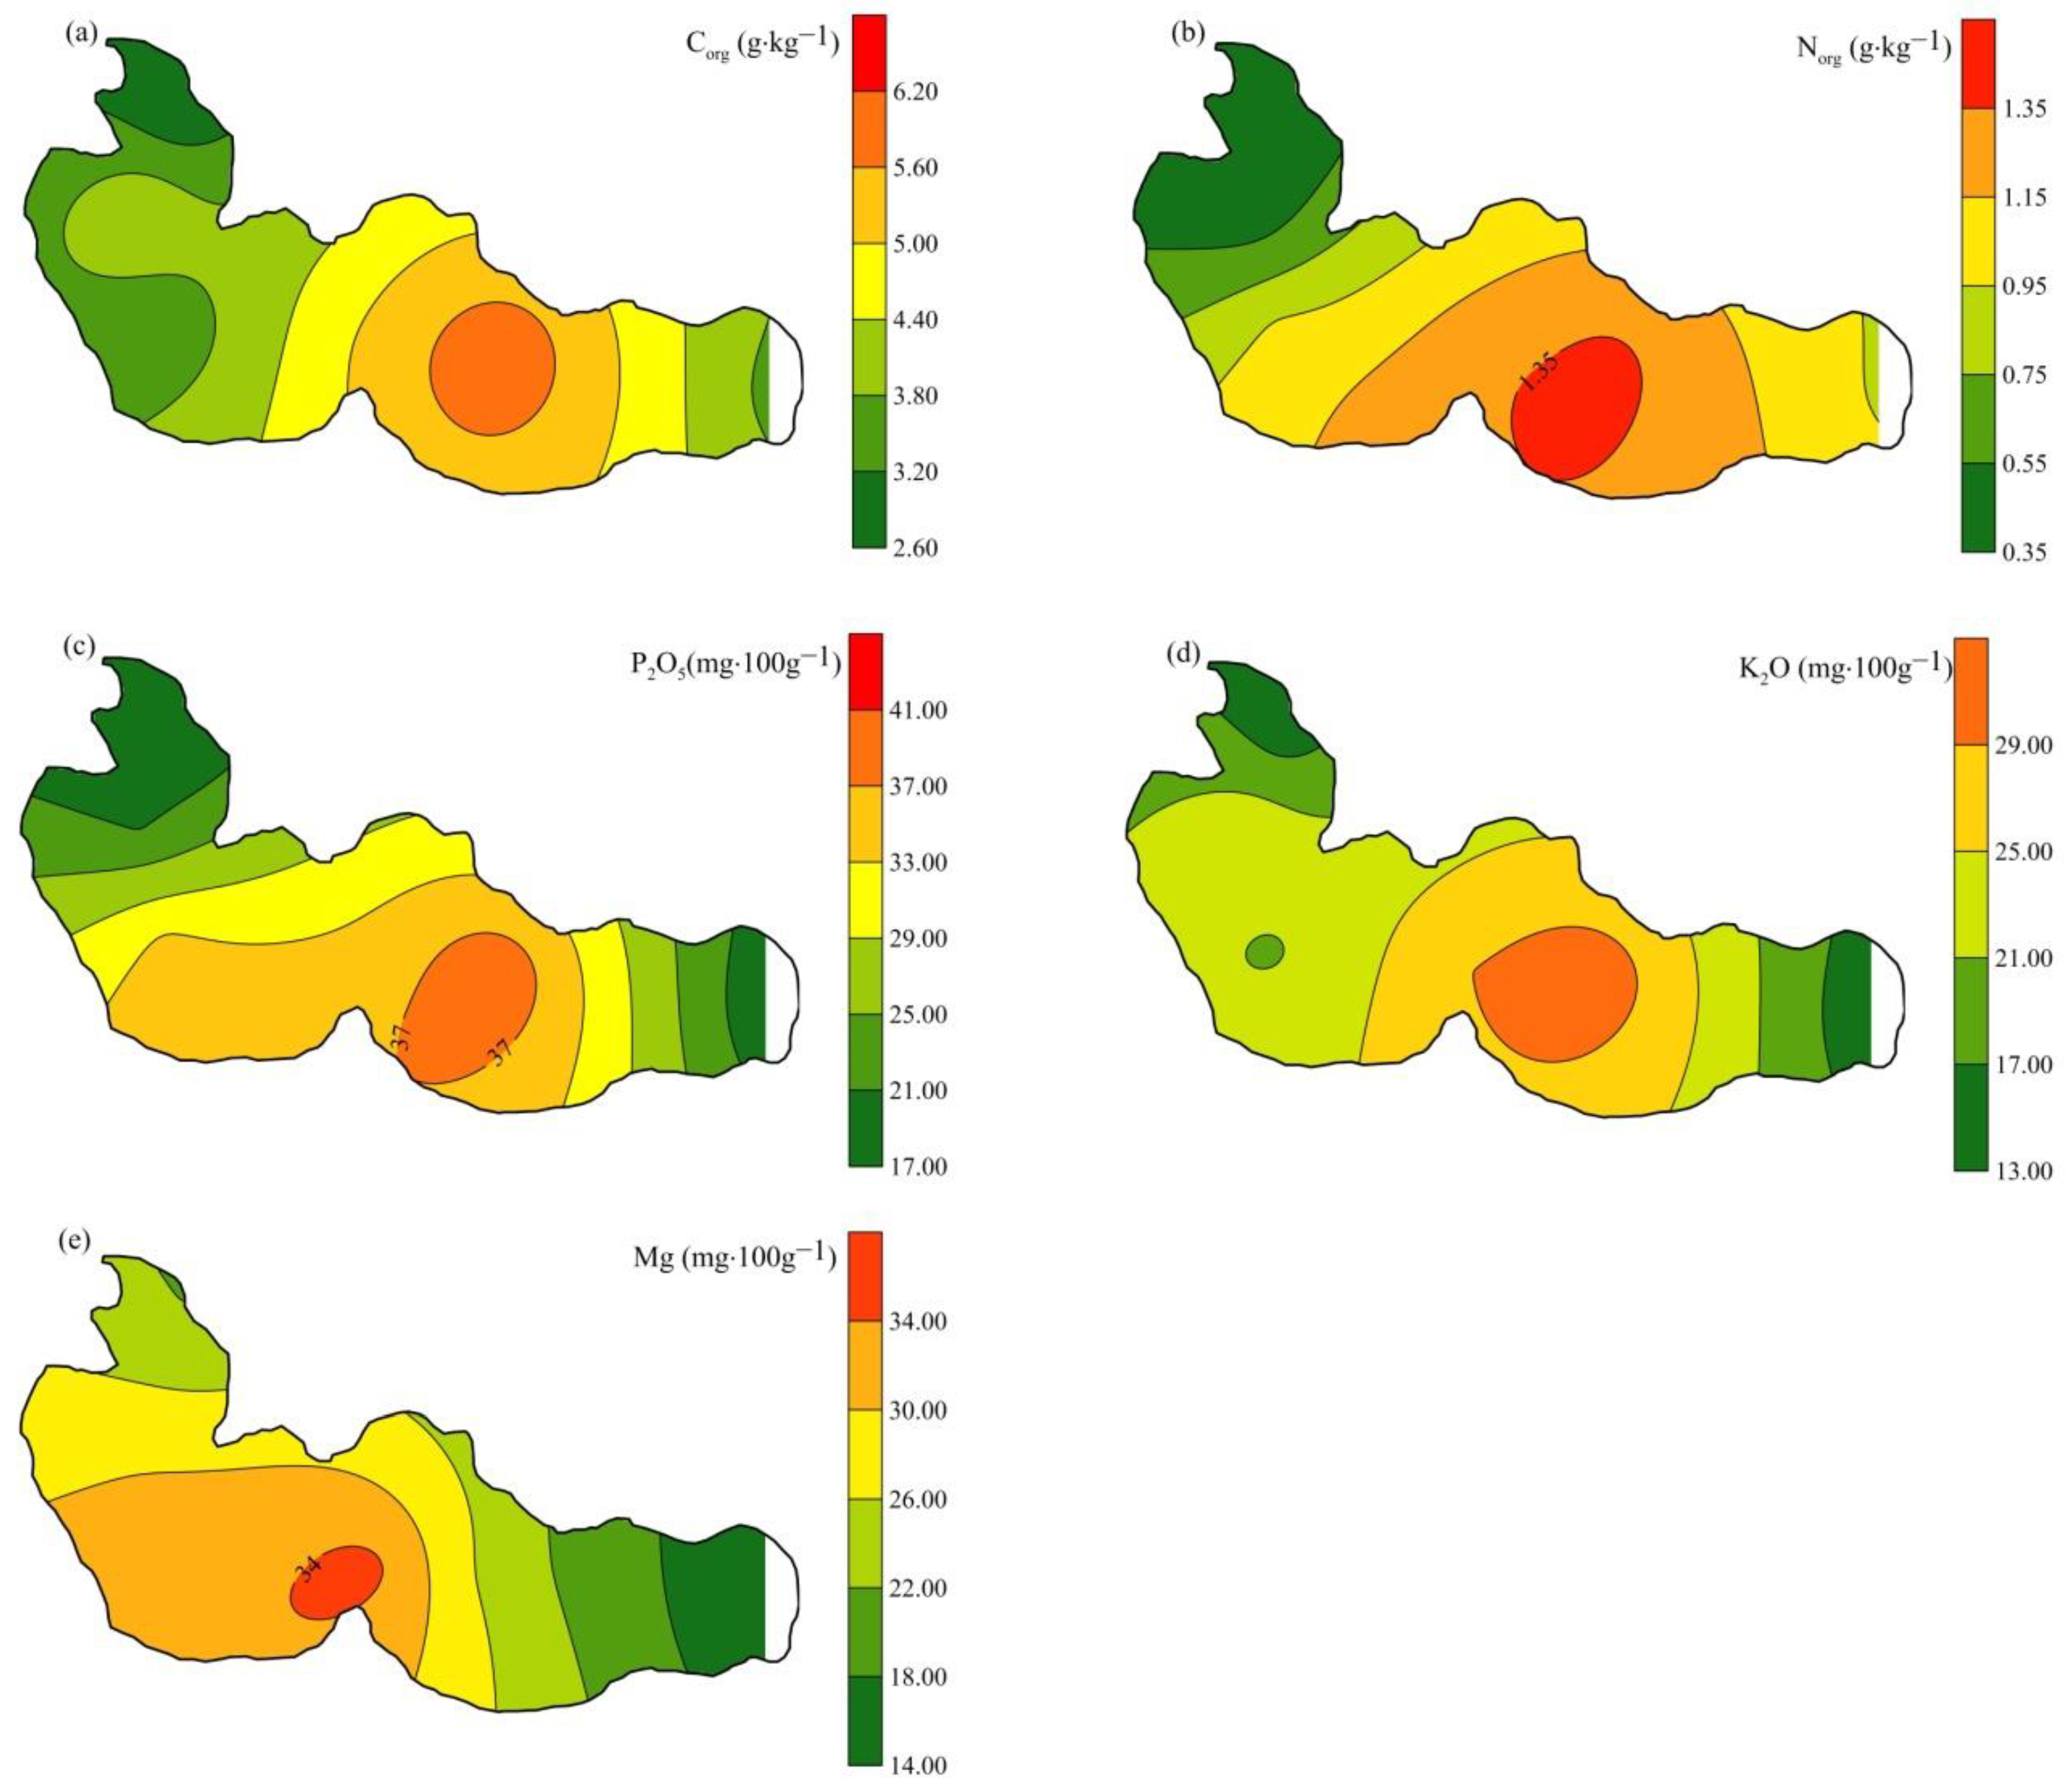
3.3. Spatial Distributions of the Studied Sediment Characteristics

The spatial distributions of the analysed characteristics of bottom sediments are presented in Figure 3 and Figure 4. Analysis of the figure indicates different distributions of the analysed characteristics within the reservoir basin. Generally, the content of trace metals in sediments increased in accordance with the direction of flow, reaching its maximum value near the middle part of the reservoir in the case of Pb and in the lower part of the reservoir in the case of the other trace metals, then decreasing in the direction of the outflow. The highest contents of Cd, Cr and Ni were observed in sediment samples collected at site 2 (deepest part of the reservoir), while the lowest contents were found at site 6 for Cd and Cr and site 1 for Ni. In the cases of Cu and Zn, the highest concentrations were found at site 3 and the lowest at sites 5 (the upper part of the reservoir) and 1 (the lower part of the reservoir). A different distribution was observed in the case of Pb, with the highest concentration of this element being recorded at site 4 and the lowest at site 3. It should be noted that the differences in trace metal contents between the samples collected from the upper and lower parts of the reservoir were small and did not exceed 17% (except for Cr, for which the difference was 30%). The analysis of the coefficient of variation CV (the ratio of the standard deviation to the arithmetic mean) shows that the concentration of individual trace elements in reservoir sediments exhibits moderate variation. Calculated values of CV oscillate within the range of 13% for Pb to 30% for Cr. Differentiation in the content of individual trace metals in sediment is undoubtedly influenced by the different hydrodynamic conditions of water flow in the reservoir, as well as the intensity of the outflow from the reservoir’s direct catchment (the southern part of the catchment is mostly arable land). Phosphorus and compound fertilizers used in agriculture may in this case be a significant source of trace metals (Cd, Cu, Ni, Pb and Zn) in sediments [33].
The analysis of Figure 4 shows that the highest contents of Corg, Ntot, P2O5, K2O and Mg were observed in sediment samples from the middle part of the reservoir (site 5). On the other hand, the lowest values were observed in the lower—estuary—part of the reservoir (site 1) for Corg. and Ntot and in the upper part (site 6) for P2O5, K2O and Mg. The study conducted by Arifjanov et al. [34] has shown that the contents of P2O5 and K2O in sediments depends on their granulometric composition—with increasing grain diameter, the contents of P2O5 and K2O decrease. The conducted research does not confirm the existence of such a relationship (Table 8). Kaletova et al. [35], meanwhile, has reported that the highest contents of P2O5, K2O and organic matter were observed in the bottom sediments of a small water reservoir collected from its lower (outlet) part, while the lowest contents were present in sediments from its upper (inlet) part. The differences in the spatial distributions of the analysed characteristics in the analysed reservoir may be the result of hydraulic flow conditions—that is, in the downstream part of the Sołtmany reservoir, there is an inlet and a small island, which most likely results in the concentration of flow in the northern shore of the reservoir and the transport of fine sedimentary particles and organic matter out of the reservoir.

3.4. Statistics

Correlations between individual trace elements in sediments may be due to their geochemical relationships and also provide information about the sources and pathways of metals [5]. In Sołtmany Lake sediments, a significant correlation was found between Cu and Cr, Ni and Cr, and Zn and Ni contents, which may confirm their common origin from a single source(s). Many researchers have argued that the existence of a positive correlation between metal and organic carbon contents in sediments may indicate anthropogenic sources of this element [36]. Such a relationship was found to exist for Pb in the studied sediments. In addition, a strong positive correlation of this metal with sand content in the sediments was observed. A strong positive correlation was also found between Ni, Zn and the content of clay fraction. Fine sedimentary fractions are characterised by high metal sorption capacity [37] and may flow into the reservoir along with surface runoff from adjacent agricultural fields. However, there are no statistically significant relationships between trace elements and Ntot, P2O5, K2O and Mg. The results in Table 8 also show that metal concentrations in the sediments were not significantly correlated with pH, which confirms the results of other researchers [38].

3.5. Assessment of Sediment Contamination

Selected criteria were used to assess the degree of trace metal contamination of sediments: (a) comparison of values with the geochemical background; (b) geochemical classes of sediment purity, according to Bojakowska (2001) [20]; (c) classification according to Igeo; and (d) comparison with TEC and PEC values. Comparison of mean trace metal values in bottom sediments with the geochemical background showed that all mean metal concentrations contained in the bottom sediments of Sołtmany Lake were above the background levels, except for Zn. Mean metal concentrations above the geochemical background level were ranked in the order: Cu > Ni > Cr > Pb > Cd. Lettuce et al. reported that elevated Cu concentrations may be related to the nature of the immediate catchment (arable land—about 90%), and copper may be used in fertilizers and crop protection products [39]. The purity classification of the studied bottom sediments according to the criteria given by Bojakowska (2001) [20] is as follows: all bottom sediments collected from Sołtmany Lake can be classified as Class I in terms of the content of all tested trace metals, except Cd (Class II for three sampling sites: 2, 4 and 5).
Based on the maximum values of trace metals in the analysed samples, an assessment of the contamination of Sołtmany Lake sediments was carried out using the Igeo index. According to the classification presented in Table 3, the calculated Igeo values for Cd, Cr and Cu in the sediments belong to Class 1, which indicates that the sediments were “unpolluted to moderately polluted”. The Igeo values for Ni, Pb and Zn classified the sediments as “unpolluted” (contamination level 0).
The determination of metal contamination in bottom sediments can be made using the method of numerical indicators of sediment quality TEC and PEC. The concentration of metals in sediment samples was compared with TEC and PEC values (Table 5). The results indicated that the TEC value was exceeded only for Cd (17% of the samples), while the PEC value was not exceeded in any case.

4. Discussion

Many authors use geochemical criteria to assess the degree of contamination of bottom sediments with metals in relation to the geochemical background, i.e., the content of elements occurring in sediments under natural conditions (Igeo, geoaccumulation index) [14,23,39], geochemical classes of sediment purity according to Bojakowska 2001 [20]), and ecotoxicological criteria using the methods of numerical indicators of sediment quality, TEC and PEC [5,22]. A comparison of the present data with those for other lakes from Poland and the world is shown in Table 9.
The content of trace metals in bottom sediments is an individual characteristic of reservoirs. Analysis of the geoaccumulation index (Igeo), accumulation coefficient and pollutant loading index (PLI) of sediments collected from Lubianka reservoir indicated that Cd, Cr, Cu, Ni and Pb in bottom sediments originate from geogenic sources—weathering of rock material—while Zn comes from anthropogenic sources (sewage management). Analysis has shown that areas adjacent to reservoirs can affect the distribution of trace metals, and Ni concentrations can additionally be affected by traffic [43].
Studies [5,15] show that the highest concentrations of trace metals in samples collected from dam reservoirs are observed at the reservoir inlets and near the dams. The highest concentrations of Ni, Cd, Zn and Cr in bottom sediments were found in the upper part of Lubianka reservoir, those of Fe in the middle part and those of Cu, Hg, Pb and Mn in the lower part of the reservoir [43]. The conducted research does not confirm this thesis. The contents of trace metals in samples collected from the selected sites are similar.
Studies of lake sediments in Poland are conducted under the supervision of the Chief Inspectorate of Environmental Protection within the State Monitoring of Environment subsystem Water Quality Monitoring. The analyses include, among others, assessment of the status and trends of changes in the quality of individual environmental elements, including bottom sediments, based on established criteria.
Table 10 shows the comparison of parameters of selected Warmian-Masurian Province lakes (Giżycko district) with those of Sołtmany Lake (Table 10) [44].
Evaluation of the quality of sediments collected from lakes according to the ecotoxicological criterion enables assessment of the impact of contaminated sediments on aquatic organisms [22]. For the assessment, one of the assumptions made was that concentrations of materials in sediments exceeding the limits set for level 3 warranted the classification of a water body as heavily polluted. The final assessment of a sediment sample was that purity class is equal to the level of the indicator with the least favorable assessment, the so-called degrading factor—in this case, manganese. However, given that this element occurs naturally in nature, it is therefore not certain whether the indicated exceedances have an anthropogenic background or are related to geological structure [45]. In 2015, the Provincial Inspectorate of Environmental Protection in Olsztyn conducted research on the classification of the ecological status of Sołtmany Lake based on biological and physicochemical elements. It was then determined to have poor ecological status (water quality class IV) due to the presence of phytoplankton and good chemical status. The condition of Sołtmany Lake was determined as bad [25]. In turn, the research carried out in 2008 by the aforementioned Inspectorate showed the reservoir to have Class II purity. In the surface layer in summer, COD-Cr corresponded to Class II standards, while BOD5 corresponded to Class I, with the values 25.5 mg O2/L and 2.0 mgO2/L, respectively. The biogenic compounds were dominated by total phosphorus (0.392 mgP/L, Class III) and ammonium nitrogen (2.15 mgN/L). The value of mineral nitrogen in the surface layer was also high (0.63 mgN/L, Class III). The out-of-class specific electrolytic conductivity value confirmed high mineral abundance in the lake [46].

5. Conclusions

The results of the conducted analyses showed that Sołtmany Lake is not polluted with trace metals. The mean concentrations of all metals in the sediments of the study area were higher than the geochemical background levels (except for Zn). Analysis of the contamination scale of bottom sediments using geochemical and ecotoxicological indices showed that bottom sediments collected from Sołtmany Lake can be classified as Class I in terms of the content of all investigated trace metals, except for Cd (Class II for three sampling sites: 2, 4 and 5). After calculating the Igeo index, it was found that the sediments belonged to Class 0 (unpolluted) and Class 1 (unpolluted to moderately polluted). The analyses showed that trace element concentrations in the lake sediments increased in the following series: Zn > Pb > Cu > Ni > Cr > Cd. The mean concentrations of Zn, Pb, Cu, Ni, Cr and Cd were: 42.2, 10.8, 8.0, 6.2, 6.1 and 0.8 mg·kg−1, respectively. The pH of sediments was mostly weakly acidic or on the verge of neutral (range: 6.5–7.1). The average values of Corg., Ntot., P2O5, K2O and Mg were 4.2 g·kg−1, 0.9 g·kg−1, 27.3, 22.2 and 26.0 mg·100 g−1, respectively. The results for the samples collected from both the near shore and the central part of the lake did not indicate that human activities have had a significant impact on the quality of reservoir bottom sediments. Assessment of lake sediment quality can be useful in developing strategic sediment management programs and policies.

Author Contributions

Conceptualization, A.Ś.; methodology, A.Ś.; software, A.Ś., I.T.-W. and Ł.B.; validation, A.Ś., I.T.-W. and Ł.B.; formal analysis, A.Ś., I.T.-W. and Ł.B.; investigation, A.Ś., I.T.-W. and Ł.B.; resources, A.Ś., I.T.-W. and Ł.B.; data curation, A.Ś., I.T.-W. and Ł.B.; writing—original draft preparation, A.Ś., I.T.-W. and Ł.B.; writing—review and editing, A.Ś., I.T.-W. and Ł.B.; visualization, A.Ś., I.T.-W. and Ł.B.; supervision, A.Ś., I.T.-W. and Ł.B.; project administration, A.Ś., I.T.-W. and Ł.B.; funding acquisition, A.Ś., I.T.-W. and Ł.B. All authors have read and agreed to the published version of the manuscript.

Funding

This research was funded by Jan Kochanowski University under grant number SUPD.RN.22.022 and SUPB.RN.21.252, and the Kielce University of Technology under grant number 05.0.12.00/1.02.001/SUBB.IKGT.22.001.

Institutional Review Board Statement

No applicable.

Informed Consent Statement

No applicable.

Data Availability Statement

Not applicable.

Conflicts of Interest

The authors declare no conflict of interest.

References

  1. Bojakowska, I.; Sokołowska, G. Geochemiczne klasy czystości osadów wodnych [Geochemical sediments quality classes]. Przegląd Geol./Geol. Rev. 1998, 46, 49–54. [Google Scholar]
  2. Kasperek, R.; Wiatkowski, M. Bottom studies of Mściwojów reservoir. Sci. Rev. Eng. Environ. Sci. 2008, 17, 194–201. [Google Scholar]
  3. Palma, P.; Ledo, L.; Alvarenga, P. Assessment of trace element pollution and its environmental risk to freshwater sediments influenced by anthropogenic contributions: The case study of Alqueva reservoir (Guadiana Basin). Catena 2015, 128, 174–184. [Google Scholar] [CrossRef] [Green Version]
  4. Świercz, A.; Smorzewska, E. Assessment of the long-term anthropogenic impact on the degree of heavy metal contamination of organic alluvia deposited in the area of the Białogoński pond. Carpathian J. Earth Environ. Sci. 2015, 10, 49–56. [Google Scholar]
  5. Baran, A.; Tarnawski, M.; Koniarz, T. Spatial distribution of trace elements and ecotoxicity of bottom sediments in Rybnik reservoir, Silesian-Poland. Environ. Sci. Pollut. Res. 2016, 23, 17255–17268. [Google Scholar] [CrossRef] [Green Version]
  6. Kuriata-Potasznik, A.; Szymczyk, S.; Skwierawski, A.; Glińska-Lewczuk, K.; Cymes, I. Heavy Metal Contamination in the Surface Layer of Bottom Sediments in a Flow-Through Lake: A Case Study of Lake Symsar in Northern Poland. Water 2016, 8, 358. [Google Scholar] [CrossRef] [Green Version]
  7. Lee, P.K.; Kang, M.J.; Yu, S.; Ko, K.S.; Ha, K.; Shin, S.C.; Park, J.H. Enrichment and geochemical mobility of heavy metals in bottom sediment of the Hoedong reservoir, Korea and their source apportionment. Chemosphere 2017, 184, 74–85. [Google Scholar] [CrossRef]
  8. Barut, I.F.; Ergin, M.; Meriç, E.; Avs¸ar, N.; Nazik, A.; Suner, F. Contribution of natural and anthropogenic effects in the Iznik Lake bottom sediment: Geochemical and microfauna assemblages evidence. Quat. Int. 2018, 486, 129–142. [Google Scholar] [CrossRef]
  9. Algül, F.; Beyhan, M. Concentrations and sources of heavy metals in shallow sediments in Lake Bafa, Turkey. Sci. Rep. 2020, 10, 11782. [Google Scholar] [CrossRef]
  10. Kalicki, T.; Kozłowski, R.; Przepióra, P.; Szwed, M. The geochemical diversity of lacustrine sediments of the Suchedniów water reservoir (Świętokrzyskie voivodeship, Poland)-preliminary results. Acta Geobalcanica 2021, 7, 159–165. [Google Scholar] [CrossRef]
  11. Tomczyk-Wydrych, I.; Świercz, A. Methods of management of bottom sediments from selected water reservoirs: A literature review. Geologos 2021, 27, 127–134. [Google Scholar] [CrossRef]
  12. Kaniecki, A. Hydrologia Obszarów Lądowych; Wydawnictwo Naukowe UAM: Poznań, Poland, 2018. [Google Scholar]
  13. Przybylska, J.; Kaleta, J.; Kozłowski, R. Impact of Cedzyna Reservoir on Selected Physicochemical Parameters of River Water Quality (Swietokrzyskie Mountains, Poland). Chem.-Didact.-Ecol.-Metrol. 2019, 24, 117–125. [Google Scholar] [CrossRef] [Green Version]
  14. Kulbat, E.; Sokołowska, A. Methods of Assessment of Metal Contamination in Bottom Sediments (Case Study: Straszyn Lake, Poland). Arch. Environ. Contam. Toxicol. 2019, 77, 605–618. [Google Scholar] [CrossRef] [PubMed] [Green Version]
  15. Sojka, M.; Jaskuła, J.; Siepak, M. Heavy Metals in Bottom Sediments of Reservoirs in the Lowland Area of Western Poland: Concentrations, Distribution, Sources and Ecological Risk. Water 2019, 11, 56. [Google Scholar] [CrossRef] [Green Version]
  16. Cabral, J.B.P.; Nogueira, P.F.; Becegato, V.A.; Becegato, V.R.; Paulino, A.T. Environmental Assessment and Toxic Metal-Contamination Level in Surface Sediment of a Water Reser-voir in the Brazilian Cerrado. Water 2021, 13, 1044. [Google Scholar] [CrossRef]
  17. Skordas, K.; Kelepertzis, E.; Kosmidis, D.; Panagiotaki, P.; Vafidis, D. Assessment of nutrients and heavy metals in the surface sediments of the artificially lake water reservoir Karla, Thessaly, Greece. Environ. Earth Sci. 2015, 73, 4483–4493. [Google Scholar] [CrossRef]
  18. Liu, P.; Zheng, C.; Wen, M.; Luo, X.; Wu, Z.; Liu, Y.; Chai, S.; Huang, L. Ecological Risk Assessment and Contamination History of Heavy Metals in the Sediments of Chagan Lake, Northeast China. Water 2021, 13, 894. [Google Scholar] [CrossRef]
  19. Zhao, S.; Li, Y.; Liu, D.; Li, B.; Xiao, H.; Cheng, W.; Li, A.; Chong, J. Spatial distribution, ecological risk assessment and source identification for nutrients and heavy metals in surface sediments from Tangxun Lake, Wuhan, Central China. Nat. Environ. Pollut. Technol. 2016, 15, 1417–1425. [Google Scholar]
  20. Bojakowska, I. Criteria for evaluation of water sediments pollution. Pol. Geol. Rev. 2001, 49, 213–219. [Google Scholar]
  21. Gałuszka, A.; Migaszewski, D.M.; Zalasiewicz, J. Assessing the An-thropocene with geochemical methods. Geol. Soc. Spec. Publ. 2014, 395, 221–238. [Google Scholar] [CrossRef]
  22. MacDonald, D.; Ingersoll, C.; Berger, T. Development and Evaluation of Consensus-Based Sediment Quality Guidelines for Freshwater Ecosystems. Arch. Environ. Contam. Toxicol. 2000, 39, 20–31. [Google Scholar] [CrossRef] [PubMed]
  23. Müller, G. Index of geoaccumulation in sediments of the Rhine River. GeoJournal 1969, 2, 108–118. [Google Scholar]
  24. Choiński, A.; Jezior Polski, K. Część Druga–Pojezierze Mazurskie; UAM: Poznań, Poland, 1991. [Google Scholar]
  25. Inspekcja Ochrony Środowiska. Wojewódzki Inspektorat Ochrony Środowiska w Olsztynie, Raport o Stanie Środowiska Województwa Warmińsko-Mazurskiego w 2015 Roku; Biblioteka Monitoringu Środowiska: Olsztyn, Poland, 2016.
  26. Aniszczyk, M. Objaśnienia do Mapy Hydrogeologicznej Polski w Skali 1:50,000, Arkusz Orłowo 0105; Państwowy Instytut Geologiczny Państwowy Instytut Badawczy: Warszawa, Poland, 2004.
  27. Kondracki, J. Geografia Regionalna Polski; Wydawnictwo Naukowe PWN: Warszawa, Poland, 2002. [Google Scholar]
  28. Pochocka-Szwarc, K.; Lisicki, S. Objaśnienia do Szczegółowej Mapy Geologicznej Polski, Arkusz Orłowo 105; Państwowy Instytut Geologiczny Państwowy Instytut Badawczy: Warszawa, Poland, 2015. (In Polish)
  29. Majewski, M.; Kostrzewski, A. Stan Geoekosystemów Polski w 2020 Roku na Podstawie Badań Zintegrowanego Monitoringu Środowiska Przyrodniczego; Zintegrowany Monitoring Środowiska Przyrodniczego: Poznań, Poland, 2021. (In Polish) [Google Scholar]
  30. PN-ISO 11261:2002; Jakość Gleby–Oznaczenie Azotu Ogólnego–Zmodyfikowana Metoda Kjeldahla. Polski Komitet Normalizacyjny: Warsaw, Poland. Available online: https://sklep.pkn.pl/pn-iso-11261-2002p.html (accessed on 20 June 2022).
  31. Karczewska, A.; Kabała, C. Metodyka Analiz Laboratoryjnych Gleb i Roślin; Uniwersytet Przyrodniczy we Wrocławiu: Wrocław, Poland, 2008. [Google Scholar]
  32. Kocel, K. Osady denne stawów jako wskaźnik zmian zaistniałych w środowisku przyrodniczym doliny Rudy. Scr. Rudensia 1997, 7, 75–84. (In Polish) [Google Scholar]
  33. Gimeno-García, E.; Andreu, V.; Boluda, R. Heavy metals incidence in the application of inorganic fertilizers and pesticides to rice farming soil. Environ. Pollut. 1996, 92, 19–25. [Google Scholar] [CrossRef]
  34. Arifjanova, A.; Samiev, L.; Akmalov, S. Dependence of fractional structure of river sediments on chemical composition. Int. J. Innov. Technol. Explor. Eng. 2019, 9, 2646–2649. [Google Scholar] [CrossRef]
  35. Kaletova, T.; Arifjanov, A.; Samiev, L.; Babajanov, F. Importance of river sediments in soil fertility. J. Water Land Dev. 2022, 52, 21–26. [Google Scholar] [CrossRef]
  36. Shaheen, S.M.; Rinklebe, J. Geochemical fractions of chromium, copper, and zinc and their vertical distribution in floodplain soil profiles along the Central Elbe. Geoderma 2014, 228–229, 142–159. [Google Scholar] [CrossRef]
  37. Bąk, Ł.; Górski, J.; Sałata, A.; Gawdzik, J.; Muszyńska, J.; Górska, K. Ecological risk assessment and spatial distribution of heavy metals in surface sediments. A case study of two small storage reservoirs, SE Poland. Desalination Water Treat. 2020, 186, 206–215. [Google Scholar] [CrossRef]
  38. Tarnawski, M.; Baran, A. Use of Chemical Indicators and Bioassays in Bottom Sediment Ecological Risk Assessment. Arch. Environ. Contam. Toxicol. 2018, 74, 395–407. [Google Scholar] [CrossRef] [Green Version]
  39. Sałata, A.; Bąk, Ł.; Chmielowski, K.; Rabajczyk, A. Metal pollution of sediments in small water reservoirs in the Kielce Highland (South Eastern Poland). Arch. Environ. Prot. 2019, 45, 12–21. [Google Scholar]
  40. Zieliński, A.; Choiński, A.; Machula, S.; Ławniczak, A.; Strzelczak, A. Chemistry of Bottom Sediments from Selected Karst Lakes in the Vicinity of Staszów (Nida Basin). Limnol. Rev. 2020, 20, 81–87. [Google Scholar] [CrossRef]
  41. Podlasińska, J.; Szydłowski, K. Charakterystyka stężeń wybranych metali ciężkich w osadach dennych jeziora Byszyno oraz określenie ich potencjalnego zagrożenia środowiskowego. Water Environ. Rural Areas 2017, 17, 85–99. [Google Scholar]
  42. Wang, Y.; Yang, L.; Kong, L.; Liu, E.; Wang, L.; Zhu, J. Spatial distribution, ecological risk assessment and source identification for heavy metals in surface sediments from Dongping Lake, Shandong, East China. Catena 2015, 125, 200–205. [Google Scholar] [CrossRef]
  43. Górski, J.; Bąk, Ł.; Szeląg, B. Jakość wody i osadów dennych zbiornika wodnego Lubianka w Starachowicach. Proc. ECOpole 2016, 10, 635–643. [Google Scholar] [CrossRef]
  44. Ośrodek Badań i Kontroli Środowiska. Monitoring Osadów Dennych Rzek i Jezior w Latach 2018–2019 Raport pt. In Stan Zanieczyszczenia Osadów Dennych Rzek i Jezior w 2018 Roku; Ośrodek Badań i Kontroli Środowiska: Katowice, Poland, 2019. [Google Scholar]
  45. Kabata-Pendias, A.; Pendias, H. Biogeochemistry of Trace Elements; PWN: Warszawa, Poland, 1999. (In Polish) [Google Scholar]
  46. Inspekcja Ochrony Środowiska. Wojewódzki Inspektorat Ochrony Środowiska w Olsztynie, Raport o Stanie Środowiska Województwa Warmińsko-Mazurskiego w 2008 roku; Biblioteka Monitoringu Środowiska: Olsztyn, Poland, 2009.
Figure 1. Location of Sołtmany Lake, with the locations of the sampling points.
Water 14 02045 g001
Figure 2. Contents of Corg. (g·kg−1), Ntot. (g·kg−1), P2O5 (mg·100 g−1), K2O (mg·100 g−1), Mg (mg·100 g−1) and trace metal concentration values (mg·kg−1) in bottom sediments collected from the selected locations (1–6).
Water 14 02045 g002
Figure 3. Spatial distributions of trace metal contents in bottom sediment samples from Sołtmany Lake.
Water 14 02045 g003
Figure 4. Spatial distribution of Corg., Ntot., P2O5, K2O and Mg contents in bottom sediment samples of Sołtmany Lake.
Water 14 02045 g004
Table 2. The measured and certified values of element/compound concentrations were compared.
ElementMeasured Value (mg·kg−1) ± SDCertified Value (mg·kg−1) ± SDRecovery (%)
Cd0.90 ± 0.201.0 ± 0.1599
Cr0.61 ± 0.400.70 ± 0.30102
Cu8.20 ± 0.408.90 ± 0.20105
Ni6.20 ± 0.507.40 ± 0.15108
Pb10.60 ± 0.909.90 ± 0.40115
Zn42.23 ± 0.7040.41 ± 0.3098
Table 3. Classification of bottom sediments according to the geoaccumulation index (Igeo).
Igeo ValueClassPollution Degree
<00Unpolluted
0–11Unpolluted to moderately polluted
1–22Moderately polluted
2–33Moderately to highly polluted
3–44Highly polluted
4–55Highly to very highly polluted
>56Very highly polluted
Table 4. Geochemical classification of sediment quality, according to Bojakowska (2001) [20].
ParametersCdCrCuNiPbZn
Geochemical quality classes (mg·kg−1d.w.)
Class I0.750201630125
Class II3.510010040100300
Class III6400300502001000
Class IV>6>400>300>50>200>1000
Table 5. TEC and PEC values for the studied trace elements.
ParametersCdCrCuNiPbZn
TEC0.9943.331.622.735.8121
PEC4.9811114948.6128459
Table 6. Granulometric composition determined by areometric method (% by weight).
Percentage Content of Fraction of Ø Diameter in mm
Sample No0.5–0.05
Sand
0.05–0.002
Silt
<0.002
Clay
170273
270246
3632710
4711811
574215
668275
Table 7. Chemical properties of bottom sediments.
Sample NoCorgNtotP2O5K2OMgpHCdCrCuNiPbZn
g·kg−1mg·100 g−1H2OKClmg·kg−1
12.70.417.515.222.26.96.80.75.26.95.19.732.2
24.30.420.624.128.46.76.51.18.79.57.710.845.9
33.41.034.120.532.17.16.90.77.810.96.99.052.3
45.21.334.729.135.16.96.70.95.87.96.212.943.2
56.11.440.231.224.17.17.00.84.96.16.011.642.9
63.50.916.412.913.96.96.70.64.06.85.310.536.9
Average4.20.927.322.226.06.96.80.86.18.06.210.842.2
Min2.70.416.412.913.96.76.50.64.06.15.19.032.2
Max6.11.440.231.235.17.17.01.18.710.97.712.952.3
SD1.30.410.37.47.60.20.20.21.81.81.01.47.0
Table 8. Spearman correlation coefficients between the studied variables.
CdCrCuNiPbZnSaClSiCorgNorgP2O5K2OMgpH
Cd1.000.670.290.670.640.460.57−0.770.470.580.070.550.750.64−0.39
Cr 1.000.890.83−0.090.77−0.17−0.150.58−0.09−0.290.200.260.71−0.31
Cu 1.000.71−0.370.77−0.550.150.64−0.37−0.32−0.03−0.090.66−0.19
Ni 1.000.140.94−0.12−0.330.750.310.060.370.430.71−0.15
Pb 1.00−0.030.84−0.940.320.890.490.540.710.31−0.22
Zn 1.00−0.26−0.210.810.200.200.430.370.770.12
Sa 1.00−0.83−0.060.750.470.640.780.140.00
Cl 1.00−0.49−0.88−0.59−0.76−0.88−0.580.07
Si 1.000.350.380.460.410.900.02
Corg 1.000.700.710.830.310.09
Ntot 1.000.810.670.380.72
P2O5 1.000.940.660.52
K2O 1.000.600.25
Mg 1.000.09
pH 1.00
Table 9. Literature data on the concentrations of heavy metals and assessments of the degree of contamination of lake sediments from Poland and other countries of the world.
Study AreaMain ConclusionReferences
Łajba Lake and Donica Lake, Świętokrzyskie Voivodeship, Poland Concentrations of selected heavy metals in bottom sediments of Łajba Lake: 0.9 mg·kg−1 for Cd, 35.8 mg·kg−1 for Cr, 24.3 mg·kg−1 for Cu, 25.3 mg·kg−1 for Ni, 73.6 mg·kg−1 for Pb, 128.0 mg·kg−1 for Zn; and Donica Lake: 0.6 mg·kg−1 for Cd, 45.5 mg·kg−1 for Cr, 8.9 mg·kg−1 for Cu, 14.7 mg·kg−1 for Ni, 35.6 mg·kg−1 for Pb, 115 mg·kg−1 for Zn.[40]
Straszyn Lake,
Pomeranian Voivodeship, Poland
The average concentrations of metals in sediments were: 0.72 µg/g for Cd, 148.2 µg/g for Cr, 17.08 µg/g for Cu, 15.56 µg/g for Ni, 21.73 µg/g for Pb, 55.19 µg/g for Zn.
The mean concentrations of metals exceeding background levels were found to have the order: Cr  >  Ni  >  Cu  >  Pb  >  Cd  >  Zn.
The values of Igeo for Zn and Cd in the sediments belonged to class 0 and 1; Igeo values for Cu, Pb and Ni were classified as levels 0–2; Igeo values for Cr were classified as level 5, except for the samples collected at the station S1 (Igeo = 0.87, level 1)
[14]
Byszyno Lake,
West Pomeranian Voivodship, Poland
In terms of contents, the heavy metals in bottom sediments were ranked as follows: Fe > Mn > Zn > Pb > Ni > Cu > Cr > Cd.
Medium enrichment of bottom sediments with heavy metals against the geochemical background decreased was as follows: Pb > Cr > Cu > Zn > Ni.
[41]
Karla Lake,
Greece
The average concentrations of metals in sediments were: 298.4 mg·kg−1 for Cr, 38.3 mg·kg−1 for Cu, 182.8 mg·kg−1 for Ni, 34.3 mg·kg−1 for Pb, 31.2 mg·kg−1 for Zn.
The concentrations of Cr and Ni were well above the corresponding PEC values in 100% of the samples. For Cu and Pb, almost half of the sediment samples exhibited loadings higher than the TEC levels but they were always substantially lower than the PEC values.
[17]
Chagan Lake, ChinaThe mean values of Igeo in the surface sediment were arranged in descending order as follows: Hg > Cd > Ni > Zn > Cr > Pb > Cu > As.[18]
Tangxun Lake, Wuhan, ChinaThe degree of enrichment of the heavy metals in sediments decreased in the order: Cd > As > Zn > Cu > Cr > Pb.
The values of Igeo for Zn and Cu in the sediments belonged to class 0, 1 and 2; Igeo values for Cd were classified as levels 1–3; Igeo values for Cr and Pb were classified as levels 0 and 1.
The degree of pollution exhibited the following order: Cd > As > Zn > Cu > Cr > Pb.
[19]
Dongping Lake,
Shandong Province, China
The enrichment degree of the studied metals decreased in the order of Cd > Hg > As > Pb > Cu > Cr > Zn, and the average concentrations of Cd, Hg and As were 3.70, 3.69 and 3.37 times their background values.[42]
Table 10. Parameters of selected lakes in Giżycko County with classification [44].
LakeCdCrCuNiPbZnMnAssessment of Sediment Contamination
According to Bojkowska and Sokołowska (2001) [20]
mg·kg−1d.w.
Sołtmany0.416.625.514.128.3101.02200Class II
Kruklin0.031.78.93.311.922.21500Class I
Gołdapiwo0.49.812.88.730.071.81800Class III
Jagodne0.815.29.411.437.283.7920Class II
Łękuk0.531.524.524.634.30.25420Class II
Publisher’s Note: MDPI stays neutral with regard to jurisdictional claims in published maps and institutional affiliations.

