
Application of Nanofiltration and Reverse Osmosis Membranes for Tannery Wastewater Reuse
by
 , and
, and
Vilma Fernández-Medrano
, 
Beatriz Cuartas-Uribe
*,
María-Amparo Bes-Piá
and
José-Antonio Mendoza-Roca
Instituto de Seguridad Industrial, Radiofísica y Medioambiental, Universitat Politècnica de València, 46022 València, Spain
*
Author to whom correspondence should be addressed.
Water 2022, 14(13), 2035; https://doi.org/10.3390/w14132035
Submission received: 12 May 2022
/
Revised: 21 June 2022
/
Accepted: 24 June 2022
/
Published: 25 June 2022
(This article belongs to the Special Issue Membrane Filtration for Water Reuse)
Abstract
:Tanneries produce large amounts of wastewater with high concentrations of suspended solids, organic matter, and salts. Treatment and reuse of these effluents are of great importance to preserve water resources and save costs. Although suspended solids and high percentages of organic matter can be eliminated by physico-chemical and biological processes, refractory chemical oxygen demand (COD) and salts will remain in the wastewater after these processes. In particular, chloride and sulphate ion concentrations may hinder the treated wastewater from being reused or even discharged according to legal standards. In this work, two nanofiltration membranes and two reverse osmosis membranes are tested to assess these technologies as regeneration processes for biologically treated tannery wastewater. Permeate flux and rejection of organic matter and ions were measured at different operating conditions (transmembrane pressure and cross-flow velocities) at both total recycle and concentration modes. Results showed that the difference between permeate fluxes of nanofiltration (NF) membranes and reverse osmosis (RO) membranes was very high. Thus, at 20 bar and 1.77 m·s−1, the permeate flux of the two tested NF membranes in the total recycle mode experiments were 106 and 67 L·m−2·h−1, while the obtained permeate fluxes for the RO membranes were 25 and 18 L·m−2·h−1. Concerning rejections, RO membranes rejected almost 100% of the salts, whereas NF membranes reduced their rejection when faced with increasing concentration factors (salt rejection between 50–60% at the highest concentration factor). In addition, the fouling of RO membranes was lower than that of NF membranes, recovering more than 90% of initial permeability by only water rinsing. In contrast, chemical cleaning was necessary to increase the permeability recovery of the NF membranes above 90%. The considerably lower rejections and the higher membrane fouling of the NF membranes lead us to conclude that reverse osmosis could be the most feasible technique for water reuse in the tannery industry, though the permeate fluxes are lower than those achieved with NF membranes.
1. Introduction
It is well known that tannery industries are characterised by high water consumption, which leads to the generation of high quantities of wastewater [1]. Therefore, the treatment and reuse of these effluents are of great importance to preserve water resources and save costs.
As in other industries, there are two strategies for water reuse: from effluents of some processes and from the global wastewaters. The first strategy has been studied widely in the last few years. Thus, the reuse of water and chemicals from the unhairing [1,2], deliming [3], pickling [4,5], and tanning processes [6] has been assessed in a significant number of works by different authors. All the authors used either membrane technologies or electrochemical processes for this purpose.
However, in most tanneries, the effluents from the different processes are not treated separately. Three types of wastewater can be distinguished in a tannery processing raw skins to produce finished leather. The first type is alkaline wastewater from previous processes to tanning. The second type corresponds to acidic wastewater from tanning operations, usually containing trivalent chromium (chromium is the most used tanning agent). The third type of wastewater includes the effluents from the finishing processes [7].
Researchers have mainly paid attention to the trivalent-chromium-containing wastewater due to its toxicity and, especially, to the risk of its oxidation into hexavalent chromium, the toxicity of which is much higher than that of Cr (III). For its removal, precipitation, adsorption [8], electrocoagulation [9], and membrane technologies [10] have been studied by different authors.
In many tanneries, alkaline wastewaters are subjected to an oxidation process to convert sulphide into sulphates to eliminate the risk of SH2 formation. After that, this stream is mixed with the acidic wastewaters and the effluents from the finishing operations. A physico-chemical treatment is performed for chromium separation and for suspended solids and COD reduction. Further biological treatment would maximise the elimination of the organic matter in the wastewater. For this, biological treatment techniques such as membrane bioreactors (MBRs) [11], MBRs combined with adsorption [12], and sequencing batch reactors (SBRs) [13,14,15] have been reported in the literature.
After biological treatment, a refractory COD remains in the treated wastewater. In addition, these biologically treated effluents are characterised by high conductivity due to sodium chloride and sulphate salts. Sodium chloride comes from hide preservation (transferred to the soaking effluent). The high content of sulphates is due to the use of sodium sulfphide (further oxidised to sulphate), sulphuric acid and chromium sulphate in the tannery process. In this way, tertiary treatment for salt removal is needed to reuse the water in the industry or even to discharge it into the sewers.
Since the objective is the separation of both refractory organic matter and salts, membrane technologies such as nanofiltration (NF) and reverse osmosis (RO) are the appropriate techniques to achieve it. These technologies are used for municipal wastewater reclamation when salt elimination is required. In the last few years, these techniques have been assessed for micropollutant elimination [16]. Hafiz et al. [17] compared NF and RO membranes to treat ultrafiltered municipal secondary effluent for its reuse in agriculture, selecting the RO process due to the quality of the permeate stream. The management of the reject streams is a crucial factor in implementing these techniques. The main alternatives have been described in the literature [18].
Unlike the secondary effluents of municipal wastewater treatment plants, tannery wastewater after biological treatment is characterised by higher COD and conductivity. Due to these characteristics, low-fouling membranes have to be applied. Reducing membrane fouling is a challenge that is being studied currently. Thus, some authors have achieved the improvement of the anti-fouling properties of PES membranes by their modification with different types of nanoparticles [19,20,21]. The fabrication or modification of commercial membranes, specifically for application to tanneries, will be of great importance in the near future. Few papers dealing with NF or RO applied to biologically treated tannery wastewater can be found in the literature. De Gisi et al. [22] applied RO membranes to tannery wastewater after biological treatment, removing only 67% of organic matter. Jang et al. [23] used a combination of adsorption, ultrafiltration and RO to clean biologically treated tannery wastewater. Concerning NF, this technique has been used to treat effluents from tanneries to separate chromium. There is still a gap in the literature related to the application of this technique to biologically treated tannery wastewater. In this work, NF and RO are compared to treat this effluent, which cannot be directly reused, as explained above. These processes will lead to permeates with enough quality to be reused in the industry. This study has been conducted with commercial membranes, labelled as low-fowling membranes.
2. Materials and Methods
NF and RO tests were performed with tannery wastewater subjected previously to biological treatment in a laboratory sequencing batch reactor (SBR).
2.1. SBR Effluent Characterisation
The main analysed parameters were chemical oxygen demand (COD), turbidity, pH, conductivity, suspended solids (SSs), total chromium, sulphates, chlorides, sodium, calcium, magnesium ions concentration, and toxicity. Total chromium concentration was measured with an atomic absorption spectrophotometer (Perkin–Elmer model Analyst 100). Sulphate, chloride, sodium, calcium and magnesium ions concentration and COD were determined with kits and a Spectroquant Nova 60 apparatus from Merck. Turbidity was measured with a D-112 apparatus from DINKO and conductivity and pH with CRISON instruments. Suspended solids were determined according to standard methods [24] and toxicity with Microtox M-500 (Microbics). Samples were analysed in duplicate.
Table 1 collects the characterisation of the two samples of tannery wastewater after treatment with the laboratory SBR, which was used in the tests with the membranes. One of the samples was used as a feed for the total recycle mode tests and the other one for the concentration mode tests. It can be observed that conductivity values were high, ranging between 7700 and 8500 μS·cm−1. The high values were mainly due to the sodium chloride concentration from the wastewaters of the soaking and pickling processes. COD values were 240 and 100 mg·L−1. These values are higher than the typical COD values for effluents from the secondary treatment of municipal wastewater treatment plants. The toxicity of the samples was negligible, which is in concordance with the absence of chromium. Moreover, the samples presented low values of turbidity, near 1 NTU.
2.2. Membrane Tests
The tested NF membranes were NF Duraslick (General Electric) and NF270 (Dow Chemical), and the tested RO membranes were RO Duraslick (General Electric) and RO-SWC3 (Hydranautics). Table 2 and Table 3 show the characteristics of the membranes. For all membranes, membrane compaction was performed at 20 bar for 1 h. After that, deionised water permeability coefficients were measured according to the Darcy equation (Equation (1)).
where A (L·h−1·m−2·bar−1) is the permeability coefficient, ΤΜP (bar) is the transmembrane pressure, and Δπ (bar) is the osmotic pressure difference between the feed and permeate streams.
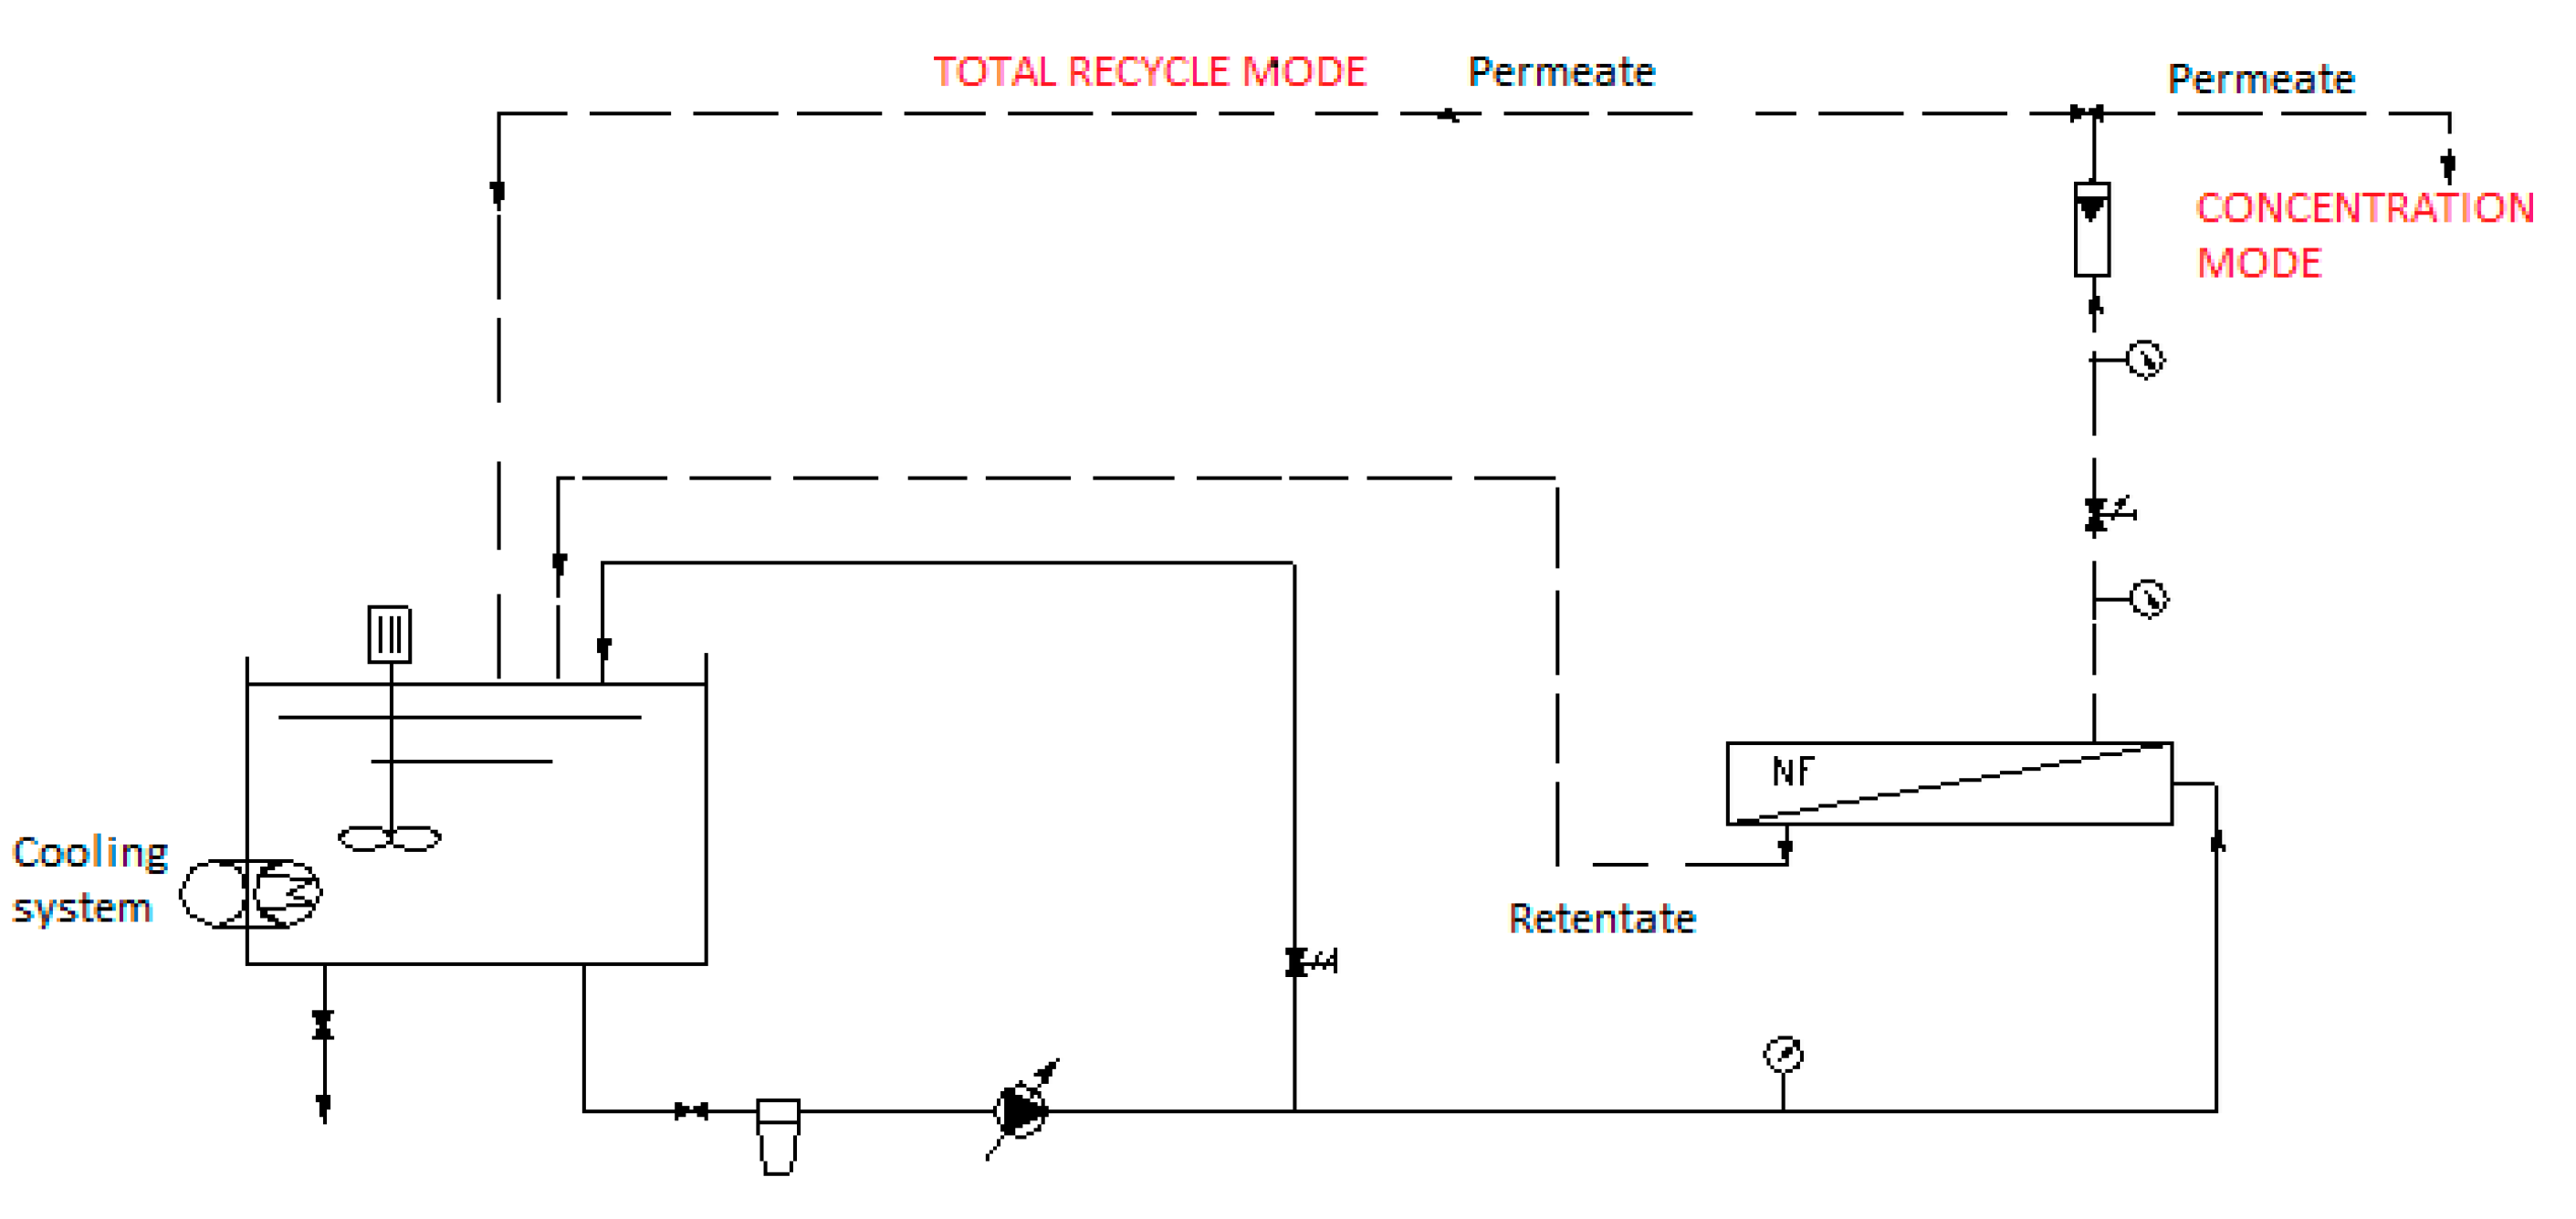
The membrane tests were performed in two operating modes (total recycle mode and concentration mode), as can be seen in Figure 1. In the total recycle mode, the feed volume concentration was constant (volume concentration factor, CF = 1), and the studied variables were transmembrane pressure (10, 15 and 20 bar) and cross-flow velocity (CFV) (0.89, 1.33 and 1.77 m·s−1, corresponding to feed flow rates of 200, 300 and 400 L·h−1, respectively). Tests were carried out with a flat sheet membrane module with a total active surface of 31 cm2. In the concentration mode, different CFs were studied at 20 bar with an initial feed volume of 35 L. For these tests, the same membranes were tested but with a spiral wound membrane configuration with a total active surface of 2.2 and 2.6 m2 for NF and RO membranes, respectively. The feed flow rate was 300 L·h−1, and the temperature was kept constant at 20 °C with a cooling system.
The effects of TMP and CFV on permeate flux (JP) and COD, total dissolved solids (TDSs) and ion (Cl−, Na+, Ca2+, Mg+2, SO42−, Cr3+) rejection were determined. Permeate flux (JP) was calculated according to (Equation (2)):
where QP (L·h−1) is the flow rate of the permeate stream (the volume collected during a certain time), and Am (m2) is the active surface of the membrane.
Rejection was calculated according to (Equation (3))
where C is the salt concentration or the concentration of a particular ion in the feed (F) or permeate (P) stream.
The influence of TMP and CFV on permeate flux and salt retention was assessed statistically with Statgraphics Centurion XVIII software. Firstly, a factorial experimental design considering TMP and CFV as factors and salt rejection and permeate flux as response variables was carried out. In order to determine the optimal operating conditions, a response surface analysis was performed. Analysis of variance was used to study the effects of each factor on the response variables. Finally, the relation between factors and variables was determined with multiple regression.
2.3. Membrane Cleaning
A cleaning procedure was applied to recover membrane permeability at the end of each experiment (total recycle and concentration modes). It consisted of a membrane rinse with deionised water for 40 min at a high feed flow rate to remove the reversible fouling. No TMP was applied to avoid pushing the foulants into the membrane pores and causing membrane clogging. After this stage, an additional chemical cleaning was carried out if the initial permeability was not recovered. The chemical cleaning procedure started with the application of a sodium hydroxide solution (pH 10) for 20 min. In the next step, a rinse stage with deionised water was performed until the rejection stream had the same pH as the feed stream (deionised water). After that, the initial permeability was measured again to check whether the recovery was accomplished.
It has to be remarked that after each cleaning step, the permeate flux (Ji) was determined again to check the membrane fouling state in comparison with the initial permeate flux (J0). In this way, the recovery flux parameter was calculated (Equation (4)).
The images of new and cleaned membranes were obtained with an atomic force microscope from Digital Instruments Nanoscope IIIA (Santa Barbara, CA, USA) and a scanning electronic microscopic (SEM) JSM6300 from JEOL (Musashino, Akishima, Tokyo, Japan). For the images, the membrane surface for the analysis was 2 × 2 cm2.
3. Results
3.1. Membrane Permeability
The hydraulic permeability coefficient (A) was obtained with Equation (1), as explained in the Material and Methods section (Section 2.2). For the membranes NF270 and NF Duraslick, the values obtained were 10.25 and 9.45 L·h−1·m−2·bar−1, respectively. For RO membranes, the A values were significantly lower, as expected (2.10 L·h−1·m−2·bar−1 for RO Duraslick and 1.05 L·h−1·m−2·bar−1 for SWC3). The variation between A values in RO membranes is in concordance with the kind of membrane since SWC3 is specifically for treating seawater while the RO Duraslick is used for brackish water.
3.2. Membrane Tests
3.2.1. Total Recycle Mode
- Influence of CFV and TMP on Permeate Flux
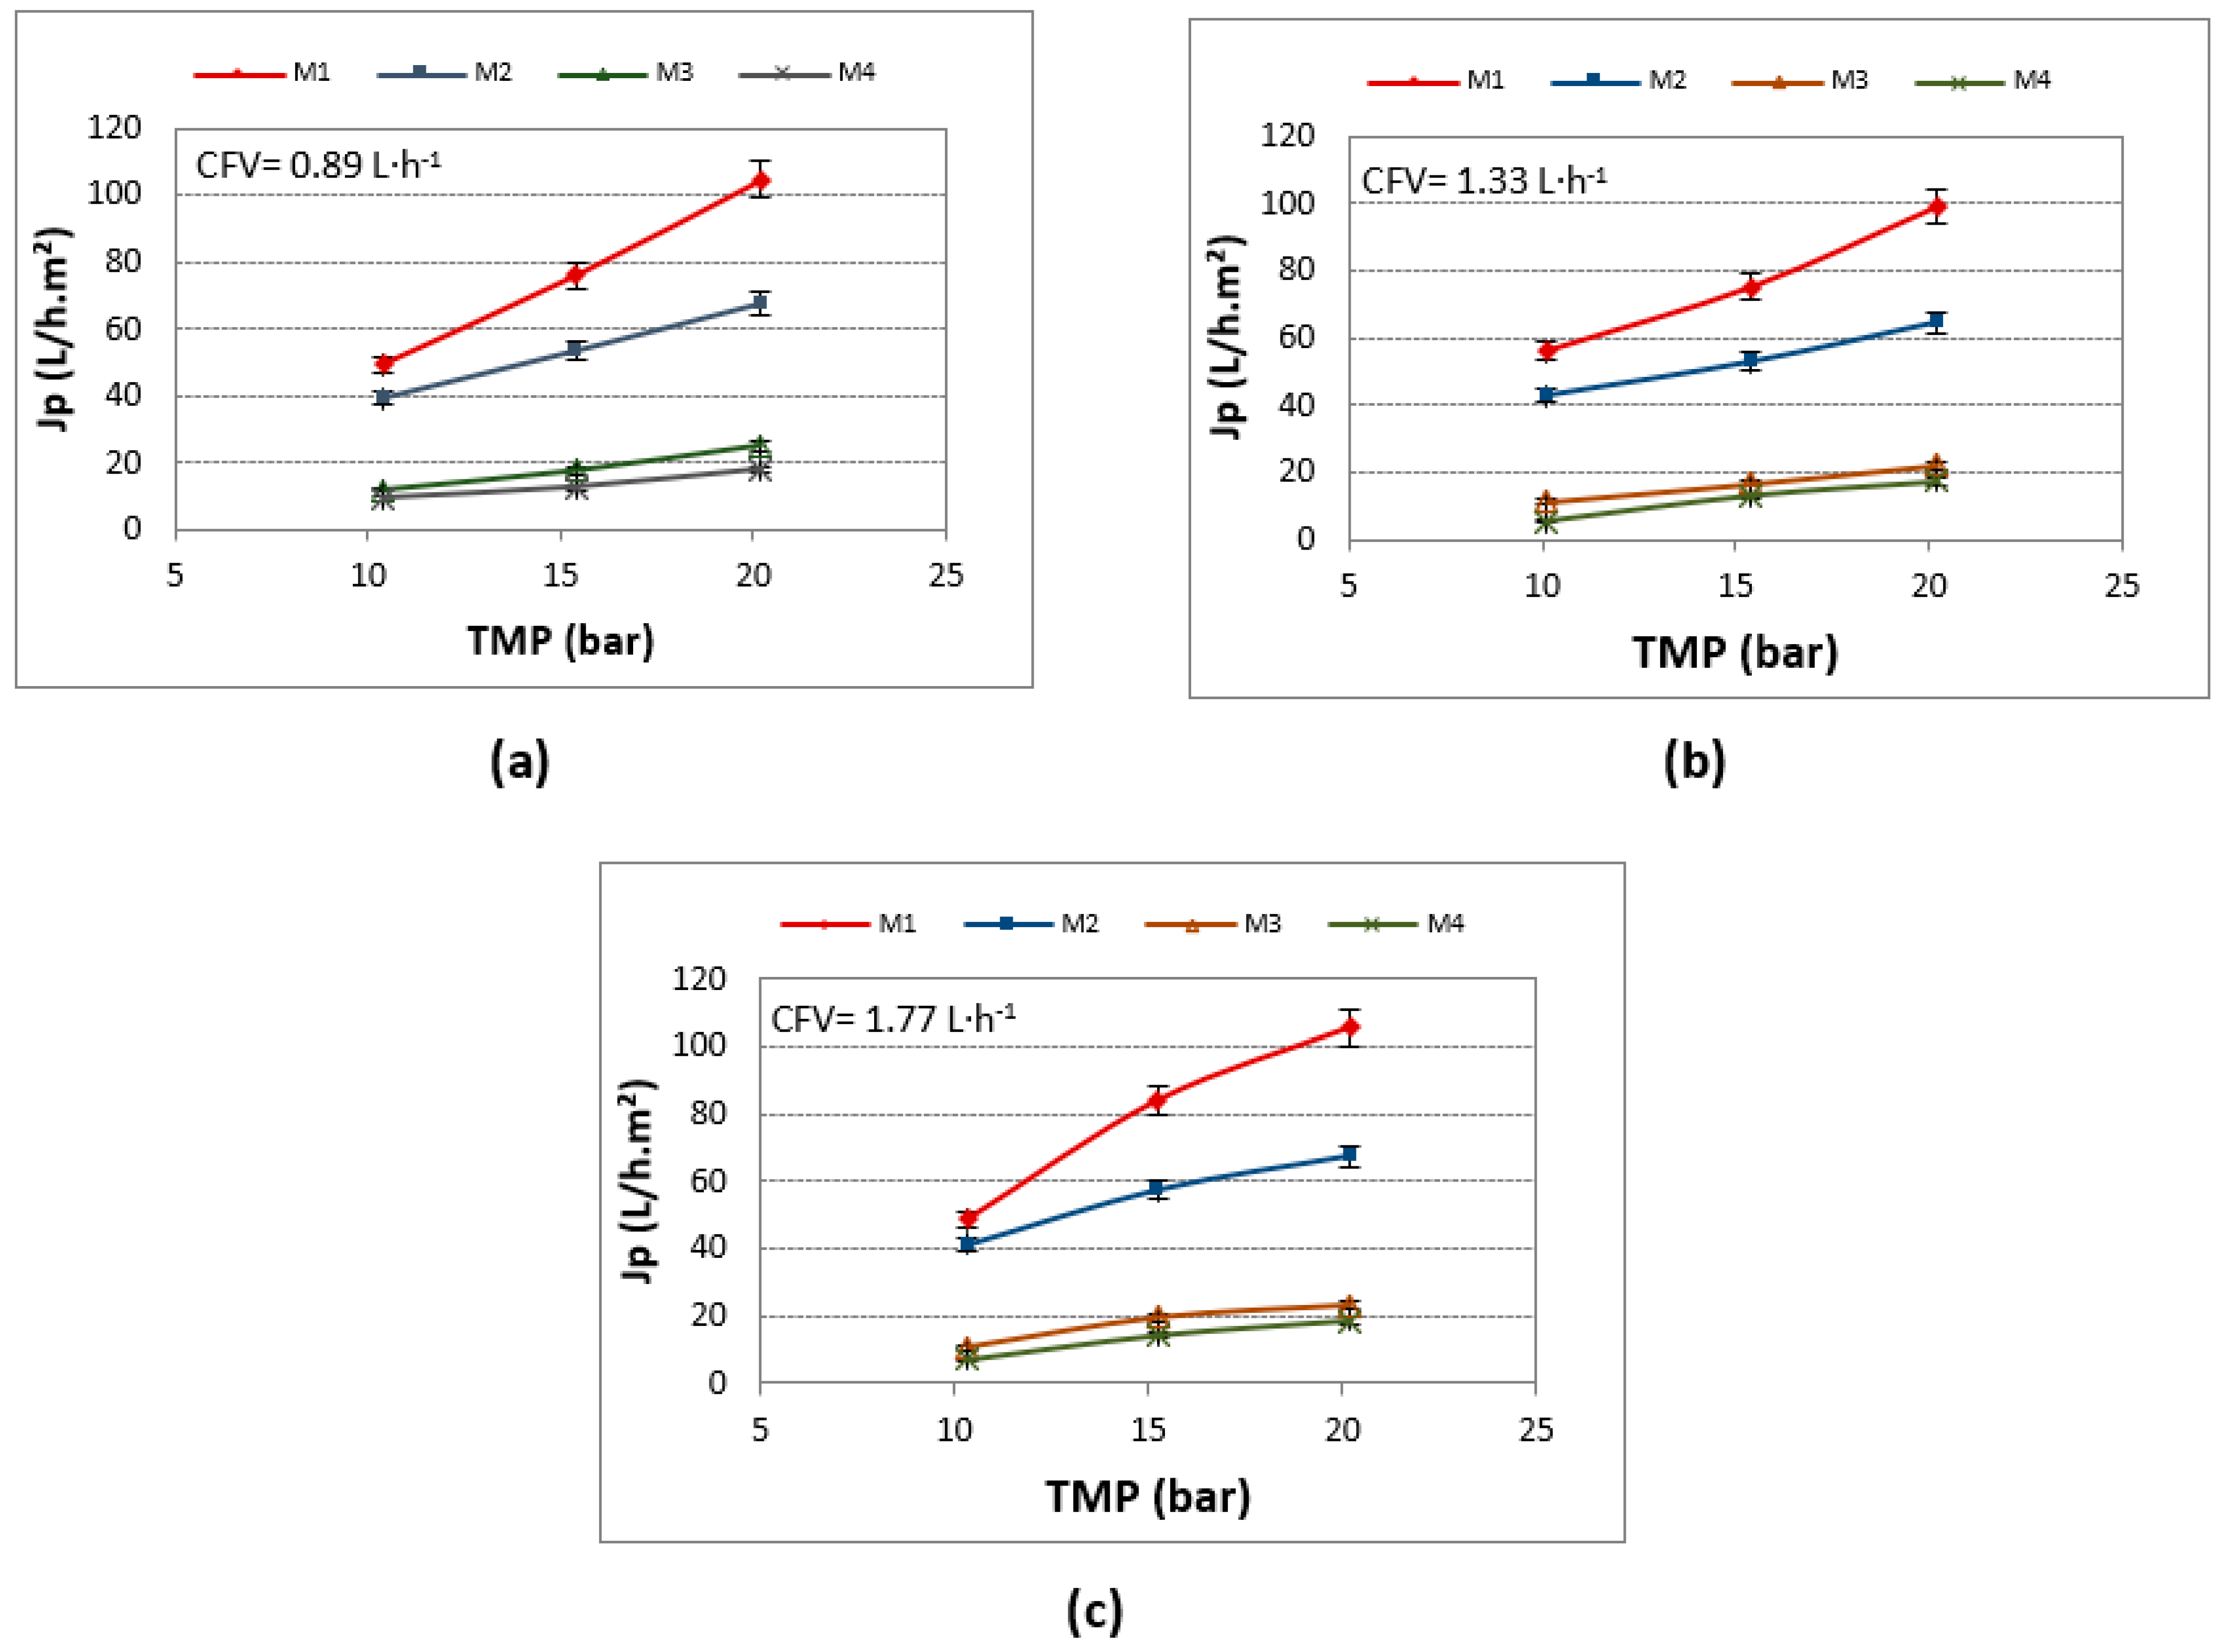
Figure 2 shows the variation of JP with the TMP at different CFVs for the tested membranes. In all cases, it can be observed that TMP affected the permeate flux more significantly than CFV. As expected, the permeate flux increases with TMP since it is the main driving force for the membrane processes. However, the permeate fluxes remained almost constant for all CFVs. The lack of CFV influence could be attributed to the narrow range of CFVs tested, as other authors have pointed out [25].
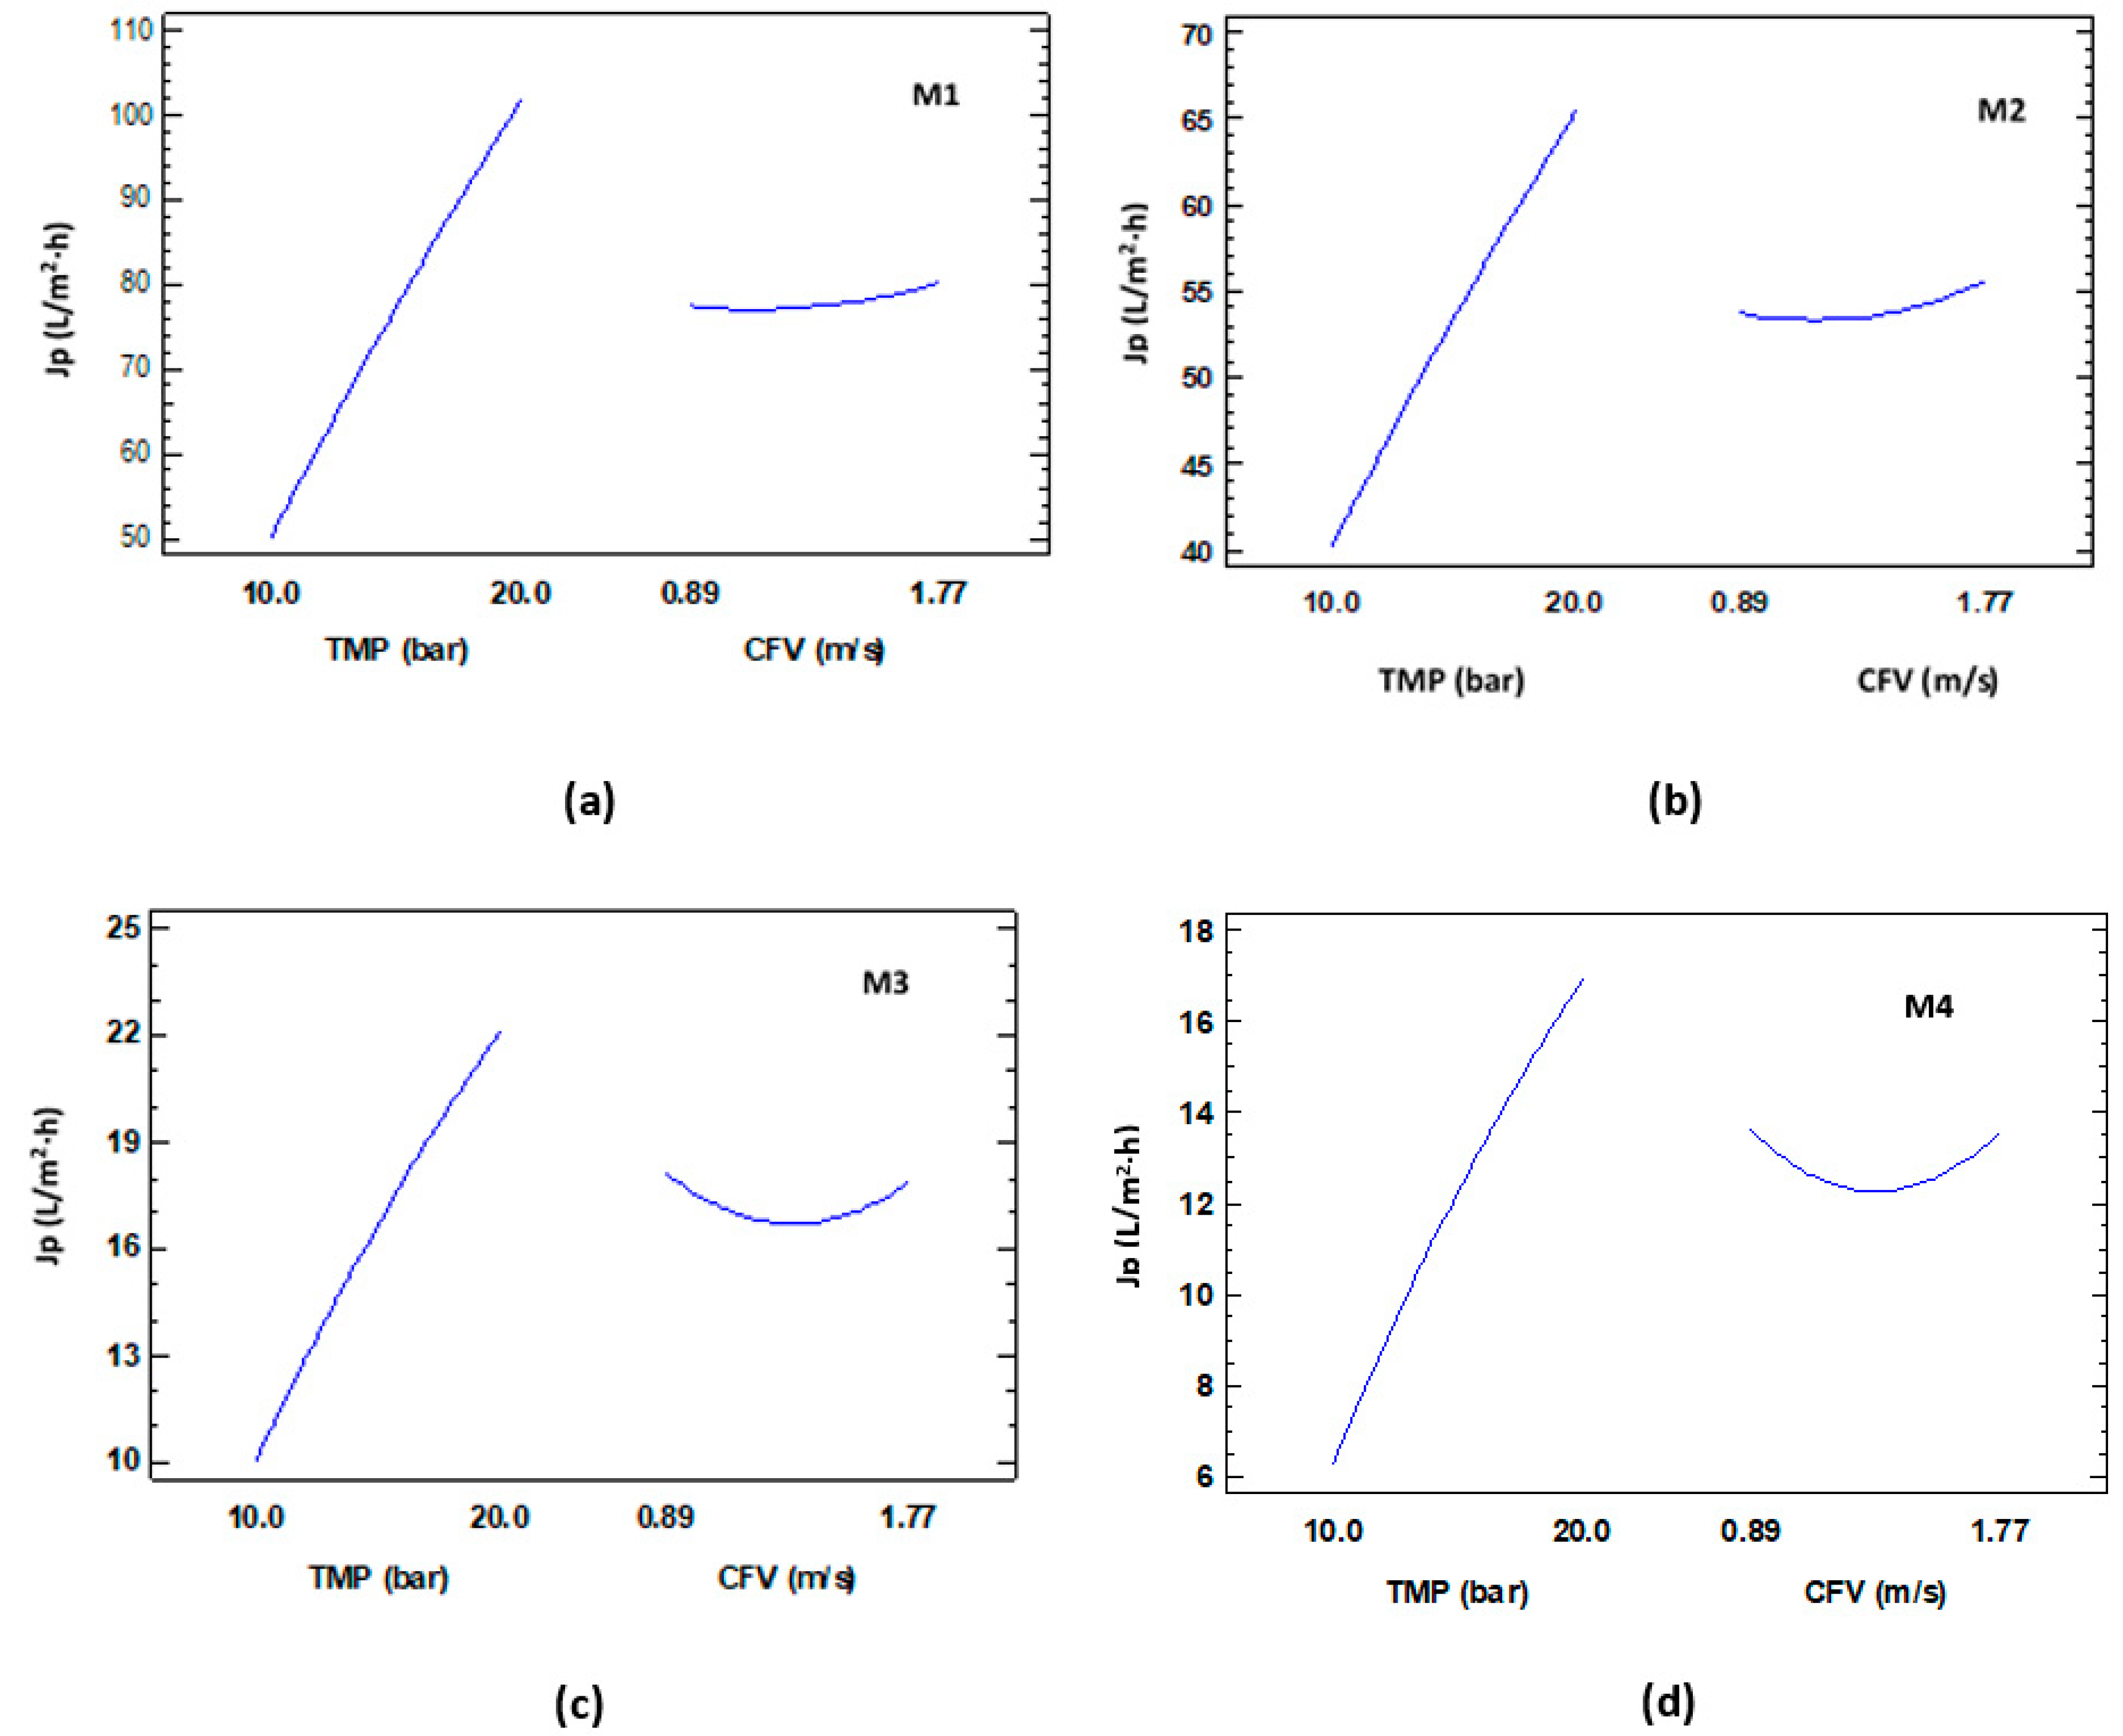
In the tested TMP range, the highest Jp values were achieved for NF270, followed by NF Duraslick, whereas RO membrane permeate flux values were very similar, though quite low. The performance of RO membranes was not in concordance with the hydraulic permeability obtained. Thus, it was expected that RO Duraslick would achieve higher Jp values than SWC3. Using Statgraphics Centurion XVIII software, the variability of JP for each main effect (TMP and CFV) is plotted in Figure 3. In this case, it can be observed that JP is hardly affected by CFV. The obtained p-values for TMP were lower than 0.05. However, the p-values sequence for CFV in the ascendant order was 0.0715 (M2) < 0.2846 (M1) < 0.6831 (M3) < 0.9396 (M4), with the M4 membrane achieving the highest value. These p-values indicate that the tested crow flow velocities did not affect Jp values.
The estimated response surface was also statistically assessed to find the optimal operating conditions (TMP, CFV) for each membrane. Table 4 shows the combination of factor levels that maximises JP. The optimal JP value was reached at 20 bar and a CFV value of 1.77 m/s for all membranes except M3. Table 4 also includes a comparison between empirical and experimental JP values, pointing out that deviation errors were not considered significant. JP_empirical values have been calculated with the fitted equations collected in Table 5.
The empirical correlation of the operating conditions (TMP and CFV) for each membrane was determined by multiple linear regression analysis using Statgraphics software. In the equations of the fitted model, JP is given in L·m−2·h−1, CFV in m·s−1, and TMP in bar.
- Retention index
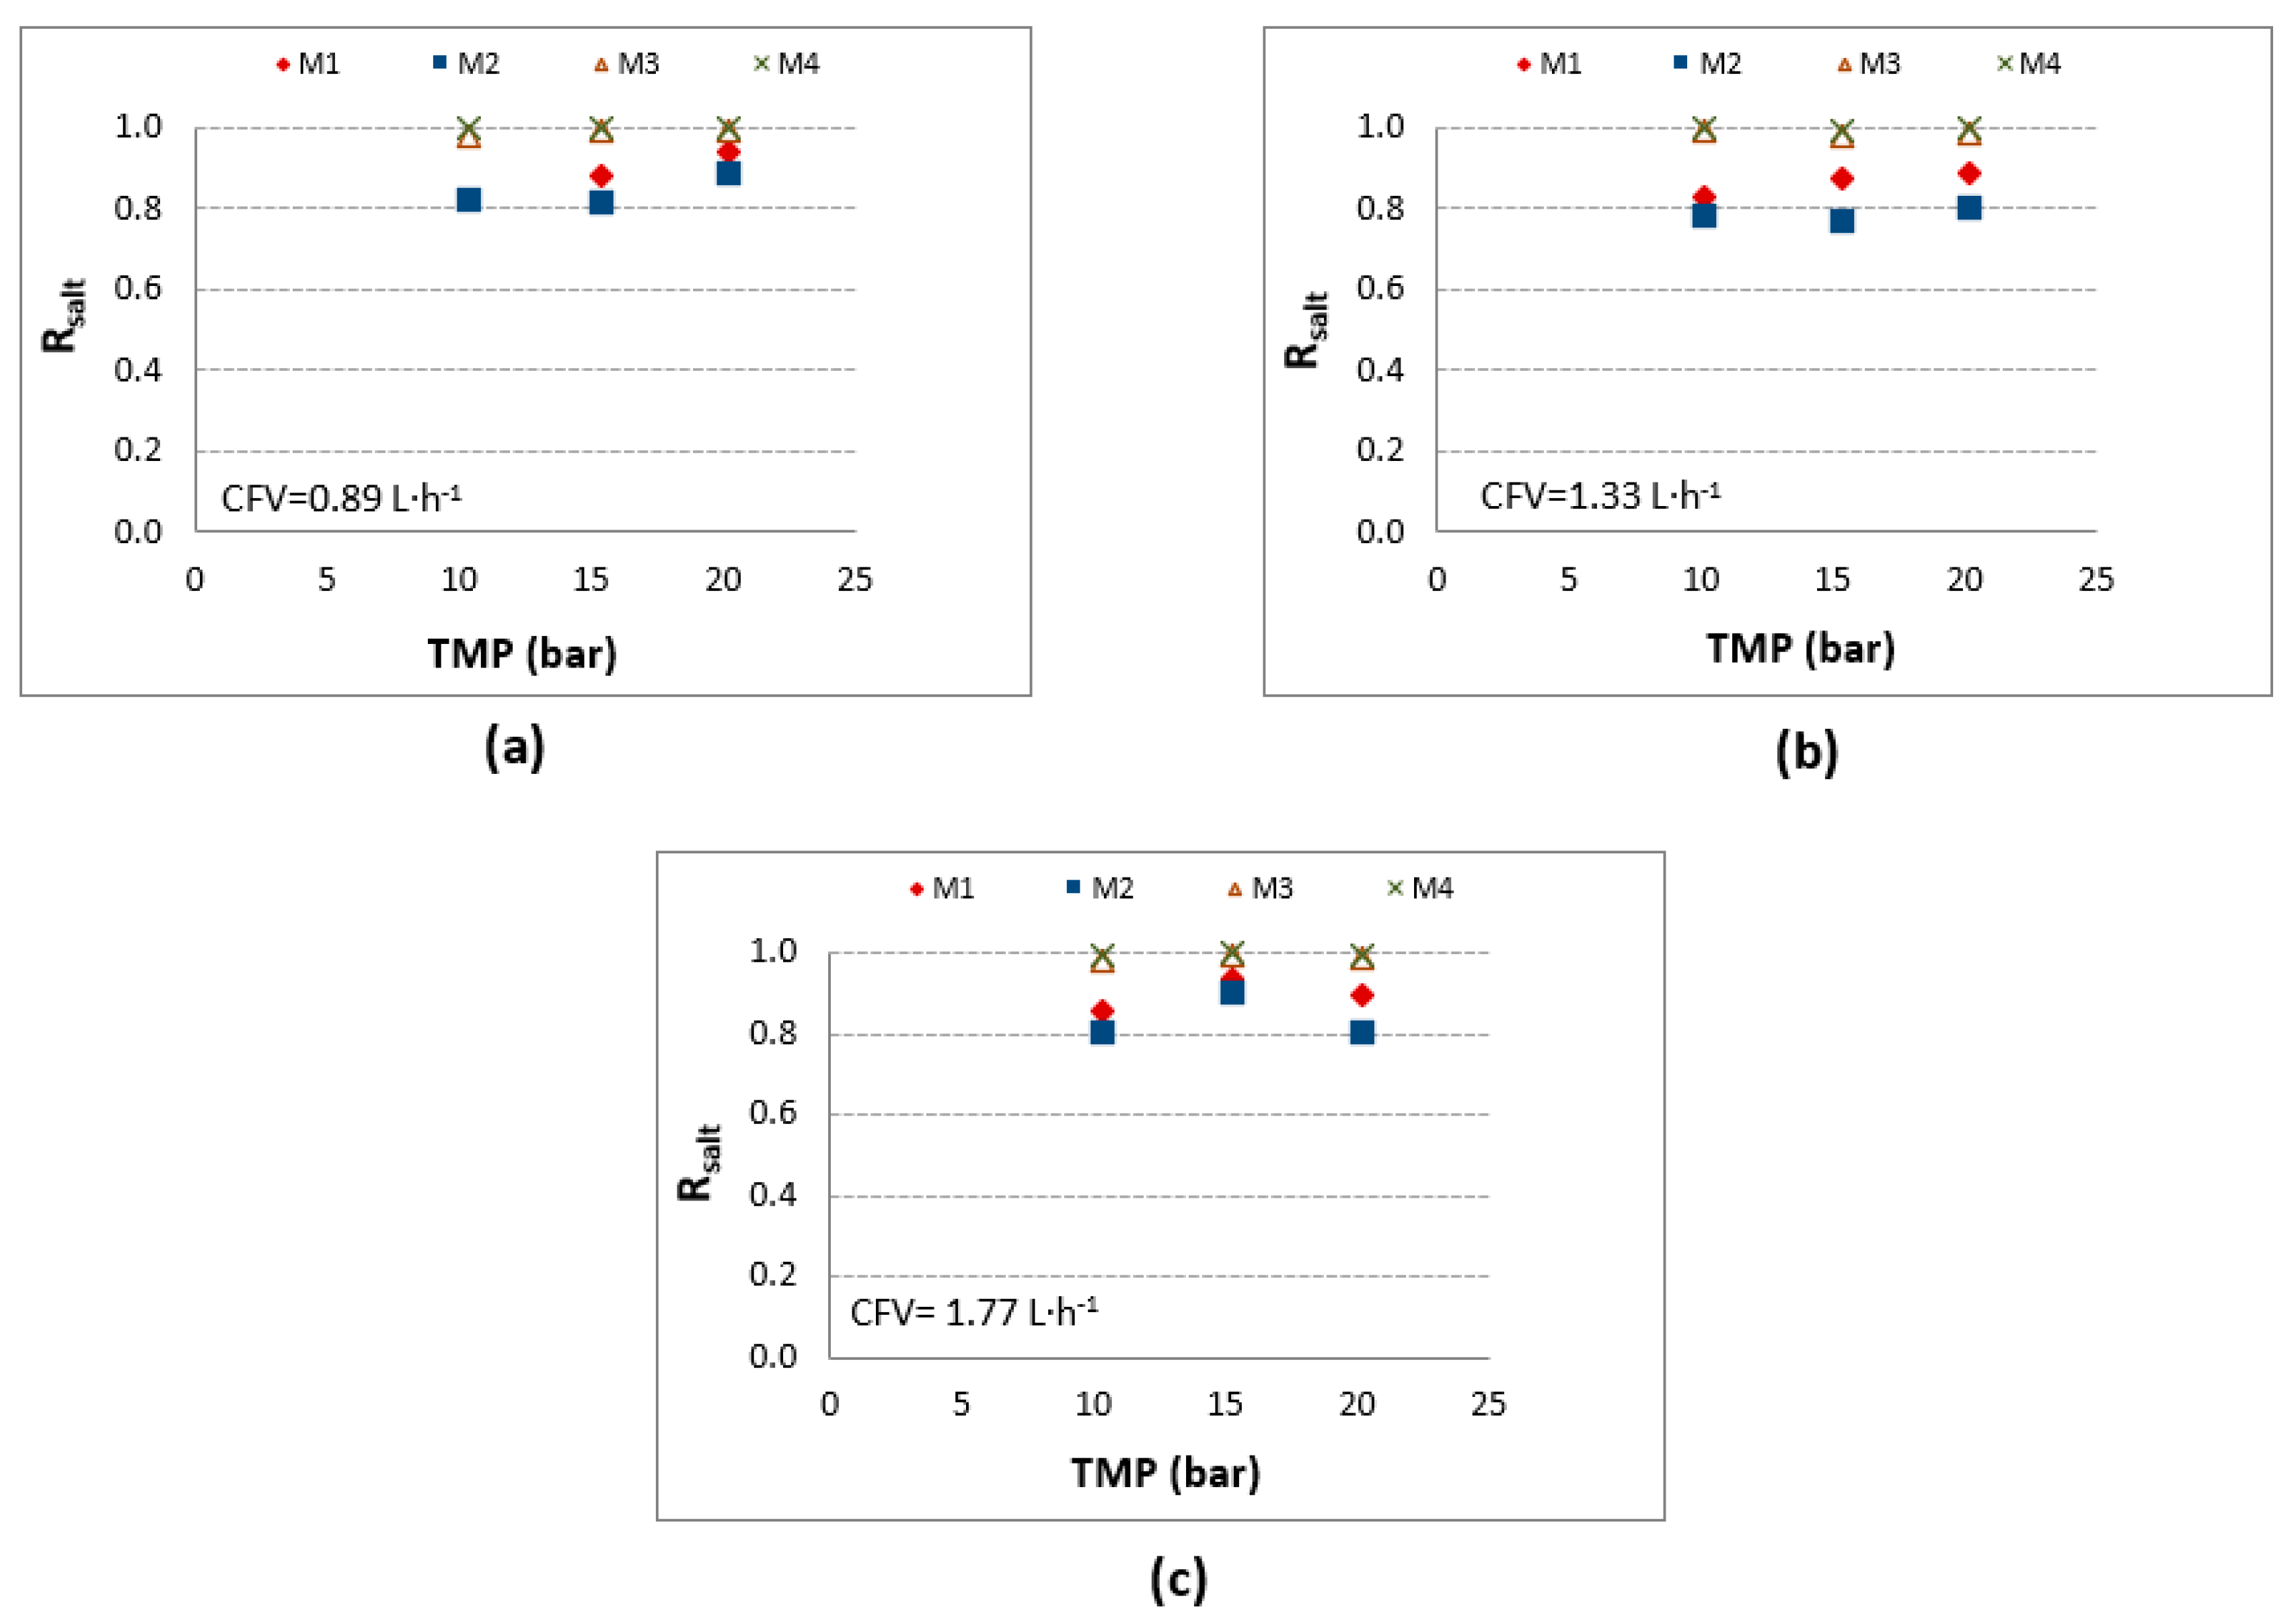
Figure 4 depicts the influence of TMP on salt retention at different CFVs for the tested membranes. RO membranes achieved higher rejections than NF membranes, as expected, achieving values near 100%. For NF membranes, a range between 80–90% was reached, depending on the TMP applied since the influence of CFV was negligible.
Below, these results are explained according to the statistical analysis. Figure 5 shows the main effects of salt rejections for all tested membranes.
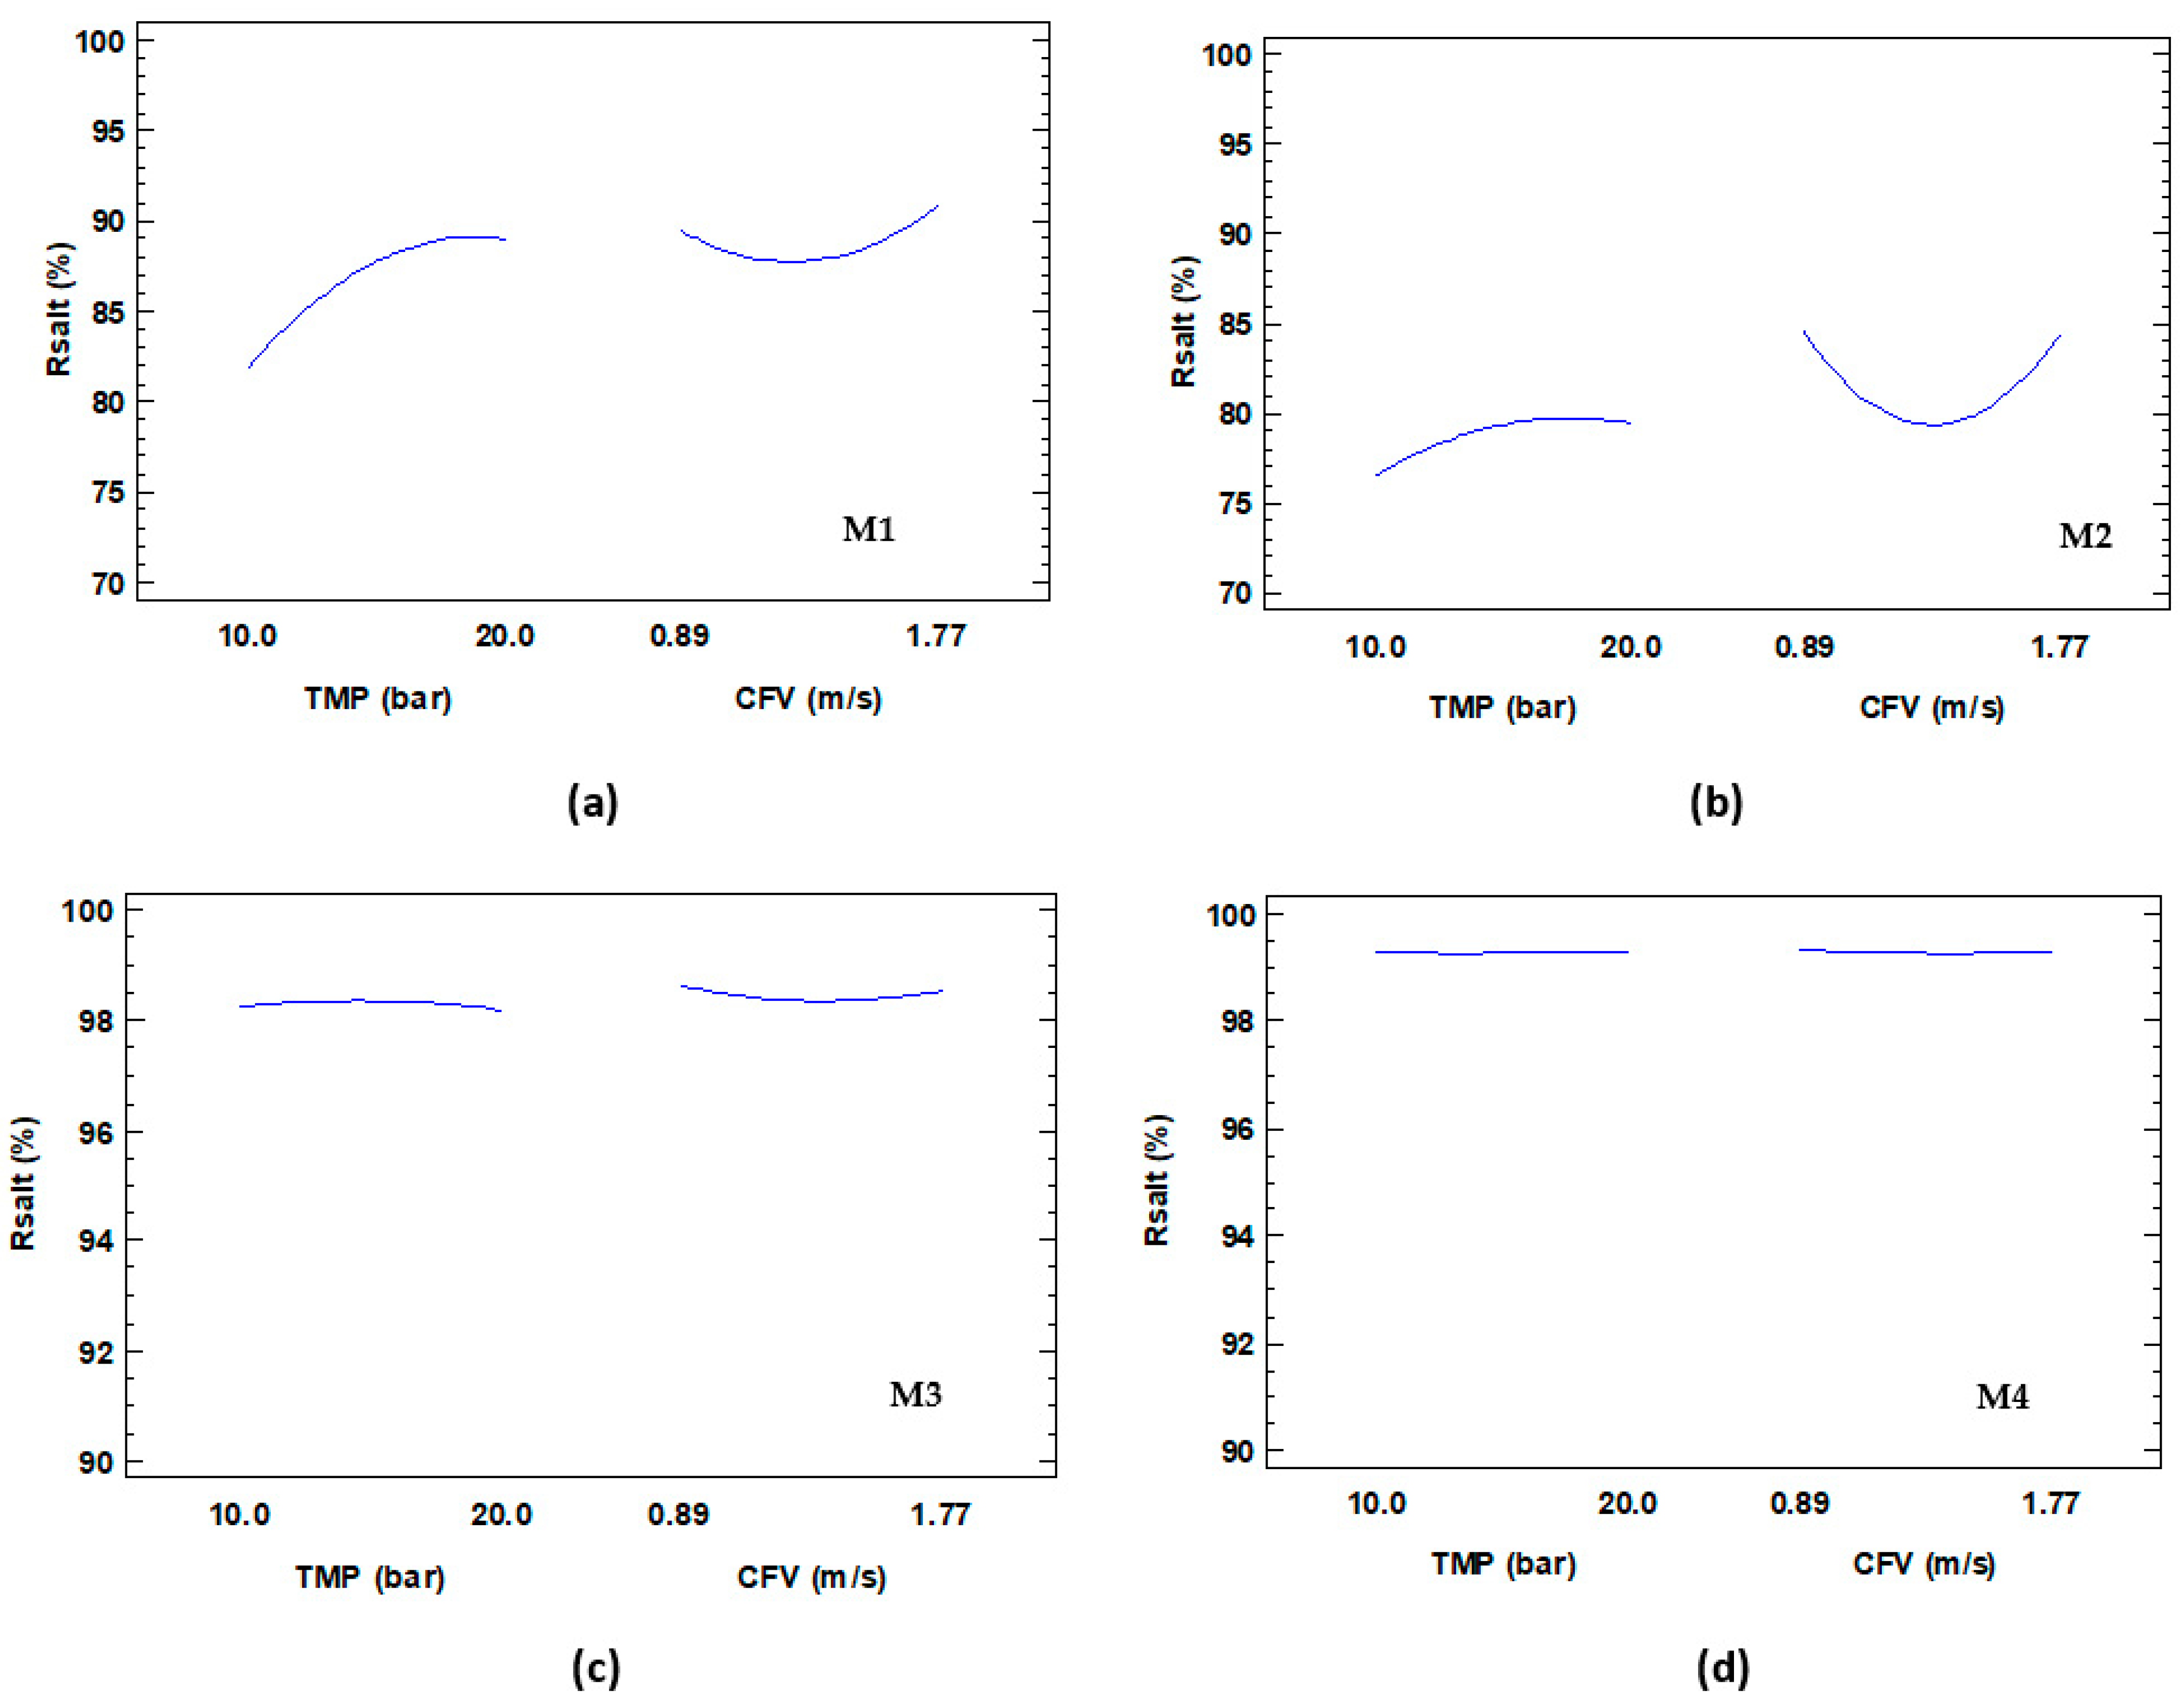
For M2, M3 and M4, it can be observed that salt rejection was not practically affected by TMP and CFV. These results were confirmed by p-values higher than 0.05 (Table 6). However, for M1, TMP had a significant effect since the p-value was <0.05, which would explain the depicted tendency (the higher TMP applied, the higher the salt rejection).
The estimated response surface was also statistically assessed to find the optimal operating conditions for each membrane. Table 7 collects the combination of factor levels that maximises RSalt. It can be observed that the optimal values for CFV and TMP were 0.89 m/s and 20 bar, respectively. For membrane M3, the optimal values were 0.89 m/s and 15 bar. Furthermore, this table compares empirical and experimental RSalt values, showing that the deviation error was not significant (0.28–2.67%).
The equations of the fitted model for RSalt (%), determined by multiple linear regression analysis, are collected in Table 8.
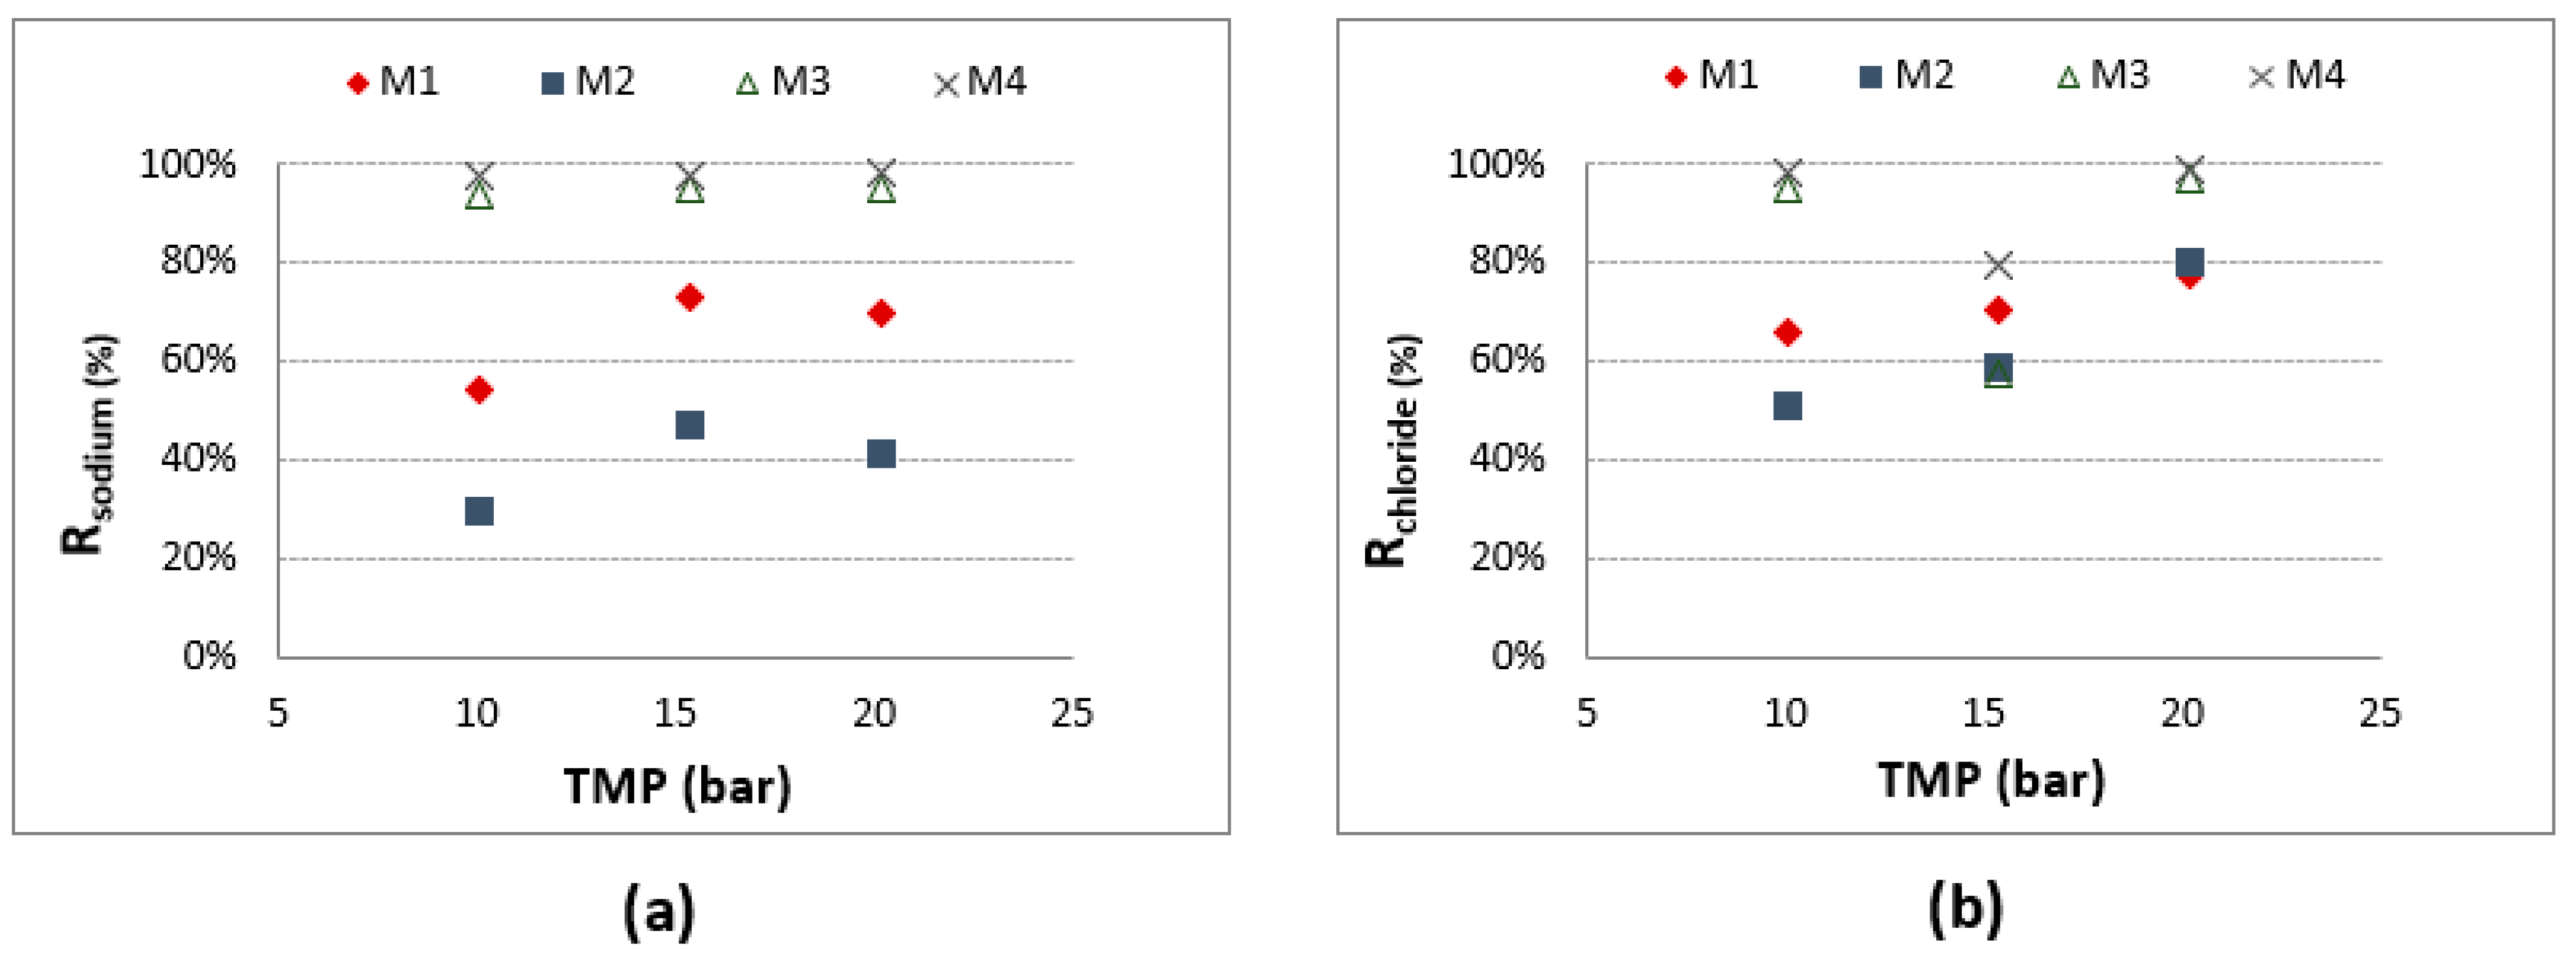
In addition to salt rejection, divalent and monovalent ion rejection was also considered. Related to divalent ions (sulphates, calcium and magnesium), the rejection values achieved were higher than 90% for all operating conditions (TMP and CFV) and tested membranes [16]. Moreover, for monovalent ions (Figure 6) in general, the typical tendency for the studied variables was also observed. Specifically, RO membranes (M3 and M4) achieved near 100% rejection values for sodium and chloride, except at 15 bar for chloride.
On the other hand, CFV values did not influence these results (data not shown). It is worth mentioning that the results collected in our study indicate that pore size exclusion and net charge repulsion were the predominant mechanisms in salt retention for NF membranes. This statement is supported by the idea that, typically, NF membranes have two separation mechanisms, depending on the membrane pore size (sieving) and electric repulsion (Donnan and dielectric effects). NF membranes achieved the highest permeate flux and lowest ion rejections in our study. The low salt rejection led to a brine waste stream with lower conductivity compared to RO membranes [26].
3.2.2. Concentration Mode
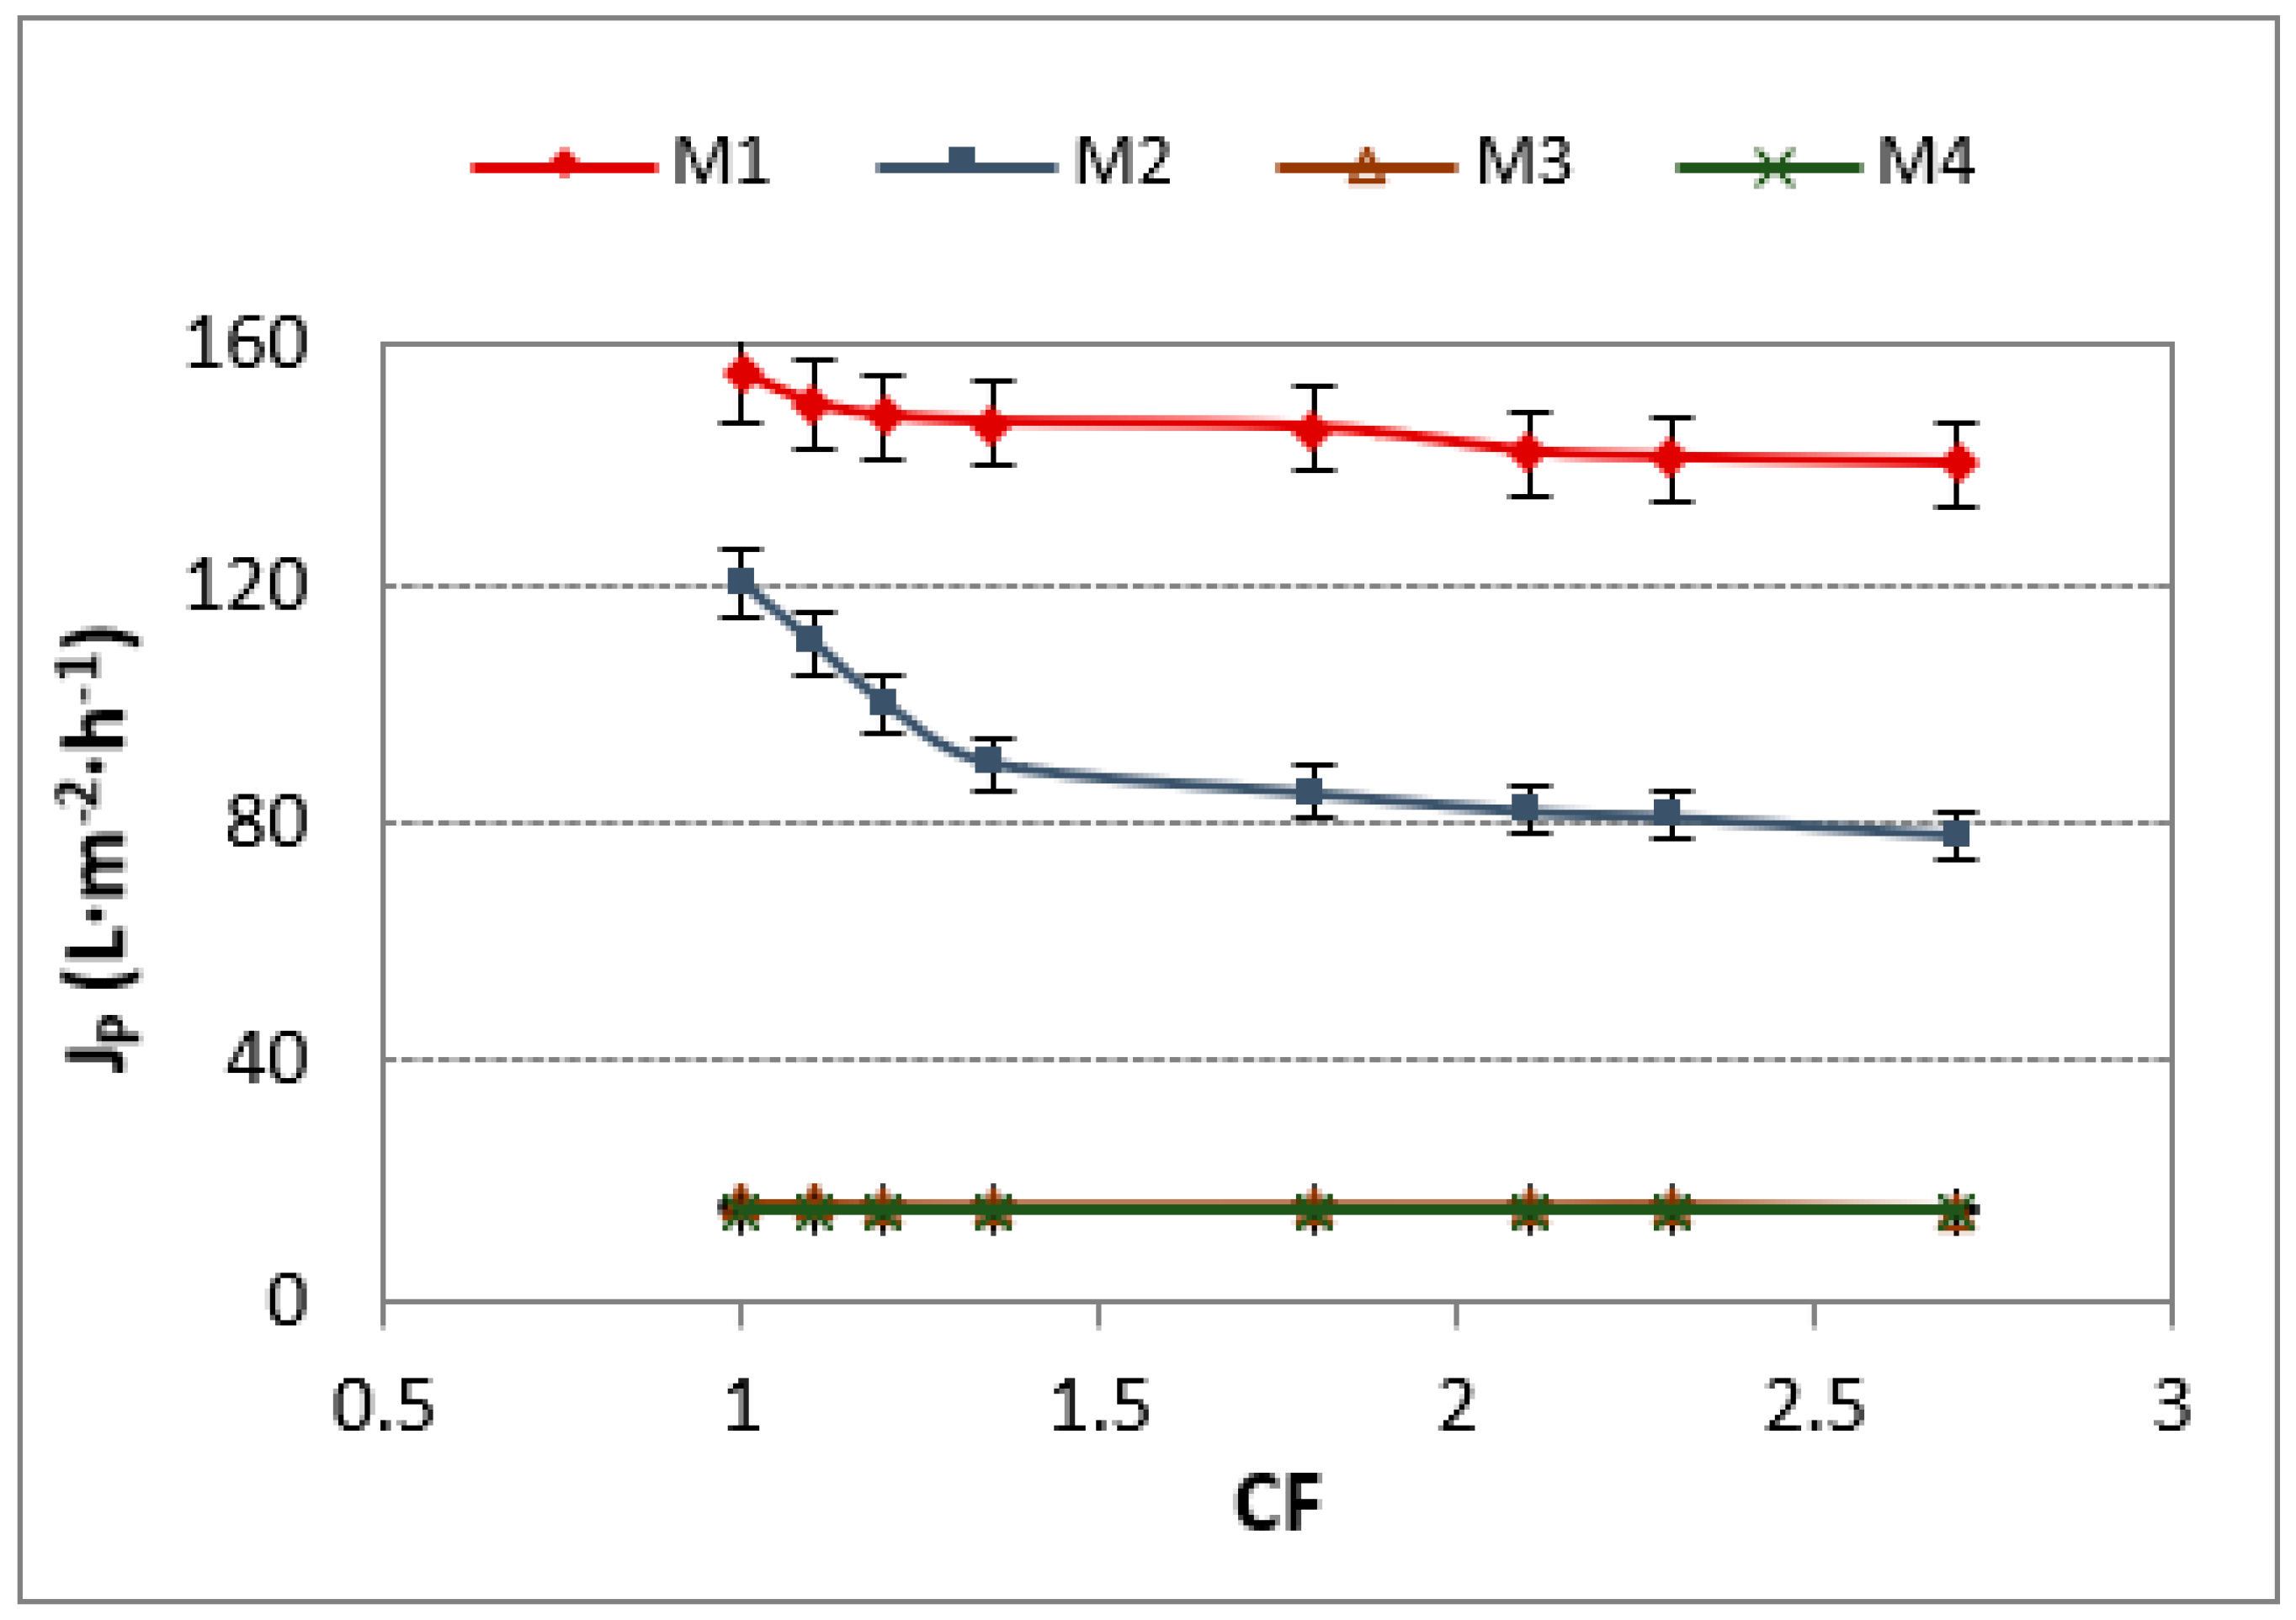
- Permeate flux
Figure 7 shows the variation of JP with the volume concentration factor (CF). It can be seen that the JP values of RO membranes remained practically constant for all the CFs tested. However, the differences between M1 and M2 are worth mentioning. M2 had a notable permeate flux decrease of 41% compared with M1 (12.5%). These results could be attributed to the membrane pore size since M2 (0.84–1.2 nm) has higher values than M1 (0.80 nm). A similar decreasing trend in permeate flux was also observed by Zakmout et al. [10].
Concentration mode (TMP = 20 bar and CFV = 1.33 m·s−1).
- Retention index
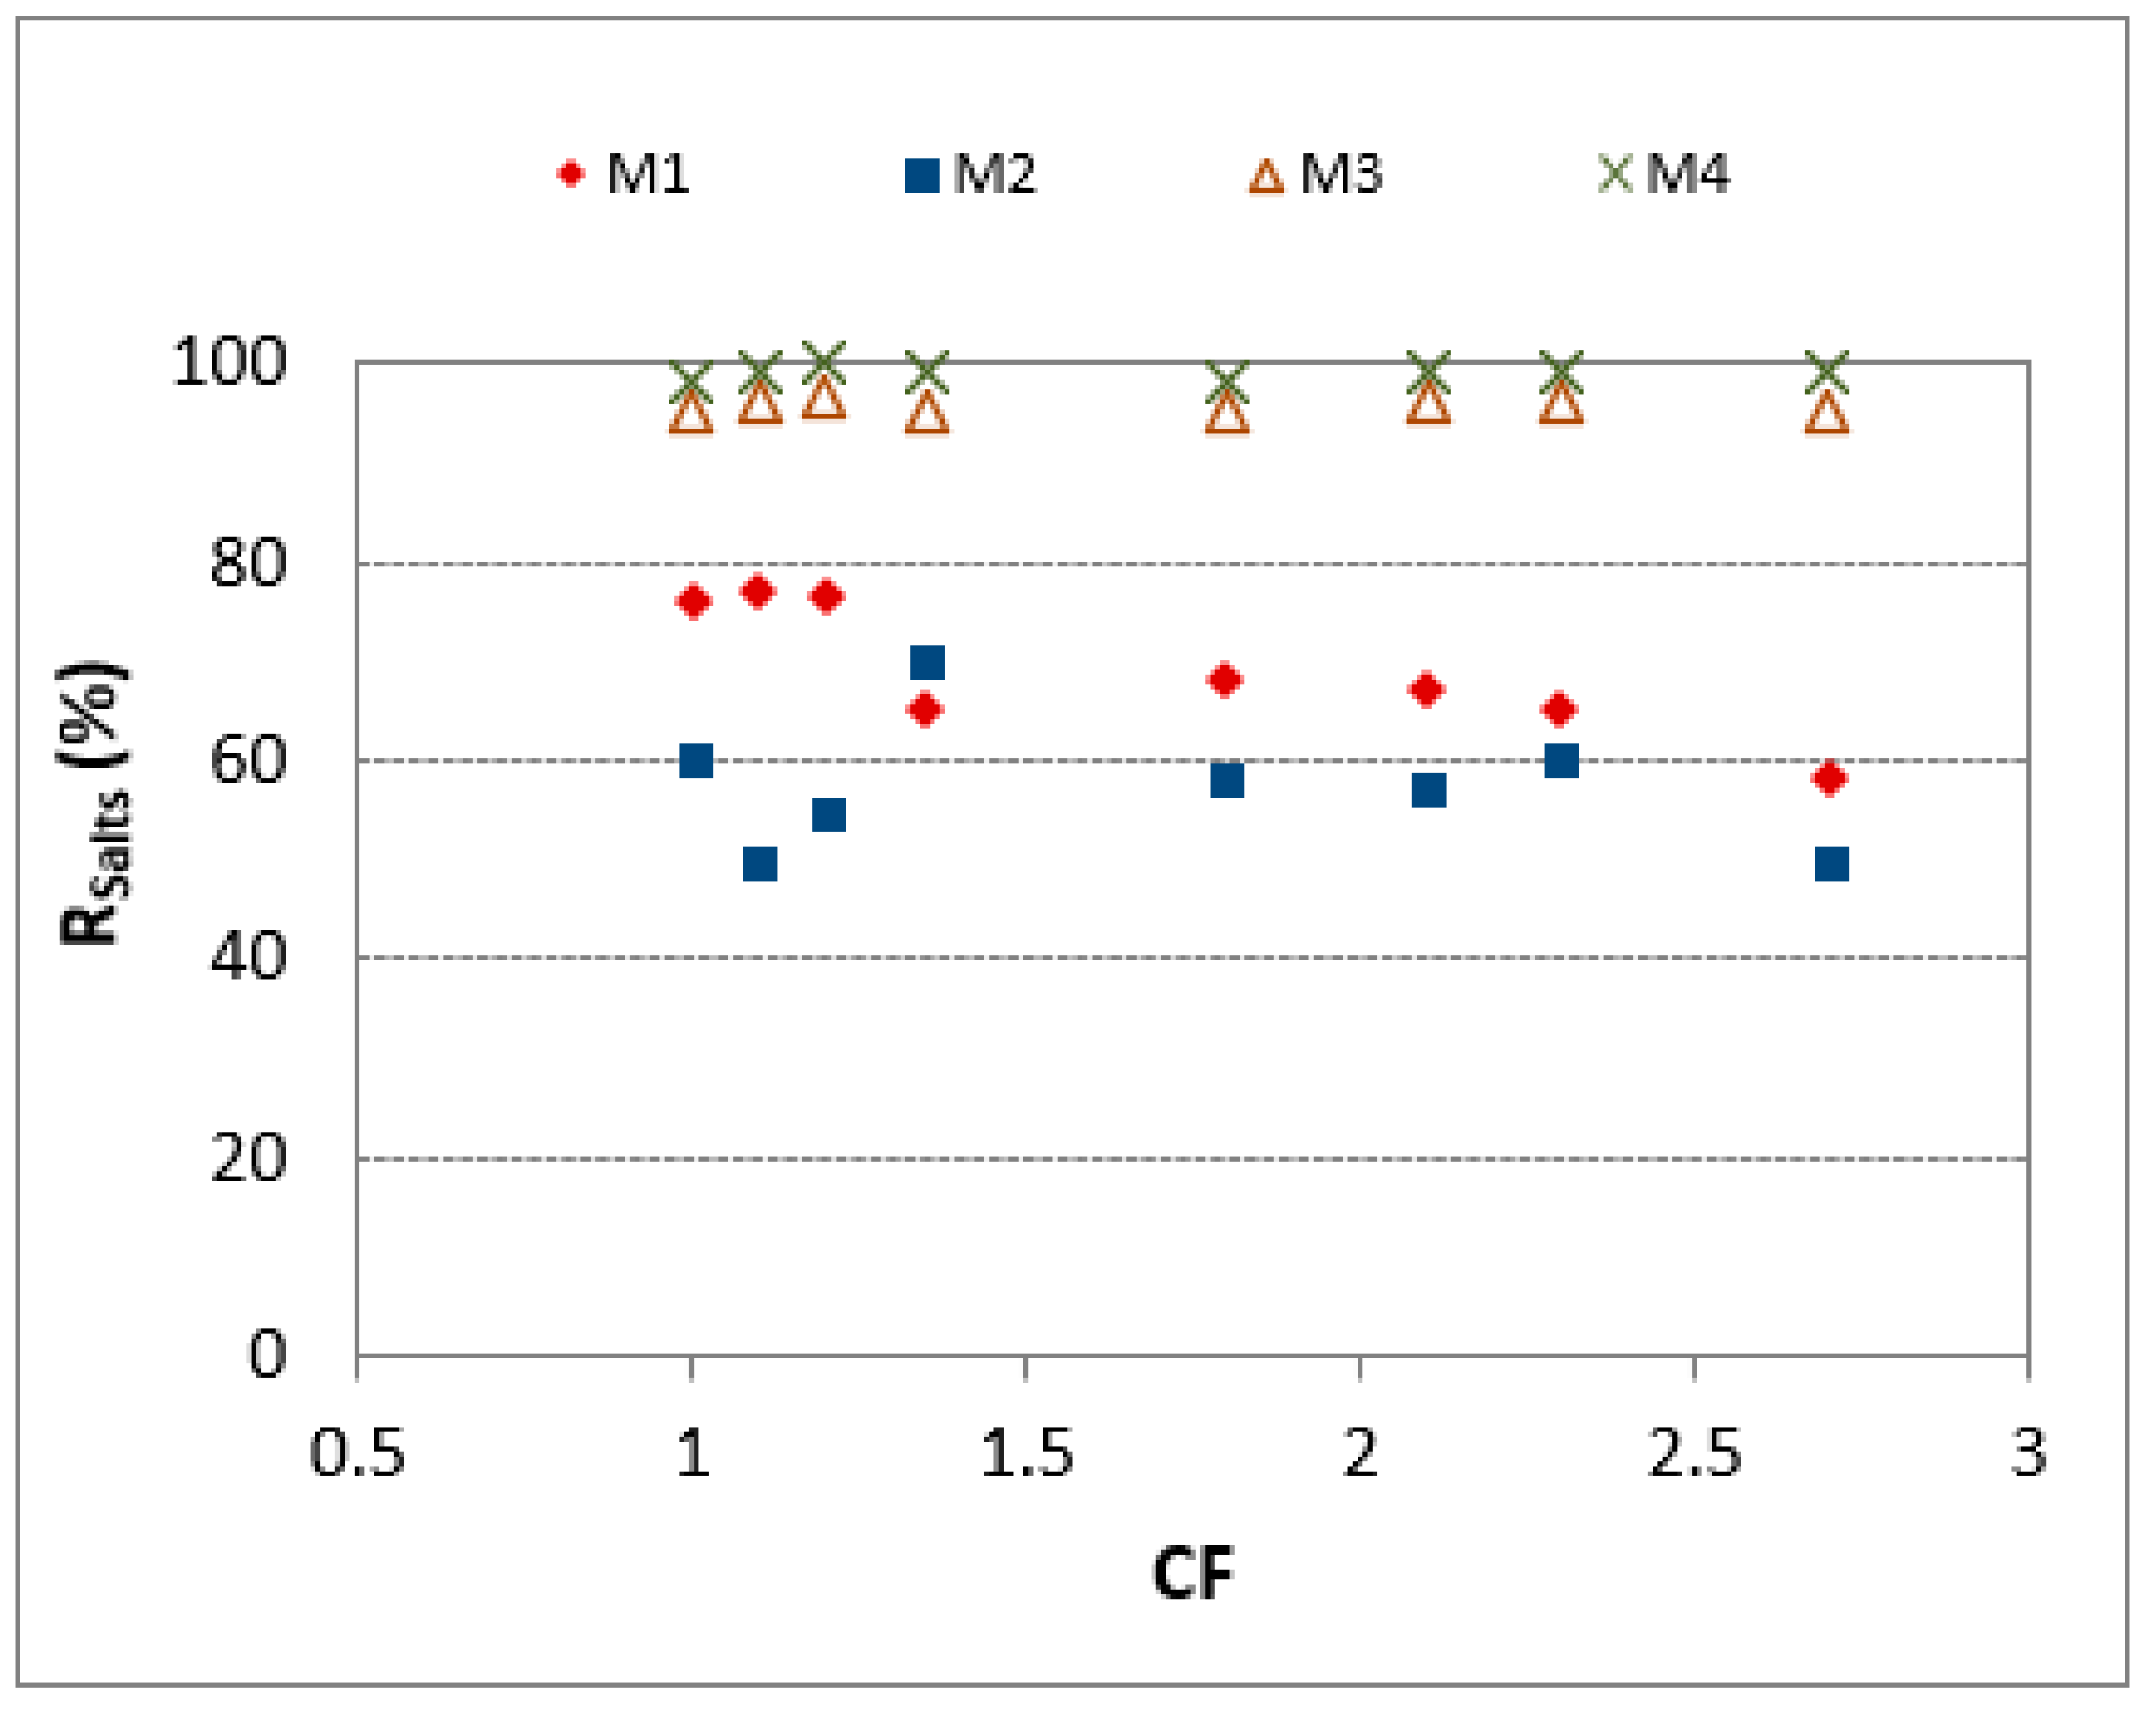
Figure 8 depicts the influence of CF on salt retention. The reverse osmosis membranes were not affected by the studied concentration factor, keeping RSalt near 100%. Nevertheless, the NF membranes showed a decreasing tendency, in which RSalt for M2 was lower than for M1, probably due to the membrane pore size.
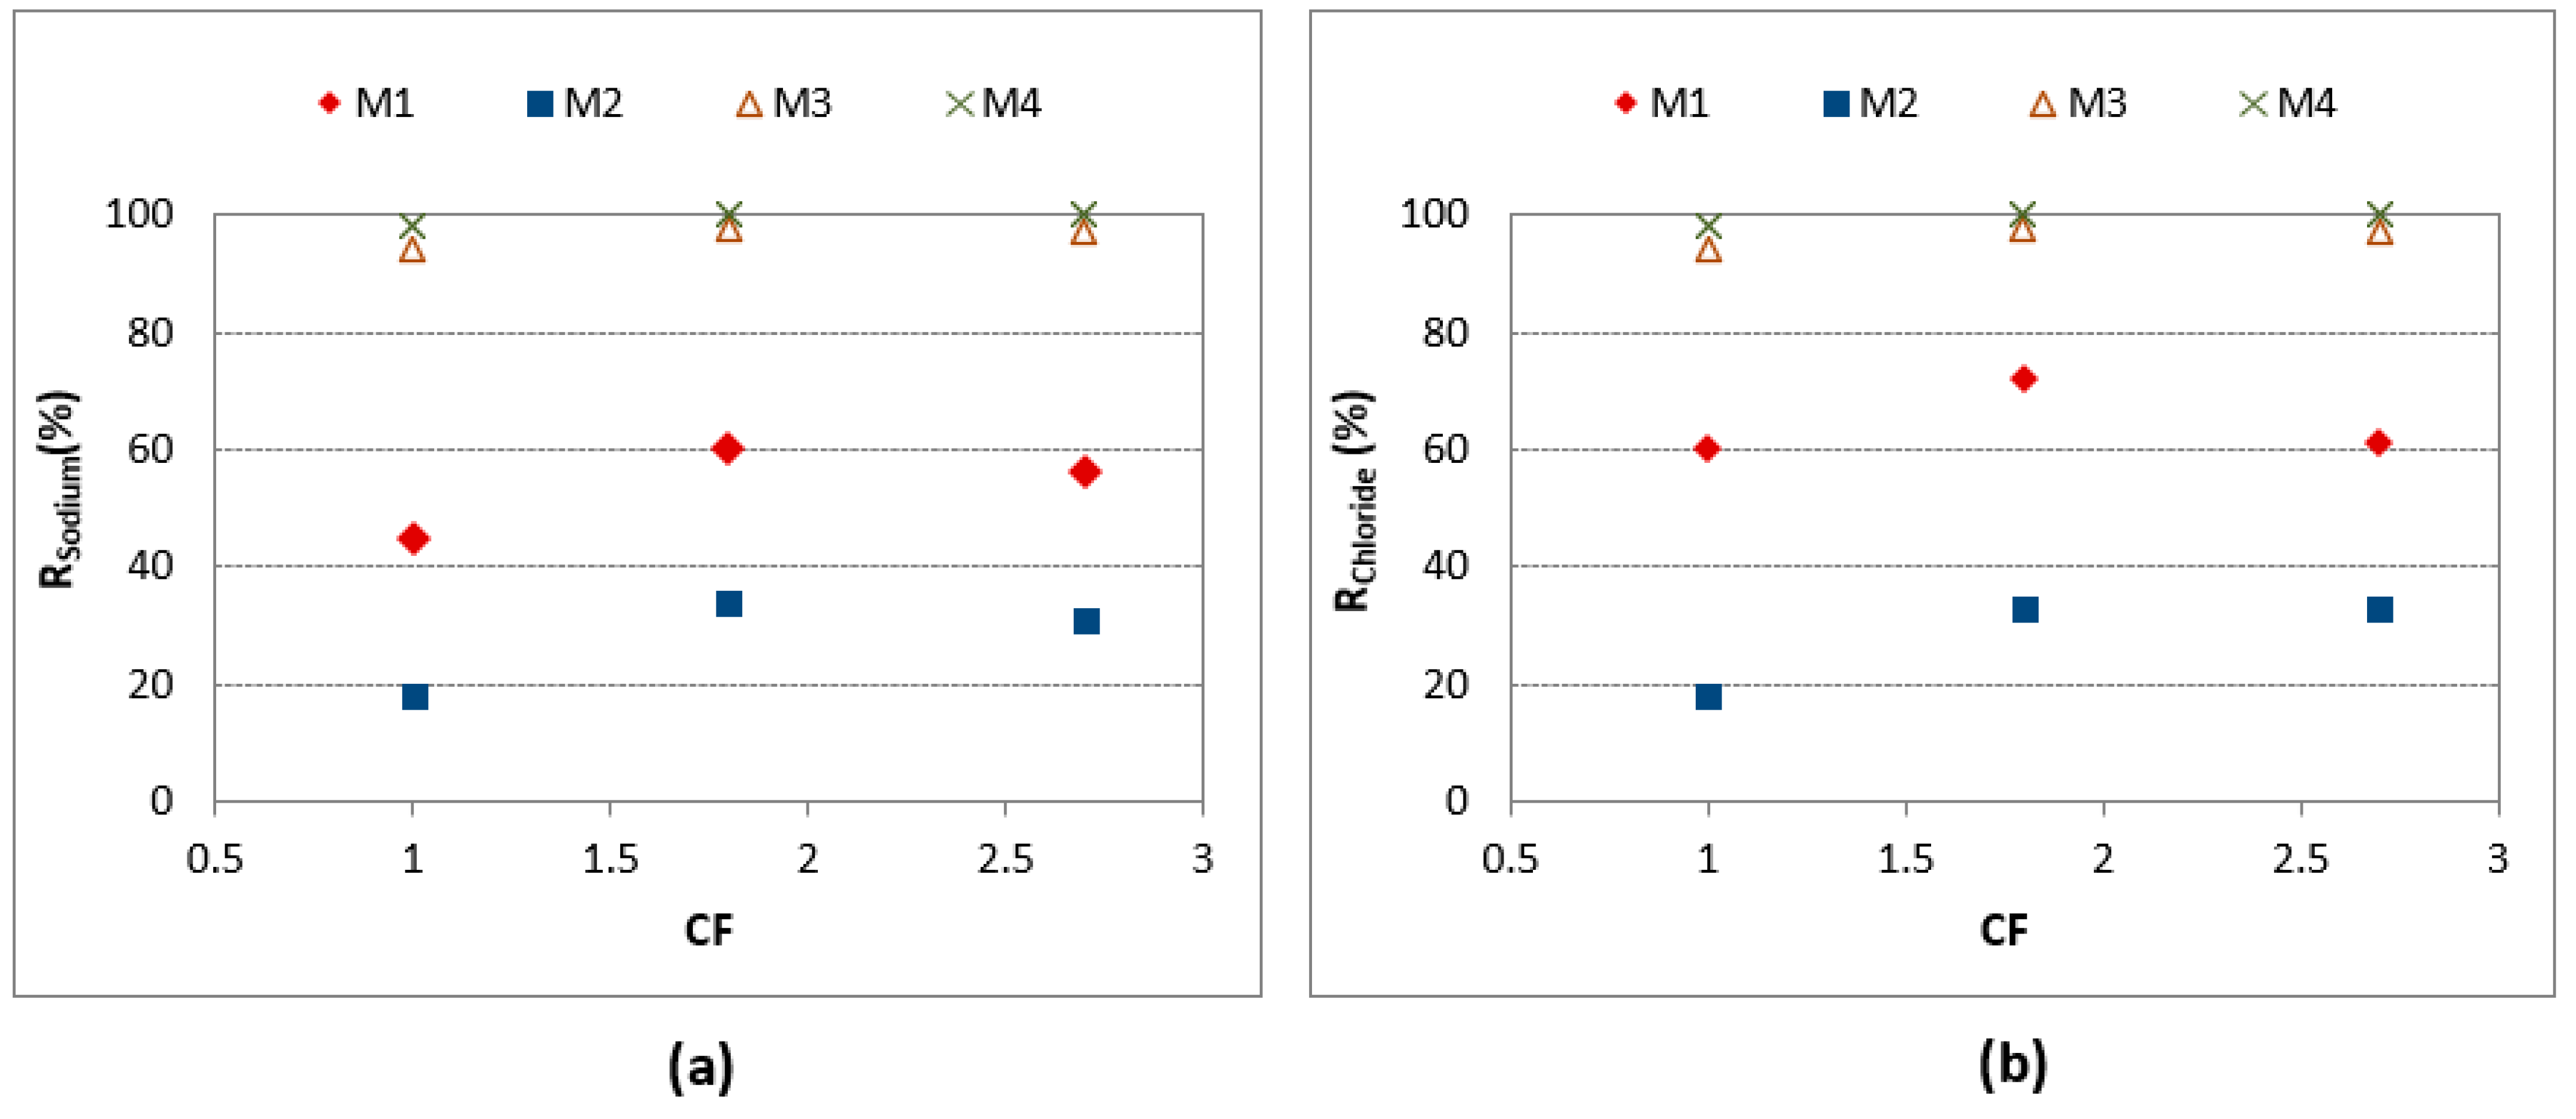
For monovalent ions (chloride and sodium), Figure 9 shows that RO membranes were not affected by CF, achieving rejections close to 100%. On the contrary, NF membranes showed different behaviour: M1 (NF270) presented higher rejection (60–72%) than M2 (21–44%). It has to be said that the rejection index followed a similar tendency in the two studied operating modes for both NF membranes.
Related to divalent ions (sulphate, magnesium and calcium), the rejection values were around 93% and 100% for NF and RO membranes, respectively. Concerning COD rejection, a 94% value was achieved for the total recycle mode, in contrast with 80% for the concentration mode.
3.3. Permeate Flux Recovery
Table 9 collects the flux recoveries (rj) after the cleaning step was applied. After the first rinse with water, flux recovery for M3 and M4 achieved 93% and 100%, respectively. Since the RO membranes reached flux recoveries higher than 90% after the rinsing step, it was not necessary to apply chemical cleaning. However, the NF membranes accomplished recoveries higher than 90% after alkaline cleaning.
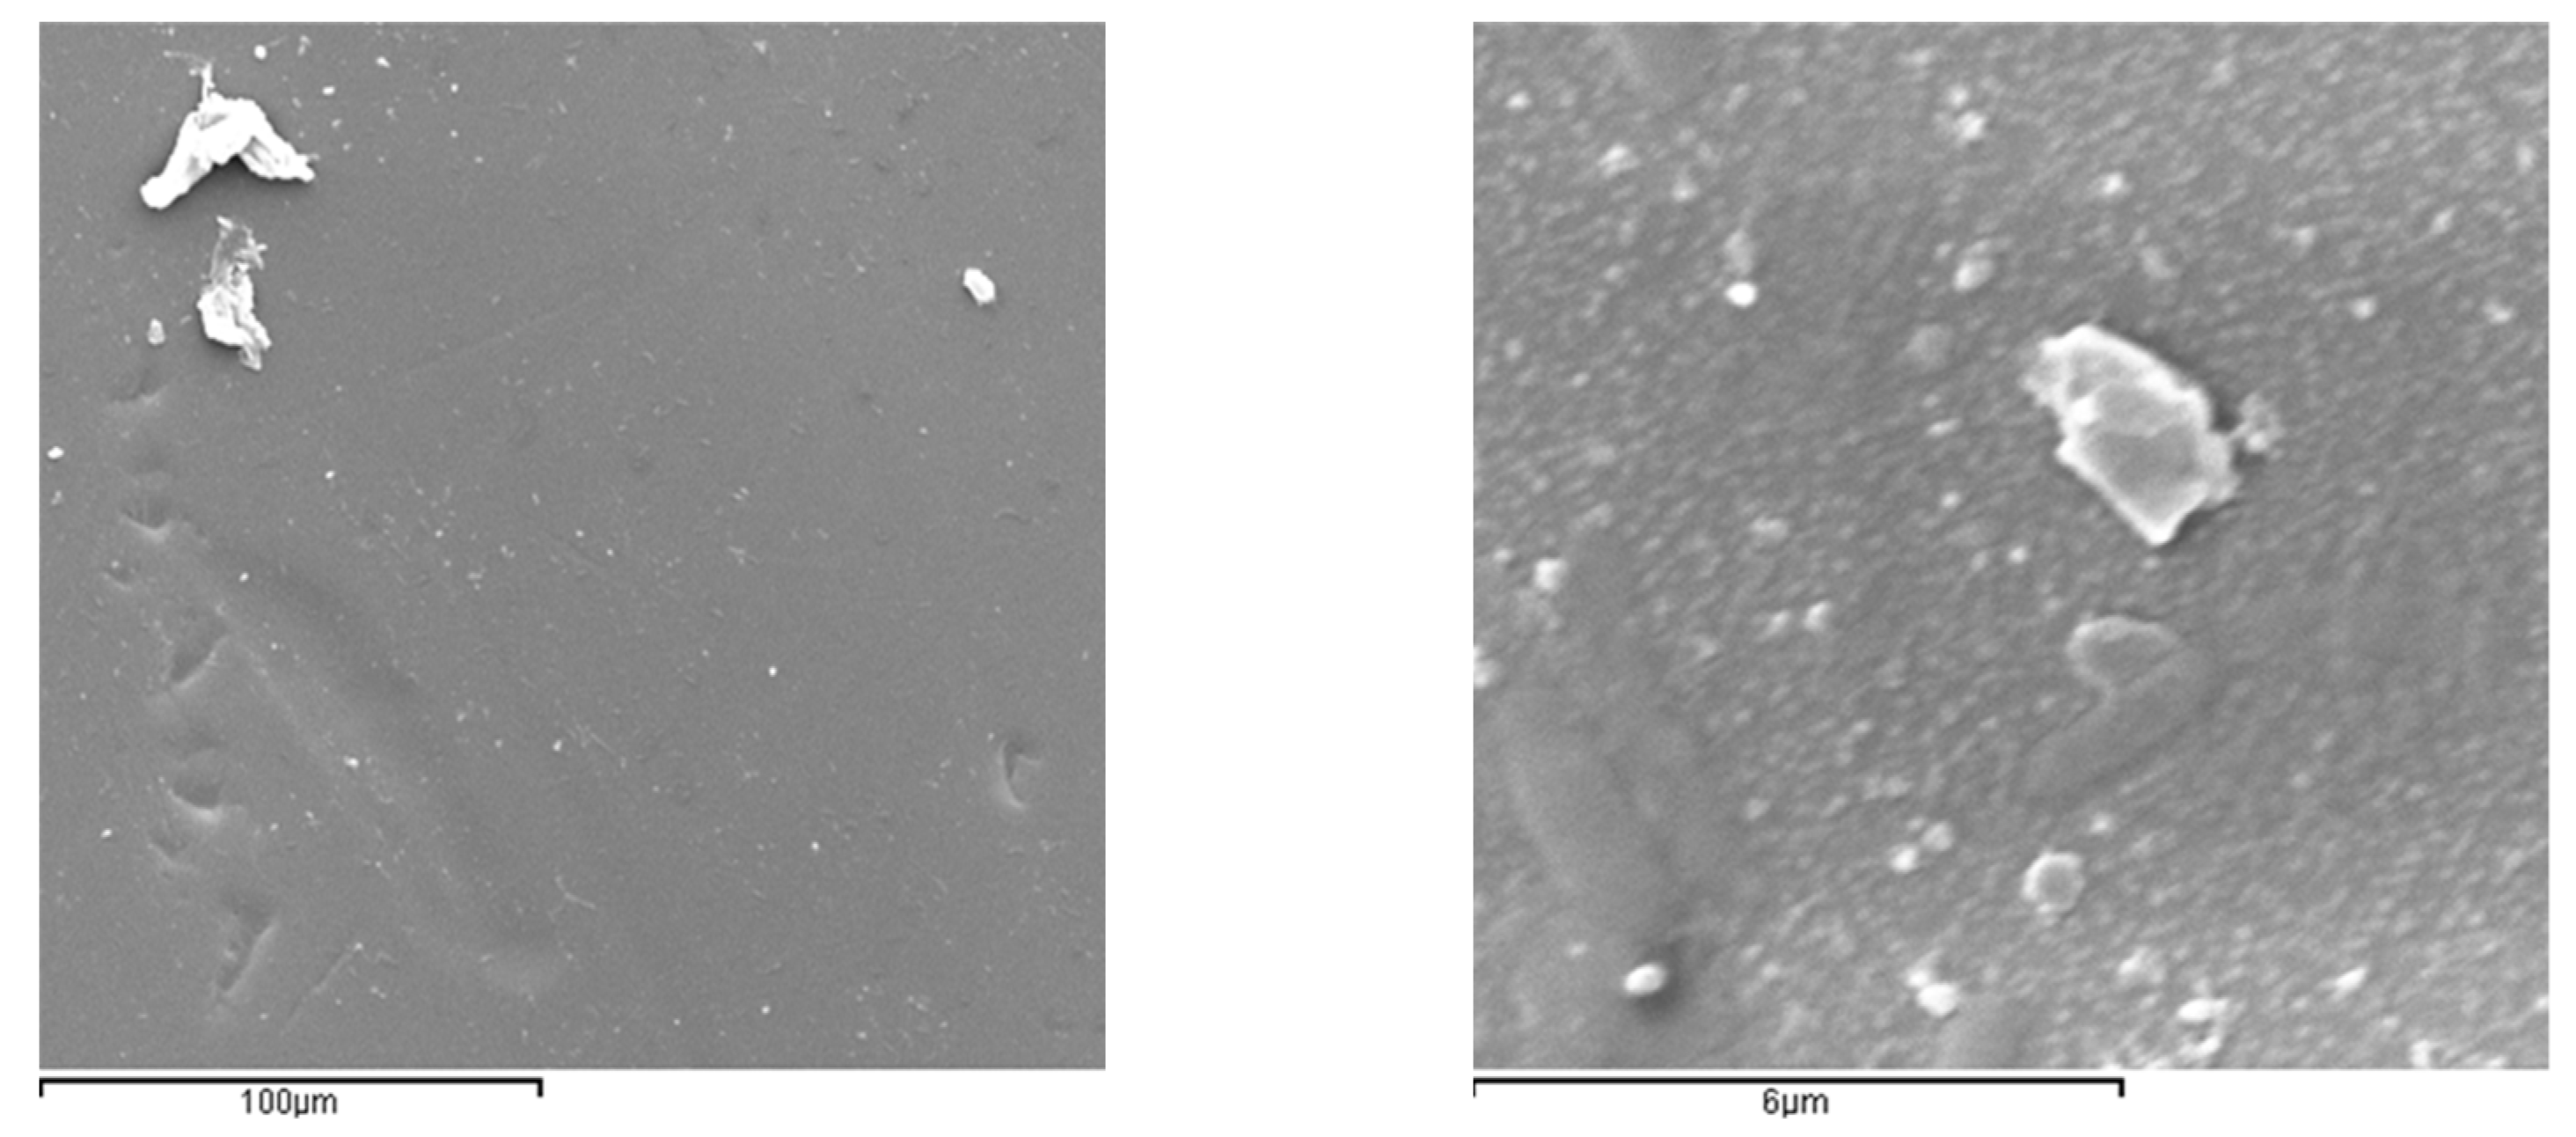
Although CFV hardly affected permeate fluxes and rejections, it seems that it has a positive effect in terms of fouling prevention. This fact is especially remarkable in RO membranes versus NF membranes, which present pores. Thus, it can be stated that CFV is an efficient tool to control fouling and improve membrane hydrodynamics near the membrane surface, which reduces concentration polarisation and fouling. Figure 10 shows the M3-RO membrane surface after the test was carried out at a concentration factor of 2.8. It can be observed that there was no significant fouling on the membrane. This fact shows that CFV plays an important role in reducing the fouling phenomenon.
Other authors have also compared the behaviour of NF and RO membranes for treating wastewater. Thus, Ogawa et al. (2010) [27] also observed that membrane fouling was more significant in the NF membrane than in the RO membrane. In addition, Haan et al. (2018) [28] observed similar results. The initial permeability of the tested RO membranes was restored completely after their cleaning. On the contrary, Hacifazlioglu et al. (2019) [29] evaluated the chemical cleaning of NF and RO membranes used to treat wastewater after use in a membrane bioreactor. These authors observed that the permeability of the RO membranes decreased more sharply than the permeability of the NF membranes. Thus, regarding fouling, the behaviour of NF and RO membranes is different depending on feed water and membrane characteristics, among other factors.
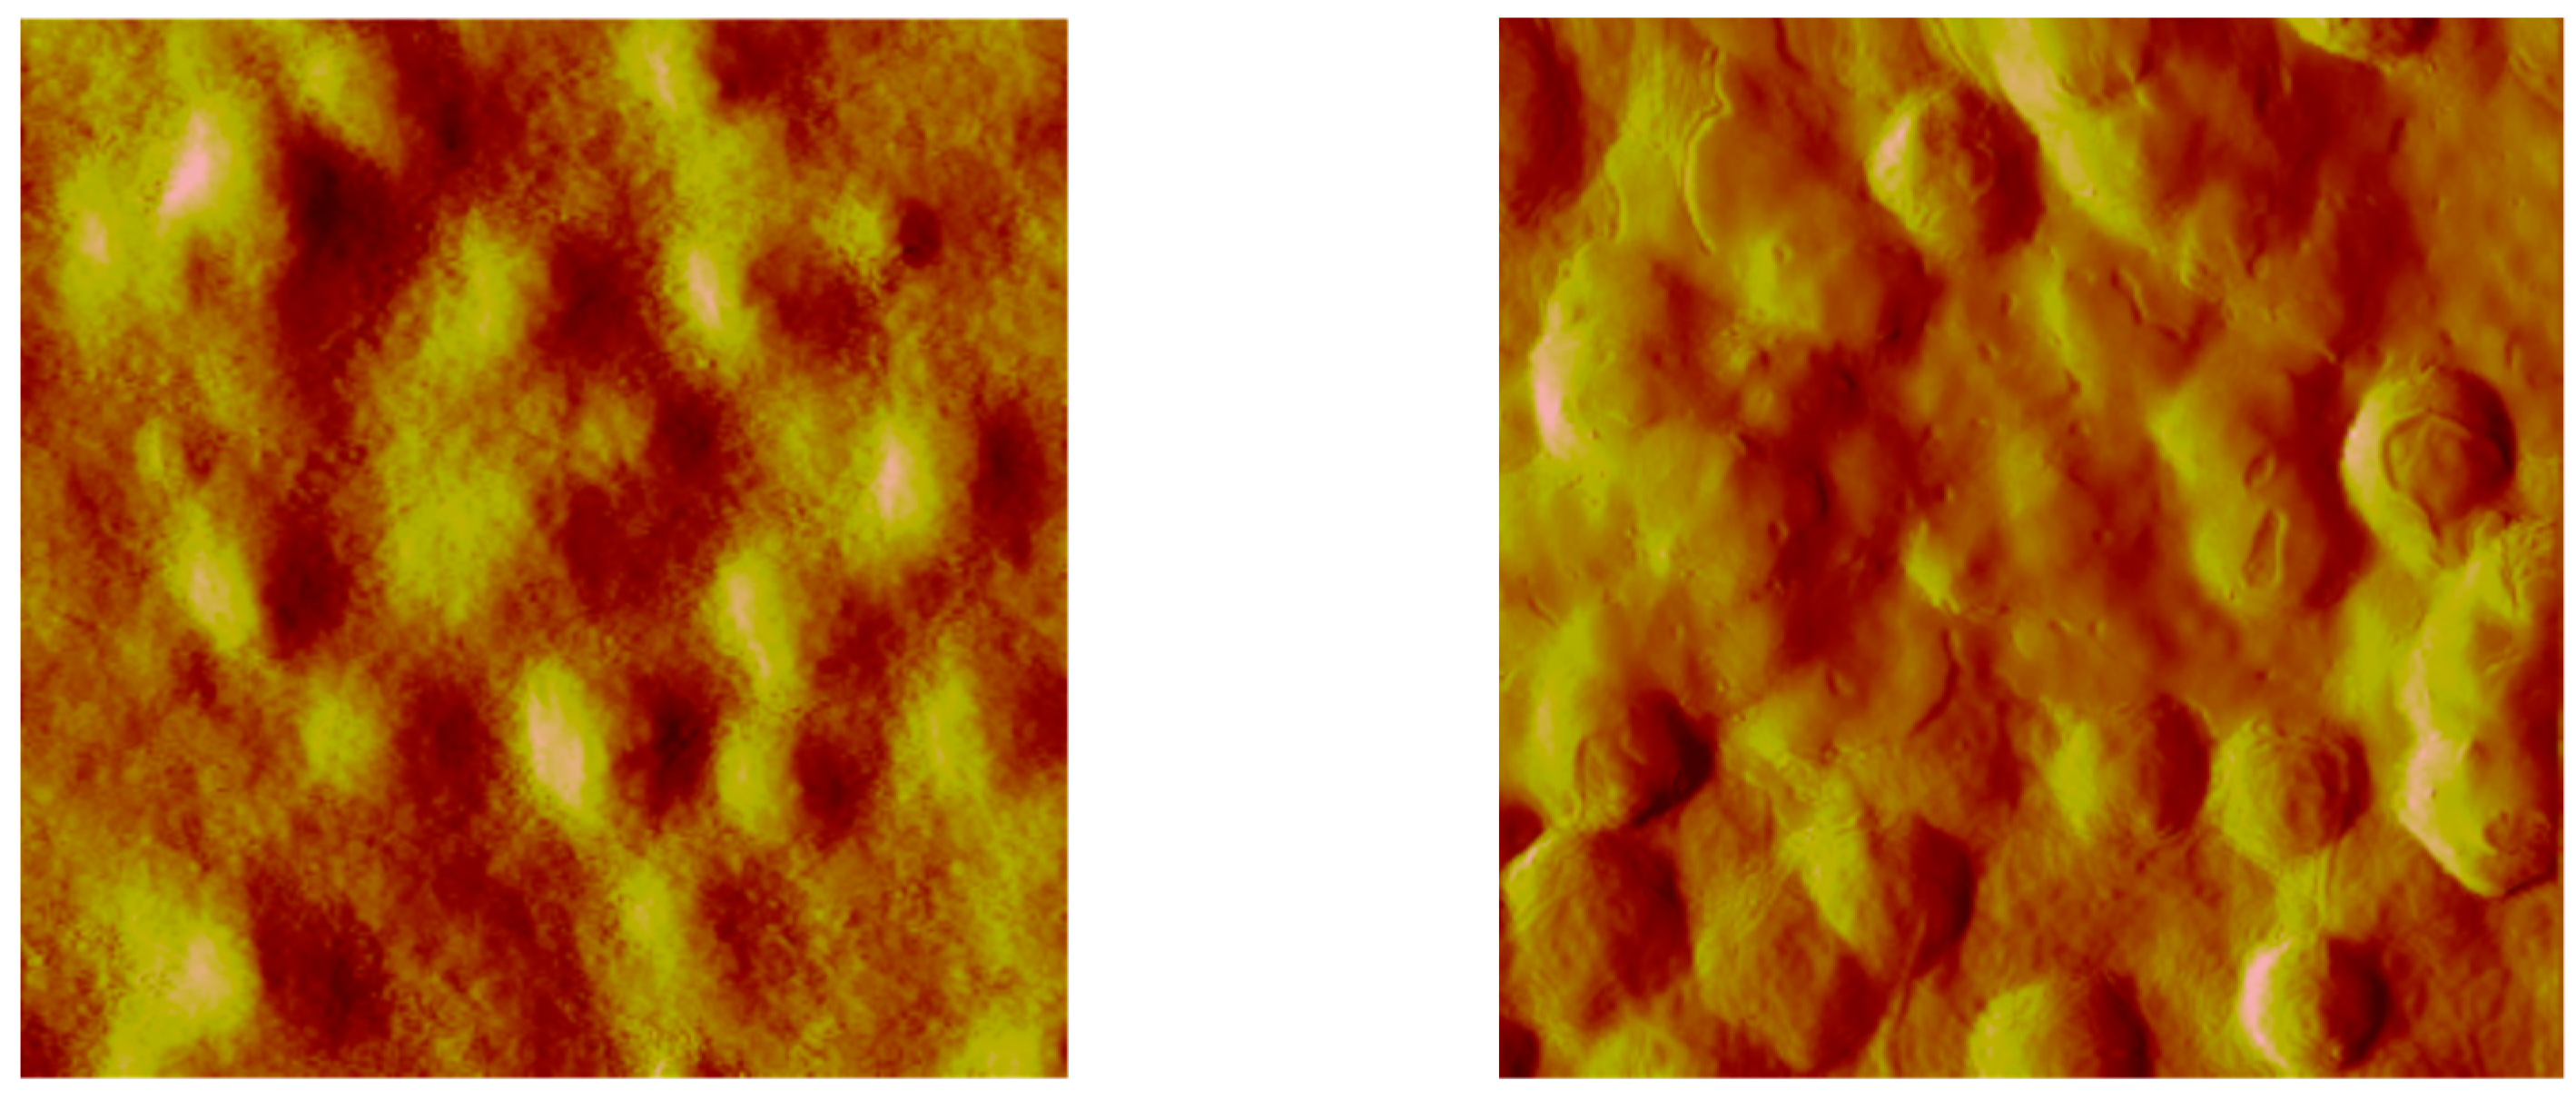
Comparing the AFM images of the surfaces of pristine membranes (on the left of Figure 11 and Figure 12) with used membranes after cleaning (on the right of Figure 11 and Figure 12), the elimination of membrane fouling can be checked.
Taking into account the above-mentioned results, some comments about the costs of membrane processes can be made. RO and NF would present the same energy costs when operated at the same transmembrane pressure. However, the high difference in permeate flux implies that the installed area of RO membranes will be much higher than the installed area of NF membranes. This difference will be lower when it is considered that a part of the feed can bypass the membrane facility in order to blend it with RO permeate to achieve the desired final water quality. On the other hand, the operating costs of RO membranes will be lower than those of NF membranes if it is confirmed that membrane fouling is higher for NF membranes, as our tests have proved. Thus, cleaning costs will be higher for NF membranes. Other techniques for salt elimination, such as ion exchange resins, have been discarded since they are not economically competitive due to the high salt concentration of tannery wastewater.
4. Conclusions
In this work, four membranes were tested to treat biologically treated tannery wastewater in order to eliminate refractory COD and salts.
For the total recycle mode, the influence of TMP on permeate flux was more significant than CFV. The statistical analysis showed that the optimal TMP and CFV values were 20 bar and 1.77 m/s, respectively. For NF membranes, salt rejection ranged between 80–90% at the studied TMPs.
In the concentration mode tests, it was observed that the fouling of NF membranes was higher than the fouling of RO membranes. In addition, the more open NF membrane (M2) exhibited more flux decline than the other NF membrane (M1). Thus, M2 showed a sharp decline (41%) compared with that shown by M1 (12.5%). Maximum durability of the RO membranes due to the low fouling observed could be expected.
As a general conclusion, it can be stated that RO could be the most feasible technique for water reuse in the tannery industry due to the considerably higher rejections and the low membrane fouling.
Further experiments on a larger scale are needed to assess an eventual blending of the feed solution with RO membranes, diminishing, in this way, the operating costs of the process.
Author Contributions
V.F.-M.: investigation, methodology, data curation. M.-A.B.-P.: supervision, conceptualization, data curation, writing—original draft, writing—review and editing. B.C.-U.: supervision, conceptualization, methodology, writing—review and editing. J.-A.M.-R.: supervision, conceptualization, methodology, writing—review and editing. All authors have read and agreed to the published version of the manuscript.
Funding
This research was funded by Universitat Politècnica de València (project ref: PAID-06-10-2269).
Conflicts of Interest
The authors reported no potential conflict of interest. The funders had no role in the design of the study; in the collection, analyses, or interpretation of data; in the writing of the manuscript; or in the decision to publish the results.
References
- Mendoza-Roca, J.A.; Galiana-Aleixandre, M.V.; Lora-García, J.; Bes-Piá, A. Purification of tannery effluents by ultrafiltration in view of permeate reuse. Sep. Purif. Technol. 2010, 70, 296–301. [Google Scholar] [CrossRef]
- Tamersit, S.; Bouhidel, K.E.; Zidani, Z. Investigation of electrodialysis anti-fouling configuration for desalting and treating tannery unhairing wastewater: Feasibility of by-products recovery and water recycling. J. Environ. Manag. 2018, 207, 334–340. [Google Scholar] [CrossRef]
- Gallego-Molina, A.; Mendoza-Roca, J.A.; Aguado, D.; Galiana-Aleixandre, M.V. Reducing pollution from the deliming-bating operation in a tannery. Wastewater reuse by microfiltration membranes. Chem. Eng. Res. Des. 2013, 91, 369–376. [Google Scholar] [CrossRef]
- Bes-Piá, A.; Cuartas-Uribe, B.; Mendoza-Roca, J.A.; Galiana-Aleixandre, M.V.; Iborra-Clar, M.I.; Alcaina-Miranda, M.I. Pickling Wastewater Reclamation by means of Nanofiltration. Desalination 2008, 221, 225–233. [Google Scholar] [CrossRef]
- Sundarapandiyan, S.; Rajeswari, G.; Saravanan, P.; Dhanaselvan, M.C.K.; Ramalingam, S.; Chandrababu, N.K. Electrochemical oxidation and reuse of pickling wastewater from tanneries. J. Am. Leather. Chem. A 2008, 103, 370–376. [Google Scholar]
- Benhadji, A.; Ahmed, M.T.; Djelal, H.; Maachi, R. Electrochemical treatment of spent tan bath solution for reuse. J. Water Reuse Desal. 2018, 8, 123–134. [Google Scholar] [CrossRef] [Green Version]
- Korpe, S.; Rao, P.V.K. Application of advanced oxidation processes and cavitation techniques for treatment of tannery wastewater—A review. J. Environ. Chem. Eng. 2021, 9, 105234. [Google Scholar] [CrossRef]
- Abdelkader, S.E.; El-Gendy, A.S.; El-Haggar, S. Removal of trivalent chromium from tannery wastewater using solid wastes. Innov. Infrastruct. Solut. 2021, 6, 47. [Google Scholar] [CrossRef]
- Genawi, N.M.; Ibrahim, M.H.; El-Naas, M.H.; Alshaik, A.E. Chromium removal from tannery wastewater by electrocoagulation: Optimisation and sludge characterisation. Water 2020, 12, 1374. [Google Scholar] [CrossRef]
- Zakmout, A.; Sadi, F.; Portugal, C.A.M.; Crespo, J.G.; Velizarov, S. Tannery effluent treatment by nanofiltration, reverse osmosis and chitosan modified membranes. Membranes 2020, 10, 378. [Google Scholar] [CrossRef]
- Munz, G.; Gualtiero, M.; Salvadori, L.; Claudia, B.; Lubello, C. Process efficiency and microbial monitoring in MBR (membrane bioreactor) and CASP (conventional activated sludge process) treatment of tannery wastewater. Bioresour. Technol. 2008, 99, 8559–8564. [Google Scholar] [CrossRef]
- Alighardashi, A.; Pakan, M.; Jamshidi, S.; Shariati, F.P. Performance evaluation of membrane bioreactor (MBR) coupled with activated carbon on tannery wastewater treatment. Membr. Water Treat. 2017, 8, 517–528. [Google Scholar] [CrossRef]
- Carucci, A.; Chiavola, A.; Majone, M.; Rolle, E. Treatment of tannery wastewater in a sequencing batch reactor. Water Sci. Technol. 1999, 40, 253–259. [Google Scholar] [CrossRef]
- Balaguer-Arnandis, E.; Cuartas-Uribe, B.; Bes-Pia, M.A.; Mendoza-Roca, J.A.; Galiana-Aleixandre, M.V. Performance Improvement of a Sequencing Batch Reactor for Treating Tannery Wastewaters. Chem. Eng. Technol. 2017, 40, 1666–1673. [Google Scholar] [CrossRef] [Green Version]
- Elkarrach, K.; Merzouki, M.; Laidi, O.; Biyada, S.; Omor, A.; Benlemlih, M. Sequencing batch reactor: Inexpensive and efficient treatment for tannery effluents of Fez city in Morocco. Desalin. Water Treat. 2020, 202, 71–77. [Google Scholar] [CrossRef]
- Abtahi, S.M.; Ilyas, S.; Cassan, C.J.; Albasi, C.; de Vos, W.M. Micropollutants removal from secondary-treated municipal wastewater using weak polyelectrolyte multilayer based nanofiltration membranes. J. Membr. Sci. 2018, 548, 654–666. [Google Scholar] [CrossRef] [Green Version]
- Hafiz, M.; Hawari, A.H.; Alfahel, R.; Hassan, M.K.; Altaee, A. Comparison of nanofiltration with reverse osmosis in reclaiming tertiary treated municipal wastewater for irrigation purposes. Membranes 2021, 11, 32. [Google Scholar] [CrossRef]
- Arola, K.; van der Bruggen, B.; Manttari, M.; Kallioinen, M. Treatment options for nanofiltration and reverse osmosis concentrates from municipal wastewater treatment: A review. Crit. Rev. Environ. Sci. Technol. 2019, 49, 2049–2116. [Google Scholar] [CrossRef]
- Khosravi, M.J.; Hosseini, S.M.; Vatanpour, V. Performance improvement of PES membrane decorated by Mil-125(Ti)/chitosan nanocomposite for removal of organic pollutants and heavy metal. Chemosphere 2022, 290, 133335. [Google Scholar] [CrossRef]
- Amiri, S.; Asghari, A.; Vatanpour, V.; Rajabi, M. Fabrication and characterization of a novel polyvinyl alcohol-graphene oxide-sodium alginate nanocomposite hydrogel blended PES nanofiltration membrane for improved water purification. Sep. Purif. Technol. 2020, 250, 117216. [Google Scholar] [CrossRef]
- Barzegar, H.; Shahsavarifar, S.; Vatanpour, V.; Masteri-Farahani, M. Peroxopolyoxometalate nanoparticles blended PES membrane with improved hydrophilicity, anti-fouling, permeability, and dye separation properties. J. Appl. Polym. Sci. 2021, 138, 50764. [Google Scholar] [CrossRef]
- de Gisi, S.; Galasso, M.; de Feo, G. Treatment of tannery wastewater through the combination of a conventional activated sludge process and reverse osmosis with a plane membrane. Desalination 2009, 249, 337–342. [Google Scholar] [CrossRef]
- Jang, A.; Jung, J.T.; Kang, H.; Kim, H.S.; Kim, J.O. Reuse of effluent discharged from tannery wastewater treatment plants by powdered activated carbon and ultrafiltration combined reverse osmosis system. J. Water Reuse Desal. 2017, 7, 97–102. [Google Scholar] [CrossRef] [Green Version]
- American Public Health Association; American Water Works Association; Water Pollution Control Federation. Standard Methods for Examination of Water and Wastewater; Santos, S.A.D., Ed.; APHA/AWWA/WPCF: Madrid, Spain, 1992. [Google Scholar]
- Tonova, K.; Lazarova, M.; Dencheva-Zarkova, M.; Paniovska, S.; Tsibranska, I.; Stanoev, V.; Dzhonova, D.; Genova, J. Separation of glucose, other reducing sugars and phenolics from natural extract by nanofiltration: Effect of pressure and cross-flow velocity. Chem. Eng. Res. Des. 2020, 162, 107–116. [Google Scholar] [CrossRef]
- Irigoyen, J.; Laakso, T.; Politakos, N.; Dahne, L.; Pihlajamäki, A.; Mänttäri, M. Design and performance evaluation of hybrid nanofiltration membranes based on multiwalled carbon nanotubes and polyelectrolyte multilayers for larger ion rejection and separation. Macromol. Chem. Phys. 2016, 217, 804–811. [Google Scholar] [CrossRef]
- Ogawa, N.; Kimura, K.; Watanabe, Y. Membrane fouling in nanofiltration/reverse osmosis membranes coupled with a membrane bioreactor used for municipal wastewater treatment. Desalin. Water Treat. 2018, 18, 292–296. [Google Scholar] [CrossRef]
- Haan, T.Y.; Ghani, M.S.H.; Mohammad, A.W. Physical and Chemical Cleaning for Nanofiltration/Reverse Osmosis (NF/RO) Membranes in Treatment of Tertiary Palm Oil Mill Effluent (POME) for Water Reclamation. J. Kejuruteraan SI 2018, 1, 51–58. [Google Scholar] [CrossRef]
- Hacifazlioglu, M.C.; Parlar, I.; Pek, T.O.; Kabay, N. Evaluation of chemical cleaning to control fouling on nanofltration and reverse osmosis membranes after desalination of MBR effluent. Desalination 2019, 466, 44–51. [Google Scholar] [CrossRef]
Figure 1.
Operating modes. Total recycle and concentration modes.

Figure 2.
Influence of TMP on the permeate flux at different CFVs for: (a) 0.89 L·h−1; (b) 1.33 L·h−1; (c) 1.77 L·h−1.
Figure 2.
Influence of TMP on the permeate flux at different CFVs for: (a) 0.89 L·h−1; (b) 1.33 L·h−1; (c) 1.77 L·h−1.

Figure 3.
Main effect chart: influence of TMP and CFV on Jp for (a) NF270, (b) NF Duraslick, (c) RO Duraslick, and (d) SWC3.
Figure 3.
Main effect chart: influence of TMP and CFV on Jp for (a) NF270, (b) NF Duraslick, (c) RO Duraslick, and (d) SWC3.

Figure 4.
Influence of TMP on salt retention at different CFVs: (a) 0.89 L·h−1; (b) 1.33 L·h−1; (c) 1.77 L·h−1.
Figure 4.
Influence of TMP on salt retention at different CFVs: (a) 0.89 L·h−1; (b) 1.33 L·h−1; (c) 1.77 L·h−1.

Figure 5.
Main effect chart: influence of TMP and CFV on RSalt for (a) NF270, (b) NF Duraslick, (c) RO Duraslick, and (d) SWC3.
Figure 5.
Main effect chart: influence of TMP and CFV on RSalt for (a) NF270, (b) NF Duraslick, (c) RO Duraslick, and (d) SWC3.

Figure 6.
Influence of TMP on sodium ion (a) and chloride ion (b) retention at CFV = 0.89 m·s−1 for the tested membranes.
Figure 6.
Influence of TMP on sodium ion (a) and chloride ion (b) retention at CFV = 0.89 m·s−1 for the tested membranes.

Figure 7.
Influence of concentration factor (CF) on permeate flux.

Figure 8.
Influence of concentration factor (CF) on RSalt.

Figure 9.
Influence of concentration factor (CF) on monovalent ion rejections: (a) sodium ion, (b) chloride ion.
Figure 9.
Influence of concentration factor (CF) on monovalent ion rejections: (a) sodium ion, (b) chloride ion.

Figure 10.
SEM Images for the fouled M3 membrane after the concentration mode test. Left: 100 μm. Right: 6 μm.
Figure 10.
SEM Images for the fouled M3 membrane after the concentration mode test. Left: 100 μm. Right: 6 μm.

Figure 11.
AFM images for M1 membrane (10 μm). Left: new membrane. Right: membrane after chemical cleaning.
Figure 11.
AFM images for M1 membrane (10 μm). Left: new membrane. Right: membrane after chemical cleaning.

Figure 12.
AFM images for M2 membrane (1 μm). Left: new membrane. Right: membrane after chemical cleaning.
Figure 12.
AFM images for M2 membrane (1 μm). Left: new membrane. Right: membrane after chemical cleaning.


Table 1.
SBR effluent characterisation samples.
| For Total Recycle Mode Tests | For Concentration Mode Tests | |
|---|---|---|
| Parameter | Value | Value |
| pH | 8.28 ± 0.10 | 8.11 ± 0.10 |
| Conductivity (μS·cm−1) | 8510 ± 85.1 | 7760 ± 77.6 |
| Turbidity (NTU) | 0.85 ± 0.01 | 0.92 ± 0.01 |
| Cr3+ (mg·L−1) | 0.00 | 0.00 |
| Cl− (mg·L−1) | 2520 ± 22.68 | 2480 ± 22.32 |
| SO42− (mg·L−1) | 1160 ± 10.44 | 630 ± 5.7 |
| Na+ (mg·L−1) | 1760 ± 14.08 | 1420 ± 11.36 |
| Ca2+ (mg·L−1) | 410 ± 3.4 | 350 ± 2.9 |
| Mg2+ (mg·L−1) | 124 ± 1.24 | 144 ± 1.44 |
| COD (mg·L−1) | 240 ± 12 | 100 ± 5 |
| Toxicity (Equitox·m−3) | 0 | 0 |
Table 2.
Characteristics of the NF membranes.
| Membrane | NF Duraslick | NF-270 |
|---|---|---|
| Material | Polyamide | Aromatic Polyamide |
| Maximum pressure (bar) | 41 | 41 |
| Maximum operating temperature (°C) | 50 | 45 |
| Chlorine tolerance | 500 ppm-h Dechlorination recommended | <0.1 ppm |
| pH range | 2–11 | 2–11 |
| % Retention MgSO4 (25 °C) | 96 | >97 |
| Typical operating flux (L·h−1·m−2) | 15–25 | - |
| Maximum feed flow (m3·day−1) | - | 3.2 |
Table 3.
Characteristics of the RO membranes.
| Membrane | RO Duraslick | RO SWC3 |
|---|---|---|
| Material | Polyamide | Aromatic Polyamide |
| Maximum pressure (bar) | 41 | 83 |
| Maximum operating temperature (°C) | 50 | 45 |
| Chlorine tolerance | 500 ppm-h Dechlorination recommended | <0.1 ppm |
| pH range | 4–11 | 3–11 |
| % Retention MgSO4 (25 °C) | 97 | >99 |
| Typical operating flux (L·h−1·m−2) | 15–25 | - |
| Maximum feed flow (m3·day−1) | - | 17 |
Table 4.
Optimal TMP and CFV for maximising JP. Comparison between empirical and experimental values.
Table 4.
Optimal TMP and CFV for maximising JP. Comparison between empirical and experimental values.
| Parameter | Membrane | |||
|---|---|---|---|---|
| M1 | M2 | M3 | M4 | |
| TMPoptimal (bar) | 20 | 20 | 20 | 20 |
| CFVoptimal (m·s−1) | 1.77 | 1.77 | 1.77 | 1.77 |
| JP_empirical (L·m−2·h−1) | 105 | 67.07 | 23.63 | 18.83 |
| JP_experimental (L·m−2·h−1) | 105.57 | 67.35 | 24.98 | 18.53 |
| Deviation error (%) | 0.54 | 0.42 | 5.73 | 1.61 |
Table 5.
Equations from the multiple regression statistical model for JP (total recycle mode).
| JP = −0.245821 + 6.58937 · TMP − 18.6966 · CFV − 0.0569 · TMP2 + 0.205114 · TMP · CFV + 7.03771 · CFV2 | Equation (5) (M1) |
| JP = 12.1096 + 3.70292 · TMP − 10.2743 · CFV − 0.0282 · TMP2 − 0.242045 · TMP · CFV + 6.04339 · CFV2 | Equation (6) (M2) |
| JP = 4.81371 + 1.98553 · TMP − 17.7852 · CFV − 0.0247667 · TMP2 − 0.0278409 · TMP · CFV + 6.73209 · CFV2 | Equation (7) (M3) |
| JP = 7.8469 + 1.51421 · TMP − 22.4112 · CFV − 0.0269333 · TMP2 + 0.271023 · TMP · CFV + 6.87844 · CFV2 | Equation (8) (M4) |
Table 6.
Effect of TMP and CFV on salt rejections in terms of p-values.
| p-Values | ||
|---|---|---|
| Membrane | TMP (bar) | CFV (m·s−1) |
| M1 | 0.0000 | 0.2372 |
| M2 | 0.2018 | 0.9375 |
| M3 | 0.8971 | 0.8417 |
| M4 | 0.8736 | 0.6209 |
Table 7.
Optimal parameters for maximising RSalt according to Statgraphics. Comparison between empirical and experimental values.
Table 7.
Optimal parameters for maximising RSalt according to Statgraphics. Comparison between empirical and experimental values.
| Parameter | Membrane | |||
|---|---|---|---|---|
| M1 | M2 | M3 | M4 | |
| TMPoptimal (bar) | 20 | 20 | 15.2 | 20 |
| CFVoptimal (m·s−1) | 0.89 | 0.89 | 0.89 | 0.89 |
| JP_empirical (L·m−2·h−1) | 92.57 | 86.30 | 98.65 | 99.35 |
| JP_experimental (L·m−2·h−1) | 94.09 | 88.60 | 99.23 | 99.60 |
| Deviation error (%) | 1.64 | 2.67 | 0.60 | 0.28 |
Table 8.
Equations from the multiple regression statistical model for Rsalt (total recycle mode).
| RSalt = 58.0939 + 4.69936 · TMP − 17.8002 · CFV − 0.0943 · TMP2 − 0.877841 · TMP · CFV + 12.2159 · CFV2 | Equation (9) (M1) |
| RSalt = 93.9891 + 2.9747 · TMP − 58.6342 · CFV − 0.0556 · TMP2 − 0.761932 · TMP · CFV + 26.2655 · CFV2 | Equation (10) (M2) |
| RSalt = 99.2921 + 0.18217 · TMP − 3.31018 · CFV − 0.0055 · TMP2 − 0.0170455 · TMP · CFV + 1.30424 · CFV2 | Equation (11) (M3) |
| RSalt = 100.002 − 0.0197348 · TMP − 0.870954 · CFV + 0.0004 · TMP2 + 0.00681818 · TMP · CFV + 0.271178 · CFV2 | Equation (12) (M4) |
Table 9.
Recovery of permeate flux (%) after cleaning procedure.
| Cleaning Step | Membrane | |||
|---|---|---|---|---|
| M1 | M2 | M3 | M4 | |
| After rinsing | 79.53 | 73.05 | 93.22 | 100 |
| After alkaline cleaning | 92.11 | 96.17 | - | - |
Publisher’s Note: MDPI stays neutral with regard to jurisdictional claims in published maps and institutional affiliations. |
© 2022 by the authors. Licensee MDPI, Basel, Switzerland. This article is an open access article distributed under the terms and conditions of the Creative Commons Attribution (CC BY) license (https://creativecommons.org/licenses/by/4.0/).
Share and Cite
MDPI and ACS Style
Fernández-Medrano, V.; Cuartas-Uribe, B.; Bes-Piá, M.-A.; Mendoza-Roca, J.-A. Application of Nanofiltration and Reverse Osmosis Membranes for Tannery Wastewater Reuse. Water 2022, 14, 2035. https://doi.org/10.3390/w14132035
AMA Style
Fernández-Medrano V, Cuartas-Uribe B, Bes-Piá M-A, Mendoza-Roca J-A. Application of Nanofiltration and Reverse Osmosis Membranes for Tannery Wastewater Reuse. Water. 2022; 14(13):2035. https://doi.org/10.3390/w14132035
Chicago/Turabian StyleFernández-Medrano, Vilma, Beatriz Cuartas-Uribe, María-Amparo Bes-Piá, and José-Antonio Mendoza-Roca. 2022. "Application of Nanofiltration and Reverse Osmosis Membranes for Tannery Wastewater Reuse" Water 14, no. 13: 2035. https://doi.org/10.3390/w14132035
Note that from the first issue of 2016, this journal uses article numbers instead of page numbers. See further details here.