
Effects of Weather Extremes on the Nutrient Dynamics of a Shallow Eutrophic Lake as Observed during a Three-Year Monitoring Study


Geobiology, Geoscience Centre, University of Göttingen, Goldschmidtstraße 3, 37077 Göttingen, Germany
*
Authors to whom correspondence should be addressed.
†
Current address: Geobiology, Institute of Geology and Mineralogy, University of Cologne, Zülpicher Straße 49a, 50674 Cologne, Germany.
Water 2022, 14(13), 2032; https://doi.org/10.3390/w14132032
Submission received: 13 May 2022
/
Revised: 20 June 2022
/
Accepted: 23 June 2022
/
Published: 25 June 2022
(This article belongs to the Section Water Quality and Contamination)
Abstract
:The formation of algal and cyanobacterial blooms caused by the eutrophication of water bodies is a growing global concern. To examine the impact of extreme weather events on blooms, eutrophication-related parameters (e.g., water temperature, nitrate, ammonium, nitrite, and soluble reactive phosphate (SRP)) were quantitatively assessed monthly over three years (2017–2019) at Lake Seeburg (Central Germany), a shallow eutrophic lake with regular cyanobacterial blooms. In addition, SRP concentrations in sediment pore water were assessed monthly for one year (2018). The monitoring period included a three-day extremely heavy rain event in 2017 as well as a severe drought in summer 2018. No such extreme weather conditions occurred in 2019. After the heavy rain event in 2017, anoxic water containing high levels of ammonium and SRP entered the lake from flooded upstream wetlands. This external nutrient spike resulted in a heavy but short (3 weeks) and monospecific cyanobacterial bloom. A different situation occurred during the exceptionally hot and dry summer of 2018. Especially favored by high water temperatures, SRP concentrations in sediment pore waters gradually increased to extreme levels (34.4 mg/L). This resulted in a strong and sustained internal SRP delivery into the water column (69 mg/m2·d−1), which supported the longest-lasting cyanobacterial bloom (3 months) within the three-year monitoring period. Subsequent biomass decay led to oxygen-depleted conditions in the bottom waters, elevated ammonium, and, later, nitrate concentrations. Our observations demonstrate the particular effects of extreme weather events on nutrient dynamics and the phytoplankton composition in the lake. As the frequency and intensity of such events will likely increase due to climate change, their impacts need to be increasingly considered, e.g., in future remediation strategies.
1. Introduction
Anthropogenic eutrophication of lake waters is a matter of growing global concern. The overabundance of nutrients leads to effects such as phytoplankton blooms and oxygen deficiency, which negatively impact lake ecosystems. Furthermore, cyanobacterial blooms can pose an immediate threat to animals and humans due to their production of hazardous toxins [1,2,3]. Climate change and the associated increase in extreme weather events such as heavy rainfalls or heat waves will likely exacerbate negative eutrophication phenomena in lakes in the future [4,5,6,7].
Various changes in lake water bodies due to extreme weather events have been described in the literature. Heavy rain events can contribute to significant short-term changes such as nutrient inputs from soil erosion in the catchment [8] or increased turbidity in the waterbody itself [9]. Hot and dry periods can result in declining water levels, which is often associated with increased conductivity [10] and increased nutrient release from the sediment [7]. Both heavy rain events and dry periods can change the organism composition of lake waterbodies, often with a competitive advantage for cyanobacteria [11].
Well-studied examples of lakes exhibiting these problems are the shallow lakes of Taihu (China) and Lake Okeechobee (FL, USA). Lake Taihu, the third-largest freshwater lake in China, with high concentrations of anthropogenic nutrients, recently experienced its largest cyanobacterial bloom, exacerbated by high rainfalls and a subsequent much warmer winter due to the El Niño effect [12]. In Lake Okeechobee, the third-largest lake in the USA, three hurricanes caused increased nutrient loads, water levels, and turbidity that lasted two years and had a significant impact on the phytoplankton community and submersed aquatic vegetation [13].
To better protect vulnerable lake environments and design proper management strategies, it is necessary to understand how and in what time frames different lake ecosystems may be affected by, and respond to, such external forcing. Here, we report on nutrient and microorganism dynamics at Lake Seeburg, a small (0.89 km2) and shallow (average depth 2 m) unstratified lake in central Germany. As a result of ongoing eutrophication, the lake has been suffering from recurrent cyanobacterial blooms in recent decades. The frequency and intensity of these blooms tend to increase, similar to various other inland lakes around the world [14].
Small lakes, such as Lake Seeburg, are particularly exposed to nutrient inputs due to their low water volume and proximity to adjacent agricultural land [15]. Although they account for the largest share of inland water bodies in central Europe in terms of surface area, small lakes are strongly underrepresented in environmental studies. For example, more than 90% of all water systems in Germany have a catchment area of ≤10 km2 and are, therefore, not considered by the European Water Framework Directive (WFD). This contrasts with the fact that small lakes often harbor even greater biodiversity than larger water bodies and, thus, play a particularly important ecological role [16,17]. Likewise, the high value of many small lakes to residential populations in terms of nature experience, recreation, and local economy makes it worthwhile to develop appropriate management and remediation strategies.
Our 3-year monitoring study of key nutrients allowed us to gain insight into the complex biogeochemical processes that govern the ecology of Lake Seeburg. In two of the three years of observation, extreme weather conditions occurred in the study area. Between 24 and 26 July 2017, a heavy rain event with precipitation of ~120 L/m2 (almost twice the normal rainfall in a month) was recorded, leading to widespread floodings in the catchment area of Lake Seeburg [18]. The total sum of rain for the month of July reached about 200 L/m2 in the study area and was, thus, 2.7 times higher than average [19]. In 2018, in contrast, there was a severe drought with very little rainfall between February and October (49% of the long-term average) and high average temperatures (+1.1 °C compared to the long-term average) [19]. In this study, we report on the effects of these events on the seasonal and interannual nutrient dynamics and the associated varying microorganism composition of Lake Seeburg. Knowledge of the expected ecological consequences of such events enables early recognition of the resulting environmental impact and initiation of appropriate countermeasures.
2. Materials and Methods
2.1. Sampling Location
Lake Seeburg is located in central Germany, about 15 km E of the city of Göttingen (51°33′52″ N, 10°09′52″ E). It covers 0.89 km2 and has a water volume of 2 million m3, a mean water depth of 2 m, and a maximum water depth of 4 m [20]. The lake is a water-filled sinkhole and was formed by subsurface leaching of Permian evaporites about 10,000 years ago [20]. The lake has been a natural reserve since 1973 and is classified as a special flora–fauna habitat area and an EU bird reserve.
Lake Seeburg is used for non-commercial fishing and as an official swimming lake in summer (R13A50002403152002, EU Bathing Directive). The area surrounding the lake is only sparsely populated with small villages, and no industry is located in the catchment. Residential wastewater is not allowed to be discharged into the lake, nor the inflow; the absence of such contamination has been recently confirmed [21]. Most of the catchment area is used for agriculture; the resulting inputs of pesticides and their metabolites into the lake have recently been characterized [21].
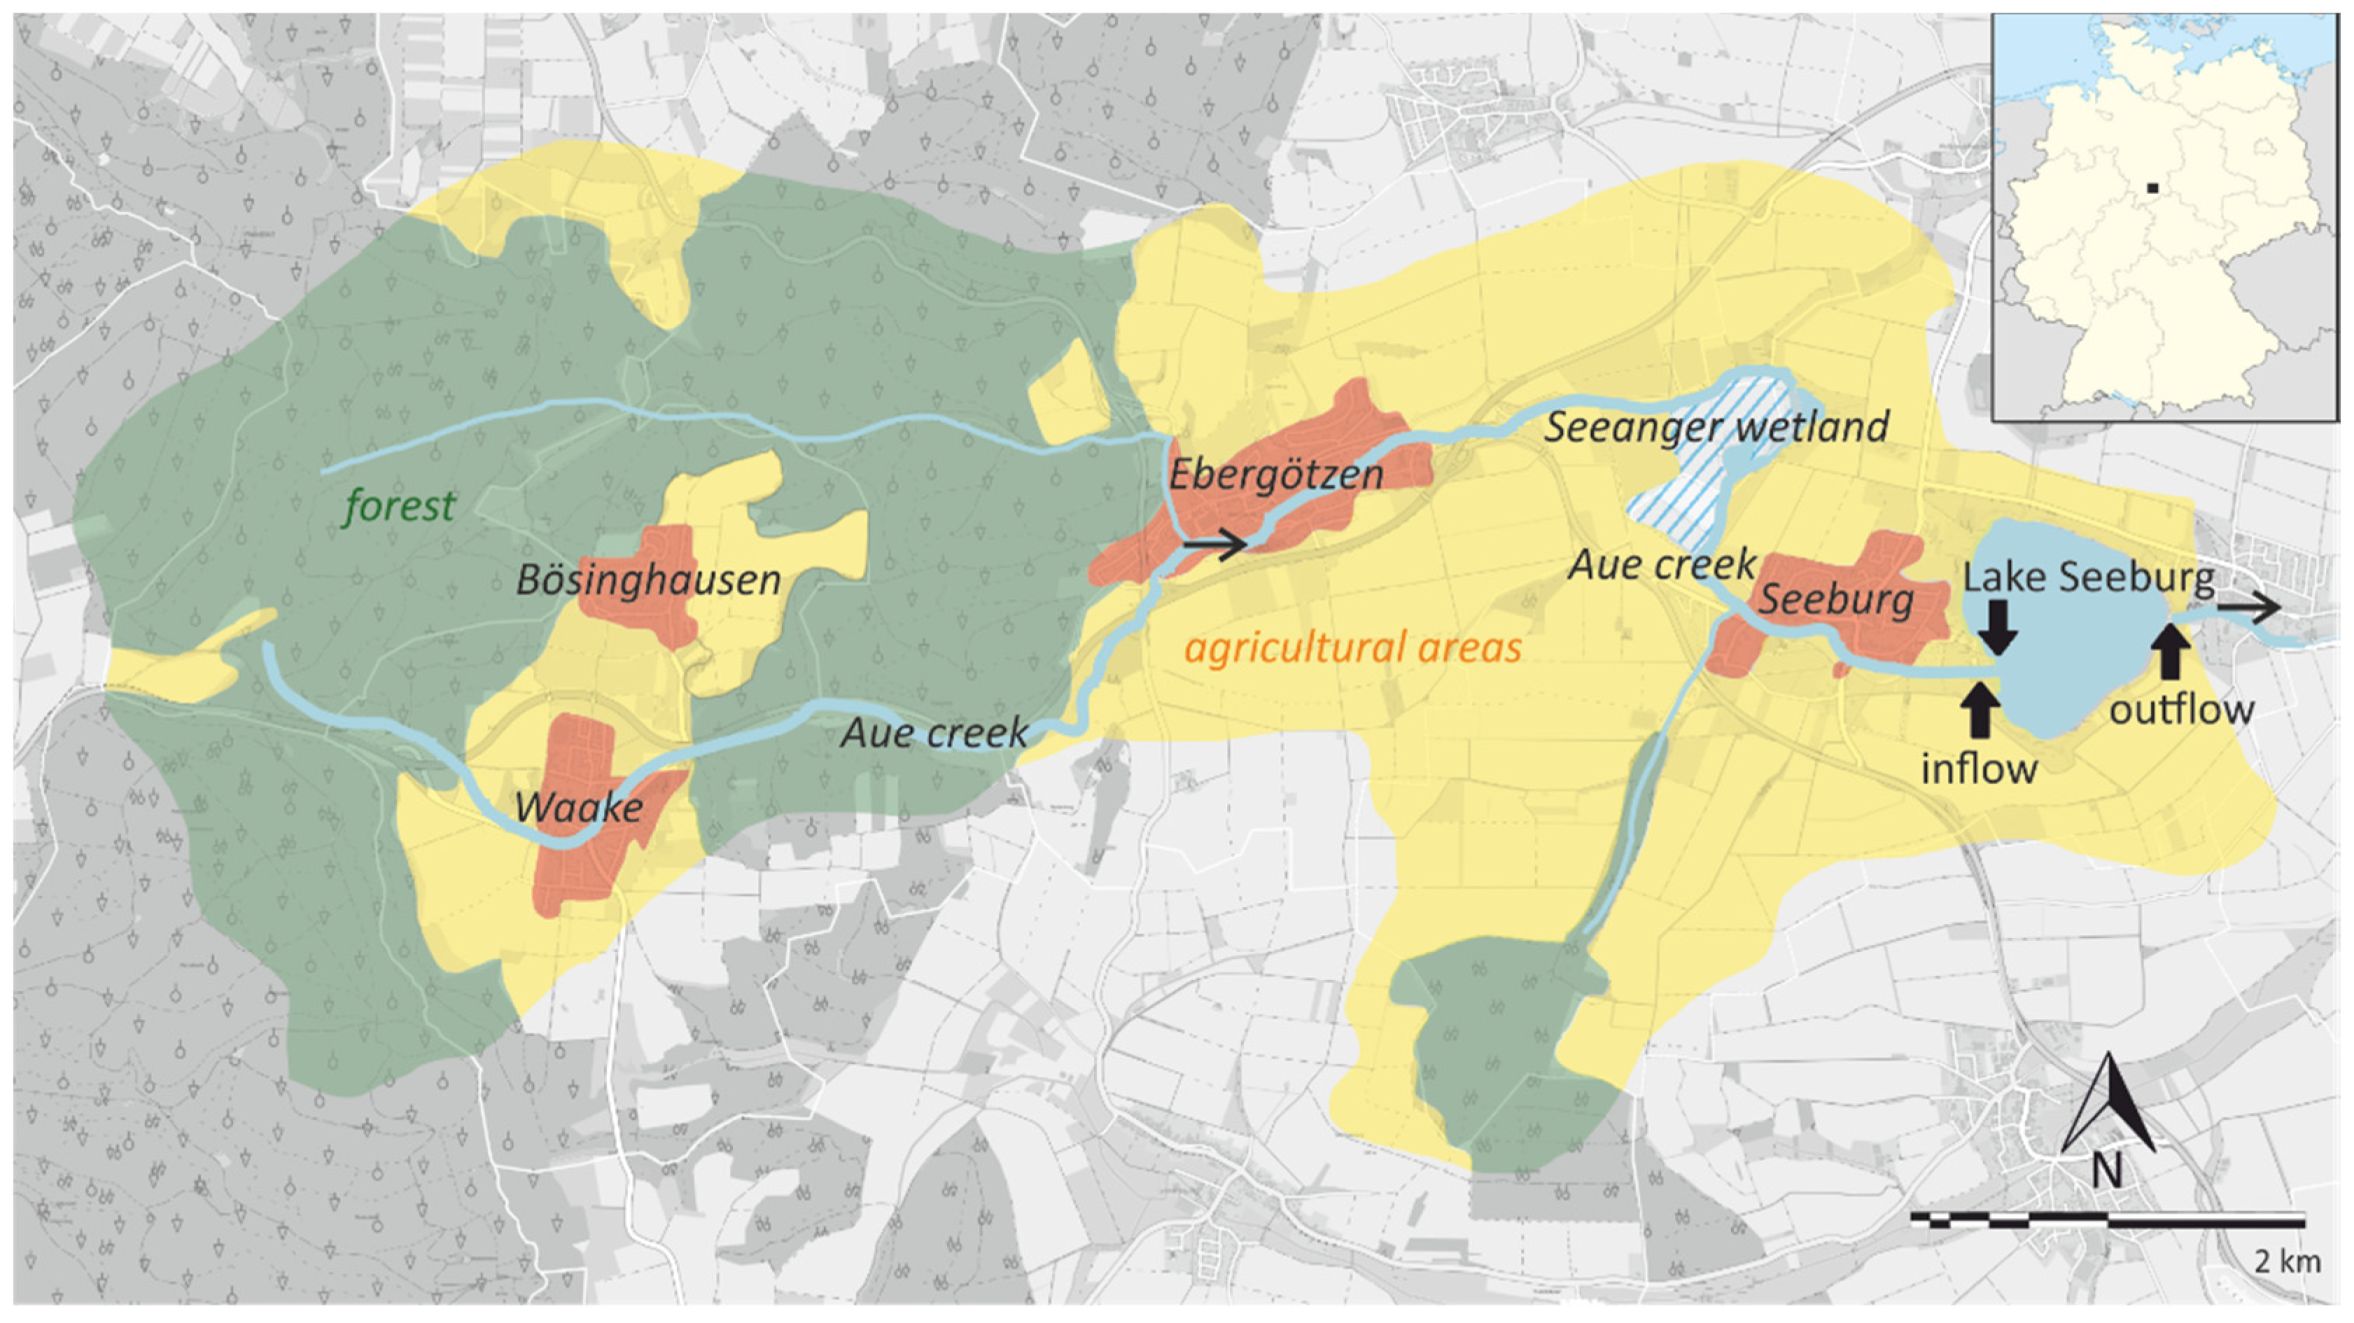
The lake has only one significant inflow, the Aue creek. Before entering the lake, about 1.5 km upstream, the Aue creek passes the so-called Seeanger, a wetland with a central, few-decimeter-deep pond (Figure 1; see also Figure S1 in Supplementary Materials). The Seeanger wetland was formerly drained and used for agriculture but re-established in 2003 to renature the ecosystem. Other intentions were to reduce the nutrient input into Lake Seeburg and to create a flood plain and sediment trap for the Aue creek, reducing the particle load, especially after heavy rainfall events. Due to high nutrient inputs over the last decades, Lake Seeburg is currently considered to be strongly eutrophic to polytrophic, with recurring algal (i.e., cyanobacterial) blooms recorded since 2005 [22,23].
To assess the nutrient dynamics of the lake, especially for N and P, we conducted a long-term monitoring campaign. Water sampling and analyses were carried out monthly at the main inflow (Aue creek), in the western part of the lake (pier), and in the eastern part near the main outflow over a period of 36 months between January 2017 and December 2019. Sediment sampling for pore water analysis was performed simultaneously with water sampling in the western part of the lake in 2018. The sampling locations are shown in Figure 1.
2.2. Analytical Methods
At each sampling location, 100 mL of water was collected from the water surface using Zinsser Polyvials (Purell) from Zinsser Analytic. Push cores from lake sediments were taken and sectioned in 1–2 cm sub-samples. The top two centimeters were used as “surface sediments” in this study. Pore water was obtained by centrifuging, and subsequent analyses were identical to those of the lake water described below.
Pore- and lake-water samples were stored at 4 °C and analyzed within days after sampling. To fix the ammonium for later measurements, 5 mL of each sample was acidified with 5 µL of concentrated nitric acid. Temperature and pH were analyzed in situ using a multi-parameter portable meter (Multiline 3630 IDS, WTW GmbH, London, UK) with a corresponding SenTix 940 electrode. Conductivity was measured in situ with a TetraCon 925 electrode, and oxygen concentration was measured with an FDO 925 electrode. For the calibration of the conductivity electrode, a 0.01 mol/L KCl calibration standard was used, and for the pH electrode, a technical buffer, according to ISO 7888 (both from WTW). The runoff measurements of the Aue creek were performed in situ using an OTT C2 hydrometric measuring blade with an OTT Z400 flowmeter from OTT HydroMet and a transverse distance of 10 cm.
Our study focused on bioavailable macronutrient fluxes, particularly soluble nitrogen and phosphorus species. Nitrite and soluble reactive phosphate (SRP) were analyzed via photometry according to EN ISO 6878 for SRP and EN ISO 26777, using a UviLine 9400 photometer by SI-Analytics. Nitrate and ammonium were analyzed by ion chromatography (IC) using an 883 Basic IC plus chromatograph by Metrohm. Prior to measurement, water samples were filtrated with 0.45 µm nylon filters by Carl Roth GmbH. For separation, a Metrosep A. Supp. 5, 250 × 4.0 mm was used. The separation was performed at 25 °C, and the injection volume was set to 20 µL at a flow rate of 0.7 mL/min. The eluents were 3.2 mmol/L Na2CO3 and 1.0 mmol/L NaHCO3.
Ammonium was analyzed via IC using an 820 IC separation unit, an 818 IC pump unit, an 837 IC degasser unit, and an 819 IC detector by Metrohm. Before measurement, filtered (mesh 0.22 µm) and acidified (0.1% HNO3) water samples were diluted 1:2 with 3.0 mM HNO3. For separation, a Metrosep C3, 250 × 4.0 mm was used. The column oven was performed at 40 °C; the injection volume was set to 20 µL at a flow rate of 1.0 mL/min. The eluent was 4.5 mmol HNO3. IC-Standard tables are attached in the supplementary information (Table S1).
Identification of microorganisms in the lake was performed microscopically using a Carl Zeiss Axio Scope.A1.
3. Results and Discussion
The seasonal course of temperature, nitrite, ammonium, nitrate, and SRP between 2017 and 2019 is shown in Figure 2. The minimum, maximum, and average concentrations at the sampling points are presented in Table 1. For detailed data, see Table S2. Due to the mostly high similarity of the data obtained from the western part (pier) and the eastern part (outflow) of Lake Seeburg, the results are jointly reported as “lake” in the following text unless otherwise noted.
3.1. Temperature, Precipitation, and Runoff Measurements
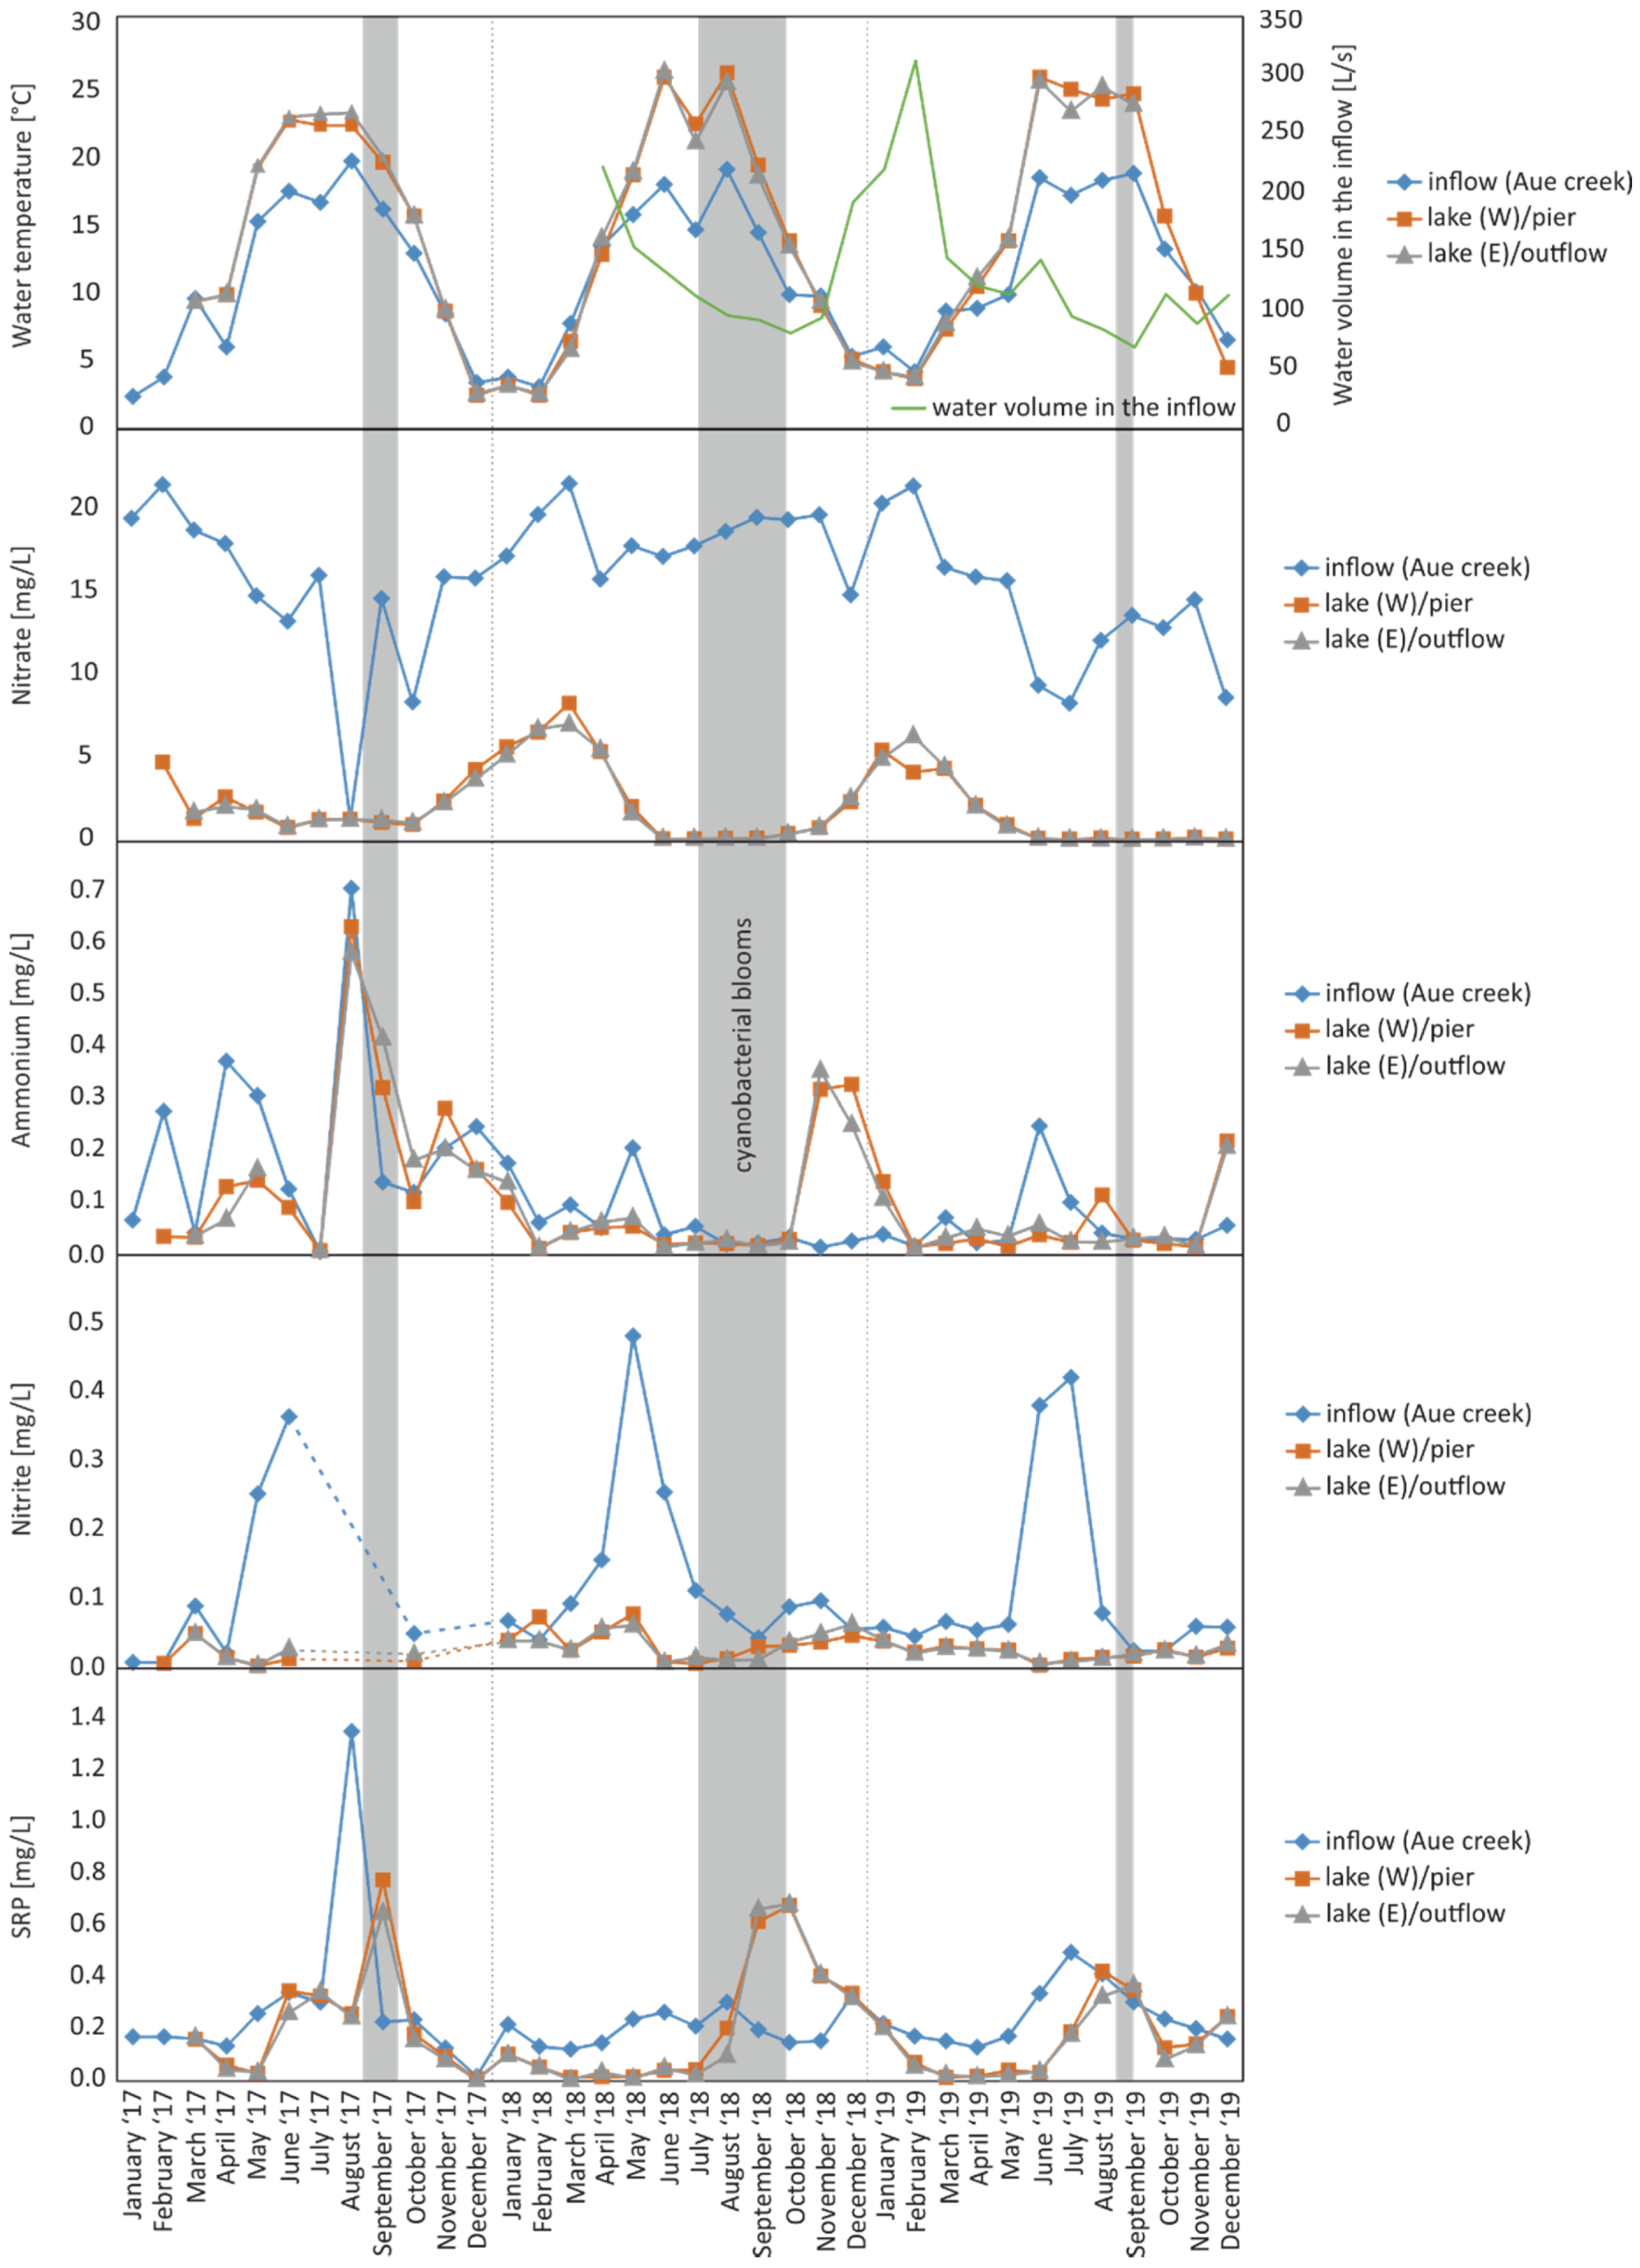
Temperatures in the inflow (Aue creek) varied between 2.4 °C in winter and 19.5 °C in summer. In the lake, temperatures ranged from 2.6–26.0 °C. While the peak temperatures in the inflow were relatively similar between the years, they differed in the lake. The hottest year was 2018 (26.0 °C in June), followed by 2019 (25.6 °C in June) and 2017 (23.0 °C in August). The annual means were 10.9–11.6 °C in the inflow and 13.7–15.3 °C in the lake. Again, the highest temperatures were observed in 2018. While the inflow and lake temperatures were similar during the winter, the lake water was consistently warmer from April through October.
Between April 2018 and December 2019, additional runoff measurements were taken in the Aue creek (Figure 2, for detailed data, see Table S3). The inflow steadily decreased from 225 L/s in April to 84 L/s in October 2018. Over the winter months, the inflow increased to 315 L/s in February 2019 before it declined again with rising temperatures, stabilizing around 100 L/s between June and October 2019.
The observation period covered a year with a multi-day heavy rain event (2017), a very dry and hot year (2018), as well as a year with no major weather-related events (2019). After the 2017 heavy rain event, the slow drainage of the upstream Seeanger wetland resulted in continued flooding that lasted for several weeks. Concomitantly, the inflow into the lake increased and remained high until the following winter (own visual observations, measurements started later in 2018). The flooding of the Seeanger wetland was also associated with pronounced oxygen depletion in the flooded area and, consequently, in the inflow. Indeed, oxygen levels observed in the Aue creek were typically >6 mg/L throughout the three years but dropped to 0.22 mg/L in August 2017 (Table S2).
Unlike in 2017, there were no major rain events in the summers of 2018 and 2019, and thus, no large-scale flooding occurred in the Seeanger wetland. Instead, in 2018, a severe drought, with very little rainfall, between February and October (49% of the long-term average [19]) resulted in an ever-decreasing inflow into the lake throughout the summer (Figure 2). Apart from a short cold snap in July, which was reflected in a temperature drop of the inflow and the lake water (Figure 2), it was mostly warmer than average (+1.1 °C compared to the long-term average [19]). In comparison, 2019 represented a year with less extreme weather conditions. Again, it was warm (+0.9 °C compared to the long-term average); annual precipitation was slightly below the long-term average, with occasional light rain spread over the summer, as reflected by low inflow volumes with sporadic minor increases (Figure 2).
3.2. Microorganisms and Related Biogeochemical Processes
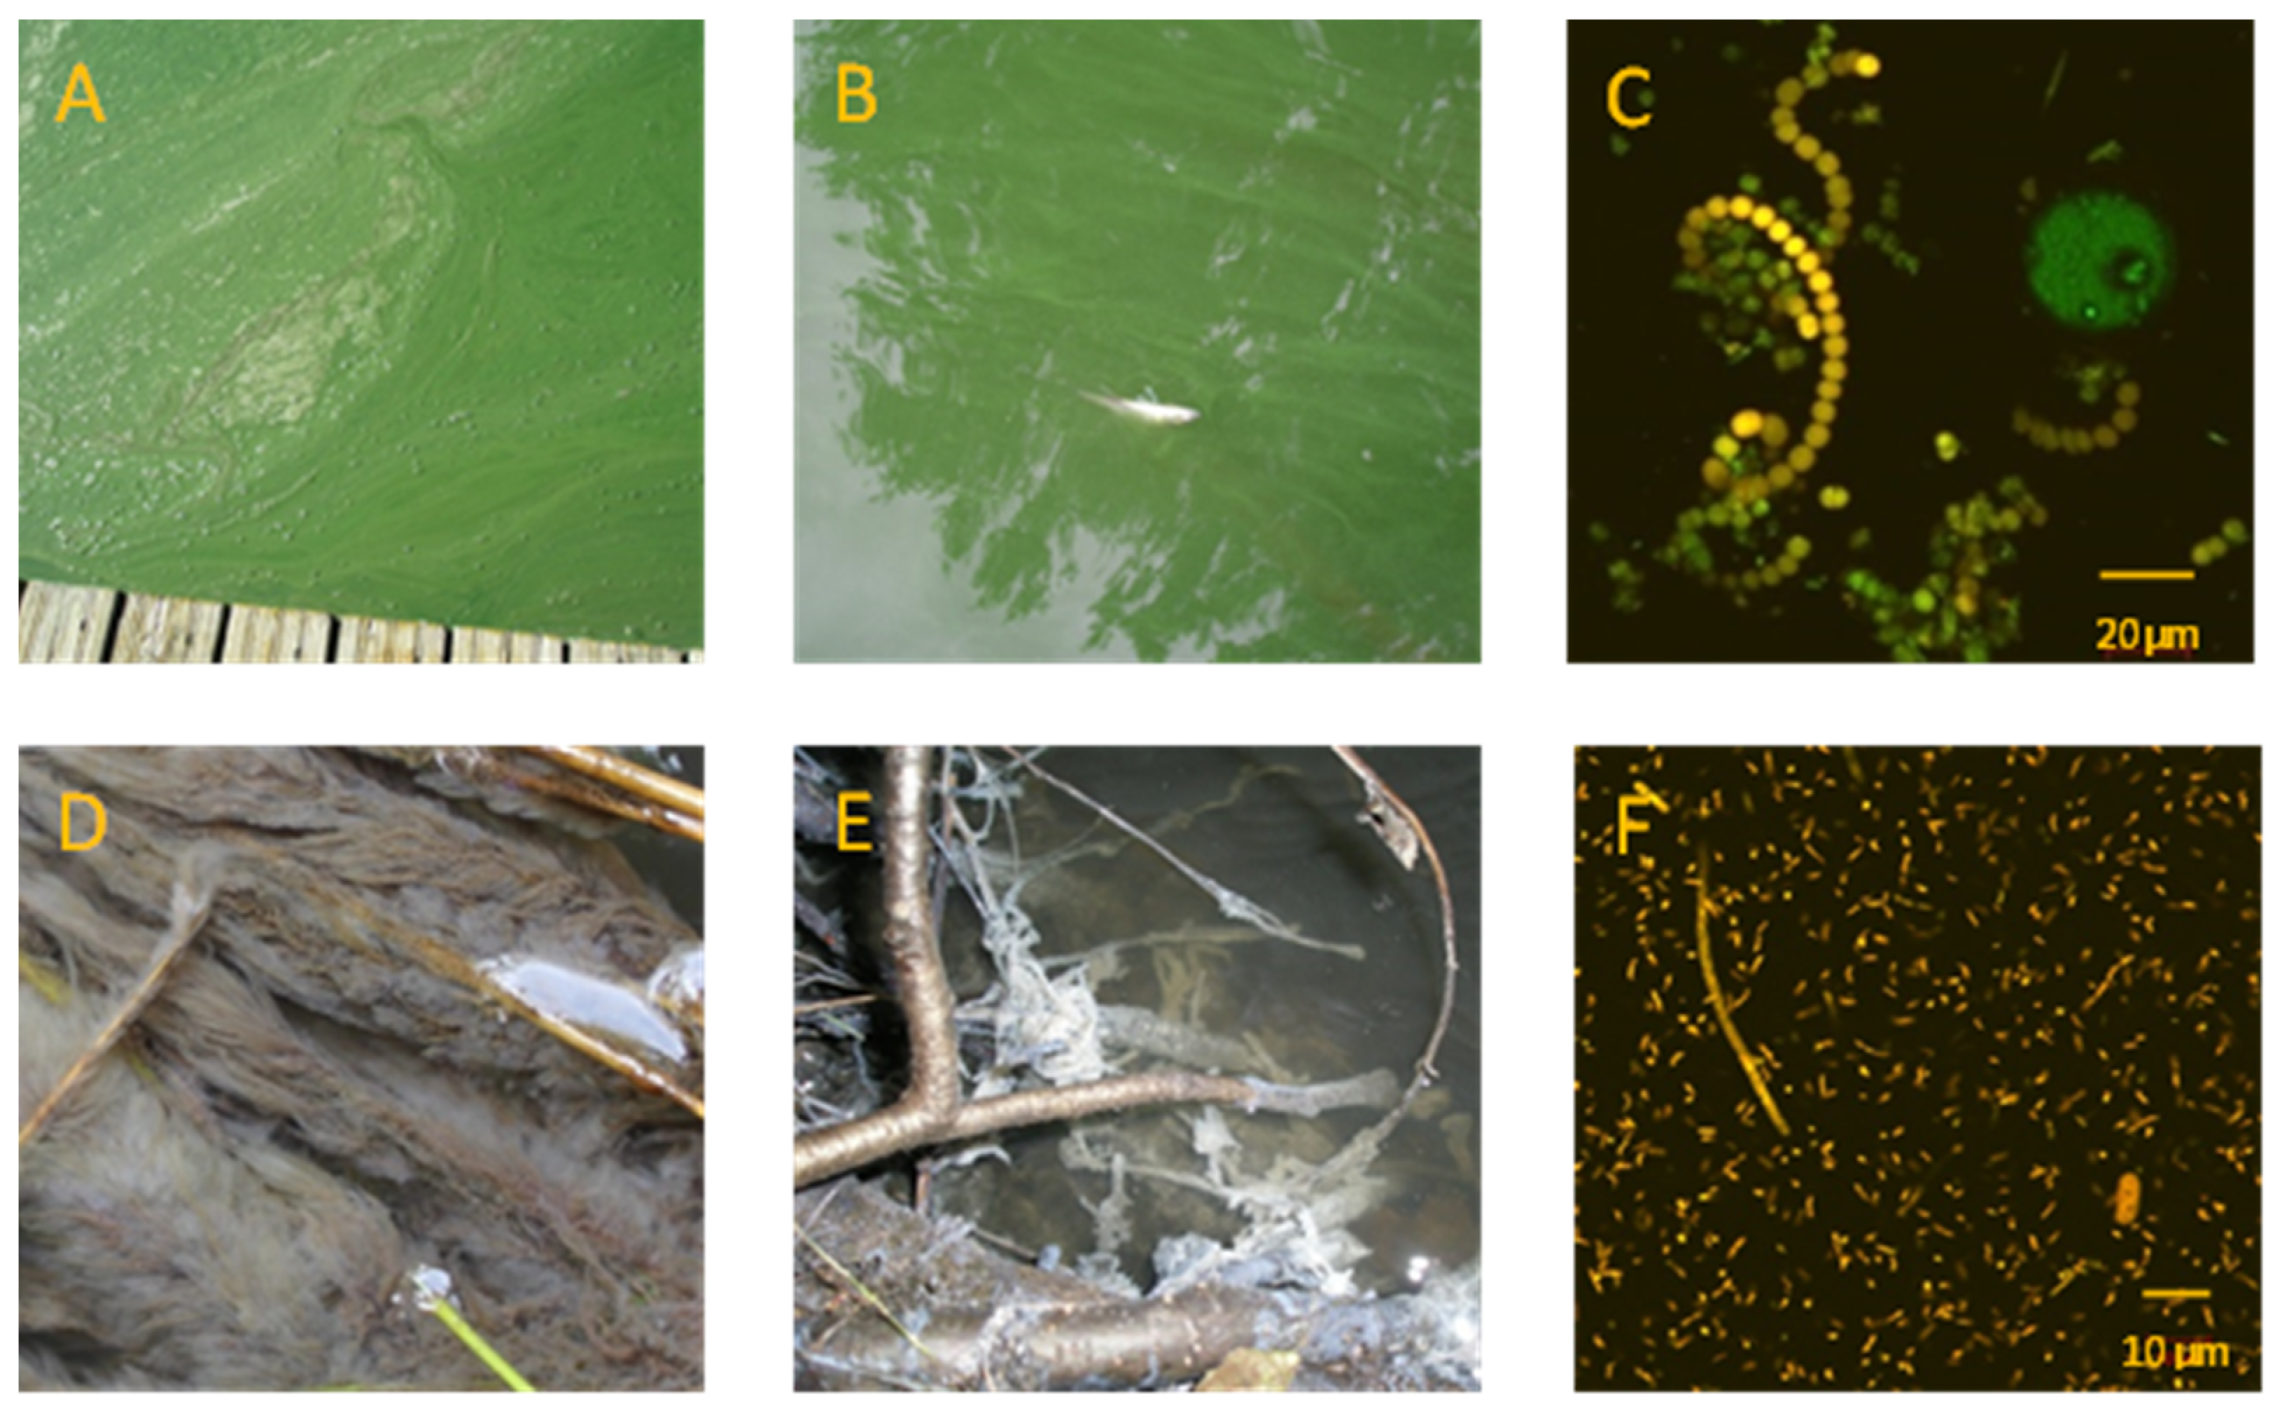
Cyanobacterial blooms were visually and microscopically observed at Lake Seeburg in all three years of monitoring (Figure 3A,B) but showed varying durations and intensities. In August and September 2017, blooming cyanobacteria dominated above all other species (own observations, see also [25]). Additionally, 2018 was the year with the longest and most intensive bloom, which began early in July and lasted for nearly three months until the first days of October. The shortest and least noticeable cyanobacterial bloom occurred in 2019 during the first two weeks of September. While Nostocales (Anabaena sp., Figure 3C) and, subordinately, Oscillatoriales (Planktothrix agardhii, Pseudanabaena limnetica) were predominant in 2017, the following two years showed a more mixed composition, with diverse forms of Oscillatoriales (Planktothrix agardhii, Microcystis, etc.) and Nostocales (Anabaena species) (own observations, see also [25]). In addition to the cyanobacteria, green algae (Chlamydomonadales, Chlorococcales) and diatoms (Centrales) occurred in increased abundance in the lake from May to October 2017, and accounted for about a quarter of the cyanobacterial biovolume. The maximum growth phase of the green algae was during May, August, and September (Cryptophyceae, Chlorococcales) and July/August (Centrales) [25]. Whereas in (early) summer, green algae and diatoms are the dominant phytoplankton in the lake, cyanobacteria are typically most abundant in August/September. At this time of the year, their cell numbers can be >10 times higher than those of green algae [25].
Strikingly, in August 2017, after the heavy rain event, the Aue creek developed a severe lack of oxygen. This was obviously due to the intensified microbial decomposition of organic matter within the flooded organic-rich soils and overlying waters of the upstream Seeanger wetland. After the consumption of the available oxygen, anaerobic respiration processes took over, and, as a result, H2S was formed via microbial sulfate reduction. The sulfide released caused a massive odor nuisance in the adjacent village of Seeburg. It also enabled the buildup of vast amounts of whitish feather-like biofilms of sulfide oxidizing bacteria (SOB) in the Aue creek over the entire distance between the Seeanger wetland and Lake Seeburg (Figure 3D–F). SOB typically thrive at suboxic/anoxic boundaries showing elevated H2S concentrations [26]. These conditions were toxic to all other oxygen-depending organisms and wiped out higher life in the creek for several weeks.
3.3. Nutrient Characterization
3.3.1. Nitrate
In the inflow (Aue creek), nitrate ranged from 8.3–21.5 mg/L, apart from a three-year low in August 2017 of 1.2 mg/L. In the lake, nitrate varied from below the detection limit to 8.2 mg/L (Figure 2). The annual means ranged between 14.1–18.2 mg/L in the inflow and between 1.4–2.6 mg/L in the lake. Nitrate was, thus, the most significant nitrogen contributor during the observation period (Table S2, see Table S5 for water quality classifications according to [27]).
The high and fairly steady nitrate inputs reaching the lake via the inflow (Figure 2) can be attributed to discharges from the intensively farmed catchment area. The heavy rainfalls in July 2017 could have caused a dilution effect that may explain the notable drop of nitrate concentrations in the inflow in August 2017 (however, increased nitrate discharges from farmland surface runoff often level up the dilution effect of rainfalls [28]). In addition, nitrate levels in the inflow may have been attenuated by the intense microbial nitrate reduction that occurred in the oxygen-depleted flooded Seeanger wetlands upstream. This could also have contributed to the high ammonium levels observed during this period (Section 3.3.2) [29].
Low nitrate concentrations in the lake compared to the inflow can be explained by the fact that nitrate is an essential nutrient for all aquaphytes, especially for green algae and diatoms [30]. Consequently, the lake becomes nitrate-limited from about June to October, coinciding with the maximum growth phase of these algae [4]. In turn, the subsequent aerobic remineralization of phytoplankton biomass can plausibly explain the pronounced accumulation of nitrate in the lake during the autumn and winter of 2018 and 2019 (Figure 2).
Different observations on external nitrate inputs after rain events have been reported in the literature. In a study of Lake Belau in northern Germany, which is similar in size to Lake Seeburg, a two-day storm event was recorded with twice the normal rainfall in a month. The storm caused major short-term changes in the lake, but increased allochthonous N inputs were not observed. One reason could be the constantly high nitrate load via the inflow (similar to Lake Seeburg), which could make additional input peaks less noticeable. Further aspects are the smaller catchment area and possible buffering by two upstream lakes [31]. Unlike Lake Belau and Lake Seeburg, a positive correlation between precipitation and nitrate concentrations was reported for the eutrophic Lake Vico (Italy), where nitrate increased up to 20 mg/L after rain events [32]. The differences between these studies confirm that it is difficult to make sweeping statements about different, albeit similar, lake systems.
3.3.2. Ammonium
During the three years of monitoring, ammonium concentrations varied between 0.01–0.71 mg/L in the inflow and 0.01–0.63 mg/L in the lake (Figure 2). The annual means were between 0.06–0.22 mg/L and 0.05–0.20 mg/L, respectively (Table S2, see Table S5 for water quality classifications).
Our data reveal that the extreme rain event in July 2017 had a strong impact on the ammonium concentrations of the lake system. From background levels near zero in July 2017, concentrations increased to peak concentrations as high as ~0.7 mg/L in August 2017 in both the tributary and lake (Figure 2). This can be interpreted as a result of the abovementioned anaerobic remineralization processes in the flooded upstream Seeanger wetlands (Section 3.2 and Section 3.3.1). Evidently, this led to a high ammonium discharge via the Aue creek (along with sulfide, see above) and resulted in a temporarily increased ammonium concentration in the lake. In the two following years, however, no such heavy rainfall events occurred, and thus, no comparable ammonium peaks were recorded.
Unlike Lake Seeburg, no elevated ammonium inputs were observed for Lake Belau after a two-day storm event (see Section 3.3.1) [31]. However, it has to be considered that its inflow, before entering Lake Belau, discharges into two other lakes, which may, therefore, act as a buffer for ammonium. In the western Lake Superior in North America, two heavy rain events in 2012 (250 mm of rainfall in two days) and 2016 (220 mm of rainfall in two days) resulted in additional ammonium inputs that accounted for only up to 1% (2016) of the total annual inputs [33]. The much greater ammonium increase at Lake Seeburg after a similar rain event may point to a major role of the flooded Seeanger wetland as a source of reduced nitrogen species.
Our data further indicate a regular increase in ammonium concentrations in Lake Seeburg in the aftermath of cyanobacterial blooms, i.e., in autumn and winter (Figure 2). This may be explained by the release of ammonium from the decaying cyanobacterial biomass under oxygen-limited conditions. Similarly, in column experiments with lake water from Lake Taihu (China), strongly elevated ammonium concentrations (up to 53.3 mg/L) were recorded during the anaerobic degradation of cyanobacterial blooms [34].
Numerous cyanobacteria have the ability to fix atmospheric nitrogen and convert it into bioavailable modifications [35,36]. Whereas eukaryotic phytoplankton require bioavailable nitrogen as well as phosphorus, nitrogen-fixing cyanobacteria are limited only by the latter. In late summer 2017, cyanobacteria from the nitrogen-fixing order Nostocales (especially Anabaena sp.) were the dominant aquatic organisms in Lake Seeburg ([25], see also Section 3.4). The decay of these blooms released major amounts of ammonium into the lake water. Subsequent microbial ammonium oxidation (i.e., nitrification) most likely contributed to the elevated nitrate concentrations in the lake over the winter months of 2017/2018 (Section 3.2; Figure 2).
3.3.3. Nitrite
The nitrite concentrations varied between 0.01–0.48 mg/L in the inflow and near-zero to 0.08 mg/L in the lake. The mean values were between 0.11–0.13 mg/L and 0.02–0.04 mg/L, respectively. In the inflow, maximum concentrations occurred as annually repeating peaks in late spring or early summer. With one exception (February 2018), nitrite concentrations in the lake were lower than those in the inflow (Table S2, see Table S5 for water quality classifications). No data were available during the heavy rain event.
A noteworthy feature of the nitrite distributions at Lake Seeburg is annual peaks in the inflow occurring in early summer (Figure 2). These nitrite distributions might result from the increased microbial decomposition of dead plant material accumulated in the upstream Seeanger wetland, where the high availability of such material in spring is evident (own observation). As the first step in nitrification, ammonium resulting from the decay of organic material is aerobically oxidized to nitrite [37]. The energy so obtained is more than four times higher than for the subsequent aerobic oxidation of nitrite to nitrate [38]. Consequently, oxygen deficiency arising in wetland environments as a result of intense decomposition processes would hamper the (energetically less favorable) oxidation of nitrite to nitrate. Notably, the marked nitrite spike is only observed in the inflow but not in the lake itself (Figure 2). This can plausibly be explained by the lower availability of organic matter and a higher amount of available oxygen in the lake water, which would promote a more rapid turnover of nitrite and, thus, complete oxidation of ammonium to nitrate.
3.3.4. Soluble Reactive Phosphate (SRP)
SRP in the inflow ranged from 0.02–0.50 mg/L, apart from a strikingly high peak observed in August 2017 after the rain event (1.36 mg/L). In the lake, concentrations varied widely from 0.01–0.78 mg/L. Mean values were between 0.21–0.29 mg/L and 0.14–0.23 mg/L, respectively. Concentrations in the lake were typically lower than in the inflow; however, higher values regularly occurred around September in all three monitoring years (Figure 2, Table S2, see Table S5 for water quality classifications).
The remarkably high SRP peak observed in the inflow in August 2017 most likely resulted from the extreme rain event in July 2017 (Figure 2, Section 3.1). The enhanced biodegradation processes in the upstream flooded Seeanger wetland resulted in oxygen-depleted conditions, leading to the release of high amounts of SRP from the degraded organic matter and formerly iron-bound phosphate. Phosphate speciation analyses of the wetland soils showed almost equal proportions of organically bound phosphate and mineralized (iron-bound) phosphate in the sample fractions. It can be estimated that approximately 64.3 kg/day of SRP entered the lake during the rain event (see Table S6 for calculations). In the absence of further major flooding events, SRP concentrations in the inflow consistently remained at much lower levels for the rest of the observation period (e.g., 2.1 kg/day one year later in July 2018).
At Lake Belau, heavy rain resulted in additional P inputs of 5 kg/day, about 3–4 times the pre-event levels [31]. At Lake Gollin, another north German lake with similar characteristics, SRP concentrations increased to nearly 0.3 mg/L (annual mean 0.004 mg/L) after a heavy rain event with flooding [39]. Similar observations were also made at two shallow eutrophic lakes in Spain, where SRP concentrations increased to maximum concentrations of up to 0.28 mg/L after heavy rain events (annual mean 0.04 g/L) [40]. These findings, as well as our results from Lake Seeburg, demonstrate that high external phosphorus inputs after heavy rain events are a widespread problem in lake environments worldwide.
Unlike in 2017, the marked late summer SRP peaks in Lake Seeburg were not related to major external input events in 2018 and 2019. Obviously, high SRP concentrations in Lake Seeburg may build up independently from short-term inputs.
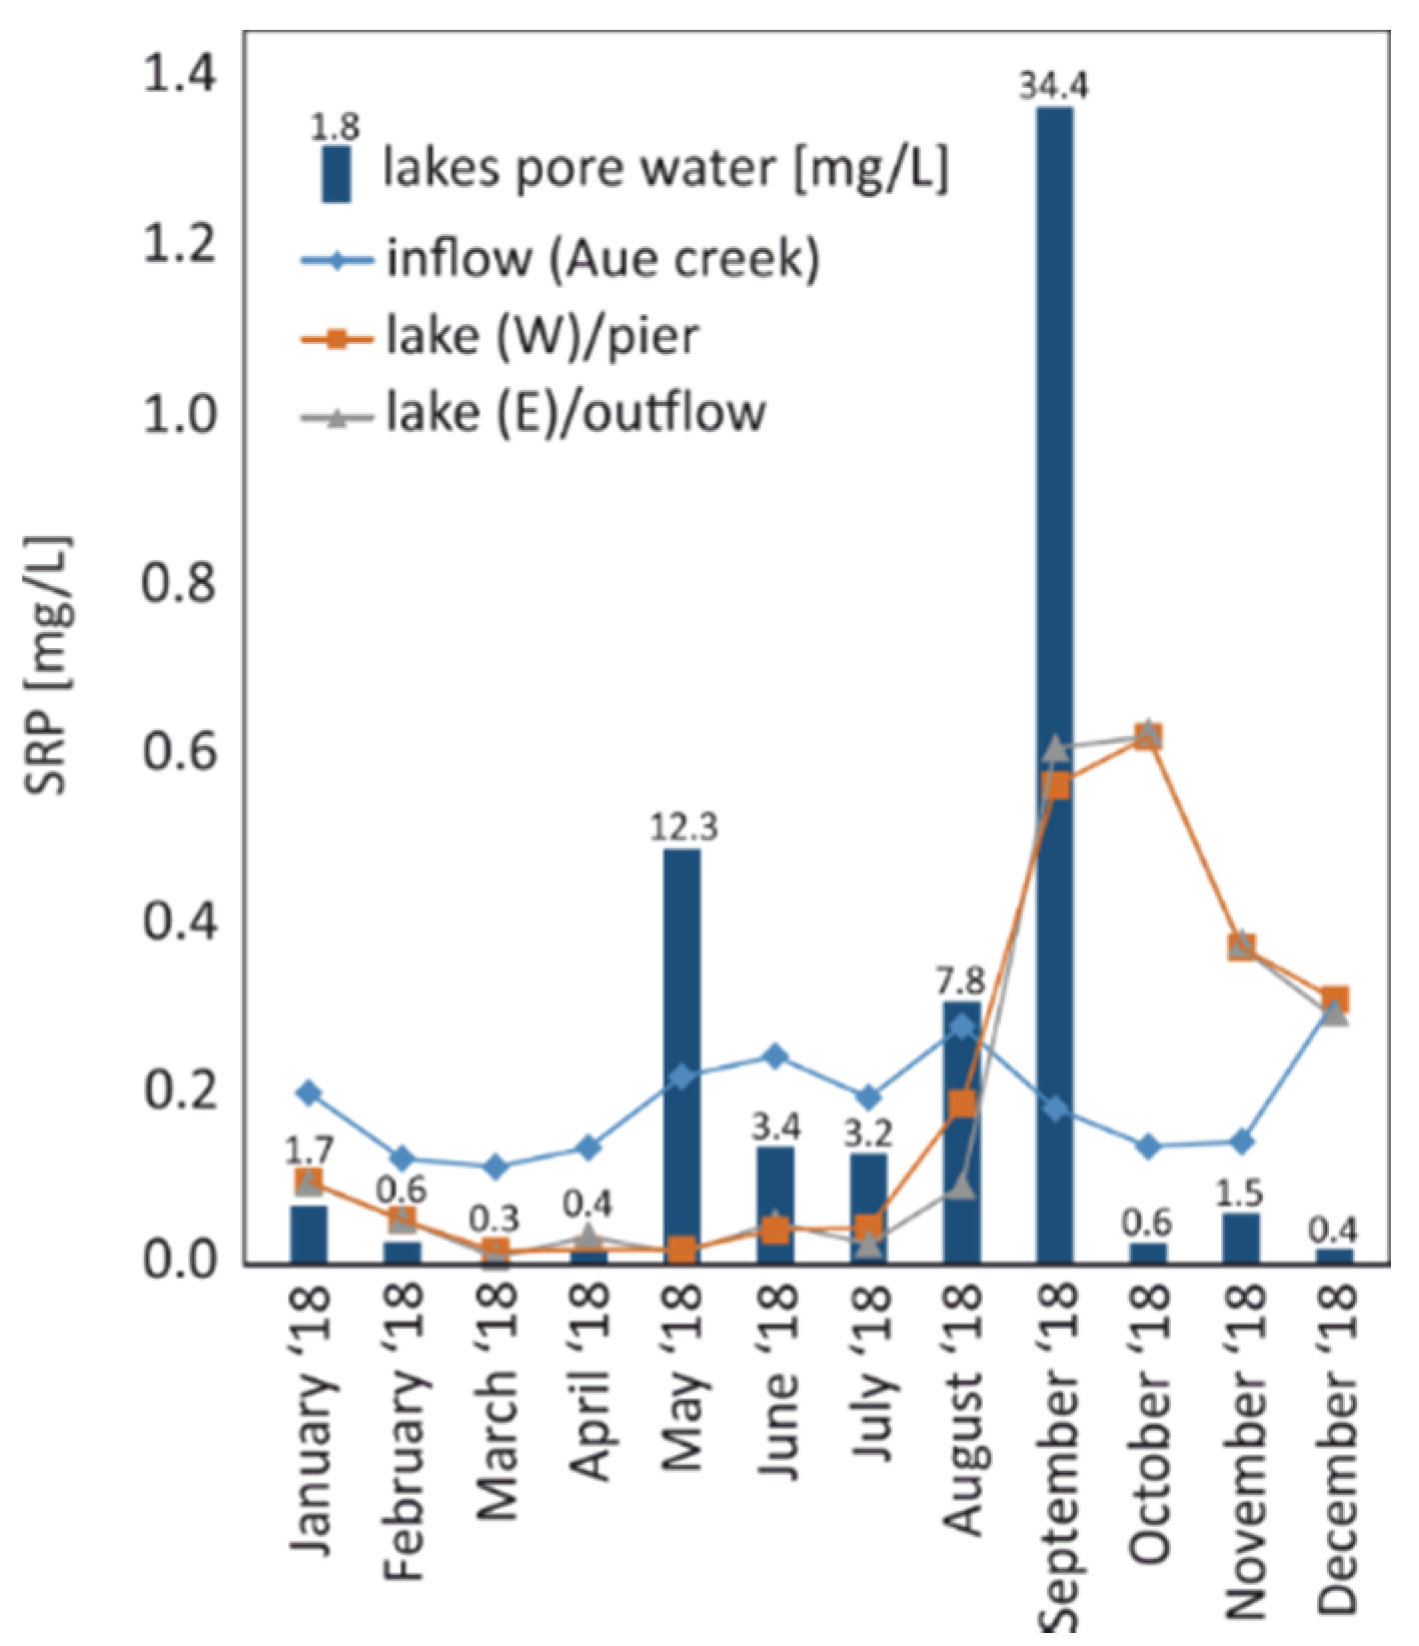
Increased SRP concentrations in the water column of lakes are generally observed during the final stages of cyanobacterial blooms in late summer [41,42]. One explanation discussed in the literature is the release of sedimentary phosphorus by carps [43,44]. However, the fish population in Lake Seeburg is controlled by the local anglers’ club through stocking (walleye, pike, trout) and selective removal (carp, whitefish). Therefore, bottom-dwelling fish should not have a crucial effect on sedimentary nutrient release. As Lake Seeburg is very shallow and used as a swimming lake, it is also possible that human activity may cause some sediment disturbance and promote nutrient release, but this should be limited to small areas of the lake during the summer season. Overall, therefore, the sedimentary release of phosphorus through chemical processes [45,46,47] and the degradation of phytoplankton biomass are most likely to be of critical importance [48]. Both processes contribute to the late summer SRP maximum in Lake Seeburg, which is shown by pore water analyses in parallel with the water sampling in 2017 and during the warm and dry year of 2018.
In 2017, a constant increase in pore water SRP was observed from 0.15 mg/L in April to 8.3 mg/L in August, which later dropped significantly to 0.3 mg/L in October. In the following year, 2018, the pore water SRP concentration increased markedly, with its annual maximum in the water column. During the peak cyanobacterial bloom, pore water values were raised to an extreme 34.4 mg/L (Figure 4); note that there was hardly any SRP present in the lake water earlier in summer because of a direct uptake by green algae and diatoms [25,49].
The observed sedimentary SRP release is probably coupled to benthic biodegradation, which leads to the remineralization of biomass-bound nutrients and the depletion of pore water oxygen. Under fully oxic conditions (such as in oligotrophic lakes), phosphorus released from decaying organic material is typically bound to sedimentary iron hydroxides and, thus, removed from the lake cycle for a long period of time [50]. However, the iron-bound phosphorus association becomes unstable as soon as suboxic to anoxic conditions emerge [51]. As a consequence, iron-bound sedimentary SRP is released.
In addition to the O2 concentration (↓) and temperature (↑), further drivers for the transformation of dissolved, organic, and inorganic phosphorus species (and thus, the SRP levels) are pH value (especially pH > 8) and redox conditions [52,53,54,55]. In summer, high lake water temperatures favor the growth of cyanobacteria [6]. Due to the particularly high maximum water temperatures during the 2018 drought (Figure 2), the growth of cyanobacteria was enhanced. Phytoplankton (e.g., green algae, cyanobacteria) increase the pH value in the water body during their maximum growth phase through their CO2/HCO3− consumption, and their photosynthetic activity can lead to oxygen oversaturation [56,57,58]. Due to the sheer amount of cyanobacteria in late summer, we consider them to be primarily responsible for the significant increases in pH and oxygen in Lake Seeburg (late summer pH~9; oxygen > 12 mg/L; Table S2). In the decay stage, the decomposition of the cyanobacterial biomass requires large amounts of oxygen, resulting in oxygen depletion in the water column and the sediment. Similar to the bloom formation, the decay of the cyanobacteria was certainly promoted by high water temperatures in 2018. Consequently, oxygen concentrations in the surface water of Lake Seeburg regularly decreased to values < 7 mg/L immediately after cyanobacterial blooms (Table S2). Close to the sediment–water interface, the oxygen concentrations are considerably lower (ca. 2–3 mg/L). The calculated amount of sediment-released SRP during the cyanobacterial bloom in 2018 was 69 mg/m2·d−1, corresponding to 61.4 kg/day in the whole lake (see Table S7; calculations according to [59]). In a comparison of core incubations from seven small and shallow eutrophic lakes under oxic and anoxic conditions, the P release rate ranged from 0.02 to 83 mg/m2 per day [60]. In the shallow eutrophic Lake Hiidenvesi (Finland), a maximum sedimentary release rate of 57.6 mg/m2 per day, a value very similar to Lake Seeburg, was observed for two weeks in summer [61]. This internal phosphorus release from the sediment, caused by cyanobacteria, plays a major role in maintaining the lake’s eutrophic status [5,48,50,62,63,64,65].
3.4. Influences of Extreme Weather Events on the Nutrient and Phytoplankton Community Composition in the Lake
Due to the heavy rainfall event in 2017, anoxic water enriched with ammonium and, especially, SRP (64.3 kg/day) entered the lake through the inflow (Section 3.3.4 and Table S6). The strong nutrient inputs obviously induced a cyanobacterial bloom that was relatively short-lived (≈3 weeks) but very intense, showing high cell densities of Nostocales (Anabaena spiroides, 168.000/mL, 63% of the biovolume of the lake) and Oscillatoriales (Planktothrix agardhi, 78.000/mL; Pseudanabaena limnetica, 48.000/mL) [25]. The intensity of the cyanobacterial bloom in the wake of the 2017 heavy rain event was considerably higher and much less diverse, as previously observed in Lake Seeburg. Anabaena species, which dominate the overall phytoplankton community, are typical for eutrophic to hypertrophic lakes. As A. spiroides is neurotoxin-producing (anatoxin-a(s)), toxic to all kinds of wildlife in the lake (e.g., zooplankton, fishes, and crabs; Figure 3B), there is a clear tendency towards worse conditions [1]. A phytoplankton monitoring study conducted in September 2006, which may be taken as a background reference, reported a broader diversity of cyanobacteria, where the abovementioned species were also present but in much lower cell densities (Anabaena compacta and Anabaena sp., 13.000/mL; Planktothrix agardhii, 41.000/mL; Pseudanabaena limnetica, 26.000/mL) and in co-occurrence with other phytoplankton communities such as Chlorophyceae (cryptophyceae, Bacillariophyceae, and euglenophyceae [66]).
In the hot and dry year of 2018, the water volume of the inflow decreased significantly during summer, and, thus, only small amounts of nutrients entered the lake (Section 3.1). On the other hand, the warm weather conditions influenced early-blooming Bacillariophyceae in May and enhanced degradation and remineralization processes in the lake; thus, a remarkably high SRP re-dissolution from the sediment (61.4 kg/day) was observed (Section 3.3.4 and Table S7). This sustained re-dissolution fostered a cyanobacterial bloom that was more diverse than in the year before and lasted much longer (≈3 months).
In 2019, in the absence of extreme weather events, only a minor cyanobacterial bloom occurred, whose impact was significantly smaller than in previous years. The bloom was the shortest (only a few days) and had a lower total number of organisms and a higher diversity.
4. Conclusions
Like many other lakes worldwide, Lake Seeburg suffers from severe eutrophication. Our long-term (3 years) observation of bioavailable nutrients revealed, as expected, steady background inputs of bioavailable nitrogen and phosphorous species from the farmed catchment area. In addition, our data indicate a critical role of weather extremes in the dynamics of these nutrients and the formation of hazardous phytoplankton blooms. Following a three-day very heavy rain event in July 2017, high amounts of ammonium and SRP were discharged into the lake from the upstream Seeanger wetland, which has been restored as a nutrient retention trap for Lake Seeburg. In this case, the wetland even represented a strong nutrient source and failed to serve its intended purpose. In addition to such exogenous inputs, internal dynamics between the surface sediment and the water column exert significant control over nutrient distribution in Lake Seeburg. In particular, the release of sediment-bound phosphorus in late summer promotes the additional growth of cyanobacteria. Again, extreme weather conditions can be an important driver of this process, which becomes particularly intense under very hot and dry weather conditions, such as those experienced during the severe drought of the summer of 2018. Our observations also suggest that the duration and composition of the resulting cyanobacterial blooms depend on the nature of the nutrient input involved (short-lived and monospecific after spike-like external inputs; long-lived and more diverse with sustained internal release), but this requires further investigation. As the frequency and intensity of heat waves and heavy rain events are expected to increase due to climate change, their effects on the nutrient dynamics of lake ecosystems will need to be understood in more detail. Only with accurate knowledge of the potential impacts can appropriate and sustainable management strategies be implemented in the future.
Supplementary Materials
The following supporting information can be downloaded at: https://www.mdpi.com/article/10.3390/w14132032/s1, Figure S1: Map of Lake Seeburg showing the sampling locations (arrows) at the main inflow (Aue creek), the western part of the lake (bathing pier) and the eastern part near the outflow. The shaded area represents the Seeanger wetland upstream of the main tributary (Aue creek), Table S1: Standards used for IC analyses of cations and anions, Table S2: Compilation of the data obtained at the sampling positions, Table S3: Lake inflow between April 2018 and December 2019, Table S4: Soluble reactive phosphate (SRP) concentrations in the pore water of the lake sediment in 2018, Table S5: Quality classification for nutrients according to the “Bund/Länder-Arbeitsgemeinschaft Wasser” (LAWA), Table S6: Calculations of soluble reactive phosphate (SRP) in- and outputs and dissolutions from the sediment, Table S7: Calculation of the amount of soluble reactive phosphate (SRP) released from the sediment into the pore water during the cyanobacterial bloom in 2018.
Author Contributions
Conceptualization, C.H. and V.T.; methodology, all authors; formal analysis, all authors; investigation, all authors; resources, C.H. and V.T.; writing—original draft preparation, S.Z.-K.; writing—review and editing, C.H. and V.T.; visualization, S.Z.-K.; supervision, C.H. and V.T.; project administration, C.H. and V.T.; funding acquisition, C.H. All authors have read and agreed to the published version of the manuscript.
Funding
This research was financially supported by the Nature Conservation Authority of Göttingen County (contract number 701034002-48).
Institutional Review Board Statement
Not applicable.
Informed Consent Statement
Not applicable.
Data Availability Statement
Not applicable.
Acknowledgments
We thank three journal reviewers for their constructive criticism that greatly helped us to improve the original manuscript. Joachim Berger, Angelika Mroncz, Christian Peters, Christoph Naab, Solveig Nachtigall, Hannes Schwarze, Lukas Kammel, and Marie Winter contributed the nutrient data obtained in their B.Sc. and M.Sc. projects. We also thank Mechthild Rittmeier and Birgit Röring for analytical support. This research was financially supported by the Nature Conservation Authority of Göttingen County (contract number 701034002-48).
Conflicts of Interest
The authors declare no conflict of interest.
References
- Catherine, Q.; Susanna, W.; Isidora, E.-S.; Mark, H.; Aurélie, V.; Jean-François, H. A review of current knowledge on toxic benthic freshwater cyanobacteria—Ecology, toxin production and risk management. Water Res. 2013, 47, 5464–5479. [Google Scholar] [CrossRef] [PubMed]
- Huisman, J.; Codd, G.A.; Paerl, H.W.; Ibelings, B.W.; Verspagen, J.M.H.; Visser, P.M. Cyanobacterial blooms. Nat. Rev. Microbiol. 2018, 16, 471–483. [Google Scholar] [CrossRef] [PubMed]
- Jones, M.R.; Pinto, E.; Torres, M.A.; Dörr, F.; Mazur-Marzec, H.; Szubert, K.; Tartaglione, L.; Dell’Aversano, C.; Miles, C.O.; Beach, D.G.; et al. CyanoMetDB, a comprehensive public database of secondary metabolites from cyanobacteria. Water Res. 2021, 196, 117017. [Google Scholar] [CrossRef]
- Jeppesen, E.; Søndergaard, M.; Meerhoff, M.; Lauridsen, T.L.; Jensen, J.P. Shallow lake restoration by nutrient loading reduction—Some recent findings and challenges ahead. In Shallow Lakes in a Changing World, Proceedings of the 5th International Symposium on Shallow Lakes, Dalfsen, The Netherlands, 5–9 June 2005; Gulati, R.D., Lammens, E., Pauw, N., de van Donk, E., Eds.; Springer: Dordrecht, The Netherlands, 2007; pp. 239–252. ISBN 978-1-4020-6398-5. [Google Scholar]
- Nürnberg, G. Internal phosphorus load estimation during biomanipulation in a large polymictic and mesotrophic lake. Inland Waters 2012, 2, 147–162. [Google Scholar] [CrossRef]
- Paerl, H.W.; Huisman, J. Blooms like it hot. Science 2008, 320, 57–58. [Google Scholar] [CrossRef] [PubMed] [Green Version]
- Jeppesen, E.; Pierson, D.; Jennings, E. Effect of Extreme Climate Events on Lake Ecosystems. Water 2021, 13, 282. [Google Scholar] [CrossRef]
- Kleinmann, P.J.; Srinivasan, M.S.; Dell, C.J.; Schmidt, J.P.; Sharpley, A.N.; Bryant, R.B. Role of rainfall intensity and hydrology in nutrient transport via surface runoff. J. Environ. Qual. 2006, 35, 1248–1259. [Google Scholar] [CrossRef] [Green Version]
- Anh, C.Y.; Chung, A.S.; Oh, H.M. Rainfall, phycocyanin, and N:P ratios related to cyanobacterial blooms in a Korean large reservoir. Hydrobiologia 2002, 474, 117–124. [Google Scholar] [CrossRef]
- Bonte, M.; Zwolsman, J. Climate change induced salinisation of artificial lakes in the Netherlands and consequences for drinking water production. Water Res. 2010, 44, 4411–4424. [Google Scholar] [CrossRef]
- Reichwald, E.S.; Ghadouani, A. Effects of rainfall patterns on toxic cyanobacterial blooms in a changing climate: Between simplistic scenarios and complex dynamics. Water Res. 2012, 46, 1372–1393. [Google Scholar] [CrossRef]
- Qin, B.; Deng, J.; Shi, K.; Wang, J.; Brookes, J.; Zhou, J.; Zhanf, Y.; Zhu, G.; Pearl, H.W.; Wu, L. Extreme Climate Anomalies Enhancing Cyanobacterial Blooms in Eutrophic Lake Taihu, China. Water Resour. Res. 2021, 57, 7. [Google Scholar] [CrossRef]
- James, T.R.; Chimney, M.J.; Sharfstein, B.; Engstrom, D.R.; Schottler, S.P.; East, T.; Jin, K.-R. Hurricane effects on a shallow lake ecosystem, Lake Okeechobee, Florida (USA). Fundam. Appl. Limnol. 2008, 172, 273–287. [Google Scholar] [CrossRef]
- Taranu, Z.E.; Gregory-Eaves, I.; Leavitt, P.R.; Bunting, L.; Buchaca, T.; Catalan, J.; Domaizon, I.; Guilizzoni, P.; Lami, A.; McGowan, S.; et al. Acceleration of cyanobacterial dominance in north temperate-subarctic lakes during the Anthropocene. Ecol. Lett. 2015, 18, 375–384. [Google Scholar] [CrossRef]
- Lorenz, S.; Rasmussen, J.J.; Süß, A.; Kalettka, T.; Golla, B.; Horney, P.; Stähler, M.; Hommel, B.; Schäfer, R.B. Specifics and challenges of assessing exposure and effects of pesticides in small water bodies. Hydrobiologia 2017, 793, 213–224. [Google Scholar] [CrossRef]
- Biggs, J.; Williams, P.; Whitfield, M.; Nicolet, P.; Brown, C.; Hollis, J.; Arnold, D.; Pepper, T. The freshwater biota of British agricultural landscapes and their sensitivity to pesticides. Agric. Ecosyst. Environ. 2007, 122, 137–148. [Google Scholar] [CrossRef]
- Szöcs, E.; Brinke, M.; Karaoglan, B.; Schäfer, R.B. Large Scale Risks from Agricultural Pesticides in Small Streams. Environ. Sci. Technol. 2017, 51, 7378–7385. [Google Scholar] [CrossRef] [PubMed]
- Becker, A.; Junghänel, T.; Hafer, M.; Köcher, A.; Rustemeier, E.; Weigl, E.; Wittich, K.-P. Erste Hydro-Klimatologische Einordnung der Starkregen und Dauerregen in Deutschland zum Ende Eines Sehr Nassen Juli 2017; Deutscher Wetterdienst: Offenbach, Germany, 2017. [Google Scholar]
- Wetterkontor. Monats- und Jahreswerte für Göttingen. Available online: https://www.wetterkontor.de/de/wetter/deutschland/monatswerte-station.asp?id=10444 (accessed on 19 July 2021).
- Streif, H. Limnologische Untersuchungen des Seeburger Sees (Untereichsfeld): Geologische Untersuchungen an niedersächsischen Binnengewässern. Beih. Geol. Jh. 1970, 83, 1–106. [Google Scholar]
- Warner, W.; Zeman-Kuhnert, S.; Heim, C.; Nachtigall, S.; Licha, T. Seasonal and spatial dynamics of selected pesticides and nutrients in a small lake catchment—Implications for agile monitoring strategies. Chemosphere 2021, 281, 130736. [Google Scholar] [CrossRef]
- Hartmann, R. Abschlussbericht der Hydrochemischen Untersuchungen im Bereich des Seeburger Sees im Landkreis Göttingen und Dessen Zuflüsse. Gutachten im Auftrag des Landkreis Göttingen; Gesellschaft für angewandte Biologie und Geologie mbH: Göttingen, Germany, 2007; pp. 1–23. [Google Scholar]
- Niedersächsischer Landesbetrieb für Wasserwirtschaft, Küsten-und Naturschutz. Gesetzlich Geschützte Biotope und Landschaftsbestandteile in Niedersachsen 2010; Niedersächsischer Landesbetrieb für Wasserwirtschaft, Küsten-und Naturschutz: Brake, Germany, 2010; pp. 161–208. [Google Scholar]
- Niedersächsischer Landesbetrieb für Wasserwirtschaft, Küsten-und Naturschutz. Leitfaden Maßnahmenplanung Oberflächengewässer, Teil B Stillgewässer 2010; Niedersächsischer Landesbetrieb für Wasserwirtschaft, Küsten-und Naturschutz: Brake, Germany, 2010. [Google Scholar]
- Bäthe, J.; Coring, E.; Curdt, T.; Kleinfeldt, H. Limnologische Untersuchungen in Stehenden Gewässern Niedersachsens 2017; EcoRing: Hardegsen, Germany, 2018. [Google Scholar]
- Friedrich, C.G.; Rother, D.; Bardischewsky, F.; Quentmeier, A.; Fischer, J. Oxidation of reduced inorganic sulfur compounds by bacteria: Emergence of a common mechanism? Appl. Environ. Microbiol. 2001, 67, 2873–2882. [Google Scholar] [CrossRef] [Green Version]
- Grage, A.; Gudat, S.; Melzer, O.; Pinz, K.; Schuster, H. Gewässerüberwachungssystem Niedersachsen (GÜN). Nähstoffe in niedersächsischen Oberflächengewässern: Stickstoff und Phosphor. 2014. Available online: https://www.nlwkn.niedersachsen.de/download/92683 (accessed on 12 May 2022).
- Nettelmann, R. Diffuse Nitrat-und Phopshatbelastung Niedersachen 2007. Available online: https://nibis.lbeg.de/DOI/dateien/GB_2_Text_Web.pdf (accessed on 12 May 2022).
- Tobias, C.; Neubauer, S.C. Salt Marsh Biogeochemistry—An Overview. In Coastal Wetlands: An Integrated Ecosystem Approach, 2nd ed.; Perillo, G.M.E., Wolanski, E., Cahoon, D.R., Hopkinson, C.S., Eds.; Elsevier: Amsterdam, The Netherlands, 2019; pp. 539–596. ISBN 9780444638939. [Google Scholar]
- Ullrich, W.R. Uptake and Reduction of Nitrate: Algae and Fungi. In Inorganic Plant Nutrition; Läuchli, A., Asher, C.J., Eds.; Springer: Berlin/Heidelberg, Germany, 1983; pp. 376–397. ISBN 978-3-642-68885-0. [Google Scholar]
- Schernewski, G. Nutrient Budgets, Dynamics and Storm Effects in a Eutrophic, Stratified Baltic Lake. Acta Hydrochim. Hydrobiol. 2003, 31, 152–161. [Google Scholar] [CrossRef]
- Garnier, M.; Recanatesi, F.; Ripa, M.N.; Leone, A. Agricultural nitrate monitoring in a lake basin in Central Italy: A further step ahead towards an integrated nutrient management aimed at controlling water pollution. Environ. Monit. Assess. 2010, 170, 273–286. [Google Scholar] [CrossRef] [PubMed]
- Cooney, E.M.; McKinney, P.; Sterner, R.; Small, G.E.; Minor, E.C. Tale of Two Storms: Impact of Extreme Rain Events on the Biogeochemistry of Lake Superior. JGR Biogeosci. 2018, 123, 1719–1731. [Google Scholar] [CrossRef] [PubMed]
- Zhu, M.; Zhu, G.; Zhao, L.; Yao, X.; Zhang, Y.; Gao, G.; Qin, B. Influence of algal bloom degradation on nutrient release at the sediment-water interface in Lake Taihu, China. Environ. Sci. Pollut. Res. Int. 2013, 20, 1803–1811. [Google Scholar] [CrossRef] [PubMed]
- Stewart, W.D.; Lex, M. Nitrogenase activity in the blue-green alga Plectonema boryanum strain 594. Arch. Mikrobiol. 1970, 73, 250–260. [Google Scholar] [CrossRef]
- Herrero, A.; Muro-Pastor, A.M.; Flores, E. Nitrogen control in cyanobacteria. J. Bacteriol. 2001, 183, 411–425. [Google Scholar] [CrossRef] [Green Version]
- Keeney, D.R. The Nitrogen Cycle in Sediment-Water Systems. J. Environ. Qual. 1973, 2, 15–29. [Google Scholar] [CrossRef]
- Alexander, M. Introduction to soil microbiology. Soil Sci. 1978, 125, 331. [Google Scholar] [CrossRef]
- Kazanjian, G.; Brothers, S.; Köhler, J.; Hilt, S. Incomplete resilience of a shallow lake to a brownification event. BioRxiv 2019, 658591. [Google Scholar] [CrossRef]
- De Vicente, I.; Moreno-Ostos, E.; Amores, V.; Rueda, F.; Cruz-Pizarro, L. Low predictability in the dynamics of shallow lakes: Implications for their management and restoration. Wetlands 2006, 26, 928–938. [Google Scholar] [CrossRef]
- Rose, V.; Rollwagen-Bollens, G.; Bollens, S.M. Interactive effects of phosphorus and zooplankton grazing on cyanobacterial blooms in a shallow temperate lake. Hydrobiologia 2017, 788, 345–359. [Google Scholar] [CrossRef]
- Xie, L.; Xie, P. Long-term (1956–1999) dynamics of phosphorus in a shallow, subtropical Chinese lake with the possible effects of cyanobacterial blooms. Water Res. 2002, 36, 343–349. [Google Scholar] [CrossRef]
- Huser, B.J.; Bajer, P.G.; Kittelson, S.; Christenson, S.; Menken, K. Changes to water quality and sediment phosphorus forms in a shallow, eutrophic lake after removal of common carp (Cyprinus carpio). Inland Waters 2022, 12, 33–46. [Google Scholar] [CrossRef]
- Huser, B.J.; Bajer, P.G.; Chizinski, C.J.; Sorensen, P.W. Effects of common carp (Cyprinus carpio) on sediment mixing depth and mobile phosphorus mass in the active sediment layer of a shallow lake. Hydrobiologia 2016, 763, 23–33. [Google Scholar] [CrossRef]
- Bormans, M.; Maršálek, B.; Jančula, D. Controlling internal phosphorus loading in lakes by physical methods to reduce cyanobacterial blooms: A review. Aquat. Ecol. 2016, 50, 407–422. [Google Scholar] [CrossRef]
- Schindler, D.W. The dilemma of controlling cultural eutrophication of lakes. Proc. Biol. Sci. 2012, 279, 4322–4333. [Google Scholar] [CrossRef] [PubMed] [Green Version]
- Schindler, D.; Carpender, S.; Chapra, S.; Hecky, R.; Orihel, D. Reducing Phosphorus to Curb Lake Eutrophication is a Success. Environ. Sci. Technol. 2016, 50, 8923–8929. [Google Scholar] [CrossRef] [PubMed]
- Zhang, S.; Wang, W.; Zhang, K.; Xu, P.; Lu, Y. Phosphorus release from cyanobacterial blooms during their decline period in eutrophic Dianchi Lake, China. Environ. Sci. Pollut. Res. Int. 2018, 25, 13579–13588. [Google Scholar] [CrossRef]
- Jansson, M. Phosphate Uptake and Utilization by Bacteria and Algae. In Phosphorus in Freshwater Ecosystems; Persson, G., Jansson, M., Eds.; Springer: Berlin/Heidelberg, Germany, 1990; pp. 177–189. ISBN 978-94-010-7898-6. [Google Scholar]
- Randall, M.C.; Carling, G.T.; Dastrup, D.B.; Miller, T.; Nelson, S.T.; Rey, K.A.; Hansen, N.C.; Bickmore, B.R.; Aanderud, Z.T. Sediment potentially controls in-lake phosphorus cycling and harmful cyanobacteria in shallow, eutrophic Utah Lake. PLoS ONE 2019, 14, e0212238. [Google Scholar] [CrossRef]
- Nowlin, W.H.; Evarts, J.L.; Vanni, M.J. Release rates and potential fates of nitrogen and phosphorus from sediments in a eutrophic reservoir. Freshw. Biol. 2005, 50, 301–322. [Google Scholar] [CrossRef]
- Wu, Y.; Wen, Y.; Zhou, J.; Wu, Y. Phosphorus release from lake sediments: Effects of pH, temperature and dissolved oxygen. KSCE J. Civ. Eng. 2014, 18, 323–329. [Google Scholar] [CrossRef]
- Søndergaard, M.; Jensen, J.P.; Jeppesen, E. Role of sediment and internal loading of phosphorus in shallow lakes. Hydrobiologia 2003, 506–509, 135–145. [Google Scholar] [CrossRef]
- Chen, M.; Ye, T.-R.; Krumholz, L.R.; Jiang, H.-L. Temperature and cyanobacterial bloom biomass influence phosphorous cycling in eutrophic lake sediments. PLoS ONE 2014, 9, e93130. [Google Scholar] [CrossRef] [PubMed] [Green Version]
- Mortimer, C.H. The Exchange of Dissolved Substances Between Mud and Water in Lakes. J. Ecol. 1941, 29, 280. [Google Scholar] [CrossRef]
- Gao, Y.; O’Neil, J.M.; Stoecker, D.K.; Cornwell, J.C. Photosynthesis and nitrogen fixation during cyanobacteria blooms in an oligohaline and tidal freshwater estuary. Aquat. Microb. Ecol. 2014, 72, 127–142. [Google Scholar] [CrossRef] [Green Version]
- Morales-Williams, A.M.; Wanamaker, A.D., Jr.; Downing, J.A. Cyanobacterial carbon concentrating mechanisms facilitate sustained CO2 depletion in eutrophic lakes. Biogeosciences 2017, 14, 2865–2875. [Google Scholar] [CrossRef] [Green Version]
- Aizawa, K.; Miyachi, S. Carbonic anhydrase and CO 2 concentrating mechanisms in microalgae and cyanobacteria. FEMS Microbiol. Lett. 1986, 39, 215–233. [Google Scholar] [CrossRef]
- Scholtysik, G.; Dellwig, O.; Roeser, P.; Arz, H.W.; Casper, P.; Herzog, C.; Goldhammer, T.; Hupfer, M. Geochemical focusing and sequestration of manganese during eutrophication of Lake Stechlin (NE Germany). Biogeochemistry 2020, 151, 313–334. [Google Scholar] [CrossRef]
- Paytan, A.; Roberts, K.; Watson, S.; Peek, S.; Chuang, P.-C.; Defforey, D.; Kendall, C. Internal loading of phosphate in Lake Erie Central Basin. Sci. Total Environ. 2017, 579, 1356–1365. [Google Scholar] [CrossRef]
- Horppila, J.; Nurminen, L. The effect of an emergent macrophyte (Typha angustifolia) on sediment resuspension in a shallow north temperate lake. Freshw. Biol. 2001, 46, 1447–1455. [Google Scholar] [CrossRef]
- Cottingham, K.L.; Ewing, H.A.; Greer, M.L.; Carey, C.C.; Weathers, K.C. Cyanobacteria as biological drivers of lake nitrogen and phosphorus cycling. Ecosphere 2015, 6, 1–19. [Google Scholar] [CrossRef]
- Cao, X.; Wang, Y.; He, J.; Luo, X.; Zheng, Z. Phosphorus mobility among sediments, water and cyanobacteria enhanced by cyanobacteria blooms in eutrophic Lake Dianchi. Environ. Pollut. 2016, 219, 580–587. [Google Scholar] [CrossRef] [PubMed]
- Wu, S.; Zhao, Y.; Chen, Y.; Dong, X.; Wang, M.; Wang, G. Sulfur cycling in freshwater sediments: A cryptic driving force of iron deposition and phosphorus mobilization. Sci. Total Environ. 2019, 657, 1294–1303. [Google Scholar] [CrossRef] [PubMed]
- Hupfer, M.; Lewandowski, J. Oxygen Controls the Phosphorus Release from Lake Sediments—A Long-Lasting Paradigm in Limnology. Internat. Rev. Hydrobiol. 2008, 93, 415–432. [Google Scholar] [CrossRef]
- Bäthe, J.; Coring, E. Ökologisch-limnologische Untersuchungen am Seeburger See und Ausgewählten Gewässern in Seinem Einzugsgebiet; EcoRing: Hardegsen, Germany, 2007. [Google Scholar]
Figure 1.
Map of Lake Seeburg showing the catchment area and the sampling locations (arrows) at the main inflow (Aue creek), the western part of the lake (bathing pier), and the eastern part near the outflow. The shaded area represents the Seeanger wetland upstream of the main tributary (Aue creek). Simplified after NLWKN [24]. For an enlarged map of the sampling points, see Figure S1.

Figure 2.
Seasonal variability (2017–2019) of temperatures and nutrient concentrations for the inflow (Aue creek), western (pier), and eastern (near the outflow) parts of Lake Seeburg. The water volume in the inflow, measured between April 2018 and December 2019, is given in the top figure (green line). Episodes of cyanobacterial blooms are shaded in grey. For detailed concentration data, see Table S2. Dotted lines, no data available.

Figure 3.
(A,B), Massive cyanobacterial bloom in Lake Seeburg (pier) in July 2018, with dead fish due to cyanobacterial toxins; (B), see planks (~12 cm) and dead fish (~15 cm) for scale; (C), Anabaena sp., dominating species in bloom 2017; (D,E), microbial filaments (D) and thick biofilms (E) of sulfide oxidizing bacteria (SOB), which covered all available substrates in the Aue creek in August 2017 (image widths ~15 cm); (F), high abundance of sulfur-cycling microorganisms (SRB, SOB, including proteobacteria (purple sulfur bacteria)) in the sulfidic creek water after the rain event 2017. SOB with S-globules (observed via confocal laser scanning microscope); according to the size and surface pattern of the large bacterium (right corner), it can be assigned to purple sulfur bacteria.

Figure 4.
Seasonal variability of soluble reactive phosphate (SRP) in the pore water of Lake Seeburg surface sediments compared to the Aue creek (inflow), the western part (pier), and the eastern part (outflow) in 2018. Note the different scales of surface and pore water. For detailed concentrations, see Table S4.


Table 1.
Minimum, maximum, and average temperatures and nutrient concentrations for the inflow (Aue creek), western (pier), and eastern (near the outflow) parts of Lake Seeburg.
Table 1.
Minimum, maximum, and average temperatures and nutrient concentrations for the inflow (Aue creek), western (pier), and eastern (near the outflow) parts of Lake Seeburg.
| 2017 | 2018 | 2019 | ||||||||
|---|---|---|---|---|---|---|---|---|---|---|
| Min. | Max. | Average | Min. | Max. | Average | Min. | Max. | Average | ||
| Temperature [°C] | inflow | 2.4 (January) | 19.5 (August) | 10.9 | 3.1 (January) | 18.9 (August) | 11.2 | 4.2 (February) | 18.6 (September) | 11.6 |
| lake (W), pier | 2.5 (December) | 22.5 (June) | 15.1 | 2.5 (February) | 25.9 (August) | 13.7 | 3.7 (February) | 25.6 (June) | 14.0 | |
| lake (E), outflow | 2.6 (December) | 23.0 (August) | 15.3 | 2.6 (February) | 26.0 (June) | 13.5 | 3.8 (February) | 25.3 (June) | 14.0 | |
| Nitrate [mg/L] | inflow | 1.22 (August) | 21.47 (February) | 14.78 | 14.81 (December) | 21.55 (March) | 18.23 | 8.25 (July) | 21.40 (February) | 14.08 |
| lake (W), pier | 0.90 (October) | 4.69 (February) | 1.99 | 0.02 (July) | 8.24 (March) | 2.60 | 0.00 (September) | 5.41 (January) | 1.42 | |
| lake (E), outflow | 1.00 (October) | 3.66 (December) | 1.67 | 0.03 (July) | 6.98 (March) | 2.46 | 0.00 (July/December) | 6.27 (February) | 1.54 | |
| Ammonium [mg/L] | inflow | 0.01 (July) | 0.71 (August) | 0.22 | 0.01 (November) | 0.21 (May) | 0.07 | 0.02 (February) | 0.25 (June) | 0.06 |
| lake (W), pier | 0.01 (July) | 0.63 (August) | 0.18 | 0.01 (February) | 0.33 (December) | 0.08 | 0.02 (February) | 0.22 (December) | 0.06 | |
| lake (E), outflow | 0.01 (July) | 0.58 (August) | 0.20 | 0.01 (February) | 0.36 (November) | 0.09 | 0.01 (February) | 0.21 (December) | 0.05 | |
| Nitrite [mg/L] | inflow | 0.01 (January) | 0.37 (June) | 0.11 | 0.04 (February) | 0.48 (May) | 0.13 | 0.03 (September) | 0.42 (July) | 0.11 |
| lake (W), pier | 0.00 (May) | 0.05 (March) | 0.02 | 0.01 (July) | 0.08 (May) | 0.04 | 0.00 (June) | 0.04 (January) | 0.02 | |
| lake (E), outflow | 0.00 (May) | 0.05 (March) | 0.02 | 0.01 (June) | 0.06 (December) | 0.04 | 0.01 (June) | 0.04 (January) | 0.02 | |
| SRP [mg/L] | inflow | 0.02 (December) | 1.36 (August) | 0.29 | 0.12 (March) | 0.33 (December) | 0.21 | 0.13 (April) | 0.50 (July) | 0.25 |
| lake (W), pier | 0.01 (December) | 0.78 (September) | 0.23 | 0.02 (March) | 0.68 (October) | 0.21 | 0.02 (March) | 0.43 (August) | 0.16 | |
| lake (E), outflow | 0.01 (December) | 0.65 (September) | 0.20 | 0.01 (March) | 0.69 (October) | 0.21 | 0.02 (April) | 0.37 (September) | 0.14 | |
Publisher’s Note: MDPI stays neutral with regard to jurisdictional claims in published maps and institutional affiliations. |
© 2022 by the authors. Licensee MDPI, Basel, Switzerland. This article is an open access article distributed under the terms and conditions of the Creative Commons Attribution (CC BY) license (https://creativecommons.org/licenses/by/4.0/).
Share and Cite
MDPI and ACS Style
Zeman-Kuhnert, S.; Thiel, V.; Heim, C. Effects of Weather Extremes on the Nutrient Dynamics of a Shallow Eutrophic Lake as Observed during a Three-Year Monitoring Study. Water 2022, 14, 2032. https://doi.org/10.3390/w14132032
AMA Style
Zeman-Kuhnert S, Thiel V, Heim C. Effects of Weather Extremes on the Nutrient Dynamics of a Shallow Eutrophic Lake as Observed during a Three-Year Monitoring Study. Water. 2022; 14(13):2032. https://doi.org/10.3390/w14132032
Chicago/Turabian StyleZeman-Kuhnert, Sebastian, Volker Thiel, and Christine Heim. 2022. "Effects of Weather Extremes on the Nutrient Dynamics of a Shallow Eutrophic Lake as Observed during a Three-Year Monitoring Study" Water 14, no. 13: 2032. https://doi.org/10.3390/w14132032
Note that from the first issue of 2016, this journal uses article numbers instead of page numbers. See further details here.