Article

Groundwater Quality Affected by the Pyrite Ash Waste and Fertilizers in Valea Calugareasca, Romania

by
Nicoleta Vasilache
1,2,
Elena Diacu
2,*,
Cristina Modrogan
2,
Florentina Laura Chiriac
1,
Iuliana Claudia Paun
1,
Anda Gabriela Tenea
1,
Florinela Pirvu
1 and
Gabriela Geanina Vasile
1,*
1
National Research and Development Institute for Industrial Ecology ECOIND, 57-73 Drumul Podu Dambovitei, Sector 6, 060652 Bucharest, Romania
2
Faculty of Applied Chemistry and Materials Science, Politechnica University of Bucharest, 1-7, Polizu, 011061 Bucharest, Romania
*
Authors to whom correspondence should be addressed.
Water 2022, 14(13), 2022; https://doi.org/10.3390/w14132022
Submission received: 1 June 2022 / Revised: 20 June 2022 / Accepted: 22 June 2022 / Published: 24 June 2022
(This article belongs to the Section Water Quality and Contamination)

Abstract

:
The aim of the study was to assess the groundwater quality in a rural area affected by the abandoned pyrite ash waste dumps. The abundance of major ions in groundwater depends largely on the nature of the rocks, climatic conditions, and mobility. To evaluate geochemical processes, 30 groundwater samples collected from Valea Calugareasca, Prahova County, Romania, were analyzed for the major anions (NO3, SO42−, Cl, HCO3, and F) and cations (Ca2+, Mg2+, Na+, and K+), which are naturally highly variable due to climatic and geographical location conditions. Ca2+, Na+, Mg2+, and K+ varied between 118 and 275 mg/L, 32 and 160 mg/L, 12.2 and 78.4 mg/L, and 0.21 and 4.48 mg/L, respectively. NO3 levels exceeding the World Health Organization (WHO) limit of 50 mg/L were identified in 17% of the groundwater samples, mainly as result of fertilizers applied to agricultural activities. The hydrogeochemical study identified dolomite dissolution and halite precipitation as natural sources of ions as well as the presence of pyrite as a source of SO42− ions in 60% of the samples. The sulfate content varied between 125 and 262 mg/L. Bicarbonate and chloride concentrations varied between 202 and 530 mg/L and 21 and 212 mg/L. The saturation index indicates the contribution of Ca2+ ions in the groundwater samples came from some processes of dissolving rocks such as aragonites (values between 1.27 and 2.69) and calcites (values between 1.43 and 2.82). Negative halite values indicated that salt accumulation results from precipitation processes. Only 10% of the analyzed groundwater samples were suitable for human consumption, the samples being situated on the hill, far away from the pyrite ash waste dumps and agricultural land.

1. Introduction

Water is a renewable, vulnerable natural resource, and it is a determining factor in maintaining the ecological balance. Increasing the water demand due to climate change has a negative impact on the water supply. The constant growth of the population leads to increased pressure upon the environment and produces negative implications for meeting the water needs for the natural system and humans [1,2].
Groundwater quality can be affected by factors of human or natural origin. Mining and metallurgy, intensive agriculture, and changes in land use and management practices are among the most invasive anthropogenic activities with a major role in changing the hydrographic system and water quality, with the effect of degrading groundwater quality [3]. Pollution as result of increasing nutrient concentrations (nitrogen and phosphorus compounds) may be due to the use of fertilizers, livestock, and agricultural activities. As infiltration from waste deposits, for example, mining activities, wastewater leaks lead to pollution with other inorganic substances and toxic compounds that can be associated with water salinity due to high concentrations of Ca2+, Mg2+, Na+, Cl, and F [4].
Groundwater pollution, because of natural phenomena, includes easily dissolved rocks (gypsum, mineral salt, etc.), intense evaporation in shallow aquifers, and can cause the elevation of groundwater and salt deposits. Prevalent inorganic contaminants are nitrogen contaminants such as NO3, NO2, and NH4+. Nitrate can be predominantly from anthropogenic sources such as fertilizers, manure, or sewage [5,6,7,8]. Nitrate contamination of groundwater has been widely reported in regions around the world. Other common inorganic contaminants found in groundwater include anions, such as F, SO42−, and Cl, and major cations, such as Ca2+ and Mg2+. Total dissolved solids (TDS), which represent the total amount of substances, can be also increased in groundwater generally of natural origin but also could be raised by the influence of human activities [9]. Some groundwater contaminants are of geogenic origin due to the dissolution of mineral deposits in the terrestrial structure. The rapid expansion of urbanization and the economy may increase the negative impact on the aquifer of contaminants of anthropogenic origin [10,11,12]. Saturation of groundwater bodies with rocks and minerals affects the processes and quality of aquifer water [7,8]. The hydrogeochemical characteristics and the assessment of groundwater pollution in different basins affected by human activity interference have been studied for a long time [10,13,14].
In the literature, factor analysis, correlation matrix and multivariate statistical analysis, and GIS-integrated statistical analysis are used to understand the sources and contribution to groundwater pollution of contaminants from geogenic or anthropogenic activities measured [15,16]. Study of groundwater properties and ionic concentrations were undertaken to identify various geochemical processes that took place in the aquifer system. The hydrogeochemical analysis, such as ionic ratios and indices, were used in the literature in order to identify the origin of ions responsible for aquifer contamination. Indices for evaluating groundwater samples suitable for human consumption and irrigation were used [7,8].
This article highlights the zonal pollution caused by pyrite ash deposits in the Valea Calugareasca area, Prahova County, Romania. The waste dumps, as a result of the roasting of pyritic ores in the manufacture of sulfuric acid, have been abandoned for decades. Mountains of waste cover an area of approximately 0.5 km2, and meteoric precipitation has led to the acidification of the agricultural soil all around the area. The meteoric precipitations, containing iron sulfide and metal oxides, led to the dramatic decrease of humus content in the agricultural soil in the immediate vicinity of the dumps. This study analyzes the quality of the groundwater used as the source of drinking water and in agricultural works in the rural communities located near the dumps. The study represents a first part of the investigations aimed at the long-term effects of improper storage of pyritic ashes. The study will be completed in the future by the correlations between the quality of the soil and the vegetation that has developed both spontaneously and in crops around the polluted area, underlining the adaptation of the plant species to the existing pollution. Studying the contribution of pyritic ash deposits to the deterioration of groundwater quality is a necessary step before making any decision in selection of remediation techniques [15].
In this context, the present study aims to (i) identify the origin of cations and anions in the aquifer as a result of soil structure or the intake of anthropic activities and (ii) assess the groundwater quality used for human consumption and agricultural purposes in a rural inhabited area situated around a sulfur pyrite waste dump.

2. Materials and Methods

2.1. Materials

Certified reference materials (CRMs) for K+, Na+, Ca2+, and Mg2+ at 10 g/L each (Certipur, Merck, Darmstadt Germany) and ultra-trace nitric acid (69%, Supelco Merck, Darmstadt Germany) were used for cations analyses. For anions, 1000 mg/L CRMs each (for Cl, NH4+, and NO3 Merck quality, Germany; for F and SO42−, CPAChem quality, Stara Zagora, Bulgaria) were used. For pH measurement, CRM solutions of 4.00, 7.00, and 10.00 pH were applied in order to calibrate the pH meter. In addition, for EC parameter, a specific CRM was used (1413 µS/cm, Merck, Darmstadt Germany). HCO3 determination required acquisition of sodium bicarbonate (p.a. quality, Merck, Darmstadt Germany). TDS measurement were performed using sodium chloride (p.a. quality, Merck, Germany). For metals analysis (Al, As, Cd, Cr, Cu, Fe, Hg, Mn, Ni, Pb, Se, Sb, Zn) and quality control of the results, CRMs type ICP Calibration Standard XVI, 21 components (100 mg/L, CPAChem, Stara Zagora, Bulgaria), ICP multi-element standard solution IV, 23 elements (1000 mg/L, Supelco, Darmstadt, Germany), and Hg (1000 mg/L, CPAChem, Stara Zagora, Bulgaria) were used.
Other chemical reagents were purchased in order to perform the analysis. Thus, silver nitrate and potassium dichromate (p.a., Scharlau, Sentmenat, Spain) for Cl analysis were purchased. For NO3 determination, marketed sodium salicylate (p.a., Supelco, Merck, Darmstadt, Germany), sodium hydroxide (puriss p.a., 98%, Honeywell, Fluka, Germany), and sodium azide (p.a. quality, Merck, Darmstadt, Germany) were used, and acetic acid 96% and sulfuric acid 96.0% were purchased from Sigma-Aldrich, Merck, Darmstadt, Germany). NH4+ analysis required sodium salicylate, sodium hydroxide, trisodium citrate dehydrate (ACS Reagent, VWR Chemicals, Radnor, Pennsylvania, Leuven, Belgium), and sodium dichloroisocyanurate dihydrate (purity ≥ 98%, Sigma-Aldrich, Merck, Darmstadt, Germany). TISAB reagent from Merck Darmstadt, Germany) was used for F detection. Barium chloride, hydrochloric acid 37%, sodium chloride, glycerol, and isopropyl alcohol anhydrous were marketed from Honeywell, Fluka, Merck, Darmstadt, Germany) in order to perform SO42− analysis. All the solutions for standards and reagents were prepared using ultrapure water provided by Millipore Simplicity UV (Merck, Darmstadt, Germany) equipment.
The equipment’s AVIO 500 ICP-EOS Spectrometer (Perkin Elmer, Waltham, MA, USA) with hydride generation FIAS 400 (Perkin Elmer, Waltham, MA, USA) and ultrasonic nebulizer U6000AT+ (Teledyne Cetac Technologies, NE, USA), AFS Quick Trace Mercury Analyzer M-8000 (Teledyne Cetac Technologies, NE, USA), Specord 210 Plus UV-Vis Spectrometer (Analytik Jena, Göttingen, Germany), and WTW 9620IDS Multiparameter (Xylem Analytics, Rye Brook, New York, NY, USA) were used for the determinations and quality control of the analytical results.

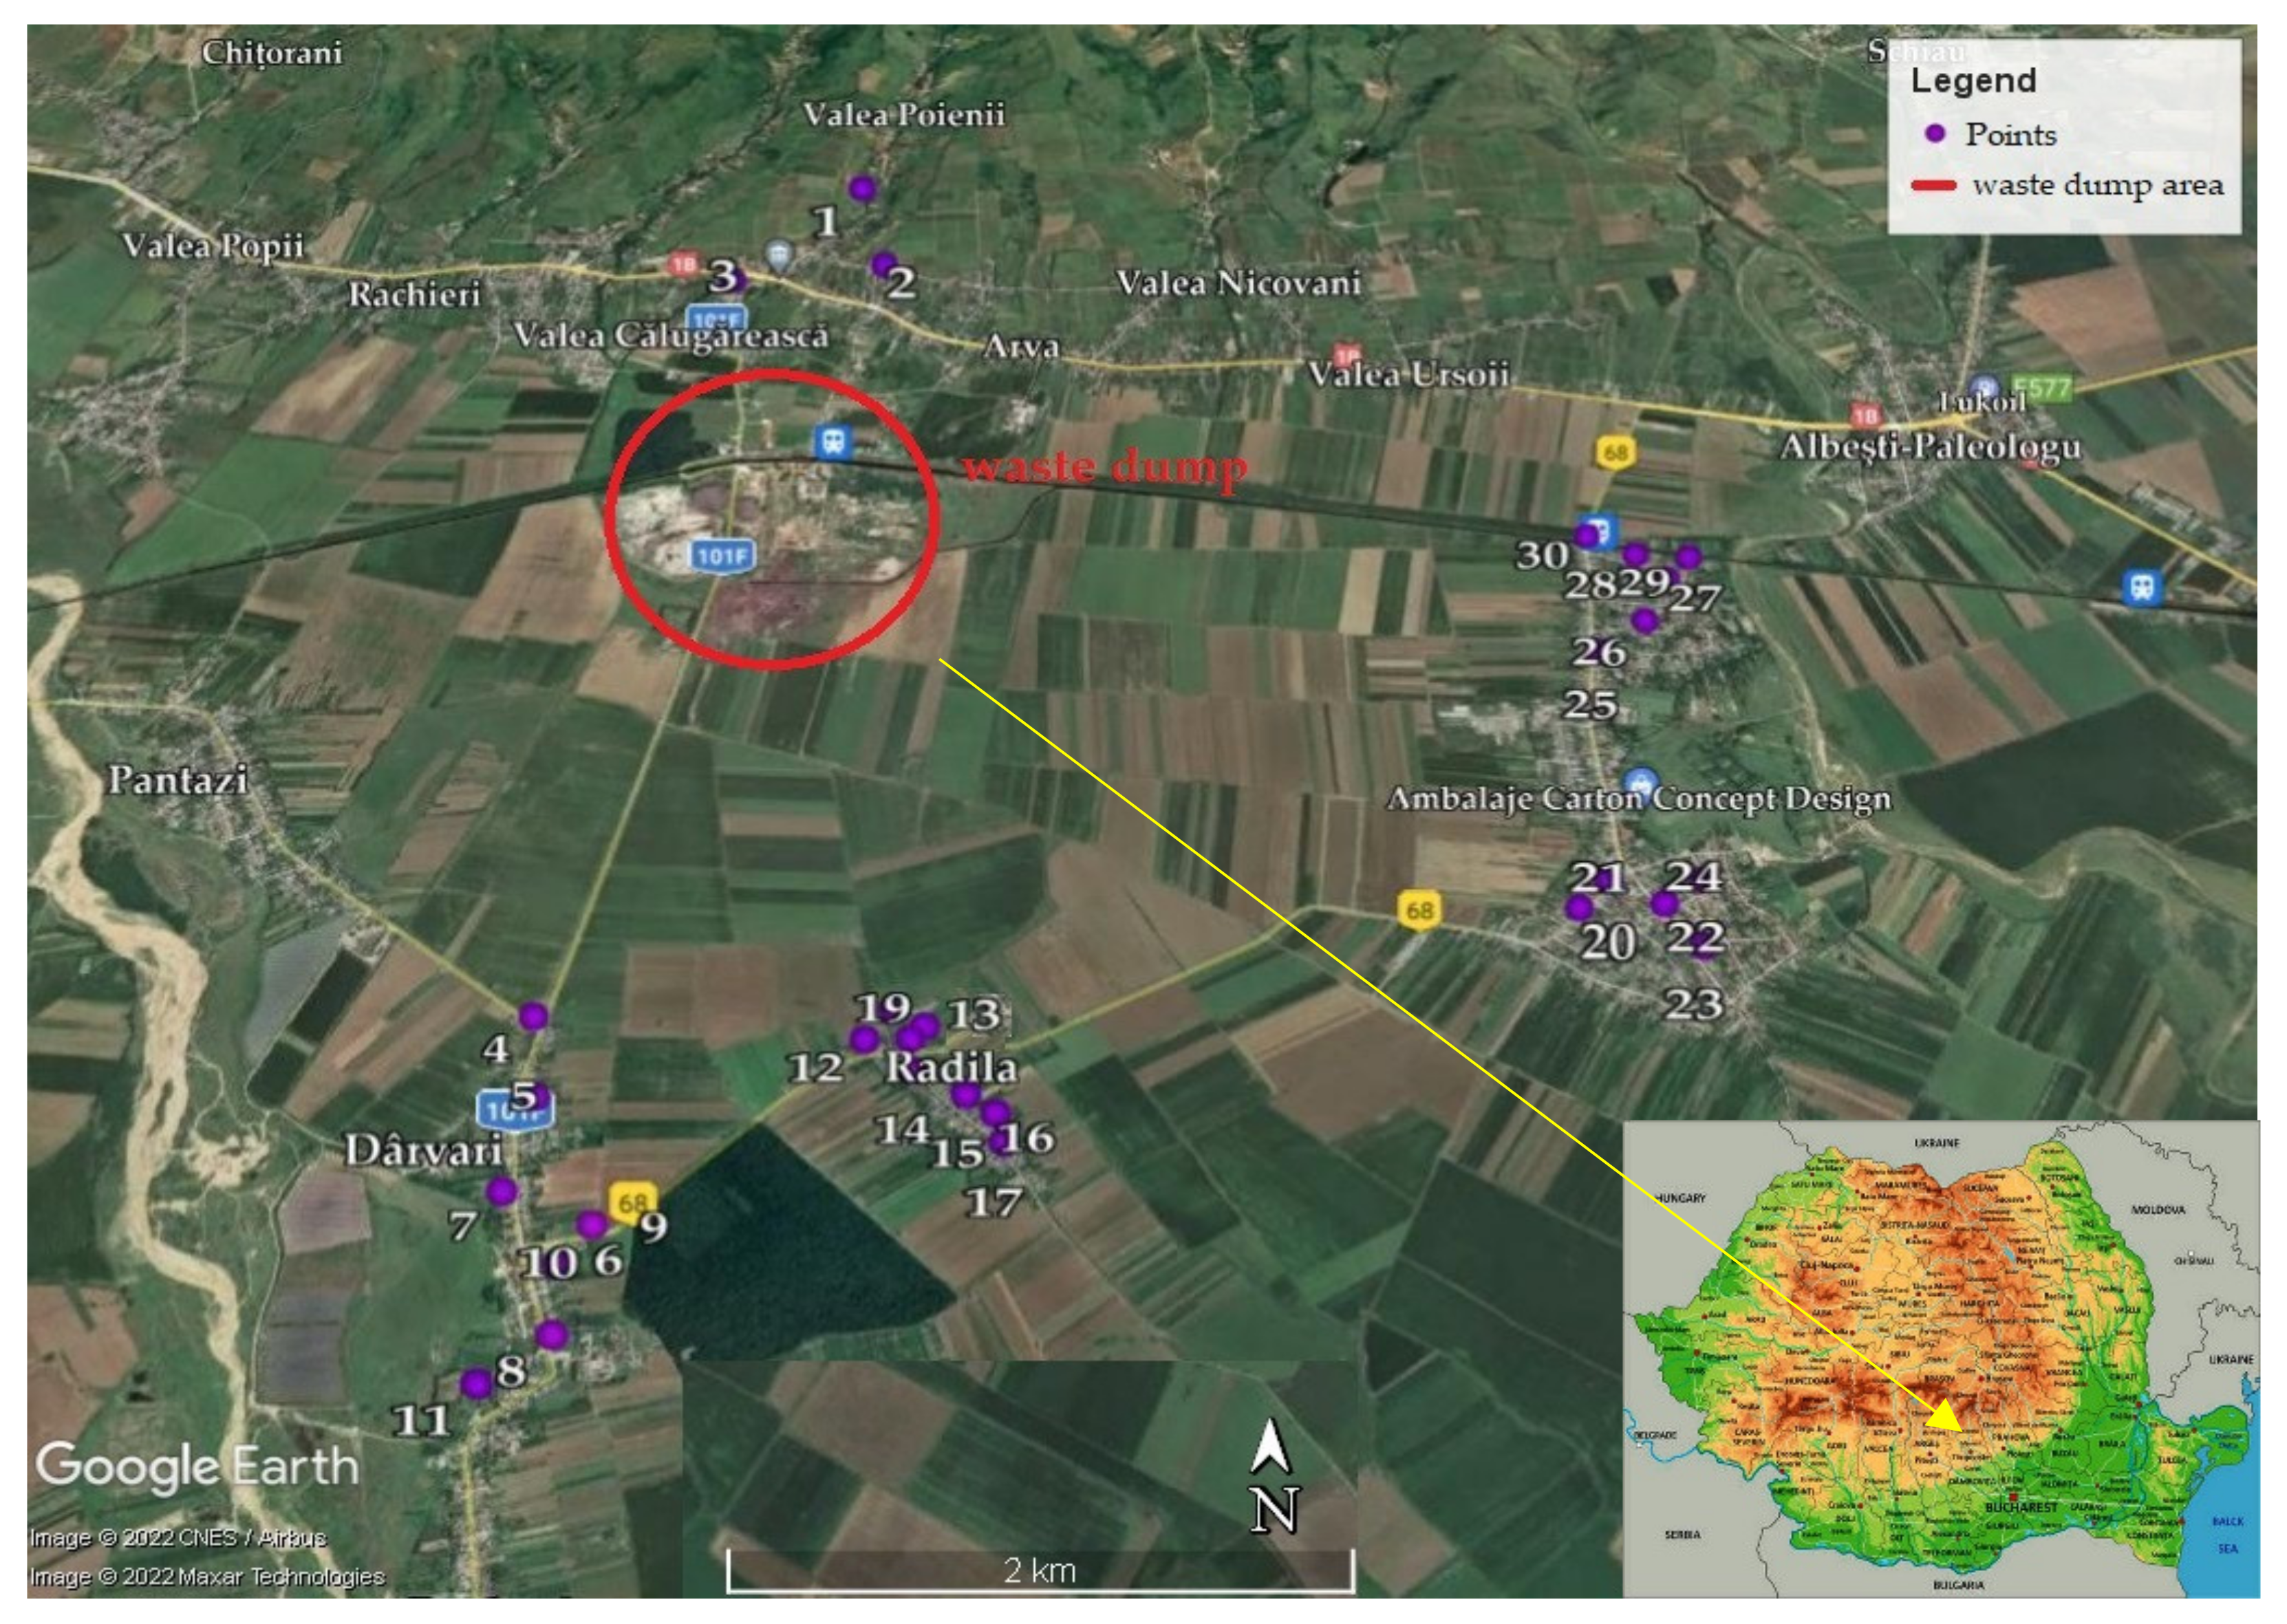
2.2. Samples Collection

The studied zone, as shown in Figure 1, is located in rural areas in the immediate vicinity of pyrite ash storage dumps, surrounded by agricultural land cultivated with cereals. Thirty groundwater samples were collected between 21 March and 18 October 2021 in three different campaigns (March, July, and October), with ten samples for each campaign (Figure 1, sampling points). Five sectors were investigated (Valea Calugareasca Commune, Darvari, Radila, Vadul Parului, and Albesti Muru villages) within an area of 4.5 km2 around waste dumps. Thus, eight samples each were collected from Darvari and Radila villages, six from Albesti Muru village, five samples from Vadu Parului village, and only three samples from Valea Calugareasca commune. A higher number of samples were collected from locations situated in the direction of aquifer flow and less from the hill area (Valea Calugareasca) cultivated with vines. The groundwater samples were taken from inhabitants’ household fountains or street fountains using local hydrophore pumps after purging the groundwater supply system to flush stagnant water. The samples were collected in plastic containers and were kept at 4 °C during transport to the laboratory.

2.3. Geology and Hydrogeology

The location, from the border between the Roman Plain and the Pericarpian Hills of Prahova, in an area with altitudes between 100–375 m, belongs to the plain of Piedmont and the northern part of the slopes of the sub-Carpathian Hills of Prahova (Figure 1).
Regarding the soil quality, reddish-brown, clay-alluvial soils are widespread in the plain area, all types being favorable for cereals and corn. In the meadows that cross the plain and in the dredging area, there are large areas with alluvium and alluvial soils suitable for cereals and vegetables. The percentage of agricultural land with very good quality (soils without limitations for arable land use) is low, about 3.87% of the total agricultural area. Instead, lands with extremely severe limitations occupy 15.45% of the agricultural land as a result of slopes, deep erosion, and collapses. The aquifer structures are granular, with local development of the type of phreatic aquifers with discontinuous spatial extension except for the areas where the regional aquifers are with free surface, with relatively different hydrogeological characteristics. The aquifer system is fed directly from the rivers in northern Muntenia at elevations of 350–200 m [17,18].
During the investigated period in 2021, according to Romanian National Meteorological Administration, meteoric precipitations was in excess for spring and summer (51–75 mm month average) and in normal level in autumn (41–50 mm). The temperature regime was normal for the area and the period studied compared to the median of the standard reference interval (1991–2020) [19].

2.4. Methodology

Parameters, such as pH and electrical conductivity (EC), were measured on the sampling locations using the pH meter and conductometer. The cations K+, Na+, Ca2+, and Mg2+ and metals (Al, Cd, Cr, Cu, Hg, Fe, Mn, Ni, Pb, and Zn) were analyzed using simultaneous detection with ICP-OES equipment, the calibration curve being plotted in the range 5 mg/L to 50 mg/L for cations and between 10 µg/L and 100 µg/L for the other metals. Hydride generation coupled with ICP-EOS method (ICP-EOS-HG) was used for As, Se, and Sb parameters (calibration curves in the range 1 µg/L to 10 µg/L), while AFS technique was applied for Hg detection (calibration curve between 10 ng/L and 100 ng/L). HCO3 and Cl were analyzed with volumetric methods. SO42−, NH4+, and NO3 were measured with UV–Vis spectrometry methods, while F, pH, and EC were measured electrochemically. TDS analyses were measured with gravimetric method. Two different matrix type Certified Reference Materials Burtap-14 (Drinking water, Environment, and Climate Change Canada) and Ontario-12 (Lake Water, Environment, and Climate Change Canada) were used for the quality control of the analytical results for each set of analyzed samples. The analytical methods were in accordance with the international standards, as the laboratory applied all the requirements imposed by the EN ISO/IEC 17025 standard [20].
In Table 1 are presented performance characteristics of the applied methods using ICP-EOS, ICP-EOS-HG, and AFS equipment.

2.5. Data Processing and Analysis

2.5.1. Ionic Equilibrium

The accuracy of the hydrochemical analysis was tested using an ionic error equilibrium. The ionic equilibrium was calculated according to the normalized equilibrium, which should not exceed 5% of the ion difference (meq/L) [21]. Charge-balance error (CBE) was evaluated using the Equation (1).
CBE (%) = [(∑cation − ∑ anion)/(∑cation + ∑ anion)] ∗ 100
where ∑ cation represents the sum of cations (meq/L), and ∑ anion represents the sum of anions (meq/L). The CBE value must be between −5% and +5% to ensure the reliability of the data.

2.5.2. Statistical Analysis of Water Quality Data

Factor analysis was used to interpret commonly collected data on groundwater quality and to correlate these data to a specific hydrogeological process [22]. The procedure of FA has previously been presented in the works of Davis, 1973, and Brown, 1998 [23]. This method helps to simplify the complex problems that are described by many parameters, without losing information. Derived factors will behave in the same way as the statistically significant variables involved in this process [24]. Varimax rotation is performed to reduce the number of factors that describe the total variance. The significance of each factor is represented by its own values. Factors showing an eigenvalue greater than one are considered to be significant. The Kaiser–Meyer–Olkin ratio (KMO) needs to be higher than 0.5 for the methodology to be applicable to the data set [25]. The number of factors that will result may be indicative of the reasons for the change in data. Depending on the participating variables, each factor is assigned to a specific hydrogeological process. Case factor scores can be used to draw contour maps describing the spatial distribution of factors. Negative values represent areas that are not affected by the process that the factor describes, the positive values representing the affected areas [26]. The limitation in using factor analysis is the difficulty distinguishing processes that lead to similar differentiation of groundwater chemistry. Knowledge of the hydrogeological processes that can affect the studied environment of the physical and chemical processes that can affect the chemistry of groundwater are necessary to interpret the attribution of factors [15,27,28]. The statistical software NCSS 2022 was used to perform statistical data analysis.

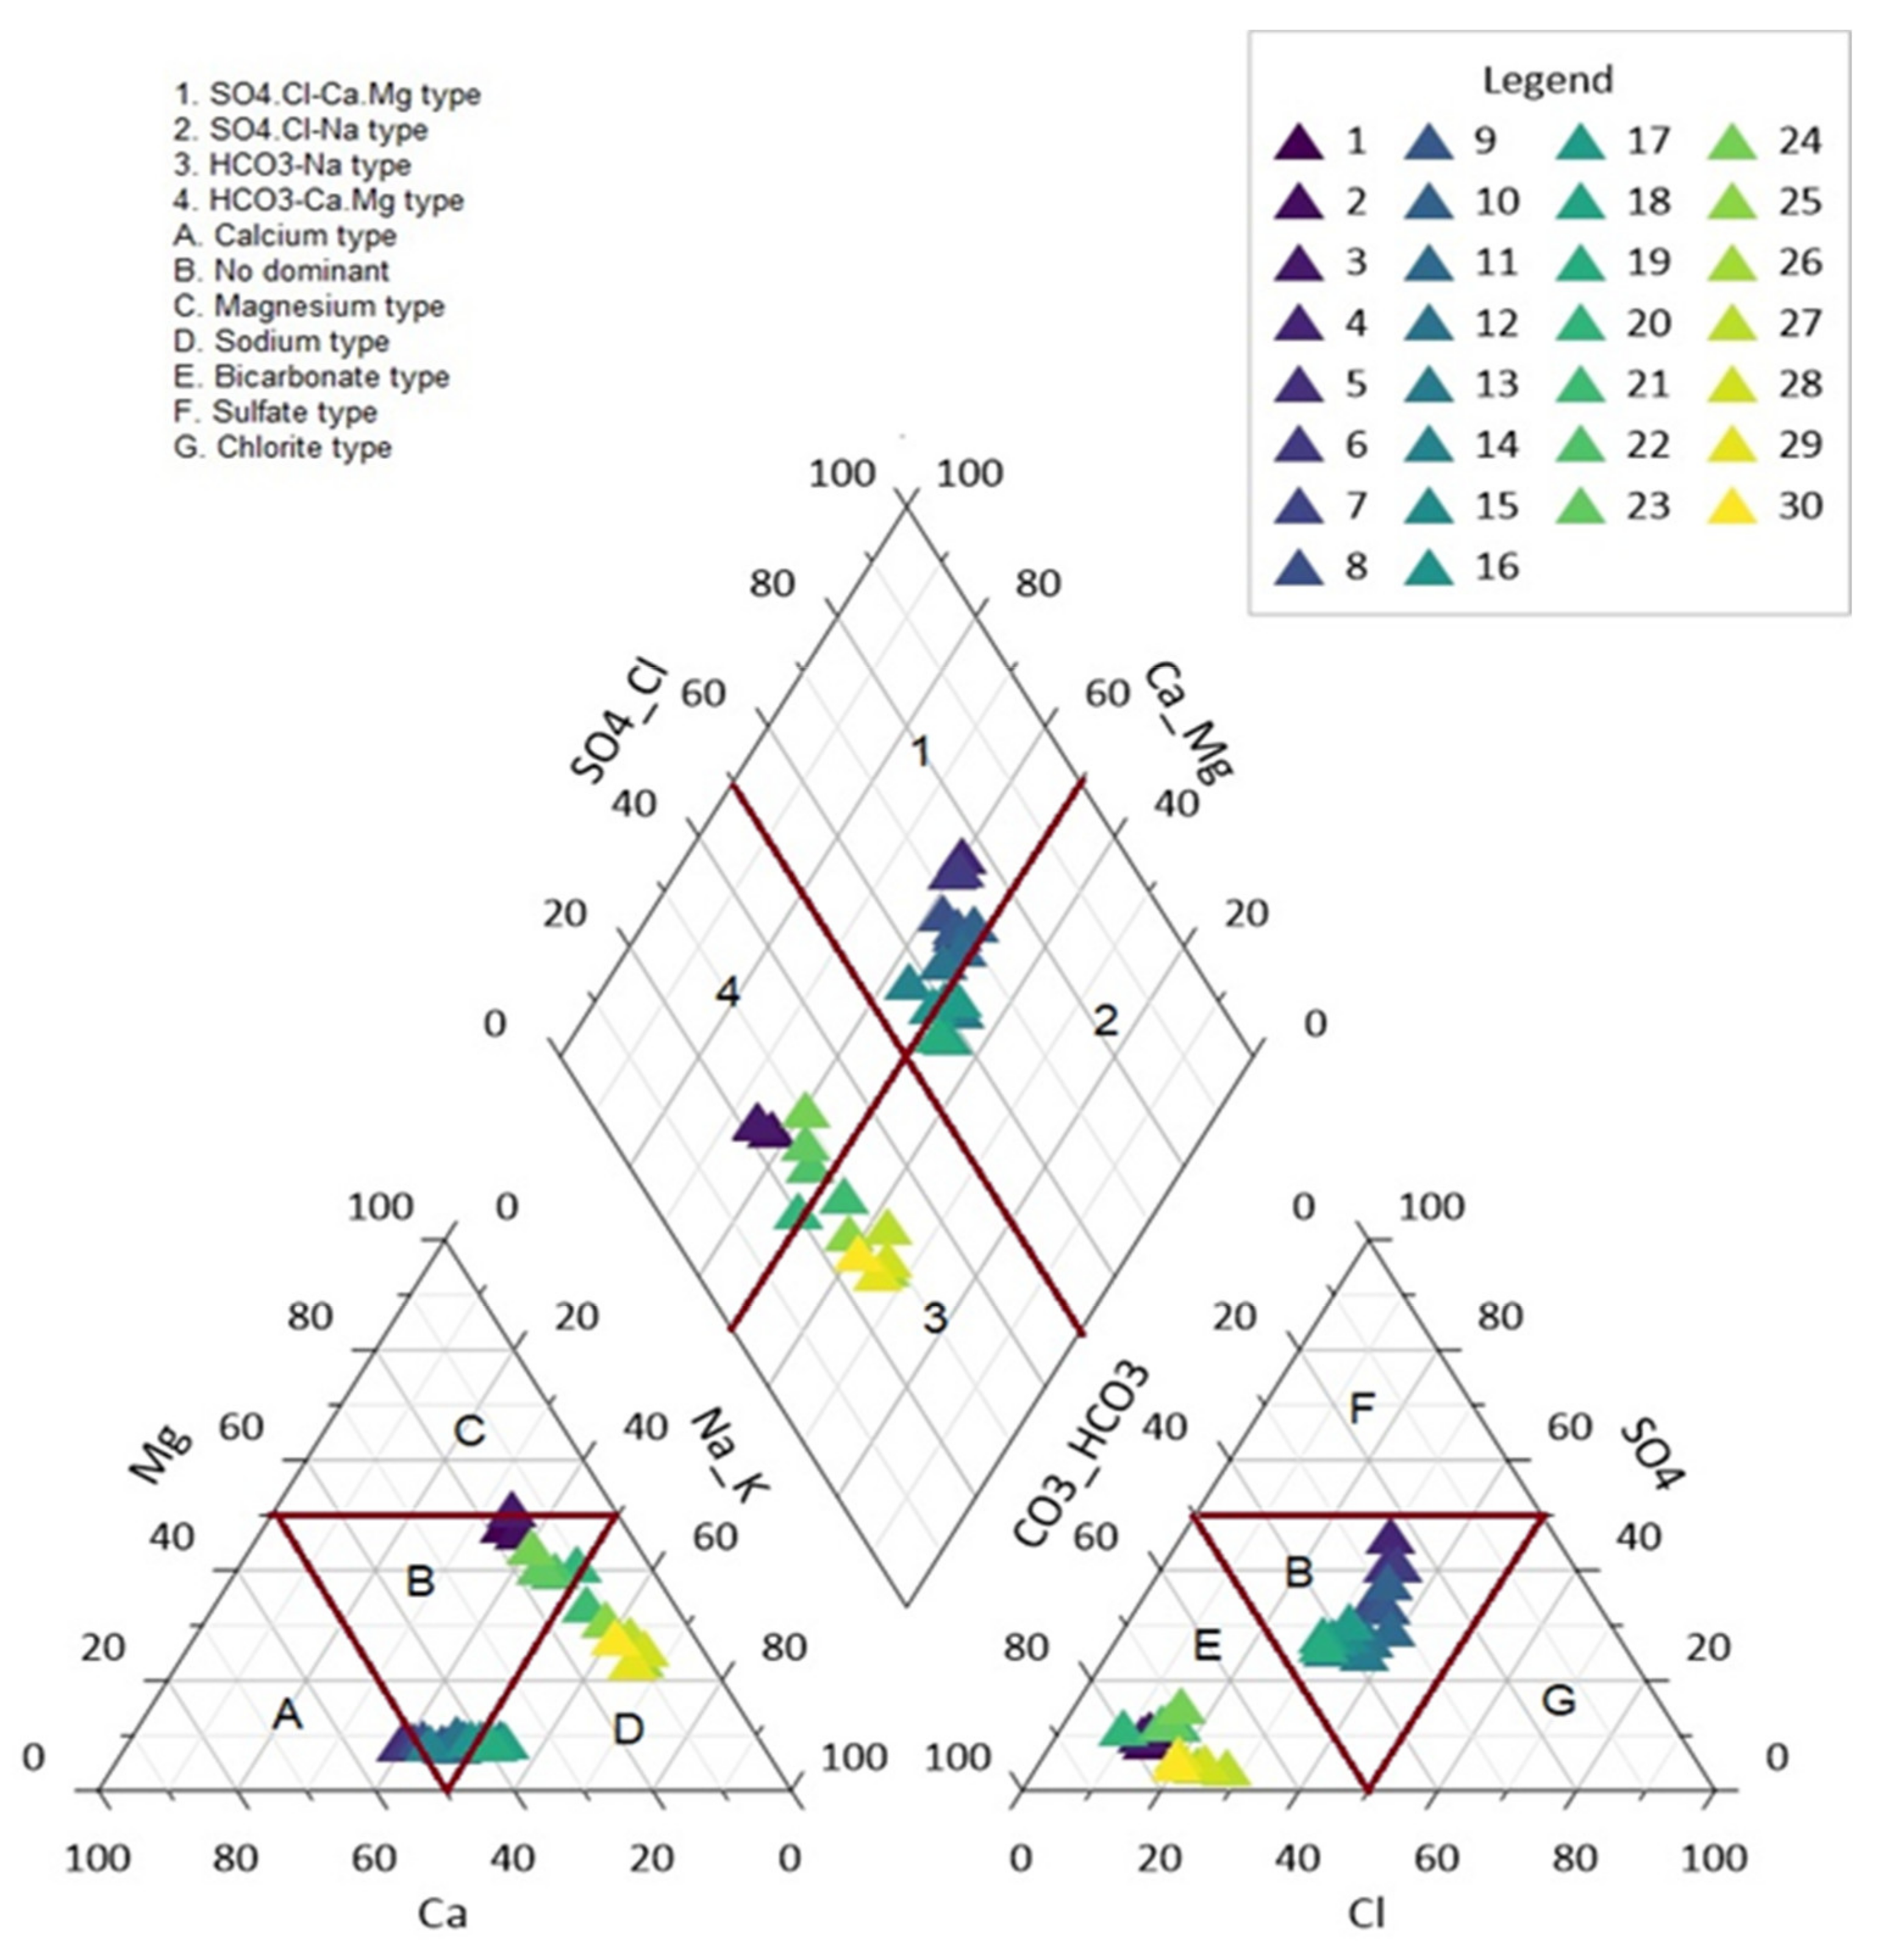
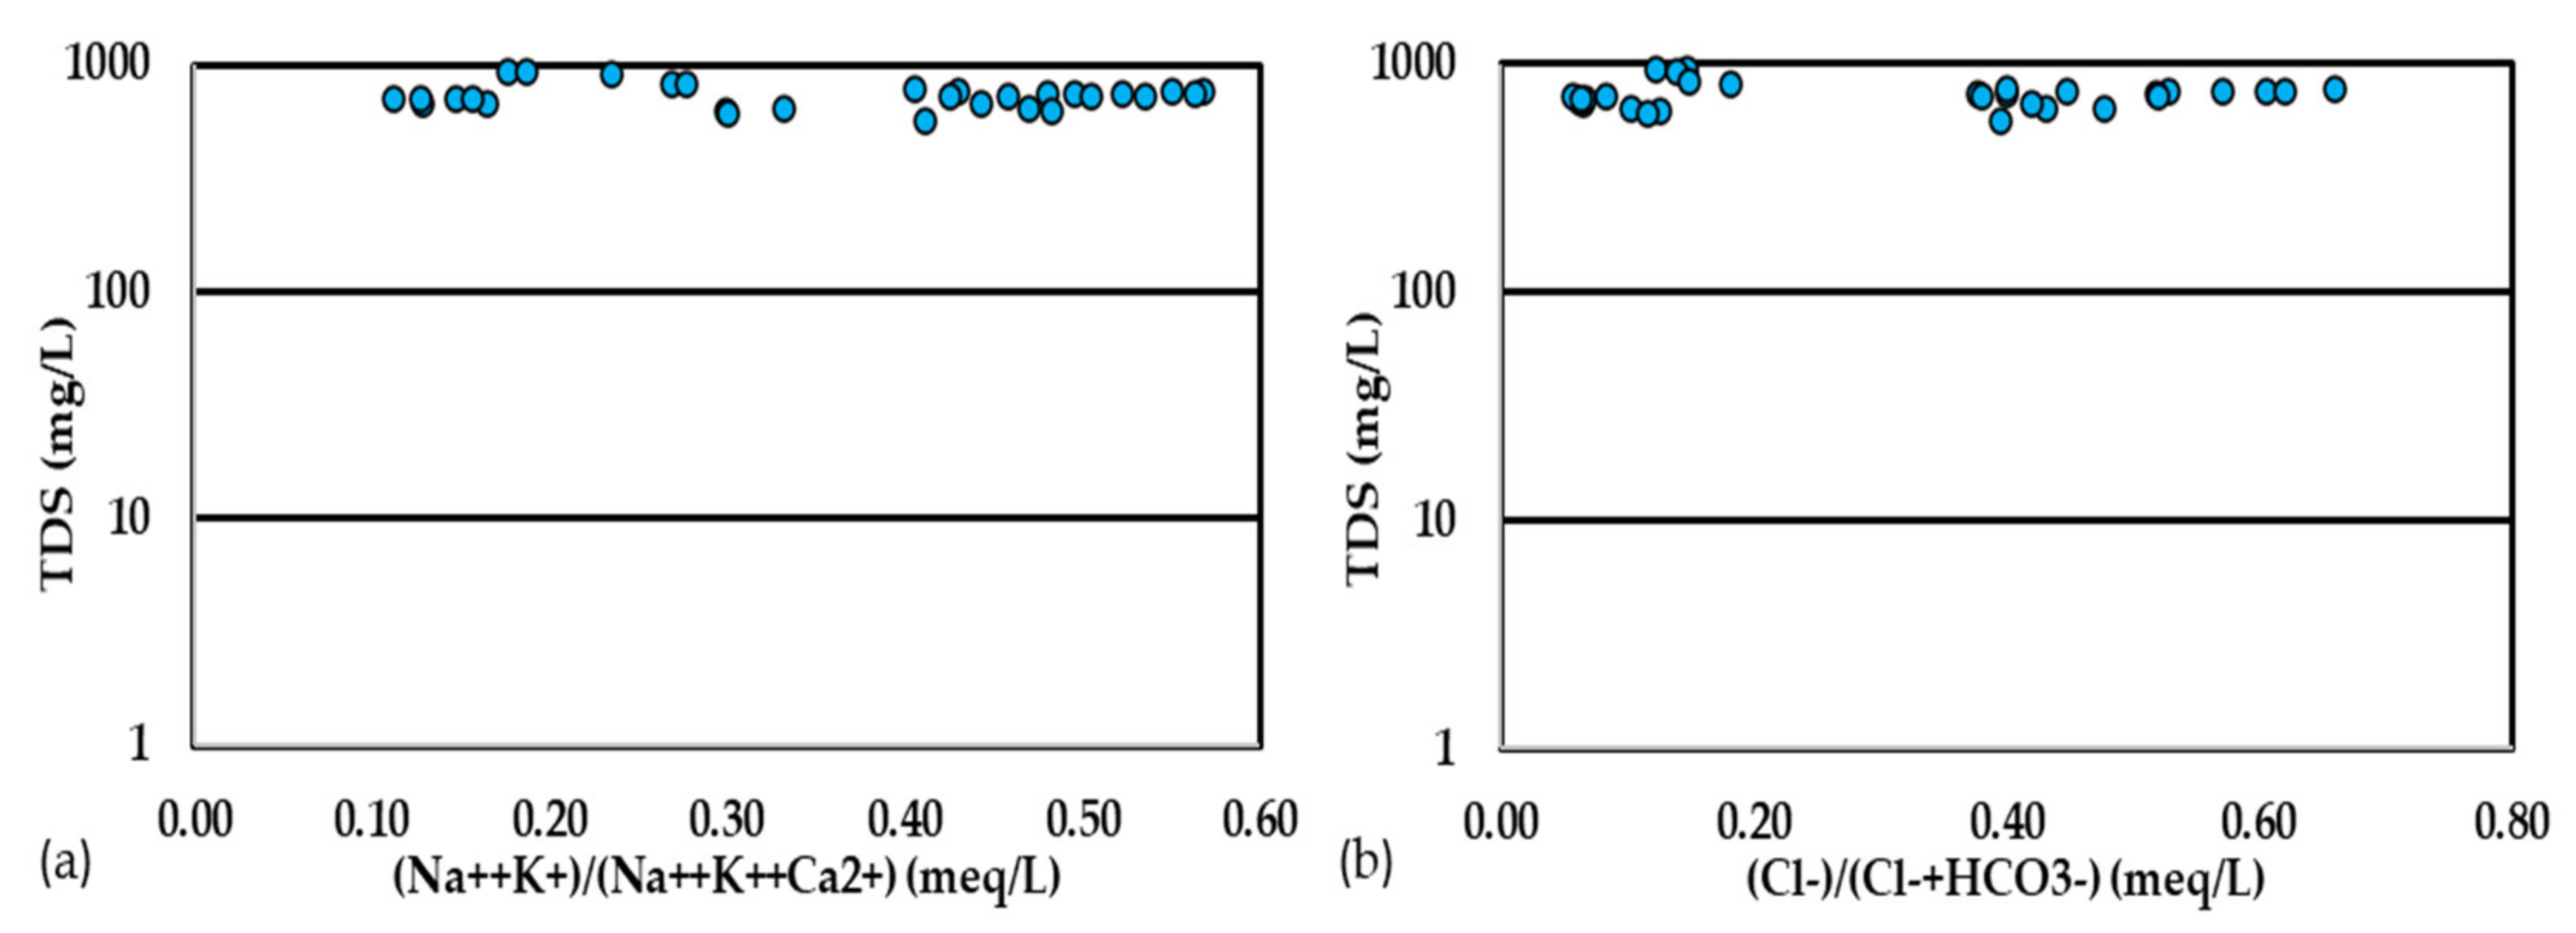
2.5.3. Piper and Gibbs Diagram

Hydrochemical facies is a hydrogeological term that uses the chemical processes of an aquifer to know the chemistry of groundwater. Knowing the dominance of the hydrochemical facies of groundwater can identify the origin of water. The trilinear diagram of the Piper has been used by many scientists to identify the existing hydrochemical facies in groundwater samples [29,30]. The Gibbs diagram is used to understand the processes that control the ion formation in groundwater can reveal the origin of salts in groundwater as well as the chemistry of ion formation and the identification of the main source of increasing salinity. Interpretations of the hydrochemical facies are useful tools for determining the chemical history of groundwater bodies and for distinguishing between different types of groundwater depending on the presence of dominant ions [31]. Due to the hydrochemical classification, mixtures of end-element compositions can be identified using the rhombic field assuming that all species initially identified in the two mixing waters remain in solution during mixing. The three-component mixture can be identified by the representation of vectors between three samples in the diamond-shaped field. The Piper diagram should not be used to predict or determine a pattern of water mixtures, especially for mixed groundwater types.
The Piper diagram [32] was used to segregate the analytical data needed to determine the sources of constituents dissolved in water. The applicability of the procedure is possible due to the natural water having anions and cations in chemical equilibrium. According to studies reported in the literature, the dominant cations in water proved to be Na+, Mg2+, and Ca2+, while SO42−, Cl, and HCO3 were the most abundant anions [33,34,35,36]. The concentration of chemical components in natural groundwater depends on many processes and conditions, including the availability and solubility of minerals, the geochemical environment (pH and EC), and exchange processes, which may be different for the type of aquifer water. The main governing processes include evaporation, precipitation, and water–rock interaction. The chemical composition of natural groundwater depends on many processes and conditions, such as the availability and solubility of minerals and the geochemical environment. The scatter plot of Gibbs [37,38,39] highlights the influence of these processes, where the ratios Na+/(Ca2+ + Mg2+) were represented in relation to the total dissolved solids (salinity).
Due to the hydrochemical classification, mixtures of end-element compositions can be identified using the rhombic field assuming that all species initially identified in the two mixing waters remain in solution during mixing. The three-component mixture can be identified by the representation of vectors between three samples in the diamond-shaped field. The Piper diagram should not be used to predict or determine a pattern of water mixtures, especially for mixed groundwater types [40].
Gibbs developed the initial concept for surface water by studying three processes that can change the chemistry of this type of water by plotting it. Applying a diagram with the same axes to describe the processes that determine the composition of groundwater may differ from those developed by Gibbs due to longer residence times. Due to this process, the evolution of groundwater quality is dominated by water–rock interactions [41,42,43].
The Piper and Gibbs diagrams were generated using Graphic software version 13. The Gibbs ratio was calculated with Equations (2) and (3).
Gibbs ratio I for anion = Cl/(Cl − HCO3)
Gibbs ratio II for cation = (Na+ + K+)/(Na+ + K+ + Ca2+)

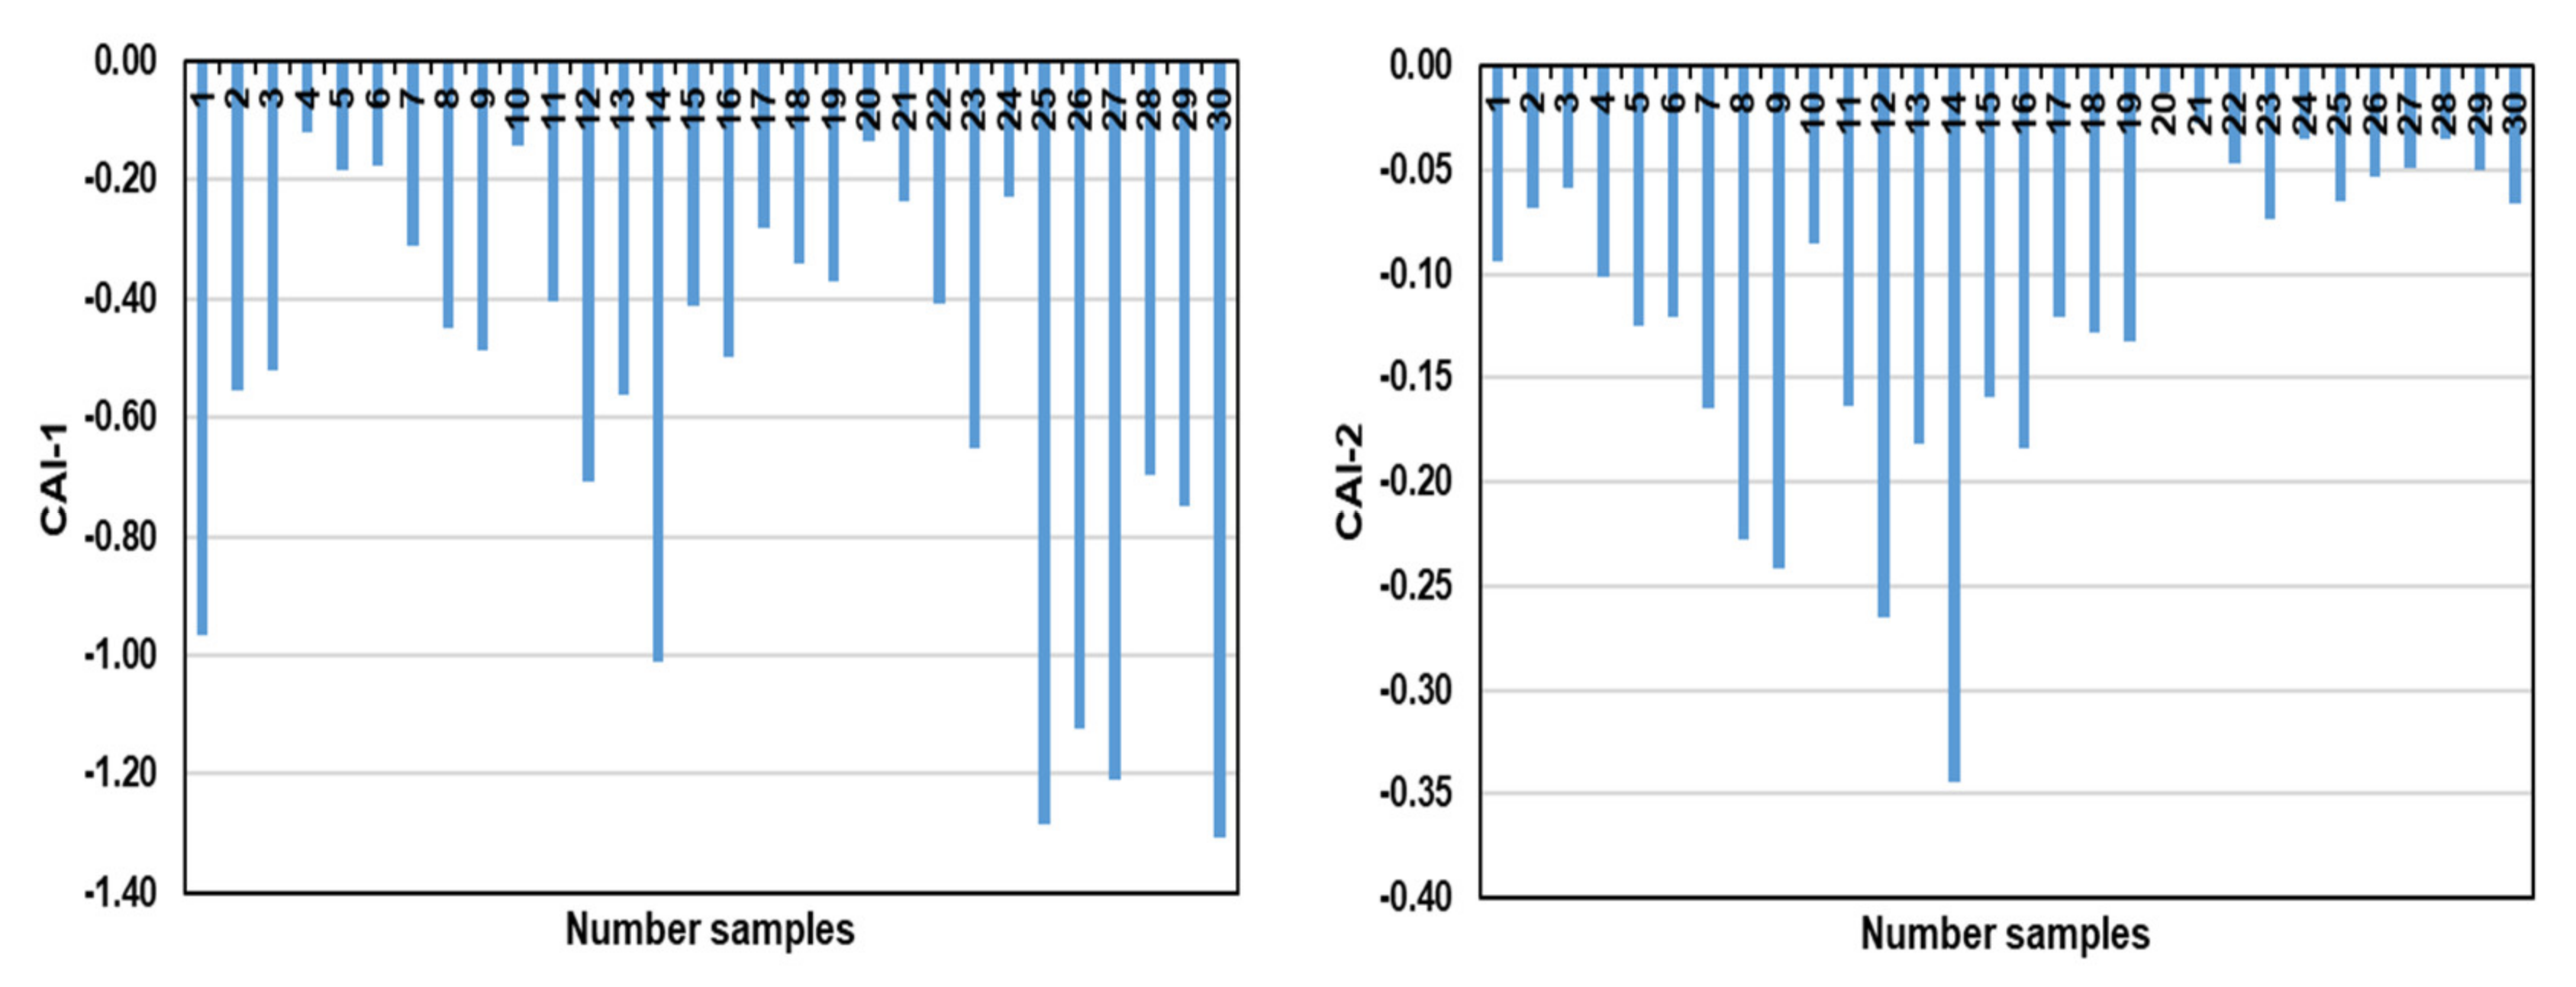
2.5.4. The Chloro-Alkaline Indices (CAI)

The chloro-alkaline indices, CAI-1 and CAI-2, identify the various changes in the composition of groundwater [44]. Chloro-alkaline indices were used to indicate the ion exchange between terrestrial structure and groundwater [44]. CAI-1 and CAI-2 indices can be positive or negative. Positive values suggest a direct exchange reagent of K+ and Na+ ions with Ca2+ and Mg2+ ions in the rock composition. Negative values of CAI-1 and CAI-2 indices indicate an indirect exchange of Ca2+ and Mg2+ ions in the water with the K+ and Na+ ions in the rocks. The exchange is indirect, suggesting a chloro-alkaline imbalance. Both reactions are known as ion exchange reactions [45]. CAI-1 and CAI-2 indices were calculated using the Equations (4) and (5):
CAI-1 = [Cl − (Na+ + K+)]/Cl
CAI-2 = [Cl − (Na+ + K+)]/Cl]/[SO42− +HCO3− + CO32− + NO3]

2.5.5. Saturation Index (SI)

Processes such as recharge and discharge result from water–rock reactions as well as groundwater flows affect the hydrochemistry of groundwater. Along the flow direction, the hydrochemistry is affected by the mineral leaching. The SI index was calculated using Equation (6):
SI = log (KIAP/KSP)
where KIAP is the product of ion activity for a mineral equilibrium reaction, and KSP is the product of the solubility of the mineral. PHREEQC software was used to calculate the SI values of minerals in groundwater. The SI results suggest the trend of the chemical balance of water and minerals due to the processes resulting from the water–rock interaction [46]. If unsaturated (SI greater than zero), the mineral will be continuously damaged by the groundwater, but if it is supersaturated (SI less than zero), the mineral will precipitate, and if the SI is close to zero, the mineral will remain in a state of equilibrium with the groundwater phase [47].

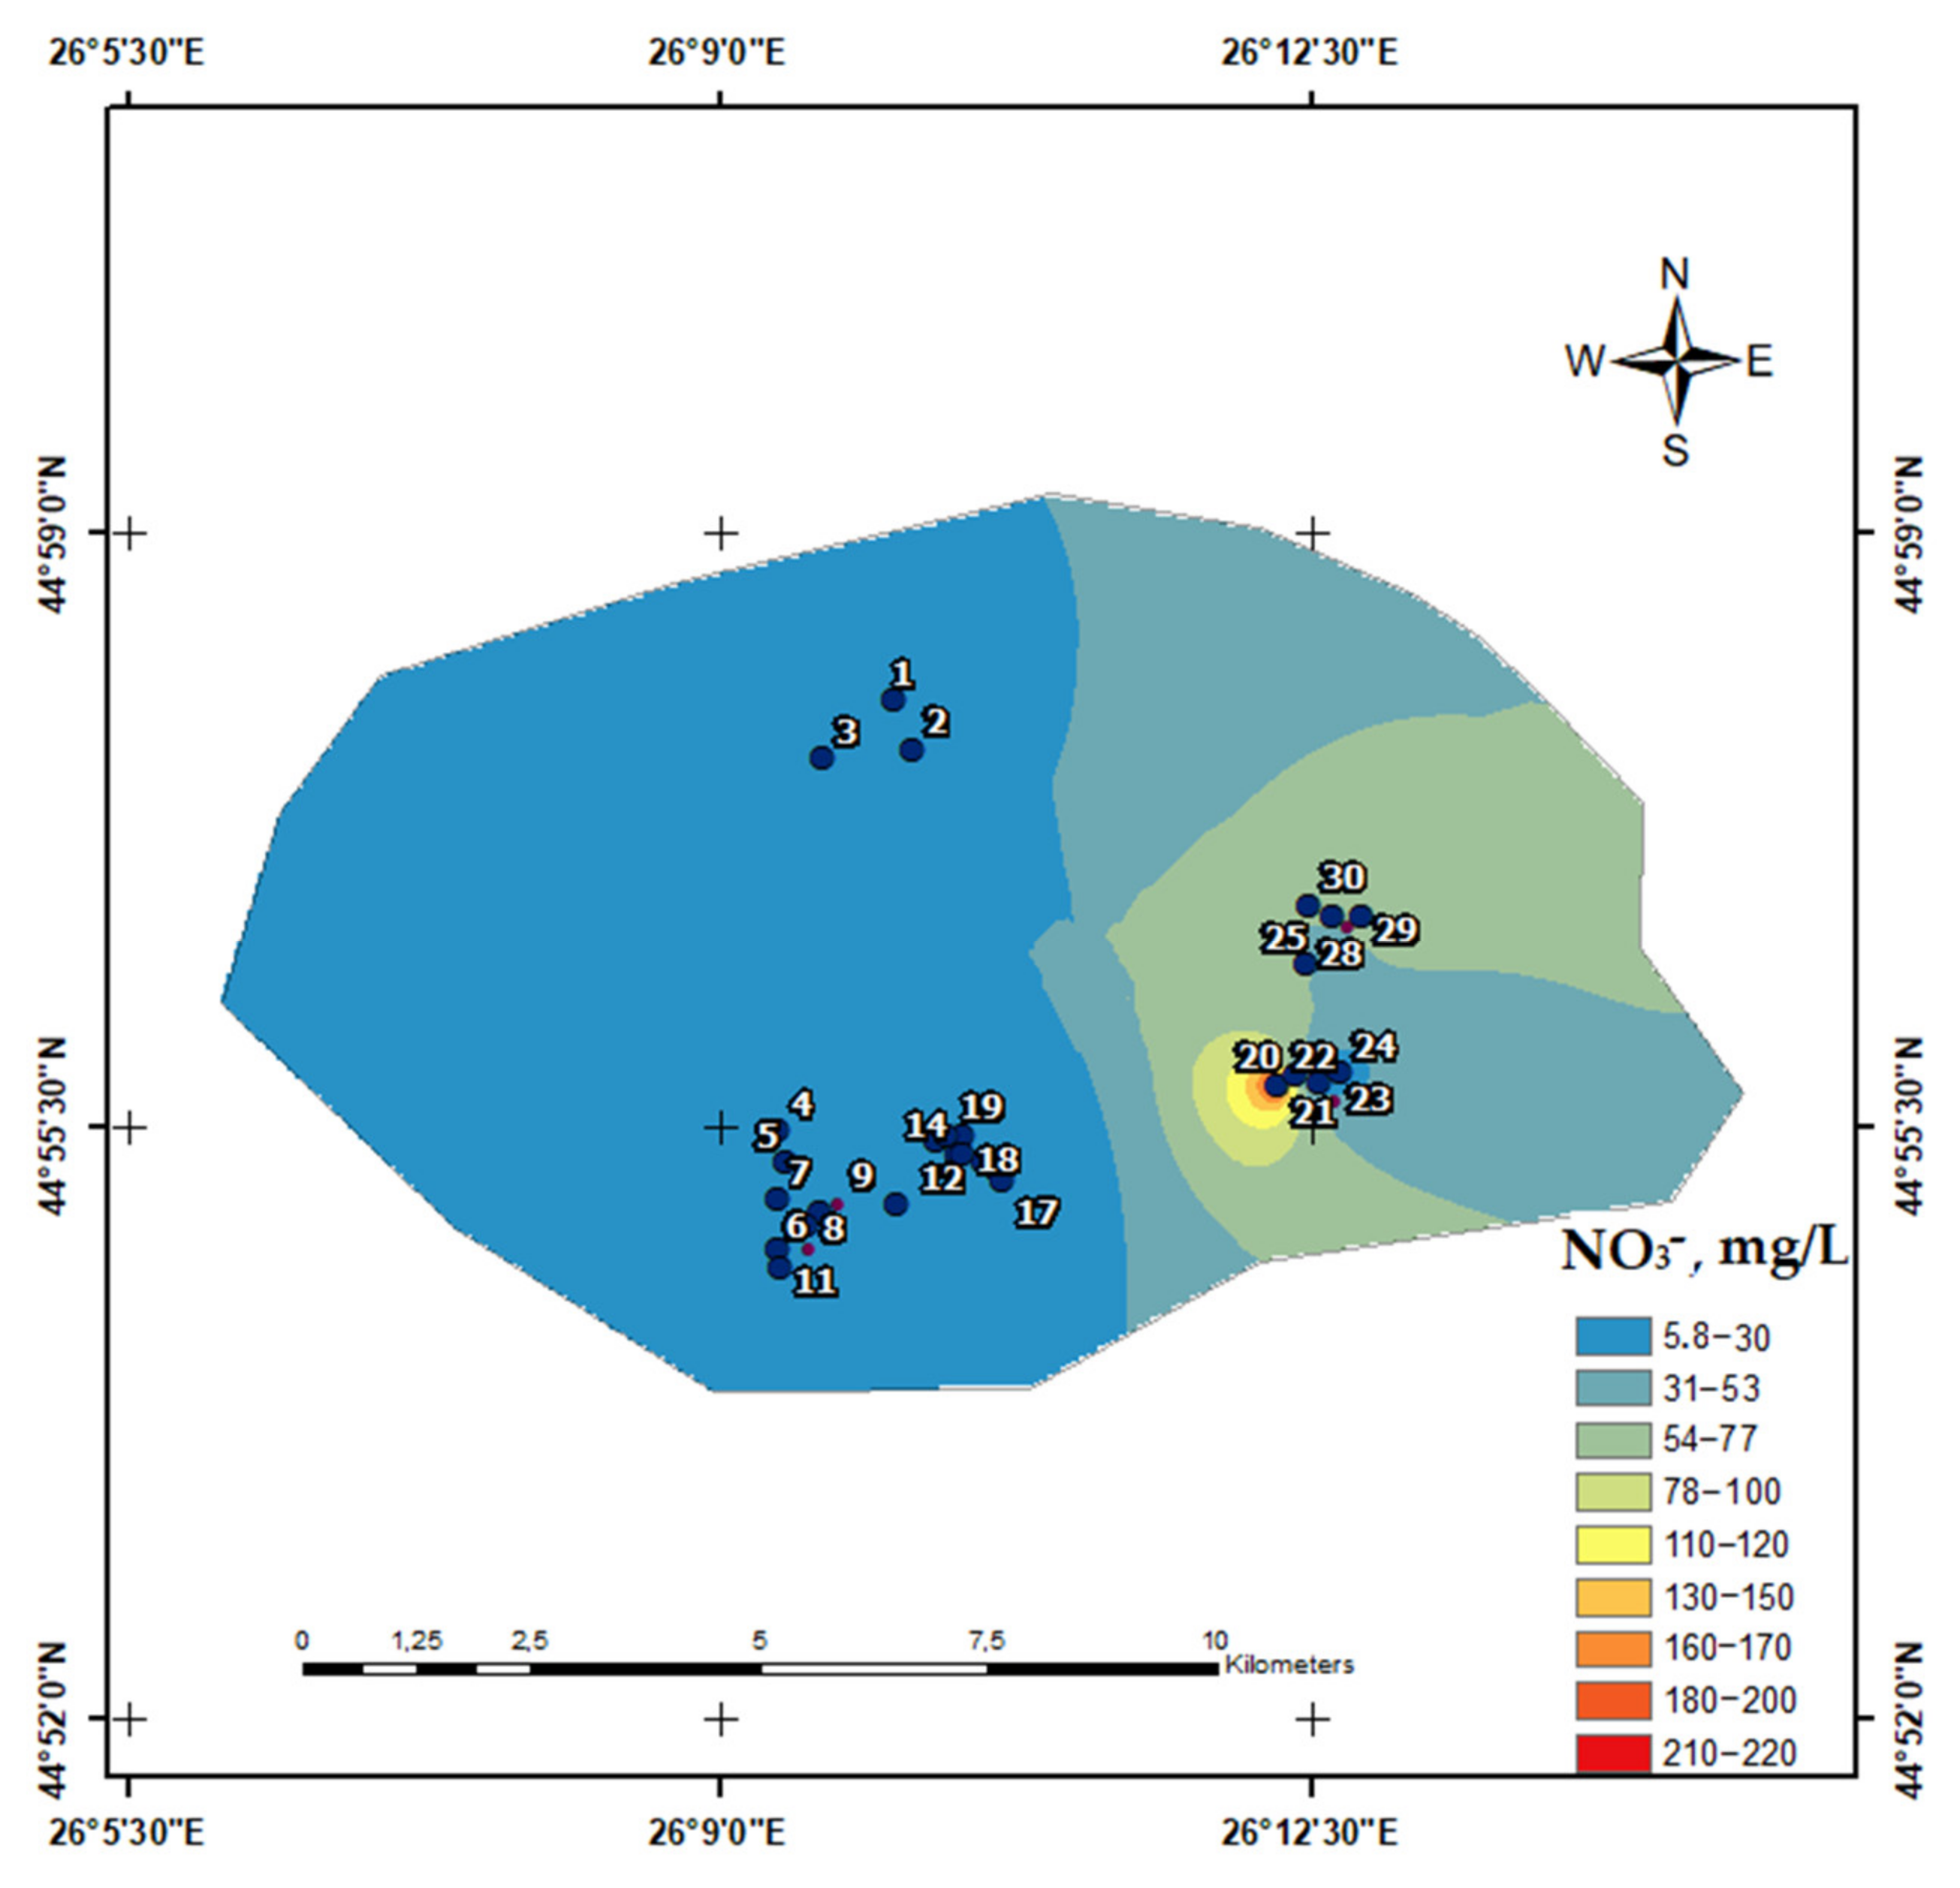
2.5.6. Spatial Analysis

For the spatial analysis of various physical-chemical parameters and quality index of the analyzed water samples, geographic information system (GIS) contouring method developed with ArcGIS 10.5 software was used [48,49,50]. The preparation of spatial distribution maps for each physical-chemical parameter was performed using reverse distance weighted interpolation (IDW) techniques. The IDW (inverse distance weighted) tool uses an interpolation method in which only known z values and distance weights are used to determine unknown areas. The closer a point is to the estimated area, the more influence or weight it has on the mediation process [51]. IDW is a flexible method of spatial interpolation, which can be configured in different ways using only a known number of points. Another reason to use the IDW interpolation method is to create polyline barriers. IDW uses spatial autocorrelation in mathematics. The closer values have a higher effect, while the farther ones have a lower effect [52,53].

2.5.7. Irrigation and Drinking Suitability

Excessive dissolved salts such as bicarbonate, sodium, magnesium, and chlorine in water can alter the osmotic pressure of groundwater, affecting agricultural soil and plants and leading to low yields and consequently preventing their growth. The chemistry of ions dissolved in water and their concentrations determine the suitability of water samples for irrigation.
Residual sodium carbonate (RSC) was used to indicate the danger of alkalinity to the soil [54]. In addition, the CSR index was used to find the adequacy of water for irrigation in soils that have a high level of cation exchange capacity. When sodium dissolved in water is present in greater amounts, compared to calcium and magnesium, the clay soil swells, generating a dispersion process that drastically reduces its infiltration capacity.
In the structure of the soil, the roots of the plants are unable to spread deeper into the soil due to lack of moisture. Irrigation of clay soils with a CSR index leads to the formation of alkaline soils. RSC index (meq/L) was calculated using the Equation (7):
RSC = (HCO3 +CO32−) − (Ca2+ + Mg2+)
Electrical conductivity (EC) and sodium percentage (%Na) play a key role in determination of the adequacy water used for agricultural purposes [55]. Richard [56] established water according to EC and % Na values in four classes (low, medium, high, very high). %Na (meq/L) was calculated using the Equation (8):
%Na = (Na+ +K+)/(Ca2+ + Mg2+ + Na+)
Sodium adsorption ratio (SAR) is a parameter of water quality for irrigation used in the management of soils affected by sodium.
It is an indicator of the suitability of water for use in agriculture determined by the concentrations of the main alkaline and alkaline earth cations presented in water [57]. SAR (meq/L) was calculated with Equation (9):
SAR = Na+/√(Ca2++Mg2+)/2

3. Results

3.1. Groundwater Chemistry

The statistical data of the physical-chemical parameters were analyzed, and the ionic ratio CBE and the calculated indices (SAR, %Na, RSC) for all thirty samples are presented in Table 2.
From the group of cations, Ca2+ was the main ion with a concentration range between 85 and 185 mg/L, followed by Na+ ranging from 24.8 to 173 mg/L, Mg2+ between 13.8 and 80.2 mg/L, and K+ with concentration values varying between 0.18 and 4.33 mg/L.
Regarding anions, samples were dominated by HCO3 ion with concentration values ranging between 214 and 628 mg/L, followed by SO42− ion that varied between 52.6 and 248 m/L, Cl ion between 18.6 and 241 mg/L, NO3 ion between 5.84 and 220 mg/L, and F- ion whose concentration varied between 0.09 and 0.40 mg/L. The pH of the analyzed groundwater samples varied between 6.9 and 7.4 pH units. EC ranged from 758 to 1308 µS/cm, and total dissolved solids (TDS) showed values between 562 and 942 mg/L. The CBE% for all groundwater samples was between −3.89 and 3.47, which indicates that the analytical data were reliable. The anionic chemistry of water showed that the HCO3 ion is dominant, constituting 69% of the total anions in 30% of the groundwater samples, while the SO42− ion constituted 33% of the total anions in 53% of the analyzed samples. The Cl ion constituted 32% of the total anions in 53% of the analyzed groundwater samples.
Regarding metals concentrations, only As, Fe, Cu, Zn, and Al were detected in groundwater samples (Table 2); all the values were situated below maximum admissible limits for water quality intended for human consumption according to in force legislation [58]. The concentrations of Cd, Cr, Ni, Pb, Hg, Mn, Se, and Sb were situated under the quantification limit of the applied methods (ICP-EOS and AFS for Hg).

3.2. Hydrogeochemical Facies

Interpretations of the hydrochemical facies are useful tools for determining the chemical history of groundwater bodies and for distinguishing between different types of groundwater depending on the presence of dominant ions [29]. Piper trilinear diagrams for the analyzed samples are shown in Figure 2.
Cationic fields show that 47% of the analyzed groundwater samples fell into the non-dominant type, 20% showed HCO3Ca2+ − Mg2+ type, 23% were HCO3Na+ type, and only 10% were of the SO42 – Cl − Na+ type. In addition, 43% of the analyzed water samples were the dominant type Na, while 47% were the HCO3 type. Another 53% of the water samples showed the mixed type without ionic dominance.

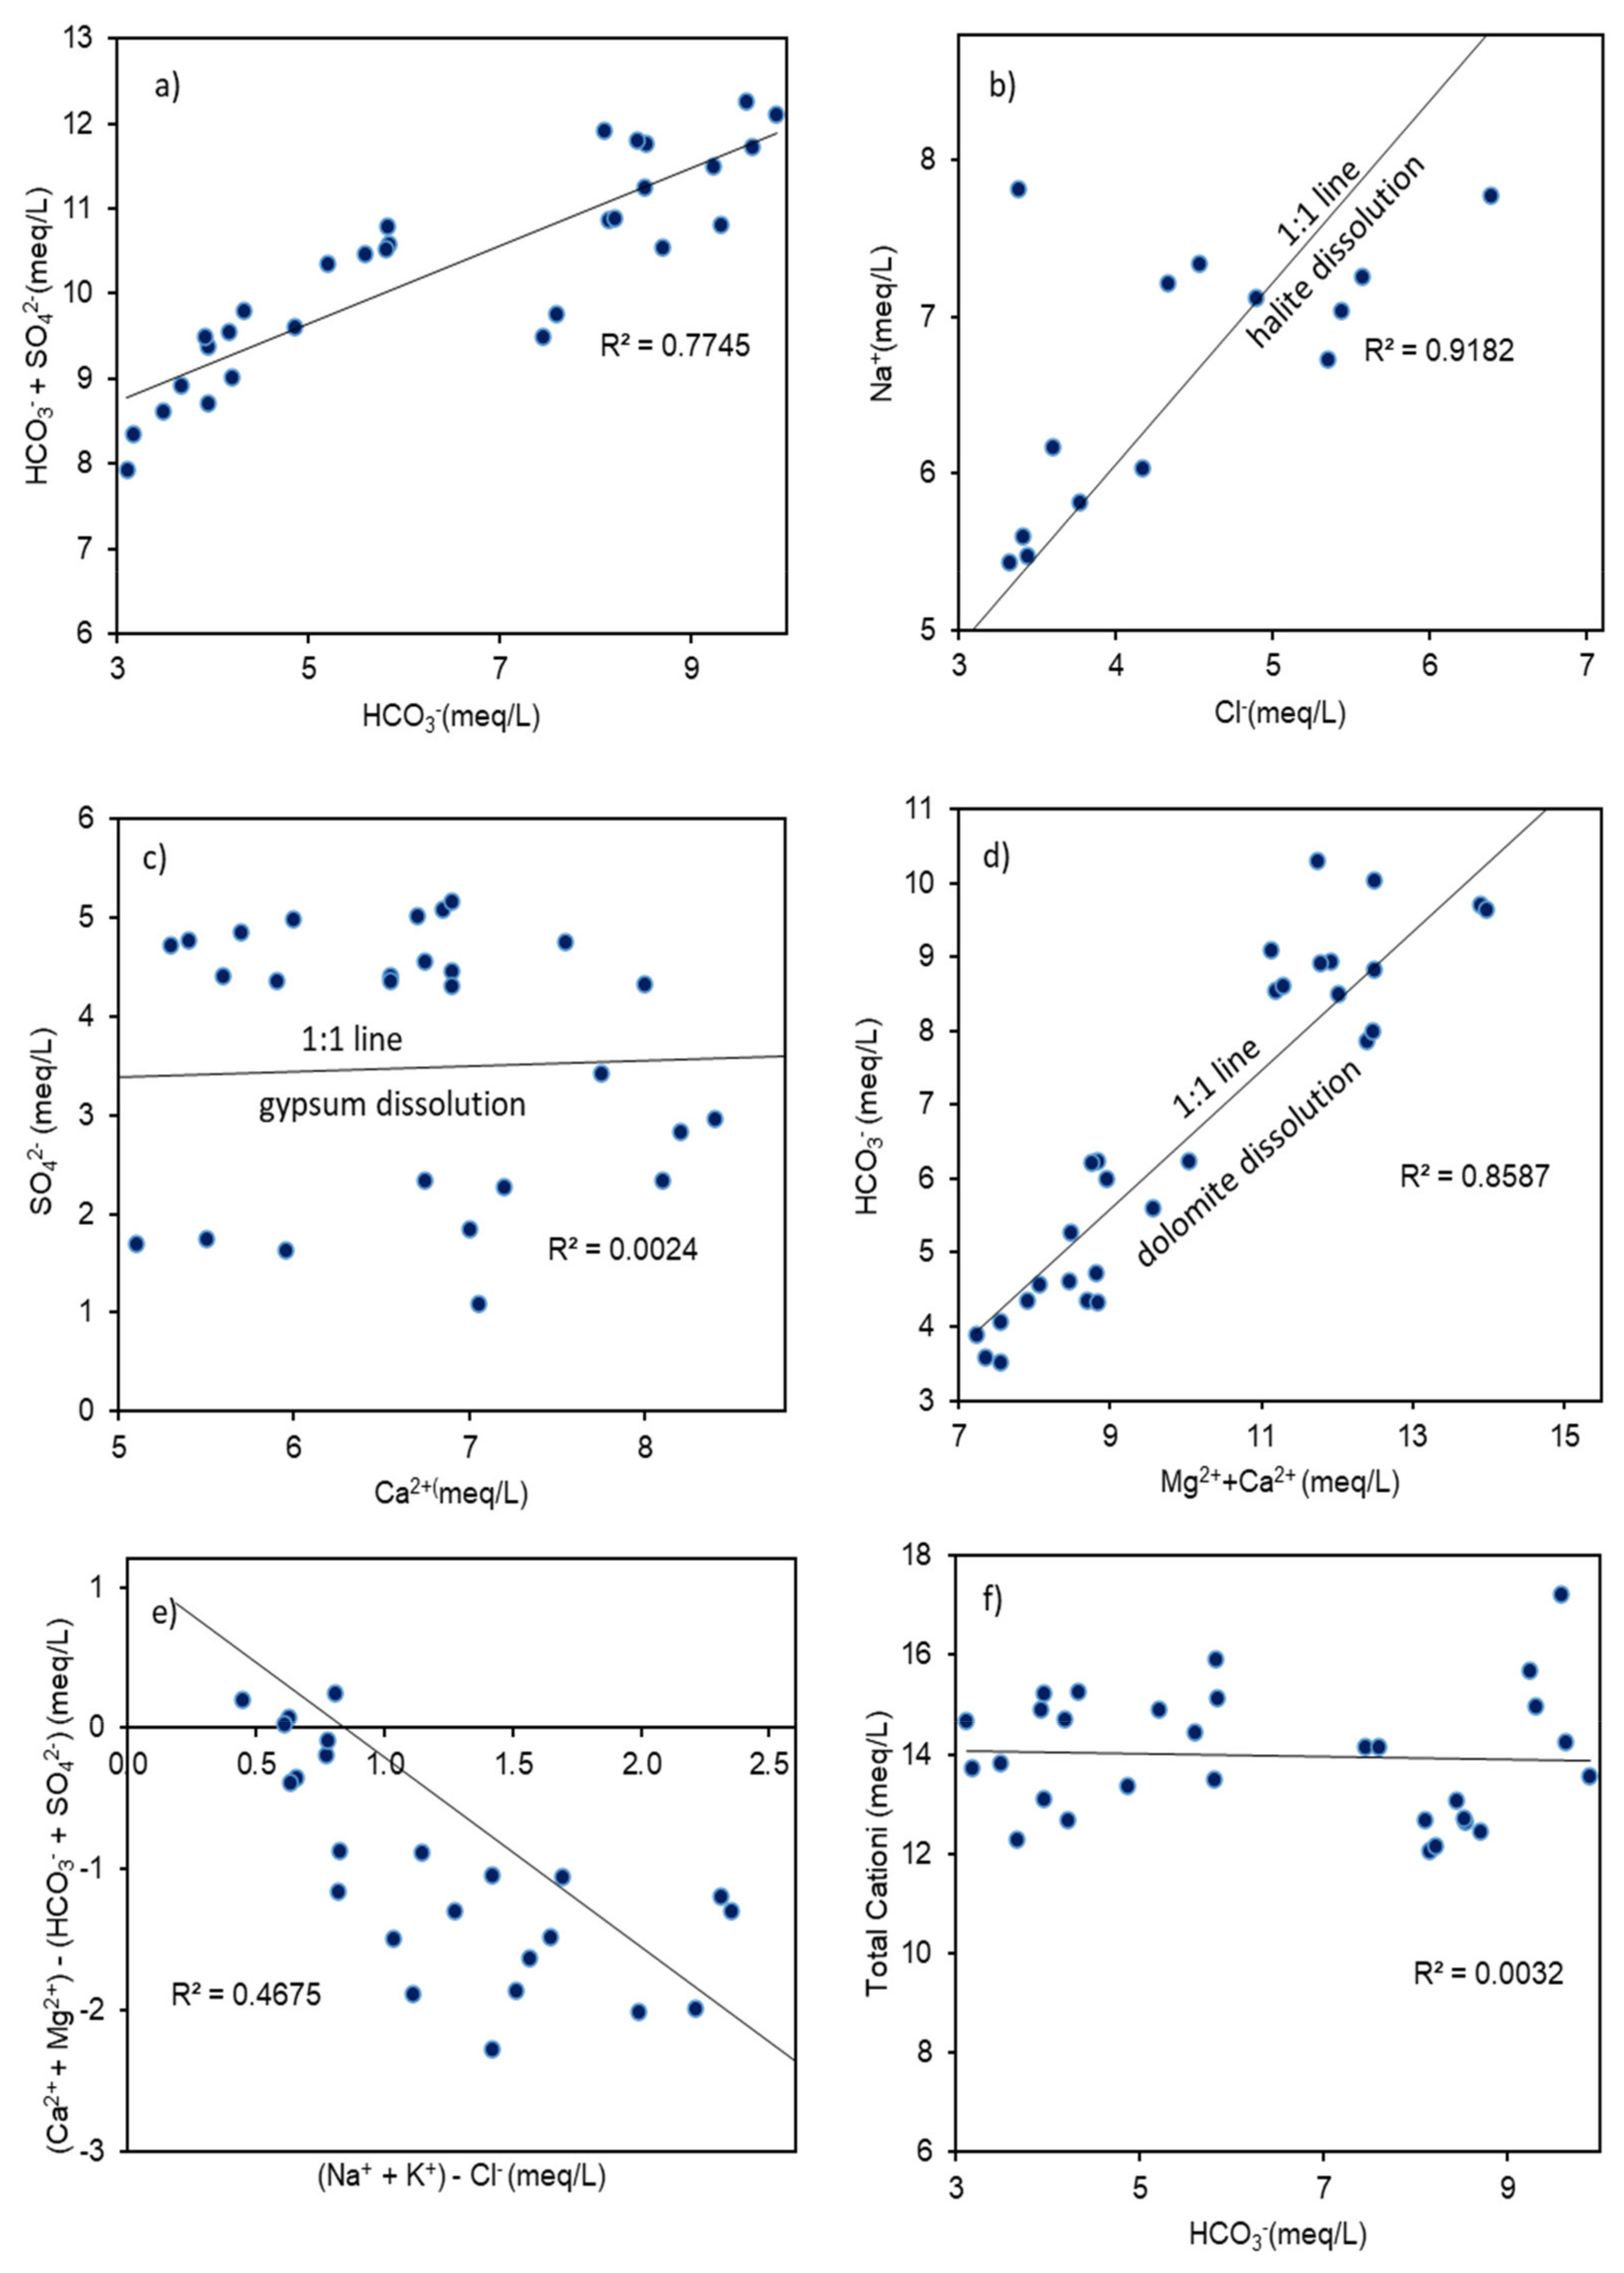
3.3. Natural Processes

Gibbs diagrams indicate that all groundwater samples from the affected area were under the dominance of evaporation processes (Figure 3a,b).
A plot of HCO3 + SO42− versus HCO3 (Figure 4a) indicates the presence of weather with carbonic acid, an important source of bicarbonate ions in the aquifer with a strong correlation coefficient (r = 0.824; R2 = 0.7745) (Table 3), as was reported in similar studies [59].
A plot of Na+ versus Cl (Figure 4b) showed a strong correlation (r = 0.935; R2 = 0.9182) (Table 3). The relationship between SO42− and Ca (Figure 4c, Table 3) was a value of R2 close to zero. The diagram (Na+ + K+) – Cl versus (Ca2+ + Mg2+) − (HCO3 + SO42−) shows strong correlation between Mg2+ and HCO3 (R2 = 0.8587) (Figure 4d, Table 3). The value of R2 in the diagram (Na+ + K+) – Cl versus (Ca2+ + Mg2+) − (HCO3 + SO42−) was 0.4675 (Figure 4e). The graph between total cations and bicarbonate (Figure 4f, Table 3) showed a R2 value of 0.0032. Because there is no correlation between Ca2+ and Mg2+, and the Ca2+/Mg2+ ratio was greater than 2, the presence of Ca2+ in the groundwater samples was reported due to carbonate weathering. Ca2+/Mg2+ ratio was situated between 1.89 and 6.17 for 87% of samples. The ratio Ca2+/Mg2+ for 3% of samples was less than 1.
The values of the chloro-alkaline indices CAI-1 and CAI-2 had negative values, indicating an ion exchange process between Mg2+ and Ca2+ ions in water with Na+ and K+ ions in rocks, thus confirming the tendency towards alkalization of the analyzed groundwater samples (Figure 5).

3.4. Sources of Anthropogenic Ions

Positive correlations were between SO42− and Na+ (r = 0.802), TDS with NO3 (r = 0.624), and between Na+−Cl (r = 0.935) (Table 3).
The average value of NO3 was situated within the limits according to admissible value [60,61,62,63], with only 17% of the analyzed groundwater samples analyzed exceeding 50 mg/L value. Figure 6 was designed using ArcMap 10.5 Software, developed by Environmental Systems Research Institute (ESRI), Redlands, California. The spatial distribution of NO3 showed a relatively large variation in the SE part of the investigated site, an intensively cultivated area.

3.5. Saturation Index

The study of the saturation indices indicated that the contribution of Ca2+ ions in the groundwater samples came from some processes of dissolving rocks such as aragonites with values between 1.27 and 2.69 and calcites with values between 1.43 and 2.82. Instead, the contribution of Mg2+ ions was given by dolomite degradation with values between 3.03 and 5.30 (Table 4). Negative halite values between −5.26 and −3.4 indicated that salt accumulation came from precipitation processes, as was reported in similar studies [64].

3.6. Statistical Screening for Water Quality Data

In this study, three factors were adequate to explain 91.33% of the variation for the component matrix. The description of the different factors extracted after varimax rotation is presented in Table 5.
Factor 1 (natural and anthropogenic component) explained a percentage of 49.51 from the total samples and showed a positive charge for HCO3, K+, SO42−, Mg2+, NO3, Na+, and Cl due to the phenomena of precipitation that can increase groundwater salinity and NO3 contamination from agricultural practices. Ion exchange processes generated enrichment with Na+ and Mg2+ ions.
Factor 2 (geological component) explained a variance of 38.65% of the total variance and showed a positive charge for TDS and EC and Ca2+, Fe, NO3. Carbonate degradation processes caused elevated Ca2+ concentrations.
Factor 3 (geological component) explained a variant of 9.66% of the total variant and showed a positive charge for F caused by dissolution in water and for NH4+ due to anaerobic processes in the underground aquifer.

3.7. Irrigation and Drinking Suitability

The groundwater for human consumption and agriculture use depending on the TDS parameter [65,66]. The obtained values according to TDS, %Na, SAR, and RSC are presented in Table 6. Following the study, 97% from the analyzed samples were classified as good for human consumption.

4. Discussion

Groundwater quality is determined by a variety of chemical components and their concentrations, which are largely obtained from geological data in the study area. From the chemistry study of the analyzed groundwater samples, different types of water were identified: HCO3-Ca-Mg as dominant type and HCO3 Na and mixed type. The geochemical processes that influence groundwater chemistry were the dissolution of dolomite and the precipitation of halite. Cation exchange processes influence the hydrogeochemical evolution of groundwater.
The Piper diagram suggested an alkaline-earth soil due to the presence of HCO3 ions. The dominance of HCO3 and Na+ ions indicated a high recharge and refresh following the natural processes of evaporation and precipitation presented in the alluvial nature of the studied region, respectively, with the tendency towards alkalinization.
Precipitation of carbonate minerals increased salinity due to evaporation, thus reducing Ca2+ activity in groundwater. Groundwater evaporation causes a loss of groundwater through the soil pores. At shallow depths, evaporation affects the chemical characteristics of groundwater by concentrating the chemical constituents. The effects of precipitation on shallow groundwater are more complicated due to the effect of water for ions such as NO3, SO42−, Ca2+, and K+.
The diagram (Na+ + K+) − Cl versus (Ca2+ + Mg2+) − (HCO3 + SO42−) indicated the possibility of an ion exchange process (Figure 4e). In this way, (Na+ + K+) − Cl represented the concentration of Na+ and K+ replaced by the dissolved sodium chlorides, while the (Ca2+ + Mg2+) − (HCO3+ SO42−) signified the amount of Ca2+ and Mg2+ accumulated or lost from the dissolution of dolomite or gypsum, similarly as was reported by Zhang et al. [47].
Strong correlation between ions Na+ and Cl clearly indicated the dissolution of halite. Exposure of silicate minerals to the weather condition also released bicarbonate [23]. Pyrite (FeS2) and gypsum (CaSO4 × 2H2O) are the two main sources of sulfate in water [60]. The relationship between SO42− and Ca2+ indicated that the main source of SO42− ions in groundwater was represented by pyrite ash (Figure 4c, Table 3), [67].
The cation exchange process is an important process that determines the chemistry of groundwater. A strong correlation between Mg2+ and HCO3 (Figure 4d, Table 3) indicated that an important source of Mg2+ ions was the dissolution of dolomite, which is similar to other studies [64,68]. In the studied area, the graph showed a R2 value of 0.4675 (Figure 4e), indicating that the exchange processes constituted a moderate source of ions in groundwater. According to other studies, dissolution of dolomite brings an equal concentration of Ca2+ and Mg2+ in water if the Ca2+/ Mg2+ ratio is 1 [64]. The graph between total cations and bicarbonate (Figure 4f, Table 3) showed a R2 value close to zero, suggesting that carbonic and silicate weathering were not the sources of HCO3 ions, as reported by Kim et al. [59].
The values of the chloro-alkaline indices CAI-1 and CAI-2 with negative values close to −1 indicate an ion exchange process between Mg2+ and Ca2+ ions in water with Na+ and K+ ions in rocks. For groundwater samples taken from the area upstream of the landfills (Valea Calugaresca) and the two rural areas away from the aquifer (Vadul Parului, Albesti Muru), the values of chlor-alkaline indices indicate that the predominant exchange processes ionic are influenced by high concentrations of NO3, confirmed by the positive correlation between NO3 and Ca2+ (r = 787). The values of the CAI-1 and CAI-2 indices for the areas located on the flow direction (Darvari and Radila) indicate a variation due to the mixed ion exchange and rock dissolution processes. The high positive correlations between SO42− and Na+ and TDS with NO3 indicated an important contribution of the anthropogenic ion contribution in groundwater. Poor drainage system by percolation of salt residues in the soil increased the concentration of Cl. A strong positive correlation between Na+ − Cl suggested that halite dissolution and human actions were the key source of Cl in the aquifer. In addition, high concentration of SO42− suggested the addition of SO42− by the breakdown of organic matter in the soil, fertilizers, and other human influences. The spatial distribution of NO3 showed a relatively large variation in the SE part of the investigated site, an intensively cultivated area. This area is further away from pyrite waste dumps. Vadul Parului and Albesti Muru villages are located partially hilly away from the direction of groundwater flow from the aquifer. The spatial distribution map of the NO3 ions indicated high concentrations, which exceed the maximum admissible value (50 mg/L) due to the intensive use of fertilization practices, as was reported in similar studies [69].
The study of the saturation indices indicated that the contribution of Ca2+ ions in the groundwater samples came from some processes of dissolving rocks such as aragonites and calcites. The contribution of Mg2+ ions was given by dolomite degradation. Negative halite values between −5.26 and −3.4 indicated that salt accumulation came from precipitation processes, the same situation as reported in other studies [35].
According to the Davis and De Wiest groundwater classification (Table 6), 10% of all groundwater samples are suitable for human consumption (between 300 and 600 mg/L), 74% are acceptable (between 600 and 900 mg/ L), and 16% are not recommended for domestic use (Abesti Muru and Vadul Parului villages). The high concentration of TDS in the groundwater sample is due to salt runoff from the soil and agricultural practices that can increase NO3 concentrations, which can infiltrate the groundwater. In the studied region, the main source of crop growth is groundwater, and its poor quality reduces crop growth. Assessing the adequacy of groundwater quality is essential for groundwater management measures. Excess of %Na in groundwater may be due to changes in soil structure due to different types of interaction processes, reducing permeability in soil with an effect on the exchange of air and water in soil. Decreasing soil structure can decrease aeration and soil permeability, affecting crop growth. The results of the %Na of the study area showed that 47% of the samples were classified as excellent, while 20% were classified as good and could be used for agricultural purposes. Furthermore, 30% of groundwater samples were classified as permissible, and only 3% were not suitable for agricultural crops (Table 6). Groundwater samples with high %Na values are located in the areas near the waste dumps, on the direction of water flow in the groundwater aquifer (Radila and Darvari villages). The sodium adsorption ratio (SAR) assesses the influence of Na+, Ca2+, and Mg2+ content. If SAR increases, it reduces soil permeability, which has adverse effects on crop growth [70]. In this study, the SAR ranged from 0.44 to 2.98, with a mean value of 1.99 (Table 2), and all analyzed groundwater samples were able to be used for irrigation purposes. Residual sodium carbonate (CSR), used also to assess the quality of groundwater for irrigation, indicated that 97% of groundwater samples were suitable for crops irrigation (below 1.25 meq/L). Only 3% of the analyzed samples could be used moderately for irrigation (between 1.25 and 2.50 meq/L), the samples being collected from the area with intensive agriculture, far from the aquifer flow direction.
High concentrations of SO42− in the fountains in the area near the abandoned waste dump may reflect mining pollution from various pyrite ash deposits. Pyrite oxidation is a natural process that can occur in many abandoned mining areas. The increase in SO42− concentrations confirms the existence of acid mineral drainage in the study area. The water from the leachate dumps infiltrates into an environment rich in calcium deposits, so in groundwater samples, the pH values are close to a neutral pH, which is between 6.9 and 7.4 (Table 2), as was reported in other similar studies (Province Jerada located in north-east of Morocco, Africa) [71].
In order to assess the quality of all environmental factors in the studied area (soil, vegetation), the correlations between the quality of the soil and the vegetation (crops and spontaneous flora) could bring other information, which will complete the present study.

5. Conclusions

The present study investigated groundwater quality in a rural region from Valea Calugareasca, Prahova County, Romania, adjacent to the area of pyrite ash waste dumps, in order to better understanding of the groundwater chemistry mechanisms. The results obtained indicate the following:
-
Natural ion sources were influenced by the dissolution processes of the minerals in the aquifer such as dolomite, which gives the contribution of Mg2+ in the composition of groundwater. The dominant type of water is HCO3-, which presented due to the geochemical processes of precipitation of carbonate minerals;
-
The evaporation processes characterized the geochemistry of the groundwater for entire studied area;
-
Ion exchange processes bring a high intake of Na+, which can increase the salt concentration in dryness period and precipitation of halite;
-
High concentrations of SO42− and NO3 indicate anthropogenic sources of ions;
-
The intake of SO42− came from, according to the ionic diagrams, presence of pyrite. The groundwater samples collected from Darvari and Radila villages showed high concentrations of SO42−, these being located closest to the pyrite waste dumps on the direction of water flow from the underground aquifer;
-
Groundwater from the investigated area could be used for agriculture practices. Only the groundwater samples collected from the hill the in Valea Calugareasca area, far away from the pyrite waste dumps and agricultural land, were suitable for human consumption. In terms of irrigation water, all groundwater samples could be used in agricultural activities except the samples from Darvari village.
However, the research has shown limited results on the hydrogeochemical characteristics of groundwater in the study area.
This study may provide new perspectives in assessing groundwater potential using an integrated geospatial and hydrological exploration approach, applied here to a groundwater aquifer in an area around pyrite ash deposits. Such research can provide direct information for the implementation of shallow drilling systems on the lands to meet current and future water supply needs. Moreover, the study is a valuable source of information and forms the basis for further research.

Author Contributions

Conceptualization, N.V. and G.G.V.; methodology, N.V.; validation, E.D. and C.M.; analysis, A.G.T., I.C.P. and N.V.; resources, F.P.; data curation, N.V., G.G.V. and E.D.; writing—original draft preparation, N.V.; writing—review and editing, N.V., G.G.V. and F.L.C.; visualization, E.D. and C.M.; supervision, E.D. and G.G.V.; project administration, F.L.C.; funding acquisition, F.L.C. All authors have read and agreed to the published version of the manuscript.

Funding

This research was funded by the Ministry of Research, Innovation, and Digitization of Romania, Grant no. 20N/2019, Project code PN 19 04 01 01.

Institutional Review Board Statement

Not applicable.

Informed Consent Statement

Not applicable.

Data Availability Statement

Not applicable.

Acknowledgments

The authors acknowledge the financial support offered by the Ministry of Research, Innovation, and Digitization of Romania through the Romanian National Research Program “Nucleu” through contract no. 20N/2019, Project code PN 19 04 01 01. The authors would like to thank Stefania Gheorghe for the idea of the study and her support in sampling procedures.

Conflicts of Interest

The authors declare no conflict of interest.

References

  1. Megdal, S.B. Invisible water: The importance of good groundwater. NPJ Clean Water 2018, 1, 15. [Google Scholar]
  2. Patel, P.; Janardhana, R.N.; Sundara Raja, B.C.; Suresh, U.; Gossel, W.; Wycisk, P. Geochemical processes and multivariate statistical analysis for the assessment of groundwater quality in the Swarnamukhi River basin, Andhra Pradesh, India. Environ. Earth Sci. 2016, 75, 611. [Google Scholar] [CrossRef]
  3. Hamzah, H.; Aris, A.Z.; Ramli, B.H.Z.; Juahir, H.; Narany, T.S. Groundwater quality assessment using integrated geochemical methods, multivariate statistical analysis, and geostatistical technique in shallow coastal aquifer of Terengganu, Malaysia. Arab. J. Geosci. 2017, 10, 49. [Google Scholar] [CrossRef]
  4. Stefanakis, A.I.; Zouzias, D.; Marsellos, A. Groundwater Pollution: Human and Natural Sources and Risks. In Environmental Science and Engineering, Water Pollution, 1st ed.; Govil, J.N., Ed.; Studium Press LLC Editors: New Delhi, India, 2015; Volume 4, pp. 88–102. [Google Scholar]
  5. Hansen, B.; Thorling, L.; Schullehner, J.; Termansen, M.; Dalgaard, T. Groundwater nitrate response to sustainable nitrogen management. Sci. Rep. 2017, 7, 8566. [Google Scholar] [CrossRef] [PubMed]
  6. He, S.; Wu, J. Relationships of groundwater quality and associated health risks with land use/land cover patterns: A case study in a loess area, Northwest China. Hum. Ecol. Risk Assess. 2019, 25, 354–373. [Google Scholar] [CrossRef]
  7. Karunanidhi, D.; Aravinthasamy, P.; Subramani, T.; Setia, R. Groundwater suitability estimation for sustainable drinking water supply and food production in a semi-urban area of south India: A special focus on risk evaluation for making healthy society. Sustain. Cities Soc. 2021, 73, 103077. [Google Scholar] [CrossRef]
  8. Serio, F.; Miglietta, P.P.; Lamastra, L.; Ficocelli, S.; Intini, F.; De Leo, F.; De Donno, A. Groundwater nitrate contamination and agricultural land use: A grey water footprint perspective in Southern Apulia Region (Italy). Sci. Total Environ. 2018, 645, 1425–1431. [Google Scholar] [CrossRef]
  9. Adimalla, N.; Wu, J. Groundwater quality and associated health risks in a semi-arid region of south India: Implication to sustainable groundwater management. Hum. Ecol. Risk Assess. 2019, 25, 191–216. [Google Scholar] [CrossRef]
  10. Li, J.; Shi, Z.; Liu, M.; Wang, M.; Liu, F.; Wang, Y. Identifying anthropogenic sources of groundwater contamination by natural background levels and stable isotope application in Pinggu basin, China. J. Hydrol. 2021, 596, 126092. [Google Scholar] [CrossRef]
  11. He, X.; Li, P.; Wu, J.; Ren, X.; Wang, D. Poor groundwater quality and high potential health risks in the Datong Basin, northern China: Research from published data. Environ. Geochem. Health 2021, 43, 791–812. [Google Scholar] [CrossRef]
  12. Subbarao, C.; Subbarao, N.V.; Chandu, D.N. Characterization of groundwater contamination using factor analysis. Environ. Geol. 1996, 28, 175–180. [Google Scholar] [CrossRef]
  13. Madhav, S.; Ahamad, A.; Raju, N.J. A study of hydrogeochemical processes using integrated geochemical and multivariate statistical methods and health risk assessment of groundwater in Trans-Varuna region, Uttar Pradesh. Environ. Dev. Sustain. 2021, 23, 7480–7508. [Google Scholar] [CrossRef]
  14. Rezaei, K.; Vadiati, M. A comparative study of artificial intelligence models for predicting monthly river suspended sediment load. J. Water Land Dev. 2020, 45, 107–118. [Google Scholar] [CrossRef]
  15. Baragano, D.; Boente, C.; Rodriguez-Valdes, E.; Fernandez-Brana, A.; Jiemez, A.; Gallego, J.R.; Gonzalez-Fernandez, B. Arsenic release from pyrite ash waste over an active hydrogeological system and its effects on water quality. Environ. Sci. Pollut. Res. 2019, 27, 10672–10684. [Google Scholar] [CrossRef] [PubMed]
  16. Serra, J.; Cameira, M.R.; Cordovil, C.M.; Hutchings, N. Development of a groundwater contamination index based on the agricultural hazard and aquifer vulnerability: Application to Portugal. Sci. Total Environ. 2021, 772, 145032. [Google Scholar] [CrossRef]
  17. Palcu, M.; Albu, M.; Witek, G. Theoretical Aspects Concerning Groundwater Reserves and Resources Assessment and Administration. Geo-Eco-Marina 2009, 15, 89–95. (In Romanian) [Google Scholar]
  18. The Inspectorate for Emergency Situations of Prahova County. Available online: http://www.isuprahova.ro/ (accessed on 1 May 2022). (In Romanian).
  19. Weather Romania. Available online: https://www.meteoromania.ro/clim/caracterizare-lunara/index.html (accessed on 30 May 2022). (In Romanian).
  20. EN ISO/IEC 17025:2018; General Requirements for the Competence of Testing and Calibration Laboratories. ISO: London, UK, 2018. Available online: https://www.iso.org/publication/PUB100424.html (accessed on 20 May 2022).
  21. Abed, M.F.; Zarraq, G.A.; Ahmed, S.H. Hydrogeochemical Assessment of Groundwater Quality and its Suitability for Irrigation and Domestic Purposes in Rural Areas, North of Baiji City Iraq. Iraqi J. Sci. 2021, 62, 2296–2306. [Google Scholar] [CrossRef]
  22. Liang, C.P.; Wang, C.H.; Wang, S.W.; Chang, T.W.; Chen, J.S. Application of Factor Analysis for Characterizing the Relationships between Groundwater Quality and Land Use in Taiwan’s Pingtung Plain. Sustainability 2020, 12, 608. [Google Scholar] [CrossRef]
  23. Zarei, K.; Bilondi, M.P. Factor analysis of chemical composition in the Karoon River basin, southwest of Iran. Appl. Water Sci. 2013, 3, 753–761. [Google Scholar] [CrossRef] [Green Version]
  24. Kazakis, N.; Mattas, C.; Pavlou, A.; Patrikaki, O.; Voudouris, K. Multivariate statistical analysis for the assessment of groundwater quality under different hydrogeological regimes. Environ. Earth Sci. 2017, 76, 349. [Google Scholar] [CrossRef]
  25. Li, N.; Huang, J.; Feng, Y. Construction and confirmatory factor analysis of the core cognitive ability index system of ship C2 system operators. PLoS ONE 2020, 15, e0237339. [Google Scholar] [CrossRef]
  26. Elumalai, V.; Elango, L. Groundwater quality assessment and application of multivariate statistical analysis in Luvuvhu catchment, Limpopo, South Africa. J. Afr. Earth Sci. 2020, 171, 103967. [Google Scholar] [CrossRef]
  27. Rodriguez-Escales, P.R.; Canelles, A.; Sanchez-Vila, X.; Folch, A.; Kurtzman, D.; Rossetto, R.; Fernandez-Escalante, E.; Lobo-Fereira, J.P.; Sapiano, M.; San-Sebastian, J.; et al. A risk assessment methodology to evaluate the risk failure of managed aquifer recharge in the Mediterranean Basin. Hydrol. Earth Syst. Sci. 2018, 22, 3213–3227. [Google Scholar] [CrossRef] [Green Version]
  28. Marghade, D.; Malpe, D.M.; Rao, N.S. Applications of geochemical and multivariate statistical approaches for the evaluation of groundwater quality and human health risks in a semi-arid region of eastern Maharashtra, India. Environ. Geochem. Health 2021, 43, 608–703. [Google Scholar] [CrossRef]
  29. Newman, B.D.; Havenor, K.C.; Longmire, P. Identification of hydrochemical facies in the Roswell Artesian Basin, New Mexico (USA), using graphical and statistical methods. Hydrogeol. J. 2016, 24, 819–839. [Google Scholar] [CrossRef]
  30. Kim, Y.Y. Analysis of hydrochemical processes controlling the urban groundwater system in Seoul area, Korea. Geosci. J. 2004, 8, 313–318. [Google Scholar] [CrossRef]
  31. Eskandari, E.; Mohammadzadeh, H.; Nassery, H.; Vadiati, M.; Zadeh, A.M.; Kisi, O. Delineation of isotopic and hydrochemical evolution of karstic aquifers with different cluster-based (HCA, KM, FCM and GKM) methods. J. Hydrol. 2022, 609, 127706. [Google Scholar] [CrossRef]
  32. Darwesh, N.; Meng, Q.; Allam, M.; Alaizari, H. Using Piper trilinear diagrams and principal component analysis to determine variation in hydrochemical faces and understand the evolution of groundwater in Sidi Slimane Region, Morocco. Egypt. J. Aquat. Biol. Fish. 2019, 23, 17–30. [Google Scholar] [CrossRef] [Green Version]
  33. Kumar, S.P.J. Interpretation of groundwater chemistry using piper and chadha´s diagrams: A comparative study from perambalur taluk. Elixir Geosci. 2013, 54, 12208–12211. [Google Scholar]
  34. Yingzhi, L.; Jiutan, L.; Zongju, G.; Min, W.; Leqi, Y. Major ion chemistry and water quality of groundwater in the Shigaze urban area, QinghaiTibetan Plateau, China. Water Supply 2020, 20, 335–347. [Google Scholar]
  35. Aghazedeh, N.; Chitsan, M.; Golesta, Y. Hydrochemistry and quality assessment of groundwater in the Ardabil area. Iran. Appl. Water Sci. 2016, 7, 3599–3616. [Google Scholar] [CrossRef] [Green Version]
  36. Karakus, C.B.; Yildiz, S. Evaluation for irrigation water purposes of groundwater qualityin the vicinity of sivas City Centre (Turkey) by using gis and an irrigation water quality index. Irrig. Drain. 2019, 69, 121–137. [Google Scholar] [CrossRef]
  37. Gibbs, R.J. Mechanisms Controlling World Water Chemistry. Science 1970, 170, 1088–1090. [Google Scholar] [CrossRef] [PubMed]
  38. Hussein, A.S.; Mohamed, R.E.; Mohamed, A.; Gamal, Y.B. Effect of the Nile Aquifer lithological characteristics in Assiut Governorate, Egypt. Ecol. Eng. 2020, 20, 73–83. [Google Scholar]
  39. Ogbozige, F.J.; Toko, M.A. Piper Trilinear and Gibbs Description of Groundwater Chemistry in Port Harcourt, Nigeria. Appl. Sci. Eng. Prog. 2020, 13, 362–369. [Google Scholar] [CrossRef]
  40. Shelton, J.L.; Engle, M.A.; Buccianti, A.; Blondes, M.S. The isometric log-ratio (ilr)-ion plot: A proposed alternative to the Piper diagram. J. Geochem. Explor. 2018, 190, 130–141. [Google Scholar] [CrossRef]
  41. Marandi, A.; Shand, P. Groundwater chemistrynd the Gibbs Diagram. J. Appl. Geochem. 2018, 97, 209–212. [Google Scholar] [CrossRef]
  42. Gabr, M.E.; Soussa, H.; Fattouh, E. Groundwater quality evaluation for drinking and irrigation uses in Dayrout city Upper Egypt. Ain Shams Eng. J. 2021, 12, 327–340. [Google Scholar] [CrossRef]
  43. Zakaria, N.; Anornu, G.; Adomako, D.; Owusu-Nimo, F.; Gibrilla, A. Evolution of groundwater hydrogeochemistry and assessment of groundwater quality in the Anayari catchment. Groundw. Sustain. Dev. 2021, 12, 100489. [Google Scholar] [CrossRef]
  44. Schoeller, H. Geochemistry of Groundwater. In Groundwater Studies—An International Guide for Research and Practice; UNESCO: Paris, France, 1977. [Google Scholar]
  45. Soro, T.; Soro, G.; Ahoussi, K.; Oga, Y.; Soro, N. Hydrogeochemical and Groundwater Quality Studies in the High Bandama Watershed at Tortiya (Northern of Côte d’Ivoire). J. Geosci. Environ. Prot. 2019, 7, 49–61. [Google Scholar]
  46. Sunkari, E.D.; Abu, M.; Zango, M.S.; Wani, A.M.L. Hydrogeochemical characterization and assessment of groundwater quality in the Kwahu-Bombouaka Group of the Voltaian Supergroup, Ghana. J. Afr. Earth Sci. 2020, 169, 103899. [Google Scholar] [CrossRef]
  47. Zhang, D.; Han, D.; Song, X. Impacts of the Sanmenxia Dam on the Interaction between Surface Water and Groundwater in the Lower Weihe River of Yellow River Watershed. Water 2020, 12, 1671. [Google Scholar] [CrossRef]
  48. Ahamad, A.Y.; Saleh, I.A.; Balakrishnan, P.; Al-Ghouti, M. Comparison GIS-Based interpolation methods for mapping groundwater quality in the state of Qatar. Groundw. Sustain. Dev. 2021, 13, 100573. [Google Scholar] [CrossRef]
  49. Zhu, Q.; Abdelkareem, M. Mapping Groundwater Potential Zones Using a Knowledge-Driven Approach and GIS Analysis. Water 2021, 13, 579. [Google Scholar] [CrossRef]
  50. Arabameri, A.; Pal, S.C.; Rezaie, F.; Nalivan, O.A.; Chowdhuri, I.; Saha, A.; Lee, S.; Moayedi, H. Modeling groundwater potential using novel GIS-based machine-learning ensemble techniques. J. Hydrol. 2021, 36, 100848. [Google Scholar] [CrossRef]
  51. Aycut, T. Determination of groundwater potential zones using Geographical Information Systems (GIS) and Analytic Hierarchy Process (AHP) between Edirne-Kalkansogut (northwestern Turkey). Groundw. Sustain. Dev. 2021, 12, 100545. [Google Scholar] [CrossRef]
  52. Arkoc, O. Modeling of spatiotemporal variations of groundwater levels using diferent interpolation methods with the aid of GIS, case study from Ergene Basin, Turkey. Earth Syst. Environ. 2022, 8, 967–976. [Google Scholar] [CrossRef]
  53. Khouni, I.; Louhichi, G.; Ghrabi, A. Use of GIS based Inverse Distance Weighted interpolation to assess surface water quality: Case of Wadi El Bey, Tunisia. Environ. Technol. Innov. 2021, 24, 101892. [Google Scholar] [CrossRef]
  54. Listyani, T.; Prabowo, I.A. Groundwater in Bener area, its quality and contribution for agriculture. IOP Conf. Ser. Earth Environ. Sci. 2022, 985, 012028. [Google Scholar] [CrossRef]
  55. Sahoo, H.K.; Nayak, K.M. Hydrogeochemical Evaluation of Mahanga Block, Cuttack District, Odisha, India. Int. J. Geomat. Geosci. 2014, 2, 16–21. [Google Scholar]
  56. Kumar, P.S.; James, E.J. Identification of hydrogeochemical processes in the Coimbatore district, Tamil Nadu, India. Hydrol. Sci. J. 2016, 61, 719–731. [Google Scholar] [CrossRef]
  57. Singh, K.K.; Tewari, G.; Kumar, S. Evaluation of Groundwater Quality for Suitability of Irrigation Purposes: A Case Study in the Udham Singh Nagar, Uttarakhand. J. Chem. 2020, 2020, 6924026. [Google Scholar] [CrossRef]
  58. Council Directive 98/83/EC on the Quality of Water Intended for Human Consumption. Available online: https://eur-lex.europa.eu/legal-content/EN/TXT/PDF/?uri=CELEX:01998L0083-20151027&from=EN (accessed on 30 May 2022). (In Romanian).
  59. Jampani, M.; Liedl, R.; Hulsman, S.; Sonkamble, S.; Amerasinghe, P. Hydrogeochemical and mixing processes controlling groundwater chemistry in a wastewater irrigated agricultural system of India. Chemosphere 2020, 239, 124741. [Google Scholar] [CrossRef] [PubMed]
  60. WHO. World Health Statistics 2017: Monitoring Health for the SDGs, Sustainable Development Goals; WHO: Geneva, Switzerland, 2017. [Google Scholar]
  61. Idehen, O. A Comparative Investigation of Groundwater Contamination in Typical Dumpsites and Cemetery Using Ert and Physicochemical Analysis of Water in Benin Metropolis, Nigeria. J. Geosci. Environ. Prot. 2020, 8, 72–85. [Google Scholar] [CrossRef] [Green Version]
  62. Siddiqi, S.A.; Al-Mamun, A.; Baawain, M.S.; Sana, A. Groundwater contamination in the Gulf Cooperation Council (GCC) countries: A review. Environ. Sci. Pollut. Res. 2021, 28, 21023–21044. [Google Scholar] [CrossRef] [PubMed]
  63. Mahmoudi, N.; Nakhael, M.; Pohemmat, J. Assessment of hydrogeochemistry and contamination of Varamin deep aquifer, Tehran Province, Iran. Environ. Earth Sci. 2017, 76, 370. [Google Scholar] [CrossRef]
  64. Wang, Y.; Jiao, J.J. Origin of groundwater salinity and hydrogeochemical processes in the confined quaternary aquifer of the Pearl River Delta, China. J. Hydrol. 2018, 438, 112–124. [Google Scholar] [CrossRef]
  65. Sarath Prasanth, S.V.; Magesh, N.S.; Jitheshlal, K.V.; Chandrasekar, N.; Gangadhar, K. Evaluation of groundwater quality and its suitability for drinking and agricultural use in the coastal stretch of Alappuzha District, Kerala, India. Appl. Water Sci. 2012, 2, 165–175. [Google Scholar] [CrossRef] [Green Version]
  66. Samtio, M.S.; Rajper, K.H.; Mastoi, A.S.; Sadaf, R.; Rajper, H.R.; Hakro, A.A.; Asghar, A.; Agheem, H.; Lanjwani, M.F. Hydrochemical assessment of groundwater from taluka Dahili, Thar Desert, Pakistan, for irrigation purpose using water quality indices. Int. J. Environ. Anal. Chem. 2021, 1–17. [Google Scholar] [CrossRef]
  67. Porowski, A.; Porowska, D.; Halas, S. Identification of Sulfate Sources and Biogeochemical Processes in an Aquifer Affected by Peatland: Insights from Monitoring the Isotopic Composition of Groundwater Sulfate in Kampinos National Park, Poland. Water 2019, 11, 1388. [Google Scholar] [CrossRef] [Green Version]
  68. Yang, Y.S.; Li, P.; Zhang, X.; Li, M.; Lu, Y.; Xu, B.; Yu, T. Lab-based investigation of enhanced BTEX attenuation driven by groundwater table fluctuation. Chemosphere 2017, 169, 678–684. [Google Scholar] [CrossRef]
  69. Nagaraju, A.; Muralidhar, P.; Sreedhar, Y. Hydrogeochemistry and Groundwater Quality Assessment of Rapur Area, Andhra Pradesh, South India. J. Geosci. Environ. Prot. 2016, 4, 88–99. [Google Scholar] [CrossRef]
  70. Mukonazothe, M.; Munay, L.F.; Mutoti, M.I. Groundwater quality evaluation for domestic and irrigation purposes for the Nwanedi Agricultural Community, Limpopo Province, South Africa. Heliyon 2022, 4, 4. [Google Scholar] [CrossRef] [PubMed]
  71. Battioui, M.; Benzazoua, M.; Hakkou, R.; Bouzahzah, H.; Jilali, A.; Sbaa, M. Impact of Mining Wastes on Groundwater Quality in the Province Jerada (Eastern Morocco). Int. J. Eng. Sci. Technol. 2013, 5, 1601–1615. [Google Scholar]
Figure 1. Study area (location map and distribution of sampling points around the sulfury pyrite waste dump). Source: Google Earth Pro.
Water 14 02022 g001
Figure 2. Relative ionic composition groundwater.
Water 14 02022 g002
Figure 3. Mechanism controlling groundwater chemistry (a) TDS versus (Na+ + K+)/(Na+ + K+ + Ca2+); (b) TDS versus Cl/Cl + HCO3.
Water 14 02022 g003
Figure 4. Relationship between major ionic concentrations: (a) HCO3+SO42− versus HCO3; (b) Cl versus Na+; (c) Ca2+ versus SO42−; (d) Mg2++Ca2+ versus HCO3; (e) (Ca2++Mg2+) − (HCO3−SO42−) versus (Na++K+)−Cl; and (f) total cation versus HCO3.
Water 14 02022 g004
Figure 5. Chloro-alkaline indices plot.
Water 14 02022 g005
Figure 6. Spatial distribution of NO3 in study area (ArcMap 10.5 Software).
Water 14 02022 g006
Table 1. Detection and quantification limits, recovery and uncertainty percentages for the applied methods regarding metals.
ElementLOD, µg/LLOQ, µg/LRecovery (%)Uncertainty
(%)
ElementLOD, µg/LLOQ, µg/LRecovery (%)Uncertainty (%)
Al2.007.0099.512Mg1.505.001038.0
As0.150.4597.724Mn *0.100.3598.210
Ca10.035.099.612Na7.0023.010213
Cd *0.120.4010223Ni *0.301.0010113
Cr *0.080.2510113Pb *0.250.7598.515
Cu0.301.0010116Se0.401.4010425
Hg5.00 **10.0 **94.410Sb0.351.2097.026
Fe1.505.0099.617Zn0.602.1010313
K6.5021.099.611
* ICP-EOS with ultrasonic nebulizer 6000 AT+. ** ng/L.
Table 2. Descriptive statistic for groundwater parameters.
VariableUnitMinimumMeanMaximumSD
Na+mg/L24.894.317354.6
K+mg/L0.181.984.331.52
Ca2+mg/L85.013618523.5
Mg2+mg/L13.836.180.225.7
SO42−mg/L52.616724865.9
Clmg/L18.610524169.1
NO3mg/L5.8446.922056.9
Fmg/L0.090.260.400.11
HCO3mg/L214416628141
Femg/L0.0010.0160.0890.001
Asµg/L1.003.107.301.89
Cuµg/L0.902.10113.01
Znµg/L2.0016.6367101
Alµg/L2.507.1534.210.4
NH4+mg/L0.0100.0150.0220.004
pHpH unit6.907.157.400.18
ECµS/cm75810151308128
TDSmg/L56273294291
CBE%−3.89−0.333.475.20
RSCmeq/L0.941.532.120.83
SARmeq/L0.441.992.981.80
%Nameq/L8.2929.652.431.2
SD, standard deviation of the results.
Table 3. Correlation matrix for the groundwater samples. (Values in bold have p-value < 0.0001).
VariablesNa+K+Ca2+Mg2+SO42−ClNO3FHCO3pHECTDSFeNH4+
Na+1
K+0.9111
Ca2+0.1160.1401
Mg2+0.5750.5670.2471
SO42−0.8020.7880.1900.8771
Cl0.9350.9140.0690.5210.7611
NO30.2630.2500.7870.3990.3410.2001
F0.5030.4650.1020.4130.4760.4620.1851
HCO30.8930.8660.1690.6410.8240.8050.2660.4791
pH0.4210.4620.2070.3110.3950.3870.2720.0230.5311
EC0.0010.0020.8030.0860.0230.0080.6020.0110.0290.1011
TDS0.0020.0040.8050.0780.0230.0050.6240.0120.0310.1110.9911
Fe0.0620.0590.3300.2660.1940.0430.4510.0730.0870.0730.3020.3001
NH4+0.0140.0000.0000.0030.0000.0020.0030.0800.0370.0000.0180.0160.0001
Table 4. Saturation indices calculated for different types of rocks.
SamplesAnhydriteAragoniteCalciteDolomiteFluoriteGypsumHalite
(CaSO4)(CaCO3)(CaCO3)(CaMg(CO3)2)(CaF2)(CaSO4·2H2O)(NaCl)
1−0.162.172.314.720.680.05−4.59
2−0.142.322.464.980.730.07−4.52
3−0.282.232.374.870.66−0.07−4.62
40.372.422.564.390.640.58−3.40
50.432.482.634.450.710.63−3.42
60.372.462.604.450.670.58−3.45
70.452.402.554.280.760.66−3.48
80.402.342.484.240.710.61−3.50
90.452.472.614.420.730.66−3.52
100.402.382.524.260.680.61−3.76
110.372.432.574.410.700.58−3.76
12−0.551.271.423.03−0.88−0.34−3.90
130.382.392.534.300.020.59−3.76
140.392.332.484.150.040.60−3.81
150.392.392.534.280.040.60−3.73
160.452.112.253.67−0.100.66−3.62
170.432.172.323.79−0.080.63−3.68
180.382.112.253.65−0.130.59−3.78
190.292.512.654.921.150.50−4.38
200.332.532.674.921.170.53−4.46
210.232.512.664.941.150.43−4.49
220.182.682.825.251.180.38−4.54
230.202.692.835.301.160.41−4.44
240.112.332.474.621.100.32−5.12
250.162.312.454.501.080.37−5.18
260.272.432.574.761.090.48−5.26
270.232.462.604.801.110.44−5.20
280.162.512.654.801.160.37−4.97
290.122.452.604.801.110.33−5.12
300.162.502.554.801.120.35−4.97
Minimum−0.551.271.423.03−0.88−0.34−5.26
Maximum0.452.692.835.301.180.66−3.40
Table 5. Component matrix for different parameters.
ParameterF1F2F3
Na+, mg/L0.5610.1850.025
K+, mg/L0.9320.0110.002
Ca2+, mg/L0.0660.8180.001
Mg2+, mg/L0.6130.1460.013
SO42−, mg/L0.5380.0370.218
Cl, mg/L0.9360.0020.007
NO3, mg/L0.1730.7090.002
F, mg/L0.4060.0180.477
HCO3, mg/L0.8680.0380.024
Fe, mg/L0.0540.3720.002
NH4+, mg/L0.0040.0030.203
pH, pH unit0.4440.2490.112
EC, µS/cm0.0040.9170.003
TDS, mg/L0.0320.9150.002
Eigenvalue5.594.371.09
Variability (%)49.5138.659.66
Cumulative %49.5188.1697.82
Table 6. Groundwater classification for human consumption and agriculture use.
Quality ParameterClassificationRange% Samples
TDS, mg/LExcellent<300-
Good300–60010
Fair600–90074
Poor900–120016
Unacceptable>1200-
%NaExcellent0–2047
Good20–4020
Permissible40–6030
Doubtful60–803
Unsuitable>80-
SAR, meq/LExcellent0–10100
Good10–18-
Fair18–26-
Poor>26-
RSC, meq/LGood<1.2597
Medium1.25–2.53
Bad>2.5-
Publisher’s Note: MDPI stays neutral with regard to jurisdictional claims in published maps and institutional affiliations.

