
Climate Drivers Contribute in Vegetation Greening Stalls of Arid Xinjiang, China: An Atmospheric Water Drying Effect

1
Key Laboratory of Oasis Ecology of Ministry of Education, Institute of Arid Ecology and Environment, College of Geography and Remote Sensing Sciences, Xinjiang University, Urumqi 830046, China
2
Institute of Desert Meteorology, China Meteorological Administration, Urumqi 830002, China
3
College of Tourism, Xinjiang University of Finance and Economics, Urumqi 830012, China
*
Author to whom correspondence should be addressed.
Water 2022, 14(13), 2019; https://doi.org/10.3390/w14132019
Submission received: 18 May 2022
/
Revised: 20 June 2022
/
Accepted: 21 June 2022
/
Published: 24 June 2022
(This article belongs to the Special Issue Variations of Precipitation Extremes in Arid Regions)
Abstract
:Xinjiang, an arid region of China, has experienced a substantial warming–wetting trend over the past five decades. However, climate change has affected vegetation growth/greening in arid Central Asia in unexpected ways due to complex ecological effects. We found a significant greening trend (consistent increase in the normalized difference vegetation index or NDVI) from 1982 to 1996, during the growing season; however, the NDVI consequently decreased and plateaued from 1997 to 2015, especially in naturally vegetated regions. Atmospheric vapor pressure deficit (VPD) is a critical driver of vegetation growth, is a direct measure of atmospheric aridity, and has increased sharply in recent decades. A partial correlation analysis indicated a significant relationship between growing season NDVI and VPD from 1997 to 2015. This implies that decreased VPD corresponds to increasing NDVI, and increasing VPD corresponds to a decrease and plateauing in the NDVI trend. Using the partial derivative equation method, our results suggest that the trend in growing season NDVI was affected primarily by increasing VPD (contributing 87.57%) from 1997 to 2015, especially in the grassland and desert biomes. Rising temperatures lead to a greater VPD, resulting in exacerbated evaporative water loss. Soil drought and atmospheric aridity limit plant stomatal conductance and could effectively lead to a decrease in the greening trend and increased vegetation mortality in arid Xinjiang. Our results emphasize the importance of VPD as a limiting factor of greening trends in arid regions. The influence of VPD on vegetation growth should be considered when evaluating arid ecosystem functioning under global warming.
1. Introduction
Complex interactions between climate systems and terrestrial ecosystems can be described through the assessment of vegetation growth dynamics [1]. Vegetation dynamics are highly influenced by climate change [2,3,4] and affect the climate system in turn through biophysical processes and feedback systems [5,6,7]. Monitoring, defining, and analyzing changes in vegetation growth in response to global change has been a popular topic of research in the earth sciences.
The normalized difference vegetation index (NDVI) is widely used as a proxy in the analysis of vegetation growth dynamics and assessment of ecological responses to climate change [1,8,9,10,11]. Long-term monitoring of global NDVI has indicated significant greening since 1982 [12]. Indeed, several studies have confirmed global and regional greening based on vegetation inventories, satellite imaging techniques, and ecosystem models [8,9,13,14]. However, after the late 1990s, the NDVI trend showed halted greening and subsequent vegetation browning [12,15]. Yuan et al. [12] found a pronounced greening trend for approximately 84% of the global vegetated area from 1982 to 1998 that was followed by significant browning of approximately 59% of the vegetated area. Similarly, Pan et al. [16] found that global vegetation browning trends were largely accelerated after the late 1990s. Greening-to-browning reversals were experienced in all continents, especially in the mid and low latitudes of the Northern Hemisphere. In addition, the duration of the growing season in the Northern Hemisphere has reduced during recent decades [17,18].
Global drylands have experienced a significant vegetation greening trend since the 1980s, and this enhanced growth has remained strong into the twenty-first century [19,20,21,22]. However, some regional hotspots of vegetation greening trend were subsequently stalled or reversed, such as in arid Central Asia and the arid region of northwest China [1,23,24,25]. The NDVI of natural vegetation showed a greening trend from 1982 to 1998, and a subsequent browning trend after 1999 as the NDVI decreased in arid Central Asia [1]. The shrub encroachment in Central Asia showed a significant increase during 2000–2013 compared with the 1980s–1990s, and approximately 8% of grasslands have transformed through shrub encroachment during 2000–2013 [1]. Similarly, in arid China (including Xinjiang), vegetation cover and NDVI trends have decreased since 2000 [23,24,25].
Changes in vegetation greenness are related to regional climate change, atmospheric CO2 concentration, nitrogen deposition, and land-use change [15]. Kaufmann et al. [26] suggested that global warming was the main contributor to vegetation greening in the Northern Hemisphere; however, Ahlbeck [27] proposed the fertilization effect of rising atmospheric CO2 concentrations as the dominant factor. In China, Piao et al. [15] also attributed vegetation greening to rising CO2 concentrations. With regard to vegetation browning after the late 1990s, Yuan et al. [12] suggested that the increased atmospheric vapor pressure deficit (VPD) drives this global trend and also inhibits vegetation growth. In addition, drought is a major contributing driver of vegetation browning [28,29,30]. In arid Central Asia, Li et al. [1] suggested that the combined effect of significant increases in temperature and decreases in precipitation caused the observed decline in NDVI from 1998 to 2013. Yao et al. [25] suggested that an increase in climatic extremes may conjointly drive the NDVI decrease in Xinjiang. Chen et al. [24] highlighted the possible adverse ecological effects of increased temperature and evaporation.
Statistical analysis and quantification of the individual climatic factors contributing to variation in NDVI remains challenging. For example, multiple linear regression, residual trend, and ridge regression analyses have been used to quantify the individual contributions of drivers to vegetation change [31,32,33,34,35]. Chen et al. [32] investigated the contributions of climate change and human activities to the trend in gross primary production in North China during 2000–2014, using the multiple linear regression. Xie et al. [34] used ridge regression to quantify the contributions of climate drivers to vegetation growth change over the Three-North Region of China. These regression analyses suffer from two potential limitations. Firstly, statistical analysis generally assumes that effects of climatic factors on vegetation change are linear and independent of each other; meanwhile, multi-collinearity between independent variables, leads to unstable estimation [34]. However, it shows a nonlinear ecosystem response to the climatic changes. Secondly, statistical analysis of historical data shows that the dominant driving factors of the long-term trend of vegetation change may be different from those of inter-annual variability [15]. Yet, these limitations can be overcome through the application of partial derivatives equation methods, which are regarded as an effective technique to quantify individual contributions of climatic driving factors more reliably [36]. For example, Naeem et al. [36] applied partial derivative equation to calculate the dominant climatic factors of vegetation greening in the Loess Plateau.
Despite the dynamics of vegetation change in the Xinjiang of China reported by some studies [1,23,24,25], the associated drivers of vegetation change remain poorly understood. Change in VPD is an important variable in determining vegetation growth [12]. However, the constraints of VPD changes on vegetation growth have not yet been quantified. The primary objective of this study is to investigate the vegetation change trend in Xinjiang, China during the period 1982–2015, and to quantify the individual contributions of climatic driving factors to NDVI changes. The degree of vegetation change is inferred from the mean NDVI during the growing season (defined as April to October). First, we investigate the change in NDVI to describe the vegetation greening trend during 1982–2015. Secondly, we calculate the individual contributions of climatic factors (VPD, precipitation, wind speed, and radiation) to NDVI changes using a partial derivative approach. Finally, we discuss the potential mechanisms underlying the impact of VPD on changes in vegetation growth.
2. Materials and Methods
2.1. Study Area
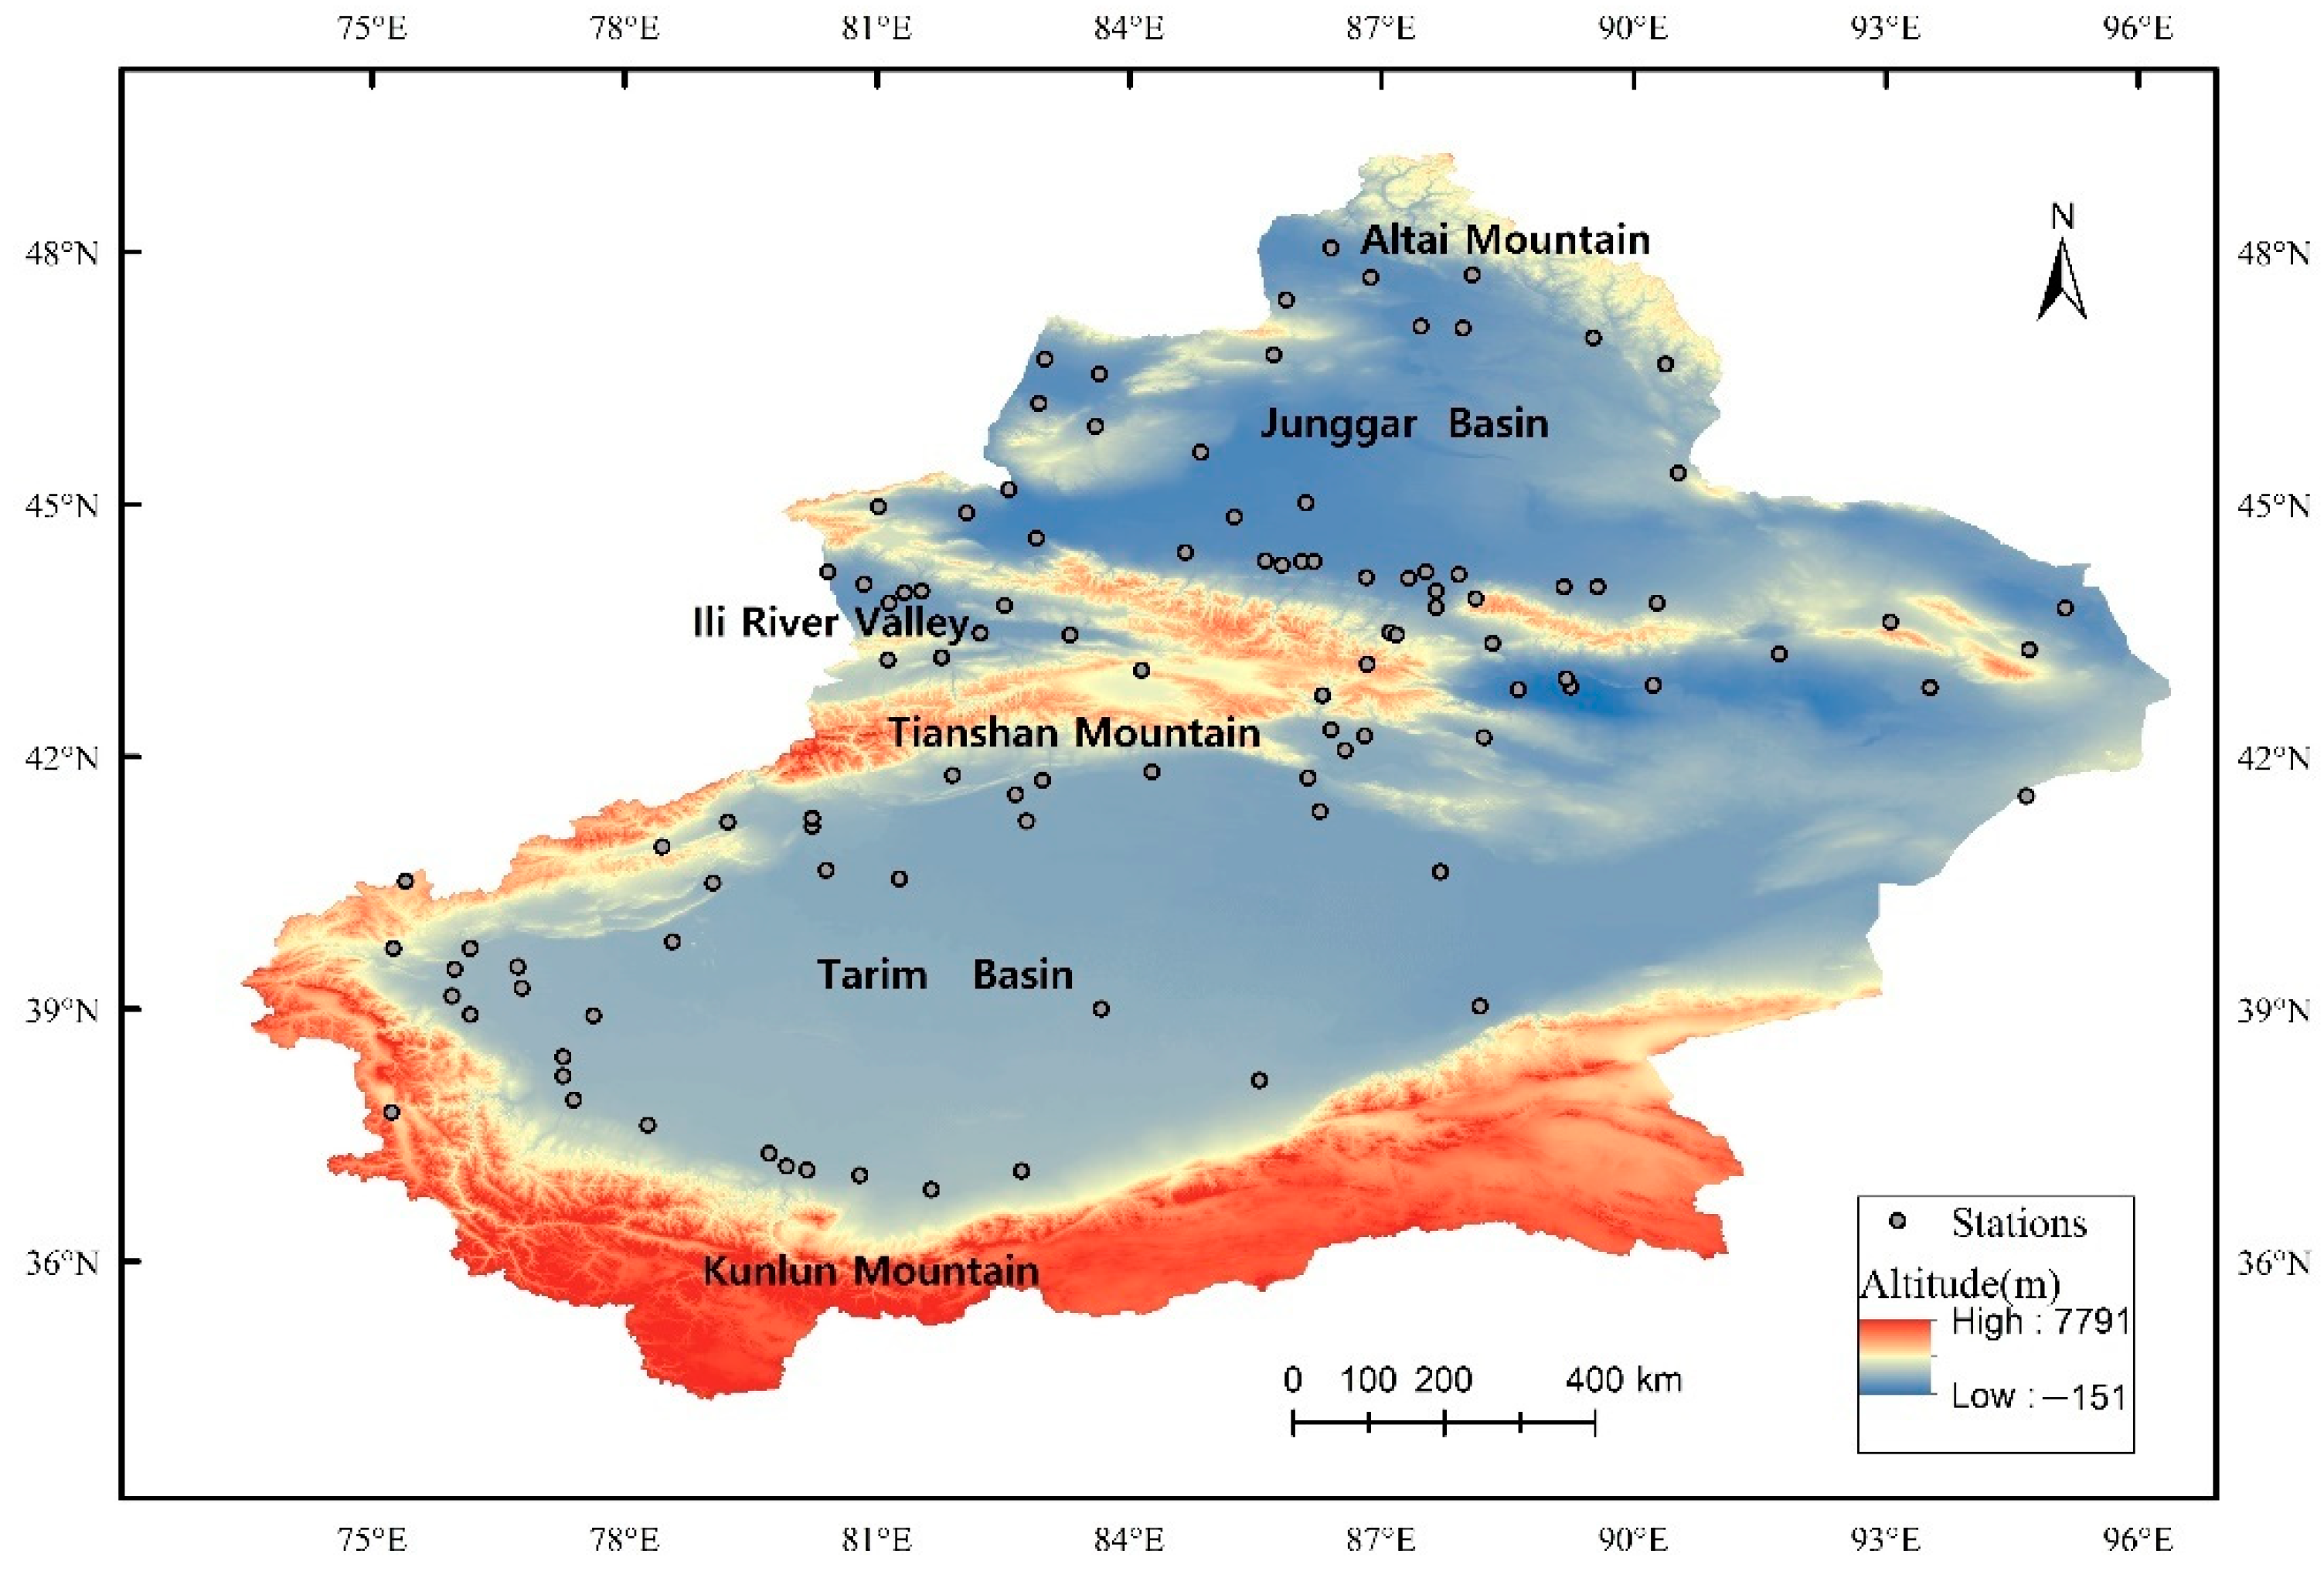
Xinjiang, our study locality, is one of the driest areas globally and is the largest province of China, covering 1,660,000 km2. Xinjiang’s climate is continental, with an average annual air temperature of 7.6 °C and mean annual total precipitation and annual total evapotranspiration of 158 mm and 1054.2 mm, respectively [25,37]. The predominant biomes of Xinjiang are desert and grassland, with scattered glaciers, snow cover, and oases. Grasslands cover ~34% of Xinjiang, mainly occurring in the Tianshan Mountains, Altai Mountains, and the Kunlun Mountains. Desert accounts for over 25% of the total surface area, with the Taklimakan Desert (China’s largest desert and the second-largest mobile desert in the world) in the southern part of the region and a portion of the Gobi Desert in the northern part of the region [38]. The artificially vegetated areas cover ~5% of Xinjiang, mainly distributed on the northern and southern slopes of the Tianshan Mountains, in the Tarim River basin and on the northern slopes of the Kunlun Mountains.
2.2. Data
2.2.1. Satellite-Derived NDVI Data
NDVI is a widely used proxy for primary productivity and vegetation growth in ecological studies [39]. We used NASA’s Global Inventory Modeling and Mapping Studies (GIMMS) NDVI third-generation dataset NDVI3g to investigate the response of vegetation growth to specific climate variables from 1982 to 2015 [8,10]. The GIMMS NDVI3g data, obtained from the Advanced Very High-Resolution Radiometer (AVHRR), has a spatial resolution of ~8 km and a temporal resolution of 15 days [12]. The quality of the NDVI3g dataset has been assessed and the results indicate suitability of the data for research use [15]. We also calculated the mean annual NDVI respectively for the growing season (GS, from April to October) and summer season (JJA, from June to August) by averaging the monthly NDVI values.
2.2.2. Meteorological Data
Monthly meteorological data (air temperature, precipitation, wind speed, and sunshine duration) were obtained from the National Meteorological Information Center (NMIC) of the China Meteorological Administration (CMA) (http://data.cma.cn/, accessed on 1 May 2020). The dataset, for the period 1982–2015, includes 105 meteorological observatories in Xinjiang, of which the data from 89 observatories were retained after excluding stations with missing data (Figure 1). These meteorological datasets were strictly quality-controlled and tested for homogeneity with high accuracy.
Homogenized monthly relative humidity (RH) data was obtained from the ChinaRHv1.0 database (Science Data Bank, http://www.sciencedb.cn/dataSet/handle/804, accessed on 12 June 2021), which provided an adjusted RH series for China from 1960 to 2017 [40].
2.3. Methodology
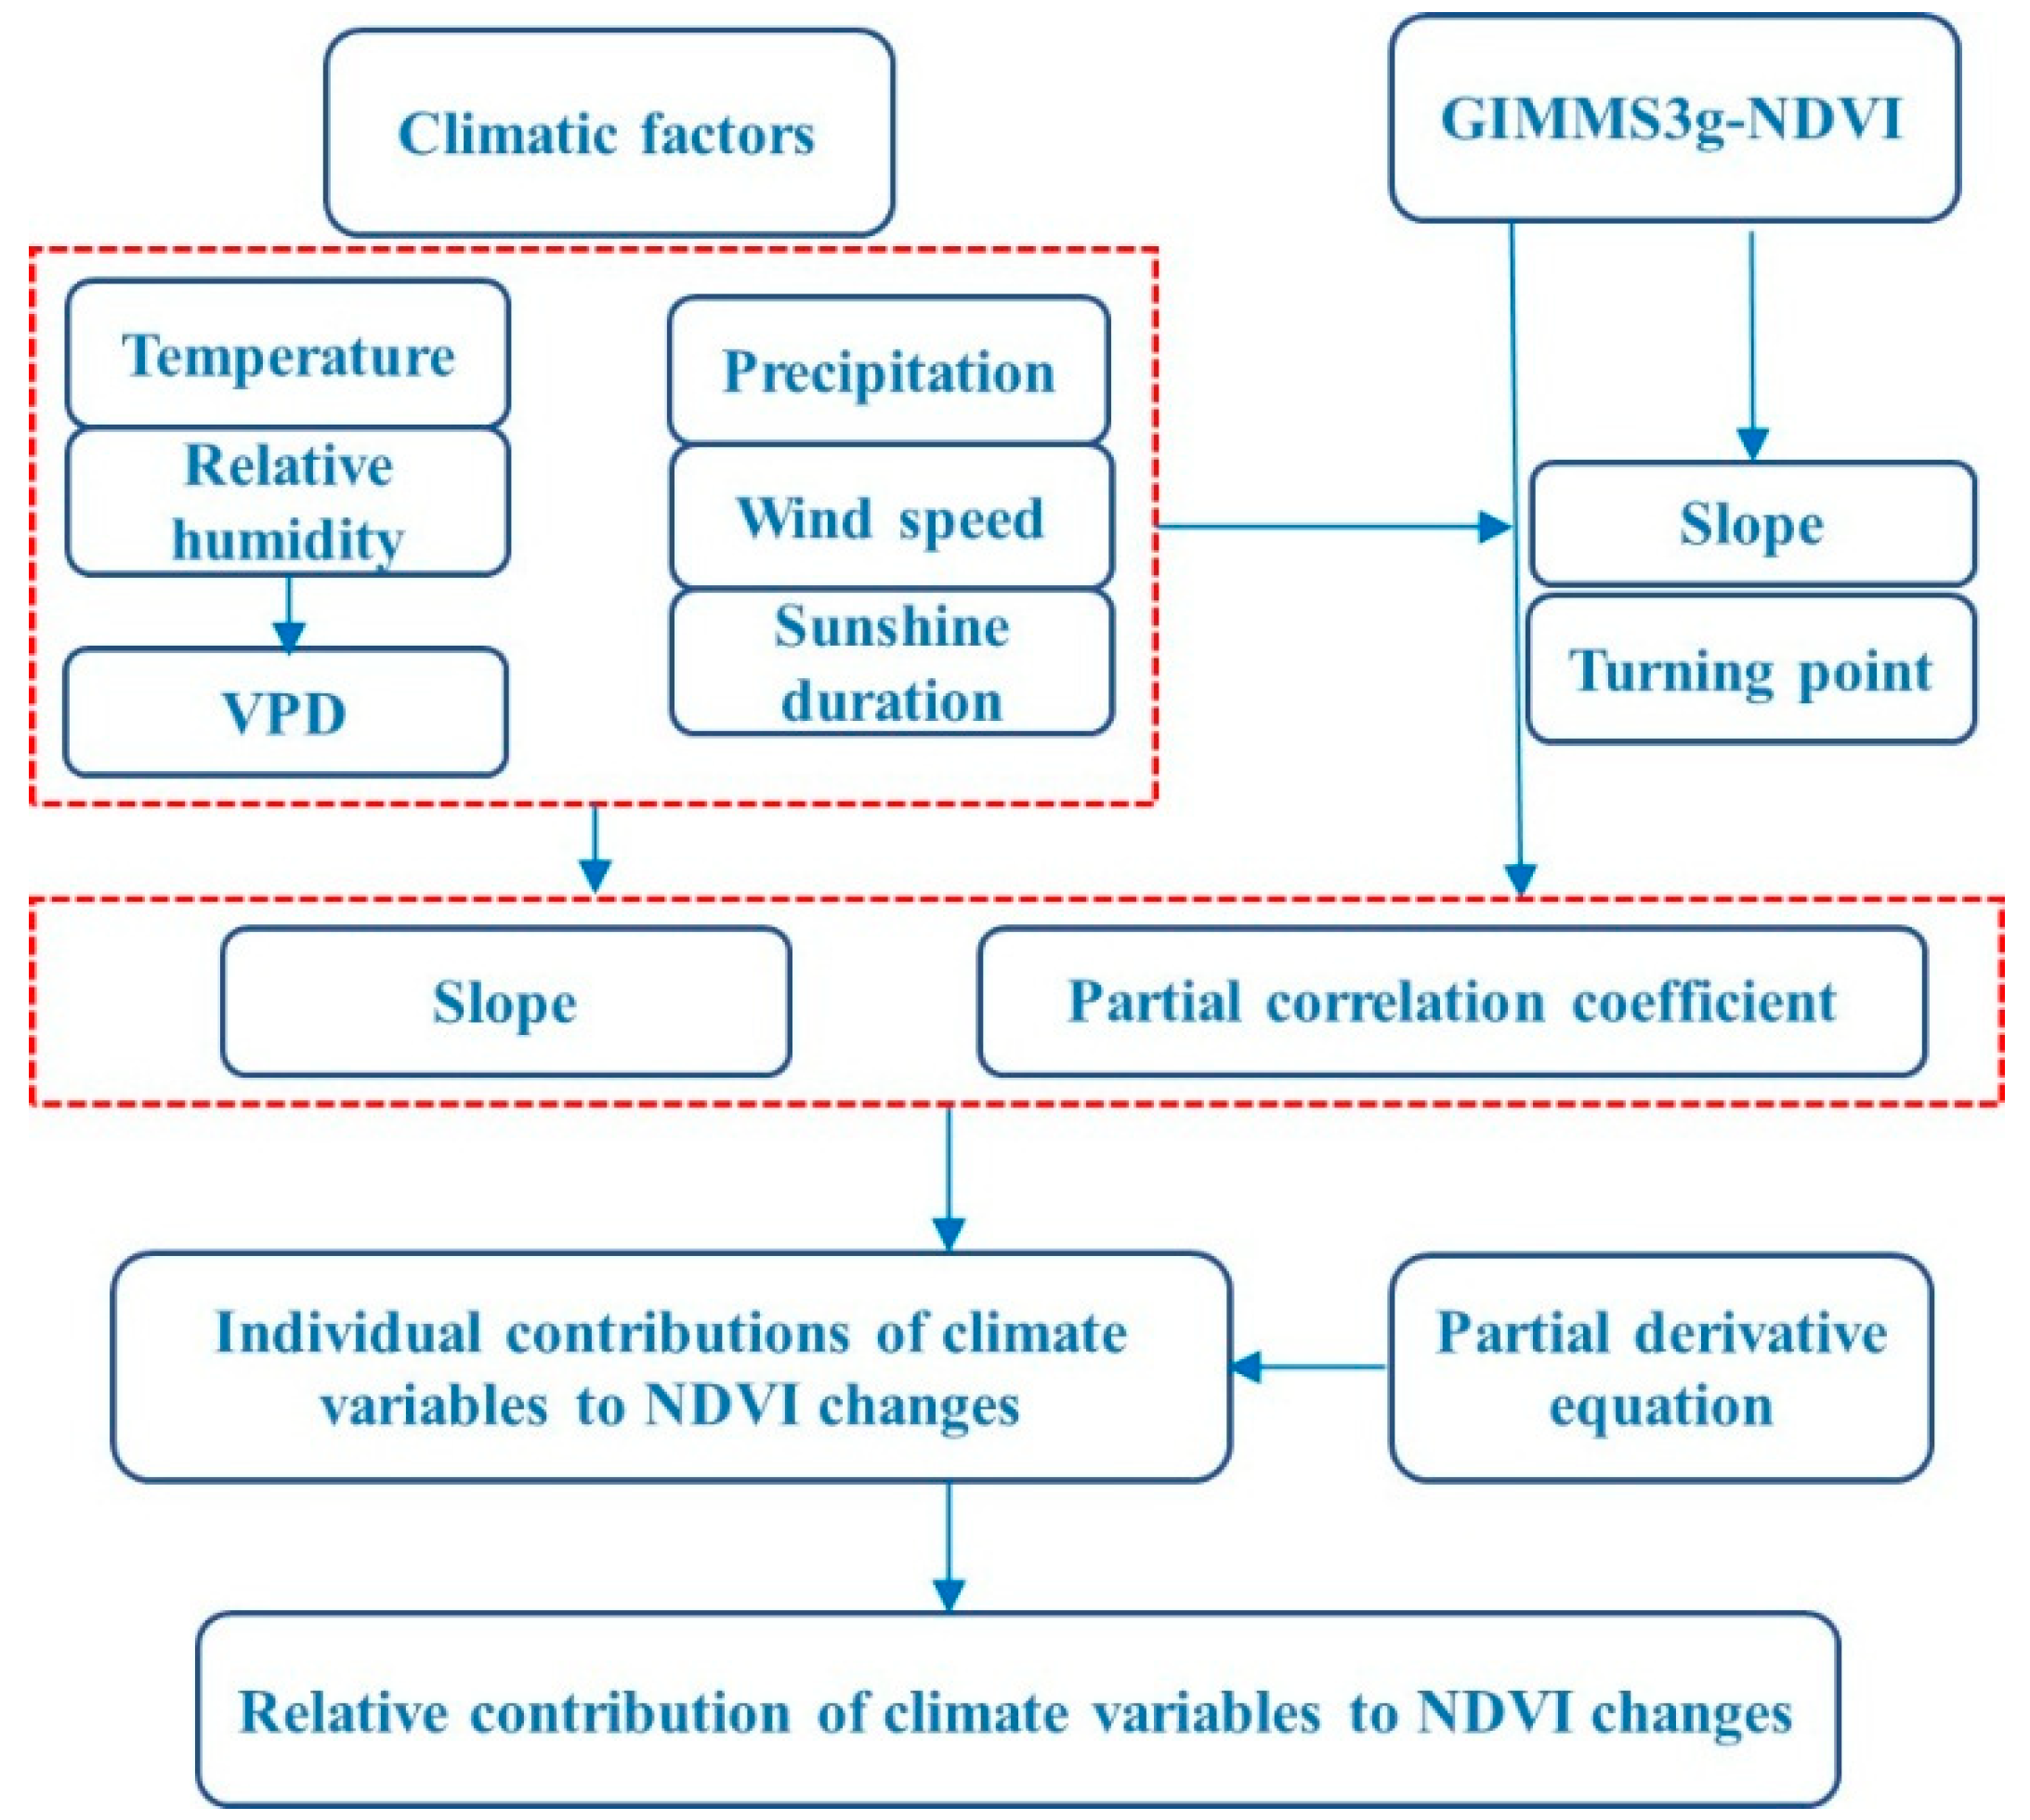
Figure 2 shows the major methodological approaches used in this study. We assessed the individual contributions of four climatic variables to changes in NDVI during the periods 1982–1996 and 1997–2015. We selected VPD, precipitation, wind speed, and radiation as the most relevant climatic variables in our study. The individual contributions of climatic factors to NDVI changes were quantified using the partial derivative approach. Finally, we estimated the relative contributions of different climatic factors during the periods 1982–1996 and 1997–2015.
2.3.1. Calculation of VPD
We used monthly air temperature and relative humidity data to calculate the monthly VPD in Xinjiang from 1982 to 2015 using the Allen et al. [41] equation. The VPD (kPa) was calculated as follows:
where es and ea represent the saturation vapor pressure (kPa) and actual vapor pressure (kPa). Specifically, es was estimated as:
where Ta is the surface air temperature (°C).
The ea was estimated as:
2.3.2. Partial Correlation Analysis
The partial correlation analysis (PCA) method was used to investigate the relationship between normalized NDVI and normalized VPD, excluding the potential impacts of precipitation (PRE), wind speed (WS), and sunshine duration or radiation (RAD). PCA describes the relationship between two variables, independent of the impacts of other potentially important variables [42]. The variable with the highest partial correlation coefficient (PCC) attributed by the PCA is considered to be the dominant factor. The PCC was calculated as follows:
where x is the dependent variable, and y and z are independent variables. Rxy.z is the PCC of variable x on y, independent of z. Rxy is the simple correlation between dependent variable x and independent variable y. Similarly, Rxz (Ryz) is the correlation between x and z (y and z). represents how much of the variance of x is not estimated by z in the equation but by y.
2.3.3. Partial Derivative Equation Method
Roderick et al. [43] proposed the partial derivative equation method to estimate the individual contributions of different climatic factors to NDVI changes. Based on the basic principle of partial correlation coefficients, the method provides a more reliable estimate of the individual contributions of different climatic factors [36].
Normalization Method
All meteorological data were normalized to the NDVI range. The normalization method can be expressed as:
where X is the normalized time series of climatic variables x, and x is the annual value of a climatic variable, xmin and xmax are the minimum and maximum values of the relevant climatic variable during the study period, and is the maximum value of NDVI for the study period.
Elasticity Coefficient Method
We evaluated the respective contributions of climatic factors to changes in NDVI as follows:
where , , , , and are changes in NDVI, VPD, precipitation, wind speed, and sunshine duration, respectively, where , , , and , and R is the residual term.
According to the Schaake [44] method, we defined the climatic factor elasticity regarding NDVI change as the ratio of the proportional change of NDVI to the proportional change of the climatic factor, as follows:
The mathematical meaning of is that 1% of change may lead to % of NDVI change.
Partial Derivative Equation
The partial derivative equation can be expressed as:
where refers to interannual trends (slopes) of NDVI corresponding to the periods 1982–1996 and 1997–2015, respectively. , , , are the partial correlation coefficients of NDVI to each climatic factor and , , , describe the interannual trends (slopes) of annual NDVI to each climatic factor during the study period. R is the residual of the partial derivative of (8).
The multivariate function was used to describe the relationship between NDVI and the climatic variables, as follows:
Based on the climate elasticity approach, the elasticities (expressed as regression coefficients) of multiple climatic factors were estimated using a multivariate regression model. The NDVI change was expressed as a linear combination of climatic factor changes:
By substituting the absolute changes from the mean in Equation (9), we obtain:
where NDVI is the mean annual NDVI, and is the mean NDVI for the study period. These climatic factors were calculated during the study period. Equation (8) can be expressed as follows:
By substituting the elasticity equation (Equation (6)) for the climatic factor in Equation (12), we obtain:
2.3.4. Trends Analysis
The linear trends of NDVI and the climatic factors were assessed using the non-parametric Sen’s slope estimator and trend significance was determined by the Mann–Kendall test (MK test). In this study, trends were considered to be statistically significant at a level of 0.05.
Because of the relatively obvious transitions of VPD and NDVI from 1982 to 2015, we used the 5-year moving average and cumulative anomaly method to detect the potential turning point (TP) in the NDVI and climatic factors. In addition, we considered the response of NDVI to VPD changes that occur during the growing season (GS, from April to October) and summer season in Xinjiang.
3. Results
3.1. Spatial-Temporal Changes in NDVI
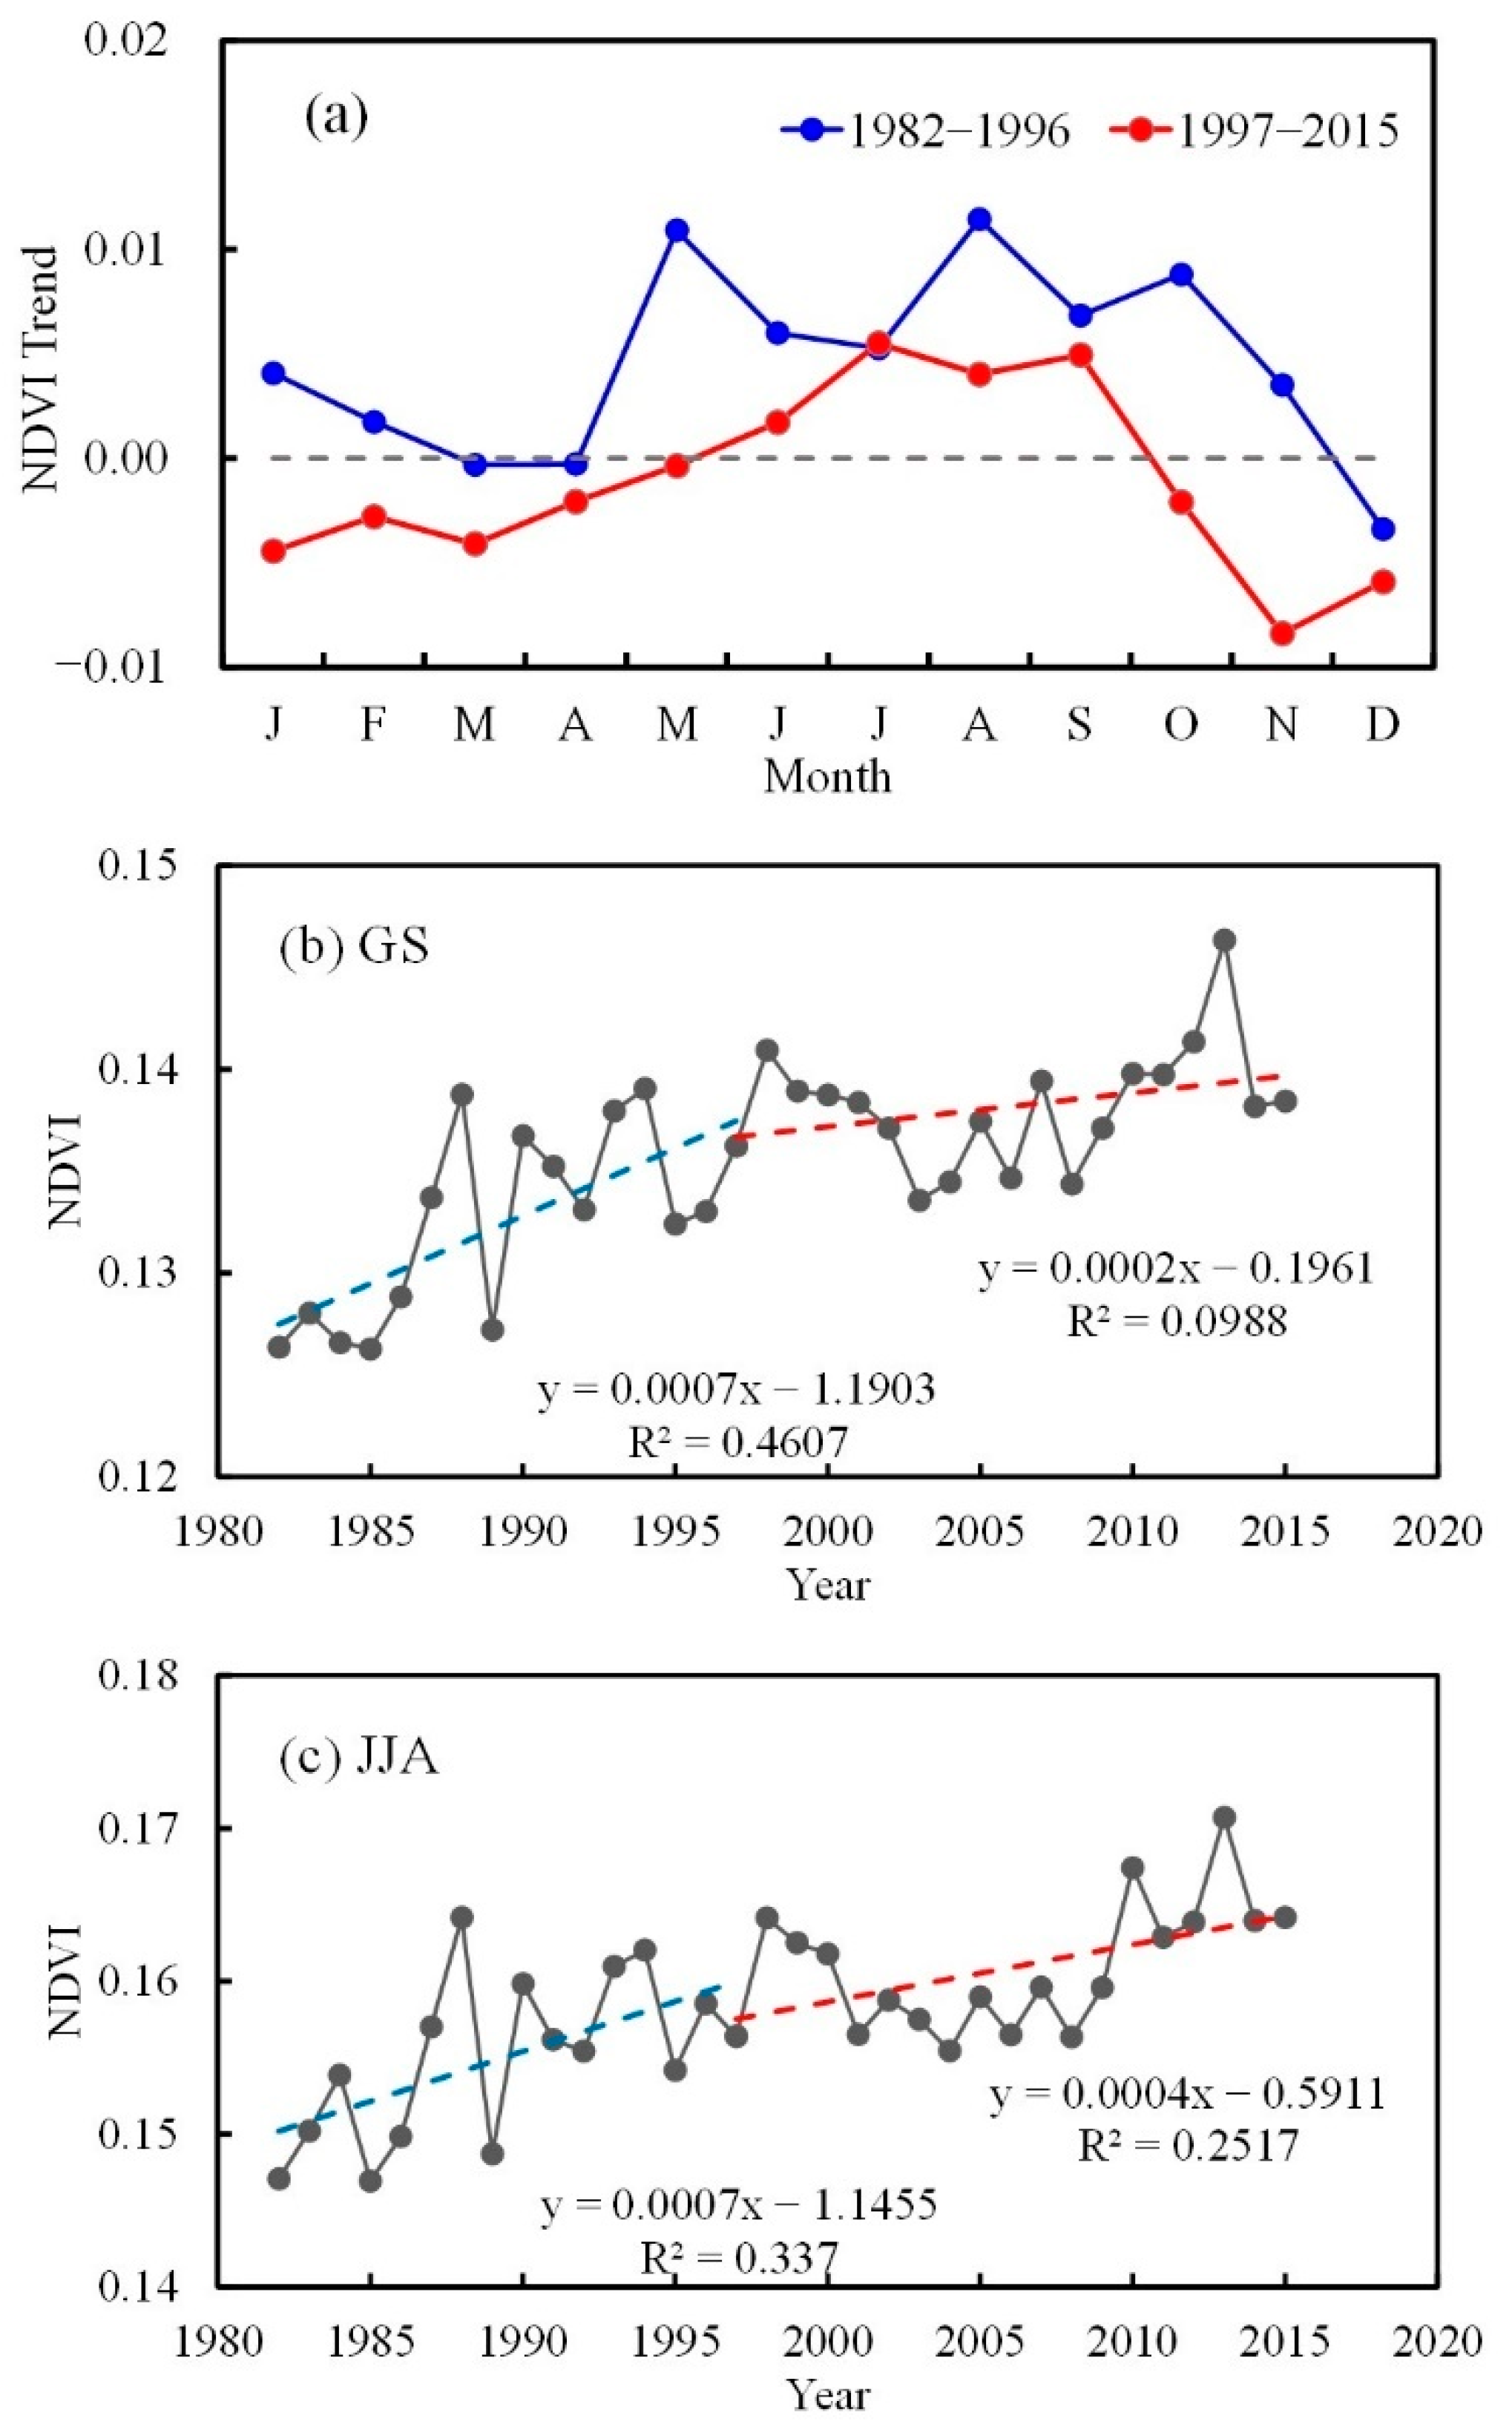
A cumulative anomaly method was used to detect the potential turning point (TP) in the annual growing season NDVI (Figure 3a). It was observed that the NDVI increased sharply before 1996, followed by a minor increase from 1997 to 2015 (Figure 3b). Regarding monthly NDVI, the mean trends for 12 months after 1996 were lower than those from 1982 to 1996 (Figure 4a). From 1982 to 1996, the trend in monthly NDVI increased significantly, especially during the growing season. However, mean NDVI trends over most of the months declined from 1997 to 2015, and only the summer NDVI trends increased slightly.
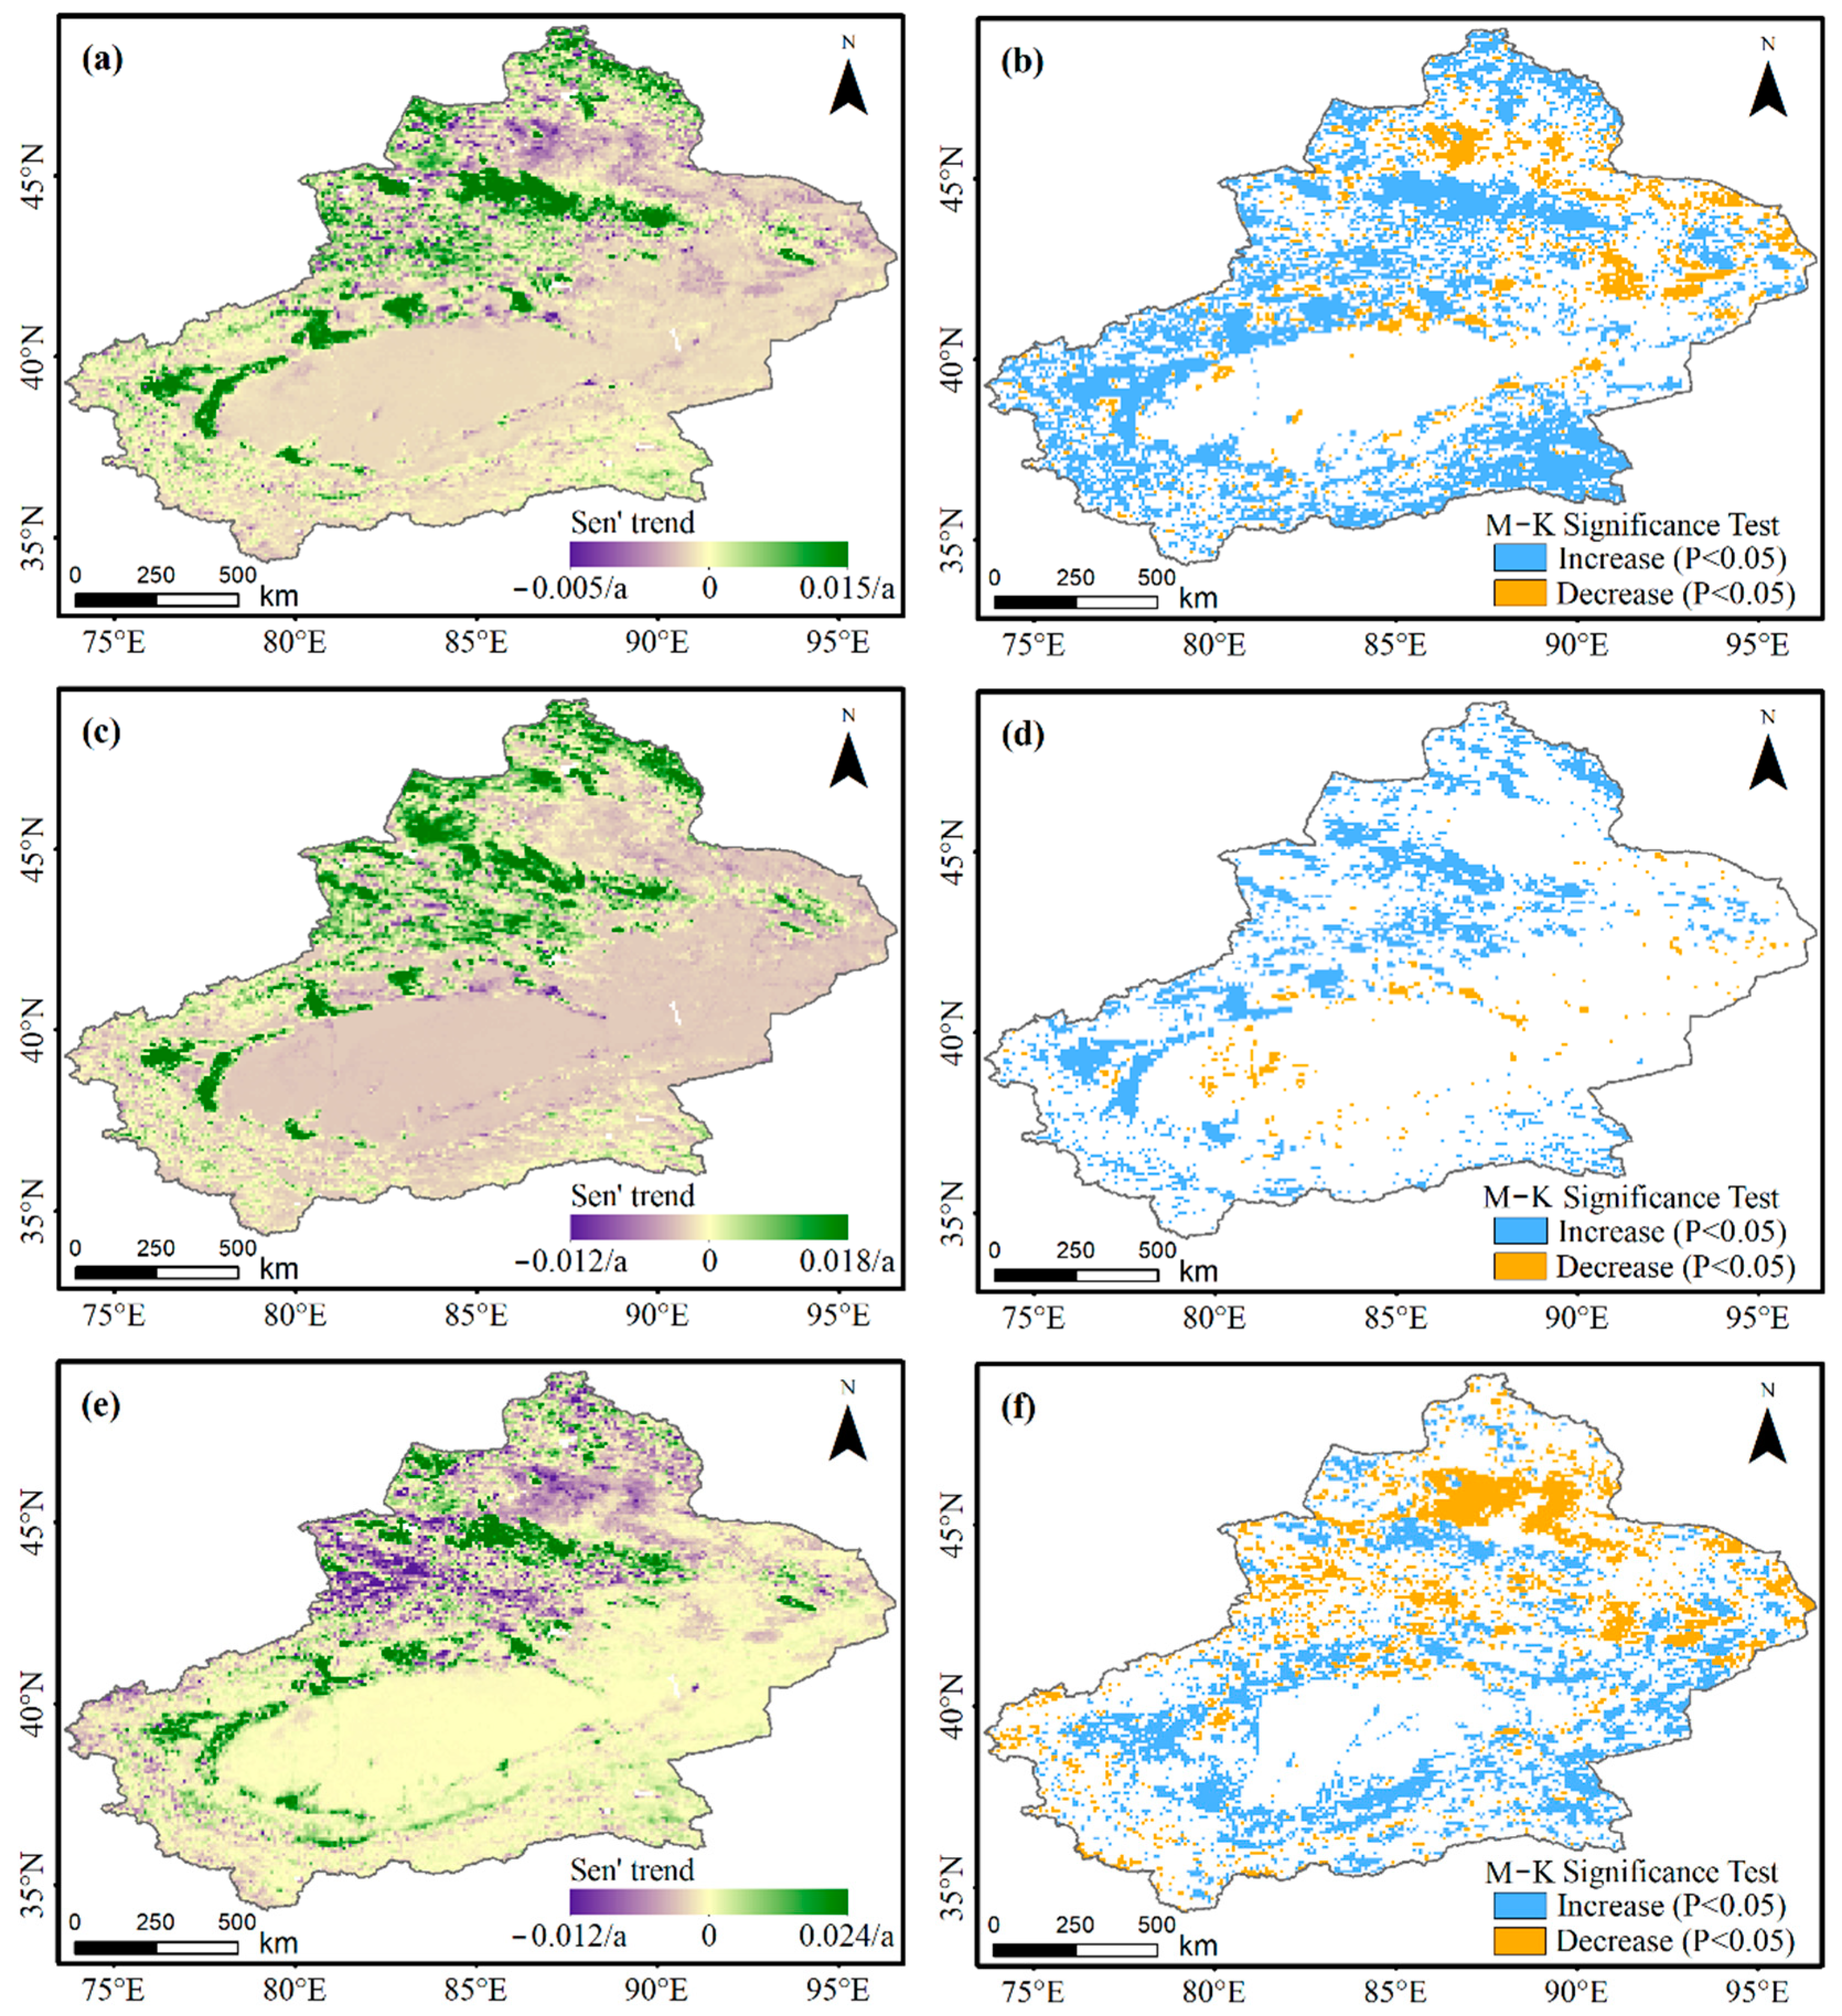
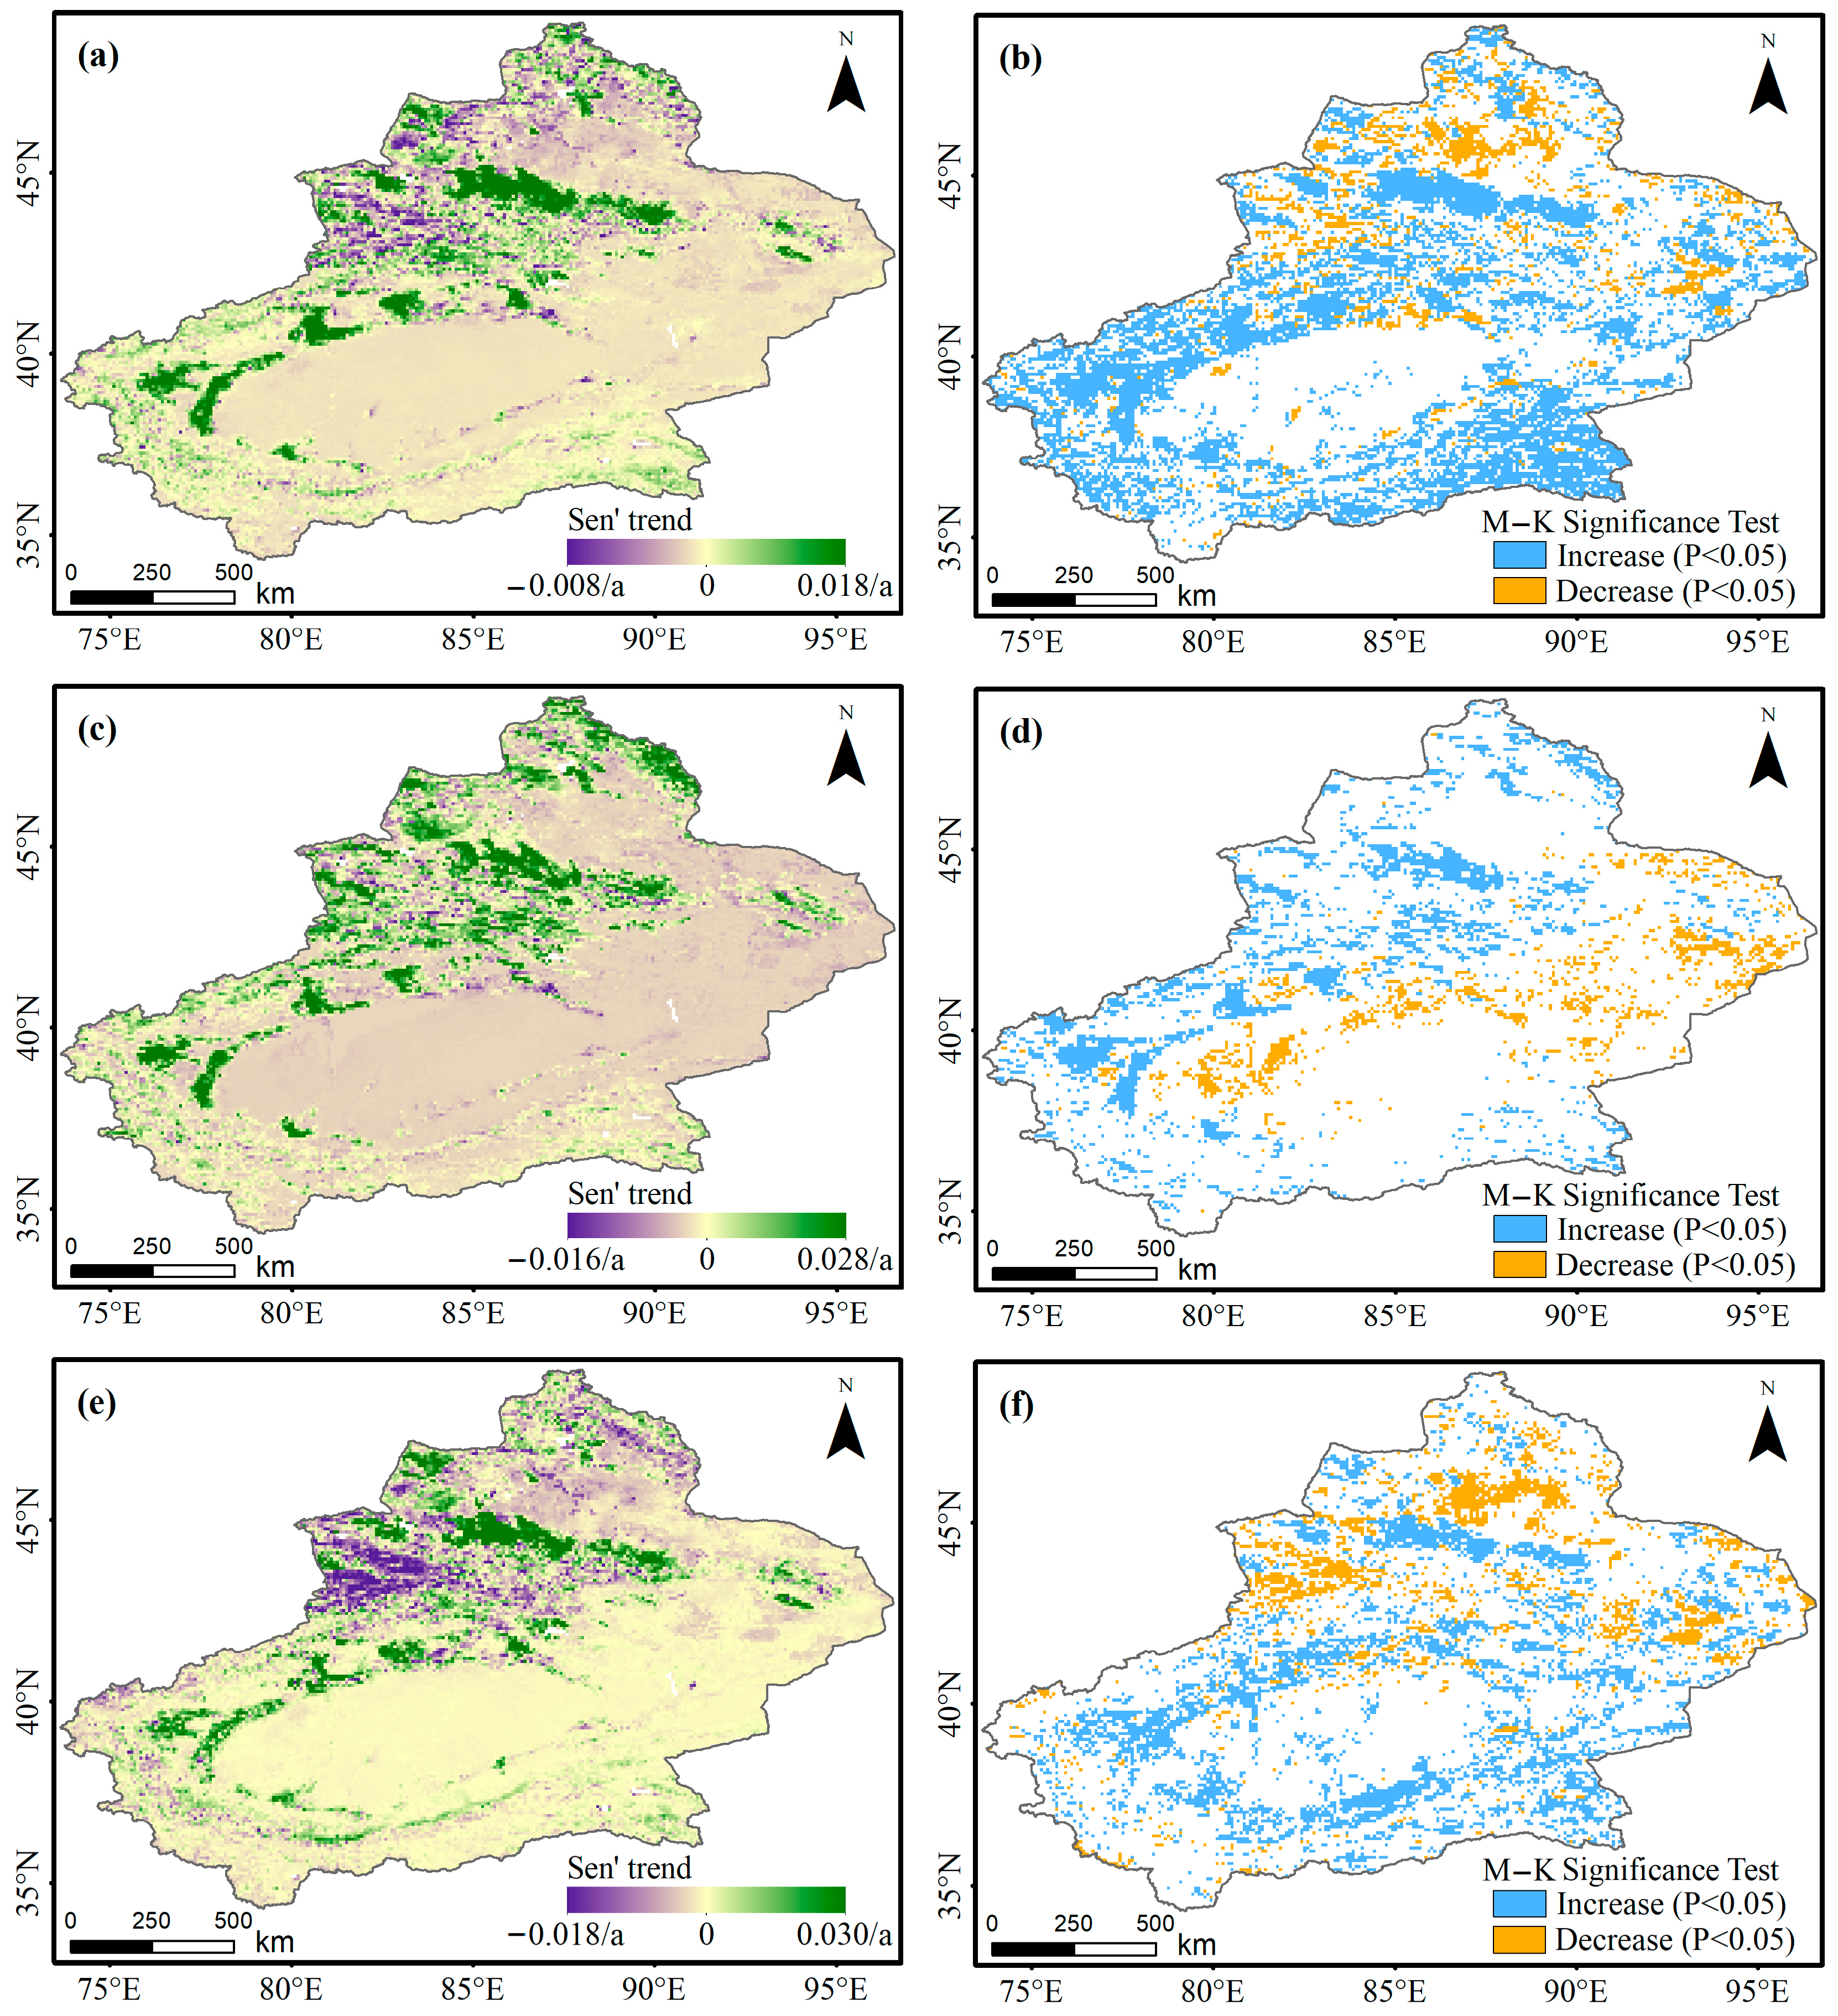
Figure 4b indicates that the annual growing season NDVI indicates a significant greening trend before 1996 (y = 0.0007x − 1.19, R2 = 0.46, p < 0.05), while NDVI declined and then plateaued from 1997 to 2015 (y = 0.0002x − 0.20, R2 = 0.09, p > 0.05). From 1982 to 1996, approximately 90% of the vegetated area in Xinjiang exhibited an increase in NDVI. Regions with the most significant greening trend, where annual NDVI was mostly greater than 0.015, were in the Tianshan Mountains, Altai Mountains, the upper reaches of the Tarim River, and parts of the Kunlun Mountains (Figure 5c,d). In addition, the mean NDVI for this period significantly decreased in less than 10% of the vegetated area, mainly downstream of the Tarim River, including the Hetian River, the southern edge of the Tarim Basin, and parts of the Turpan–Hami Basin (Figure 5c,d). In comparison, the NDVI trend from 1997 to 2015 decreased in approximately 50% of the vegetated area, mainly in the Ili River Valley, Junggar Basin, Tianshan Mountains, Altai Mountains, and the Kunlun Mountains. These areas are dominated by natural vegetation, and the NDVI trend was generally lower than −0.010 per year (Figure 5e,f). Greening trends during 1997–2015 were generally observed in the artificially vegetated areas, including the northern slope of the Tianshan Mountains and the Tarim Basin, especially downstream of the Tarim River (Figure 5e,f).
The summer NDVI increased significantly from 1982 to 1996 (slope = 0.0007, R2 = 0.34, p < 0.05), but no increase or decrease was observed after 1996 (slope = 0.0004, R2 = 0.25, p > 0.05) (Figure 4c). By comparison, the increase in NDVI was more pronounced in the summer season than in the growing season. We also compared the spatial patterns of NDVI trends before and after TP (1996) (Figure 6). From 1982 to 1996, the maximum NDVI was greater in the summer (NDVI = 0.025) compared with the growing season. In addition, the decline of the NDVI trend occurred over a larger scale in summer than in the growing season, including most of the Tarim Basin and Turpan–Hami Basin (Figure 6c,d). However, after 1996, the area of delaying NDVI trends decreased more in summer than in the growing season (Figure 6e,f).
3.2. Partial Correlations between the Climatic Factors and NDVI
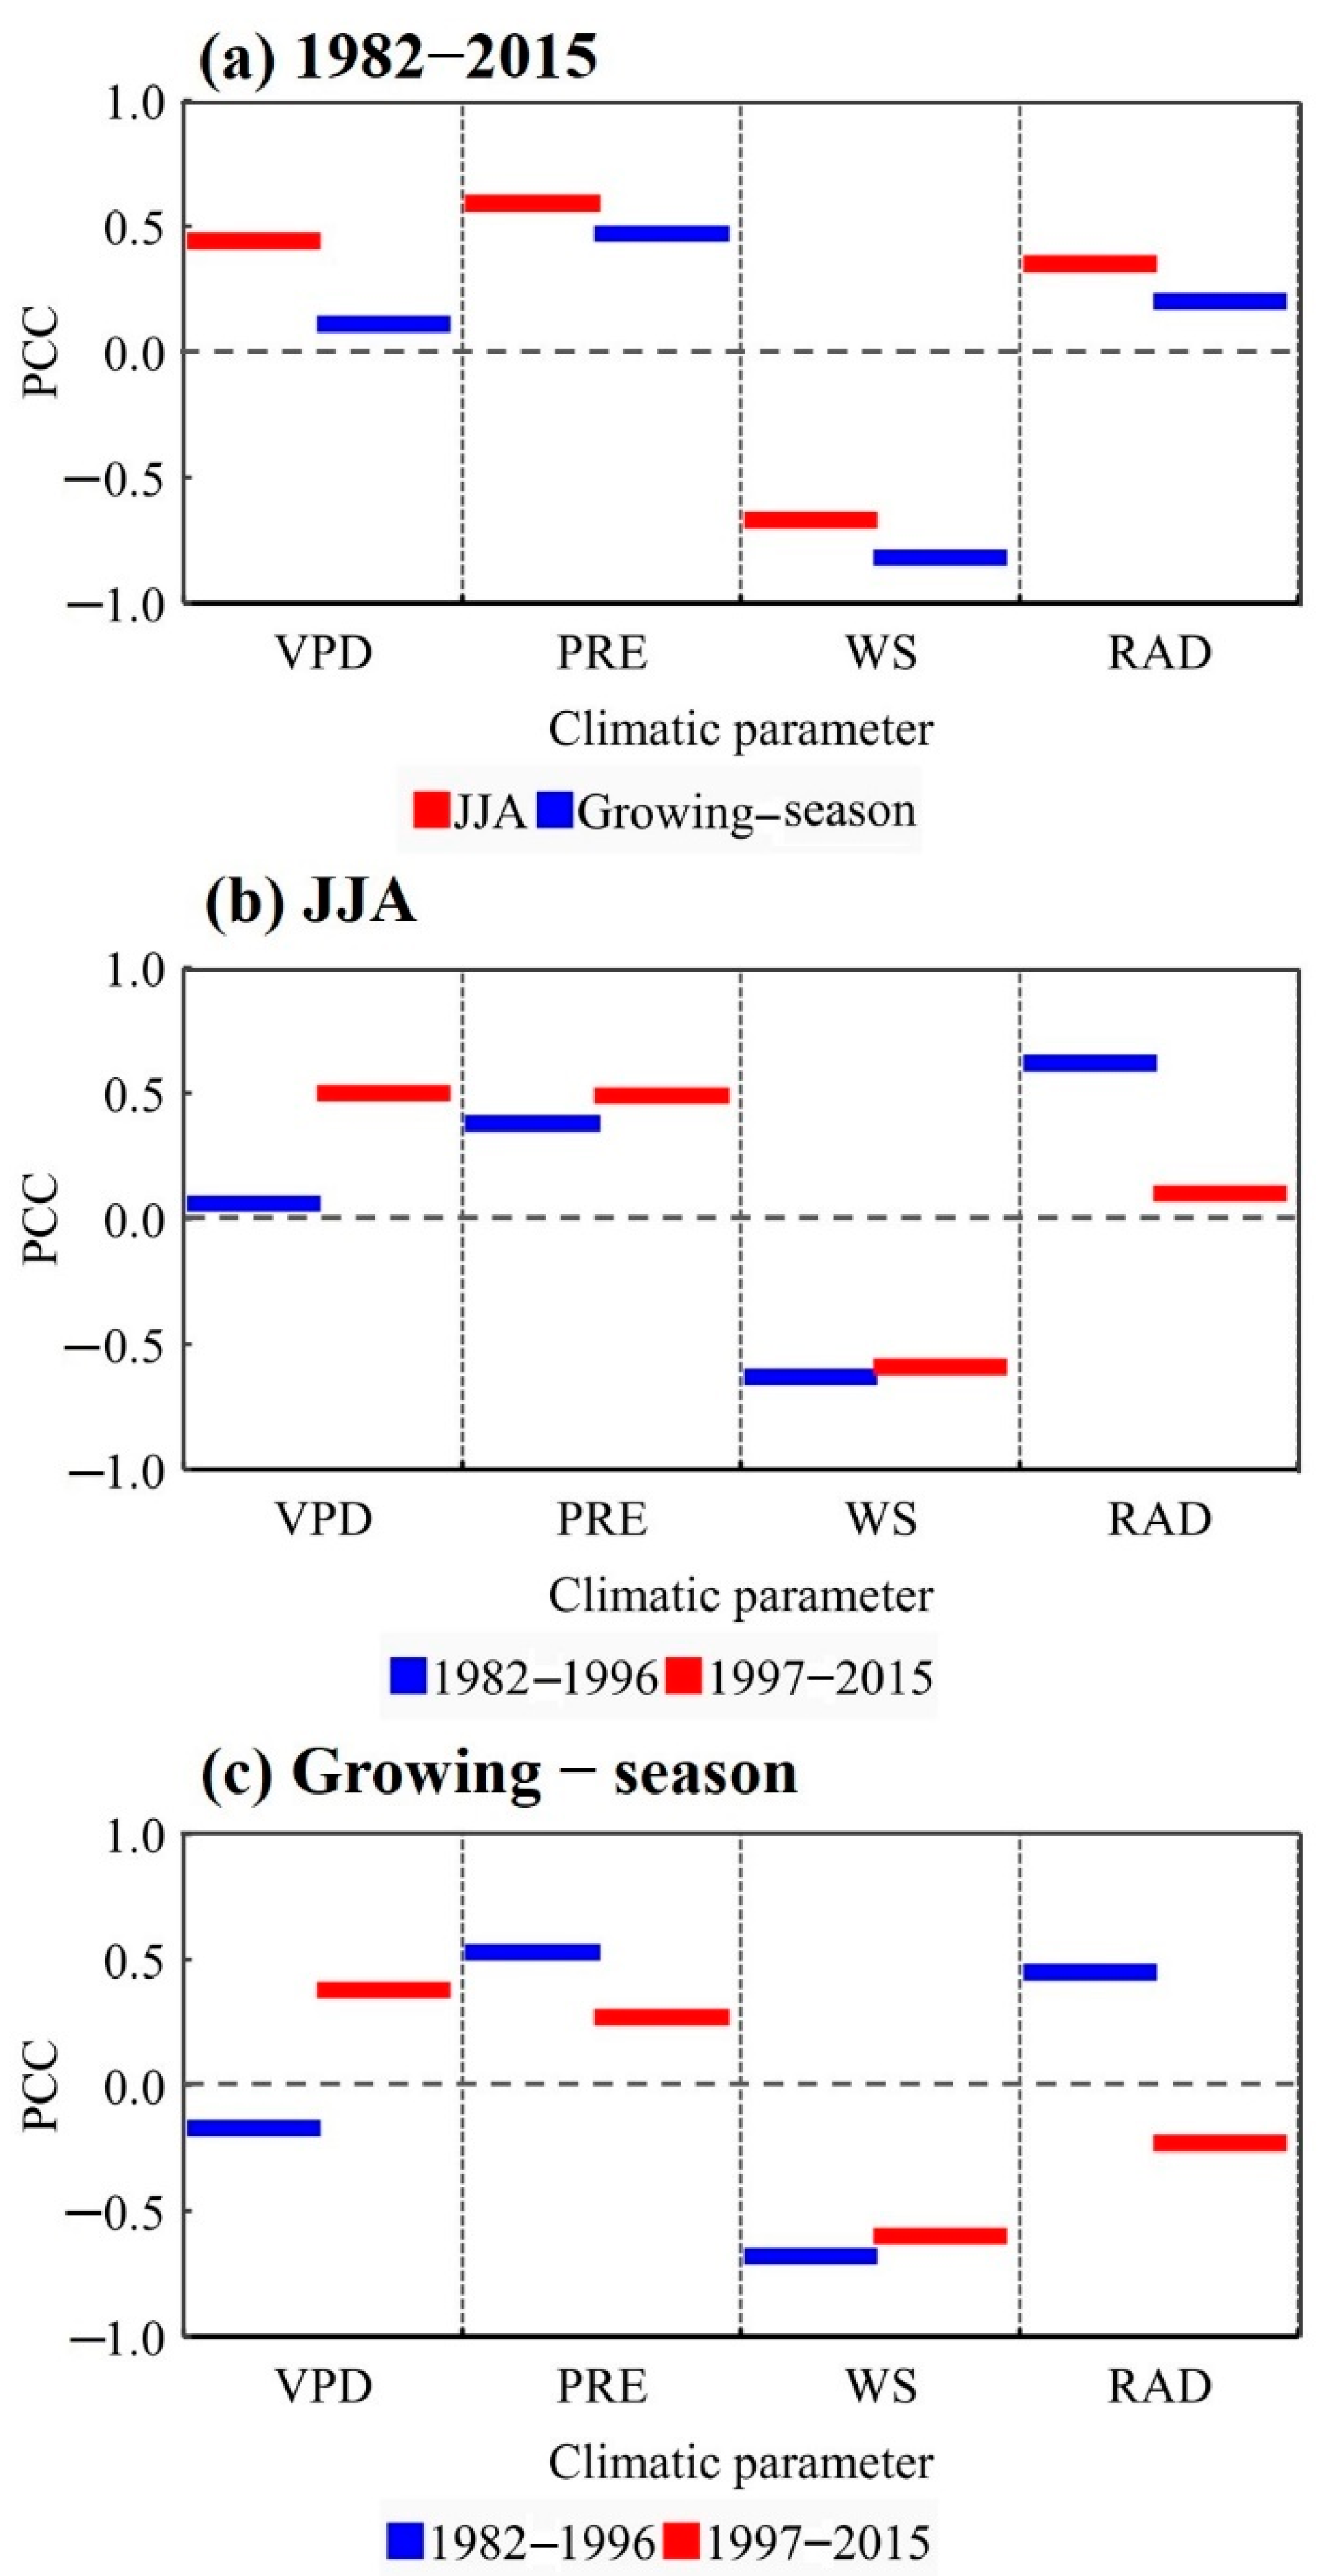
To estimate the impacts of the climatic factors on the change in NDVI, we calculated the partial correlations between each factor and NDVI for the growing season and summer season of the periods 1982–1996 and 1997–2015. From 1982–2015, the growing season NDVI was significantly correlated with precipitation (PCC = 0.47, p < 0.05) and wind speed (PCC = −0.82, p < 0.01). However, all four climatic factors were significantly correlated with NDVI during the summer season (Figure 7a).
A correlation was observed between growing season NDVI and precipitation, wind speed, and sunshine duration for the period 1982–1996. In comparison, after 1996, changes in NDVI correlated significantly with VPD and wind speed (Figure 7c). No difference was observed in the effect of wind speed on NDVI change before or after 1996, though the effect of VPD increased from 1997 to 2015. Thus, the partial correlation analysis indicated a strong relationship between growing season NDVI and the corresponding VPD from 1997 to 2015, when the effects of precipitation, wind speed, and sunshine duration were excluded. Similarly, the NDVI over the summer season was significantly correlated with VPD, when the effects of other climatic factors were excluded (Figure 7b).
Decreasing VPD corresponded to significantly increased NDVI, and rising VPD corresponded to stalled or decreased NDVI. In this study, the NDVI was constant and then stalled from 1997 to 2015, implying that a substantial increase in VPD strongly limited changes in NDVI.
3.3. Contributions of Climate Variables to NDVI Change
3.3.1. Spatial-Temporal Changes in VPD
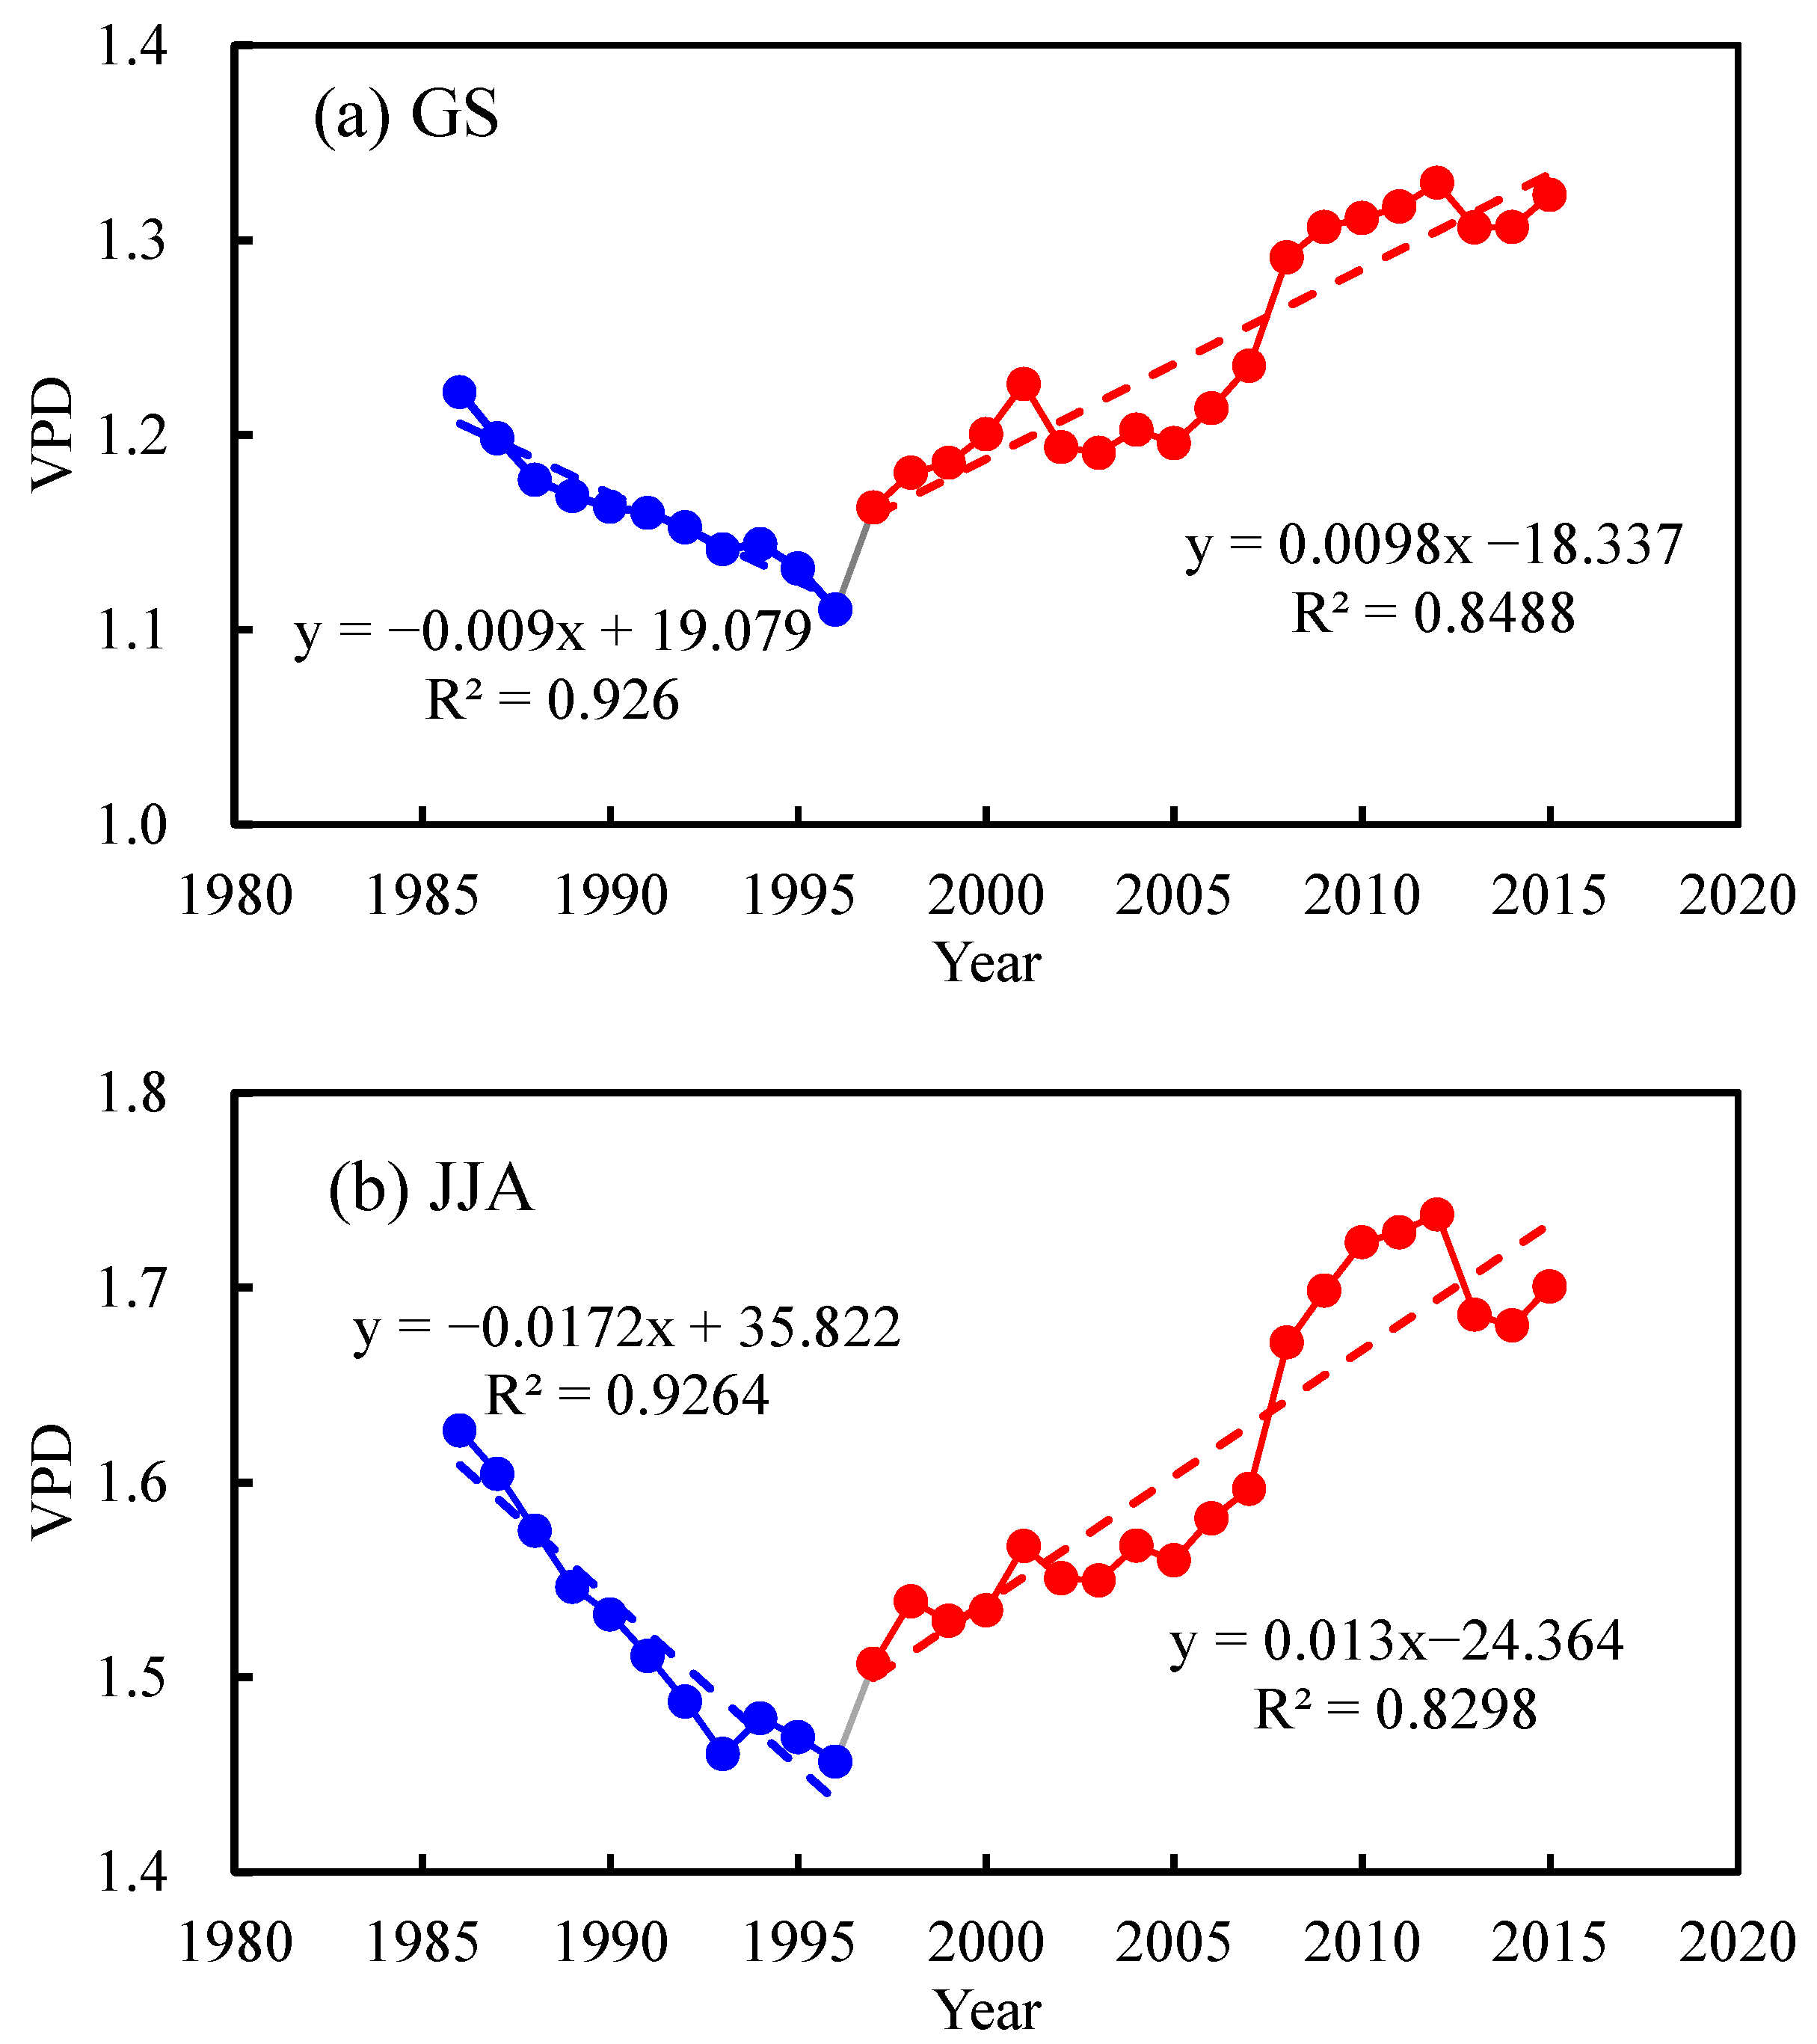
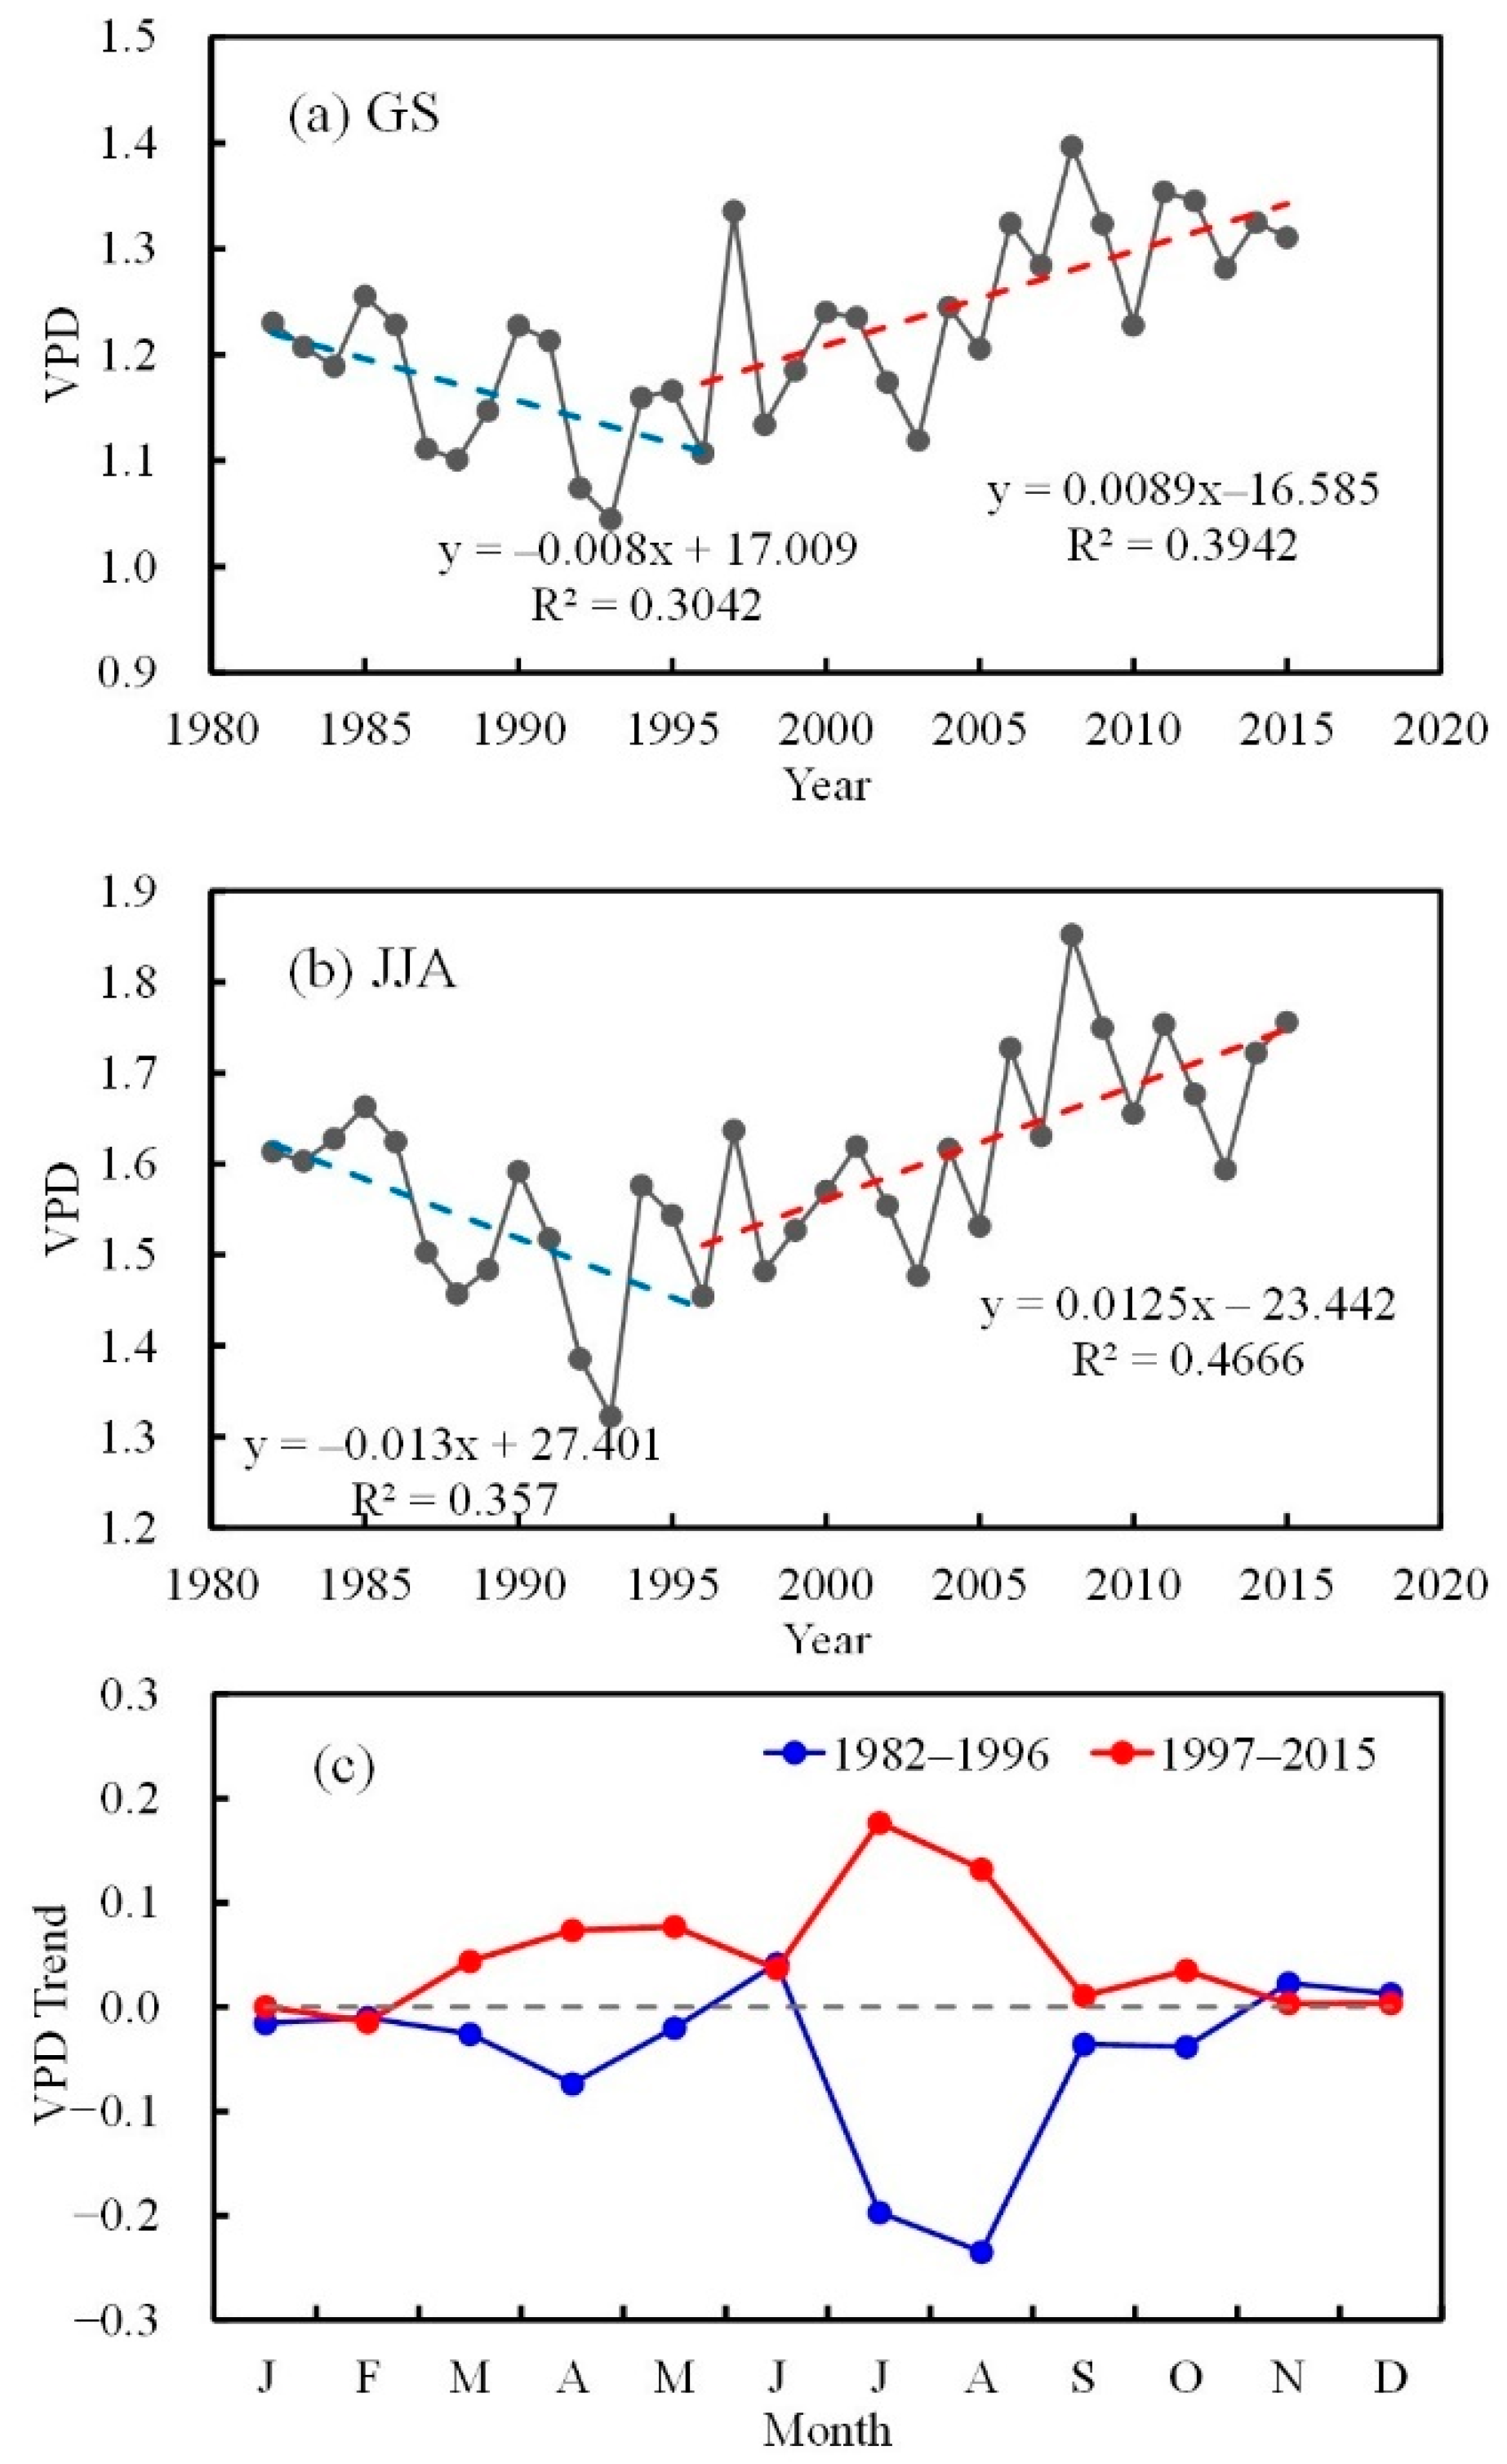
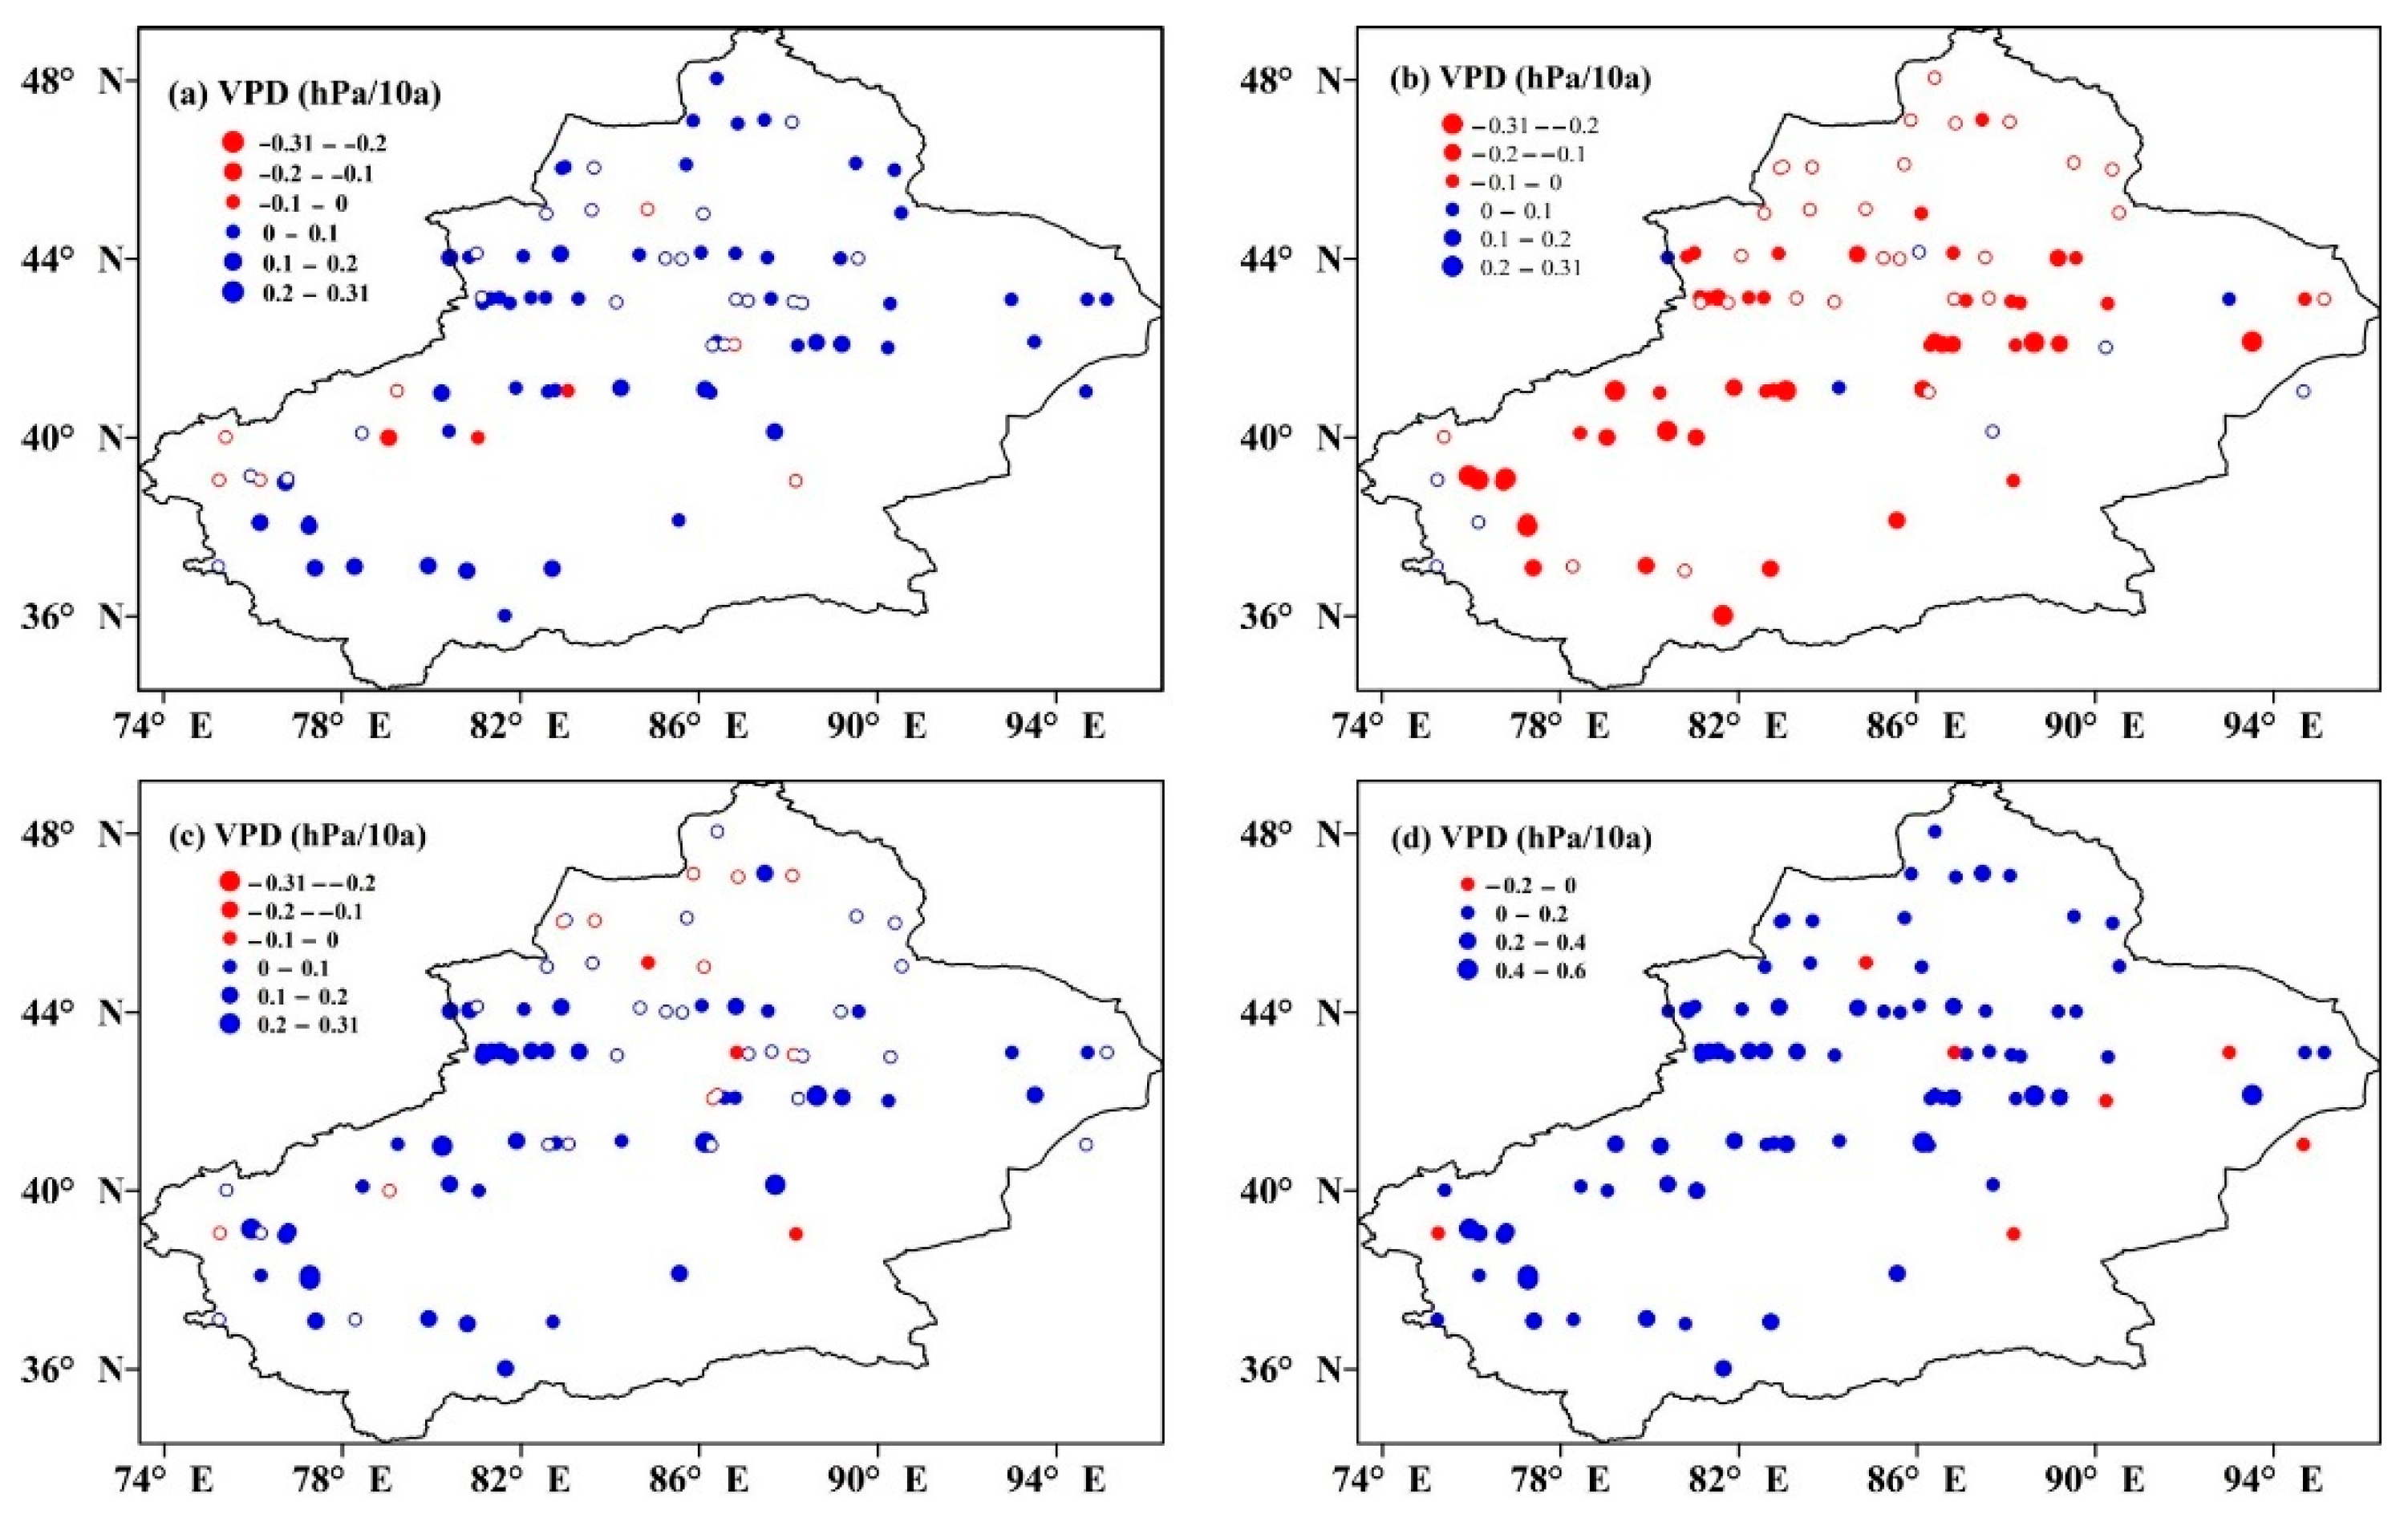
Similar to previous studies, the data showed that the decadal change in mean VPD during the growing season and summer season was marked by a distinct transition from a decreasing to an increasing trend around 1996 (Figure 8). The growing season VPD decreased by approximately 0.008 kPa per year from 1982 to 1996, and data from more than 90% of the observatories indicated a decreasing trend before 1996 (with a significant decrease reported at 59.55% of the observatories, Figure 9a and Figure 10b). In comparison, the growing season VPD trends were reversed, with a rate of 0.0089 kPa per year from 1997 to 2015, and 59% of the observatories reporting an increasing trend (56.18% with a significant increase, Figure 9a and Figure 10c). Figure 10d shows the difference in VPD trends before and after TP years, indicating that the mean VPD has experienced a substantial increase since 1996 at more than 92% of the observatories.
The summer VPD transitioned from a decreasing trend, before 1996, to an increasing trend, with a much greater change in VPD compared with the growing season. On average, the rate of decrease in summer VPD was 0.013 kPa per year from 1982 to 1996, and summer VPD increased by 0.0125 kPa per year after 1996 (Figure 9b). From 1982 to 1996, most of the monthly VPD values showed a decreasing trend, but increased after 1996. The summer VPD trends were more extensive than those in the other seasons for the two periods (Figure 9c).
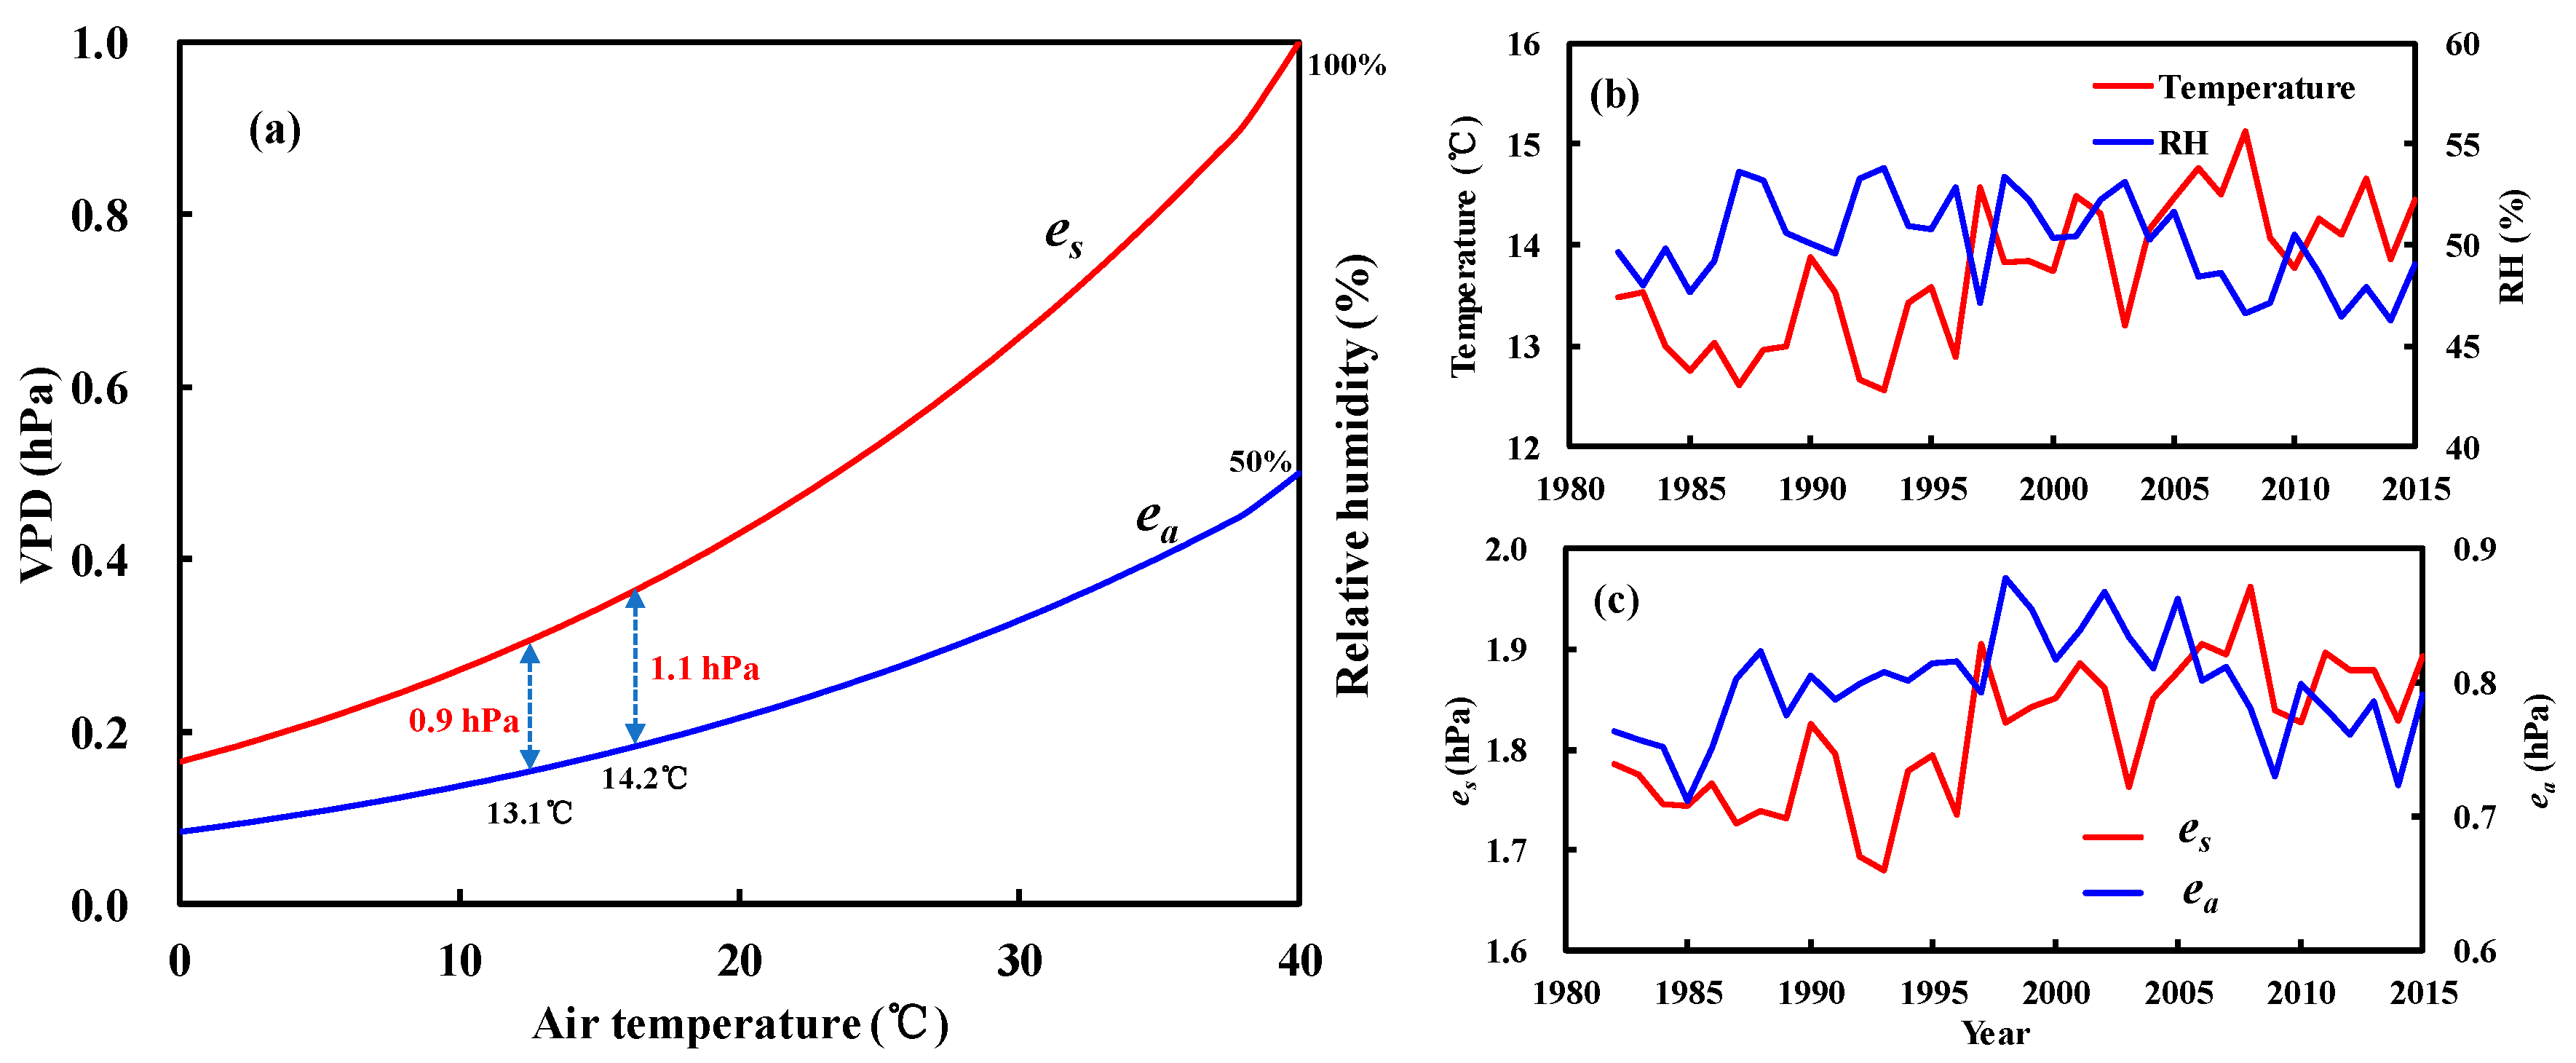
Figure 11 shows the shifts in VPD observed in Xinjiang during the two periods of 1982–1996 and 1997–2015. Air temperature increased by 1.1 °C, resulting in an increase in VPD of 0.2 kPa (from 0.9 to 1.1 kPa) (Figure 11a,b). A transition from decreasing to increasing trends was also observed for es in Xinjiang, and ea was reversed in 1996 (Figure 11c). Increased air temperature increased es, and decreased relative humidity jointly explained the changes in ea after 1996 (Figure 11b). For the period 1997–2015, the air temperature in Xinjiang increased by 0.31 °C per decade, and relative humidity declined by 2.55% per decade, resulting in a VPD increase of 0.08 kPa per decade (Figure 11a,b).
3.3.2. Attributions of Long-Term Changes in Climate Variables and NDVI
To quantify the impact of climate on NDVI, we assessed the mean contribution of each climate variable (i.e., VPD, precipitation, wind speed, and sunshine duration) to regional NDVI during the growing season and summer season for the two periods, respectively (Figure 12).
During the 1982–1996 period, an overall decrease in wind speed played an important role in greening over the growing season and summer season in the Xinjiang region, and sunshine duration, precipitation, and VPD contributed to NDVI greening in most regions of Xinjiang. Notably, the sunshine duration negatively affected NDVI, and VPD also contributed negatively to NDVI change during the summer season (Figure 12a,b). After 1996, increasing VPD trends played a dominant role in the decrease, and eventual plateauing, of greening trends in the Xinjiang region over the growing season and summer season, whereas wind speed restoration in Xinjiang was positively associated with NDVI trends decreasing and plateauing. Notably, the residual R also contributed to NDVI trends plateauing during the summer season (Figure 12b). The growing season VPD decreased by 0.008 kPa per year, corresponding to an increase in NDVI of 0.0008 per year before 1996, while annual regional NDVI decreased to 0.001 resulting from a VPD increase of 0.009 kPa per year from 1996 to 2015 (Figure 12a). Similarly, in the summer season, the VPD-induced NDVI stalls increased by 0.0019 per year after 1996 (Figure 12b).
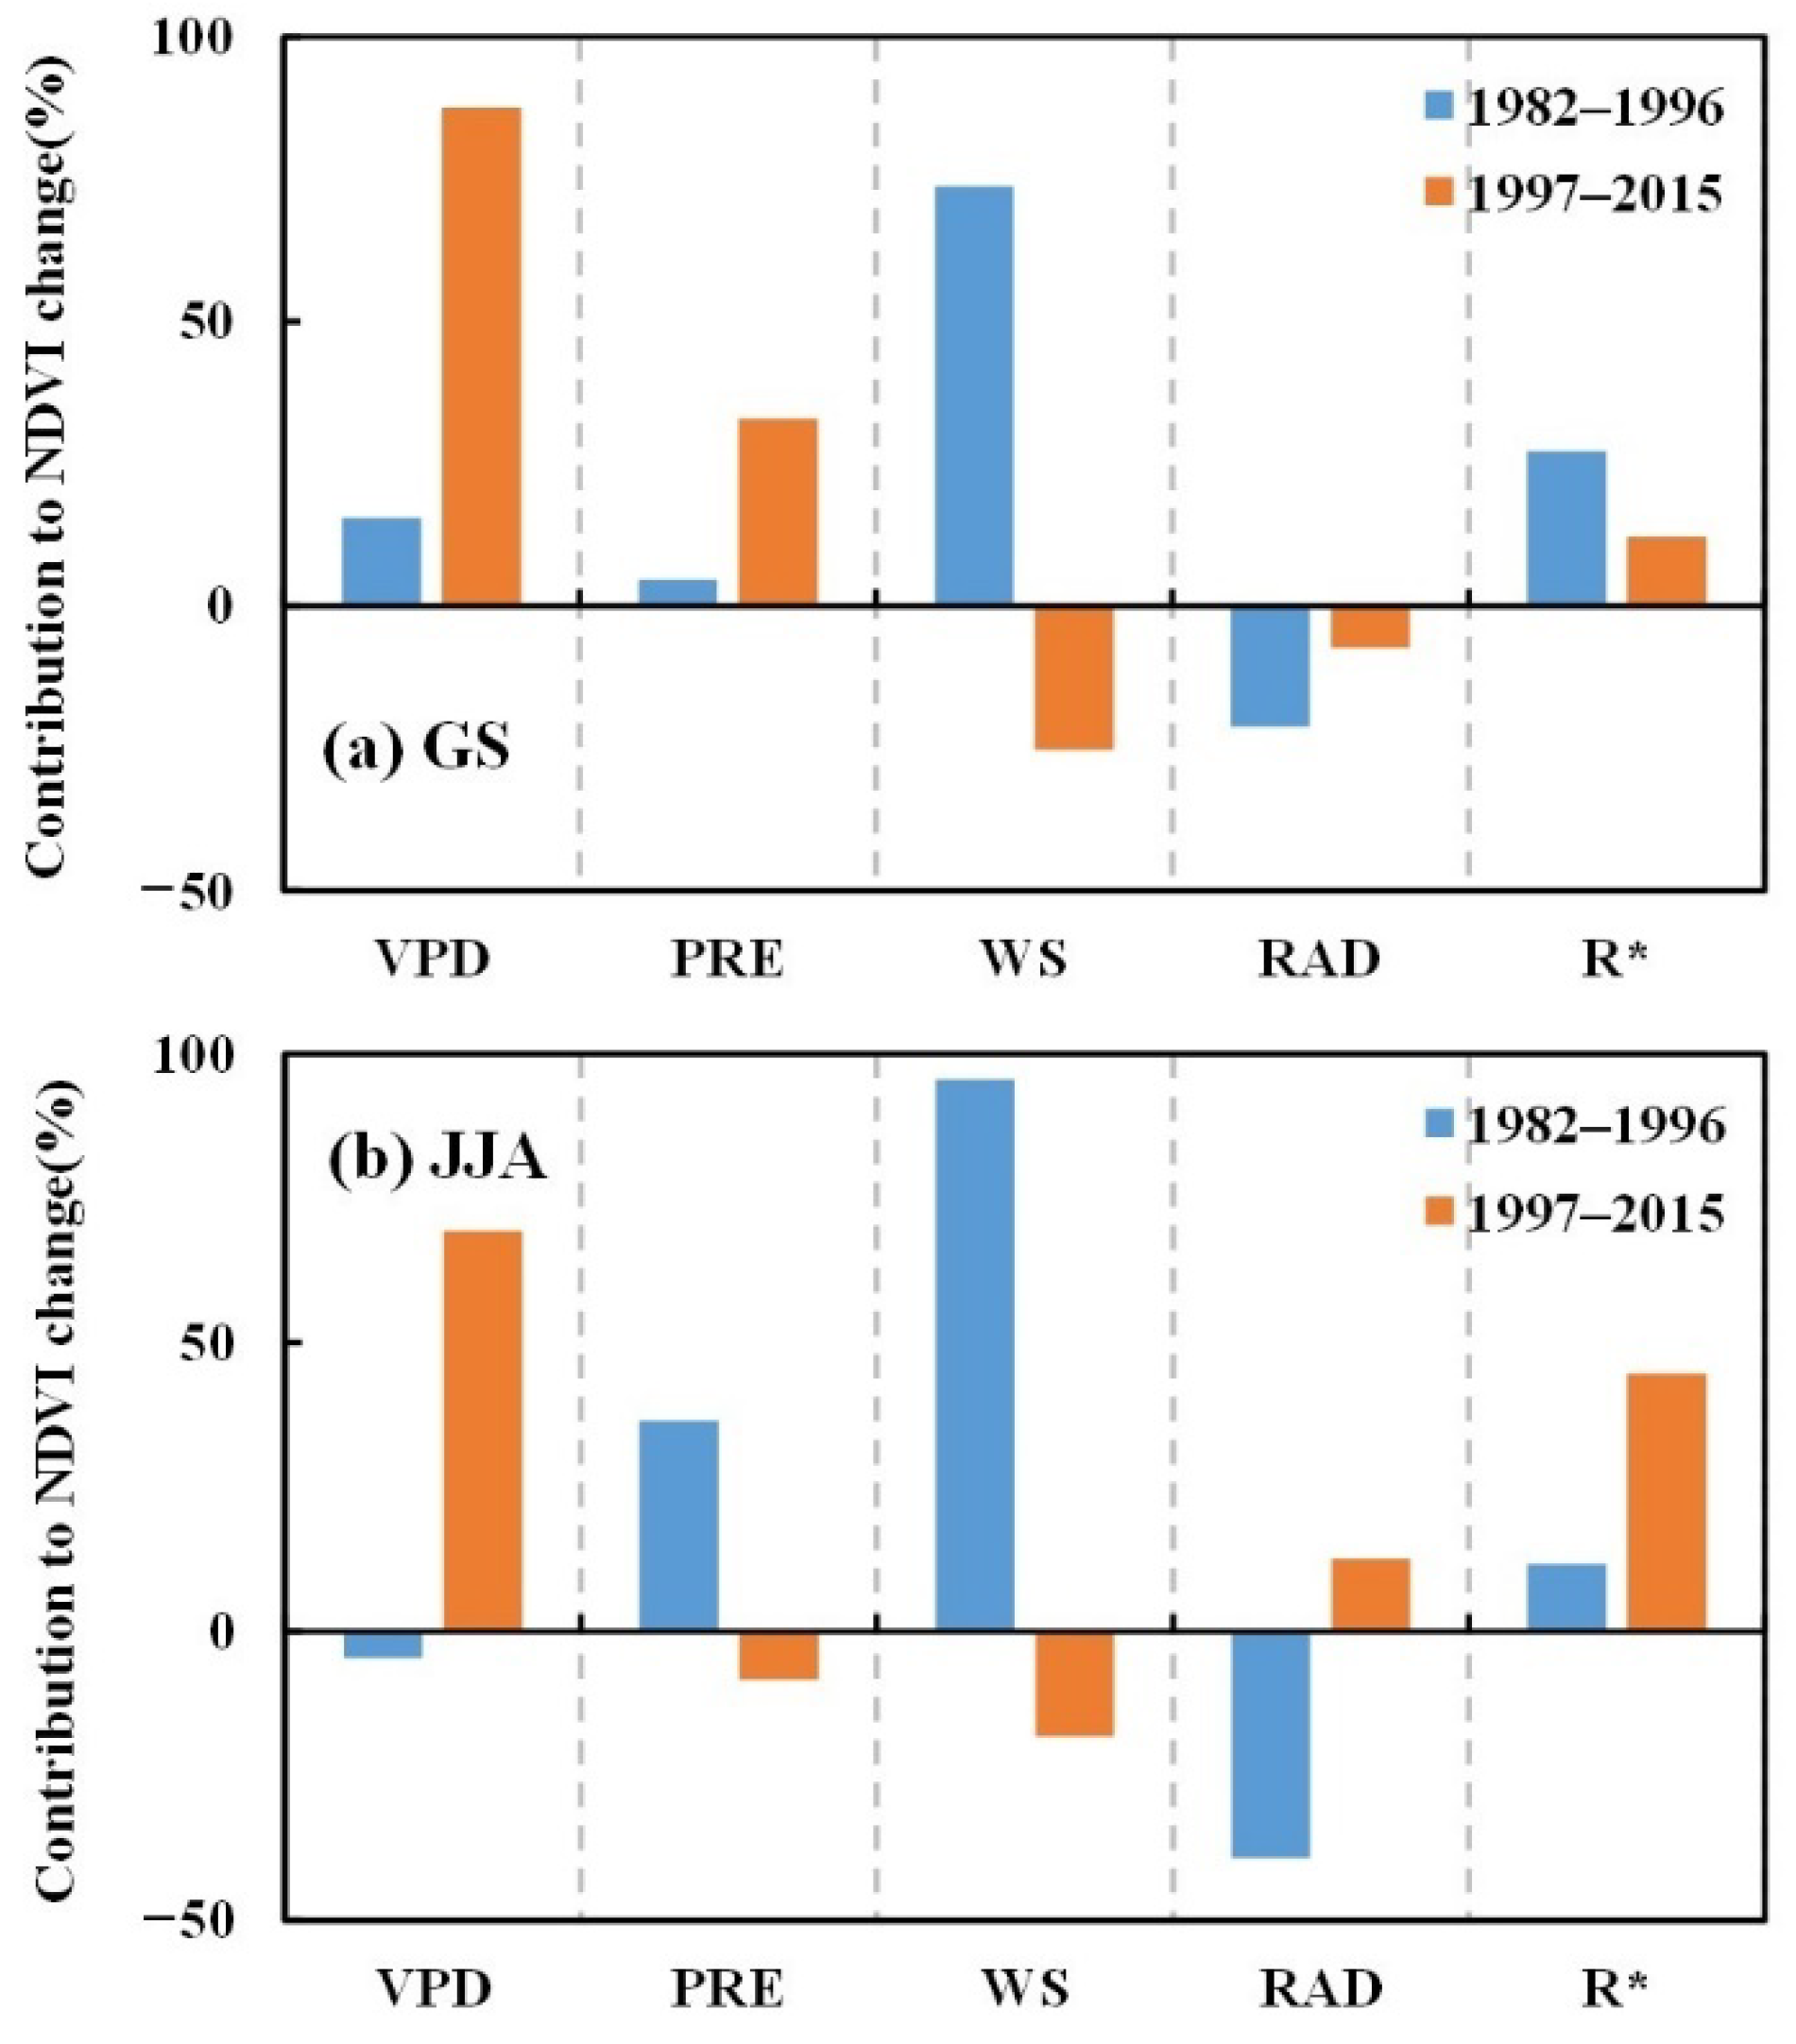
Figure 13 shows the estimated mean contribution of climatic factors to NDVI change over the growing and summer seasons during the two periods. Before 1996, the greening during the growing season in more than 90% of the vegetated area in Xinjiang was attributed to wind speed (73.68%) and VPD (15.57%), whereas sunshine duration (−21.19%) had a negative relationship (Figure 13a). However, from 1997 to 2015, increased VPD (87.57%) was the dominant contributing factor to growing season NDVI greening stalls, especially in the Ili River valley, Junggar Basin, and mountainous areas where grassland and desert vegetation were the dominant vegetation cover types (Figure 13a). In addition, a decrease in precipitation (32.89%) also contributed to decreases in growing season NDVI.
For the summer season, the VPD (69.29%) was also the leading factor in NDVI decreases, followed by residual R, contributing to 44.66% of the change in NDVI stalling after 1996 (Figure 13b). Anthropogenic factors also significantly contribute to vegetation restoration or degradation, including gross domestic product (GDP), population dynamics, rapid urbanization, grazing, and livestock.
4. Discussion
4.1. Response of VPD to Global Warming
Global air temperature has risen by approximately 0.2 °C per decade over the last 30 years [45]. This warming increases the saturation vapor pressure (es) [46], leading to increased VPD if the actual vapor pressure (ea) does not increase by the same amount as es [12]. A previous study reported an increase in global VPD after the late 1990s, which was jointly determined by increased es and decreased ea [12]. Notably, increases in VPD occur according to a nonlinear relationship. A continuous increase in global VPD has not only been reported in recent decades but has also been predicted to continue in the 21st century [12]. Yuan et al. [12], comparing four climate datasets, found a sharp increase in global VPD after the late 1990s but the trends were spatiotemporally heterogeneous.
Arid regions are particularly sensitive and vulnerable to climate warming [47]. Typical to arid areas, Xinjiang has experienced rapid warming over the past century [48]. As a result, the VPD in Xinjiang increased considerably in recent decades, with an unexpectedly high response rate to global warming of approximately 10% (according to the Clausius–Clapeyron relationship) [49].
4.2. Impacts of VPD on Vegetation Dynamics
Reliable detection and attribution of NDVI changes are key to understanding global changes and effectively conserving ecosystems [50]. Xinjiang is one of the driest regions in the world. Long-term monitoring of NDVI has indicated a significant greening trend since 1982 and was subsequently reversed to a browning trend from the late 1990s to the early 2010s [1,37]. In this study, we found a clear trend in greening from 1982 to 1996; however, the NDVI greening trend stalled from 1997 to 2015.
Compared with the detection of regional vegetation growth changes, information regarding the attribution of these changes in Xinjiang is still scarce. Previous studies have emphasized the vital role of air temperature and precipitation on NDVI changes in Xinjiang [1,37]. For example, Li et al. [1] found that the reversed trends of NDVI after the late 1990s could be attributed to increased warming and reduced precipitation. Yao et al. [37] found that increased drought severity exacerbated the loss of soil moisture, and led to decreased NDVI. However, Yao et al. [25] suggested that climate extremes (e.g., minimum temperature and torrential rainfall) were the primary driving forces for the decreased NDVI. In this study, we also identified the contributions of climatic factors to the growing season NDVI change during the periods 1982–1996 and 1997–2015 in Xinjiang. Using a method based on the partial derivative equation, we found that the growing season NDVI greening stalls were primarily driven by increasing VPD (contributing 87.57%) from 1997 to 2015. However, decreasing precipitation also contributed to the decrease in growing season NDVI.
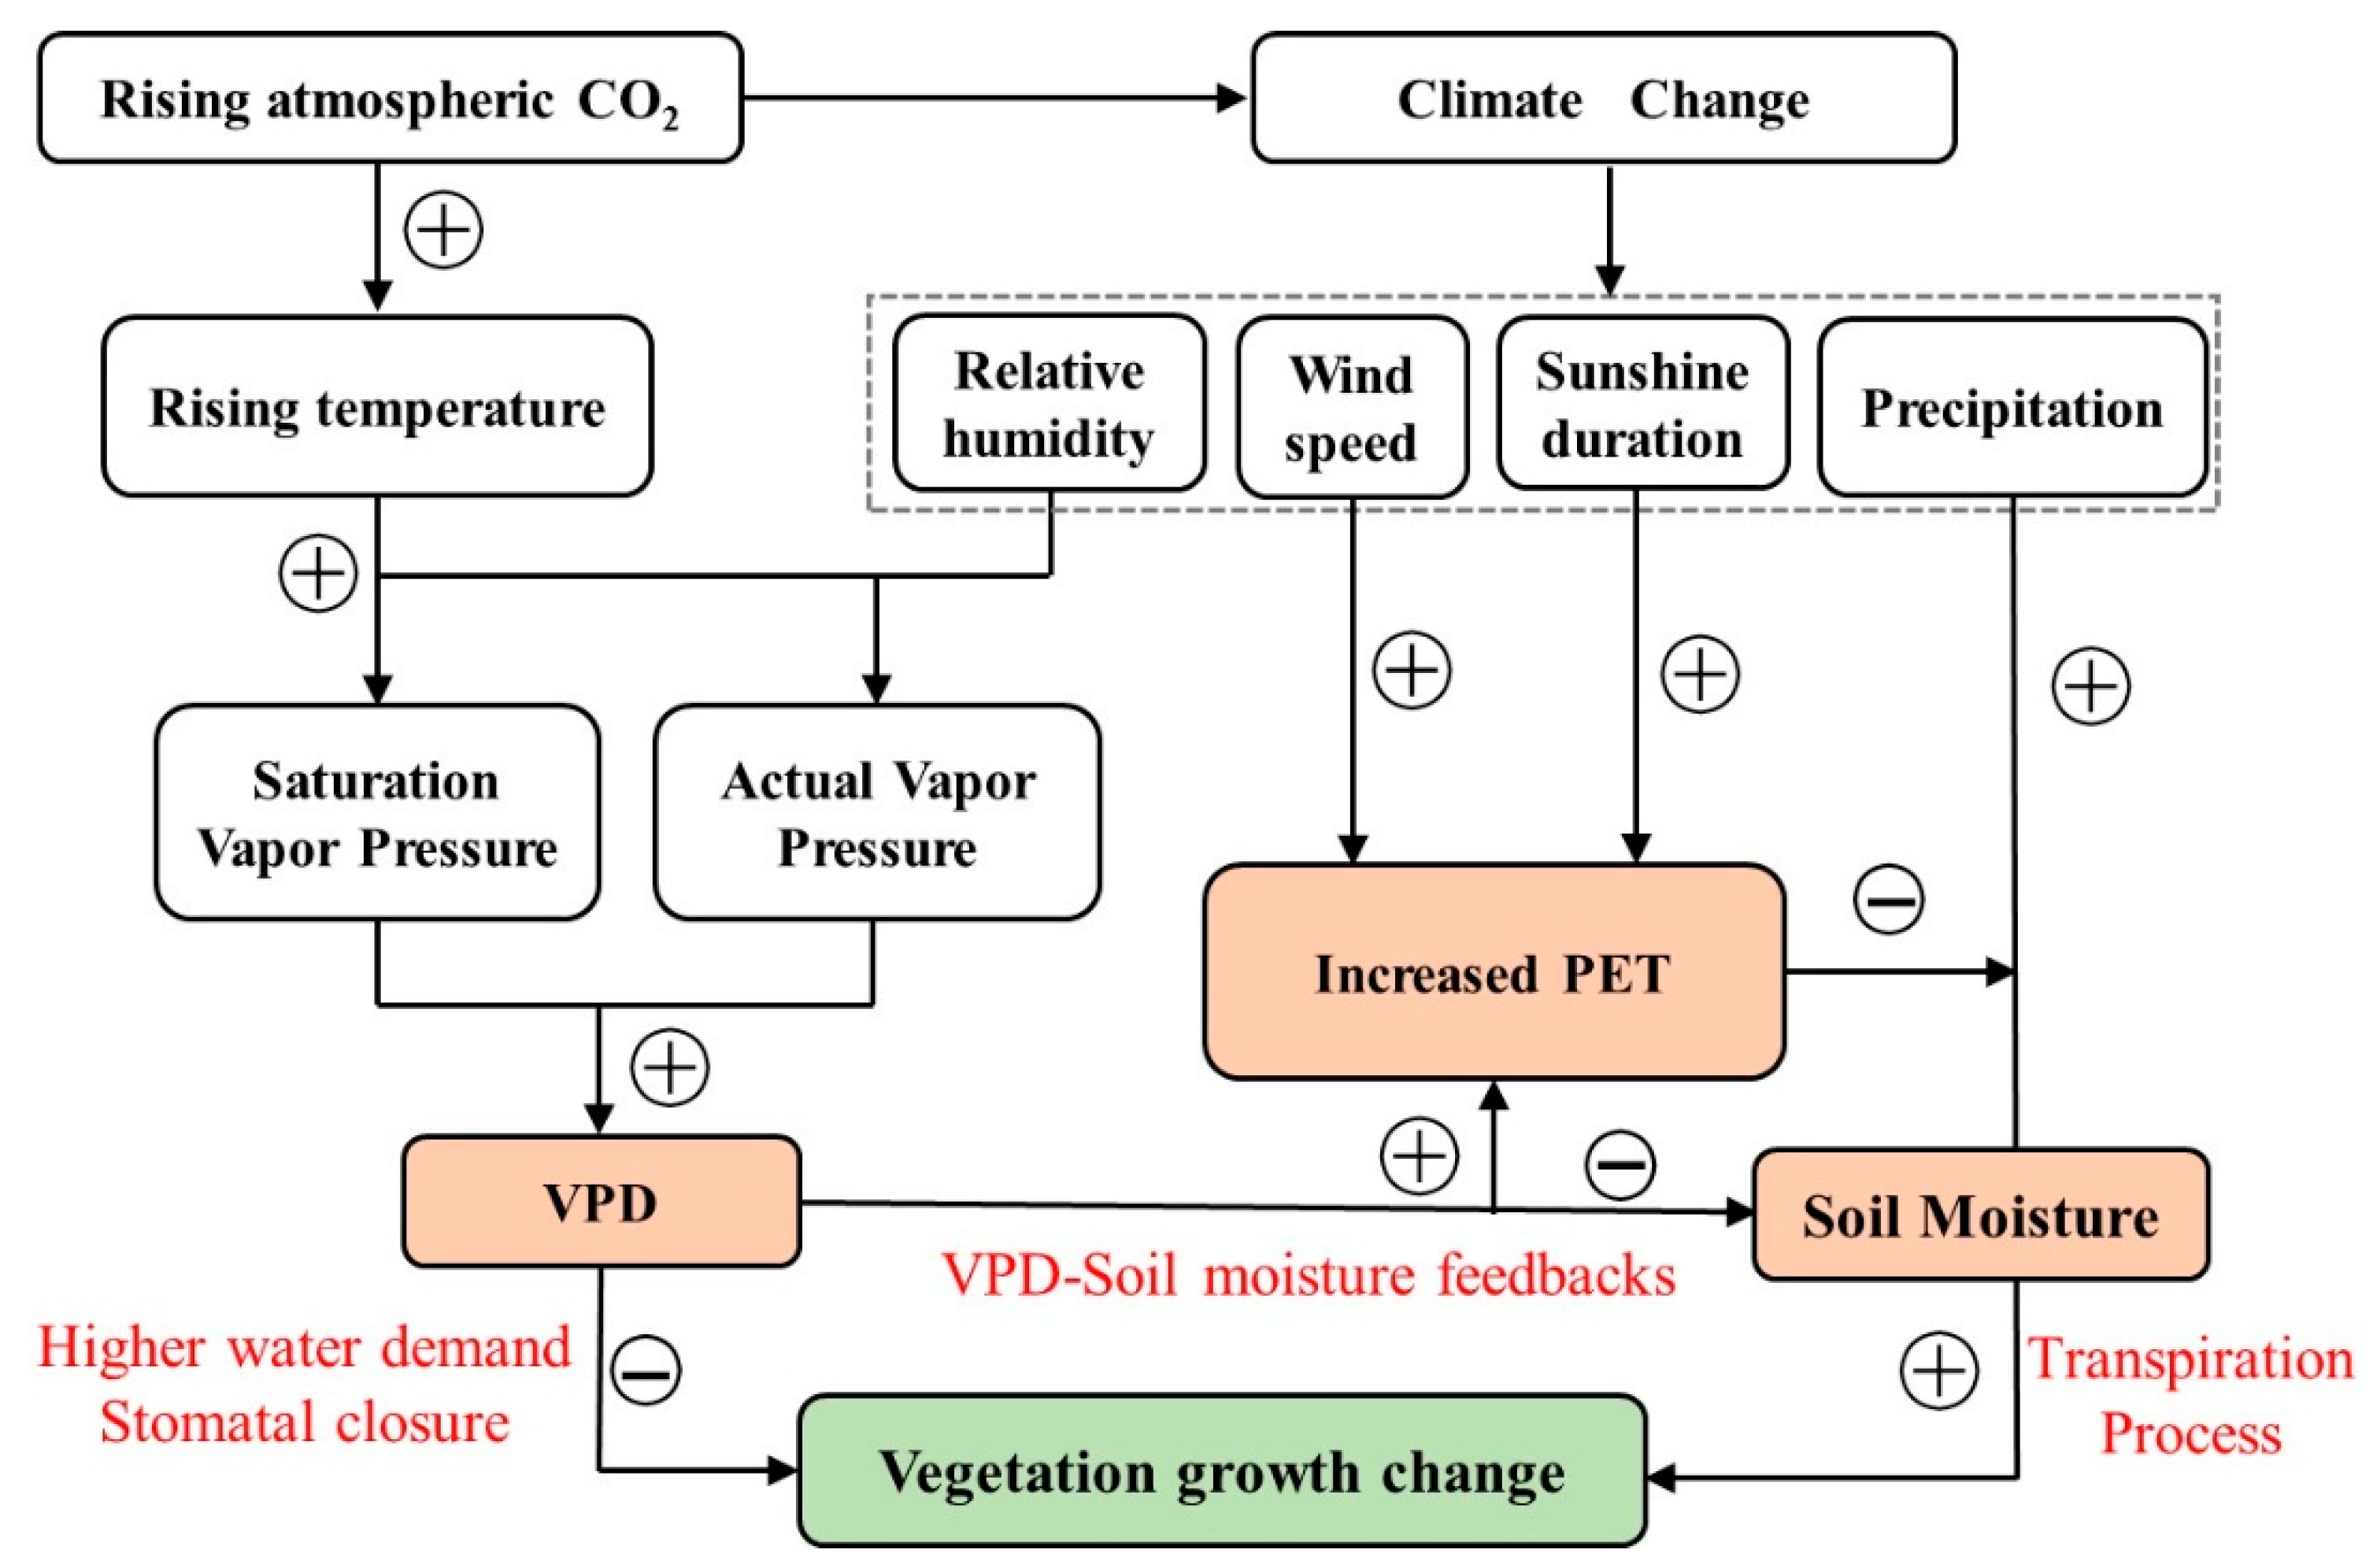
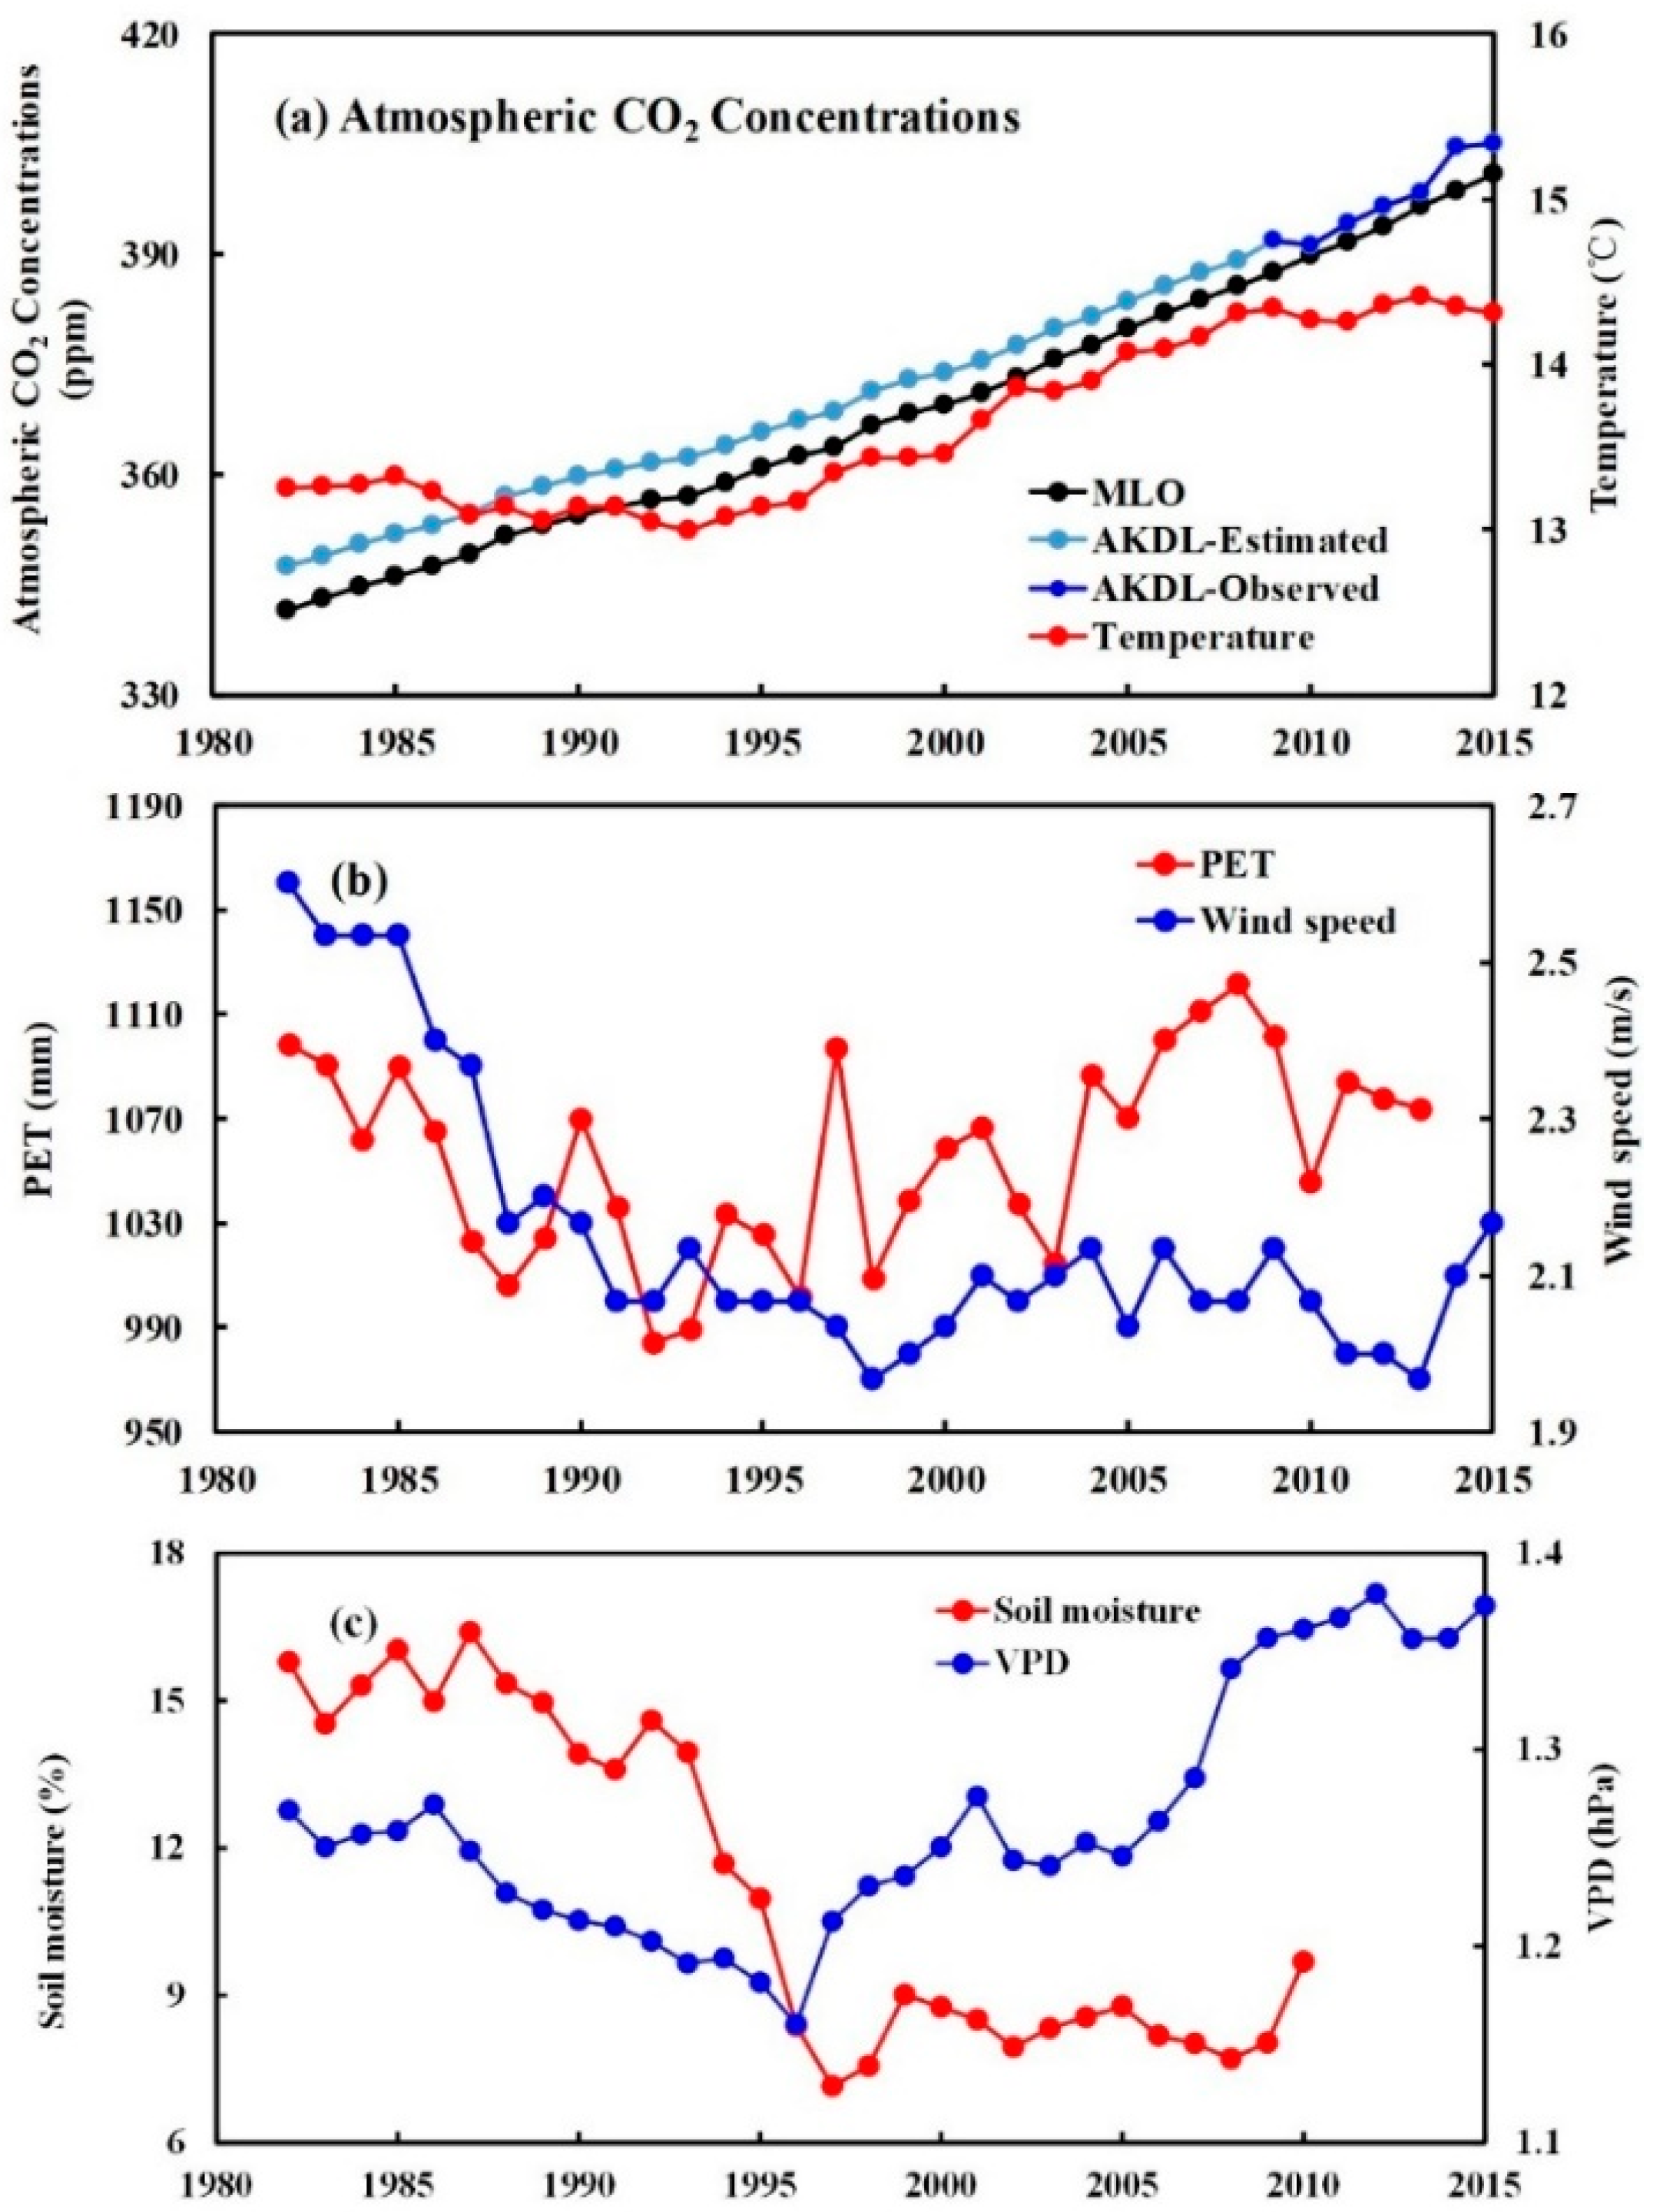
Figure 14 describes the mechanisms with which VPD, among other climatic variables, affects vegetation growth. Vegetation growth is strongly influenced by climate change and global warming [15,51]. The rising average global temperature is largely related to increasing atmospheric CO2 concentrations [45]. Previous studies have suggested that the fertilization effect of increasing atmospheric CO2 is a chief driver of vegetation greening in the northern hemisphere [15,27,52]. In addition, a model experiment demonstrated that the atmospheric CO2 concentration, air temperature, and VPD are dominant driving factors in global NDVI variability [12]. In China, rising atmospheric CO2 concentration is a leading driving factor in vegetation greening [15]. Thus, the vegetation is significantly greening in response to the fertilization effects of rising CO2 concentration [52]. The atmospheric CO2 concentration in Xinjiang (Akedala Observatory) is significantly higher than that at the global representative station (Mauna Loa Observatory) using the observed and reconstructed model (Figure 15a). In addition, Yuan et al. [12] found that increased VPD actually reduced global vegetation growth after the late 1990s. Our study also suggests that, after 1996, increased VPD leads to vegetation greening stalls in arid Xinjiang after 1996. The increase in VPD effectively counteracts the fertilization effect of rising CO2 on vegetation growth [12].
Increasing VPD is considered a thermodynamic consequence of rising temperatures, which causes a further increase [53,54]. Potential evapotranspiration (PET) in Xinjiang decreased significantly until the late 1990s, when it reversed to an increasing trend (Figure 15b), which is consistent with pan evaporation rates observed in the arid region of Northwest China [55]. Li et al. [55] also found contrasting trends in wind speed and VPD after the late 1990s, both contributing to the increase in PET. Growing season precipitation in Xinjiang showed a minor overall increasing trend after the late 1990s. With concurrent decreases in annual precipitation, the observed increase in PET leads to a net loss of soil moisture and exacerbates the ecological effects of arid climates [37,53,54] (Figure 15c). Increased VPD increases evaporative water loss, which triggers plant stomatal closure under elevated CO2 [56]. Global VPD and soil moisture have a strong positive coupling relationship, implying a high probability of co-occurring soil drought (low soil moisture) and atmospheric aridity (high VPD) [57], two physiological stressors known to affect vegetation mortality. We also found that lower soil moisture was accompanied by higher VPD in Xinjiang from 1982–2015 (Figure 15c). Soil moisture and VPD stresses may limit plant stomatal conductance and drive vegetation mortality [58]. The fertilization effect of rising CO2 concentration (Figure 15a) may trigger a vegetation greening trend, but increased VPD may offset this effect; thus, vegetation greening stalls or leads to vegetation mortality in arid Xinjiang, China.
5. Conclusions and Recommendation
In the Xinjiang region, a significant greening trend (increased NDVI) was observed over the growing season from 1982 to 1996; however, the NDVI remained constant and then stalled from 1997 to 2015. Approximately 50% of the vegetated area exhibited a significantly decreased NDVI trend from 1997 to 2015, especially in naturally vegetated regions. From 1997 to 2015, the partial correlation analysis indicated a significant relationship between growing season NDVI and VPD, when excluding the effects of other climate factors, implying that substantial VPD increases strongly limited NDVI. Using the partial derivative equation method, our study estimates suggest that the growing season NDVI greening stalls were chiefly driven by increasing VPD (contributing 87.57%) during 1997–2015.
This study emphasizes the importance of increased VPD in the vegetation greening trends and as a driver of vegetation stalls. However, their mechanisms of action remain unclear. Thus, there is a need to further evaluate the mechanisms driving vegetation change in response to rising VPD under global warming. Furthermore, more effort should be made to separate the air temperature- or humidity-driven impacts of VPD and its projected changes.
Author Contributions
Conceptualization, M.L. and J.Z.; methodology, M.L.; formal analysis, M.L. and J.G.; writing—original draft preparation, M.L. and J.Z.; writing—review and editing, M.L., J.G. and J.Z.; funding acquisition, J.Z. All authors have read and agreed to the published version of the manuscript.
Funding
This work was funded by the National Natural Science Foundation of China (U1903113), Major Program of National Social Science Foundation of China (No. 17ZDA064), and Xinjiang Tianshan Cedar Project (No. 2020XS04).
Data Availability Statement
The data presented in this study are available on request from the corresponding author or from the reference website.
Acknowledgments
We thank the anonymous reviewers for their original insights. We are also immensely grateful to the editor for their comments on the manuscript.
Conflicts of Interest
The authors declare no conflict of interest.
References
- Li, Z.; Chen, Y.; Li, W.; Deng, H.; Fang, G. Potential impacts of climate change on vegetation dynamics in Central Asia. J. Geophys. Res. Atmos. 2015, 120, 12345–112356. [Google Scholar] [CrossRef]
- Nemani, R.R.; Keeling, C.D.; Hashimoto, H.; Jolly, W.M.; Piper, S.C.; Tucker, C.J.; Myneni, R.B.; Running, S.W. Climate-driven increases in global terrestrial net primary production from 1982 to 1999. Science 2003, 300, 1560–1563. [Google Scholar] [CrossRef] [PubMed] [Green Version]
- Acreman, M.C.; Blake, J.R.; Booker, D.J.; Harding, R.J.; Reynard, N.; Mountford, J.O.; Stratford, C.J. A simple framework for evaluating regional wetland ecohydrological response to climate change with case studies from Great Britain. Ecohydrology 2009, 2, 1–17. [Google Scholar] [CrossRef]
- Xu, L.; Myneni, R.B.; Iii, F.; Callaghan, T.V.; Pinzon, J.E.; Tucker, C.J.; Zhu, Z.; Bi, J.; Ciais, P.; Tmmervik, H. Temperature and vegetation seasonality diminishment over northern lands. Nat. Clim. Chang. 2013, 3, 581–586. [Google Scholar] [CrossRef] [Green Version]
- Lee, X.; Goulden, M.L.; Hollinger, D.Y.; Barr, A.; Black, T.A.; Bohrer, G.; Zhao, L. Observed increase in local cooling effect of deforestation at higher latitudes. Nature 2011, 479, 384–387. [Google Scholar] [CrossRef] [PubMed]
- Peng, S.S.; Piao, S.; Zeng, Z.; Ciais, P.; Zhou, L.; Li, L.Z.; Myneni, R.B.; Yin, Y.; Zeng, H. Afforestation in China cools local land surface temperature. Proc. Natl. Acad. Sci. USA 2014, 111, 2915–2919. [Google Scholar] [CrossRef] [Green Version]
- Zhu, P.; Zhuang, Q.; Ciais, P.; Welp, L.; Li, W.; Xin, Q. Elevated atmospheric CO2 negatively impacts photosynthesis through radiative forcing and physiology-mediated climate feedbacks. Geophys. Res. Lett. 2017, 44, 1956–1963. [Google Scholar] [CrossRef] [Green Version]
- Tucker, C.J. Red and photographic infrared linear combinations for monitoring vegetation. Remote Sens. Environ. 1979, 8, 127–150. [Google Scholar] [CrossRef] [Green Version]
- Piao, S.; Fang, J.; Zhou, L.; Guo, Q.; Henderson, M.; Ji, W.; Li, Y.; Tao, S. Interannual variations of monthly and seasonal normalized difference vegetation index (NDVI) in China from 1982 to 1999. J. Geophys. Res. Atmos. 2003, 108, 4401. [Google Scholar] [CrossRef]
- Liu, D.; Wang, T.; Yang, T.; Yan, Z.; Liu, Y.; Zhao, Y.; Piao, S. Deciphering impacts of climate extremes on Tibetan grasslands in the last fifteen years. Sci. Bull. 2019, 64, 446. [Google Scholar] [CrossRef] [Green Version]
- Zhao, W.; Hu, Z.; Guo, Q.; Wu, G.; Chen, R.; Li, S. Contributions of climatic factors to inter-annual variability of vegetation index in northern China grasslands. J. Clim. 2020, 33, 175–183. [Google Scholar] [CrossRef]
- Yuan, W.; Zheng, Y.; Piao, S.; Ciais, P.; Lombardozzi, D.; Wang, Y.; Yang, S. Increased atmospheric vapor pressure deficit reduces global vegetation growth. Sci. Adv. 2019, 5, eaax1396. [Google Scholar] [CrossRef] [PubMed] [Green Version]
- Goetz, S.J.; Bunn, A.G.; Fiske, G.J.; Houghton, R.A. Satellite—Observed photosynthetic trends across boreal North America associated with climate and fire disturbance. Proc. Natl. Acad. Sci. USA 2005, 102, 13521–13525. [Google Scholar] [CrossRef] [Green Version]
- Zhu, Z.; Piao, S.; Myneni, R.B.; Huang, M.; Zeng, Z.; Canadell, J.G.; Ciais, P.; Sitch, S.; Friedlingstein, P.; Arneth, A.; et al. Greening of the Earth and its drivers. Nat. Clim. Chang. 2016, 6, 791–795. [Google Scholar] [CrossRef]
- Piao, S.; Yin, G.; Tan, J.; Cheng, L.; Huang, M.; Li, Y.; Liu, R.; Mao, J.; Myneni, R.B.; Peng, S.; et al. Detection and attribution of vegetation greening trend in China over the last 30 years. Glob. Chang. Biol. 2015, 21, 1601–1609. [Google Scholar] [CrossRef]
- Pan, N.; Feng, X.; Fu, B.; Wang, S.; Ji, F.; Pan, S. Increasing global vegetation browning hidden in overall vegetation greening: Insights from time–Varying trends. Remote Sens. Environ. 2018, 214, 59–72. [Google Scholar] [CrossRef]
- Park, T.; Ganguly, S.; Tommervik, H.; Euskirchen, E.S.; Karlsen, S.R.; Brovkin, V.; Nemani, R.R.; Myneni, R.B. Changes in growing season duration and productivity of northern vegetation inferred from long-term remote sensing data. Environ. Res. Lett. 2016, 11, 084001. [Google Scholar] [CrossRef]
- Wang, X.; Piao, S.; Xu, X.; Ciais, P.; MacBean, N.; Myneni, R.B.; Li, L. Has the advancing onset of spring vegetation green-up slowed down or changed abruptly over the last three decades. Glob. Ecol. Biogeogr. 2015, 24, 621–631. [Google Scholar] [CrossRef]
- Donohue, R.J.; Roderick, M.L.; McVicar, T.R.; Farquhar, G.D. Impact of CO2 fertilization on maximum foliage cover across the globe’s warm, arid environments. Geophys. Res. Lett. 2013, 40, 3031–3035. [Google Scholar] [CrossRef] [Green Version]
- Fensholt, R.; Langanke, T.; Rasmussen, K.; Reenberg, A.; Prince, S.D.; Tucker, C.; Wessels, K. Greenness in semi-arid areas across the globe 1981–2007—An Earth Observing Satellite based analysis of trends and drivers. Remote Sens. Environ. 2012, 121, 144–158. [Google Scholar] [CrossRef]
- Andela, N.; Liu, Y.Y.; van Dijk, A.I.J.M.; de Jeu, R.A.M.; McVicar, T.R. Global changes in dryland vegetation dynamics (1988–2008) assessed by satellite remote sensing: Comparing a new passive microwave vegetation density record with reflective greenness data. Biogeosciences 2013, 10, 6657–6676. [Google Scholar] [CrossRef] [Green Version]
- Piao, S.; Wang, X.; Park, T.; Chen, C.; Lian, X.U.; He, Y.; Bjerke, J.W.; Chen, A.; Ciais, P.; Tømmervik, H.; et al. Characteristics, drivers and feedbacks of global greening. Nat. Rev. Earth Environ. 2020, 1, 14–27. [Google Scholar] [CrossRef]
- Wang, Y.F.; Shen, Y.J.; Chen, Y.N.; Guo, Y. Vegetation dynamics and their response to hydroclimatic factors in the Tarim River Basin, China. Ecohydrology 2013, 6, 927–936. [Google Scholar] [CrossRef]
- Chen, Y.N.; Li, Z.; Fan, Y.; Wang, H.; Deng, H. Progress and prospects of climate change impacts on hydrology in the arid region of northwest China. Environ. Res. 2016, 139, 11–19. [Google Scholar] [CrossRef] [PubMed]
- Yao, J.Q.; Chen, Y.N.; Zhao, Y.; Mao, W.; Xu, X.; Liu, Y.; Yang, Q. Response of vegetation NDVI to climatic extremes in the arid region of Central Asia: A case study in Xinjiang, China. Theor. Appl. Climatol. 2018, 131, 1503–1515. [Google Scholar] [CrossRef]
- Kaufmann, R.K.; Zhou, L.; Tucker, C.J.; Slayback, D.; Shabanov, N.V.; Myneni, R.B. Reply to Comment on ‘Variations in northern vegetation activity inferred from satellite data of vegetation index during 1981–1999 by JR Ahlbeck. J. Geophys. Res. 2002, 107, ACH-7. [Google Scholar] [CrossRef]
- Ahlbeck, J.R. Comment on ‘Variations in northern vegetation activity inferred from satellite data of vegetation index during 1981–1999’ by L. Zhou et al. J. Geophys. Res. Atmos. 2002, 107, ACH-9. [Google Scholar] [CrossRef]
- Zhao, M.; Running, S.W. Drought-Induced Reduction in Global Terrestrial Net Primary Production from 2000 through 2009. Science 2010, 329, 940–943. [Google Scholar] [CrossRef] [Green Version]
- Chen, Y.; Zhang, X.; Fang, G.; Li, Z.; Wang, F.; Qin, J.; Sun, F. Potential risks and challenges of climate change in the arid region of northwestern China. Reg. Sustain. 2021, 1, 20–30. [Google Scholar] [CrossRef]
- Liu, L.; Gudmundsson, L.; Hauser, M.; Qin, D.; Li, S.; Seneviratne, S.I. Soil moisture dominates dryness stress on ecosystem production globally. Nat. Commun. 2020, 11, 1–9. [Google Scholar] [CrossRef]
- Peng, S.; Piao, S.; Shen, Z.; Ciais, P.; Sun, Z.; Chen, S.; Bacourc, C.; Philippe, P.; Chen, A. Precipitation amount, seasonality and frequency regulate carbon cycling of a semi-arid grassland ecosystem in Inner Mongolia, China: A modeling analysis. Agric. For. Meteorol. 2013, 178, 46–55. [Google Scholar] [CrossRef]
- Chen, X.J.; Mo, X.G.; Hu, S.; Liu, S.X. Contributions of climate change and human activities to ET and GPP trends over North China plain from 2000 to 2014. J. Geogr. Sci. 2017, 27, 661–680. [Google Scholar] [CrossRef]
- Fang, B.J.; Lei, H.M.; Zhang, Y.C.; Quan, Q.; Yang, D.W. Spatio-temporal patterns of evapotranspiration based on upscaling eddy covariance measurements in the dryland of the North China plain. Agric. For. Meteorol. 2020, 281, 107844. [Google Scholar] [CrossRef]
- Xie, S.; Mo, X.; Hu, S.; Liu, S. Contributions of climate change, elevated atmospheric CO2 and human activities to ET and GPP trends in the Three-North Region of China. Agric. For. Meteorol. 2020, 295, 108183. [Google Scholar] [CrossRef]
- Shi, S.; Yu, J.; Wang, F.; Wang, P.; Jin, K. Quantitative contributions of climate change and human activities to vegetation changes over multiple time scales on the loess plateau. Sci. Total Environ. 2020, 755, 142419. [Google Scholar] [CrossRef]
- Naeem, S.; Zhang, Y.; Zhang, X.; Tian, J.; Abbas, S.; Luo, L.; Meresa, H.K. Both climate and socioeconomic drivers contribute in vegetation greening of the loess plateau. Sci. Bull. 2021, 66, 1160–1163. [Google Scholar] [CrossRef]
- Yao, J.; Zhao, Y.; Chen, Y.; Yu, X.; Zhang, R. Multi-scale assessments of droughts: A case study in Xinjiang, China. Sci. Total Environ. 2018, 630, 444–452. [Google Scholar] [CrossRef]
- Yao, J.; Chen, Y.; Guan, X.; Zhao, Y.; Chen, J.; Mao, W. Recent climate and hydrological changes in a mountain–basin system in Xinjiang, China. Earth-Sci. Rev. 2022, 226, 103957. [Google Scholar] [CrossRef]
- Zheng, K.; Wei, J.Z.; Pei, J.Y.; Cheng, H.; Zhang, X.L.; Huang, F.Q.; Li, F.M.; Ye, J.S. Impacts of climate change and human activities on grassland vegetation variation in the Chinese Loess Plateau. Sci. Total Environ. 2019, 660, 236–244. [Google Scholar] [CrossRef]
- Li, Z.; Yan, Z.W.; Zhu, Y.N.; Freychet, N.; Tett, S. Homogenized daily relative humidity series in China during 1960–2017. Adv. Atmos. Sci. 2020, 37, 318–327. [Google Scholar] [CrossRef] [Green Version]
- Allen, R.G.; Pereira, L.S.; Raes, D.; Smith, M. Crop Evapotranspiration-guidelines for Computing Crop Water Requirements-FAO Irrigation and Drainage Paper 56. 300. FAO 1998, 300, D05109. [Google Scholar]
- Yadolah, D. The Concise Encyclopedia of Statistics; Springer: New York, NY, USA, 2008. [Google Scholar]
- Roderick, M.L.; Rotstayn, L.D.; Farquhar, G.D.; Hobbins, M.T. On the attribution of changing pan evaporation. Geophys. Res. Lett. 2007, 34, L17403. [Google Scholar] [CrossRef] [Green Version]
- Schaake, J.C. From Climate to flow. In Climate Change and U.S. Water Resources; Waggoner, P.E., Ed.; John Wiley: New York, NY, USA, 1990; pp. 177–206. [Google Scholar]
- IPCC. Climate Change and Land: An IPCC Special Report on Climate Change, Desertification, Land Degradation, Sustainable Land Management, Food Security, and Greenhouse Gas fluxes in Terrestrial (Summary for Policymakers) Ecosystems; IPCC: Geneva, Switzerland, 2019. [Google Scholar]
- Bohren, C.F.; Albrecht, B.A.; Schroeder, D.V. Atmospheric thermodynamics. Am. J. Phys. 2000, 68, 1159–1160. [Google Scholar] [CrossRef]
- Huang, J.; Yu, H.; Guan, X.; Wang, G.; Guo, R. Accelerated dryland expansion under climate change. Nat. Clim. Chang. 2015, 6, 166–171. [Google Scholar] [CrossRef]
- Yao, J.; Chen, Y.; Zhao, Y.; Guan, X.; Mao, W.; Yang, L. Climatic and associated atmospheric water cycle changes over the Xinjiang, China. J. Hydrol. 2020, 585, 124823. [Google Scholar] [CrossRef]
- Li, M.; Yao, J.Q.; Guan, J.Y.; Zheng, J.H. Observed changes in vapor pressure deficit suggest a systematic drying of the atmosphere in Xinjiang of China. Atmos Res. 2020, 248, 105199. [Google Scholar] [CrossRef]
- Piao, S.; Nan, H.; Huntingford, C.; Ciais, P.; Friedlingstein, P.; Sitch, S.; Chen, A. Evidence for a weakening relationship between interannual temperature variability and northern vegetation activity. Nat. Commun. 2014, 5, 5018. [Google Scholar] [CrossRef] [Green Version]
- Li, M.; Yao, J.; Guan, J.; Zheng, J. Vegetation Browning Trends in Spring and Autumn over Xinjiang, China, during the Warming Hiatus. Remote Sens. 2022, 14, 1298. [Google Scholar] [CrossRef]
- Norby, R.J.; DeLucia, E.H.; Gielen, B.; Calfapietra, C.; Giardina, C.P.; King, J.S.; Oren, R. Forest response to elevated CO2 is conserved across a broad range of productivity. Proc. Natl. Acad. Sci. USA 2005, 102, 18052–18056. [Google Scholar] [CrossRef] [Green Version]
- Roderick, M.L.; Greve, P.; Farquhar, G.D. On the assessment of aridity with changes in atmospheric CO2. Water Resour. Res. 2015, 51, 5450–5463. [Google Scholar] [CrossRef] [Green Version]
- Sherwood, S.; Fu, Q. A drier future? Science 2014, 343, 737–739. [Google Scholar] [CrossRef] [PubMed]
- Li, Z.; Chen, Y.; Shen, Y.; Liu, Y.; Zhang, S. Analysis of changing pan evaporation in the arid region of Northwest China. Water Resour. Res. 2013, 49, 2205–2212. [Google Scholar] [CrossRef]
- Lian, X.; Piao, S.; Chen, A.; Huntingford, C.; Fu, B.; Li, L.Z.; Roderick, M.L. Multifaceted characteristics of dryland aridity changes in a warming world. Nat. Rev. Earth Environ. 2021, 2, 232–250. [Google Scholar] [CrossRef]
- Zhou, S.; Williams, A.P.; Berg, A.M.; Cook, B.I.; Zhang, Y.; Hagemann, S.; Gentine, P. Land–Atmosphere feedbacks exacerbate concurrent soil drought and atmospheric aridity. Proc. Natl. Acad. Sci. USA 2019, 116, 18848–18853. [Google Scholar] [CrossRef] [Green Version]
- Will, R.E.; Wilson, S.M.; Zou, C.B.; Hennessey, T.C. Increased vapor pressure deficit due to higher temperature leads to greater transpiration and faster mortality during drought for tree seedlings common to the forest-grassland ecotone. New Phytol. 2013, 200, 366–374. [Google Scholar] [CrossRef]
Figure 1.
Meteorological stations in Xinjiang.

Figure 2.
The major methodological approaches and steps applied in this study.

Figure 3.
Cumulative anomaly (a) and 5-year moving average (b) of NDVI over the growing season. Blue and red lines represent the linear fit before and after the TP years.
Figure 3.
Cumulative anomaly (a) and 5-year moving average (b) of NDVI over the growing season. Blue and red lines represent the linear fit before and after the TP years.

Figure 4.
Change in the NDVI trends over Xinjiang, China, from 1982 to 2015. (a) Mean monthly NDVI trends between the two periods of 1982–1996 and 1997–2015. (b,c) Time series of NDVI over the GS and JJA.
Figure 4.
Change in the NDVI trends over Xinjiang, China, from 1982 to 2015. (a) Mean monthly NDVI trends between the two periods of 1982–1996 and 1997–2015. (b,c) Time series of NDVI over the GS and JJA.

Figure 5.
NDVI trends (left) and M–K significance test (right) over the GS in Xinjiang, China, from 1982 to 2015 (a,b); as well as the two periods of 1982–1996 (c,d) and 1997–2015 (e,f).
Figure 5.
NDVI trends (left) and M–K significance test (right) over the GS in Xinjiang, China, from 1982 to 2015 (a,b); as well as the two periods of 1982–1996 (c,d) and 1997–2015 (e,f).

Figure 6.
NDVI trends (left) and M–K significance test (right) over the JJA in Xinjiang, China, from 1982 to 2015 (a,b); as well as the two periods of 1982–1996 (c,d) and 1997–2015 (e,f).
Figure 6.
NDVI trends (left) and M–K significance test (right) over the JJA in Xinjiang, China, from 1982 to 2015 (a,b); as well as the two periods of 1982–1996 (c,d) and 1997–2015 (e,f).

Figure 7.
The PCC between NDVI and climate variables over the GS and JJA season during 1982-2015 (a), and comparison of the PCC between NDVI and climate variables over the GS (b) and JJA (c) season during the two periods of 1982–1996 and 1997–2015.
Figure 7.
The PCC between NDVI and climate variables over the GS and JJA season during 1982-2015 (a), and comparison of the PCC between NDVI and climate variables over the GS (b) and JJA (c) season during the two periods of 1982–1996 and 1997–2015.

Figure 8.
5-year moving average of VPD over the GS (a) and JJA (b). Blue and red lines represent the linear fit before and after the TP years.
Figure 8.
5-year moving average of VPD over the GS (a) and JJA (b). Blue and red lines represent the linear fit before and after the TP years.

Figure 9.
Change in the VPD trends over Xinjiang, China, from 1982 to 2015. (a,b) Time series of VPD over the GS and JJA. (c) Mean monthly VPD trends between the two periods of 1982–1996 and 1997–2015.
Figure 9.
Change in the VPD trends over Xinjiang, China, from 1982 to 2015. (a,b) Time series of VPD over the GS and JJA. (c) Mean monthly VPD trends between the two periods of 1982–1996 and 1997–2015.

Figure 10.
Spatial distributions of the VPD trends over Xinjiang, China, from 1982 to 2015 (a) and the two periods of 1982–1996 (b) and 1997–2015 (c). A solid circle indicates a 95% confidence level. (d) The difference of VPD trends before and after TP years. Positive values denote the higher VPD trends after TP years.

Figure 11.
Relationship between VPD (kPa) and relative humidity (%) as a function of air temperature (a). The VPD represents the difference between es (red line, 100% humidity) and ea (blue line, relative humidity remains constant at 20%) at a given temperature. Panels (b,c) show the long-term temperature changes, humidity, es, and ea from 1982 to 2015.

Figure 12.
Individual contributions of selected climate variables to NDVI changes over the GS (a) and JJA season (b) during the two periods. Four climate variables are included: VPD, precipitation, wind speed, and sunshine. The figure to the right illustrates the NDVI changes of the two periods.
Figure 12.
Individual contributions of selected climate variables to NDVI changes over the GS (a) and JJA season (b) during the two periods. Four climate variables are included: VPD, precipitation, wind speed, and sunshine. The figure to the right illustrates the NDVI changes of the two periods.

Figure 13.
The mean contribution of climatic factors to NDVI change over the GS (a) and JJA season (b) during the two periods.
Figure 13.
The mean contribution of climatic factors to NDVI change over the GS (a) and JJA season (b) during the two periods.

Figure 14.
Schematic representation of the impacts of climatic variables on vegetation growth under the effects of increasing levels of atmospheric CO2. Circled symbols of ‘−’ and ‘+’ represent a negative and positive impact, respectively.
Figure 14.
Schematic representation of the impacts of climatic variables on vegetation growth under the effects of increasing levels of atmospheric CO2. Circled symbols of ‘−’ and ‘+’ represent a negative and positive impact, respectively.

Figure 15.
The long-term changes in atmospheric CO2 concentrations and other climatic variables over the GS in Xinjiang from 1982 to 2015. (a) Atmospheric CO2 concentrations at the Mauna Loa Observatory (MLO) and Akedala Observatory (AKDL), and air temperature; (b) PET (modified according to Yao et al. [38]) and wind speed; (c) soil moisture (modified according to Yao et al. [37]) and VPD, respectively.

Publisher’s Note: MDPI stays neutral with regard to jurisdictional claims in published maps and institutional affiliations. |
© 2022 by the authors. Licensee MDPI, Basel, Switzerland. This article is an open access article distributed under the terms and conditions of the Creative Commons Attribution (CC BY) license (https://creativecommons.org/licenses/by/4.0/).
Share and Cite
MDPI and ACS Style
Li, M.; Guan, J.; Zheng, J. Climate Drivers Contribute in Vegetation Greening Stalls of Arid Xinjiang, China: An Atmospheric Water Drying Effect. Water 2022, 14, 2019. https://doi.org/10.3390/w14132019
AMA Style
Li M, Guan J, Zheng J. Climate Drivers Contribute in Vegetation Greening Stalls of Arid Xinjiang, China: An Atmospheric Water Drying Effect. Water. 2022; 14(13):2019. https://doi.org/10.3390/w14132019
Chicago/Turabian StyleLi, Moyan, Jingyun Guan, and Jianghua Zheng. 2022. "Climate Drivers Contribute in Vegetation Greening Stalls of Arid Xinjiang, China: An Atmospheric Water Drying Effect" Water 14, no. 13: 2019. https://doi.org/10.3390/w14132019
Note that from the first issue of 2016, this journal uses article numbers instead of page numbers. See further details here.