
Analysis on the Disaster Mechanism of “8.12” Flash Flood in Liulin River Basin
by
 ,
,
Sijia Hao
1,2, 
Wenchuan Wang
1,
Qiang Ma
2,*,
Changzhi Li
2,
Lei Wen
3,
Jiyang Tian
2 and
Changjun Liu
2 1
College of Water Resources, North China University of Water Resources and Electric Power, Zhengzhou 450046, China
2
China Institute of Water Resources and Hydropower Research, Beijing 100038, China
3
College of Hydrology and Water Resources, Hohai University, Nanjing 210098, China
*
Author to whom correspondence should be addressed.
Water 2022, 14(13), 2017; https://doi.org/10.3390/w14132017
Submission received: 11 May 2022
/
Revised: 18 June 2022
/
Accepted: 21 June 2022
/
Published: 24 June 2022
(This article belongs to the Special Issue Flash Floods: Forecasting, Monitoring and Mitigation Strategies)
Abstract
:Hubei province is located in the center of China with 56% total area characterized with mountainous area. Thus, flash flood caused by extreme rainfall has become one of the significant obstacles that highly affect the social and economic development of the province. In order to scientifically understand the mechanism of flash flood disasters and provide technological support to the local flood prevention and control work, the IWHR designed and developed a new distributed hydrological model named China-FFMS that can simulate the evolution of natural disasters and make an assessment by setting the flood water sources in line with the flow discharge. The FFMS was further applied to simulate the 8.12 flash flood disaster that occurred in the Liulin county of Hubei province on 12 August (“8.12”) and fed by the data collected from the national flash flood disaster investigation and assessment. The calculated peak flow was 666.22 m3/s with an error of +13% compared with postdisaster investigation data (589 m3/s). The results showed that using a multisourced modelling approach, e.g., mixing spatiotemporal variables and sources, to simulate the flash flood process was able to accurately reproduce the flood process and the consistence of the flow discharge, thereby explaining the underlying reason of the disaster formation and evolution. Regarding the case of the Liulin county, the main factor leading to the disaster was the overlapped peak flow where the Dunne flood peak of three different tributaries from the upper reach met together at the same time. Moreover, the peak flow of the Lianhua river at the downstream of Liulin County also arrived at the same time as the upstream peak, which obstructed the flood progress and increased the damage of the disaster. According to the analysis, several suggestions and recommendations are proposed such as the improvement of the forecast and early warning system of the upstream areas, the optimization of the current flood defense plan, and the enhancement of the residents’ awareness of flash flood disasters.
1. Introduction
Since the 21st century, climate change has led to an increase of the frequency and intensity of heavy rainfall in mountainous areas where the demography is expanding due to counter urbanization and the amount of population under risk rises. Motivated by this, the research on flash floods has attracted an increasing interest in both China and western countries [1,2,3,4]. For example, on 12 August 2021, a severe flash flood occurred in Liulin Town, Suixian County, Suizhou City, Hubei Province, affecting more than 12,000 people and destroying 474 hectares of crops and over 160 houses. It seriously undermined local socioeconomic development with a direct economic loss of about 226 million yuan [5,6]. Studying the process and mechanism of the “8.12” flash flood in the Liulin river basin can provide a positive reference for flood control and disaster reduction in the local and other similar areas prone to flash floods.
A flash flood is highlighted by its special characteristics of highly unexpected occurrence, destructive impact, and short duration. Additionally, it is usually accompanied by secondary disasters such as landslides and debris flows; therefore, it is likely to change the landform of the affected areas. However, disaster formation monitoring and postdisaster investigation and analysis are difficult [7,8,9]. There have been a lot of studies on the simulation of flash floods and the analysis of disaster mechanism [10,11,12,13,14]. For example, Yang et al. [15] investigated the disaster mechanism of the 5·16 flash floods in the Houshan Mountains of Sanming City, Fujian Province by using the flood calculation method, and analyzed the effect of flash flood magnified by culvert blockage and slope excavation. Carle et al. [16] compared different early warning systems based on aggregated rainfall and a distributed hydrological model for regional flash flood control and found that a distributed simulation has certain advantages in the analysis of flash floods associated with a rapid water level rise. Based on the measured rainfall data, Sun et al. [17] used the kinematic-wave geomorphological instantaneous unit hydrograph model to analyze the 8.16 flash flood in the Zhongdu river basin, Sichuan Province, and concluded that the disaster was caused by regional heavy rainfall combined with human activities. Braud et al. [18] investigated the 2002 flash flood in southern France by using distributed hydrological models and identified rainfall, soil saturation, and surface soil thickness as major factors of the runoff of flash floods. They suggested that a detailed runoff description is essential to increase the accuracy of the model simulations. Based on an examination of high temporal and spatial resolution data of 25 typical flash floods across Europe, Marchi et al. [19] revealed that flash floods in Europe are seasonal and significantly affected by initial soil moisture.
To summarize, a distributed hydrological model has become the main technical tool to study the mechanism of flash floods. However, most types of this model fail to describe the details of the physical mechanism of runoff generation in river basins, let alone the analysis of the changes in runoff generation and the disaster mechanism of flash floods. This paper adopts the China Flash Flood Modelling System (FFMS) independently developed by the China Institute of Water Resources and Hydropower Research (IWHR) to analyze the “8.12” flash flood in Liulin Town, based on national flash flood investigation results and postdisaster field survey data. A distributed flash flood model with small watersheds of 0.16–1.6 km2 (0.10–0.99 mi2) as the minimum calculation unit was constructed for the detailed analysis and simulation, including disaster formation and runoff changes in the process, so as to analyze the amplification effect and reveal the disaster mechanism, thereby providing technical support for future flash flood prevention and control in the region.
2. Research Materials
2.1. Study Area
Liulin Town with an administrative area of 197.49 km2 (76.25 mi2) is located in the south of Suixian County, Suizhou City, Hubei Province. The topography of the Liulin basin is dominated by mountains and hills and mainly covered by forests and cultivated land. The average annual rainfall is recorded as 1100 mm (43.3 in) and centralized in the flood season [20]. The section of watershed controlled by Liulin Town covers about 24.29 km2 (9.38 mi2) that belongs to the Langhe River basin. The main river channel is about 8.47 km (5.26 mi) with a steep gradient of 8‰, where 19 tributaries including Jinyin, Taiping and Baishuwan coalesce. In the fan-shaped upper river basin of Liulin Town, the main settlements are surrounded by mountains on three sides and located at the bottom of a river valley in a good hydrological condition that is relatively closed, wide, and gentle. However, the flood discharge conditions in the lower reach are poor due to the narrow channel. As a result, there is a high probability for an intensive rainfall during the flood season to lead to flash floods in Liulin Town (Figure 1).
2.2. Data Collection
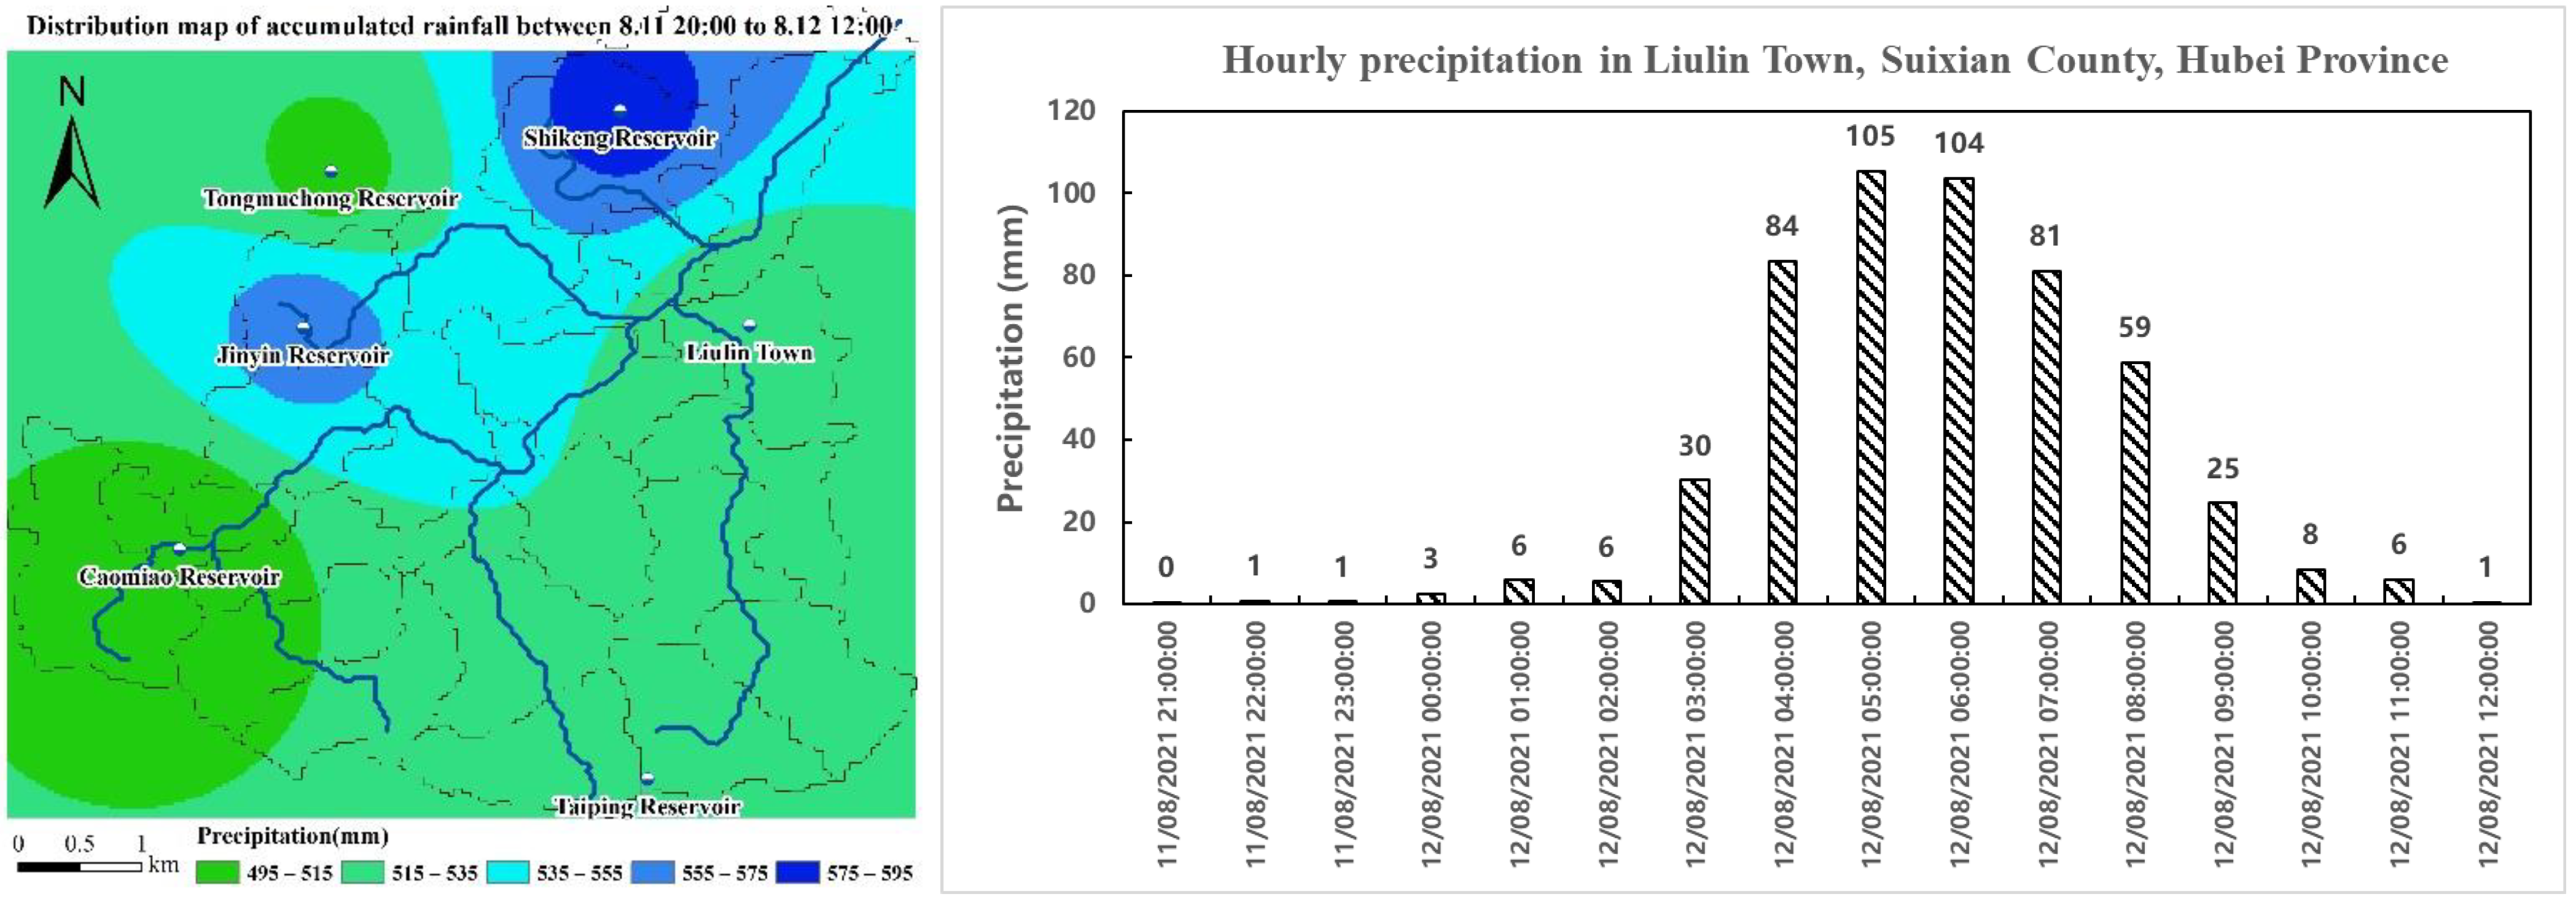
The rainfall data were measured at several reservoir sites around Liulin Town, and the total precipitation in Liulin Town from 21:00 on 11 August to 9:00 on 12 August was 503 mm, where the accumulated precipitation from 4:00 to 7:00 was 373.7 mm (1.23 ft) and the precipitation intensity at 5:00 and 6:00 was 105 mm/hour (14.7 in/h) and 104 mm/hour, respectively, both exceeding the historical record of local measurements [6]. Figure 2 shows the spatial distribution of the accumulated rainfall and hourly rainfall in the drainage area of Liulin Town from 21:00, 11 August to 12:00, 12 August.
There are four rainfall monitoring stations in the drainage area of Liulin Town, which are all small-sized reservoirs, (Grade II) namely Jinyin, Caomiao, Taiping, and Shikeng. Before the occurrence of the “8.12” flash flood, the reservoirs were kept 0.06–1.60 m (0.20–5.25 ft) below the flood limit water level. Then, when the heavy rainfall started, the water levels at Jinyin, Caomiao, and Shikeng all began to rise rapidly, with the flood peak exceeding the historical record high. However, the four reservoirs remained operational and followed the flood-season reservoir schedule and operation plan during the flash flood in Liulin Town. Figure 3 shows the changes of rainfall and water level monitored in each reservoir during the flash flood.
3. Simulation Analysis
3.1. Hydrological Model
The FFMS system developed by IWHR was employed to simulate the “8.12” flash flood disaster. It is a new-generation flood simulation piece of software for small watersheds that integrates the advantages of C++, Fortran, Java, and other computer languages. The design aims at modularization, parameterization, intelligent, visualization and automation based on the national flash flood investigation results [21,22]. FFMS has the characteristic functions of an automatic division of small watersheds, automatic extraction of parameters, modular modeling, and automatic determination of the runoff model based on the attributes of underlying surface of small watersheds. The software architecture and functional modules are as shown in Figure 4. At present, FFMS has already integrated different hydrological models available for use, such as HEC-HMS, PRMS, spatiotemporal variable–source mixed runoff model (SVSMR), and the Xin’anjiang model.
3.2. Simulation Method
In view of the characteristics of flash floods in China, IWHR proposed the SVSMR model for simulating the process of flash floods [23,24]. Through the refined division of catchments with different underlying surface conditions within watersheds, a vertically, horizontally, and temporally mixed runoff model was constructed for simulations and calculations at multiple levels such as data sources, method sources, and runoff sources [25,26,27]. The method for computing infiltration in soil mechanics, which discretized soil moisture in the downward movement of wetting front [28,29,30], was introduced into distributed hydrological simulations. This enabled a detailed description of instantaneous changes of the infiltration capacity of surface soil in the vadose zone during flash floods, thereby realizing the accurate simulation of the runoff mechanism of flash floods. The detailed model simulation method can be found in reference [15].
3.3. Modeling Process
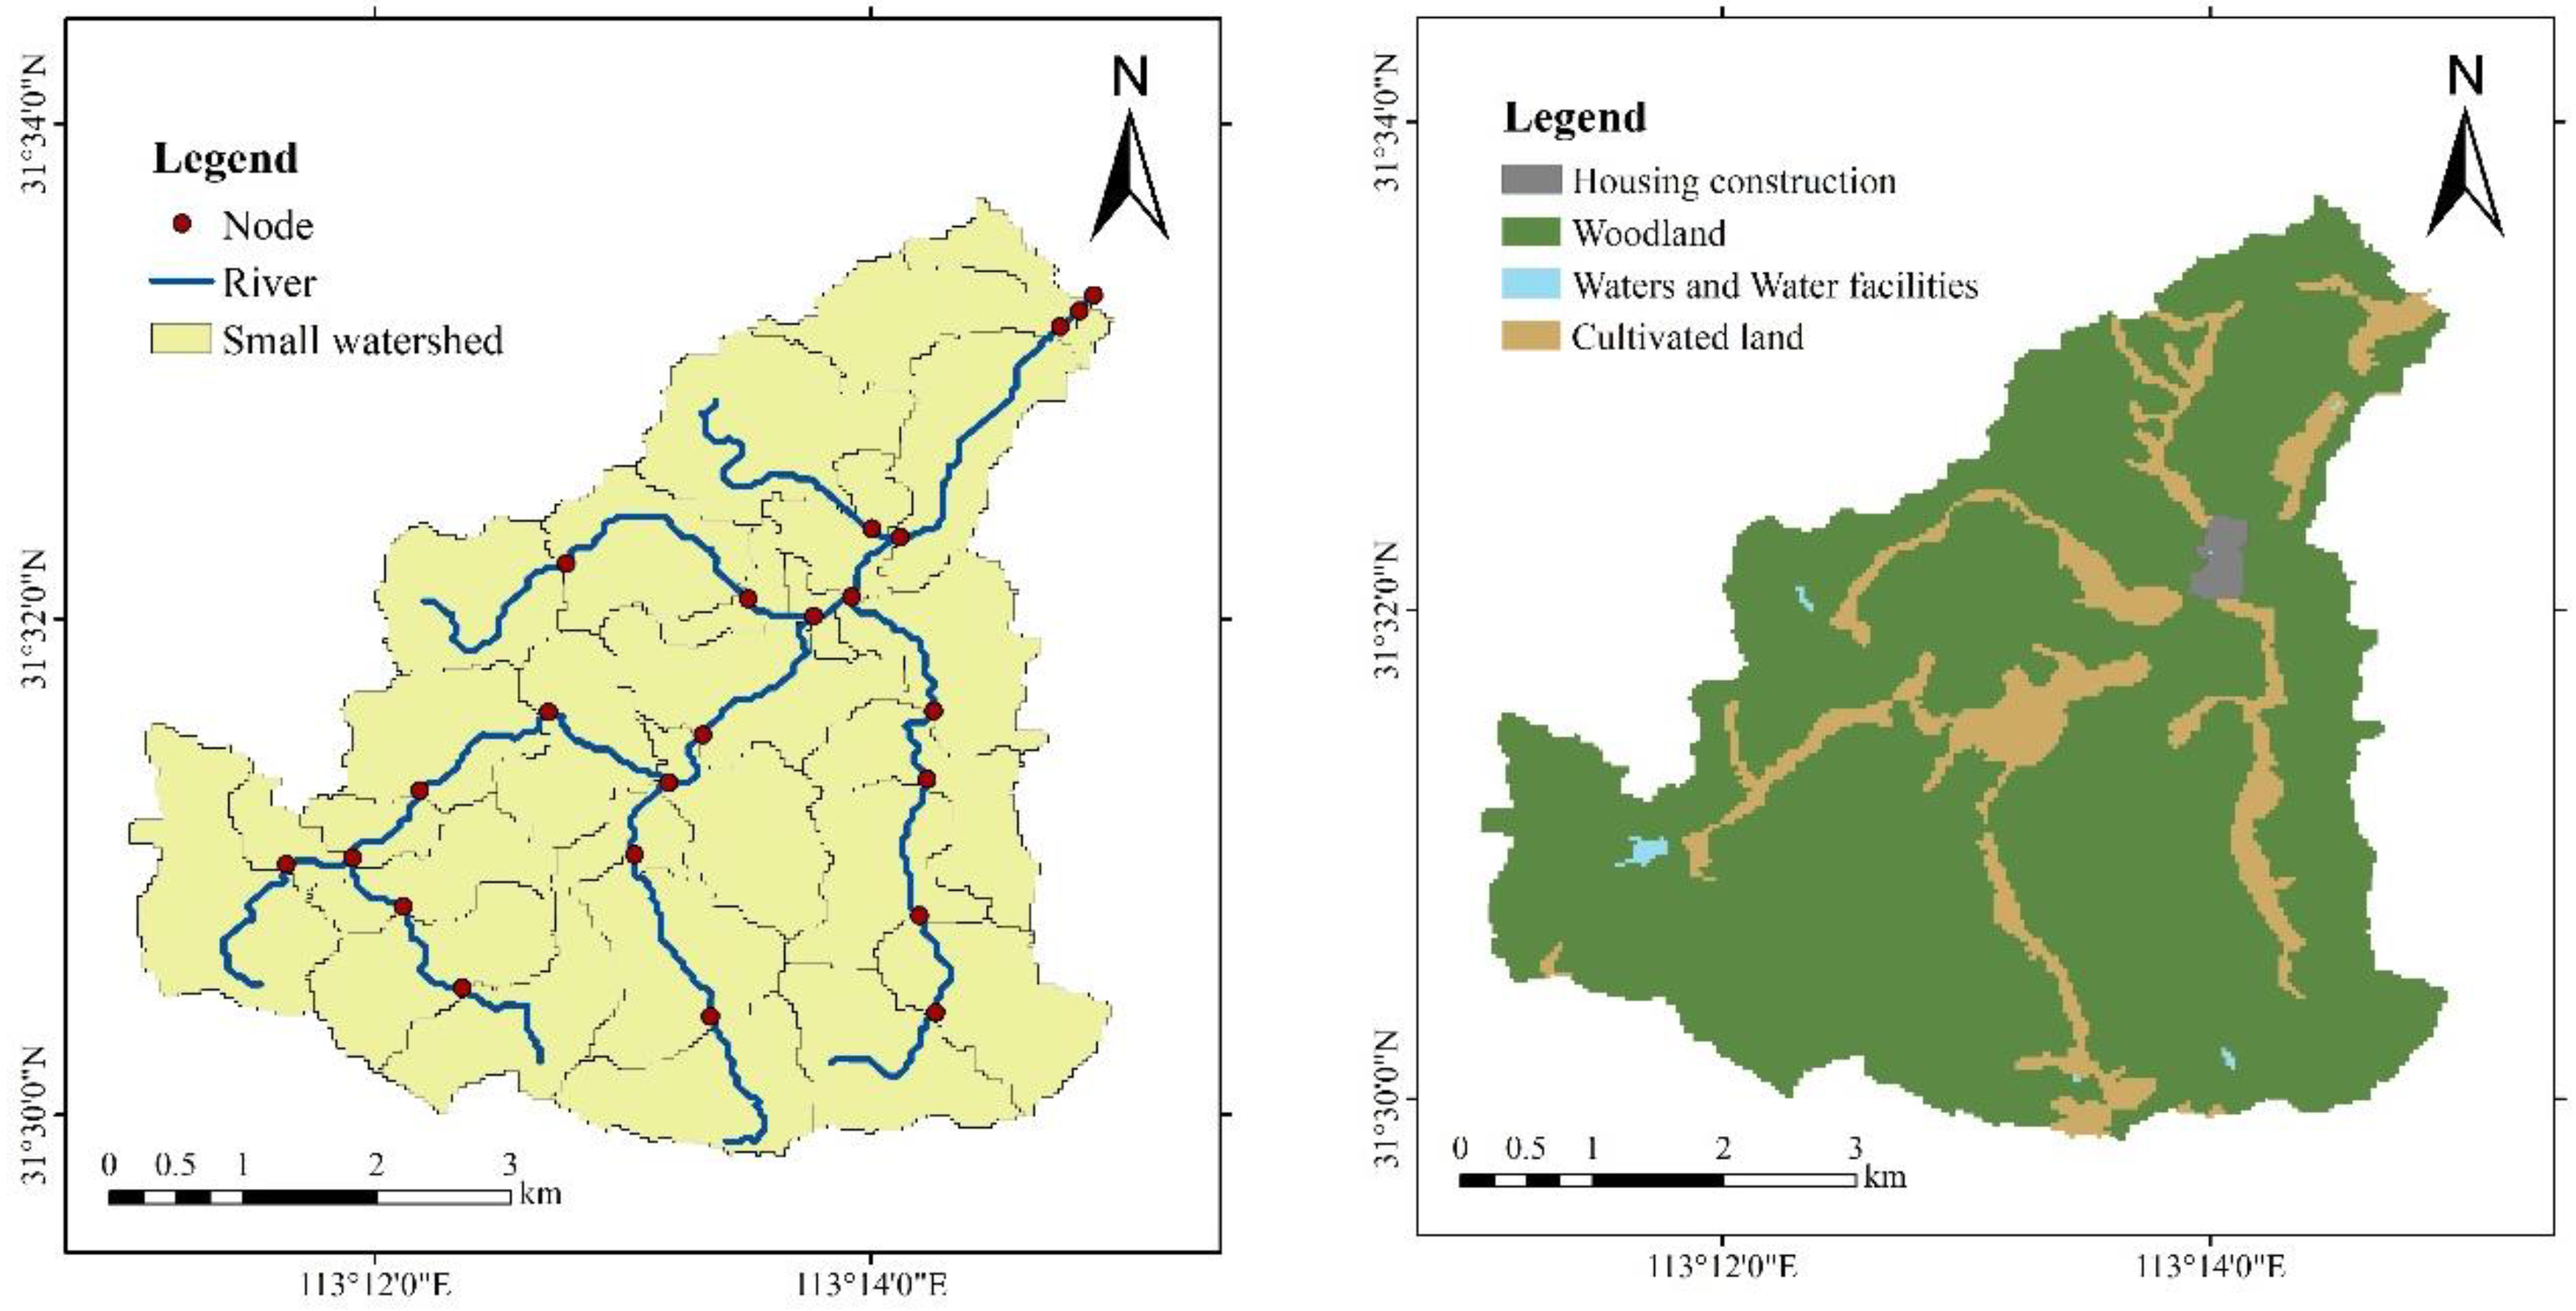
Based on basic geographic information data in the National Flash Flood Data Set, such as DEM and DLG data (1:50,000) and DOM data with a resolution of 2.5 m (8.2 ft), the drainage area upstream of the Liulin Town section were divided into 28 small watersheds each with a size of 0.16–1.6 km2 (0.10–0.99 mi2) as the minimum calculation unit for the model simulation (Figure 5). Meanwhile, information about 75 basic attributes of the small watersheds was extracted, including spatial attributes, land uses, and soil types.
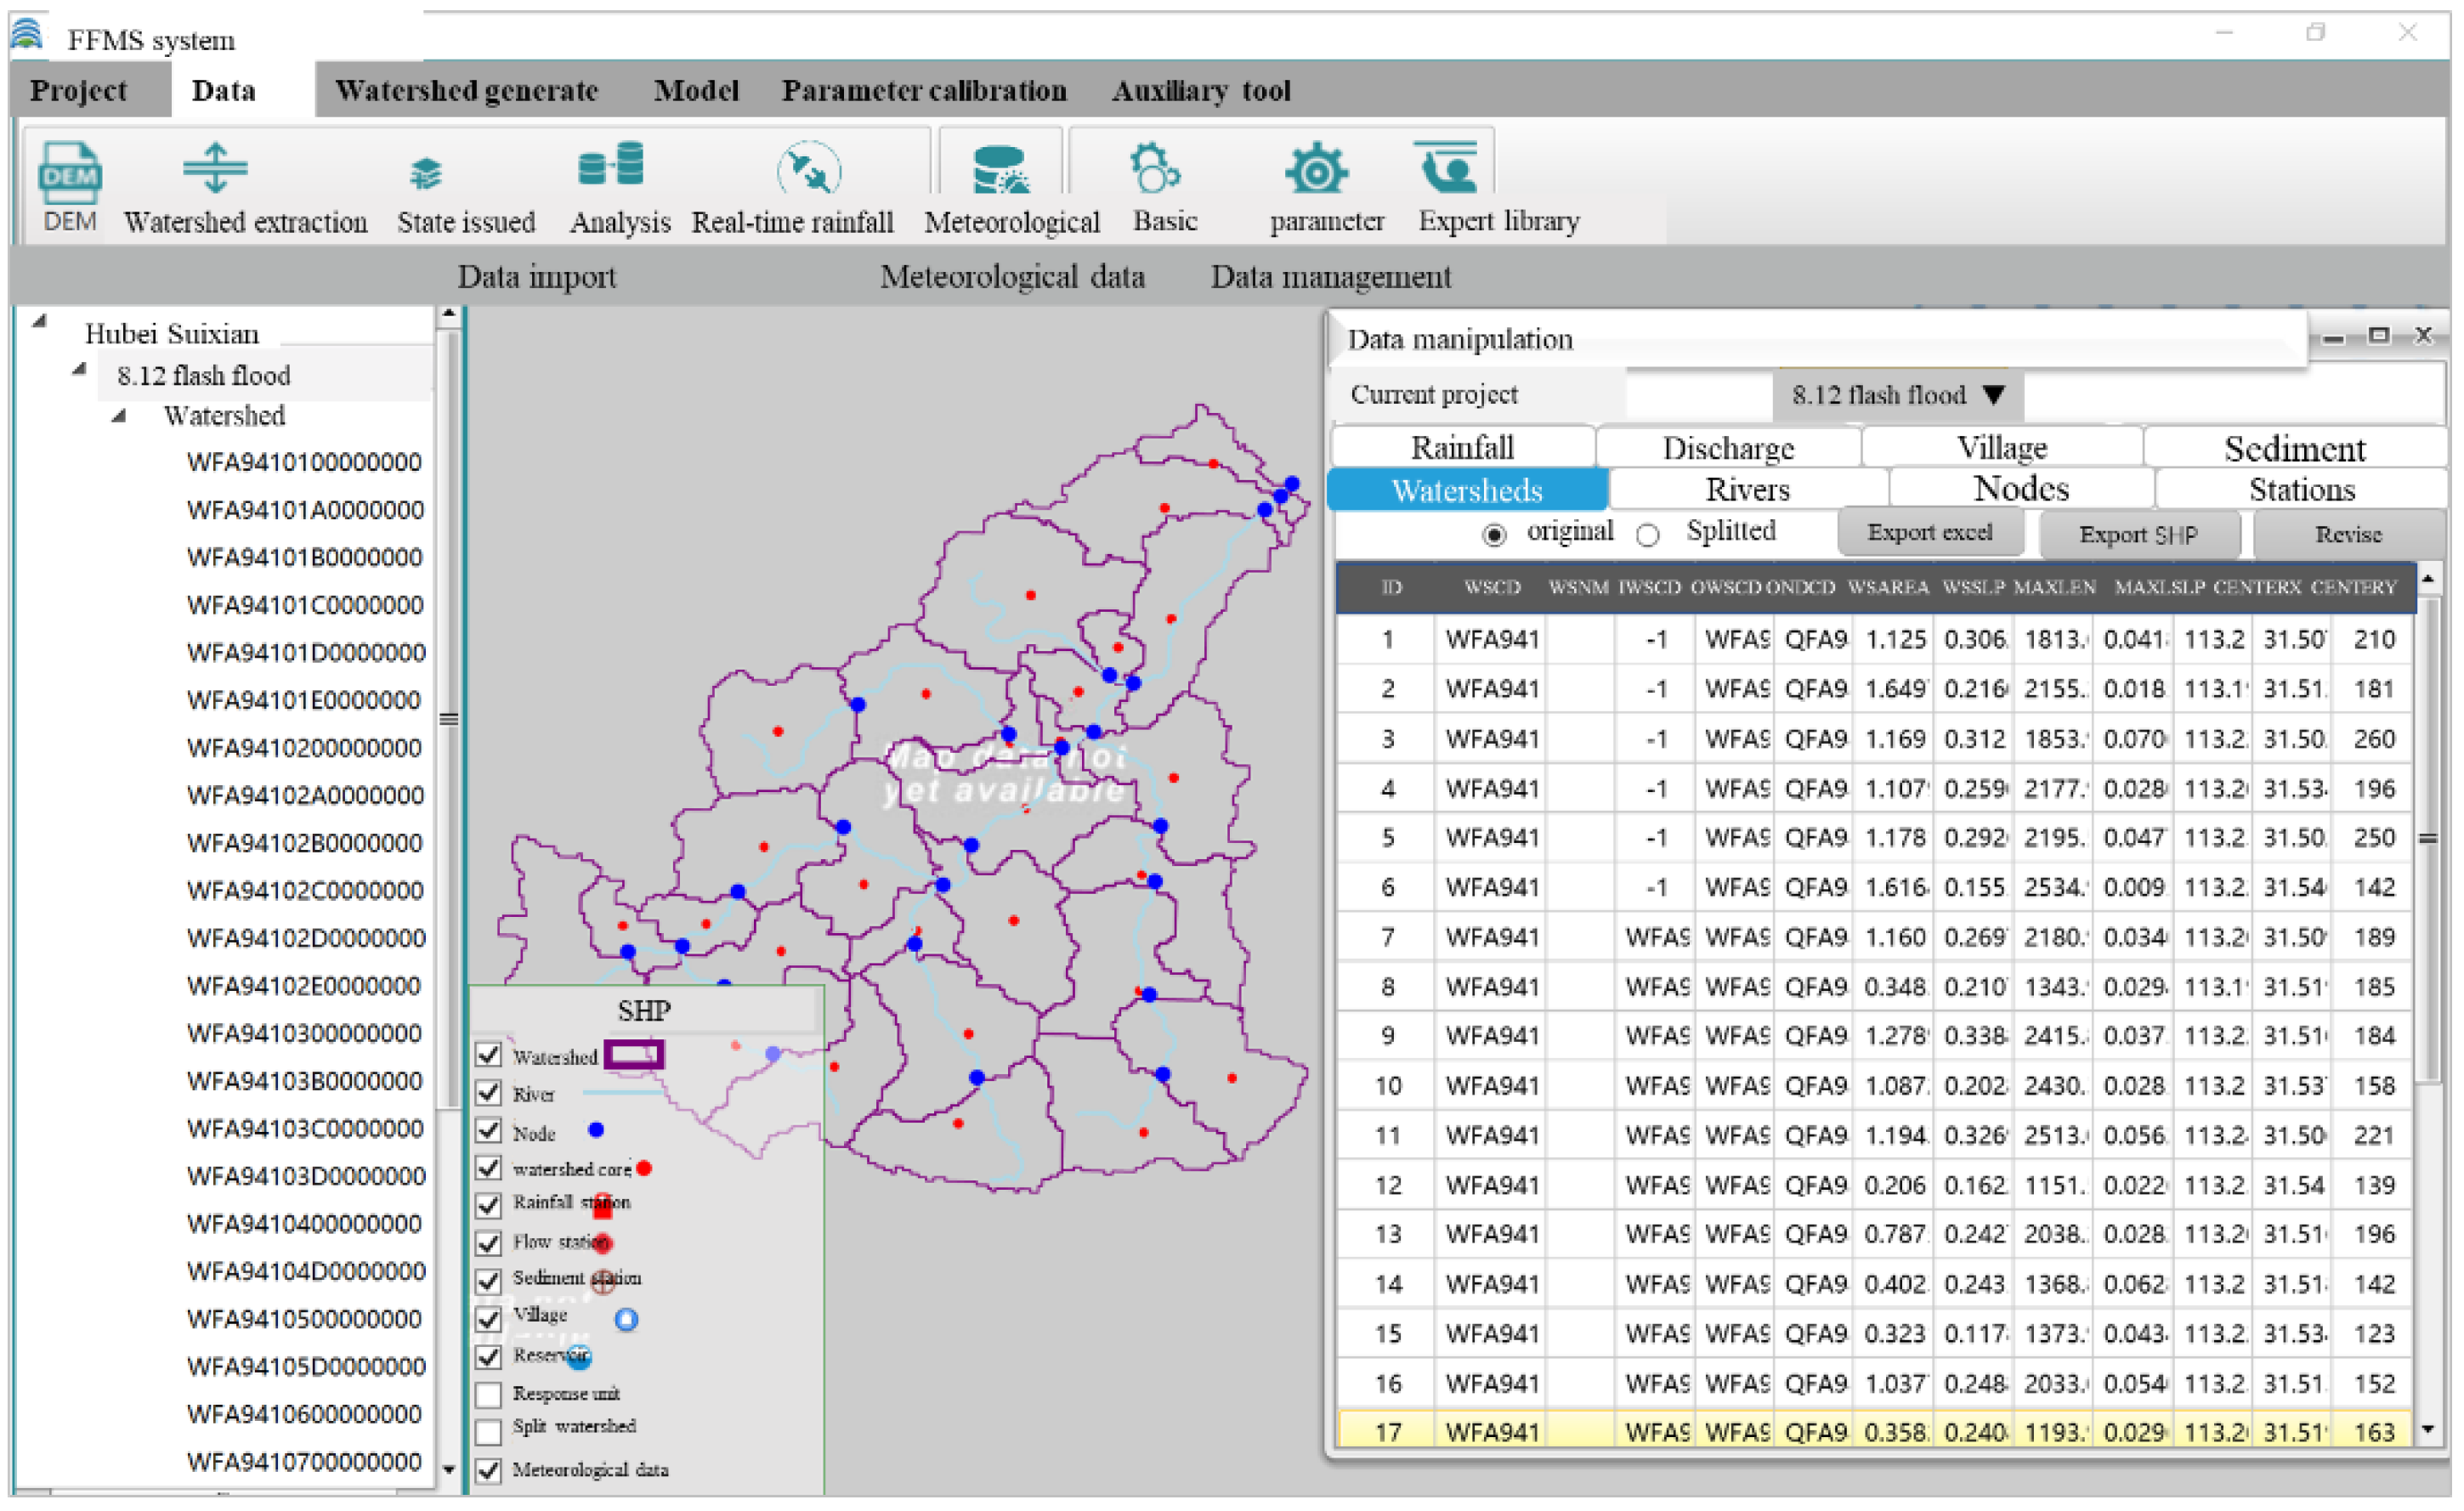
The monitored data series of the rainfall of four reservoirs around Liulin Town were the input of the model. The areal precipitation of each calculation unit was then automatically calculated through an inverse distance-weighted interpolation by the FFMS rainfall module. The SVSMR method was used for the runoff simulation while the simplified triangular unit hydrograph method was used for the slope confluence simulation, the linear reservoir method for the baseflow simulation, and the kinematic-wave method for the flood evolution simulation. The modeling interface is presented in Figure 6, where the table displays the basic attributes of each calculation unit extracted by the model automatically.
3.4. Parameter Determination
The main model parameters involved in the simulation of Liulin flash flood was divided into two categories according to their physical characteristics. One consisted of the basic attribute parameters that characterize the actual topography of calculation units, such as area, longest confluence path, and gradient. The other consisted of the runoff and confluence parameters that characterize the underlying surface of calculation units, such as maximum infiltration coefficient of surface soil, (linear/nonlinear) coefficient of preferential flow, and (linear/nonlinear) coefficient of subsurface flow. For the first category, values were obtained by automatically extracting the input data without calibration while for the second category of parameters, the model automatically determined and assigned the values based on the basic attributes of calculation units extracted from the expert database derived from the national flash flood investigation results. In the actual simulation process, the calibration and correction can be carried out for some parameters according to the simulation effect. However, this case used parameter values recommended by the expert database (Table 1) because a simulation analysis had already been conducted ahead of the post disaster survey data collection. The simulation results are compared with measured data in later verification.
4. Analysis on the Disaster Mechanism
4.1. Analysis of Flash Flood
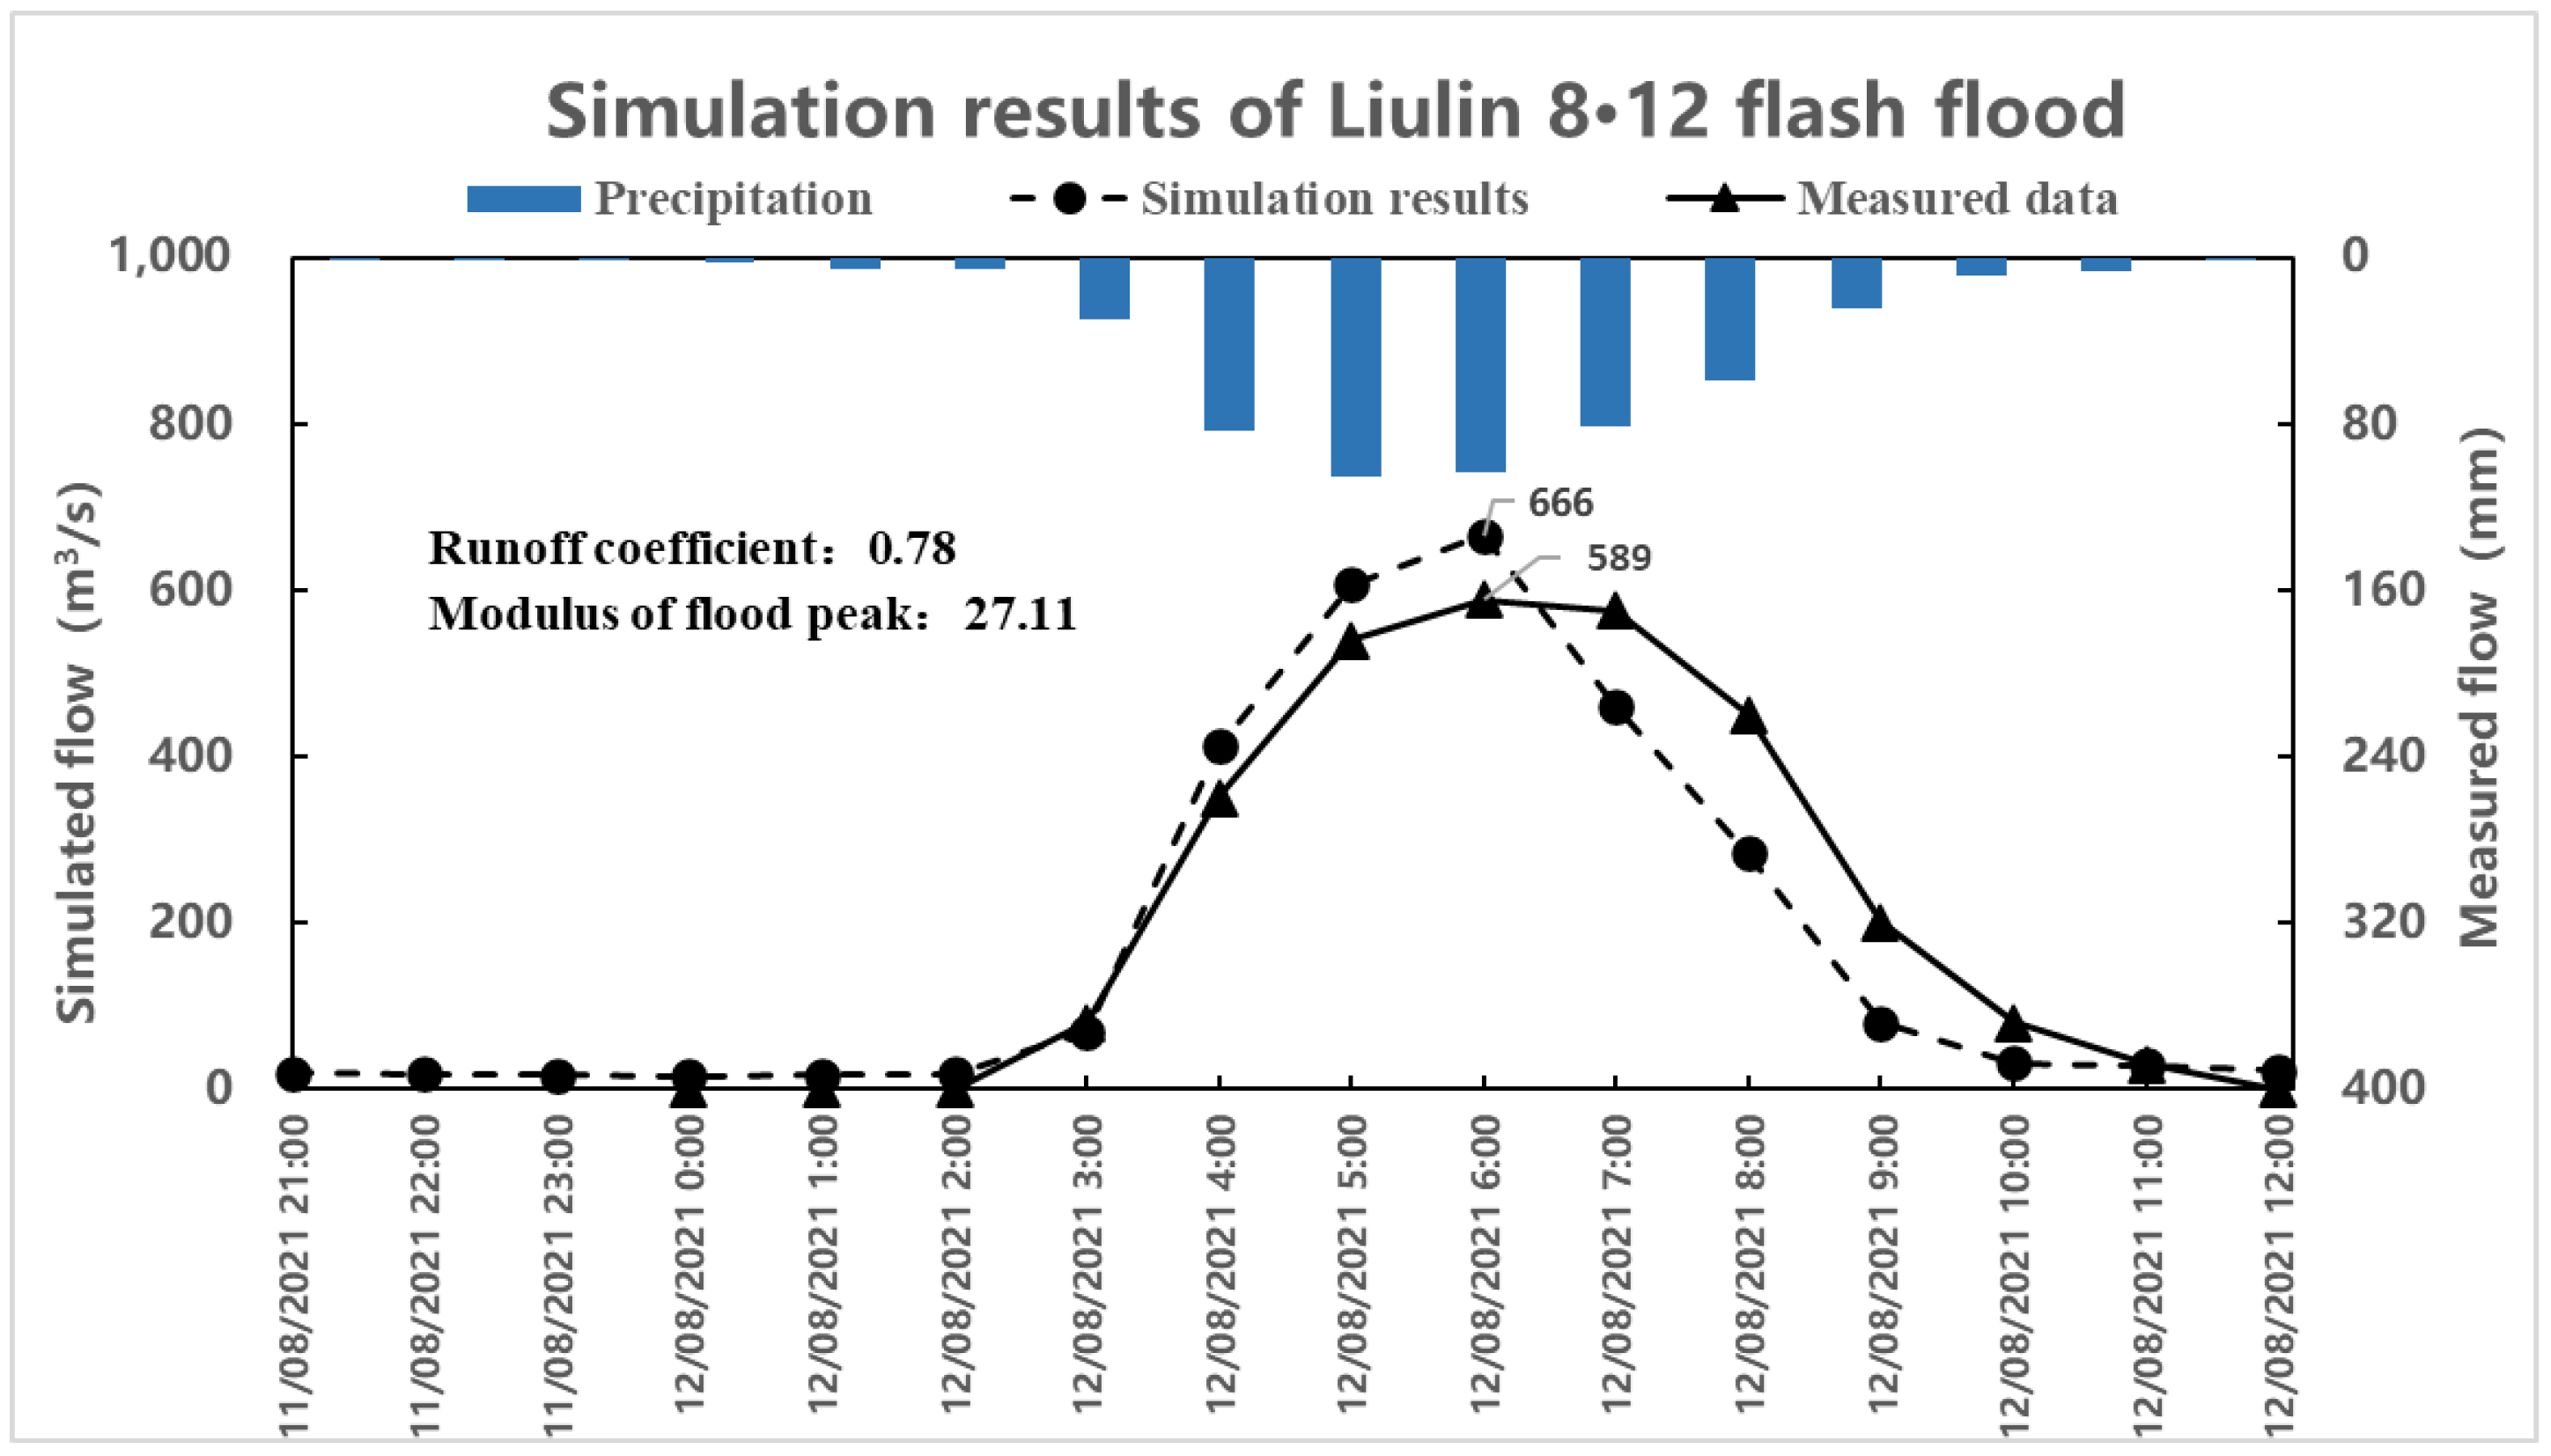
The model used default parameters to perform distributed hydrological simulations for hourly flash-flood changes from 21:00 to 12:00 on 12 August 2021 in the Liulin basin. The peak flow was calculated to be 666.22 m3/s (23,527.3 ft3/s). Flood peak traveled for one to two hours, and flow confluence took about two hours. The runoff coefficient was around 0.78, and the modulus of flood peak was 27.11. The simulated time of flood peak was basically consistent with the actual time by comparing with post disaster investigation data (Figure 7), with an error of +13%. Since the simulation results were obtained earlier than the investigation results, the simulation method proved to be reliable and the recommended parameter values were reasonable. Therefore, the simulation results could explain the flash flood process and support the mechanism analysis.
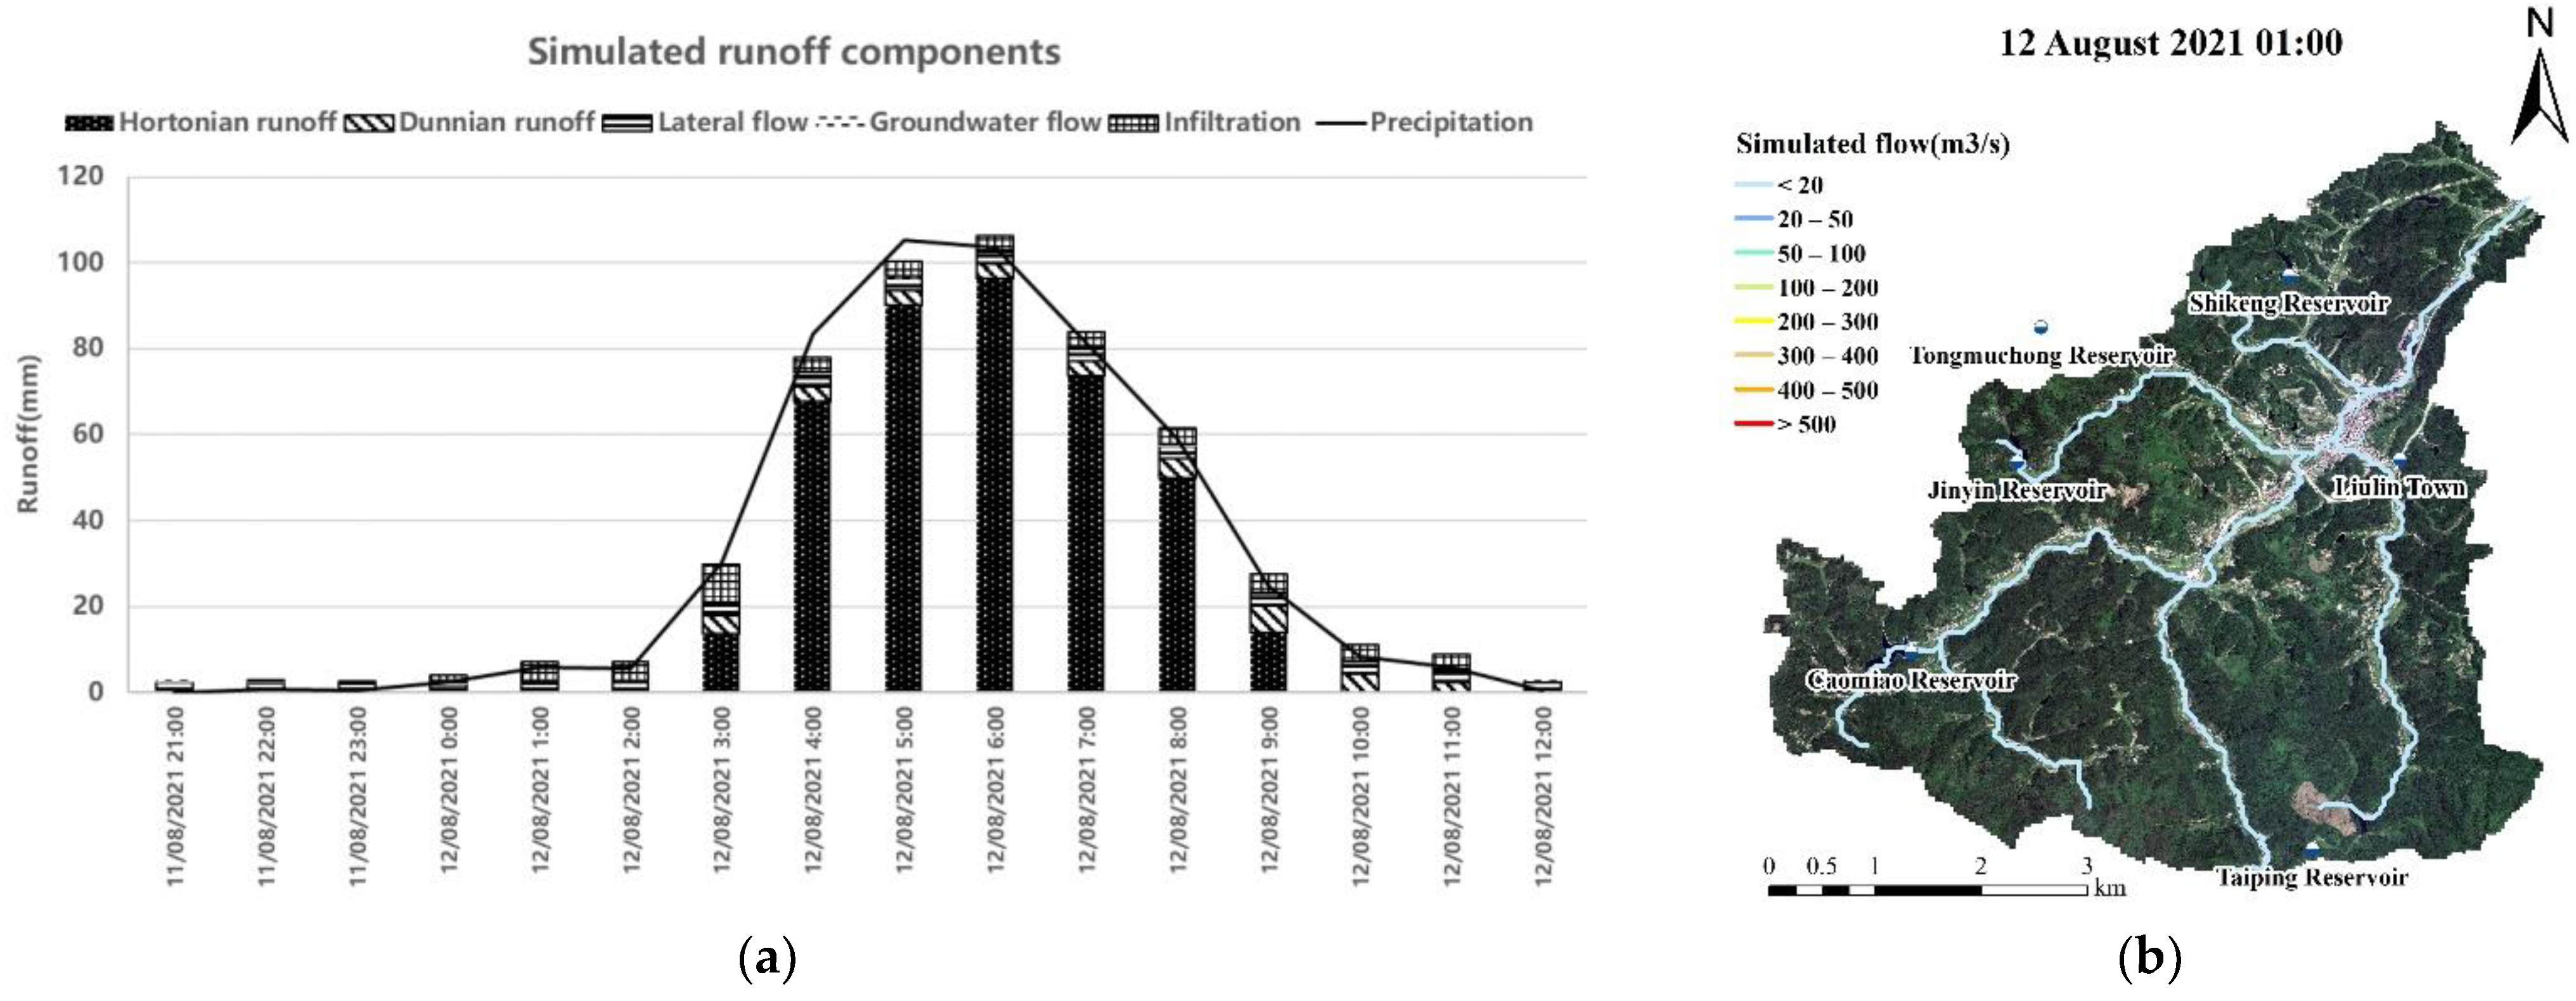
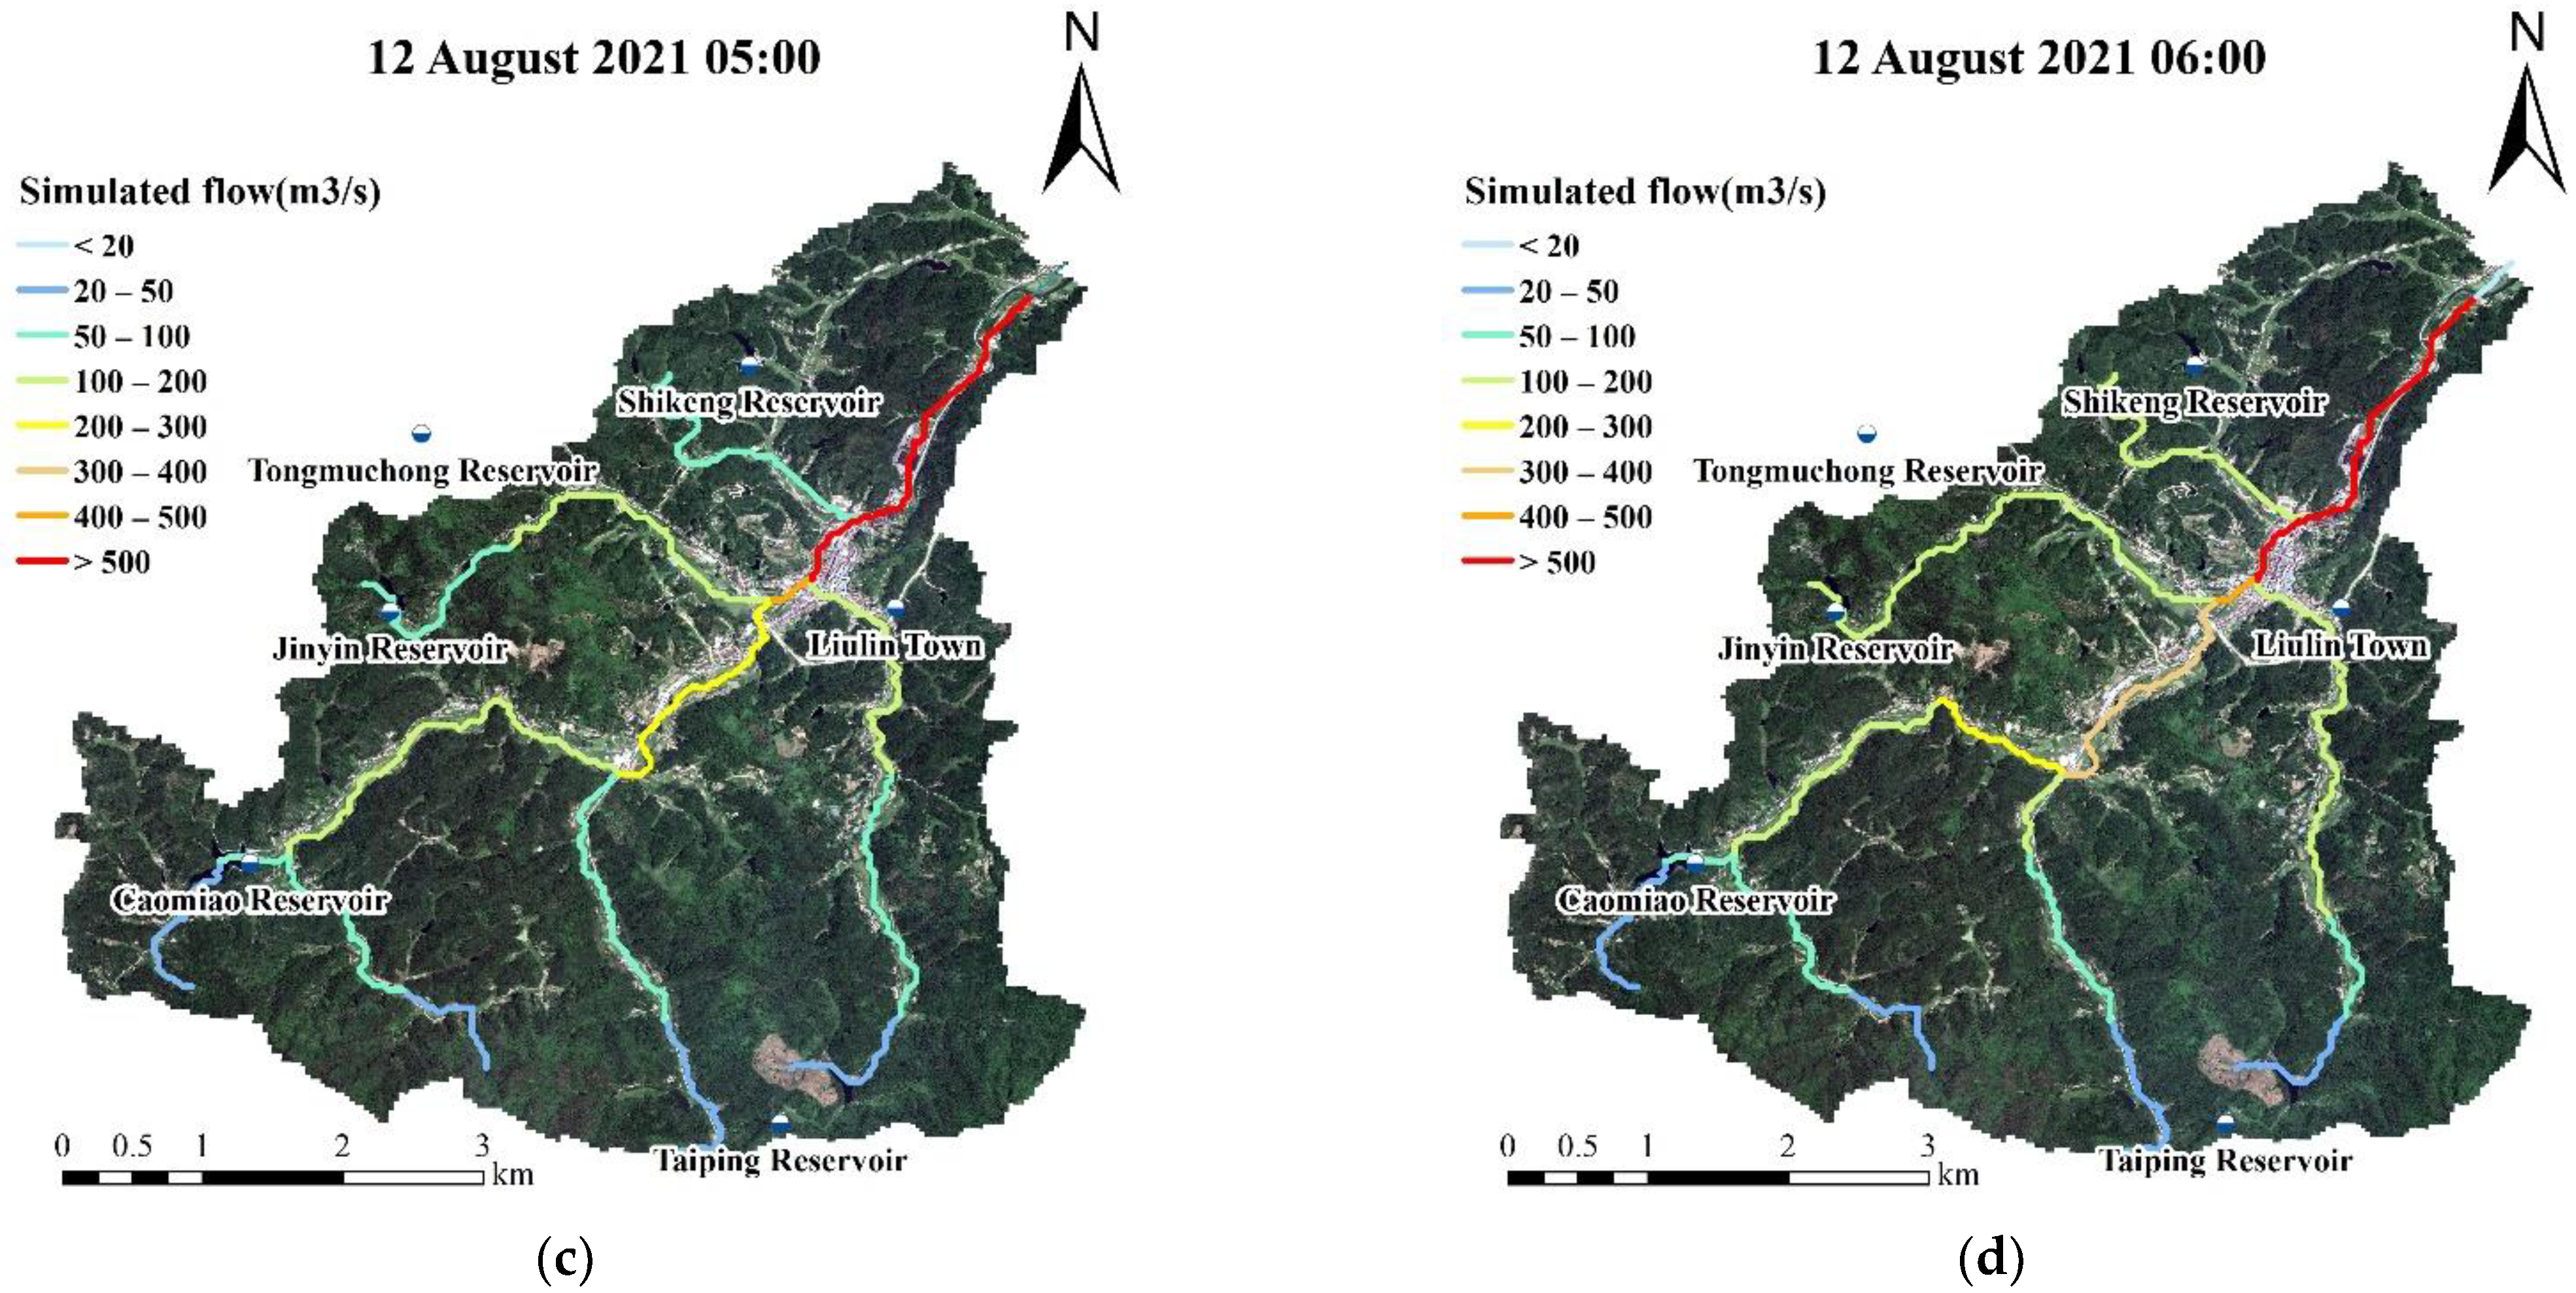
By using the SVSMR model, the changes in runoff components can be examined to pinpoint the causes of the flash flood in Liulin Town. As shown in Figure 8a, in the initial stage of the “8.12” flash flood in Liulin Town, the hourly areal rainfall in the watershed was small and surface runoff was limited as a large proportion of rainfall infiltrated into the unsaturated surface soil. The subsurface flow from the upstream calculation units contributed most to the total runoff, but due to the slow confluence, it had less impact on the downstream Liulin Town. At 1:00 on 12 August, the accumulated areal rainfall of the basin exceeded 10.1 mm (0.40 in) and a runoff was generated in some calculation units where soil became saturated. The total runoff was still generally small, so the flow of the main rivers in the basin did not increase remarkably (Figure 8b). After 3:00 on 12 August, with the rapid increase of areal rainfall in the basin, a Hortonian runoff became the main mechanism of each runoff calculation unit in the watershed and was produced from almost 85% of the total rainfall before the flood peak came. Due to a relatively large channel gradient in the upper reaches, the speed of the apparent surface runoff was rapid after confluence (Figure 8c,d). As a result, the flow at the Liulin Town section surged by 500% from 3:00 to 4:00 and reached its peak of around 600 m3/s (21,188.8 ft3/s) at 6:00.
The flash flood caused heavy casualties [6] due to several factors: an emergency evacuation that was not well organized at night; the elderly and female population that accounted for a large proportion and had relatively weak self-rescue capability; a blocked evacuation route, e.g., people could not move to a safe place in time as houses with external stairs were kept closed subject to the high water pressure of rapidly rising floods.
4.2. Analysis of the Amplification Effect
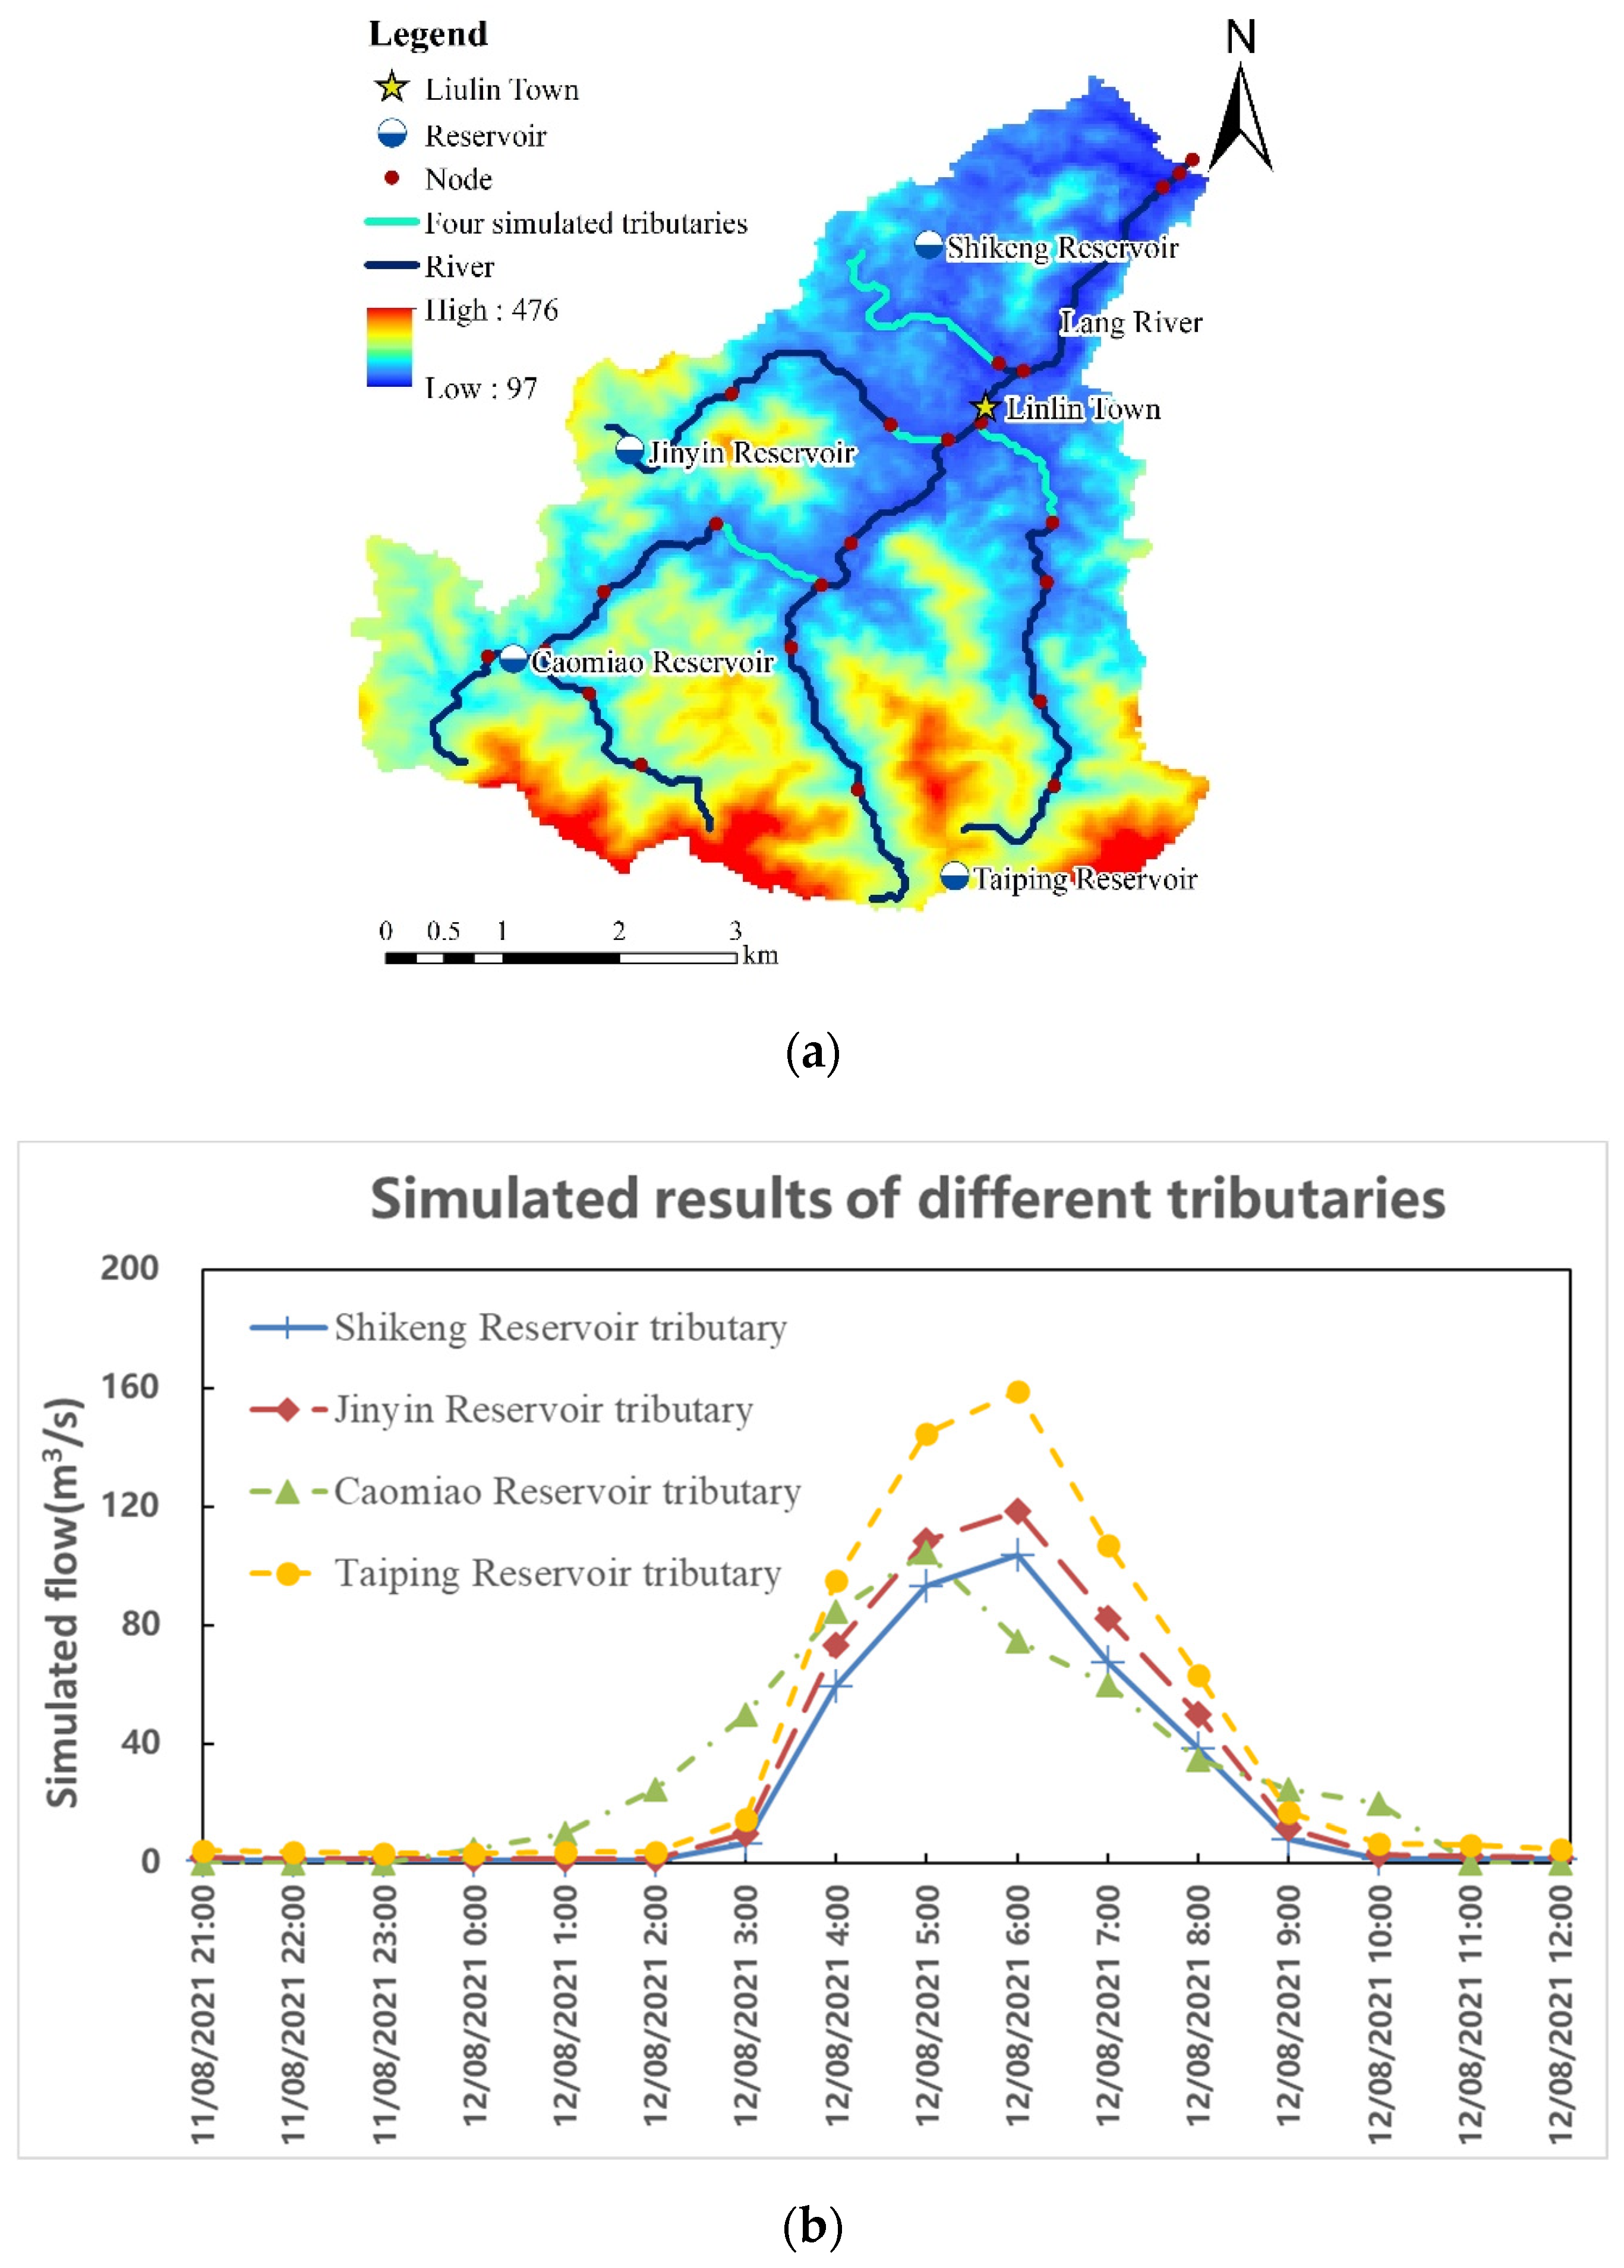
Based on the FFMS simulation results, the flow of the Langhe River and its three tributaries, i.e., the Shikeng Reservoir, the Jinyin Reservoir, and the Taiping River, was analyzed, and further, flood hydrographs were generated for each (Figure 9). The results showed that the peak flow of the tributaries all arrived at the section near Liulin Town at 6:00 on 12 August. An exception was the Caomiao Reservoir on the trunk of Langhe River, which is far away from Liulin Town; its peak flow appeared at 5:00 on 12 August. Such simultaneous arrival and overlapping of peak flows of the mainstream and tributaries magnified the effect of the flash flood near Liulin Town. Among them, the Taiping River contributed the largest peak flow of 205.33 m3/s (7251.2 ft3/s) while the Shikeng Reservoir contributed the smallest of 104.09 m3/s. However, the confluence of the Shikeng Reservoir at the downstream of Liulin Town generated a backwater effect that obstructed flood water discharge, which magnified the impact of the flash flood to a certain extent.
According to the FFMS simulation results, the 24 h cumulative rainfall during the “8.12” flash flood in Liulin Town was 1.6 times that of the local designed 100-year flood. The water depth corresponding to the peak flow at the extracted cross-sections was calculated using the Manning formula. As shown in Figure 10, the calculated water depth at each node of the “8.12” flash flood was higher than that of the 100-year flood, which means that the frequency of the flash flood in this case was at least once in more than 100 years.
Regarding the charts for flood runoff calculation of Hubei Province and statistical parameter atlas for floods in Hubei Province in Figure 10, it was deduced that the design peak flow corresponding to the design flood with a return period of 200 years at the Liulin Town section was 634 m3/s (7251.2 ft3/s), compared with 620 m3/s (21,895.1 ft3/s) using the hydrological comparison method based on the design data of the nearby Baiguohe Reservoir. Taking into account the field investigations and simulation results, the 8.12 flash flood in Liulin Town was considered to correspond to a return period of 200 years or longer [6].
5. Conclusions
This study adopted the self-developed distributed flash flood simulation model (FFMS) to analyze the “8.12” flash flood in Liulin Town in terms of runoff generation and runoff components of each tributary in the basin, which revealed the formation mechanism and underlying reasons leading to this disaster. The main conclusions are as follows:
- (1)
- The “8.12” flash flood in Liulin Town was mainly caused by the surge of a Hortonian runoff generated by a record extreme rainstorm in this area. The peak flow of four upstream tributaries arrived at the Liulin Town section at almost the same time and coupled with the backwater effect from the downstream Lianhua River, which magnified the effect of the flash flood and resulted in heavy casualties in Liulin Town.
- (2)
- The capability of evacuation in response to the Liulin flash flood was restricted by factors such as the difficulty for arranging emergency evacuation at night, a large proportion of elderly and female population, and the external layout of stairs for most resident houses.
- (3)
- Referring to the topographical features and historical flash flood events in the basin of Liulin Town, several recommendations are proposed accordingly: (1) improve the rainfall forecasting system for drainage areas of upstream tributaries; (2) build a flash flood forecasting and early warning system based on distributed models; (3) further refine the existing flash flood defense plan, and (4) increase the evacuation exercises to respond to flash floods and enhance the public awareness of extreme disaster prevention.
Author Contributions
C.L. (Changzhi Li) and Q.M.: Conceptualization, Methodology. W.W.: Writing—review & editing. S.H.: Program implementation, data curation, Writing—original draft preparation. L.W.: Software. J.T.: Investigation. C.L. (Changjun Liu): Project administration. All authors have read and agreed to the published version of the manuscript.
Funding
This research was funded by National Key Research Program (2019YFC1510603), Key Research Program of Guangxi Province (2019AB20003) and Hunan Water Conservancy Science and Technology Project (XSKJ2019081-17).
Institutional Review Board Statement
Not applicable.
Informed Consent Statement
Not applicable.
Data Availability Statement
All authors made sure that all data and materials support published claims and comply with field standards.
Conflicts of Interest
The authors declare no conflict of interest.
References
- Guo, L.; Ding, L.; Sun, D.; Liu, C.J.; He, B.S.; Liu, R.H. Key Techniques of Flash Flood Disaster Prevention in China. J. Hydraul. Eng. 2018, 49, 1123–1136. [Google Scholar]
- Weng, C.; Hu, X.; Wang, Y.; Tan, W.; Li, J. A Study on the Zoning of Mountain Flood Disaster Prevention and Control in Hubei Province. Hubei Water Power 2006, 002, 12–15. [Google Scholar]
- Zhang, Y.; Zou, Y.; Wang, X.; Zhang, P.; Xu, W. Flash Flood Warning Assessment Considering Temporal Differences. Adv. Eng. Sci. 2021, 53, 10–18. [Google Scholar]
- Wang, X.; Yang, P.; Sun, T.; Zexing, X. Study on Division Early Warning of Flash Flood Disaster Caused by Rainstorm in Mountainous Small Watersheds. Adv. Eng. Sci. 2021, 53, 29–38. [Google Scholar]
- Xu, S.; Jiang, Y.; Jiang, H.; Li, Q.; Xie, Q.; Lie, Y.; Zhou, J.; Wang, F.; Meng, L. Investigation and Reflection on “2021.8.12” Flood Disaster in Liulin Town, Sui County, Hubei Province. China Flood Drought Manag. 2022, 32, 54–58. [Google Scholar]
- Chang Jiang Water Resource Commission of the Ministry of Water Resources. Investigation and Analysis Report on “8.12” Major Mountain Flood Disaster Event in Liulin Town, Suixian County, Suizhou City, Hubei Province; Ministry of Water Resources: Beijing, China, 2021. [Google Scholar]
- He, B.; Ma, M.; Li, Q.; Liu, L.; Wang, X.-H. Current Situation and Characteristics of Flash Flood Prevention in China. China Rural. Water Hydropower 2021, 5, 133–138. [Google Scholar]
- Ding, L.; Guo, L.; Liu, C.; He, B. Technical Progress of Flash Flood Disasters Prevention and Control Systems in China. China Flood Drought Manag. 2020, 30, 11–17. [Google Scholar]
- Zhang, P.; Ding, W.; Wang, X. Research Framework and Anticipated Results of the Key Technology and Integrated Demonstration of Mountain Torrent Disaster Monitoring and Early Warning. Adv. Eng. Sci. 2018, 50, 1–11. [Google Scholar]
- Liu, C.; Nie, R.; Liu, X.; Xu, W. Research Conception and Achievement Prospect of Key Technologies for Forecast and Early Warning of Flash Flood and Sediment Disasters in Mountainous Rainstorm. Adv. Eng. Sci. 2020, 52, 1–8. [Google Scholar]
- Yang, P.; Xu, Z.; Yan, X.; Wang, X. Comparative Study on Methods of Early Warning Index of Flash Flood Disaster Induced by Rainstorm. Adv. Eng. Sci. 2020, 52, 157–165. [Google Scholar]
- Pan, J. Comparative Study of Simplified and Full Hydrodynamic Models for Flash Floods. Adv. Eng. Sci. 2012, 44, 77–82. [Google Scholar]
- Li, P.; Huang, S.; Li, D.; Huang, Q. Analysis of Flood Control Function of Three Gorges Reservoir and Flood Disaster in Poyang Lake Basin. J. Xi'an Univ. Technol. 2020, 36, 486–493. [Google Scholar]
- Chen, Y.; Qin, J.; Wang, H. Liuxihe Model-based Method for Flood Forecast of Medium and Small-sized River. Water Resour. Hydropower Eng. 2017, 48, 12–19. [Google Scholar]
- Yang, L.; Ye, L.; Yu, B.; Wu, Z.; Deng, J.; Zhao, B.; Liu, Q.; Chen, W. Analysis of “5.16” Rainstorm and Flood and Flash Flood Disaster Prevention in the Back Mountain of Sanming City, Fujian Province. J. China Hydrol. 2021, 41, 95–100. [Google Scholar]
- Corral, C.; Berenguer, M.; Sempere-Torres, D.; Poletti, L.; Silvestro, F.; Rebora, N. Comparison of Two Early Warning Systems for Regional Flash Flood Hazard Forecasting. J. Hydrol. 2019, 572, 603–619. [Google Scholar] [CrossRef] [Green Version]
- Sun, T.; Yang, P.; Xu, Z.; Wang, Y.; Wang, X. Analysis on The Disaster Mechanism of “8·16” Flash Flood in Zhongdu River basin. Adv. Eng. Sci. 2021, 53, 132–138. [Google Scholar]
- Braud, I.; Roux, H.; Anquetin, S.; Maubourguet, M.M.; Manus, C.; Viallet, P.; Dartus, D. The Use of Distributed Hydrological Models for The Gard 2002 Flash-Flood Event: Analysis of Associated Hydrological Processes. J. Hydrol. 2010, 394, 162–181. [Google Scholar] [CrossRef] [Green Version]
- Marchi, L.; Borga, M.; Preciso, E.; Gaume, E. Characterisation of Selected Extreme Flash Floods in Europe and Implications for Flood Risk Management. J. Hydrol. 2010, 394, 118–133. [Google Scholar] [CrossRef]
- Cai, J. Research on Risk Zoning of Mountain Torrents Disaster in Hubei Province Based on GIS. Ph.D. Thesis, Huazhong University of Science and Technology, Wuhan, China, 2017. [Google Scholar]
- Liu, C.; Wen, L.; Zhou, J.; Zhao, X.T.; Guo, L.; Wei, Y.Q. Comparative Analysis of Hydrological and Hydrodynamic Calculation Method for Flash Flood in Small Watershed. J. China Inst. Water Resour. Hydropower Res. 2019, 17, 262–270+278. [Google Scholar]
- Viviroli, D.; Zappa, M.; Gurtz, J.; Weingartner, R. An Introduction to the Hydrological Modelling System PREVAH and its Pre- and Post-Processing-Tools. Environ. Model. Softw. 2009, 24, 1209–1222. [Google Scholar] [CrossRef]
- Liu, C.; Zhou, J.; Wen, L.; Ma, Q.; Guo, L.; Ding, L.Q.; Sun, D.Y. Research on Spatio Temporally-Mixed Runoff Model and Parameter Regionalization for Small and Medium-Sized Catchments. J. China Inst. Water Resour. Hydropower Res. 2021, 19, 99–114. [Google Scholar]
- Liu, C. A New Generation of Hydrological Model Driven by Artificial Intelligence and Big Data and its Application in Flood Forecasting and Early Warning. China Flood Drought Manag. 2019, 29, 11–22. [Google Scholar]
- Hao, S.; Ma, Q.; Zhai, X.; Lyu, G.; Fan, S.; Wang, W.; Liu, C. A New Machine Learning Approach for parameter regionalization of Flash Flood Modelling in Henan Province, China. In Proceedings of the International Conference on Energy, Power and Environmental System Engineering (ICEPESE2021), Shanghai, China, 4–5 July 2021; p. 02010. [Google Scholar] [CrossRef]
- Tian, J.; Fan, S.; Wang, W.; Liu, C.J.; Zhang, Q.Y.; Zhao, X.T.; Ma, S. Comparison between FFMS Model and HEC-HMS Model Applied in Rainstorm and Flood Simulation. J. Yangtze River Sci. Res. Inst. 2021, 38, 59–65. [Google Scholar]
- Zhang, X.; Zhou, J.; Wen, L. Application of Spatio-Temporal Variable Source Mixed Runoff Model to Flood Simulation of Small Watersheds: A Case Study of Four Small Watersheds in Sichuan and Gansu Province. J. Water Resour. Water Eng. 2021, 32, 80–90. [Google Scholar]
- Talbot, C.A.; Ogden, F.L. A Method for Computing Infiltration and Redistribution in a Discretized Moisture Content Domain. Water Resour. Res. 2008, 44, W08453. [Google Scholar] [CrossRef]
- Lai, W.; Ogden, F.L.; Steinke, R.C.; Talbot, C.A. An Efficient and Guaranteed Stable Numerical Method for Continuous Modeling of Infiltration and Redistribution with a Shallow Dynamic Water Table. Water Resour. Res. 2015, 51, 1514–1528. [Google Scholar] [CrossRef]
- Bao, W.; Zhao, L. Application of Linearized Calibration Method for Vertically Mixed Runoff Model Parameters. J. Hydrol. Eng. 2014, 19, 85–91. [Google Scholar] [CrossRef]
Figure 1.
Distribution map of water systems and reservoirs in Liulin Town.

Figure 2.
Spatial distribution map of accumulated rainfall and hourly rainfall in Liulin Town, Hubei Province.
Figure 2.
Spatial distribution map of accumulated rainfall and hourly rainfall in Liulin Town, Hubei Province.

Figure 3.
Changes of rainfall and water level in Shijinyin, Caomiao, Taiping, and Shikeng reservoirs.
Figure 3.
Changes of rainfall and water level in Shijinyin, Caomiao, Taiping, and Shikeng reservoirs.

Figure 4.
FFMS software architecture and functional modules.

Figure 5.
Calculation unit division in Liulin Town and land use attribute data extraction.

Figure 6.
FFMS modeling process.

Figure 7.
Simulation results.

Figure 8.
Distributed simulation of runoff composition and runoff process. (a) Runoff components in Liulin Town. (b) Simulated flow at 1:00. (c) Simulated flow at 5:00. (d) Simulated flow at 6:00.
Figure 8.
Distributed simulation of runoff composition and runoff process. (a) Runoff components in Liulin Town. (b) Simulated flow at 1:00. (c) Simulated flow at 5:00. (d) Simulated flow at 6:00.


Figure 9.
Distribution map (a); and simulation results of four tributaries of Lang River (b).

Figure 10.
Simulated water levels of various reservoirs.


Table 1.
Parameter value.
| Symbol | Parameter | Unit | Recommended Value |
|---|---|---|---|
| ks | Saturated hydraulic conductivity | m/s | 2.78 × 10⁻⁶ |
| perp | Surface ratio of preferential flow | - | 0.82 |
| ki1 | Linear coefficient of subsurface flow | - | 0.88 |
| kp1 | Linear coefficient of preferential flow | - | 0.58 |
| ki2 | Nonlinear coefficient of subsurface flow | - | 2.00 |
| kp2 | Nonlinear coefficient of preferential flow | - | 0.00 |
| kg | Baseflow coefficient | - | 0.29 |
| Wfd | Average depression storage | mm | 0.37 |
| perip | Impervious surface ratio | - | 0.00 |
Publisher’s Note: MDPI stays neutral with regard to jurisdictional claims in published maps and institutional affiliations. |
© 2022 by the authors. Licensee MDPI, Basel, Switzerland. This article is an open access article distributed under the terms and conditions of the Creative Commons Attribution (CC BY) license (https://creativecommons.org/licenses/by/4.0/).
Share and Cite
MDPI and ACS Style
Hao, S.; Wang, W.; Ma, Q.; Li, C.; Wen, L.; Tian, J.; Liu, C. Analysis on the Disaster Mechanism of “8.12” Flash Flood in Liulin River Basin. Water 2022, 14, 2017. https://doi.org/10.3390/w14132017
AMA Style
Hao S, Wang W, Ma Q, Li C, Wen L, Tian J, Liu C. Analysis on the Disaster Mechanism of “8.12” Flash Flood in Liulin River Basin. Water. 2022; 14(13):2017. https://doi.org/10.3390/w14132017
Chicago/Turabian StyleHao, Sijia, Wenchuan Wang, Qiang Ma, Changzhi Li, Lei Wen, Jiyang Tian, and Changjun Liu. 2022. "Analysis on the Disaster Mechanism of “8.12” Flash Flood in Liulin River Basin" Water 14, no. 13: 2017. https://doi.org/10.3390/w14132017
Note that from the first issue of 2016, this journal uses article numbers instead of page numbers. See further details here.