Article

Seasonal Variation of Drinking Water Quality and Human Health Risk Assessment: A Case Study in Rural Village of the Eastern Cape, South Africa

by
Wendy Zimkhitha Mandindi
1,2,
Luthando Nyaba
1,2,*,
Nomvano Mketo
3 and
Philiswa Nosizo Nomngongo
1,2,*
1
Department of Chemical Sciences, University of Johannesburg, Doornfontein, Johannesburg 2028, South Africa
2
Department of Science and Innovation, University of Johannesburg, Doornfontein, Johannesburg 2028, South Africa
3
Department of Chemistry, College of Science and Engineering and Technology, Florida Science Campus, University of South Africa, Johannesburg 1709, South Africa
*
Authors to whom correspondence should be addressed.
Water 2022, 14(13), 2013; https://doi.org/10.3390/w14132013
Submission received: 4 May 2022 / Revised: 17 June 2022 / Accepted: 20 June 2022 / Published: 23 June 2022

Abstract

:
Contamination of drinking water by metals remains a global threat to living organisms. Therefore, the current study describes variations of metal occurrence, water quality and human health risk assessment between the dry and wet seasons of a rural village located in the Eastern Cape Province, South Africa. The concentrations of major and trace metals were determined in drinking water samples using inductively coupled plasma-optical emission spectrometry (ICP-OES). The physicochemical parameters, water quality index (WQI), total water hardness (TWH) and health risk assessment (hazard quotient: HQ and chronic daily intake: CDI) were evaluated seasonally. The TWH results showed that the water was very hard with water hardness values ranging between 415 and 442. The water also contained several metals and metalloids such as Al (2.18–3.36 mg L−1), As (0.17–0. 53 mg L−1), Cd (0.0068–0.0134 mg L−1), Cr (0.2481–0.2601 mg L−1), Mn (0.387–1.582 mg L−1), Pb (0.064–0.0802 mg L−1), Sb (0.0496–0.1391 mg L−1) and Se (0.075–0.148 mg L−1) that exceeded the SANS and WHO permissible limits in drinking water. The health risk assessment revealed that the water may cause noncarcinogenic and carcinogenic health effects due to the presence of As, Cr, Sb, Tl and V in water samples, while the water quality index revealed that the water was of very poor quality.

1. Introduction

The quality of drinking water is one of the most important factors affecting human health [1]. However, it has been reported that several communities in African and Asian countries lack access to safe drinking water which often leads to various waterborne diseases for the populations [2]. For example, South Africa is a semiarid country that has limited water supplies and therefore access to potable water remains a challenge especially for those South Africans living in rural areas [3]. Examples of factors affecting drinking water quality include rapid urbanization and industrialization which generally results in the degradation of chemical, biological and physical properties of water [4,5]. Moreover, the quality of water sources, water distribution systems, containers used for water storage and water treatment plants before distribution are other factors affecting drinking water quality. Additionally, the most reported factor in rural areas is the type of source water, which include boreholes, rivers, wells and lakes [1]. Furthermore, these groundwater and surface water sources of drinking water are prone to hydrology, rock-water interactions and agricultural runoffs which often introduce inorganic (major and trace metals) pollutants [6,7].
Major and trace metals present in drinking water has been attributed to various sources such as natural, urbanisation, industrialization, agricultural runoffs and traffic emissions, just to name a few [1,4,8,9]. Prolonged exposure and accumulation of major and trace metals may bring about various negative health effects which include cancer, skin lesions, peripheral gastrointestinal bleeding and shortness of breath [8]. For instance, ref. [10] reported that antimony exposure via water ingestion resulted in respiratory irritation and pneumoconiosis while cadmium brought about chronic renal failure and an increased risk of stillbirths for pregnant women. Additionally, manganese and iron are reported to affect muscle and neurological functions in the human body [5]. Renal dysfunction, cirrhosis, damage to DNA, allergies and cancer are some of the negative health effects that are reported due to uranium, vanadium, mercury and nickel exposure via water ingestion [10].
Due to the several issues and health risks associated with major and trace metals present in drinking water supplies, several South African researchers have investigated the concentration levels of these pollutants in drinking water. For example, ref. [11] evaluated the heavy metals present in the Nzhelele River of the Limpopo Province during the dry and wet seasons. The researchers discovered that the river water had elevated concentration levels of Cu, Fe, Mn, Pb and Zn during the dry season. Therefore, it was concluded that the water from the Nzhelele River was not safe for domestic use [11]. Genthe et al. [12] investigated the major and trace metal content of water and vegetables along a river catchment area that spreads across South Africa and Mozambique. Concerns started rising when several crocodiles mysteriously died in Olifants River near the border of the two countries. The findings of these researchers showed that As, Sb, Cd, Cr, Hg, Mo, Ni and Se exceeded the World Health Organization (WHO) acceptable limits in the South African water samples. Furthermore, the health risk assessment conducted indicated that as levels in the South African water samples posed a great cancer risk. Another study was conducted in the North West Province where [13] investigated the concentration levels of toxic metals in water, peat and sediment samples collected from the Wonderfonteinspruit River. The results from this study revealed that the levels of toxic metals in the river water samples were within the South African water quality guidelines for domestic and irrigation purposes.
This study aimed to determine the occurrence and concentration levels of major and trace metals in the drinking water supply of a rural village in the Eastern Cape Province, South Africa. Furthermore, a human health risk assessment was performed to evaluate the toxicity risks associated with consumption of the drinking water. It is worth to indicate that water was collected during dry and wet season.

2. Materials and Methods

2.1. Reagents

All the reagents and chemicals used were of analytical grade unless otherwise stated and ultrapure water (Direct-Q® 3UV-R purifier system, Millipore, Merck, Darmstadt, Germany) was used throughout the study. Ultrapure nitric acid (HNO3) (65%) was purchased from Sigma-Aldrich (St. Louis, MO, USA). Multielemental standard solutions with a concentration of 10 mg L−1 (De Bruyn spectroscopic solutions, Midrand, South Africa) were used for the quantification of the metal analytes. All glassware used was precleaned with metal ion free soap and rinsed with ultrapure water.

2.2. Sampling Site Description

The study area is Romanslaagte village located in the Hewu region of Whittlesea, Eastern Cape Province, South Africa. Whittlesea (32°10′33′′ S 26°49′28′′ E) is a semirural town situated about 37 km south of Queenstown and consists of a few townships and villages, with Romanslaagte being one of them. Romanslaagte consists of rolling and undulating hilly to very steep areas within the valley and consists mainly of sandstone of the Beaufort series intruded by dolerite. The area is also surrounded by thin dykes in which larger intrusions occur. The altitude of the area varies from 1280.2 m to 1463.0 m [14]. The study area has a climate which varies from arid to very cold high veld climate and generally falls into two climatic zones. The mean annual precipitation is between 301 mL and 600 mL [14]. The source of water for the villagers is generally groundwater, which is pumped from a windmill on the mountain to the taps spread across the village. The people of Romanslaagte have often complained of the water having a salty taste to it, which sometimes leads to diarrhoea for some people.

2.3. Sample Collection and Analysis

Water samples were collected using 1 L precleaned polyethylene bottles from two different water supplies (windmill and tap). Prior to sampling, the bottles were washed with water mixed with metal-ion-free soap and then rinsed several times with deionized water. Sample collection was carried out during the dry and wet seasons (2019–2020). It should be noted that there was no access to the windmill during the sampling time of the wet season and therefore there is no windmill sample data for the wet season. Upon the arrival of the samples in the laboratory, the pH, total dissolved solids (TDS) and electrical conductivity (EC) were measured. The samples were then treated with 0.5 mL of HNO3 and kept in the refrigerator until analysis. The HNO3 treatment was done to limit microbial growth within the samples. For accurate quantitative determination of the major and trace metals in water samples, multielemental standards were used to prepare calibration standards for elemental analysis. The water samples were filtered through 0.22 µm filters and then analysed in triplicates with ICP-OES. For quality assurance (QA) and quality check (QC), drinking water CRMs (NIST 1643) and procedure blank were analysed after each 10 samples.

2.4. Instrumentation

The pH of the water samples was measured using an OHAUS starter 2100 pH meter (Pine Brook, NJ, USA), while the total dissolved solids and electrical conductivity were determined with an OHAUS ST20-B pen meter and OHAUS ST20C-C conductivity pen meter (Pine Brook, NJ, USA), respectively. The major and trace metal concentrations of the samples were analysed using an inductively coupled plasma-optical emission spectrometer (ICP-OES) (iCAP 6500 DUO, Thermo Scientific, Horsham, UK) equipped with a charge injection device (CID) detector. A concentric nebulizer and cyclonic spray chamber were used to introduce the samples into the instrument. The operating conditions of the ICP-OES are represented in Table 1.

2.5. Total Water Hardness

Water hardness is defined as the measurement of the capability of water to react with soap and as a result, hard water requires more soap to form a lather [15,16]. The hardness of water is caused by various metallic ions principally calcium and magnesium ions. Additionally, aluminium, barium, iron, manganese, strontium and zinc ions also contribute to water hardness [15]. Total water hardness is however expressed as the concentration of calcium and magnesium ions in water as equivalent to calcium carbonate (CaCO3). Equation (1) [16] was used to calculate the total water hardness.
Total hardness = 2.5 (Ca2+) + 4.1 (Mg2+)
where 2.5 and 4.1 represent the ratio of the formula weight of CaCO3 to the atomic weight of Ca2+ and Mg2+, respectively. The hardness of water can be classified into various categories as shown in Table 2.

2.6. Water Quality Assessment

The values of fifteen parameters (pH, conductivity, TDS, K, Na, Ca, Mg, Al, total hardness, Zn, Cu, Co, V, Mn, and Cr) and the South African National Standard 241 (SANS 241:2015) for drinking water were used to estimate the water quality index (WQI) values, except for total hardness, where WHO guidelines were used. The Equations (2)–(5) [17] were used to calculate relative weights and WQI values.
The relative weight (RWi) was calculated using the following equation:
R W i = A W i A W i  
where RWi = relative weight and AWi = assigned weight. The parameters were assigned weights (AWi) between 1 and 5 according to their importance in water quality and impacts on public health.
The quality rating scale for each parameter is conveyed with the following equation:
q i = c i s i   × 100
where qi = quality rating for ith parameter, si = permissible standard for ith parameter set by the WHO and ci = concentration of ith chemical parameter of water sample (mg L−1)
Subindex (SIi) for each parameter is calculated using the following equation:
Sli = RWi × qi
where SIi = subindex of ith parameter and qi = rating based on concentration of ith parameter
WQI is calculated using the following equation:
W Q I = S l i  
The classification of WQI is classified according to five categories, as shown in Table 3.

2.7. Health Risk Assessment

The health risk assessment was determined by calculating the chronic daily intake and health risk index. The daily exposure via water ingestion was calculated using Equation (6) [18].
C D I = C P W × I R × E D × E F A B W × A E T  
where CDI is the average daily dose (mg/kg/day) of nitrates ingested, CPW is the concentration of potentially harmful trace metals (µg/L) in river water, IR is the ingestion rate per specified time (L/day), ED is the exposure duration (years), EF is the exposure frequency (days/year), ABW is the average body weight (kg) of a person, and AET is the average exposure time (years).
Additionally, the hazard quotient (HQ) was used to estimate the noncarcinogenic health risk of potential harmful metals through water consumption. Moreover, the HQ was calculated according to Equation (7) [19].
H Q = C D I R f D  
where HQ and RfD are the hazard quotient and reference dose of potentially harmful elements through ingestion. According to USEPA, HQ  <  1 reveals implausible adverse health impact to the exposed humans, whereas HQ  ≥  1 suggests that there is a possibility that noncarcinogenic impacts might occur [20].
The incremental lifetime cancer risk is expressed as the probability of an individual developing any type of cancer over a lifetime of 70 years. The carcinogenic risk probability of As, Cd and Pb in water samples was calculated using incremental lifetime cancer risk equation (Equation (8)) [21,22].
ILCR = CDI × CSF
where CDI is the chronic daily intake and CSF is the cancer slope factor in kg·day/mg. The CSF values used were 4.6 × 10⁻³, 3.8 × 10⁻¹ and 8.5 × 10⁻³ for As, Cd and Pb, respectively [21,22]. The acceptable range for an element’s lifetime cancer risk is between 1 × 10⁻⁶ and 1.0 × 10⁻⁴ as recommended by USEPA [23].

3. Results and Discussion

3.1. Physicochemical Parameters
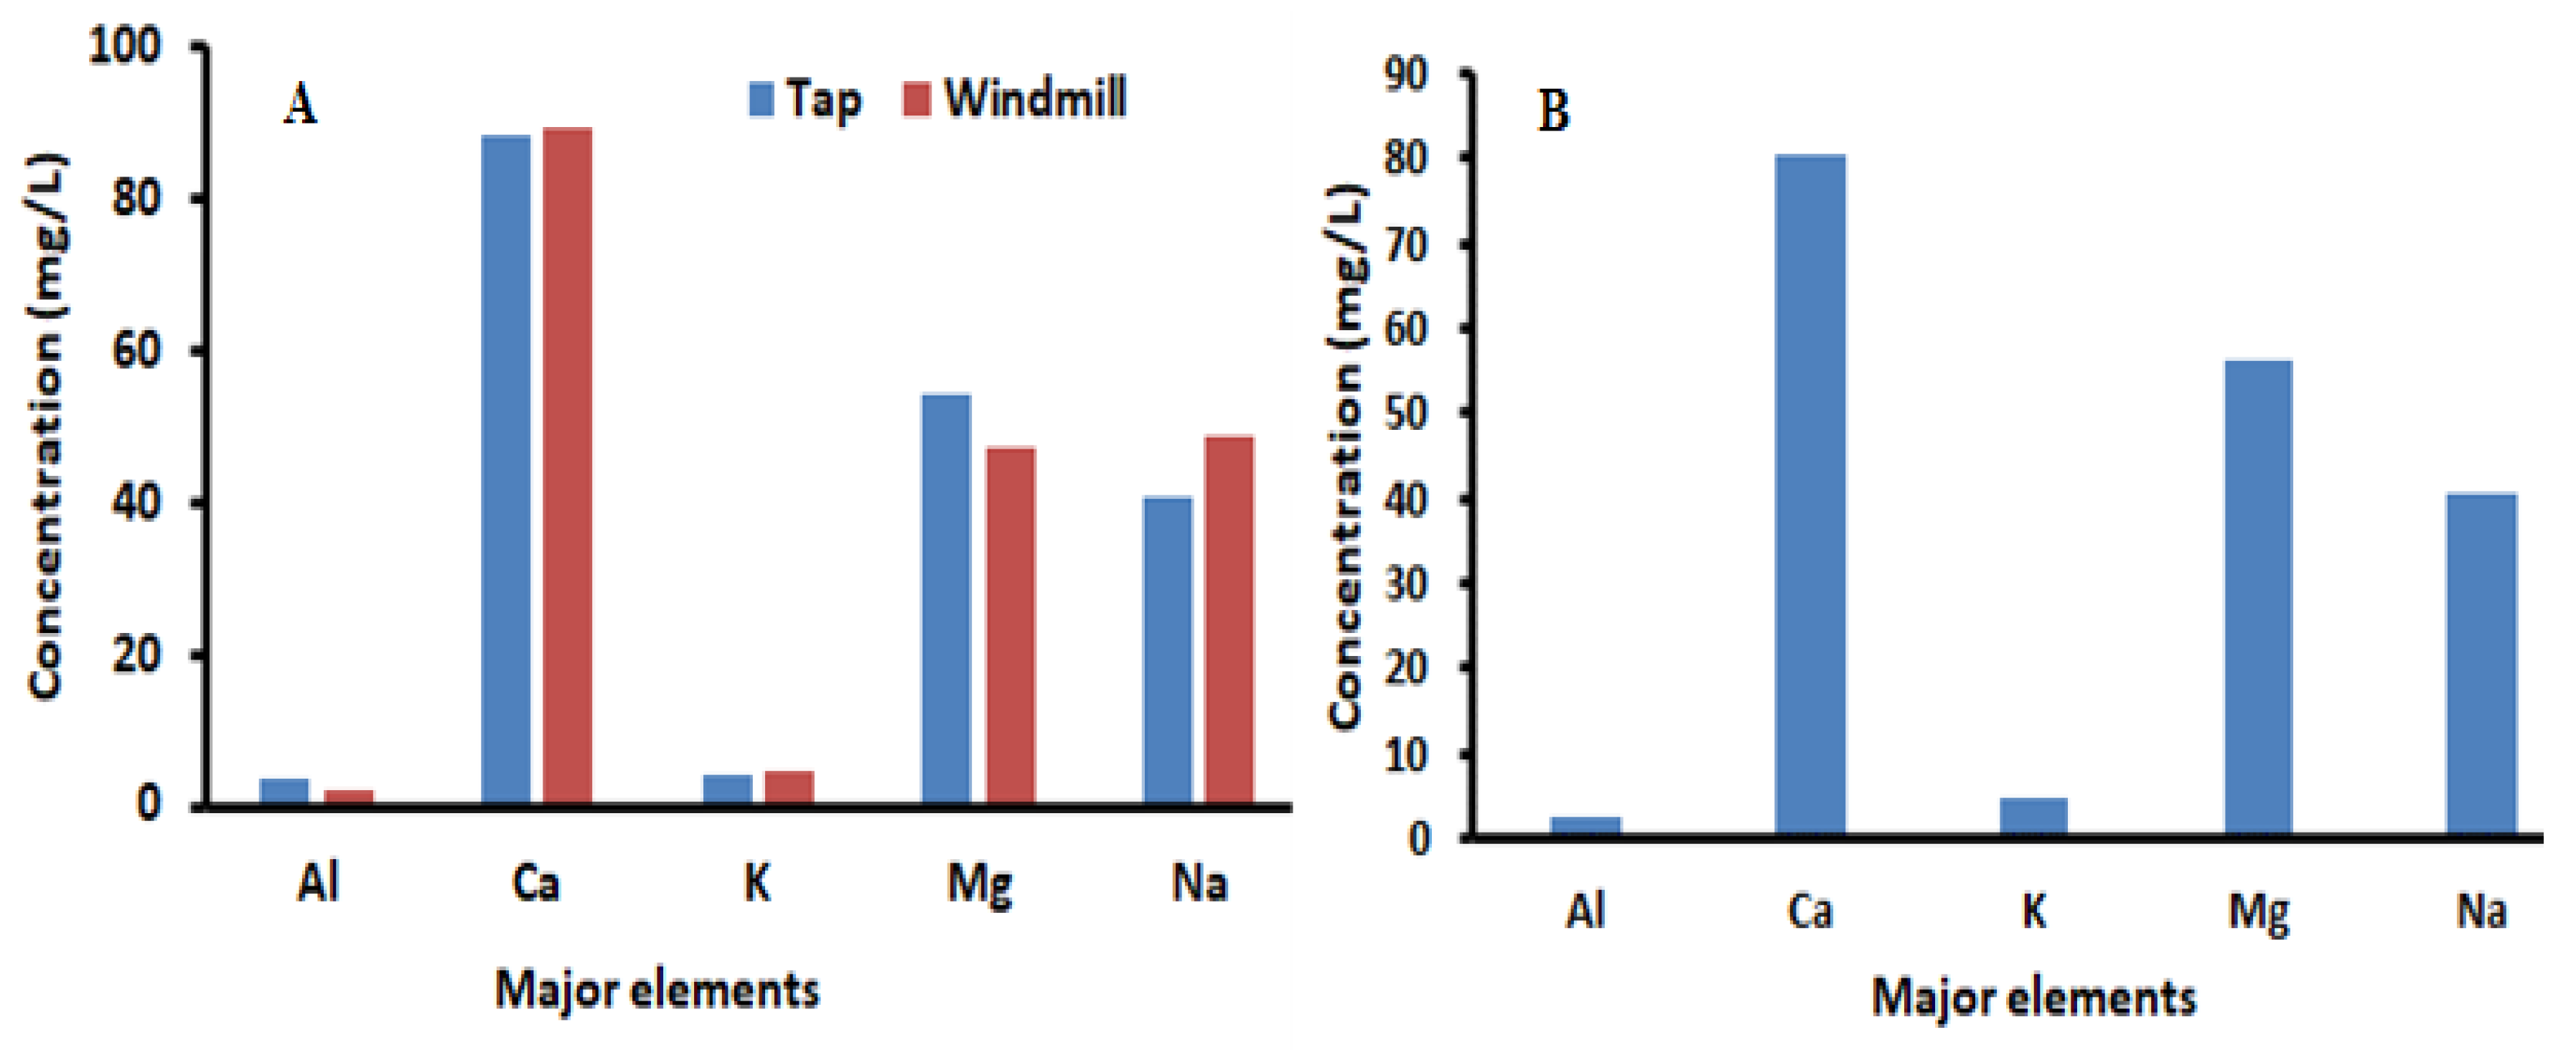
The physicochemical parameters were compared for both sample types and both seasons of collection. The pH of the tap water was recorded as 7.24 and 7.26 for the dry and wet seasons, respectively. However, the windmill water samples recorded a slightly lower pH of 7.18, further indicating that the water of the study area consists of neutral conditions. The pH of both the tap and windmill water samples indicated that the water was characterised of weak acidic conditions to weak basic conditions [24]. In Zakir et al. [25], neutral pH values were associated with high amounts of Ca, Mg and Na ions in water, which is also the case for the water of the current study. The results also showed limited pH variations between the two sampling seasons. Furthermore, the pH of all water samples was found to be within the WHO permissible limits of 6.5 to 8.5 for drinking water [26]. In the aquatic ecosystem, pH influences the solubility of toxic metals which can have a negative effect on aquatic living organisms and human health [27]. Ustaoğlu et al. [17] mentioned that there is a close relationship between TDS and EC and hence [28], reported that high levels of EC and TDS indicate the presence of dissolved minerals and organic substances in water. Furthermore, the WHO set the acceptable limit of TDS in drinking water at 1000 mg L−1. The drinking water of the current study was found to be within the WHO acceptable limits as the TDS ranged between 230 and 233 mg L−1 while the EC was recorded as 550 µS/cm for both sampling seasons.

3.2. Major Elements

The mean major metal concentrations were found to be generally in the order of Ca > Mg > Na > K > Al in both the tap and windmill water samples as seen in Figure 1. However, it should be noted that Na (48.7 mg L−1) was slightly more concentrated than Mg (46.9 mg L−1) in the windmill water during the dry season. The water contains elevated levels of Ca, Mg and Na, with the windmill water sample containing the highest concentration of Ca at 89.0 mg L−1. Calcium and magnesium are reportedly the principal sources of water hardness [15]. The presence of Mg and Ca in groundwater from the current study can be attributed to the hydrogeochemical removal of these elements from carbonate-rich rocks [27,29]. Rocks rich in carbonates have been reported to include sedimentary rocks such as limestone [15]. Aluminium, manganese and zinc have also been reported as sources of water hardness [15] and all are present in the drinking water of the current study. Aluminium and potassium were the major metals with the lowest concentrations in drinking water, however, Al levels still exceeded the limit set by WHO in drinking water [26]. The results obtained from the analysis of major elements have shown that the salinity of the water samples increases during the dry season and is low during the wet season. The reason for the difference between the two sampling seasons can be attributed to evaporation and less dilution of saline ground inputs [11] as there is less rain during the dry season which consequently results in higher salinity and high concentration of major elements such as Ca and Al during the dry season.

3.3. Total Hardness

Water samples of the current study contained the principal ions (Ca, Mg) of water hardness along with some of the other metallic ions (Al, Mn, Zn) which also contribute to total water hardness. The hardness values for the investigated water sources were 442 for tap water during dry season, 415 for windmill water during dry season and 432 for tap water during the wet season. Therefore, the highest water hardness value in the current study was recorded in tap water during the dry season. The WHO reported that water with a hardness value of over 180 can be classified as very hard (Table 2) [15] and as such, the water of the current study is very hard. Additionally, this was further confirmed by the Rand water classification which states that water with a hardness value of over 300 is classified as very hard as well.

3.4. Potential Harmful Trace Elements

The average concentrations of trace metals in drinking water are presented in Figure 2. With regards to trace metal concentrations, the most dominant trace metals and metalloids in the current study include As, Mn, Tl and V with Mn recording its highest concentration (1582 µg L−1) in tap water during the wet season (Figure 2B). The levels of Mn were lower during the dry season with the windmill water recording a concentration of 713 µg L−1 compared to the tap water’s 387 µg L−1 (Figure 2A). It must be noted that the Mn levels were only within the WHO allowable limits in the tap water during the dry season. The results obtained from the study revealed a trend as the concentration of trace metals were found to be higher during the wet season as compared to the dry season with the exception of Sb, Se, Tl and Zn. This could be because of various factors within the study area such as geological weathering. Arsenic on the other hand much like Mn showed higher levels during the wet season. Furthermore, Cr was not detected in tap water during the dry season but was detected at 248 µg L−1 in the wet season exceeding the WHO limit of 50 µg L−1. The presence of Cr during the wet season can be attributed to anthropogenic activities and rainfall leachate into the water source. It must be noted that even with its varying concentrations between the two seasons, Zn generally stayed within its allowable limit. Furthermore: As, Cd, Cr, Mn, Pb, Sb and Se collectively exceeded the allowable limits in drinking water set by the South African National Standards (SANS241-1:2015) and the WHO [26,30]. The results obtained from the study suggest that the flow rate from the rainfall, precipitation, and anthropogenic activities (such as agricultural practices) around the sampling site may have had an influence on the increment of the trace metal contamination within the water bodies during the wet season. Additionally, since the study area is a remote rural place, the results suggest that the major contributor of the metals might be as a result of natural weathering of the rocks along with other geological activities within the area such as soil erosion during the rainy wet season. Elevated levels of As, Cd, Cr, Mn and Pb can lead to various health issues such as cancer, high blood pressure, anaemia and Alzheimer’s [31,32,33]. Therefore, the people of Romanslaagte may be at risk of developing such illnesses due to their prolonged exposure to these toxic metals and metalloids through oral route via ingestion of the water and use of the water for cooking purposes.

3.5. Water Quality Assessment

The water quality of the current study was evaluated by analysing the physicochemical properties, water hardness, major and trace element levels, and the water quality index. The water quality variables and their desirable South African National Standard 241 (SANS 241:2015) as well as weight and relative weights are presented in Table 4. The assignment of weights to calculate the WQI values for river water parameters was adopted from the literature [34,35,36,37,38]. WQI assists in indicating if water is good or unsuitable for drinking, irrigation, and industrial purposes. In the current study, WQI for Tap water-Dry season, Windmill water-Dry season and Tap water wet season were 149, 182 and 222, respectively. The WQI results obtained for the dry season were in the range of 100–200 and therefore the water can be classified as of poor quality. However, the WQI results for the wet season were in the range of 200–300 thereby classifying the water as very poor further confirming that the water of Romanslaagte is of poor quality for drinking purposes.

3.6. Health Risk Assessment

3.6.1. Chronic Daily Intakes (CDI) of Trace Metals

The CDI values of the selected investigated trace metals are presented in Table 5. Based on the results obtained, the CDIs of trace metals in drinking water for both adults and children collected during the dry season were found in the order of Cr < Cd < Co < Cu < Pb < Sb < Se < V < As < Mn < Zn < Tl and Cu < Cd < Co < Sb < Pb < Se < As < Cr < V < Zn < Tl < Mn through tap water and windmill water consumptions, respectively. During the wet season, the CDIs of trace metals were Cd < Co < Sb < Pb< Se< Cu < Zn < Cr < As < V < Tl < Mn trough tap water intake. It can be seen from Table 4 that the CDIs of the trace metals differed slightly in tap water during the dry and wet seasons. Furthermore, As, Cr, Tl, Sb and V CDI values exceeded the corresponding RfD value, while that of other trace elements were within their RfD limits set by the United States Environmental Protection Agency [39]. An RfD value is the estimated value per day of exposure of a certain metal to the human body that has no hazardous effect during a lifetime [24]. Therefore, As, Cr, Tl, Sb and V pose serious health threats to the community of the study area due to their CDI values exceeding the RfD value. Furthermore, it has been reported in the literature that even trace amounts of As, Cr, Sb and Tl are threatening to human health [40]. For example, exposure to As has been reported to cause cancer, neurological issues, skin lesions and abdominal pains [32,33]. On the other hand; Cr, Sb and Tl are reportedly toxic to human and marine life [41]. Vanadium exposure reportedly causes stomach cramps, nausea, diarrhoea and in certain cases lung cancer [42,43]. Wu et al. [44] performed a health risk assessment on boiled and normal drinking water of rural areas from China and they found that most of their CDI values were lower than the RfD values of most of their investigated trace metals.

3.6.2. Hazard Quotient (HQ)

The HQ values of investigated trace metals are presented in Table 6. The trend of the HQ for trace metals was ranked as follows; tap water dry season: Cr < Co < Cu < Zn < Mn < Cd < Pb < V < Se < Sb < As < Tl; windmill dry season: Cu< Co < Zn < Mn < Cd < Se < Pb < V< Cr < Sb < As < Tl and tap water wet season: Zn < Co < Cu < Mn < Se < Pb < Cd < V < Cr < Sb <As <Tl. Mirzabeygi et al. [20] mentioned that an HQ > 1 indicates the possibility of noncancerous health effects and in the current study, As, Cr, Sb, Tl and V all recorded HQ that are greater than 1. Therefore, indicating that the people who consume the water from Romanslaagte village are at risk of developing negative health effects which are not cancerous. Results of the HQ were in line with [45], who reported that all investigated metals contained an HQ greater than 1. The elements studied by [45] included Pb, Fe, Cd, and Cr in rural Nigeria, this then indicates that Cr may pose negative health effects in rural Nigeria and rural South Africa.

3.6.3. Carcinogenic Risk

The carcinogenic risk posed by As, Cd and Pb in the water samples was determined by calculating the incremental lifetime cancer risk (ILCR). The ILCR values are presented in Table 7. The ILCR levels of the identified carcinogens were found to be above the acceptable range of between 1 × 10⁻⁶ and 1.0 × 10⁻⁴. Furthermore, ILCR levels of As, Cd and Pb were found to be the highest in women and children compared to men as seen on Table 7. This could be attributed to the average body weight of women and children being lower than that of men [21]. It is also noted that Cd plays a major role in the carcinogenic risk of the study area as it recorded the highest ILCR levels compared to As and Pb. The results obtained suggest that As, Cd and Pb might pose serious harmful effects to human being in the study area, as the consumption or ingestion of the water may lead to the development of different diseases.

4. Conclusions

The current study was conducted to assess the concentration levels of major, trace metals and metalloids in the drinking water collected from Romanslaagte village, Whittlesea, Eastern Cape (South Africa). The results generally showed that most of the studied metals were present in the water at elevated concentrations especially As, Al, Cd, Cr, Mn, Pb, Sb and Se. These elements were found to have levels exceeding the maximum allowable limits in drinking water set by SANS and WHO. It was also discovered that the studied water was classified as very hard due to the total water hardness values ranging between 415 and 442. Other physiochemical properties such as pH and major elements were found to be within the acceptable permissible limits for drinking and domestic use according to the WHO guidelines. The health risk assessment demonstrated that As, Cr, Sb, Tl and V had the possibility of causing noncarcinogenic health effects on community members, whereas the ILCR measurements for As, Cd and Pb were all above the acceptable limits, which demonstrates that they pose a huge danger to human health through accumulation and further causing cancers over time. Furthermore, WQI indicated that the water was of poor and very poor quality during the dry and wet seasons, respectively, therefore making the water unsafe for consumption. Additionally, a more in-depth study is required in the study area, focusing on more metal and speciation analysis, and environmental risk assessments as this will indicate the impact of these metals present within the water bodies.

Author Contributions

Conceptualization, P.N.N. and W.Z.M.; methodology, W.Z.M. and L.N.; formal analysis, W.Z.M.; investigation, W.Z.M.; data curation, P.N.N.; writing—original draft preparation, W.Z.M.; writing—review and editing, N.M., L.N. and P.N.N.; supervision, P.N.N.; cosupervision, N.M. and L.N.; funding acquisition, P.N.N. All authors have read and agreed to the published version of the manuscript.

Funding

This research was funded by the Department of Science and Innovation-National Research Foundation South African Research Chairs Initiative (DSI-NRF SARChI) grant no. 91230 and NRF Thuthuka grant no. 138375.

Institutional Review Board Statement

Not applicable.

Informed Consent Statement

Not applicable.

Data Availability Statement

Not applicable.

Acknowledgments

The authors wish to thank the University of Johannesburg for financial assistance and the Chemical Sciences department at the university for providing laboratory space and equipment. We also thank our colleagues in our research group for their input and assistance.

Conflicts of Interest

The authors declare no conflict of interest.

References

  1. Li, P.; Wu, J. Drinking Water Quality and Public Health. Expo. Health 2019, 11, 73–79. [Google Scholar] [CrossRef]
  2. Albratty, M.; Arbab, I.; Alhazmi, H.; Attafi, I.; Al-Rajab, A. Icp-Ms Determination of Trace Metals in Drinking Water Sources in Jazan Area, Saudi Arabia. Curr. World Environ. 2017, 12, 6–17. [Google Scholar] [CrossRef] [Green Version]
  3. Edokpayi, J.N.; Rogawski, E.T.; Kahler, D.M.; Hill, C.L.; Reynolds, C.; Nyathi, E.; Smith, J.A.; Odiyo, J.O.; Samie, A.; Bessong, P.; et al. Challenges to Sustainable Safe Drinking Water: A Case Study Ofwater Quality and Use across Seasons in Rural Communities in Limpopo Province, South Africa. Water 2018, 10, 159. [Google Scholar] [CrossRef] [Green Version]
  4. Zhang, F.; Huang, G.; Hou, Q.; Liu, C.; Zhang, Y.; Zhang, Q. Groundwater Quality in the Pearl River Delta after the Rapid Expansion of Industrialization and Urbanization: Distributions, Main Impact Indicators, and Driving Forces. J. Hydrol. 2019, 577, 124004. [Google Scholar] [CrossRef]
  5. Moyosore, J.O.; Coker, A.O.; Sridhar, M.K.C.; Mumuni, A. Iron and Manganese Levels of Groundwater in Selected Areas in Ibadan and Feasible Engineering Solutions. Eur. Sci. J. 2014, 10, 137–153. [Google Scholar]
  6. Long, D.T.; Pearson, A.L.; Voice, T.C.; Polanco-Rodríguez, A.G.; Sanchez-Rodríguez, E.C.; Xagoraraki, I.; Concha-Valdez, F.G.; Puc-Franco, M.; Lopez-Cetz, R.; Rzotkiewicz, A.T. Influence of Rainy Season and Land Use on Drinking Water Quality in a Karst Landscape, State of Yucatán, Mexico. Appl. Geochem. 2018, 98, 265–277. [Google Scholar] [CrossRef]
  7. Bacquart, T.; Frisbie, S.; Mitchell, E.; Grigg, L.; Cole, C.; Small, C.; Sarkar, B. Multiple Inorganic Toxic Substances Contaminating the Groundwater of Myingyan Township, Myanmar: Arsenic, Manganese, Fluoride, Iron, and Uranium. Sci. Total Environ. 2015, 517, 232–245. [Google Scholar] [CrossRef]
  8. Nkpaa, K.W.; Amadi, B.A.; Wegwu, M.O. Hazardous Metals Levels in Groundwater from Gokana, Rivers State, Nigeria: Non-Cancer and Cancer Health Risk Assessment. Hum. Ecol. Risk Assess. 2018, 24, 214–224. [Google Scholar] [CrossRef]
  9. Cobbina, S.J.; Duwiejuah, A.B.; Quansah, R.; Obiri, S.; Bakobie, N. Comparative Assessment of Heavy Metals in Drinking Water Sources in Two Small-Scale Mining Communities in Northern Ghana. Int. J. Environ. Res. Public Health 2015, 12, 10620–10634. [Google Scholar] [CrossRef] [Green Version]
  10. Fernández-Luqueño, F.; López-Valdez, F.; Gamero-Melo, P.; Luna-Suárez, S.; Aguilera-González, E.; Martínez, A.; García-Guillermo, M.; Hernández-Martínez, G.; Herrera-Mendoza, R.; Álvarez-Garza, M.; et al. Heavy Metal Pollution in Drinking Water-A Global Risk for Human Health: A Review. Afr. J. Environ. Sci. Technol. 2013, 7, 567–584. [Google Scholar] [CrossRef]
  11. Edokpayi, J.N.; Odiyo, J.O.; Popoola, E.O.; Msagati, T.A.M. Evaluation of Temporary Seasonal Variation of Heavy Metals and Their Potential Ecological Risk in Nzhelele River, South Africa. Open Chem. 2017, 15, 272–282. [Google Scholar] [CrossRef]
  12. Genthe, B.; Kapwata, T.; Le Roux, W.; Chamier, J.; Wright, C.Y. The Reach of Human Health Risks Associated with Metals/Metalloids in Water and Vegetables along a Contaminated River Catchment: South Africa and Mozambique. Chemosphere 2018, 199, 1–9. [Google Scholar] [CrossRef] [PubMed] [Green Version]
  13. Nsaka, N.C.; McCrindle, R.I.; Ambushe, A.A. Levels of Potentially Toxic Metals in Water, Sediment and Peat from Wonderfonteinspruit, North West Province, South Africa. J. Environ. Sci. Health Part A Toxic/Hazard. Subst. Environ. Eng. 2018, 53, 907–914. [Google Scholar] [CrossRef] [PubMed]
  14. Ighodaro, I.D.; Lategan, F.S.; Mupindu, W. The Impact of Soil Erosion as a Food Security and Rural Livelihoods Risk in South Africa. J. Agric. Sci. 2016, 8, 1. [Google Scholar] [CrossRef] [Green Version]
  15. WHO. Hardness in Drinking-Water, Background Document for Development of WHO Guidelines for Drinking-Water Quality; World Health Organization: Geneva, Switzerland, 2011; Volume 2. [Google Scholar]
  16. Bobrowsky, P.; Paulen, R.; Smedley, P.; Alloway, B.J. Water Hardness and Health Effects. In Essentials of Medical Geology; Selinus, O., Ed.; Springer: Dordrecht, The Netherlands, 2013; pp. 337–350. [Google Scholar] [CrossRef]
  17. Ustaoğlu, F.; Tepe, Y.; Taş, B. Assessment of Stream Quality and Health Risk in a Subtropical Turkey River System: A Combined Approach Using Statistical Analysis and Water Quality Index. Ecol. Indic. 2020, 113, 105815. [Google Scholar] [CrossRef]
  18. Suvarna, B.; Sunitha, V.; Reddy, Y.S.; Reddy, N.R. Data Health Risk Assessment of Nitrate Contamination in Groundwater of Rural Region in the Yerraguntla Mandal, South India. Data Br. 2020, 30, 105374. [Google Scholar] [CrossRef]
  19. Khan, K.; Lu, Y.; Khan, H.; Zakir, S.; Khan, S.; Khan, A.A.; Wei, L.; Wang, T. Health Risks Associated with Heavy Metals in the Drinking Water of Swat, Northern Pakistan. J. Environ. Sci. 2013, 25, 2003–2013. [Google Scholar] [CrossRef]
  20. Mirzabeygi, M.; Abbasnia, A.; Yunesian, M.; Nabizadeh, R.; Yousefi, N.; Hadi, M.; Mahvi, A.H. Heavy Metal Contamination and Health Risk Assessment in Drinking Water of Sistan and Baluchistan, Southeastern Iran. Hum. Ecol. Risk Assess. 2017, 23, 1893–1905. [Google Scholar] [CrossRef]
  21. Aendo, P.; Thongyuan, S.; Songserm, T.; Tulayakul, P. Carcinogenic and Non-Carcinogenic Risk Assessment of Heavy Metals Contamination in Duck Eggs and Meat as a Warning Scenario in Thailand. Sci. Total Environ. 2019, 689, 215–222. [Google Scholar] [CrossRef]
  22. Lee, J.S.; Chon, H.T.; Kim, K.W. Human Risk Assessment of As, Cd, Cu and Zn in the Abandoned Metal Mine Site. Environ. Geochem. Health 2005, 27, 185–191. [Google Scholar] [CrossRef]
  23. Rezaei, H.; Zarei, A.; Kamarehie, B.; Jafari, A.; Fakhri, Y.; Bidarpoor, F.; Karami, M.A.; Farhang, M.; Ghaderpoori, M.; Sadeghi, H.; et al. Levels, Distributions and Health Risk Assessment of Lead, Cadmium and Arsenic Found in Drinking Groundwater of Dehgolan’s Villages, Iran. Toxicol. Environ. Health Sci. 2019, 11, 54–62. [Google Scholar] [CrossRef]
  24. Sihlahla, M.; Mouri, H.; Nomngongo, P.N. Uptake of Trace Elements by Vegetable Plants Grown on Agricultural Soils: Evaluation of Trace Metal Accumulation and Potential Health Risk. J. Afr. Earth Sci. 2019, 160, 103635. [Google Scholar] [CrossRef]
  25. Zakir, H.M.; Islam, M. Hossain, S. Impact of Urbanization and Industrialization on Irrigation Water Quality of a Canal-A Case Study of Tongi Canal, Bangladesh. Adv. Environ. Res. 2016, 5, 109–123. [Google Scholar] [CrossRef]
  26. WHO. Standard for Drinking-Water Quality. In Guidelines for Drinking-Water Quality, 3rd ed.; World Health Organization: Geneva, Switzerland, 2015; pp. 1–4. [Google Scholar]
  27. Karavoltsos, S.; Sakellari, A.; Mihopoulos, N.; Dassenakis, M.; Scoullos, M.J. Evaluation of the Quality of Drinking Water in Regions of Greece. Desalination 2008, 224, 317–329. [Google Scholar] [CrossRef]
  28. Tenebe, I.T.; Emenike, C.P.G.; Daniel Chukwuka, C. Prevalence of Heavy Metals and Computation of Its Associated Risk in Surface Water Consumed in Ado-Odo Ota, South-West Nigeria. Hum. Ecol. Risk Assess. 2019, 25, 882–904. [Google Scholar] [CrossRef]
  29. Espinoza-Quiñones, F.R.; Módenes, A.N.; De Pauli, A.R.; Palácio, S.M. Analysis of Trace Elements in Groundwater Using ICP-OES and TXRF Techniques and Its Compliance with Brazilian Protection Standards. Water Air Soil Pollut. 2015, 226, 1–12. [Google Scholar] [CrossRef]
  30. Drinking Water Part 1: Microbiological, Physical, Aesthetic. SANS SANS 241-1; SABS Standards Division. Dr Lategan Road Groenkoof: Pretoria, South Africa, 2015.
  31. Akpor, O.B.; Muchie, M. Remediation of Heavy Metals in Drinking Water and Wastewater Treatment Systems: Processes and Applications. Int. J. Phys. Sci. 2010, 5, 1807–1817. [Google Scholar]
  32. Momodu, M.A.; Anyakora, C.A. Heavy Metal Contamination of Ground Water: The Surulere Case Study. Res. J. Environ. Earth Sci. 2010, 2, 39–43. [Google Scholar]
  33. Boateng, T.K.; Opoku, F.; Akoto, O. Heavy Metal Contamination Assessment of Groundwater Quality: A Case Study of Oti Landfill Site, Kumasi. Appl. Water Sci. 2019, 9, 33. [Google Scholar] [CrossRef] [Green Version]
  34. Bashir, N.; Saeed, R.; Afzaal, M.; Ahmad, A.; Muhammad, N.; Iqbal, J.; Khan, A.; Maqbool, Y.; Hameed, S. Water Quality Assessment of Lower Jhelum Canal in Pakistan by Using Geographic Information System (GIS). Groundw. Sustain. Dev. 2020, 10, 100357. [Google Scholar] [CrossRef]
  35. Dhayachandhran, K.S.; Jothilakshmi, M. Quality Assessment of Ground Water along the Banks of Adyar River Using GIS. Mater. Today Proc. 2020, 45, 6234–6241. [Google Scholar] [CrossRef]
  36. Gao, Y.; Qian, H.; Ren, W.; Wang, H.; Liu, F.; Yang, F. Hydrogeochemical Characterization and Quality Assessment of Groundwater Based on Integrated-Weight Water Quality Index in a Concentrated Urban Area. J. Clean. Prod. 2020, 260, 121006. [Google Scholar] [CrossRef]
  37. Sharmin, S.; Mia, J.; Miah, M.S.; Zakir, H.M. Hydrogeochemistry and Heavy Metal Contamination in Groundwaters of Dhaka Metropolitan City, Bangladesh: Assessment of Human Health Impact. HydroResearch 2020, 3, 106–117. [Google Scholar] [CrossRef]
  38. Singh, G.; Rishi, M.S.; Herojeet, R.; Kaur, L.; Priyanka; Sharma, K. Multivariate Analysis and Geochemical Signatures of Groundwater in the Agricultural Dominated Taluks of Jalandhar District, Punjab, India. J. Geochem. Explor. 2020, 208, 106395. [Google Scholar] [CrossRef]
  39. USEPA. Environmental Protection Agency. In Guidelines for Carcinogen Risk Assessment; U.S. Environmental Protection Agency: Washington, DC, USA, 2005. [Google Scholar]
  40. Järup, L. Hazards of Heavy Metal Contamination. Br. Med. Bull. 2003, 68, 167–182. [Google Scholar] [CrossRef] [PubMed] [Green Version]
  41. Muhammad, S.; Shah, M.T.; Khan, S. Health Risk Assessment of Heavy Metals and Their Source Apportionment in Drinking Water of Kohistan Region, Northern Pakistan. Microchem. J. 2011, 98, 334–343. [Google Scholar] [CrossRef]
  42. Ouyang, Y.; Higman, J.; Thompson, J.; O’Toole, T.; Campbell, D. Characterization and Spatial Distribution of Heavy Metals in Sediment from Cedar and Ortega Rivers Subbasin. J. Contam. Hydrol. 2002, 54, 19–35. [Google Scholar] [CrossRef]
  43. Zwolak, I. Vanadium Carcinogenic, Immunotoxic and Neurotoxic Effects: A Review of in Vitro Studies. Toxicol. Mech. Methods 2014, 6516, 1–12. [Google Scholar] [CrossRef]
  44. Wu, J.; Man, Y.; Sun, G.; Shang, L. Occurrence and Health-Risk Assessment of Trace Metals in Raw and Boiled Drinkingwater from Rural Areas of China. Water 2018, 10, 641. [Google Scholar] [CrossRef] [Green Version]
  45. Anyanwu, E.D.; Onyele, O.G. Human Health Risk Assessment of Some Heavy Metals in a Rural Spring, Southeastern NigeriaI. Afr. J. Environ. Nat. Sci. Res. 2018, 1, 15–23. [Google Scholar]
Figure 1. Metal concentrations (mg L−1) of major elements in drinking water collected during (A) dry and (B) wet seasons.
Water 14 02013 g001
Figure 2. Metal concentrations (µg L−1) of trace elements in tap and windmill water samples collected in (A) dry and (B) wet seasons.
Water 14 02013 g002
Table 1. Operating conditions of ICP-OES.
ICP-OES Conditions
RF generator powerW1150
RF generator frequencyMHz40
Coolant gas flowrateL min−112
Carrier gas flow rateL min−10.7
Auxiliary gasL min−11.0
Max integration timess15
Pump raterpm50
Viewing configuration Axial (trace metals), Radial (major metals)
Replicate 3
Flush times30
Table 2. Classification of water hardness according to WHO and rand waters.
Total HardnessClassification of Hardness
mg/L
WHORand WaterWHORand Water
<170–50SoftSoft
17–6050–100Slightly hardModerately soft
60–120100–150Moderately hardSlightly hard
120–180150–200HardModerately hard
>180200–300Very hardHard
->300-Very hard
Table 3. Classification of WQI values.
WQI ValuesClassification
<50Excellent water
50–100Good water
100–200Poor water
200–300Very poor water
>300Unsuitable for drinking
Table 4. WQI parameters, WHO desirable limit (2011 weights and relative weights) [34,35,36,37,38].
ParametersSANS 241 Limits (2015), (Si)Concentration (Ci)Assigned Weight (AWi)Relative Weight (RWi)
Tap Water-Dry SeasonWindmill-Dry SeasonTap Water Wet Season
pH8.57.24 ± 0.057.18 ± 0.047.26 ± 0.0540.080
Conductivity (µS/cm)1700550 ± 20550 ± 15550 ± 2530.060
TDS (mg/L)1200232 ± 12233 ± 13230 ± 1430.060
Potassium (mg/L)503.96 ± 0.094.45 ± 0.034.74 ± 0.1220.040
Sodium ion (mg/L)20040.6 ± 0.948.7 ± 0.640.7 ± 0.520.040
Calcium ion (mg/L)15087.9 ± 1.189.0 ± 2.180.4 ± 1.520.040
Magnesium ion (mg/L)7054.2 ± 1.246.9 ± 2.356.3 ± 1.720.040
Aluminium (mg/L)0.33.36 ± 0.042.19 ± 0.052.38 ± 0.0340.080
Total hardness as CaCO3 (mg/L)180 *442 ± 15415 ± 10432 ± 1550.10
Zinc (µg/L)5000760 ± 3570 ± 13150 ± 710.020
Copper (µg/L)20049.0 ± 0.7ND120 ± 620.040
Cobalt (µg/L)50020.0 ± 0.215.0 ± 0.826.0 ± 0.750.10
Vanadium (µg/L)200160 ± 3390 ± 15550 ± 1250.10
Manganese (µg/L)400390 ± 6710 ± 101580 ± 2050.10
Chromium (µg/L)50ND260 ± 8250 ± 1150.10
*: WH.
Table 5. Chronic daily intakes (CDIs, (mg/kg day)) of trace metals through drinking water.
ElementsTap Water-Dry SeasonWindmill-Dry SeasonTap Water-Wet SeasonRFD
MenWomenChildrenMenWomenChildrenMenWomenChildren
As8.729.449.4435.245.675.6716.317.717.70.3
Cd0.270.290.2930.210.230.230.410.450.450.5
Co0.610.660.6630.470.510.510.790.850.8520
Cr000.0008.008.678.677.638.278.273
Cu1.511.641.6370003.623.933.9340
Mn11.912.912.921.923.823.848.752.752.7140
Pb2.112.292.291.982.142.142.472.672.673.6
Sb4.284.644.641.821.981.981.531.651.650.4
Se4.554.934.932.302.492.492.602.822.825
Tl26.929.129.119.220.820.819.621.321.30.08
V5.005.415.4112.113.213.217.118.518.57
Zn23.525.525.517.518.918.94.705.095.09300
Table 6. Hazard quotient (HQ) values of trace metals through drinking water.
ElementsTap Water-Dry SeasonWindmill-Dry SeasonTap Water Wet Season
MenWomenChildrenMenWomenChildrenMenWomenChildren
As29.131.531.517.518.918.954.459.059.0
Cd0.540.590.590.420.450.450.820.890.89
Co0.030.030.030.020.030.030.040.040.04
Cr0.000.000.002.672.892.892.542.762.76
Cu0.0380.0410.0410.0000.0000.0000.0910.0980.098
Mn0.0850.0920.0920.160.170.170.350.380.38
Pb0.590.640.640.550.590.590.690.740.74
Sb10.711.611.64.564.944.943.824.134.13
Se0.910.990.990.460.500.500.520.560.56
Tl336364364240260260245266266
V0.710.770.771.731.881.882.442.642.64
Zn0.0780.0850.0850.0580.0630.0630.0160.0170.017
Table 7. Incremental lifetime cancer risk of As, Cd, Pb.
ElementsTap Water-Dry SeasonWindmill-Dry SeasonTap Water Wet Season
MenWomenChildrenMenWomenChildrenMenWomenChildren
As4.01 × 10−24.34 × 10−24.34 × 10−22.41 × 10−22.61 × 10−22.61 × 10−27.49 × 10−28.14 × 10−28.14 × 10−2
Cd1.02 × 10−11.10 × 10−11.11 × 10−17.98 × 10−28.74 × 10−28.74 × 10−21.56 × 10−11.71 × 10−11.71 × 10−1
Pb1.79 × 10−21.94 × 10−21.94 × 10−21.68 × 10−21.82 × 10−21.82 × 10−22.09 × 10−22.27 × 10−22.27 × 10−2
Publisher’s Note: MDPI stays neutral with regard to jurisdictional claims in published maps and institutional affiliations.

