
Simple ETo-Based Rules for Irrigation Scheduling by Smallholder Vegetable Farmers in Laos and Cambodia

 ,
, 
 , ,
, ,
Abstract
:1. Introduction
2. Materials and Methods
2.1. NASA POWER Weather Data and ETo-Based Method
2.2. Smallholder Farming Systems and Study Sites
2.3. Baseline Observations and Measurements
2.3.1. Field Observations
2.3.2. On-Farm Recording of Irrigation Practices
2.4. Field Experimentation and Demonstration Trials
2.4.1. Laos Experimental Designs
2.4.2. Cambodia Demonstration Trial Designs
2.4.3. Field Measurements and Data Analysis
3. Results
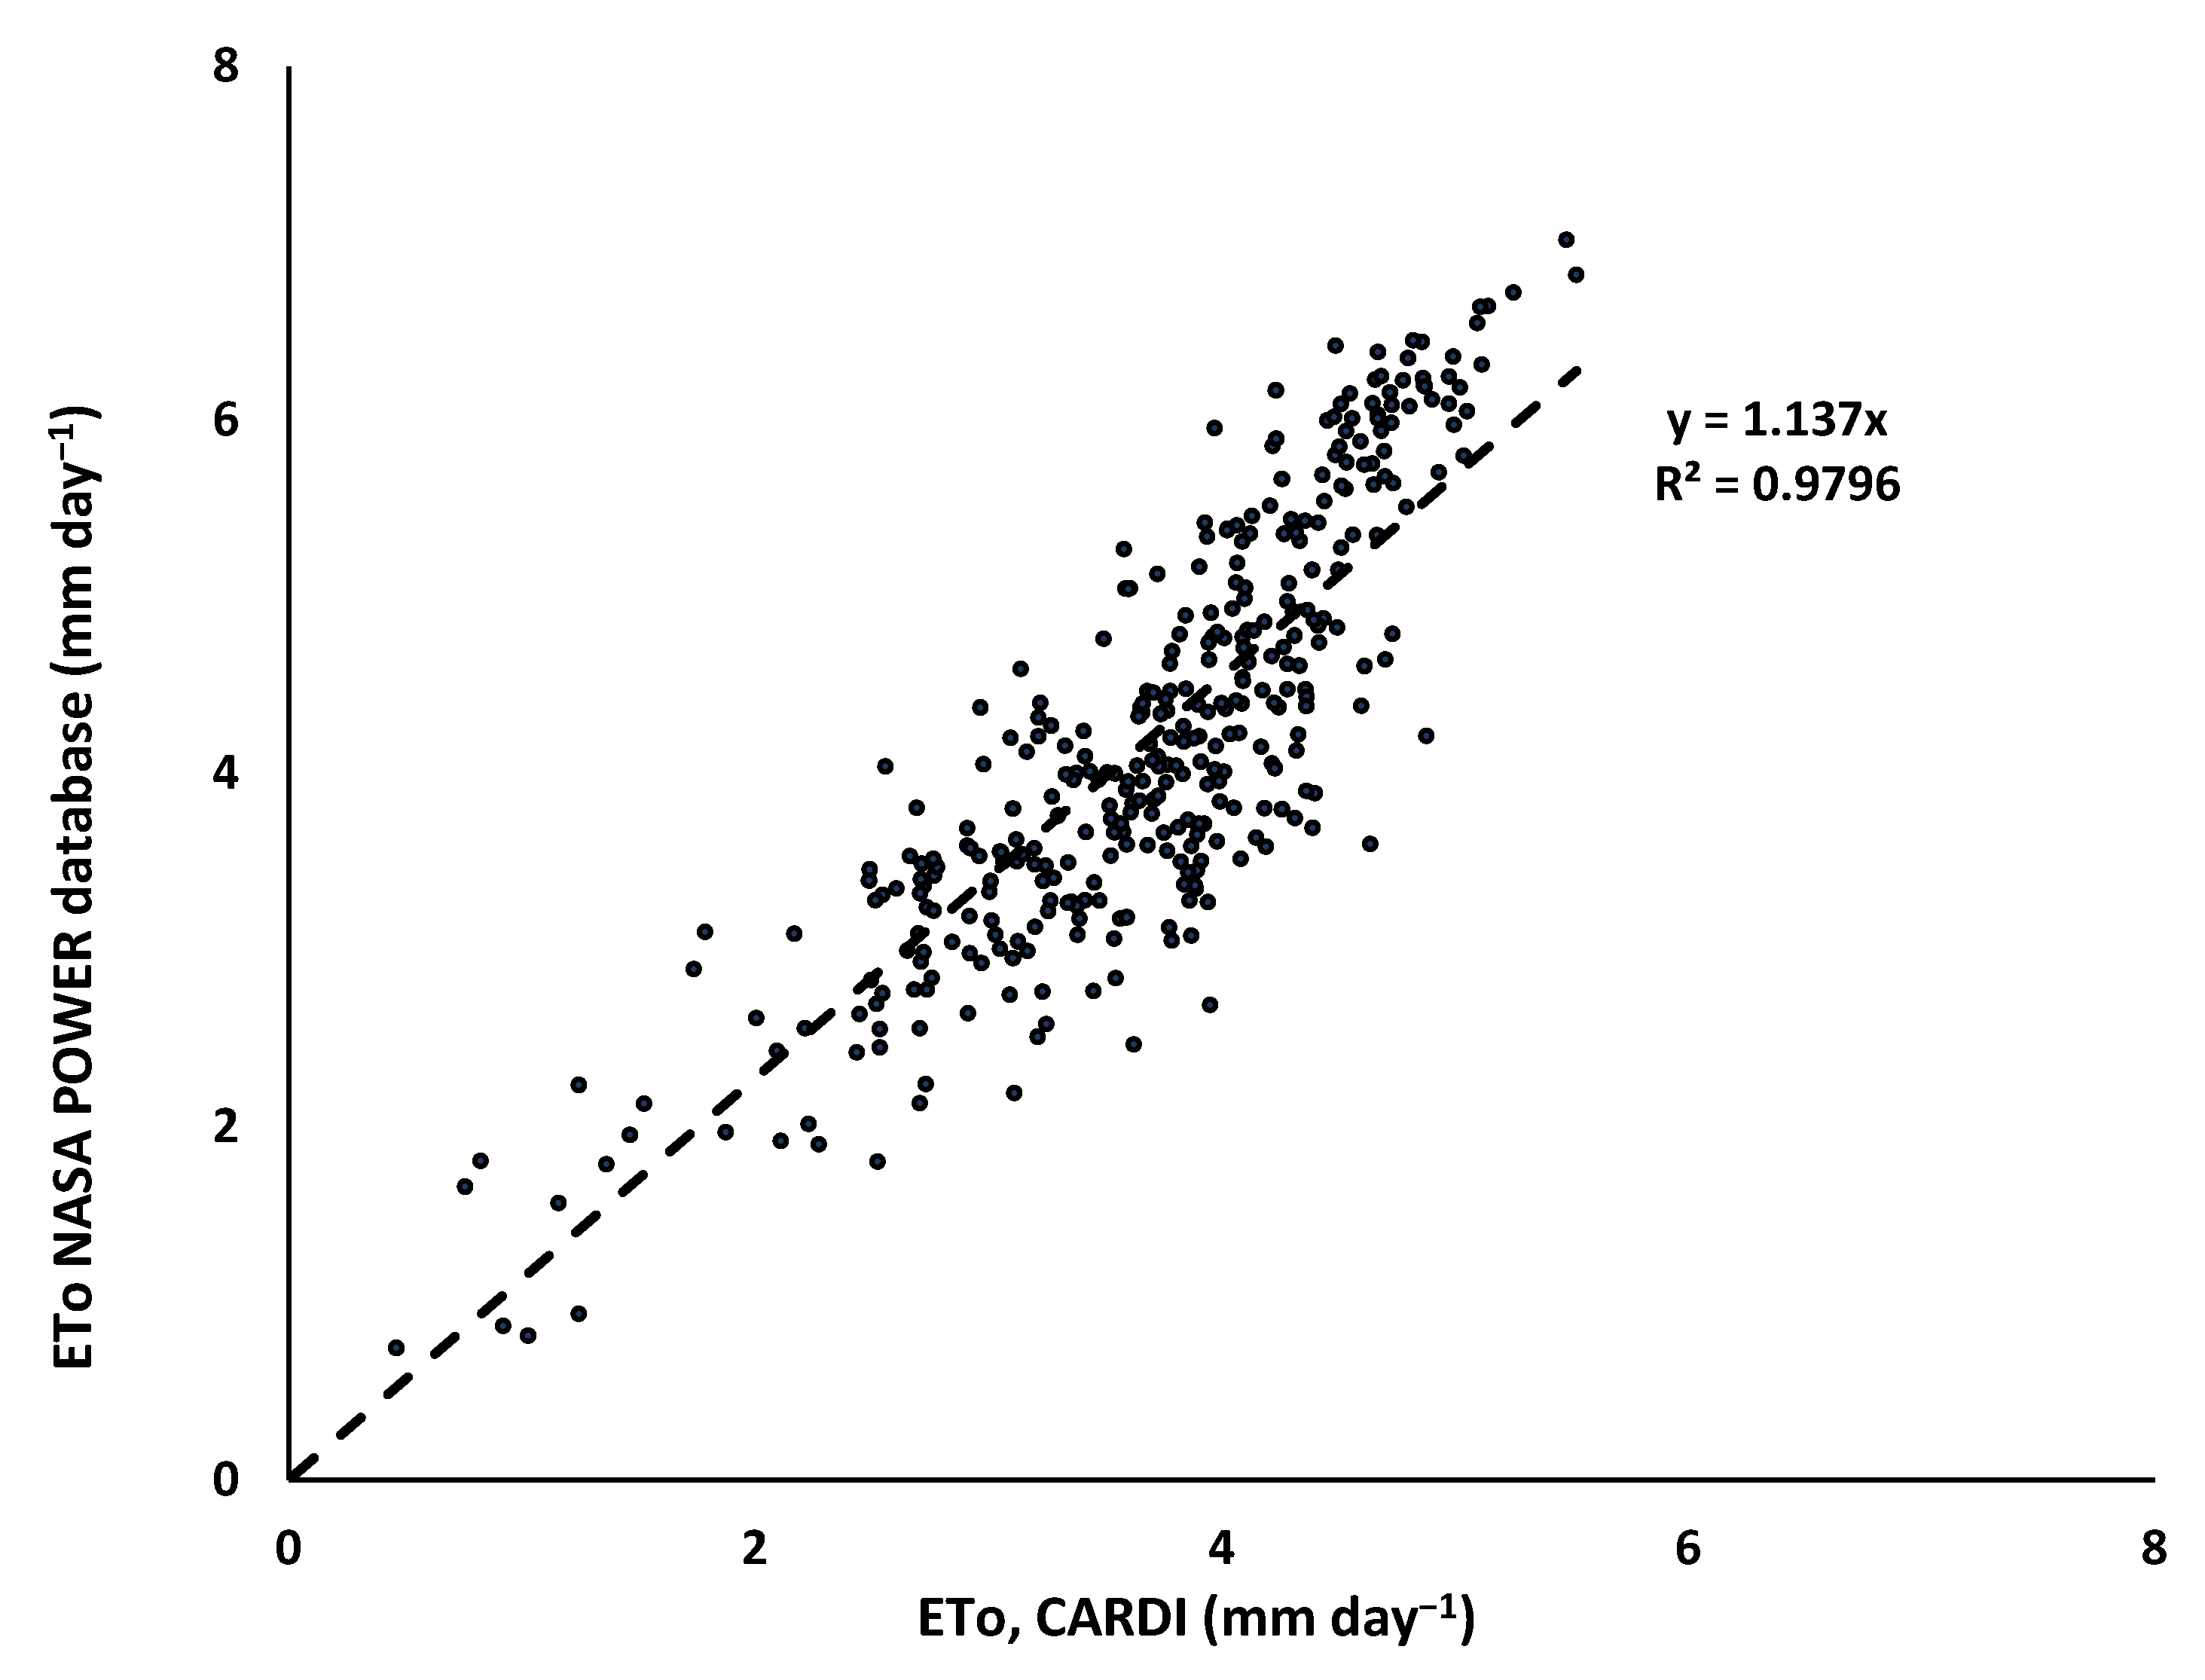
3.1. NASA POWER Weather Data and ETo-Based Method
3.2. Baseline Measurements
On-Farm Recording of Irrigation Practices, Cambodia
3.3. Field Experiments and Monitoring
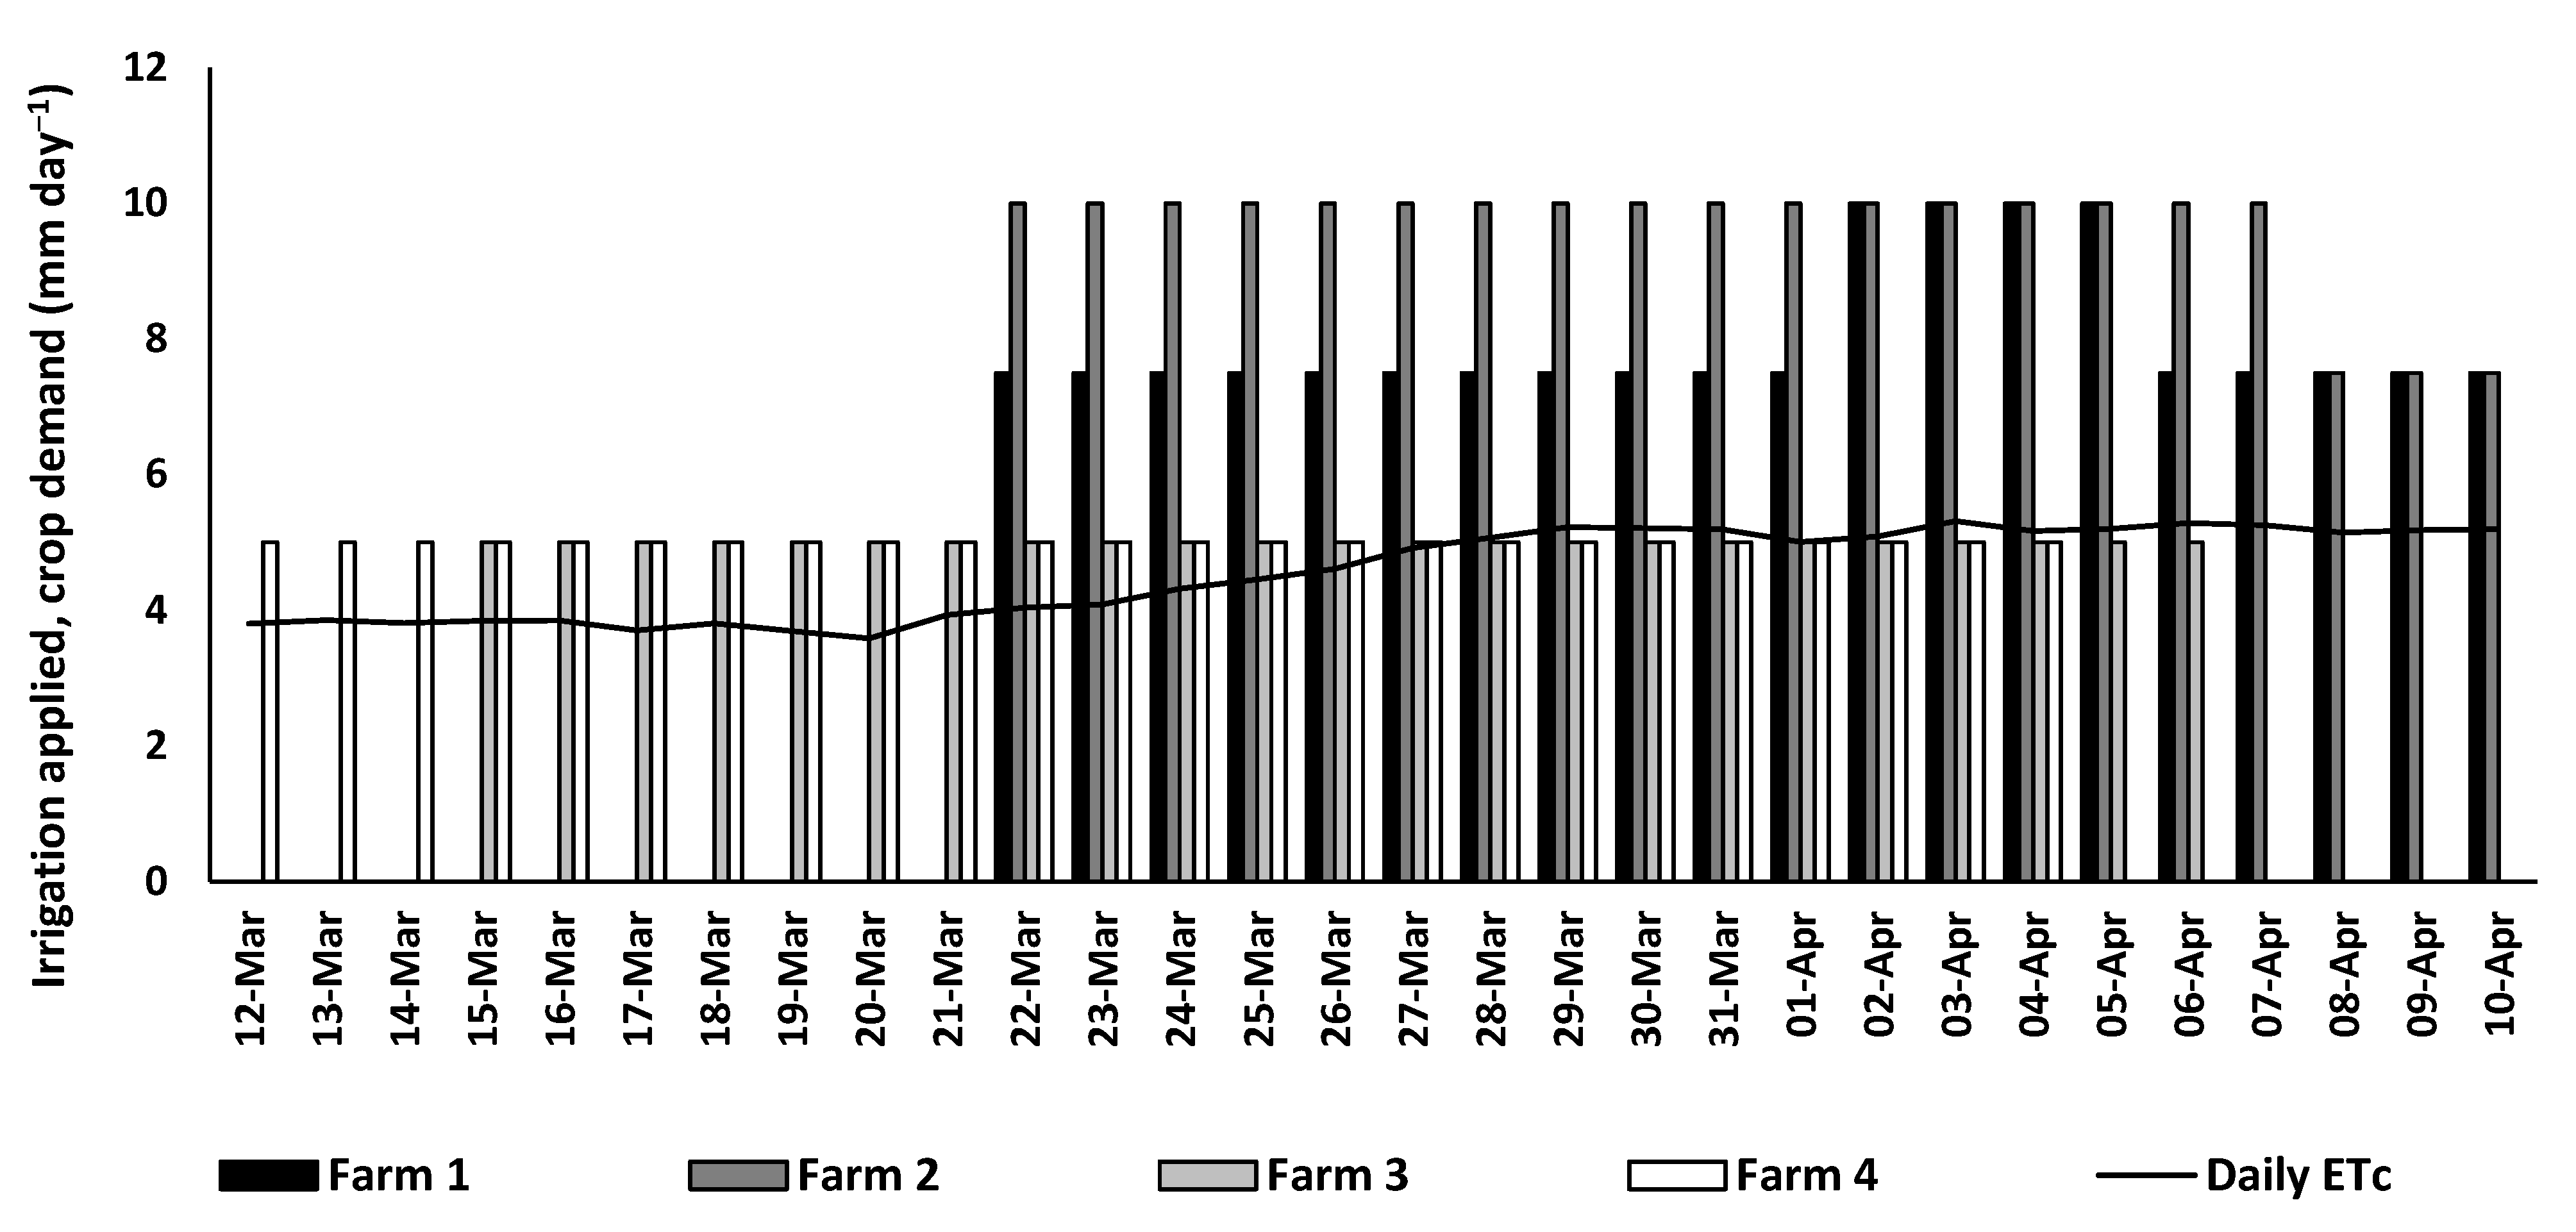
3.3.1. Laos
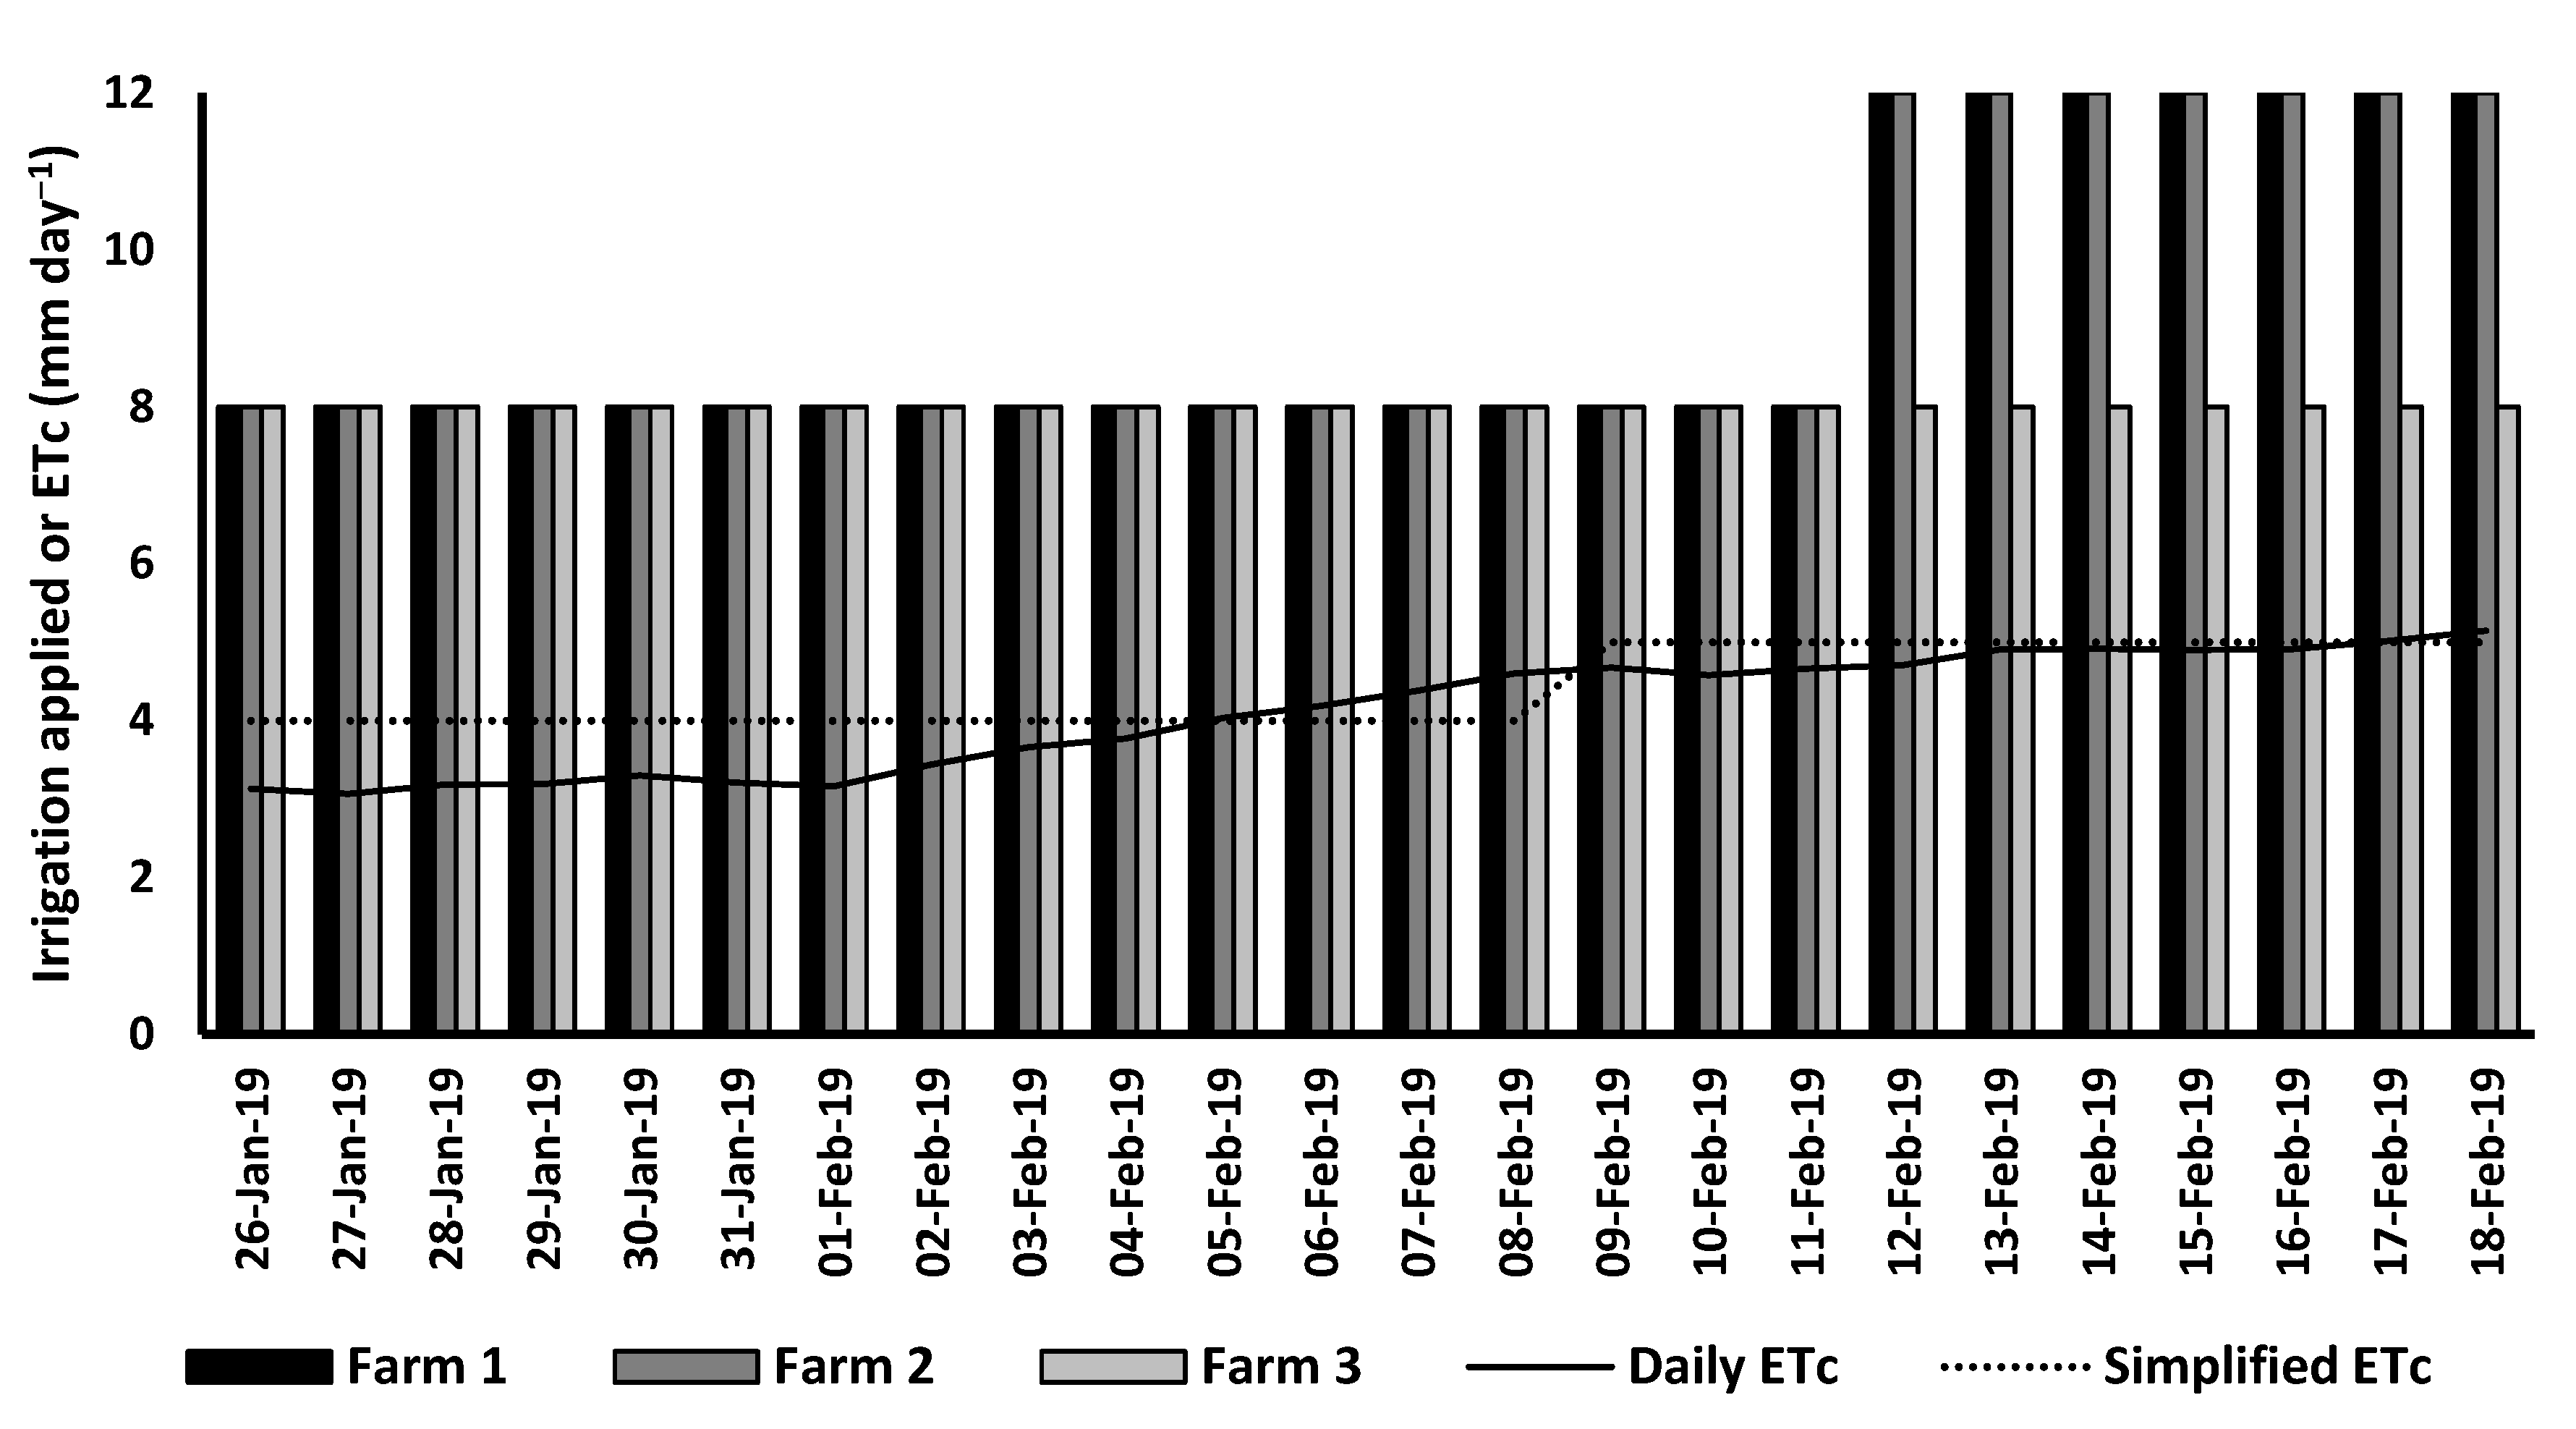
3.3.2. Cambodia
3.4. Development of ETc-Based Irrigation Scheduling Approach Suited to Smallholder Farmers
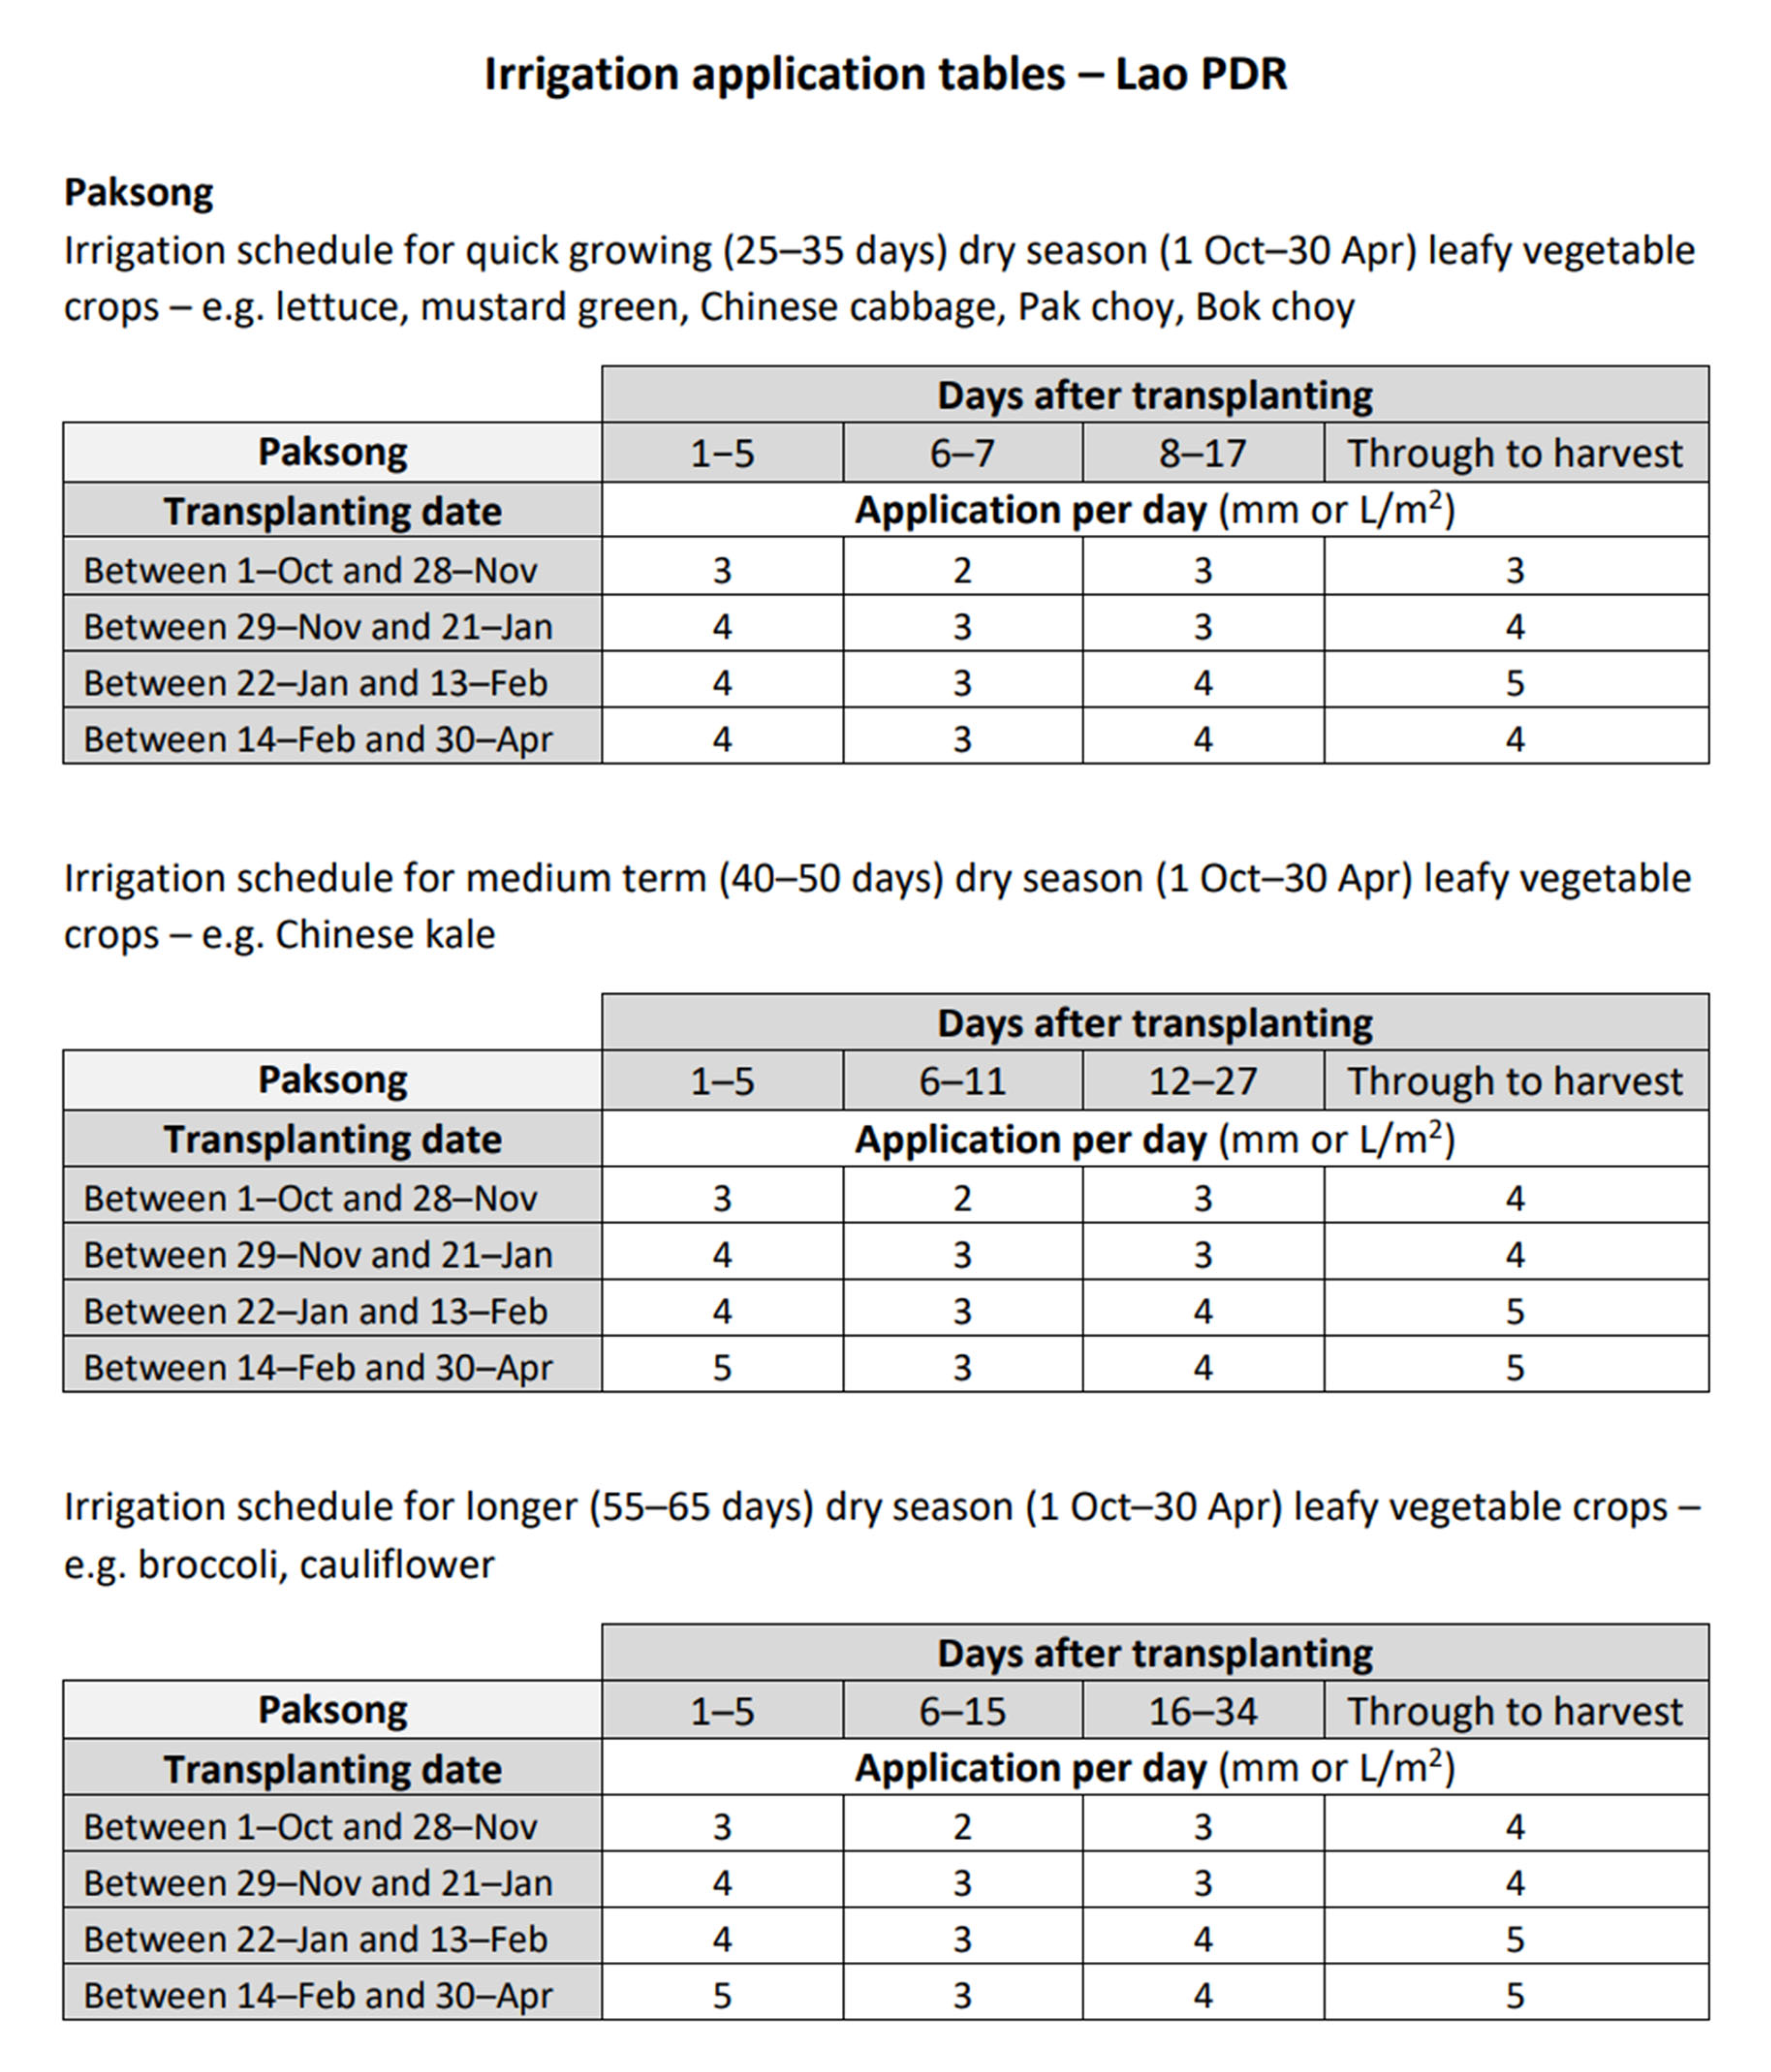
3.4.1. Daily Application Tables
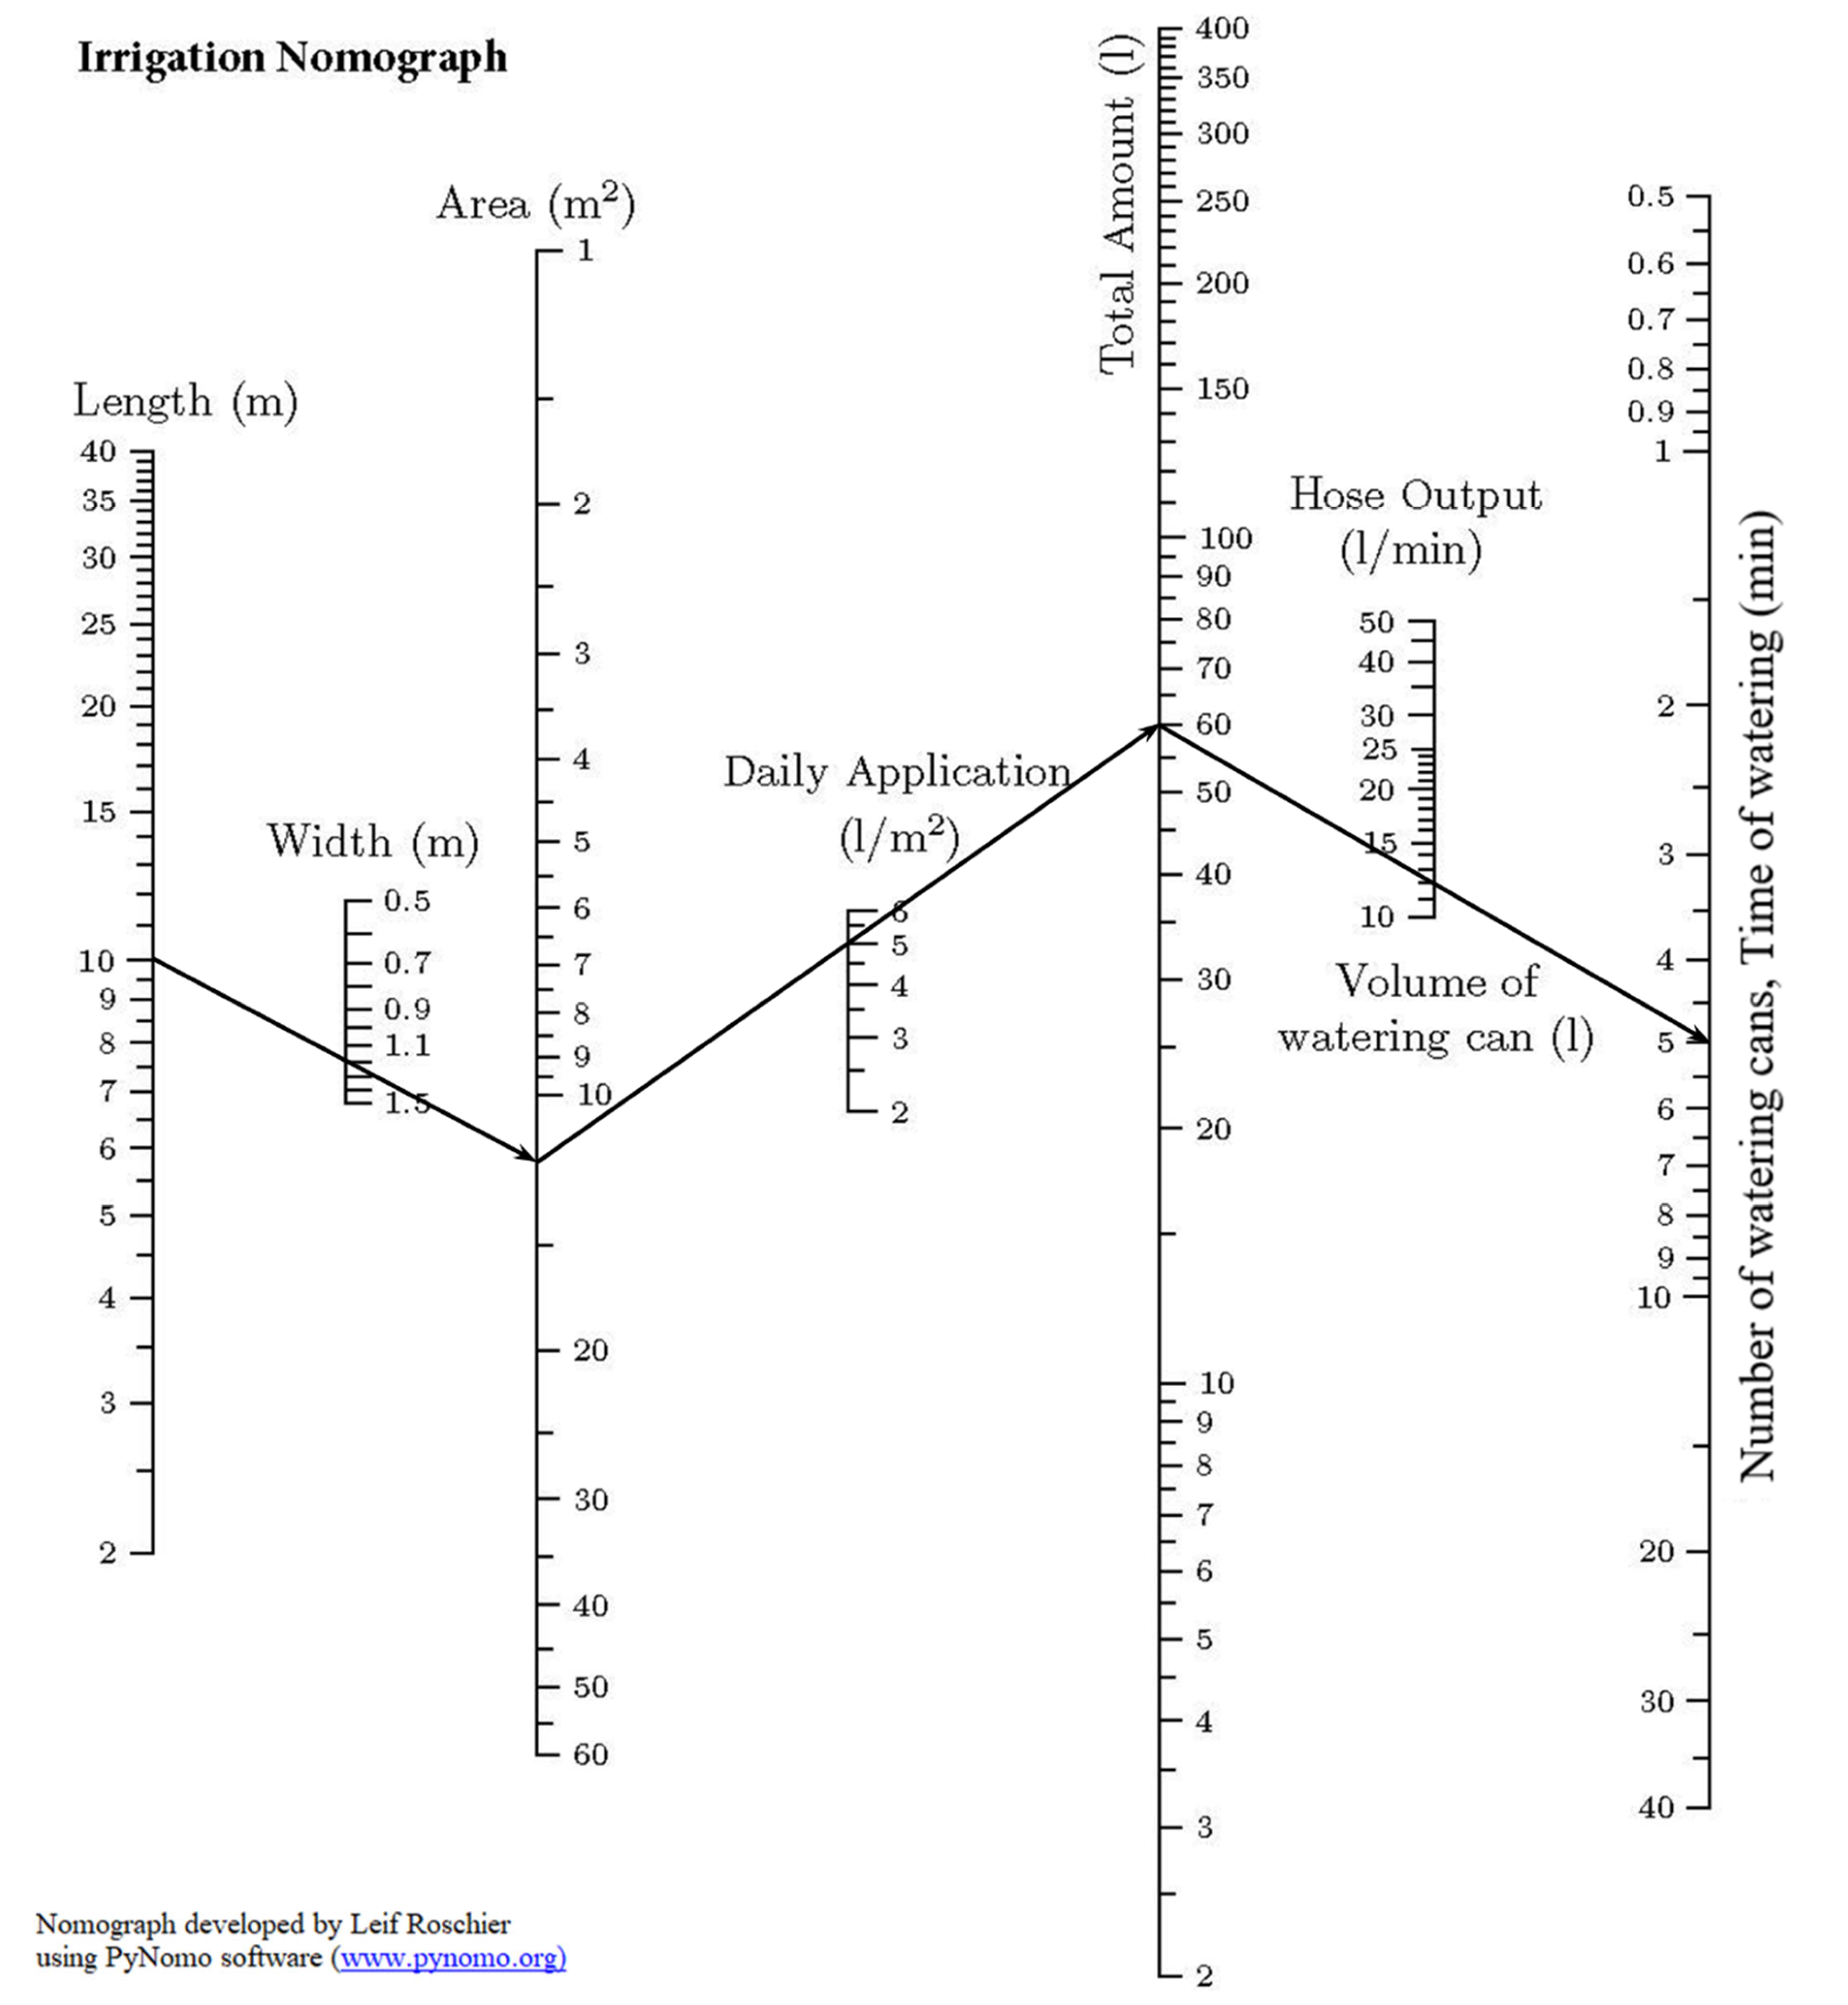
3.4.2. Development of Nomograph
4. Discussion
4.1. Impact of Improved Irrigation Scheduling on Water Use and Yield
4.2. Irrigation Scheduling Practice Change for Smallholder Vegetable Farmers
4.3. Utility of ETo-Based Irrigation Scheduling for Smallholder Vegetable Farmers and Their Advisors
4.4. Training and Future RD&E Needs
5. Conclusions
Supplementary Materials
Author Contributions
Funding
Acknowledgments
Conflicts of Interest
References
- LPDR. Development Strategy of the Crop Sector 2025 and Vision 2030; Report No. 0361/MAF; Ministry of Agriculture and Forestry: Vientiane, Laos, 2015; p. 31.
- Royal Government of Cambodia. Rectangular Strategy for Growth, Employment, Equity and Efficiency: Building the Foundation Toward Realizing the Cambodia Vision 2050; Royal Government of Cambodia: Phnom Penh, Cambodia, 2018; p. 48.
- Bhattarai, S.P.; Palada, M.C.; Midmore, D.J.; Wu, D.; Salas, R. On-farm evaluation of fertilizer briquettes and low-cost drip irrigation for smallholder vegetable production in Cambodia. Irrig. Drain. 2010, 60, 318–329. [Google Scholar] [CrossRef]
- Palada, M.; Bhattarai, S.; Roberts, M.; Bhattarai, M.; Baxter, N.; Kimsan, R.; Wu, D. Improving smallholder dry season vegetable production through increased water productivity with low cost drip irrigation technology in Cambodia. Acta Hortic. 2011, 133–140. [Google Scholar] [CrossRef]
- Palada, M.; Mercado, A.; Roberts, M.; Ella, V.; Reyes, M.; Susila, A.; Ha, D.; Wu, D.; Bhattarai, M. Farmers’ experiences with low-pressure drip irrigation for vegetable production in southeast asia and the pacific. Acta Hortic. 2011, 49–56. [Google Scholar] [CrossRef]
- Weinberger, K.; Lumpkin, T.A. Diversification into Horticulture and Poverty Reduction: A Research Agenda. World Dev. 2007, 35, 1464–1480. [Google Scholar] [CrossRef]
- Badgery-Parker, J.; Ku, V.; Kelly, G.; Wandschneider, T.; Stodart, B.; Wunderlich, N.; Chhunhy, H.; Bunna, S.; Sophal, C.; Sacklokham, S.; et al. Improving Market Engagement, Postharvest Management and Productivity of the Cambodian and Lao PDR Vegetable Industries; Final Report 2020-006; Australian Centre for International Agricultural Research: Canberra, Australia, 2020; p. 101. [Google Scholar]
- Pereira, L.S. Higher performance through combined improvements in irrigation methods and scheduling: A discussion. Agric. Water Manag. 1999, 40, 153–169. [Google Scholar] [CrossRef]
- Ertek, A.; Şensoy, S.; Gedik, I.; Küçükyumuk, C. Irrigation scheduling based on pan evaporation values for cucumber (Cucumissativus L.) grown under field conditions. Agric. Water Manag. 2006, 81, 159–172. [Google Scholar] [CrossRef]
- Imtiyaz, M.; Mgadla, N.P.; Manase, S.K.; Chendo, K.; Mothobi, E.O. Yield and economic return of vegetable crops under variable irrigation. Irrig. Sci. 2000, 19, 87–93. [Google Scholar] [CrossRef]
- Locascio, S.J.; Smajstrla, A.G. Water Application Scheduling by Pan Evaporation for Drip-irrigated Tomato. J. Am. Soc. Hortic. Sci. 1996, 121, 63–68. [Google Scholar] [CrossRef] [Green Version]
- Pardossi, A.; Incrocci, L. Traditional and New Approaches to Irrigation Scheduling in Vegetable Crops. Hort. Technology 2011, 21, 309–313. [Google Scholar] [CrossRef] [Green Version]
- Sensoy, S.; Ertek, A.; Gedik, I.; Kucukyumuk, C. Irrigation frequency and amount affect yield and quality of field-grown melon (Cucumis melo L.). Agric. Water Manag. 2007, 88, 269–274. [Google Scholar] [CrossRef]
- Fereres, E.; Goldhamer, D.A.; Parsons, L.R. Irrigation Water Management of Horticultural Crops. HortScience 2003, 38, 1036–1042. [Google Scholar] [CrossRef] [Green Version]
- Allen, R.G.; Pereira, L.; Raes, D.; Smith, M. FAO Irrigation and Drainage Paper No. 56; FAO: Rome, Italy, 1998; pp. 26–40. [Google Scholar]
- Ganjegunte, G.K.; Sheng, Z.; Clark, J.A. Evaluating the accuracy of soil water sensors for irrigation scheduling to conserve freshwater. Appl. Water Sci. 2012, 2, 119–125. [Google Scholar] [CrossRef] [Green Version]
- Muñoz-Carpena, R.; Li, Y.; Klassen, W.; Dukes, M. Field Comparison of Tensiometer and Granular Matrix Sensor Automatic Drip Irrigation on Tomato. Hort. Technol. 2005, 15, 584–590. [Google Scholar] [CrossRef] [Green Version]
- Jones, H.G. Irrigation scheduling: Advantages and pitfalls of plant-based methods. J. Exp. Bot. 2004, 55, 2427–2436. [Google Scholar] [CrossRef] [Green Version]
- Melland, A.; Starasts, A.; Eberhard, J.; Schmidt, E.; Palaniappan, G.; Ives, S.; McPhee, J.; Jones, J.; Bonney, L.; Douangboupa, B.; et al. Integrating soil and water management in vegetable production in Laos and Cambodia; Final Report R2021-033; Australian Centre for International Agricultural Research: Canberra, ACT, Australia, 2020; p. 157. [Google Scholar]
- Farooque, A.A.; Afzaal, H.; Abbas, F.; Bos, M.; Maqsood, J.; Wang, X.; Hussain, N. Forecasting daily evapotranspiration using artificial neural networks for sustainable irrigation scheduling. Irrig. Sci. 2021, 40, 55–69. [Google Scholar] [CrossRef]
- Afzaal, H.; Farooque, A.A.; Abbas, F.; Acharya, B.; Esau, T. Precision Irrigation Strategies for Sustainable Water Budgeting of Potato Crop in Prince Edward Island. Sustainability 2020, 12, 2419. [Google Scholar] [CrossRef] [Green Version]
- Ewaid, S.H.; Abed, S.A.; Al-Ansari, N. Crop Water Requirements and Irrigation Schedules for Some Major Crops in Southern Iraq. Water 2019, 11, 756. [Google Scholar] [CrossRef] [Green Version]
- Ghiat, I.; Mackey, H.R.; Al-Ansari, T. A Review of Evapotranspiration Measurement Models, Techniques and Methods for Open and Closed Agricultural Field Applications. Water 2021, 13, 2523. [Google Scholar] [CrossRef]
- Pereira, L.; Paredes, P.; Jovanovic, N. Soil water balance models for determining crop water and irrigation requirements and irrigation scheduling focusing on the FAO56 method and the dual Kc approach. Agric. Water Manag. 2020, 241, 106357. [Google Scholar] [CrossRef]
- Suleiman, A.A.; Soler, C.M.T.; Hoogenboom, G. Evaluation of FAO-56 crop coefficient procedures for deficit irrigation management of cotton in a humid climate. Agric. Water Manag. 2007, 91, 33–42. [Google Scholar] [CrossRef]
- Gowda, P.H.; Howell, T.A.; Baumhardt, R.L.; Porter, D.O.; Marek, T.H.; Nangia, V. A User-Friendly Interactive Tool for Estimating Reference ET Using ASCE Standardized Penman-Monteith Equation. Appl. Eng. Agric. 2016, 32, 383–390. [Google Scholar] [CrossRef] [Green Version]
- Her, Y.; Morgan, K.T.; Wang, Q. Excel-Based Computational Template for Irrigation Scheduling Using Dual Crop Coefficients. J. Extension 2019, 57, 3. [Google Scholar]
- Migliaccio, K.; Morgan, K.T.; Vellidis, G.; Zotarelli, L.; Fraisse, C.; Zurweller, B.A.; Andreis, J.H.; Crane, J.H.; Rowland, D.L. Smartphone Apps for Irrigation Scheduling. Trans. ASABE 2016, 59, 291–301. [Google Scholar] [CrossRef]
- Fernández, J.; Alcon, F.; Diaz-Espejo, A.; Hernandez-Santana, V.; Cuevas, M. Water use indicators and economic analysis for on-farm irrigation decision: A case study of a super high density olive tree orchard. Agric. Water Manag. 2020, 237, 106074. [Google Scholar] [CrossRef]
- Pannell, D.J.; Malcolm, B.; Kingwell, R.S. Are we risking too much? Perspectives on risk in farm modeling. Agric. Econ. 2000, 23, 69–78. [Google Scholar] [CrossRef]
- Linker, R. Stochastic model-based optimization of irrigation scheduling. Agric. Water Manag. 2020, 243, 106480. [Google Scholar] [CrossRef]
- Linker, R.; Sylaios, G. Efficient model-based sub-optimal irrigation scheduling using imperfect weather forecasts. Comput. Electron. Agric. 2016, 130, 118–127. [Google Scholar] [CrossRef]
- Linker, R.; Sylaios, G.; Tsakmakis, I.; Ramos, T.; Simionesei, L.; Plauborg, F.; Battilani, A. Sub-optimal model-based deficit irrigation scheduling with realistic weather forecasts. Irrig. Sci. 2018, 36, 349–362. [Google Scholar] [CrossRef]
- Belay, S.A.; Schmitter, P.; Worqlul, A.W.; Steenhuis, T.S.; Reyes, M.R.; Tilahun, S.A. Conservation Agriculture Saves Irrigation Water in the Dry Monsoon Phase in the Ethiopian Highlands. Water 2019, 11, 2103. [Google Scholar] [CrossRef] [Green Version]
- Gong, X.; Wang, S.; Xu, C.; Zhang, H.; Ge, J. Evaluation of Several Reference Evapotranspiration Models and Determination of Crop Water Requirement for Tomato in a Solar Greenhouse. Hort. Science 2020, 55, 244–250. [Google Scholar] [CrossRef] [Green Version]
- Qiu, R.; Li, L.; Liu, C.; Wang, Z.; Zhang, B.; Liu, Z. Evapotranspiration estimation using a modified crop coefficient model in a rotated rice-winter wheat system. Agric. Water Manag. 2022, 264, 107501. [Google Scholar] [CrossRef]
- Çetin, Ö.; Üzen, N.; Temiz, M.G.; Altunten, H. Improving Cotton Yield, Water Use and Net Income in Different Drip Irrigation Systems Using Real-Time Crop Evapotranspiration. Pol. J. Environ. Stud. 2021, 30, 4463–4474. [Google Scholar] [CrossRef]
- Awe, G.O.; Akomolafe, T.N.; Umam, J.; Ayuba, M.B. Efficiency of small pan evaporimeter in monitoring evapotranspiration under poly-covered house and open-field conditions in a hot, tropical region of Nigeria. J. Hydrol. Reg. Stud. 2020, 32, 100735. [Google Scholar] [CrossRef]
- Jaramillo, A. Evaluation of scheduling tools for the sugar industry; Cotton Research and Development Corporation: Narrabri, Australia, 2017; p. 18. [Google Scholar]
- Manikandan, N.; Panigrahi, P.; Pradhan, S.; Rautaray, S.K.; Kar, G. Evaluating mini pan evaporimeter for on-farm irrigation scheduling. Journal of Agrometeorology 2020, 22, 243–247. [Google Scholar]
- Sugar Research Australia. Irrigation Scheduling with Mini Pans; Sugar Research Australia: Indooroopilly, Australia, 2014. [Google Scholar]
- Vinh, H.; Keen, B.; Tam, H.M.; Slavich, P.; Cuong, H.H.; Nhan, D.T. Mini-evaporation pan irrigation scheduling: A tool for improving on-farm water use efficiency for peanut and tree crops in south-central coastal Vietnam. In Proceedings of the Sustainable and Profitable Crop and Livestock Systems in South-Central Coastal Vietnam, Quy Nhon, Vietnam, 5–6 March 2015; p. 240. [Google Scholar]
- Stirzaker, R.; Mbakwe, I.; Mziray, N.R. A soil water and solute learning system for small-scale irrigators in Africa. Int. J. Water Resour. Dev. 2017, 33, 788–803. [Google Scholar] [CrossRef] [Green Version]
- Schmidt, E.; Sugden, F.; Scobie, M.; Mainuddin, M.; Leder, S.; Mishra, R.; Thapa, B.; Bastakoti, R.; da Silva, S. Improving Water Use for Dry Season Agriculture by Marginal and Tenant Farmers in the Eastern Gangetic Plains; FR2019-116; Australian Centre for International Agricultural Research: Canberra, Australia, 2019; p. 116. [Google Scholar]


| Country | Province | District | Village | Lat | Lon | Soil type | Climate a | Avg Annual Rainfall (mm) a | Average Min/Max Temperature (°C) a |
|---|---|---|---|---|---|---|---|---|---|
| Laos | Vientiane Capital | Xaithany | Pakxapkao | 18.1400° N | 102.7753° E | sandy clay loam to 30 cm | Tropical savanna | 1989 | 21.8/29.9 |
| Nabong | 18.1244° N | 102.7919° E | |||||||
| Hadxaifong | Huaha | 17.0867° N | 102.6067° E | silt loam over silty clay loam to 30 cm | Tropical savanna | 1989 | 21.8/29.9 | ||
| Cambodia | Kampot | Tuek Chhou | Koun Sat | 10.5967° N | 104.2783° E | sandy loam over loam to 60 cm | Tropical monsoon | 1807 | 24.6/29.5 |
| Chhouk | Prey Ben | 10.8356° N | 104.4553° E | sandy loam over loam to 60 cm | Tropical savanna | 1500 | 23.5/30.8 | ||
| Siem Reap | Prasat Bakong | Ta Trav | 13.3353° N | 104.0289° E | sandy loam over loam to 60 cm | Tropical savanna | 1358 | 23.0/31.4 |
| Irrigation Treatment b | |||
|---|---|---|---|
| DAT a (Dates) | I1 | I2 | I3 |
| 2018 | |||
| DAT 1–6 (31/3–6/4/18) | 9 mm/day (4.5 mm morning and evening) | 6 mm/day (3 mm morning and evening) | 6 mm/day (3 mm morning and evening) |
| DAT 7–14 (7–13/4/18) | 9 mm/day (4.5 mm morning and evening) | 4 mm/day applied each morning | 8 mm applied every second morning |
| DAT 15–28 (14–27/4/18) | 9 mm/day (4.5 mm morning and evening) | 4.5 mm/day applied each morning | 9 mm applied every second morning |
| 2019 | |||
| DAT 1–5 (16–20/2/19) | 9 mm/day (4.5 mm morning and evening) | 3.7 mm/day (1.85 mm morning and evening) | 3.7 mm/day (1.85 mm morning and evening) |
| DAT 6–12 (21–27/2/19) | 9 mm/day (4.5 mm morning and evening) | 2.6 mm/day applied each morning | 5.2 mm applied every second morning |
| DAT 13–22 (28/2–6/3/19) | 9 mm/day (4.5 mm morning and evening) | 3.4 mm/day applied each morning | 6.8 mm applied every second morning |
| DAT 23–29 (7–16/3/19) | 9 mm/day (4.5 mm morning and evening) | 4.3 mm/day applied each morning | 8.6 mm applied every second morning |
| Irrigation Treatment | Details |
|---|---|
| Farmer Practice | Kampot: 2 times/day, 8–12 mm per day Siem Reap: 2 times/day, 10–14 mm per day |
| Predicted ETc | 1 time/day, 3–5 mm per day according to predicted demand based on crop type, crop growth stage and province |
| Farm No. | Total Number of Watering Cans | Total Depth of Water Applied (mm) | Average Depth of Water Applied (mm/day) |
|---|---|---|---|
| 1 | 134 | 168 | 8.0 |
| 2 | 166 | 208 | 9.4 |
| 3 | 92 | 115 | 5.0 |
| 4 | 96 | 120 | 5.0 |
| Yield (t ha−1) | Water Applied (ML ha−1) | WPI (kg ML−1) | ||||
|---|---|---|---|---|---|---|
| Year | Treatment A | Mean | s.e. | Mean | s.e. | |
| 2018 | I1 | 15.5 a | 1.41 | 2519 | 6.17 a | 0.97 |
| I2 | 16.6 a | 1.41 | 1330 | 12.50 b | 0.97 | |
| I3 | 18.1 a | 1.41 | 1370 | 13.23 b | 0.97 | |
| 2019 | I1 | 18.4 a | 3.82 | 2610 | 7.06 a | 2.49 |
| I2 | 22.8 a | 3.82 | 1035 | 21.89 b | 2.49 | |
| I3 | 26.5 a | 3.82 | 1027 | 25.72 b | 2.49 | |
| Mustard Green | Bok Choy | |||||
|---|---|---|---|---|---|---|
| Irrigation Method | Leaf Yield (kg ha−1) | Water Applied (ML ha−1) | WPI (kg ML−1) | Leaf Yield (kg ha−1) | Water Applied (ML ha−1) | WPI (kg ML−1) |
| Farmer Practice | 30,556 | 2107 | 14.5 | 24,400 | 2450 | 10.0 |
| Predicted ETc | 30,186 | 811 | 37.2 | 24,600 | 956 | 25.7 |
Publisher’s Note: MDPI stays neutral with regard to jurisdictional claims in published maps and institutional affiliations. |
© 2022 by the authors. Licensee MDPI, Basel, Switzerland. This article is an open access article distributed under the terms and conditions of the Creative Commons Attribution (CC BY) license (https://creativecommons.org/licenses/by/4.0/).
Share and Cite
McPhee, J.; Eberhard, J.; Melland, A.; Uddin, J.; Dunn, L.; Hin, S.; Lim, V.; Touch, V.; Sisouvanh, P.; Somphou, I.; et al. Simple ETo-Based Rules for Irrigation Scheduling by Smallholder Vegetable Farmers in Laos and Cambodia. Water 2022, 14, 2010. https://doi.org/10.3390/w14132010
McPhee J, Eberhard J, Melland A, Uddin J, Dunn L, Hin S, Lim V, Touch V, Sisouvanh P, Somphou I, et al. Simple ETo-Based Rules for Irrigation Scheduling by Smallholder Vegetable Farmers in Laos and Cambodia. Water. 2022; 14(13):2010. https://doi.org/10.3390/w14132010
Chicago/Turabian StyleMcPhee, John, Jochen Eberhard, Alice Melland, Jasim Uddin, Lucinda Dunn, Sarith Hin, Vanndy Lim, Veasna Touch, Phimmasone Sisouvanh, Inthong Somphou, and et al. 2022. "Simple ETo-Based Rules for Irrigation Scheduling by Smallholder Vegetable Farmers in Laos and Cambodia" Water 14, no. 13: 2010. https://doi.org/10.3390/w14132010