
INV-FLOW: New Possibilities to Evaluate the Technical Condition and Function of Extraction Wells


1
Faculty of Environmental Sciences, Czech University of Life Sciences Prague, Kamýcká 129, 165 00 Prague, Czech Republic
2
Dekonta, a.s., Volutová 2523, 150 00 Prague, Czech Republic
*
Authors to whom correspondence should be addressed.
Water 2022, 14(13), 2005; https://doi.org/10.3390/w14132005
Submission received: 8 May 2022
/
Revised: 15 June 2022
/
Accepted: 20 June 2022
/
Published: 23 June 2022
(This article belongs to the Special Issue Advances in Hydrogeological Investigations: From Numerical Modelling to Field Applications)
Abstract
:The declining supply of available groundwater resources is increasing the importance of extraction wells. To maximize the yield of extraction wells, the operators do not always respect the sustainable use of groundwater resources. These efforts can affect water quality and impact the service life of an extraction well, mainly through the clogging process. As part of the INV-FLOW project, an apparatus for evaluating the functionality of an extraction well by measuring the vertical water flow through its screen and filter was designed and tested. The apparatus consists of two electromagnetic induction flowmeters, two pneumatic seals, and a pump with the possibility of regulation. After an initial laboratory verification of the fundamental concept, the apparatus was successfully tested in real conditions. Two extraction wells, HJ-3 and HJ-4, intended for water supply to an agricultural production plant, were measured at a pilot site in the Czech Republic using the INV-FLOW apparatus. Although the HJ-3 extraction well is at the end of its service life, the HJ-4 extraction well is a newly installed well. In the new extraction well, HJ-4, a high proportion of water flowing through the gravel pack relative to the total pumping flow (93–97%) was measured using the INV-FLOW apparatus at different pumping rates. In the case of the HJ-3 extraction well, screen and filter clogging contributed significantly to the limited water flow through the gravel pack. In the most affected parts of the extraction well (15–20 m b.g.l.), the proportion of water flowing through the gravel pack relative to the total pumping flow ranged from 10 to 20%. The pilot tests confirmed the functionality of the apparatus and the possibility of using it to evaluate the degree of clogging and incrustation of an extraction well. The pilot tests thus demonstrated the usability of the INV-FLOW apparatus. The extraction well operator can assess the level of clogging or incrustation of the extraction well and decide on the need for the rehabilitation of an extraction well, or the termination of its operation.
1. Introduction
A well is a water management structure that may serve as a groundwater extraction source, a monitoring or remediation structure, or, optionally, an infiltration structure. In all cases, an extraction well is affected by several factors influencing its service life, which is largely determined by its design and how it is used in the geological environment.
The technical condition of extraction wells may be evaluated by a number of hydraulic and geophysical methods [1,2,3]. The advantage of hydraulics methods lies in their directness and lower equipment demands and costs. They are based on pumping and recovery tests that may be supplemented by measurements of the vertical component of the flow [1]. However, these methods provide only minimal information on the possible variability of the determined parameters along the vertical profile of the extraction well. Geophysical measurements designated as geophysical well logging require complex equipment. In contrast with the methods mentioned above, they only provide information on the vertical profile of the measured parameters for the evaluation [4]. Their advantages are a high resolution and the possibility of interpreting the operation properties of the extraction wells from the point of view of the physicochemical properties of the aquifer. In this case, the basic procedure is resistivity logging in its numerous variants. The list of methods used includes measurements of the real diameter of the well, acoustic logging, density logging, gamma logging, gamma–gamma logging, and neutron–neutron logging, in addition to camera inspection of the extraction well [5,6,7]. Geophysical methods can assess several properties and parameters of an extraction well, such as aquifer lithology, thickness, porosity, density, water quality, well diameter and deviation, flow within the extraction well, and mineralogy [4]. The filtration part of an extraction well is formed by a gravel pack located at the perforated part of the casing, called a well screen. In addition to a stabilization function, the gravel pack has a filtration function, consisting of reducing the entry of fine sediments into the extraction well. From a construction point of view, slit perforation (in comparison to circular perforation) is preferred, as it ensures a lower minimum cross-section of the openings while maintaining the same proportion of the open area. It is usually risky to construct an extraction well without a gravel pack. In principle, this is possible in the case of rocks having a low content of mobile sedimentary fractions; however, even in such cases, the gravel pack may have a stabilization function, and its use is recommended to achieve a long service life of the extraction well.
The main parameters of the gravel pack are the grain size, width, and material type [8]. These parameters are selected depending on the type of geological material that the extraction well penetrates, among other things. The correct choice of gravel pack has a decisive influence on the service life of the extraction well. The chosen fraction size must dimensionally exceed the internal cross-section of the perforations of the well screen while taking into account the presence and grain size of the mobile component of the transported sediment in the aquifer. The aim is to find a balance between maintaining maximum permeability, filtration capacity, and, simultaneously, accessibility for maintenance and regeneration work, and also during the long and intensive pumping of the aquifer in the case of extraction wells. It is recommended to determine grain size based on the surrounding geological material [9,10]. A grain-size analysis is also one of the first steps in selecting a well screen’s slit size [4]. In rocks, the gravel pack is mainly used for stabilization, and its grain size is selected according to the size of the inflow openings of the well screen [11].
Materials suitable for use in gravel packs are natural sands and gravels having rounded grain shapes; they should not be crushed materials. A suitable gravel pack is made of silica materials containing <4% of inhomogeneous components, such as clay, mica, feldspar, limestone, and iron. It is optimal to use drinking water filter materials, as they have a minimal impurity content [9,12].
Well clogging is defined as a decrease in the specific capacity of an extraction well over time [13]. In practice, the service life of an extraction well is limited, particularly by the impact of the clogging process, i.e., clogging of the porous area of the gravel pack, the well screen or, optionally, the part of the geological environment in the closest surroundings of the well screen [14,15,16,17,18,19,20]. The cause combines a physical clogging, i.e., the transport of mobile sedimentary particles due to transport abilities of flowing water, and a chemical–biological one, i.e., oxidative processes resulting in the precipitation of ions dissolved in groundwater. Usually, many microorganisms participate in this phenomenon, and, at the macroscopic level, the process results in incrustation on the surface and inside the screen [13,21,22,23].
Well clogging causes a reduction in the open area of the well screen and reduces the volume of effective pores in the gravel pack. The result is a decrease in the yield of extraction wells, which can also escalate over time if the operational response is pumping intensification and cause a subsequent increase in the hydrogeological gradient due to the decrease in groundwater level in the extraction well. Faster-flowing water entrains more sedimentary particles. A further decrease in the groundwater level leads to an expansion of the oxidative environment zone, causing mineral incrustation and promoting the growth of microorganisms [10,11,13]. Although few extraction wells fail completely due to clogging or direct incrustation, these phenomena always cause reduced well yield [15,22,24,25].
Corrosion processes, which affect not only metal, but also plastic and rocks, cause enlargement of the openings in the well screen, thus reducing the strength of the well screen [26]. Metals suffer the most from corrosion. Corrosion is caused by a material reaction in an oxidation reduction environment (especially in contact with oxygen present in the air), which can be further enhanced by corrosive contaminants, for example, in remediation extraction wells.
In the event of clogging and incrustation, the extraction well can be regenerated. After the necessary diagnosis, a number of mechanical and chemical procedures can be applied [10,26,27].
Researchers from the Czech University of Life Sciences in Prague and the company DEKONTA, a.s., (Prague, Czech Republic) developed a new INV-FLOW apparatus, which can be used to directly assess the technical condition of the filtration part of an extraction well, i.e., the part of the extraction well that contributes to its proper functioning. Together with the apparatus, a new method for evaluating the degree of clogging and incrustation of a given extraction well, and thus its overall functionality, was tested.
2. Materials and Methods
2.1. Apparatus Design
The INV-FLOW apparatus is portable and consists of the parts described in the conceptual diagram in Figure 1. The main parts of the apparatus are:
- Two pneumatic packers to seal the measured section of the extraction well. A through-flow pipe passes through the center of the packers. The packer’s bodies can accommodate three independent cables sealed at the flanges using watertight bushings. In the case of the INV-FLOW apparatus, these cables are used for (i) the electrical connection of the pump, (ii) the supply of compressed air for controlling the packers, and (iii) the electrical signal from the electromagnetic flowmeter.
- A pump located in the area between the packers, enabling the smooth regulation of the output.
- An electromagnetic flowmeter located at the ground surface for measuring the flow rate of water pumped from the extraction well.
- An electromagnetic flowmeter located under the lower packer inside the extraction well to measure the flow rate of water pumped through the lower packer.
2.2. Methodology
The measured section of the extraction well is the center of the lower pneumatic packer, as shown in Figure 1. Here, a portion of the groundwater in the well flows around the packer through the gravel pack at a flow rate of Qo. After installing the apparatus into the measured section of the extraction well, the pneumatic packers are sealed with compressed air. Subsequently, by pumping and measuring the total pumping flow rate Qc and the flow rate through the lower packer Qp, the flow rate of water flowing outside the lower packer, i.e., the flow rate of water through the gravel pack Qo at a given depth level, is measured. By evaluating the contribution of Qo to the total pumping quantity Qc as a function of the pumping rate Qc, we can determine whether the well gravel pack is functional (no clogging or incrustation) in the measured section or whether the filtration capacity is reduced. Thus, the dependence Qo/Qc = f(Qc) is evaluated.
The water flow rate through the gravel pack at a given depth level is expressed by the main Equation (1) for the total quantity pumped:
from which Qo can be expressed:
where Qo is the quantity of water flowing through the gravel pack (l/s), Qc is the pumping quantity (measured) (l/s), Qp is the flow rate through the lower packer (measured) (l/s), and Qin is the inflow from the aquifer through the height L (l/s).
The only unknown in Equation (2) is the Qin inflow from the aquifer through the height L (Figure 2). There are two possible ways to determine this inflow. First, it can be measured using a borehole dilution technique [28]. For this purpose, resistivity logging is used. The mineralization of water in the extraction well is increased by diluting NaCl. The inflowing groundwater differs in electrical resistivity from the water in the extraction well. By repeatedly measuring the electrical resistivity of the water in the extraction well using resistivity logging, it is possible to quantify the horizontal inflows to the well at different depth levels.
The second option is to calculate it from the decrease in water level in the observation well during the measurement. The scheme is illustrated in Figure 2. Equation (3) for steady flow to the full well was applied (the Thiem equation) [29] Using the parameters at the pumped well and at the observation well PV1:
where hV1 is the height of water in the observation well PV1 (m), hV is the height of water in the pumped well (m), Qaq is the inflow quantity of water from the aquifer (m3/s), rv is the radius of the pumped well (m), RPV1 is the distance of the observation well from the axis of the pumped well (m), and K is the hydraulic conductivity of the aquifer (m/s).
As the input parameter of Equation (3), the hydraulic conductivity of aquifer K is obtained from the pumping test performed before the start of the measurement using the INV-FLOW apparatus.
The inflow amount of water from the aquifer into the well can be expressed by Equation (4):
The amount of water flowing into the extraction well through height L is:
In addition to evaluating individual depth levels in the extraction well using the INV-FLOW apparatus according to the method described above, it is also important to assess the effect of the additional resistance of the extraction well using the pumping and recovery test. The test should be carried out before each measurement by the INV-FLOW apparatus, as described above, since the hydraulic conductivity of the aquifer is the basic input parameter for calculating the amount of water flowing from the aquifer into the extraction well (Qin).
Performing the pumping test in unsteady mode allows us to evaluate the hydraulic conductivity of the whole aquifer, K, and the coefficient of additional resistance, W [22,23,30,31,32,33,34]. Agarwal [35] solved the equation of unsteady radial flow to a real well in cylindrical coordinates, considering additional resistance (skin effect) and the actual well volume (wellbore storage) [35,36] at the beginning of the pumping test. Using Algorithm 368 [37], Equation (6) was derived in [38,39,40,41] for the slope of the first straight line of the pumping test (sD*) as a function of the skin factor, W (coefficient of additional resistance), and the dimensionless wellbore storage, CD [24,36], which precedes, in groundwater hydraulics, the standard Cooper–Jacob section—the Cooper–Jacob straight line [38] (Figure 3).
where sD* is the dimensionless drawdown for the first straight line (-), W is the coefficient of additional resistance (skin factor) (-), and CD is the dimensionless wellbore storage (the wellbore storage effect occurs at early pumping times, during which the water withdrawn is not derived from the aquifer but from the water volume originally stored in the well casing [36,39]).
After inserting the dimensionless parameters by expressing the coefficient of additional resistance, Equation (7) is obtained in the form [39,40]:
where Q is the pumped amount of water (m3/s), s* is the drawdown at the point of intersection between the “first straight line” segment with the time axis (m) (see Figure 3), and T is the aquifer transmissivity (m2/s).
The derived coefficient of additional resistance [42] directly characterizes how additional resistance is applied in the extraction well and its surrounding environment. The greater the degree of clogging in the gravel pack and in its close vicinity, the greater the coefficient of additional resistance, and the greater the probability that the filtration function of the extraction well is non-functional. Values of the coefficient of additional resistance close to zero indicate that additional resistance does not apply.
According to Hawkins [43], who defined a zone where additional resistance is applied to the radius ro (Figure 2), a relationship for the coefficient of additional resistance W for steady flow can be derived as Equation (8):
where K is the hydraulic conductivity of the aquifer (m/s), Ko is the hydraulic conductivity of the gravel pack (m/s), rv is the radius of the pumped well (m), and ro is the radius of the zone of additional resistance (m). From Equation (8), it is possible to express the hydraulic conductivity coefficient of the part of the measured extraction well where additional resistance is applied as Equation (9). The coefficient of additional resistance is known from Equation (7).
2.3. Laboratory Experiments
To verify the basic hypotheses and assumptions and test the conceptual design of the INV-FLOW apparatus, experiments were carried out on a laboratory model of an extraction well. The laboratory model was theoretically designed, constructed, and subsequently tested. Laboratory measurements were carried out in the laboratories of the Faculty of Environmental Sciences of the Czech University of Life Sciences in Prague in November and December 2019.
The laboratory model used (Figure 4) simulates the vertical flow of groundwater induced in a partially hydraulically incomplete well, with the simultaneous maintenance of a constant piezometric water level. The groundwater flow can be then reduced to a one-dimensional component. In principle, this is a model of an ideal flow during groundwater pumping, which enables the comparison of the individual components of vertical flow.
The actual laboratory model (Figure 4) consists of a DN 300 flow profile connected by its bottom to an equalizing tank with adjustable overflow height, which ensures water circulation in the system using a circulation pump. Total flow can be controlled mechanically (mechanical valve) or using a frequency converter with which the pump is equipped. A reference flowmeter is also included after the pump to verify the total water circulation in the system.
The laboratory model of an extraction well was equipped with a well casing with an internal diameter of DN175 and slit perforation (1 mm width) for the laboratory test. The gravel pack was simulated in the following variants:
- Without clogging: glass beads of fraction d = 3–5 mm;
- Affected by clogging: a mixture of glass beads of fraction d = 3–5 mm and filter sand of fraction d = 0.5–1 mm.
A pneumatic packer was used as a sealing element to seal the extraction well with an inner diameter of 105–200 mm, having a maximum working pressure of 11 bar.
Table 1 shows the scenarios that were measured in the laboratory model. In Scenario A, only half of the well casing and the lower part of the gravel pack were installed to verify the basic functionality of the constructed laboratory model. Furthermore, Scenarios B and C were tested, in which the well casing was completed, and different types of gravel packs were tested. The testing was carried out within all the scenarios with different values of the total flow rate Qc.
From the point of view of groundwater hydraulic theory, the laboratory model of an extraction well (Figure 4) represents the standard scheme of Henry Darcy [44]. Thus, for each scenario tested, a direct measurement of the saturated hydraulic conductivity of the gravel filter casing in the laboratory model, K (m/s), was carried out according to the equation:
The monitored parameters of the laboratory experiment (Figure 4, Equation (10)) are as follows:
Constant parameters:
- dm (m)—inner diameter of the laboratory model of a hydrogeological well;
- dw (m)—outer diameter of the hydrogeological casing;
- Ao (m2)—area of the flow profile of the gravel pack;
- L (m)—height of the gravel pack.
Variable (measured) parameters:
- Qc (l/s)—total water flow in circulation;
- Qp (l/s)—water flow through the packer;
- H1 (m)—piezometric level in the DN300 flow profile (laboratory model);
- H2 (m)—piezometric level in the equalizing tank.
Calculated parameters:
- Qo (m3/s)—component of vertical flow through the gravel pack;
- I (-)—hydraulic gradient;
- Ko (m/s)—hydraulic conductivity of the gravel pack.
2.4. Pilot Site, Geological and Hydrogeological Properties
The INV-FLOW apparatus was tested on a pilot scale from June to December 2020. Measurements were made on two extraction wells that were selected to meet the maximum of the initial test criteria:
- The well is operated as an extraction well;
- The results of pumping and recovery tests, geophysical logging and camera inspections of the extraction well are available;
- The well screen is located at a depth of <25 m below ground level (the depth range of the functional INV-FLOW apparatus);
- An observation well is in the vicinity of the measured extraction well;
- The extraction well casing diameter is in the range DN 175–DN 300 (range of the used functional INV-FLOW apparatus);
- There is variability between the tested extraction wells concerning the age of the extraction well and the well casing material.
2.5. Hadačka Pilot Site
The Hadačka site (Figure 5) is located 25 km north of Pilsen in the Czech Republic. The tested objects, HJ-3 and HJ-4, are extraction wells intended for supplying drinking and service water for the company Kralovická zemědělská, a.s. The pumped yield during the operation has an average value of 0.8 l/s. Extraction wells HJ-3 and HJ-4 were selected for pilot tests as a pair. The HJ-3 well is a drilled extraction well at the end of its service life, with significant signs of clogging. In contrast, the HJ-4 well is a newly drilled extraction well, constructed in 2020 as a replacement for HJ-3.
The area of interest consists of crystalline rocks of the upper Proterozoic age, generally characterized by phyllitic shales, which have been documented by drilling HJ-4 to a minimum depth of 60 m below ground [45]. Geophysical logging in 2020 on the HJ-4 extraction well [46] showed that the shallow part of the aquifer (11–24 m b.g.l.), with the prevailing porous permeability of the weathered zone, has higher mineralization. In contrast, the deeper zone (35–47 m b.g.l.) is characterized by lower mineralization, with the presence of carbonates and prevailing fissure permeability. The area of the aquifer between these zones is, therefore, most predisposed to clogging processes. The groundwater level is semi-confined and mostly corresponds to the terrain’s morphology. The site is located in an erosion valley in an otherwise flat landscape. The direction of groundwater flow predominates from W to E. Qualitatively, there is the Ca-Mg-SO4-NO3 type of groundwater, with medium hardness, Fe = 2.3 mg/L, and Mn = 0.65 mg/L.
The extraction well HJ-3 was constructed by the company AGROPROJEKT, n.p. in 1975 [45]. It has a steel casing of 219/200 mm (outer/inner diameter), with a final depth of 31 m b.g.l. The well casing shows the following parameters [47]:
- 0–6 m b.g.l. steel well casing, DN 219/200;
- 6–27 m b.g.l. steel well screen, DN 219/200;
- 27–31 m b.g.l. steel well casing, DN 219/200.
The gravel pack is made up of clean gravel of 4–8 mm fractions in the section 6–27 m b.g.l. The outer diameter of the gravel pack is given by the drilling diameters 305 mm (0–8 m b.g.l.), 267 mm (8–16 m b.g.l.), and 245 mm (16–31 m b.g.l.). Well screen perforation consists of a 1 × 1 mm steel mesh.
At the start of the operation, the water extraction was tested to a yield of Q = 1.0 l/s, and the usable yield of Q = 1.4 l/s was subsequently recommended based on pumping tests. During the operation, it was shown that due to the very high mineralization of the extracted groundwater (especially with Fe and Mn), the extraction well was subject to chemical and biological clogging, which led to the blocking of the main inflows from the aquifer. For almost the entire service life of the extraction well, this fact was overlooked, and the operating company solved the extraction well yield reduction by bringing in water from a nearby subsurface notch, which probably further escalated the clogging process due to the development of an oxidative environment by the inflow of shallow groundwater with a higher O2 concentration. In 2017, mechanical–chemical regeneration was carried out, with a significant effect: the groundwater inflow was temporarily increased, to a level even greater than the value obtained when the extraction well was first put into operation. However, it was found that the technical condition of the extraction well was not suitable, and therefore, its long-term operation was not recommended. In addition, by 2019, the clogging of the extraction well reoccurred, and it was decided that it was necessary to install a new extraction well as a replacement.
Pumping and recovery tests of the HJ-3 extraction well were carried out within the framework of implementing mechanical chemical regeneration in 2017 [47]. The results of the pumping and recovery tests are summarized in Table 2.
In 2017, a camera inspection of the HJ-3 extraction well was carried out within the framework of regeneration work [47]. Camera inspections were repeated in 2019. The extent of the well clogging and the overall technical condition of the extraction well were assessed. The following observations were made:
- Signs of severe well clogging were present in the entire well screen;
- The well casing was damaged in the area 20.2–23.0 m b.g.l.
As part of the collection of reference data for the INV-FLOW apparatus pilot tests, complex geophysical logging [46] was carried out in 2020 on the HJ-3 extraction well.
The measurements indicated groundwater inflows at a level of 21.5 m b.g.l. and further, and confirmed a very high degree of clogging in the entire measured profile of the well screen. For the pilot test, two critical sections of well screen were identified [46]:
- A low degree of compaction of the gravel pack at 12–13 m b.g.l.—this section was considered to be the most permeable part of the extraction well with the lowest degree of clogging;
- Narrowing of the extraction well casing by up to 15 mm in section 17–17.5 m b.g.l., which was considered the area with the highest degree of clogging of the extraction well, showing the nature of incrustation.
The extraction well HJ-4 was constructed by the company VODNÍ ZDROJE, a.s. [48], in 2020, as a replacement for extraction well HJ-3, which was at the end of its service life. It has a PVC-U casing of 195/175 mm (outer/inner diameter) to a final depth of 54 m b.g.l.
The well casing shows the following parameters:
- 0–14 m b.g.l. PVC well casing, DN 175 (195/8.5);
- 14–27 m b.g.l. PVC well screen, DN 175 (195/8.5);
- 27–35 m b.g.l. PVC well casing, DN 175 (195/8.5);
- 35–50 m b.g.l. PVC well screen, DN 175 (195/8.5);
- 50–54 m b.g.l. PVC well casing, DN 175 (195/8.5).
The gravel pack is made up of clean gravel of 4–8 mm fractions in the section 9–54 m b.g.l. The outer diameter of the gravel pack is given by the drilling diameters 330 mm (0–8 m b.g.l.) and 305 mm (8–60 m b.g.l.) Based on pumping tests, the usable yield of the HJ-4 extraction well was recommended to be 0.89 l/s. The groundwater chemistry in this extraction well is comparable to that in the HJ-3 extraction well—in addition to a high Fe and Mn content, the presence of carbonates in the groundwater was identified at a level below 35 m b.g.l.
Pumping and recovery tests of the HJ-4 extraction wells were carried out in 2020 before the extraction well was put into test operation [48]. The pumping and recovery test results are summarized in Table 3.
In June 2020, after completion of the HJ-4 extraction well, a camera inspection of the extraction well was carried out. The images from the camera inspection correspond to the newly installed extraction well. The photographs show no visible signs of incrustation, clogging, or damage to the well casing [46].
As part of the collection of reference data for the INV-FLOW apparatus pilot tests, complex geophysical logging [46] was carried out in 2020 on the HJ-4 extraction well.
The measurements indicate several groundwater inflows (levels 13.4, 20–26, 39–43, and 48–49 m b.g.l.) with significant zonality, especially between the shallowest inflow (13.4 m b.g.l.) and the others. Total inflows are estimated to be of the order of hundreds of liters per day. The shallow inflow shows significant oxygenation, represented by an increase in conductivity. At the contact between this shallow inflow and deeper groundwater, the oxidation of dissolved forms of Fe and Mn occurs with the help of chemolithotrophic microorganisms, which are probably also more abundant in the shallower inflow. The extraction well currently shows no signs of clogging, but floating bacterial iron sludges are forming and sinking to the bottom of the extraction well.
2.6. Pilot Test Experiments
The first pilot test of the HJ-3 and HJ-4 extraction wells occurred on 2 July 2020.
This test aimed to verify the basic functionality of the newly constructed INV-FLOW apparatus. The measurement of the HJ-4 extraction well using the INV-FLOW apparatus was carried out in the following mode:
- One profile was measured—17.05 m b.g.l.;
- Eleven different flow rates Qc were set, from 0.18 l/s to 1.11 l/s.
The measurement of the HJ-3 extraction well using the INV-FLOW apparatus was carried out in the following mode:
- Two profiles were measured—11.75 m b.g.l. and 15.75 m b.g.l.
- In each profile, 13 different flow rates Qc were set, from 0.1 l/s to 0.8 l/s.
The subsequent pilot measurement was carried out on the HJ-3 extraction well on 28 July 2020. Based on the results of the previous testing, measurement of the entire depth profile of the HJ-3 extraction well was carried out, showing a high degree of clogging.
The measurement of the HJ-3 extraction well using the INV-FLOW apparatus was carried out in the following mode:
- Nine profiles were measured, from 11.45 m b.g.l. to 19.45 m b.g.l.
- In each of the profiles, seven different flow rates Qc were set, from 0.06 l/s to 0.61 l/s.
- According to the logging measurements [46], the water inflow from the surrounding aquifer was zero (Qin = 0) in the entire measured profile, mainly due to a high degree of clogging and incrustation of the well. Logging measurements showed only an upward flow of groundwater in the extraction well.
- Three pressure sensors were attached to the INV-FLOW apparatus to check the correct installation and operation of the apparatus. One sensor was located above the upper pneumatic packer, one in the space between the two packers near the pump, and the third below the lower pneumatic packer.
3. Results and Discussion
3.1. Laboratory Experiments
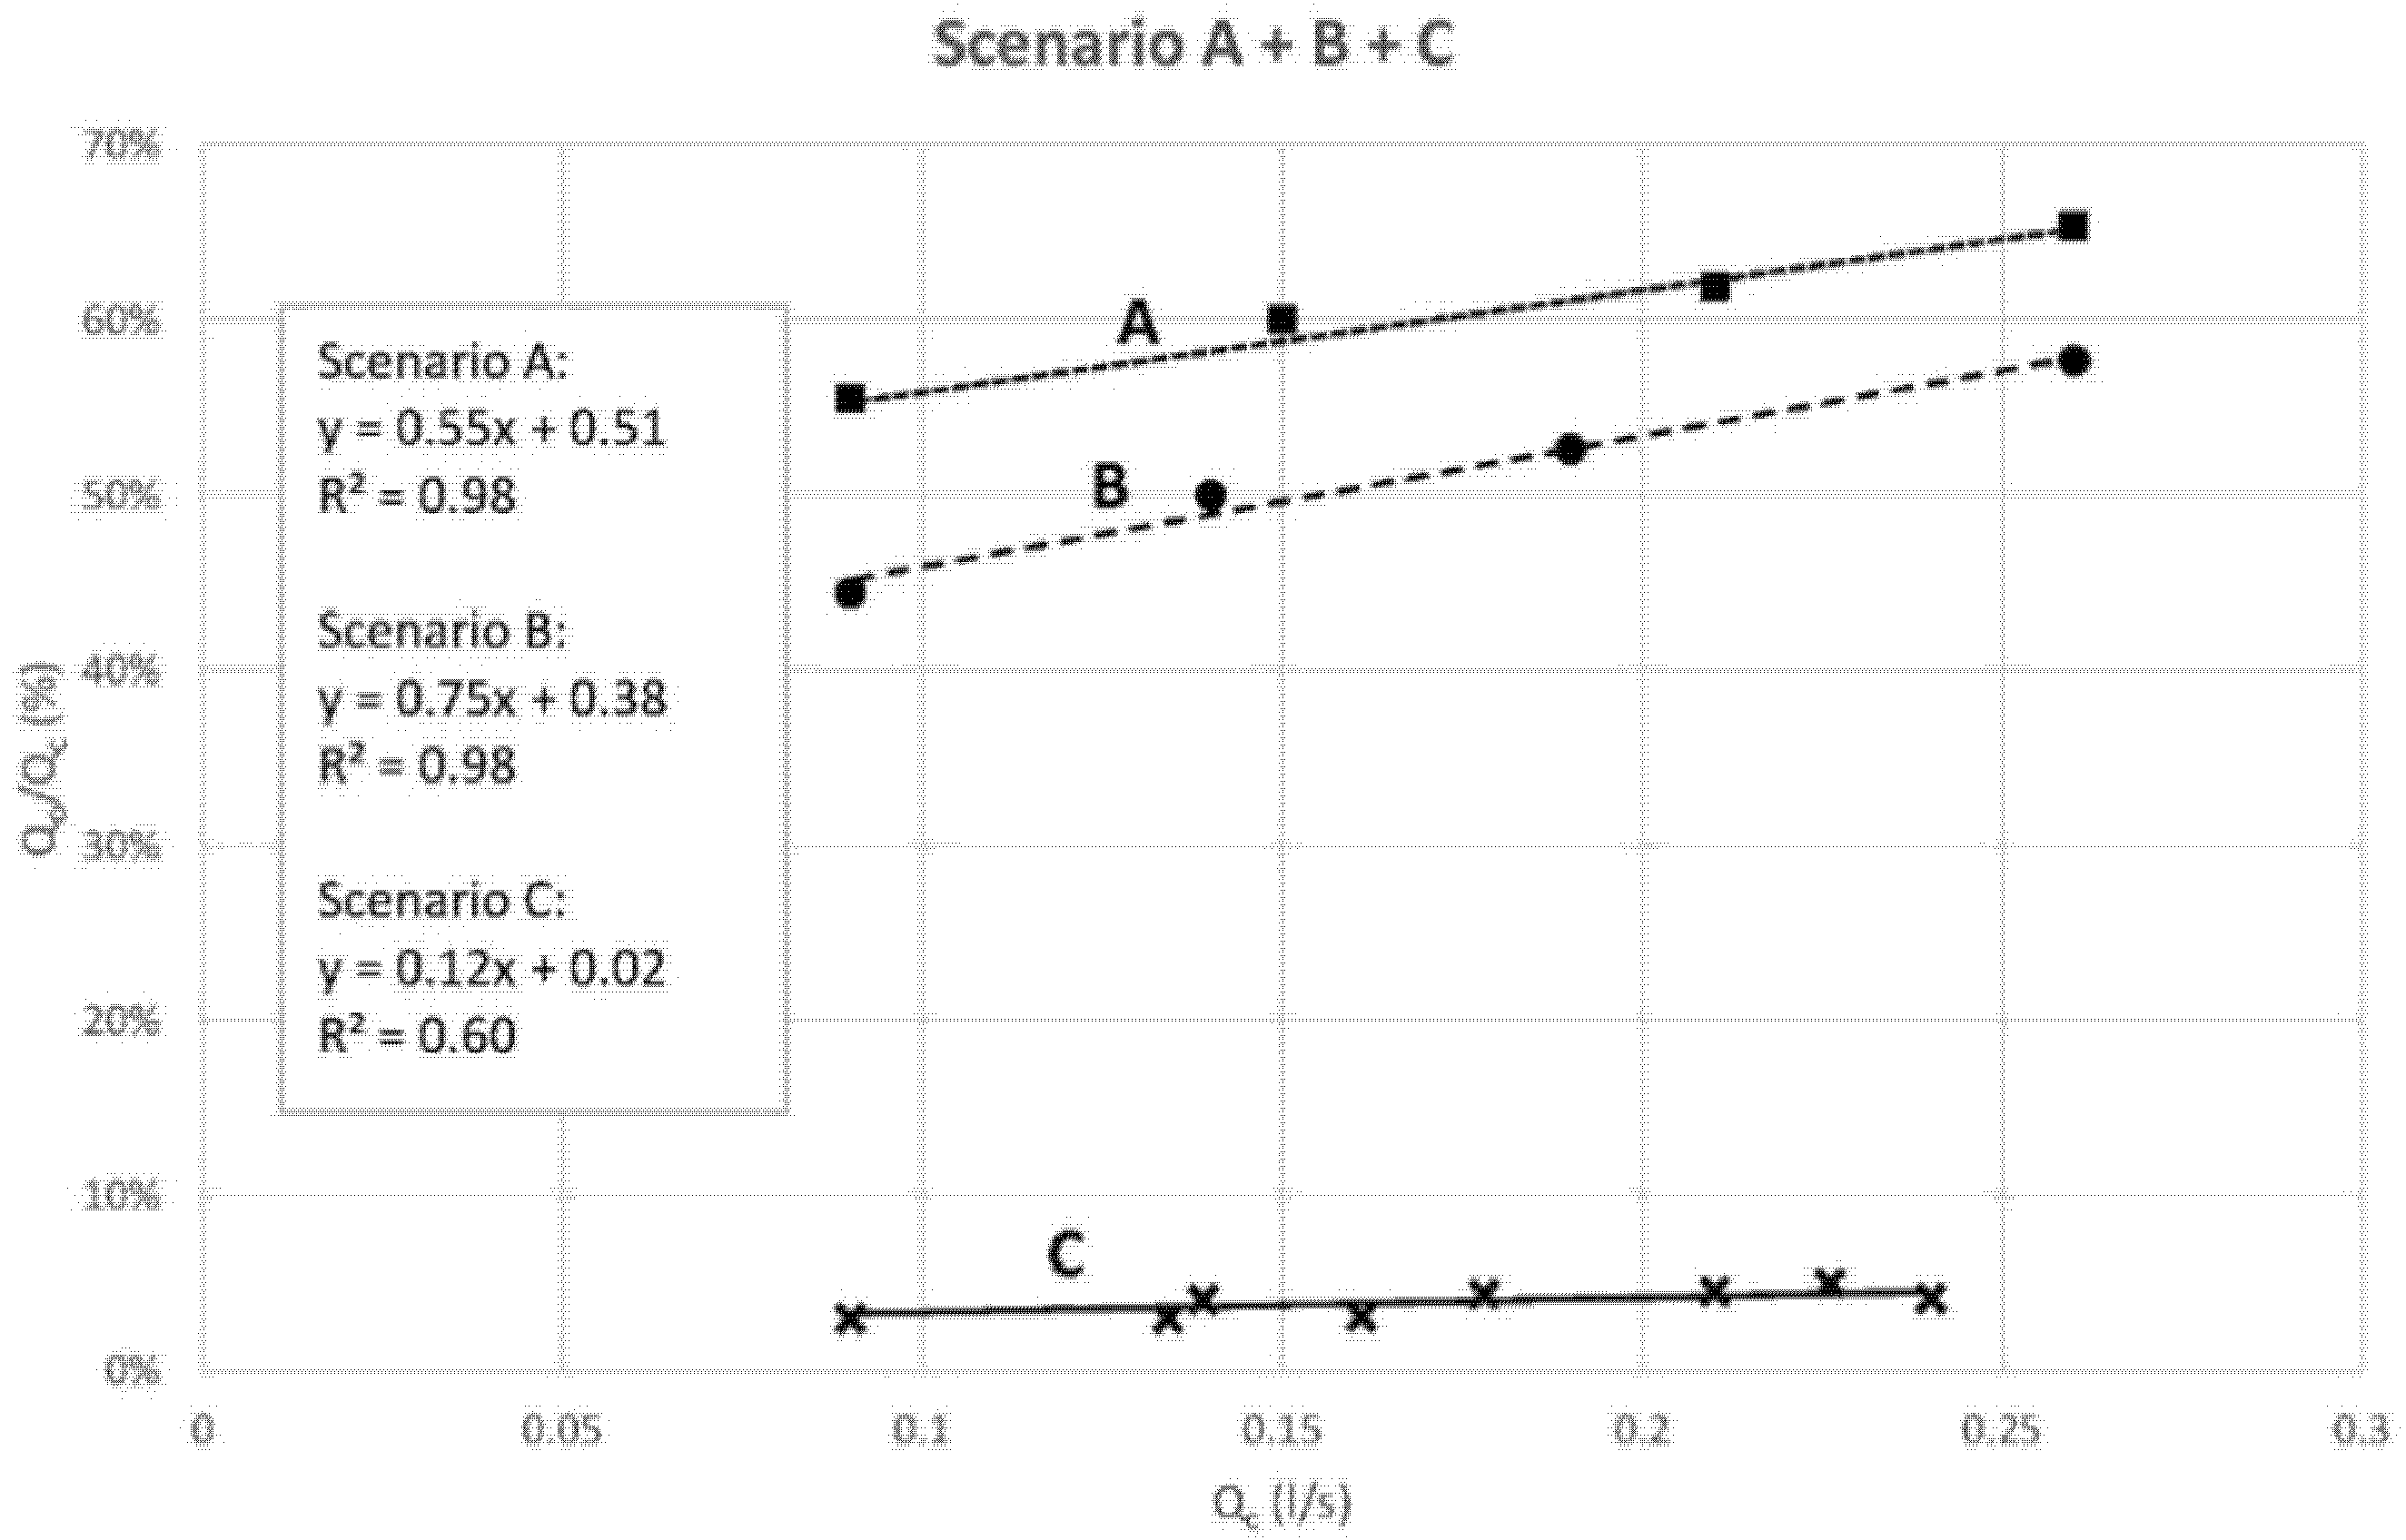
Table 4, Table 5 and Table 6 show the values obtained by measurements under the individual measurement Scenarios A, B, and C (Table 1). The measured data were then plotted on graphs (Figure 6), where the X axis represents the total flow rate Qc (l/s) and the Y axis represents the proportion of water flow through the gravel pack relative to the total flow rate—Qo/Qc (%). The measurement results are detailed in the following subsections.
3.1.1. Scenario A
The values of hydraulic conductivity, K, of the gravel pack varied between 2.56 × 10⁻² and 3.31 × 10⁻² m/s at different total flow rates, Qc. This corresponds to the used mixture of glass beads of fraction d = 3–5 mm. As the Qc circulation flow rate increased, the water flowing through the gravel pack increased linearly from 55 to 65%. The correlation coefficient of 0.98 indicates a very good degree of Qo/Qc parameter dependence on the total flow rate Qc.
Only half of the well casing was used in Scenario A, and thus only the lower part of the gravel pack. This measurement aimed to verify the basic functionality of the laboratory model constructed prior to its full completion. The measurements of this incomplete model confirmed the relevance of the conceptual model, and the functionalities of the individual parts of the model were verified. After the measurement, the model was completed, i.e., the complete well casing and the gravel pack were installed.
3.1.2. Scenario B
The values of hydraulic conductivity, K, of the gravel pack varied between 2.83 × 10⁻² and 3.21 × 10⁻² m/s at different total flow rates, Qc. This corresponds to the mixture of glass beads of fraction d = 3–5 mm used. This was also in accordance with the previous results obtained within the framework of Scenario A, with half the volume of the gravel pack. As the Qc circulation flow rate increased, the water flowing through the gravel pack increased linearly from 44% to approximately 57%. The smaller proportion of Qo flow in the total flow corresponds to the fact that the gravel pack was installed in the entire extraction well profile under Scenario B. Therefore, the resistance of the gravel pack to water flow increased slightly. The correlation coefficient of 0.98 indicates a very good degree of linear dependence of the Qo/Qc parameter on the total flow rate Qc.
3.1.3. Scenario C
The values of hydraulic conductivity, K, of the gravel pack varied between 7.08 × 10⁻³ and 9.2 × 10⁻³ m/s at different total flow rates, Qc. The reduced hydraulic conductivity value corresponds to the mixture of glass beads and filtration sand used, that is, a mixture that simulates reduced permeability, for example, due to clogging. As the circulation flow rate Qc increased, the proportion of water flowing through the filter packing increased linearly. However, in this case, the proportion of this flow to the total flow was lower by an order of magnitude, ranging from 2.99% to approximately 5.04%. The fundamentally lower proportion of Qo flow to total flow corresponded to the fact that, in Scenario C, a gravel pack with lower permeability was installed. Thus, the resistance of the gravel pack to water flow increased. The correlation coefficient of 0.63 indicates a lower level of correlation of the Qo/Qc parameter with the total flow rate Qc compared to Scenarios A and B, where gravel pack clogging was not simulated.
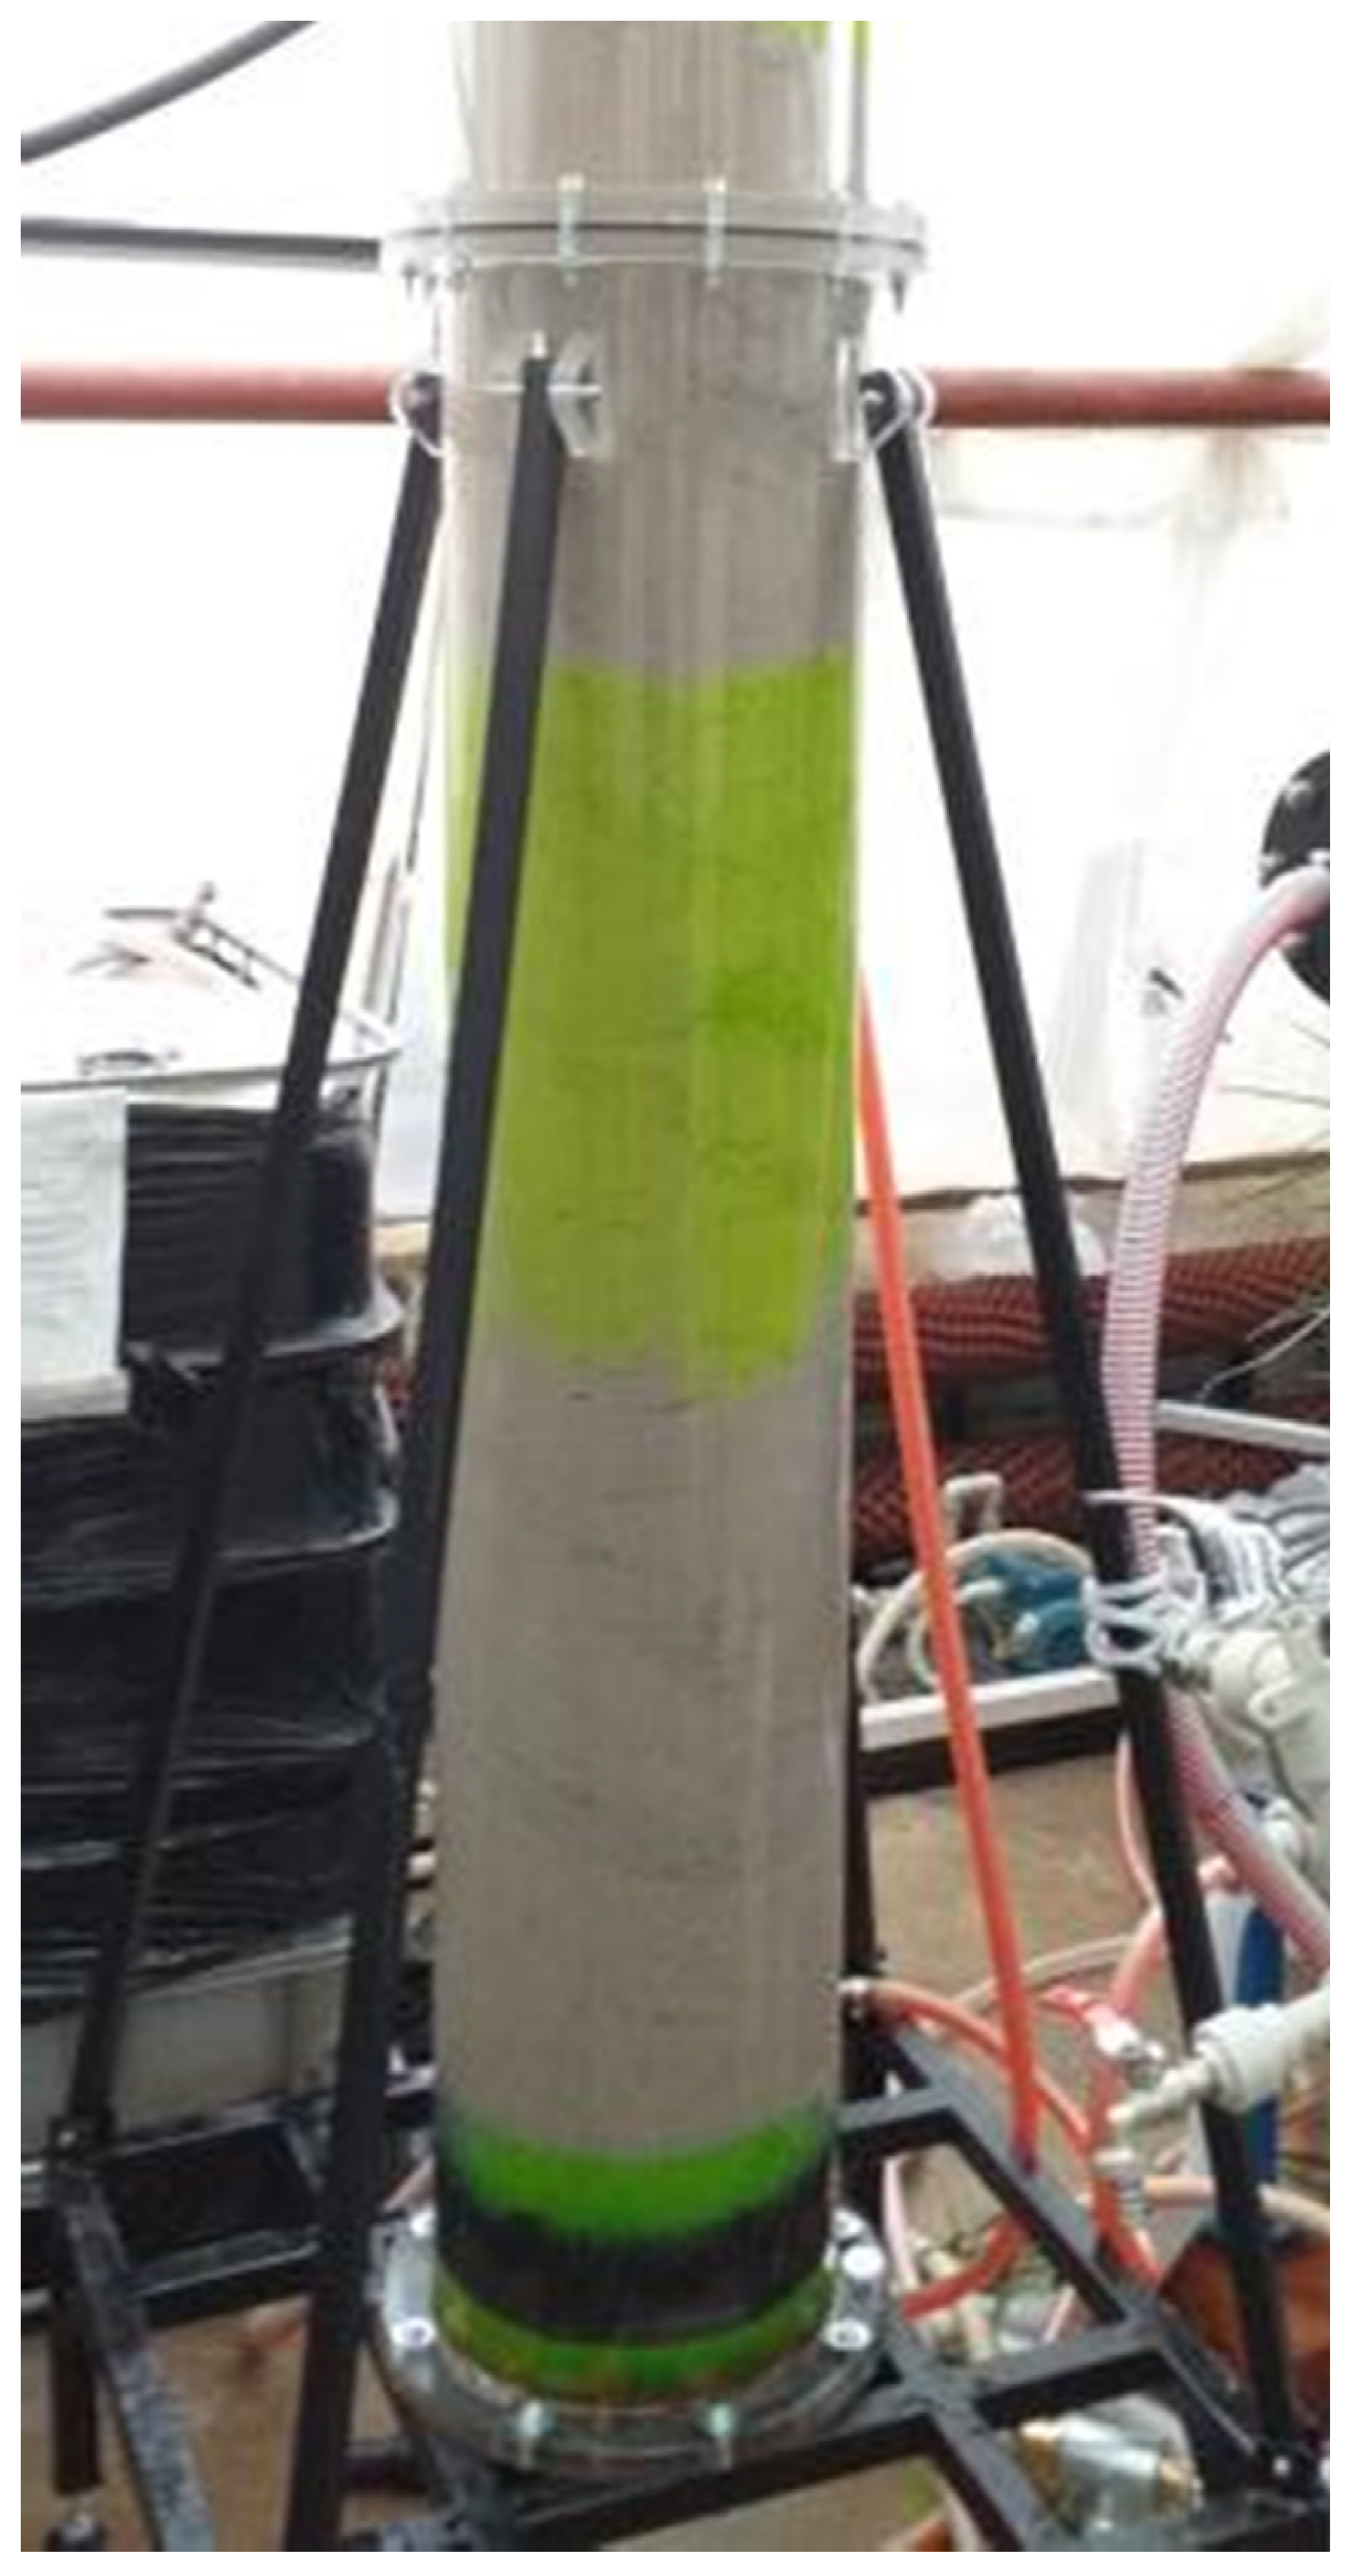
As part of the laboratory measurements at the end of Scenario C, a tracer test was performed to document the water flow through the gravel pack in the place where the laboratory model was sealed with the packer. Sodium fluorescein (uranine) was used as a tracer and applied to the equalizing tank. As water circulated through the entire model, the tracer progressively stained the gravel pack around the pneumatic packer (Figure 7). In this way, the function of the INV-FLOW apparatus was visually verified.
Due to the tests performed on the laboratory model of an extraction well, the conceptual model of the INV-FLOW apparatus was successfully verified by reproducing the one-dimensional vertical groundwater flow into the extraction well. The actual flow rate was divided into a component flowing through the well casing Qp and a component flowing through the gravel pack Qo. The Qo/Qc ratio was significantly correlated with the values of the total flow rate, Qc, and the hydraulic conductivity, K, of the gravel pack. In the case of a flow through the gravel pack without clogging, the Qo/Qc ratio was approximately 44–57%. In the case of the gravel pack showing clogging, it was only approximately 3–5%.
3.2. Pilot Test Experiments
For the pilot tests, the INV-FLOW apparatus was constructed based on previous knowledge and results of measurements. A picture of the constructed apparatus is shown in Figure 8.
3.2.1. Pilot Tests Carried Out on 2 July 2020: HJ-4 Extraction Well
The measurement record and the plot of the ratio Qo/Qc = f(Qc) for the HJ-4 extraction well are shown in Table 7 and Figure 9, respectively. It can be seen that 93 to 97% of the pumped groundwater flowed through the gravel pack. This confirms that the HJ-4 extraction well was newly installed at the time of measurement and the gravel pack had an ideal permeability for the pumped water. Here, the total pumped flow rate equation Qc (Equation (1)) also included water flowing from the surrounding aquifer (Qin). To be able to insert a specific value of Qin into the balance equation, it was necessary to calculate this value according to Equations (4) and (5). During the fieldwork, the following values were measured:
- Hydraulic conductivity of the aquifer in the surroundings of the HJ-4 extraction well: K = 1.75 × 10⁻⁶ m/s (Table 3);
- Radius of the HJ-4 casing: rv = 0.0875 m (Figure 2);
- Distance between the observation well (HJ-3) and the pumped extraction well (HJ-4): RPV1 = 20 m (Figure 2);
- Distance between pneumatic packers: L = 2.1 m (Figure 2);
- The thickness of the aquifer in the measured extraction well HJ-4 at the maximum pumping Qc = 1.11 l/s: hV = 49.1 m (the aquifer was calculated by subtracting the measured groundwater level in the extraction well HJ-4, 4.9 m b.g.l., from the total depth of the extraction well HJ-4 that reaches the base of the aquifer, 54 m b.g.l.);
- Aquifer thickness in the observation well HJ-3 at the maximum pumping Qc = 1.11 l/s: hV1 = 50.31 m (the aquifer thickness was calculated by subtracting the measured groundwater level in the HJ-3 observation well, 3.69 m b.g.l., from the total depth of the HJ-4 extraction well that reaches the aquifer base, 54 m b.g.l.); due to the small distance between extraction well HJ-4 and observation well HJ-3, the base of the aquifer can be considered to be approximately the same depth.
After inserting these values into Equations (4) and (5), the value Qin = 0.0047 l/s was obtained. Because the changes in Qin were minimal compared to the changes in the total pumped flow Qc, the same values of Qin for all pumped flows Qc were considered for simplification at a given measured depth.
3.2.2. Pilot Tests Carried Out on 2 July 2020: HJ-3 Extraction Well
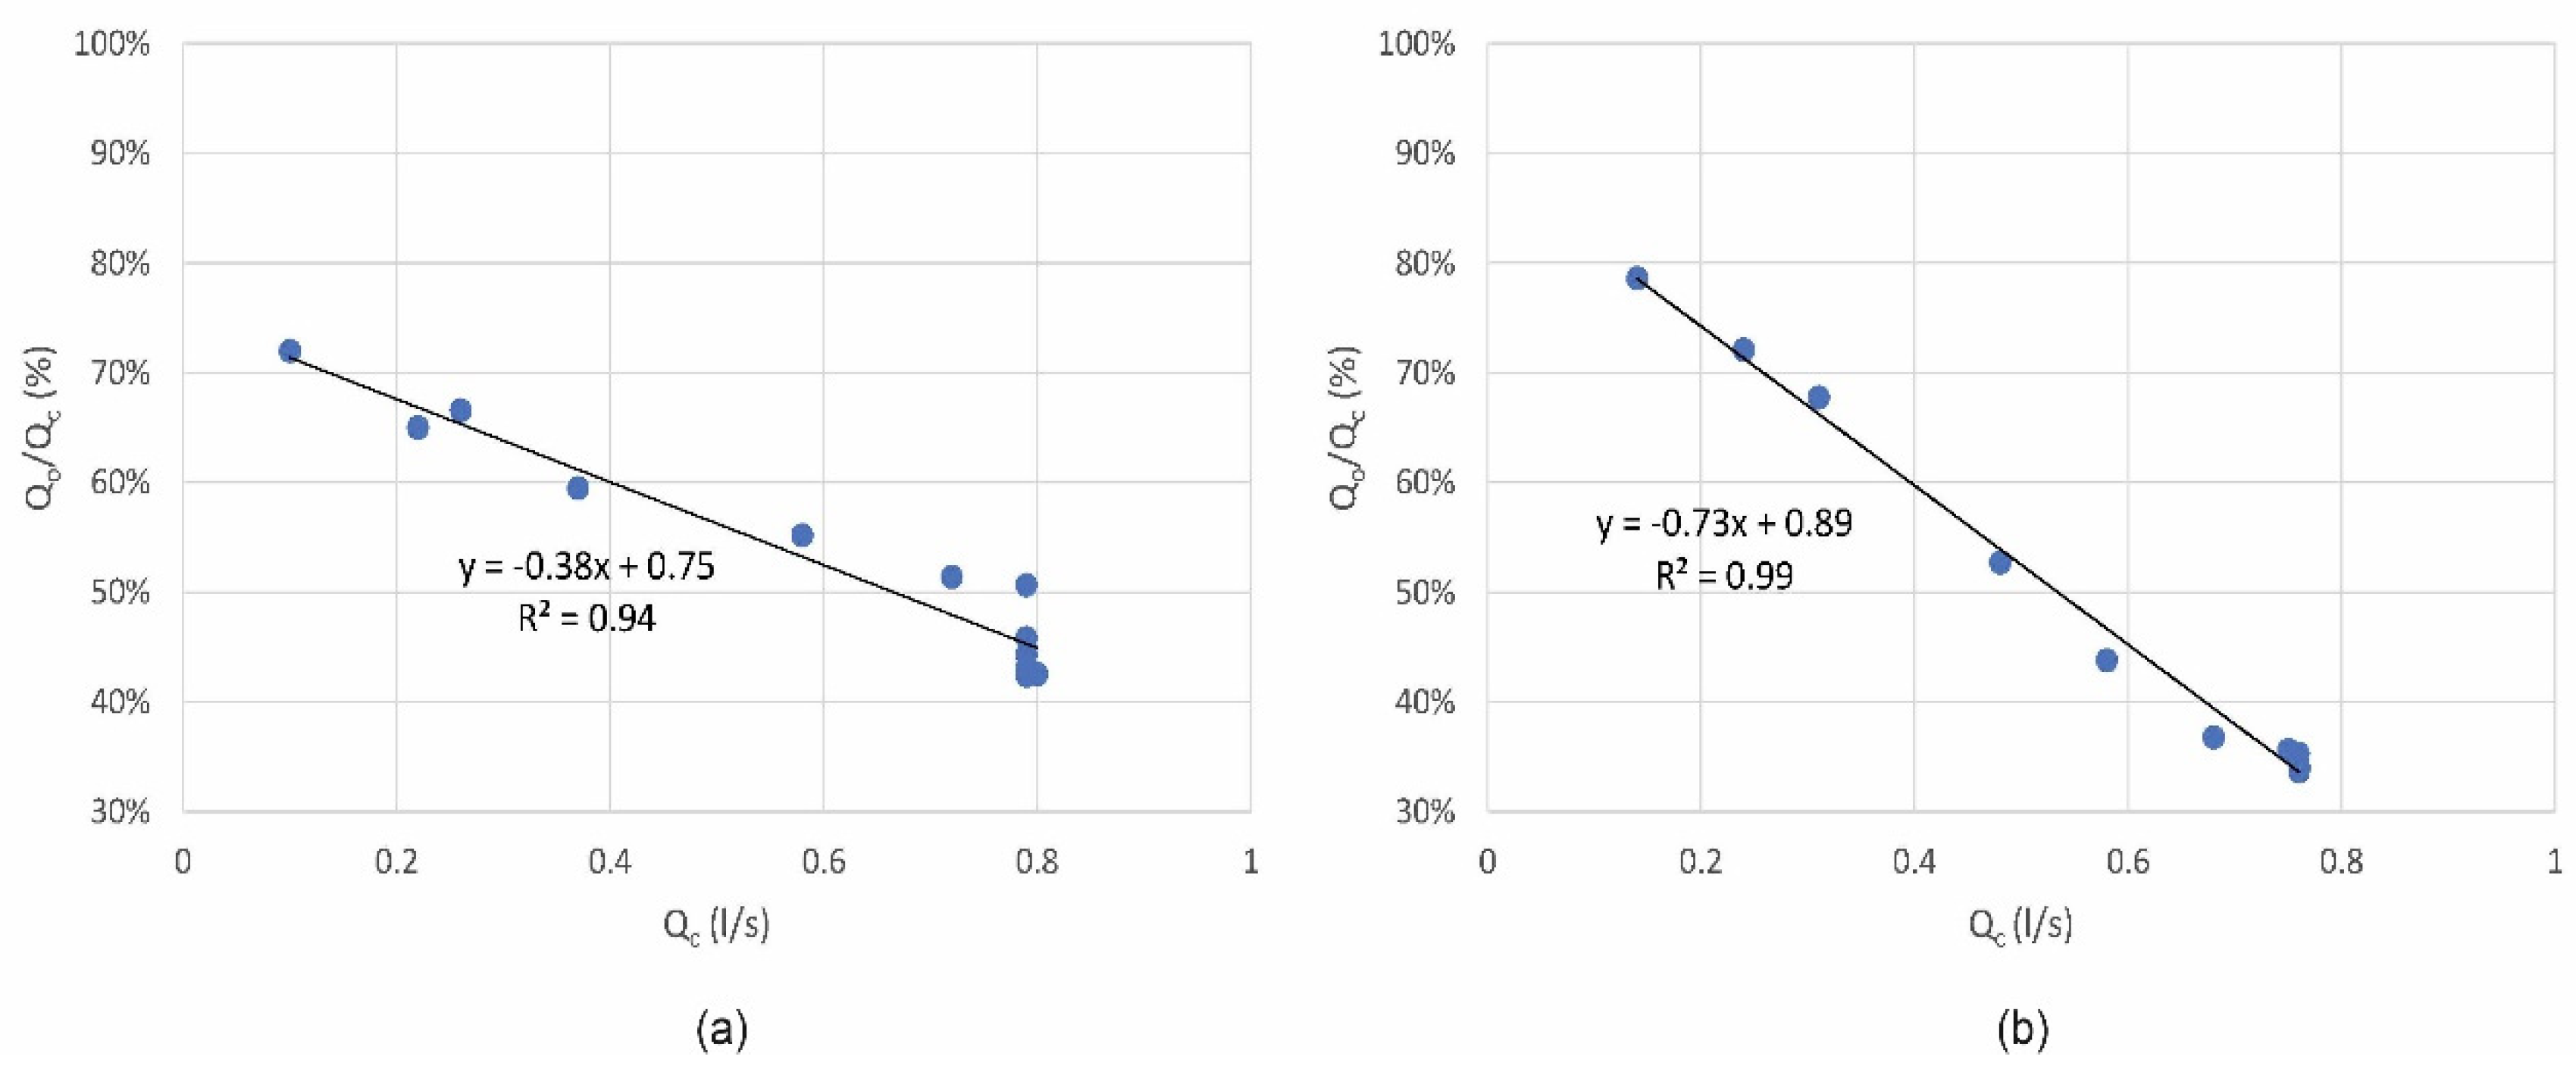
The measurement record at two depth levels of the HJ-3 extraction well is shown in Table 8 and Table 9 and Figure 10. In this case, the contribution of groundwater to the surrounding environment of the aquifer was assumed to be zero (Qin = 0.0 l/s) because the HJ-3 extraction well showed a high degree of clogging in the measured sections, as confirmed both by the geophysical logging and the camera inspections [46]. With the increasing pumping flow rate Qc, a rapid decrease in water flow around the pneumatic packer through the gravel pack can be seen. At the measurement depth of 11.75 m b.g.l., 40–50% of the pumped water flowed through the gravel pack at the maximum pumped flow rate. At the depth of 15.75 m b.g.l., only 30–40% of the pumped water flowed through the gravel pack. Thus, it is evident that clogging contributed significantly to the limited water flow through the gravel pack. The INV-FLOW apparatus during the pilot testing on the HJ-3 extraction well is shown in Figure 11.
3.2.3. Pilot Tests Carried Out on 28 July 2020: HJ-3 Extraction Well
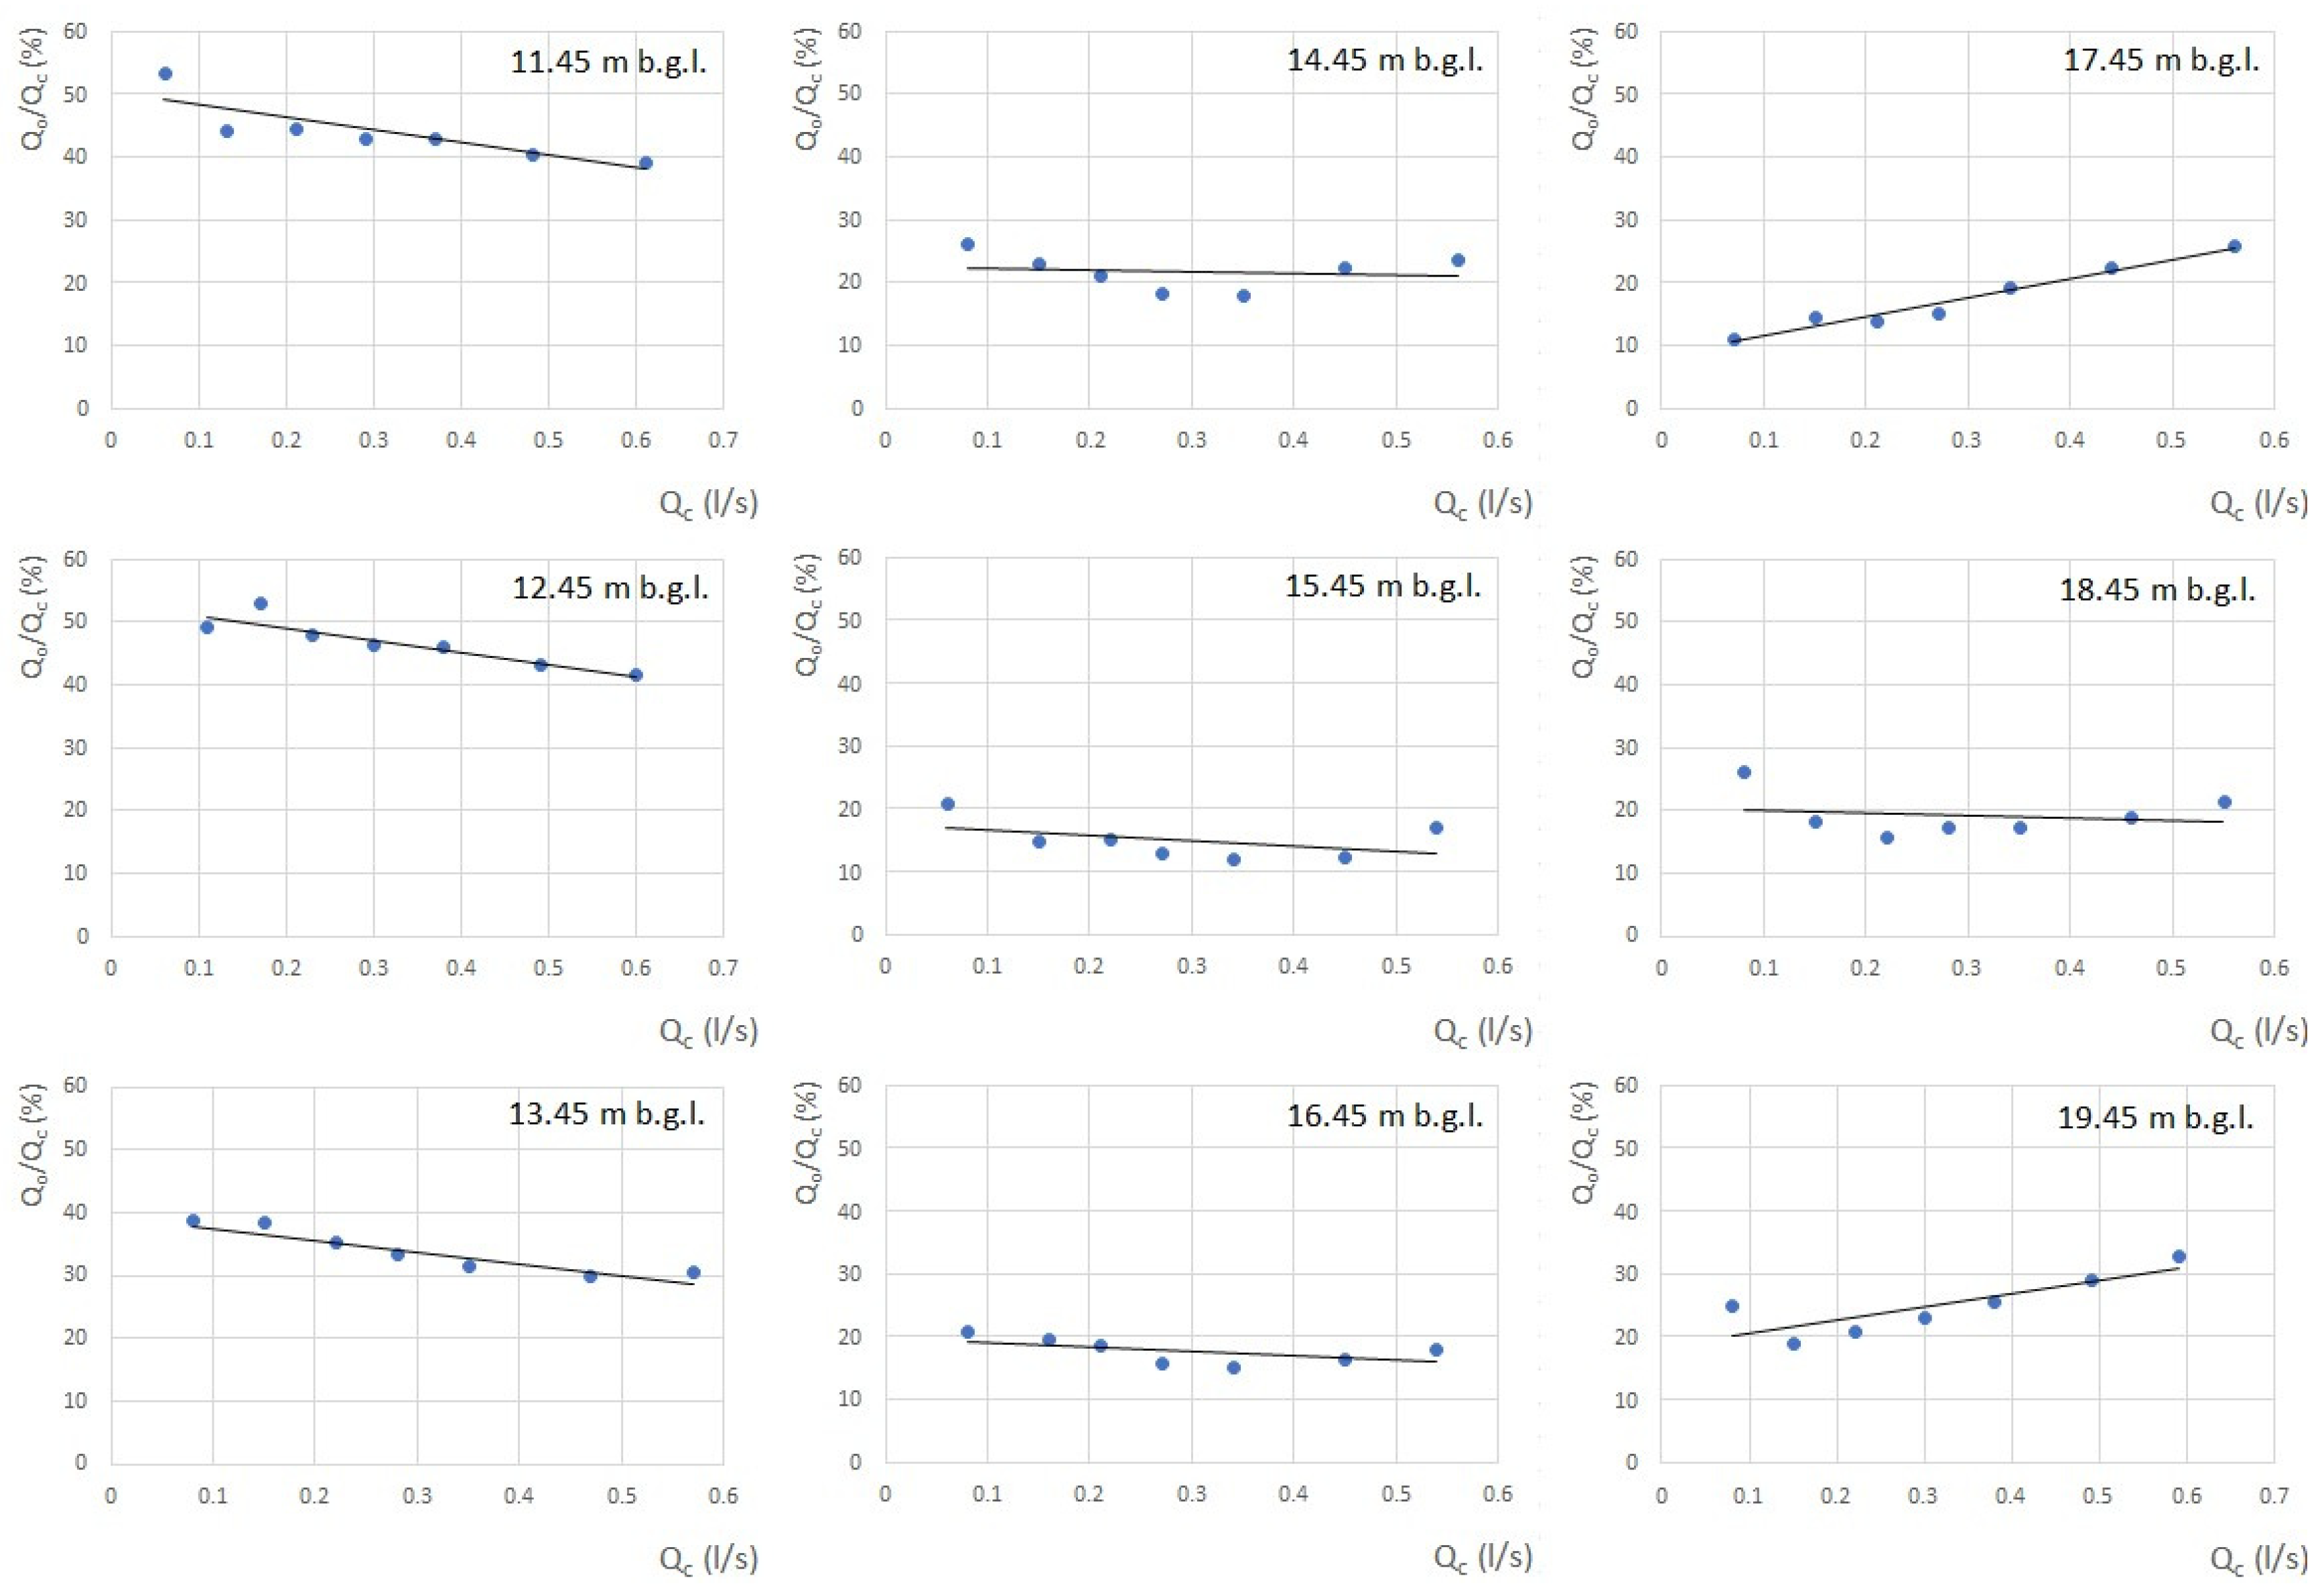
Within the framework of the pilot tests on the HJ-3 extraction well, measurements using the INV-FLOW apparatus were carried out at nine depth levels to determine the vertical profile of the degree of well clogging. A plot Qo/Qc = f(Qc) was constructed (Figure 12). Subsequently, the overall depth profile H = f(Qo/Qc) could be constructed (Figure 13).
From the assessment of the measured data, it is evident that a gradual decrease in the proportion of water that was able to flow through the gravel pack occurred in sections 11–15 m b.g.l., from a value of 50% down to a value of 20%. Thus, the filtration ability decreased with the growing depth in this section, and the well clogging increased. In sections 15–20 m b.g.l., the proportion of water that could flow through the gravel pack was permanently below 30%. In this section, the well filtration function was considerably reduced by the influences of clogging and incrustation.
The results of the pilot measurements on the HJ-3 extraction well agree with both the geophysical logging [46] and the camera inspection of the measured extraction well HJ-3 [47], where incrustation on the inner side of the extraction well was easily recognizable. Examples of camera inspection pictures are shown in Figure 14, comparing images from the new extraction well HJ-4 and the extraction well HJ-3.
4. Conclusions
In 2020, a functional INV-FLOW apparatus was constructed to assess the filtration function of an extraction well by measuring the vertical flow of water in the extraction well. The apparatus was tested at a pilot site on two extraction wells that differed in their technical condition. The testing of extraction wells HJ-4 and HJ-3 confirmed previous laboratory results. The tests also showed good agreement of the measurement results with the geophysical logging in these wells.
It was shown that, in the case of a functional extraction well, most of the water was able to flow through the gravel pack during the measurements taken using the INV-FLOW apparatus. The ratio Qo/Qc was above 0.5, and the dependence Qo/Qc = f(Qc) had an approximately linear shape with a positive gradient. In the event that only a limited amount of pumped water flowed through the gravel pack, this indicated increased clogging and incrustation and the limited function of the extraction well. Then, the ratio Qo/Qc was below 0.5 and decreased with the increasing total amount of pumped water Qc.
With regard to the application area of the INV-FLOW apparatus, it may be primarily used by water supply companies operating extraction wells. Based on direct measurement by the INV-FLOW apparatus, the extraction well operator can evaluate the level of clogging or incrustation of the extraction well and decide on the need to regenerate the extraction well, or potentially end its operation. The INV-FLOW apparatus was tested in a shallow part of the aquifer with the prevailing porous permeability of the weathered zone. The applicability of this apparatus in a fractured environment is, in principle, possible, as its technical arrangement is not dependent on the type of permeability of the aquifer. It is then recommended to use the borehole dilution technique to determine the groundwater inflow from the aquifer to the measured extraction well.
Author Contributions
Conceptualization, J.K. and D.K.; methodology, J.K., D.K. and P.P.; formal analysis, J.K., D.K. and V.F.; data curation, J.K.; writing—original draft preparation, J.K., D.K. and P.P.; writing—review and editing, J.K. and P.P.; supervision, P.P.; project administration, J.K., D.K. and P.P. All authors have read and agreed to the published version of the manuscript.
Funding
The projects TH04030492 “INV-FLOW: Technology for direct measurement of vertical groundwater flow and zonal quantification of well inflows based on electromagnetic flow induction”, funded by the Technology Agency of the Czech Republic (TACR), and SS01020224 “Small regeneration set MARS”, funded by the Technology Agency of the Czech Republic (TACR).
Institutional Review Board Statement
Not applicable.
Informed Consent Statement
Not applicable.
Data Availability Statement
Not applicable.
Conflicts of Interest
The authors declare that they have no conflict of interest.
References
- Betuš, Z.; Pinka, J. Hydrogeologické Vrty; Štroffek: Košice, Slovakia, 1998; p. 223. ISBN 80888896274. [Google Scholar]
- Ghosh, C.; Yasuhara, K. Ultrasonic Removal of Clogging and Evaluation of Flow Capacity of Geotextile Drain. Indian Geotech. J. 2021, 51, 539–551. [Google Scholar] [CrossRef]
- Liu, H.; Liu, Z.; Morató, J.; Hu, Z.; Zhuang, L.; Kang, X.; Pang, Y. Evaluation of substrate clogging in a full-scale horizontal subsurface flow treatment wetland using electrical resistivity tomography with an optimized electrode configuration. Sci. Total Environ. 2022, 824, 153981. [Google Scholar] [CrossRef] [PubMed]
- Sterrett, R.J. Groundwater and Wel, 3rd ed.; John son Screens: New Brighton, MN, USA, 2007; p. 86. ISBN 978-0-9787793-0-6. [Google Scholar]
- Bláha, P.; Lukeš, J. Co můžeme najít v zapažených průzkumných vrtech? Sborník vědeckých prací Vysoké školy báňské-Technické univerzity Ostrava. Řada Stavební 2005, 5, 1–9. Available online: http://hdl.handle.net/10084/84579. (accessed on 8 February 2022). (In Czech).
- Hanák, D. Zpracování komplexního karotážního měření. Diploma Thesis, Charles University, Prague, Czech Republic, 2008. Available online: https://home.czu.cz/storage/575/52485_Hanak-2018.pdf (accessed on 19 June 2022). (In Czech).
- Skryté a Úmyslné Vady ve Výstroji Vrtů. Available online: https://voda.tzb-info.cz/vlastnosti-a-zdroje-vody/19085-skryte-a-umyslne-vady-ve-vystroji-vrtu (accessed on 31 March 2022). (In Czech).
- Blair, A.H. Screens and Gravel Packs. Ground Water 1970, 8, 10–21. [Google Scholar] [CrossRef]
- California Department of Water Resources. Cathodic Protection Standards. Southern District. 1998. Available online: https://water.ca.gov/ (accessed on 19 June 2022).
- Company, R.M. Handbook of Ground Water Development, 1st ed.; Roscoe Moss Company: Los Angeles, CA, USA; John Wiley & Sons, Inc.: New York, NY, USA, 1990; p. 493. ISBN 978-0-471-85611-5. [Google Scholar]
- Adebayo, A.R.; Bageri, B.S. A simple NMR methodology for evaluating filter cake properties and formation damage induced by drilling fluid-induced formation damage. J. Pet. Explor. Prod. Technol. 2019, 9, 1643–1655. [Google Scholar]
- Ma, C.; Deng, J.; Dong, X.; Sun, D.; Feng Luo Xiao, Q.; Chen, J. A new laboratory protocol to study the plugging and sand control performance of sand control screens. J. Pet. Sci. Eng. 2020, 184, 106548. [Google Scholar] [CrossRef]
- Van Beek CG, E.M.; Breedveld RJ, M.; Juhász-Holterman, M.; Oosterhof, A.; Stuyfzand, P.J. Cause and prevention of well bore clogging by particles. Hydrogeol. J. Off. J. Int. Assoc. Hydrogeol. 2009, 17, 1877–1886. [Google Scholar] [CrossRef]
- Houben, G.; Treskatis, C. Water Well Rehabilitation and Reconstruction, 3rd ed.; McGraw Hill Professional: New York, NY, USA, 2007; ISBN 0-07-148651-8. [Google Scholar]
- Houben, G.J. Iron oxide incrustations in Wells—Part 1: Genesis, mineralogy and geochemist Try. Appl. Geochem. 2003, 18, 927–939. [Google Scholar] [CrossRef]
- Bageri, B.S.; Al-Mutairi, S.H.; Mahmoud, M.A. Different techniques for characterizing the filter cake. Presented at the SPE Unconventional Gas Conference and Exhibition, Muscat, Oman, 28–30 January 2013. [Google Scholar] [CrossRef]
- Payne, F.; Quinnan, J.; Potter, S. Remediation Hydraulics; CRC Press: London, UK, 2008; p. 432. ISBN 978-0849372490. [Google Scholar]
- Dausse, A.; Guihéneufa, N.; Parker, B.L. Impact of flow geometry on parameter uncertainties for underdamped slug tests in fractured rocks. J. Hydrol. 2021, 592, 125567. [Google Scholar] [CrossRef]
- Lei Wang, L.; Xiang, Y.; Hu, J.; Li, T.; Cai, C.; Cai, J. Unsteady flow to a partially penetrating pumping well with wellbore storage in a dual-permeability confined aquifer. J. Hydrol. 2020, 591, 125345. [Google Scholar] [CrossRef]
- Chen, H.; Wang, Y.; Pang, M.; Fang, T.; Zhao, S.; Wang, Z.; Zhou, Y. Research on Plugging Mechanism and Optimisation of Plug Removal Measure of Polymer Flooding Response Well in Bohai Oilfield. Int. Pet. Technol. 2021, 23, 1–3. [Google Scholar] [CrossRef]
- Iscan, A.G.; Kok, M.V.; Bagci, A.S. Permeability Reduction Due to Formation Damage by Drilling Fluids. Energy Sources 2007, 29, 851–859. [Google Scholar] [CrossRef]
- Patel, M.C.; Singh, A. Near Wellbore Damage and Types of Skin Depending on Mechanism of Damage. In Proceedings of the Society of Petroleum Engineers SPE International Conference and Exhibition on Formation Damage Control, Lafayette, LA, USA, 24–26 February 2016. [Google Scholar]
- Morozov, P.E. Groundwater Flow Near a Vertical Circulation Well with a Skin-Effect. Water Resour. 2021, 48, 737–745. [Google Scholar] [CrossRef]
- Watlton, W.C. Aquifer Test Modeling, 1st ed.; CRC Press: Boca Ralton, FL, USA, 2007; p. 240. ISBN 978-1-4200-4292-4. [Google Scholar]
- Liu, P.C.; Li, W.H.; Xia, J.; Jiao, Y.W.; Bie, A.F. Derivation and application of mathematical model for well test analysis with variable skin factor in hydrocarbon reservoirs. AIP Adv. 2016, 6, 065324. [Google Scholar] [CrossRef]
- Mansuy, N. Water Well Rehabilitation; CRC Press: Boca Raton, FL, USA, 2017; pp. 113–149. [Google Scholar]
- Abramova, A.V.; Abramov, V.O.; Bayazitov, V.M.; Nikonov, R.V. A method for water well regeneration based on shock waves and ultrasound. Ultrason. Sonochemistry 2017, 36, 375–385. [Google Scholar] [CrossRef]
- Pitrak, M.; Mares, S.; Kobr, M. A simple borehole dilution technique in measuring horizontal ground water flow. GroundWater 2007, 45, 89–92. [Google Scholar] [CrossRef]
- Batu, V. Aquifer Hydraulics: A Comprehensive Guide to Hydrogeologic Data Analysis; John Wiley & Sons: New York, NY, USA, 1998; p. 727. ISBN 0-471-18502-7. [Google Scholar]
- Horne, R.N. Modern Well Test Analysis: A Computer Aided Approach, 4th ed.; Alto, P., Ed.; Petroway, Inc.: Palo Alto, CA, USA, 1995; p. 185. ISBN 0-9626992-09.55. [Google Scholar]
- Kabala, Z.J. Sensitivity analysis of a pumping test on a well with wellbore storage and skin. Adv. Water Resour. 2001, 24, 483–504. [Google Scholar] [CrossRef]
- Chen, C.; Lan, C. A simple data analysis method for a pumping test with skin and wellbore storage effect. Terr. Atmos. Ocean. Sci. 2009, 20, 557–562. [Google Scholar] [CrossRef] [Green Version]
- Ramey, H.H., Jr. Interpretation of short-time well test data in the presence of skin effect and well bore storage. J. Pet. Technol. 1970, 22, 97–104. [Google Scholar] [CrossRef]
- Yeh, H.D.; Chang, Y.C. Recent advances in modeling of well hydraulics. Adv. Water Resour. 2013, 51, 27–51. [Google Scholar] [CrossRef]
- Agarwal, R.G.; Al-Hussainy, R.; Ramey, H.J. An investigation of well storage and skin effect in unsteady liquid flow: I. Analytical treatment. Soc. Pet. Eng. J. 1970, 10, 279–291. [Google Scholar] [CrossRef]
- Papadopulos, I.S.; Cooper, H.H. Drawdown in a well of large diameter. Water Resour. Res. 1967, 3, 241–244. [Google Scholar] [CrossRef]
- Stehfest, H. Algorithm 368: Numerical inversion of Laplace transforms. Commun. ACM 1970, 13, 47–49. [Google Scholar] [CrossRef]
- Cooper, H.H.; Jacob, C.E. A generalized graphical method for evaluating formation constants and summarizing well-field history. Trans. Am. Geophys. Union 1946, 27, 526–534. [Google Scholar] [CrossRef]
- Kahuda, D.; Pech, P. A new method for evaluation of well rehabilitation from the early-portion of the pumping test. Water 2020, 12, 744. [Google Scholar] [CrossRef] [Green Version]
- Ficaj, V.; Pech, P.; Kahuda, D. Software for Evaluating Pumping Tests on Real Wells. Appl. Sci. 2021, 11, 3182. [Google Scholar] [CrossRef]
- Kahuda, D.; Pech, P.; Ficaj, V.; Pechová, H. Well Rehabilitation via the Ultrasonic Method and Evaluation of Its Effectiveness from the Pumping Test. Coatings 2021, 11, 1250. [Google Scholar] [CrossRef]
- Van Everdingen, A.F.; Hurst, W. The Application of the Laplace Transformation to Flow problems in reservoirs. J. Pet. Technol. 1949, 1, 305–324. [Google Scholar] [CrossRef]
- Hawkins, M.F., Jr. A note on the skin effect. Trans. Am. Inst. Min. Metall. Eng. 1956, 8, 356–357. [Google Scholar] [CrossRef]
- Darcy, H. Les Fontaines Publiques de la Ville de Dijon; Victor Dalmont, Editeur: Paris, France, 1856; p. 947. [Google Scholar]
- Vaněk, R. Zpráva o Hydrogeologickém Průzkumu v Hadačce-II. Etapa, Agroprojekt Praha, Závod Plzeň. 1975. Available online: https://storage/575/52485_Vanek-1975.pdf. (accessed on 19 June 2022). (In Czech).
- Procházka, M. Hadačka, Výrov u Kralovic, Zpráva o Karotážním Měření v Novém Vrtu HJ-4 a ve Starším Vrtu HJ-3, SG Geotechnika. 2020. Available online: https://home.czu.cz/storage/575/52485_Prochazka-2020.pdf (accessed on 31 March 2022). (In Czech).
- Kahuda, D. Hadačka, Mechanicko-Chemická Regenerace Jímacích Vrtů HJ-2 a HJ-3, Hydro Dynamické Zkoušky Jímacích Vrtů HJ-2 a HR-Závěrečná Zpráva, Vodní Zdroje. 2017. Available online: https://home.czu.cz/storage/575/52485_Kahuda-2017-VZ-ZZ.pdf (accessed on 31 March 2022). (In Czech).
- Kahuda, D. Projekt Geologických Prací, Hadačka, Průzkumný Hydrogeologický vrt HJ-4, Vodní Zdroje. 2020. Available online: https://home.czu.cz/storage/575/52485_Kahuda-2020.pdf (accessed on 19 June 2022). (In Czech).
Figure 1.
Conceptual diagram of the INV-FLOW apparatus.

Figure 2.
Scheme for determining the amount of groundwater inflow into the extraction well through height L.
Figure 2.
Scheme for determining the amount of groundwater inflow into the extraction well through height L.

Figure 3.
Graph showing wellbore storage and skin effects on pumping test (sD-dimensionless drawdown, tD-dimensionless time).
Figure 3.
Graph showing wellbore storage and skin effects on pumping test (sD-dimensionless drawdown, tD-dimensionless time).

Figure 4.
General scheme of laboratory tests of the INV-FLOW apparatus.

Figure 5.
The location of the Hadačka site.

Figure 6.
Dependence of the Qo/Qc parameter on the total flow rate Qc—Scenario A, B, and C.

Figure 7.
The laboratory tracer test carried out in Scenario C visually indicated the measuring area of the INV-FLOW apparatus.
Figure 7.
The laboratory tracer test carried out in Scenario C visually indicated the measuring area of the INV-FLOW apparatus.

Figure 8.
The constructed INV-FLOW apparatus used in the pilot tests.

Figure 9.
Pilot test on the HJ-4 extraction well on 2 July 2020.

Figure 10.
Pilot test on the HJ-3 extraction well on 2 July 2020: (a) measured profile 11.75 m b.g.l.; (b) measured profile 15.75 m b.g.l.
Figure 10.
Pilot test on the HJ-3 extraction well on 2 July 2020: (a) measured profile 11.75 m b.g.l.; (b) measured profile 15.75 m b.g.l.

Figure 11.
The INV-FLOW apparatus during installation in the measured extraction well HJ-3 at the pilot site.
Figure 11.
The INV-FLOW apparatus during installation in the measured extraction well HJ-3 at the pilot site.

Figure 12.
Pilot test on the HJ-3 extraction well on 28 July 2020—measurements at various depth levels.
Figure 12.
Pilot test on the HJ-3 extraction well on 28 July 2020—measurements at various depth levels.

Figure 13.
Pilot test on the HJ-3 extraction well on 28 July 2020-the overall profile of the HJ-3 extraction well.
Figure 13.
Pilot test on the HJ-3 extraction well on 28 July 2020-the overall profile of the HJ-3 extraction well.

Figure 14.
Camera pictures of the well casing: (a) HJ-4 extraction well, depth 19.8 m b.g.l.; (b) HJ-3 extraction well, depth 15.1 m b.g.l.
Figure 14.
Camera pictures of the well casing: (a) HJ-4 extraction well, depth 19.8 m b.g.l.; (b) HJ-3 extraction well, depth 15.1 m b.g.l.


Table 1.
Scenarios measured in laboratory tests on a model of an extraction well.
| Scenario | Measurement No. | Scenario Description |
|---|---|---|
| A | 1–4 | Only one segment of the screen (lower part) was installed, a sealing packer located at the top of the installed laboratory model, and a gravel pack without clogging simulation. |
| B | 1–4 | Two segments of well screen and one sealing packer installed between them, and a gravel pack without clogging simulation. |
| C | 1–6 | Two segments of well screen and one sealing packer installed between them, and a gravel pack with clogging simulation. |
Table 2.
Results of pumping and recovery tests for extraction well HJ-3 [47].
Table 2.
Results of pumping and recovery tests for extraction well HJ-3 [47].
| Well Yield (l/s) | Initial GW Level Below Terrain (m) | GW Level Dropdown (m) | Specific Yield (l/s/m) | Transmissivity (m2/s) | Hydraulic Conductivity (m/s) | ||
|---|---|---|---|---|---|---|---|
| Before well regeneration | Pumping test | 1.33 | 2.57 | 14.7 | 0.09 | 6.43 × 10⁻⁴ | 2.26 × 10⁻⁵ |
| Recovery test | 1.52 × 10⁻⁵ | 5.36 × 10⁻⁷ | |||||
| Afterward well regeneration | Pumping test (1) | 1.33 | 4.33 | 4.39 | 0.3 | 6.4 × 10⁻⁴ | 2.41 × 10⁻⁵ |
| Pumping test (2) | 3.43 × 10⁻⁴ | 1.29 × 10⁻⁵ | |||||
| Recovery test | 5.46 × 10⁻⁴ | 2.05 × 10⁻⁵ |
Table 3.
Results of pumping and recovery tests for extraction well HJ-4 [48].
Table 3.
Results of pumping and recovery tests for extraction well HJ-4 [48].
| Well Yield (l/s) | Initial GW Level Below Terrain (m) | GW Level Dropdown (m) | Specific Yield (l/s/m) | Transmissivity (m2/s) | Hydraulic Conductivity (m/s) | |
|---|---|---|---|---|---|---|
| Pumping test | 1.25 | 3.86 | 6.33 | 0.2 | 4.33 × 10⁻⁵ | 8.64 × 10⁻⁷ |
| Recovery test (1) | 1.05 × 10⁻⁴ | 2.19 × 10⁻⁶ | ||||
| Recovery test (2) | 1.05 × 10⁻⁴ | 2.19 × 10⁻⁶ | ||||
| Average: 1.75 × 10⁻⁶ | ||||||
Table 4.
Scenario A on a laboratory model of an extraction well.
| No. | Qc (l/s) | Qp (l/s) | Qo (l/s) | Ha (m) | L (m) | I (-) | Ko (m/s) | Qo/Qc (%) |
|---|---|---|---|---|---|---|---|---|
| 1 | 0.09 | 0.04 | 0.05 | 0.045 | 1.05 | 0.04 | 3.30 × 10⁻² | 55.6 |
| 2 | 0.15 | 0.06 | 0.09 | 0.081 | 1.05 | 0.08 | 3.31 × 10⁻² | 60.0 |
| 3 | 0.21 | 0.08 | 0.13 | 0.143 | 1.05 | 0.14 | 2.71 × 10⁻² | 61.9 |
| 4 | 0.26 | 0.09 | 0.17 | 0.198 | 1.05 | 0.19 | 2.56 × 10⁻² | 65.4 |
a H = H2 − H1 (Figure 4).
Table 5.
Scenario B on a laboratory model of an extraction well.
| No. | Qc (l/s) | Qp (l/s) | Qo (l/s) | Ha (m) | L (m) | I (-) | Ko (m/s) | Qo/Qc (%) |
|---|---|---|---|---|---|---|---|---|
| 1 | 0.26 | 0.11 | 0.15 | 0.228 | 1.52 | 0.15 | 2.83 × 10⁻² | 57.7 |
| 2 | 0.09 | 0.05 | 0.04 | 0.065 | 1.63 | 0.04 | 2.84 × 10⁻² | 44.4 |
| 3 | 0.14 | 0.07 | 0.07 | 0.100 | 1.62 | 0.06 | 3.21 × 10⁻² | 50.0 |
| 4 | 0.19 | 0.09 | 0.1 | 0.154 | 1.58 | 0.10 | 2.91 × 10⁻² | 52.6 |
a H = H2 − H1 (Figure 4).
Table 6.
Scenario C on a laboratory model of an extraction well.
| No. | Qc (l/s) | Qp (l/s) | Qo (l/s) | H a (m) | L (m) | I (-) | Ko (m/s) | Qo/Qc (%) |
|---|---|---|---|---|---|---|---|---|
| 1 | 0.24 | 0.23 | 0.01 | 0.076 | 1.47 | 0.05 | 5.48 × 10⁻³ | 4.2 |
| 2 | 0.134 | 0.13 | 0.004 | 0.026 | 1.48 | 0.02 | 6.45 × 10⁻³ | 2.9 |
| 3 | 0.178 | 0.17 | 0.008 | 0.042 | 1.48 | 0.03 | 7.79 × 10⁻³ | 4.4 |
| 4 | 0.226 | 0.215 | 0.011 | 0.067 | 1.47 | 0.05 | 7.09 × 10⁻³ | 5.0 |
| 5 | 0.09 | 0.087 | 0.003 | 0.016 | 1.48 | 0.01 | 7.08 × 10⁻³ | 3.0 |
| 6 | 0.139 | 0.133 | 0.006 | 0.026 | 1.48 | 0.02 | 9.20 × 10⁻³ | 4.1 |
a H = H2 − H1 (Figure 4).
Table 7.
Pilot test on the HJ-4 extraction well on 2 July 2020.
| No. | Pump Performance (%) | Qc (l/s) | Qp (l/s) | Qin (l/s) | Qo (l/s) | Qo/Qc (%) |
|---|---|---|---|---|---|---|
| 1 | 10 | 0.18 | 0.0073 | 0.0047 | 0.1680 | 93.3 |
| 2 | 15 | 0.31 | 0.0098 | 0.0047 | 0.2955 | 95.3 |
| 3 | 20 | 0.41 | 0.0125 | 0.0047 | 0.3928 | 95.8 |
| 4 | 25 | 0.63 | 0.0185 | 0.0047 | 0.6068 | 96.3 |
| 5 | 30 | 0.88 | 0.0248 | 0.0047 | 0.8505 | 96.7 |
| 6 | 35 | 1.00 | 0.0280 | 0.0047 | 0.9673 | 96.7 |
| 7 | 40 | 1.08 | 0.0300 | 0.0047 | 1.0453 | 96.8 |
| 8 | 45 | 1.09 | 0.0305 | 0.0047 | 1.0548 | 96.8 |
| 9 | 50 | 1.09 | 0.0306 | 0.0047 | 1.0547 | 96.8 |
| 10 | 60 | 1.10 | 0.0306 | 0.0047 | 1.0647 | 96.8 |
| 11 | 70 | 1.11 | 0.0310 | 0.0047 | 1.0743 | 96.8 |
Table 8.
Pilot test on the HJ-3 extraction well on 2 July 2020 (measured profile 11.75 m b.g.l.).
| No. | Pump Performance (%) | Qc (l/s) | Qp (l/s) | Qin (l/s) | Qo (l/s) | Qo/Qc (%) |
|---|---|---|---|---|---|---|
| 1 | 10 | 0.10 | 0.028 | 0 | 0.072 | 72.0 |
| 2 | 15 | 0.22 | 0.077 | 0 | 0.143 | 65.0 |
| 3 | 20 | 0.26 | 0.087 | 0 | 0.173 | 66.5 |
| 4 | 25 | 0.37 | 0.150 | 0 | 0.220 | 59.5 |
| 5 | 30 | 0.58 | 0.260 | 0 | 0.320 | 55.2 |
| 6 | 35 | 0.72 | 0.350 | 0 | 0.370 | 51.4 |
| 7 | 40 | 0.79 | 0.390 | 0 | 0.400 | 50.6 |
| 8 | 45 | 0.79 | 0.428 | 0 | 0.362 | 45.8 |
| 9 | 50 | 0.79 | 0.440 | 0 | 0.350 | 44.3 |
| 10 | 60 | 0.79 | 0.440 | 0 | 0.350 | 44.3 |
| 11 | 70 | 0.79 | 0.450 | 0 | 0.340 | 43.0 |
| 12 | 80 | 0.79 | 0.455 | 0 | 0.335 | 42.4 |
| 13 | 100 | 0.80 | 0.460 | 0 | 0.340 | 42.5 |
Table 9.
Pilot test on the HJ-3 extraction well on 2 July 2020 (measured profile 15.75 m b.g.l.).
| No. | Pump Performance (%) | Qc (l/s) | Qp (l/s) | Qin (l/s) | Qo (l/s) | Qo/Qc (%) |
|---|---|---|---|---|---|---|
| 1 | 10 | 0.14 | 0.030 | 0 | 0.110 | 78.6 |
| 2 | 15 | 0.24 | 0.067 | 0 | 0.173 | 72.1 |
| 3 | 20 | 0.31 | 0.100 | 0 | 0.210 | 67.7 |
| 4 | 25 | 0.48 | 0.227 | 0 | 0.253 | 52.7 |
| 5 | 30 | 0.58 | 0.326 | 0 | 0.254 | 43.8 |
| 6 | 35 | 0.68 | 0.430 | 0 | 0.250 | 36.8 |
| 7 | 40 | 0.75 | 0.483 | 0 | 0.267 | 35.6 |
| 8 | 45 | 0.76 | 0.492 | 0 | 0.268 | 35.3 |
| 9 | 50 | 0.76 | 0.500 | 0 | 0.260 | 34.2 |
| 10 | 60 | 0.76 | 0.501 | 0 | 0.259 | 34.1 |
| 11 | 70 | 0.76 | 0.502 | 0 | 0.258 | 33.9 |
| 12 | 80 | 0.76 | 0.503 | 0 | 0.257 | 33.8 |
| 13 | 100 | 0.76 | 0.504 | 0 | 0.256 | 33.7 |
Publisher’s Note: MDPI stays neutral with regard to jurisdictional claims in published maps and institutional affiliations. |
© 2022 by the authors. Licensee MDPI, Basel, Switzerland. This article is an open access article distributed under the terms and conditions of the Creative Commons Attribution (CC BY) license (https://creativecommons.org/licenses/by/4.0/).
Share and Cite
MDPI and ACS Style
Kukačka, J.; Pech, P.; Ficaj, V.; Kahuda, D. INV-FLOW: New Possibilities to Evaluate the Technical Condition and Function of Extraction Wells. Water 2022, 14, 2005. https://doi.org/10.3390/w14132005
AMA Style
Kukačka J, Pech P, Ficaj V, Kahuda D. INV-FLOW: New Possibilities to Evaluate the Technical Condition and Function of Extraction Wells. Water. 2022; 14(13):2005. https://doi.org/10.3390/w14132005
Chicago/Turabian StyleKukačka, Jan, Pavel Pech, Václav Ficaj, and Daniel Kahuda. 2022. "INV-FLOW: New Possibilities to Evaluate the Technical Condition and Function of Extraction Wells" Water 14, no. 13: 2005. https://doi.org/10.3390/w14132005
Note that from the first issue of 2016, this journal uses article numbers instead of page numbers. See further details here.