
Pore-Scale Wetting Process of Capillary-Driven Flow in Unsaturated Porous Media under Micro- and Earth-Gravities


1
School of Agriculture, Meiji University, Kawasaki 214-8571, Japan
2
Research Institute for Geo-Resources and Environment, National Institute of Advanced Industrial Science and Technology (AIST), Geological Survey of Japan, Tsukuba 305-8567, Japan
3
Organization for the Strategic Coordination of Research and Intellectual Property, Meiji University, Kawasaki 214-8571, Japan
*
Author to whom correspondence should be addressed.
Water 2022, 14(13), 1995; https://doi.org/10.3390/w14131995
Submission received: 11 April 2022
/
Revised: 8 June 2022
/
Accepted: 16 June 2022
/
Published: 22 June 2022
(This article belongs to the Special Issue Advances and Challenges in Hydrological Modeling and Engineering)
Abstract
:Microgravity hinders capillary-driven water flow in unsaturated porous media. Previous studies proposed pore-scale phenomena such as “air entrapment”, “particle separation”, and “interruption on widening void space” to explain gravity-dependent capillary-driven flows. Our objectives were: (1) to measure the water flux densities of the pore-scale capillary-driven flow in micro- and Earth-gravities and (2) to reveal that what makes water flow slower under microgravity than under 1 G. We found that average macroscopic water flux densities had no significant difference under micro- and Earth-gravities (p = 0.30). We did not observe “air entrapment” in the pore spaces of porous media. “Widening on a single particle” and “capillary widening” disturbed capillary-driven flow; however, “widening on a single particle” had no significant gravity dependency. “Capillary widening” may be independent of gravity, since it was observed both under microgravity and under 1 G. Water flux densities in unsaturated porous media may have gravity dependency induced by “particle separation” only when porosity is large enough to allow particles to move.
1. Introduction
A sustainable human settlement on and around the moon will be established in 2028 [1]. Growing plants under extraterrestrial environments are essential for four reasons: producing food, recycling the atmosphere, processing wastewater, and providing a stress-relief environment for astronauts [2]. Massa et al. [3] reported that although red Romain lettuces were grown under microgravity in the International Space Station (ISS) using Veggie, a plant growth platform, lettuces suffered from water stress and died. Therefore, it may be indispensable for sustainable plant growth to understand water movement in cultivation media.
A limited number of research studies have been conducted to understand water movement in porous media under microgravity due to short-time microgravity. Heinse et al. [4] reported that water retention characteristics for the wetting condition under microgravity were similar to those under Earth-gravity (1 G). Saturated hydraulic conductivity, measured under pressurized conditions, had little gravity dependency when the media was densely packed [5]. Heinse et al. (2007) [4] concluded that the Buckingham–Darcy law and Richards’ equation were applicable for describing macroscopic porous-medium fluid behavior under microgravity. However, predicting capillary-driven flow in unsaturated porous media under microgravity was difficult. Under microgravity, the capillary-driven flow in unsaturated porous media became slow [6,7] or did not occur at all [7]. Unsaturated hydraulic conductivity was smaller under microgravity than under 1 G [8].
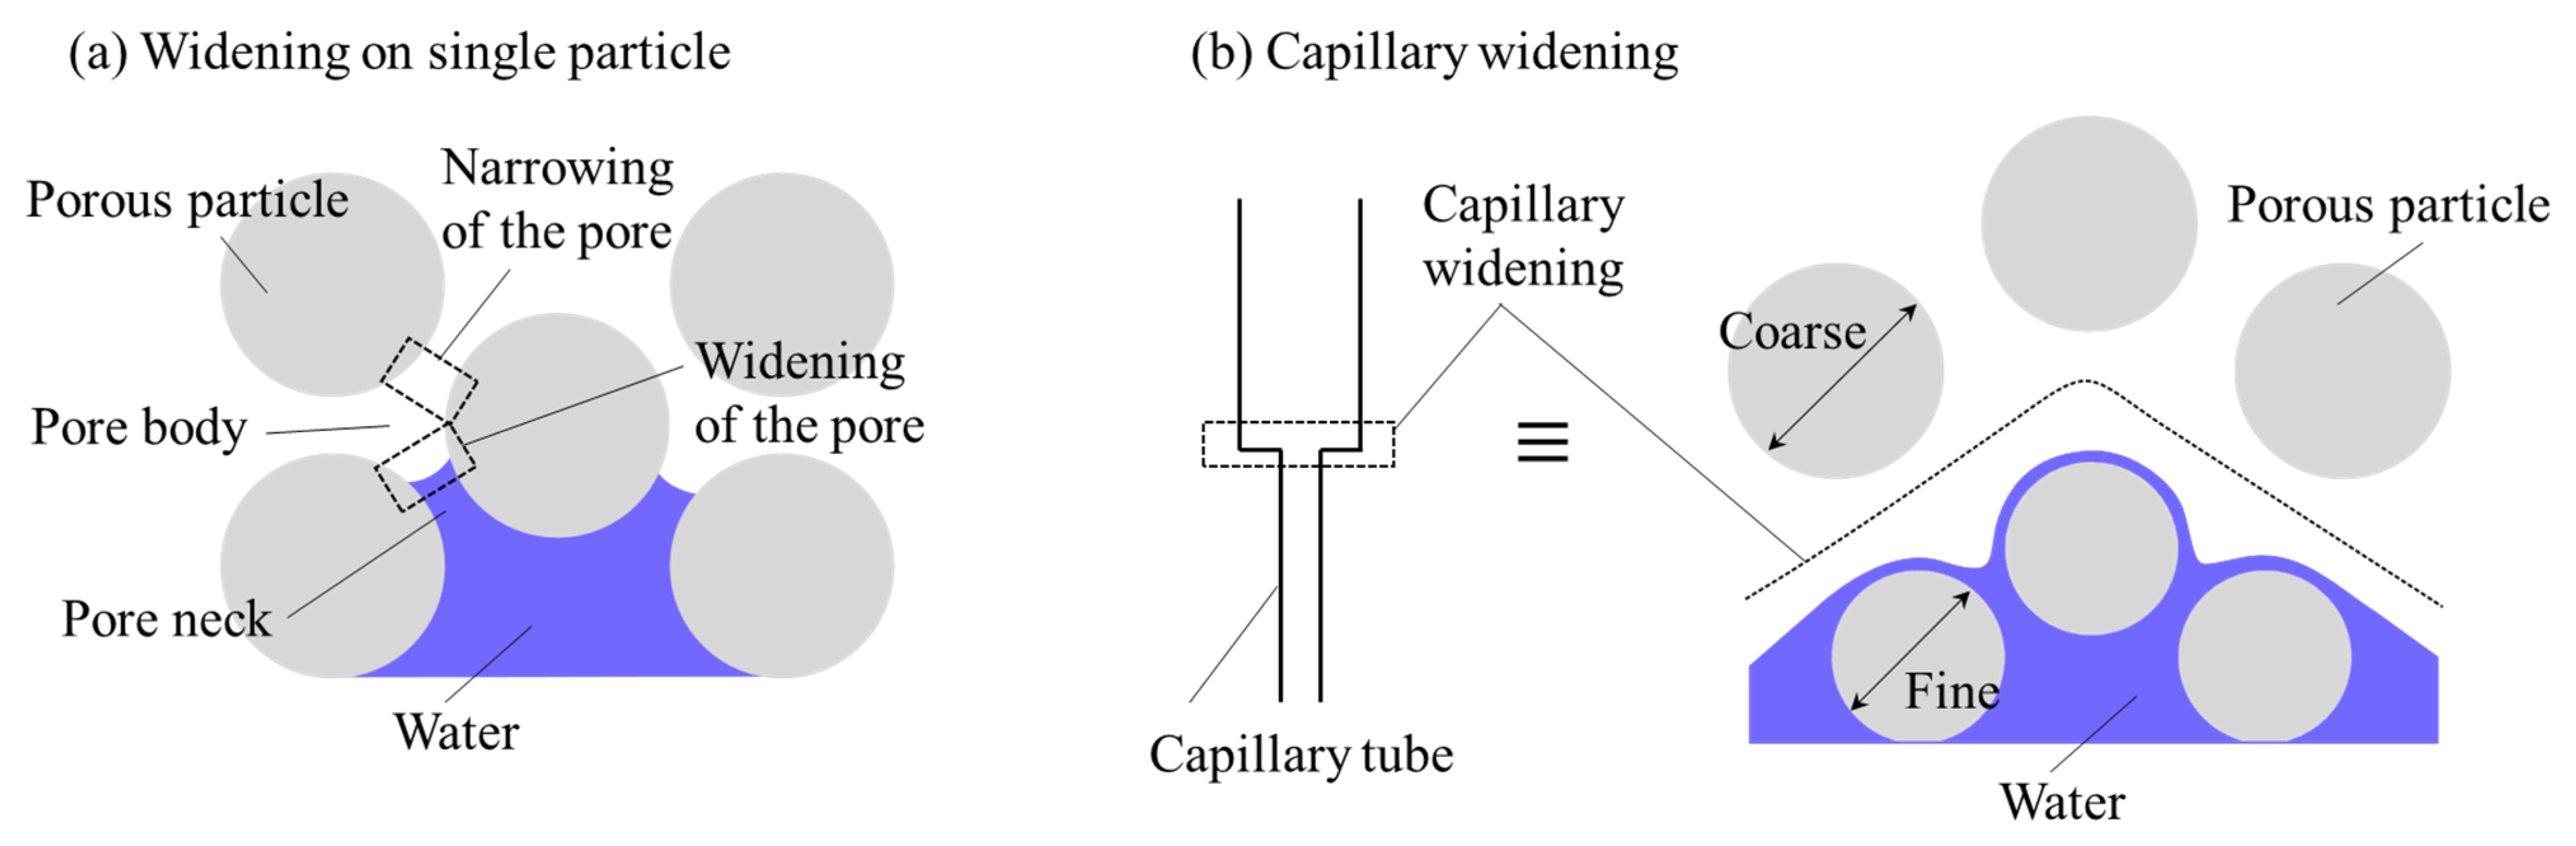
A few theories have been proposed to explain the gravity dependencies of capillary flows. For example, Jones and Or [8] hypothesized that “air entrapment” and “particle separation” contributed to smaller flux densities under microgravity than under 1 G. When the wetting front moved to the pore body from the pore neck in massive porous media [9] (Figure 1a) or glass tube [10] (Figure 1b), “interruption on widening void space” in the wetting front was observed. Or et al. [11] noted that when fine and coarse beads were packed side by side, water exclusively flowed in the fine beads. Their result suggested that the “interruption on widening void space” was observed on the boundary of the different beads’ diameters (Figure 1b). However, it is not clear whether slow water flow due to the “interruption on widening void space” is gravity-dependent or not. “Air entrapment”, “particle separation”, and “interruption on widening void space” are pore-scale phenomena; most of the previous studies under microgravity, however, focused on Darcy-scale flows. Therefore, studying pore-scale flow is essential for elucidating the gravity dependency of capillary-driven flow in unsaturated porous media.
Pore-scale flow under 1 G is generally not a Darcian flow; it is composed of numerous interfacial jumps called Haines jumps [12]. Since the flux densities of the Haines jumps are more than 50-times larger than the macroscopic mean flux densities [13,14], high-speed cameras are required to observe those flows. Few attempts have been made to develop a quantitative description of those flows even under 1 G. Moebius and Or [13] modeled pore-scale drainage dynamics in a monolayer of regularly arranged glass beads under 1 G by two hydraulically connected sinusoidal capillary tubes. The study revealed that the power balance of capillary pressure, viscous pressure, gravity, and inertia characterized the wetting front movement. Armstrong and Berg [14] observed the drainage process of water replaced by oil in an artificial micro-pattern with spherical pore bodies connected to pore necks under 1 G. The wetting events on pore necks were observed when drainage on pore bodies occurred. The authors noted that part of the drained water from the pore bodies was supplied to the pore necks, and most of the interacting menisci were more than seven pores apart from the location of the drainage event. However, most previous research focused on the drainage process; thus, pore-scale flow in the wetting process is not well understood. Furthermore, the pore-scale capillary-driven flow is not well known, since syringe pumps were used to drive flows in previous studies.
In this study, “particle separation” was reduced by dense packing. Therefore, we focused on the hypotheses of “air entrapment” and “interruption on widening void space.” Our objectives were (1) to measure the water flux densities of the pore-scale capillary-driven flow under microgravity and under 1 G and (2) to reveal what makes capillary flow slower under microgravity than 1 G.
2. Materials and Methods
2.1. Experimental Apparatus
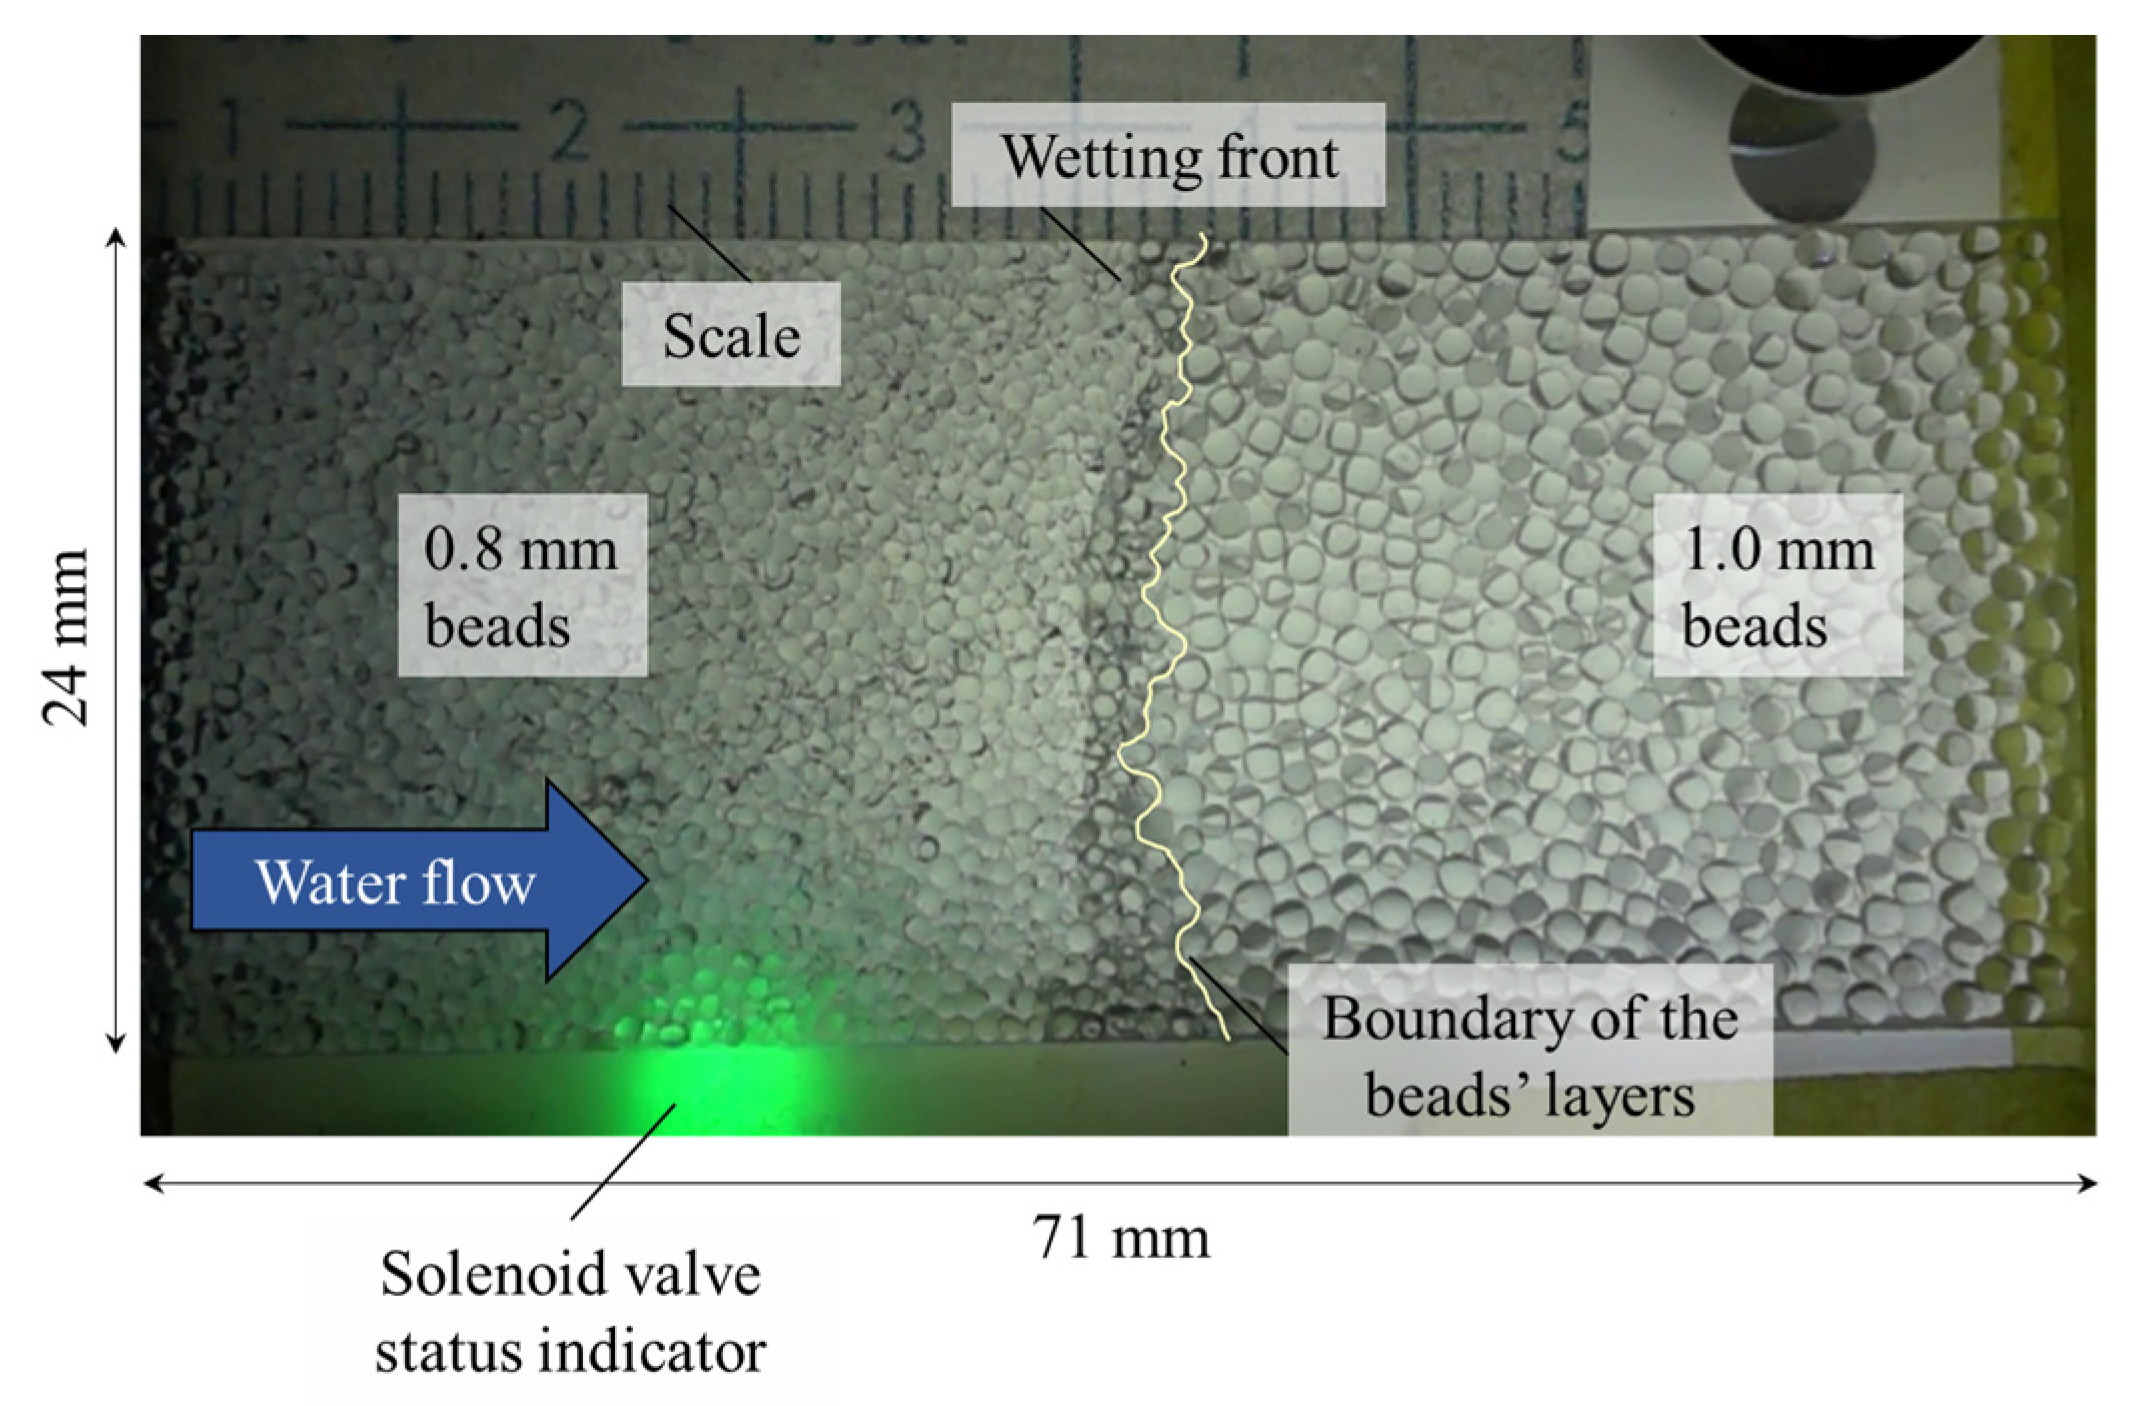
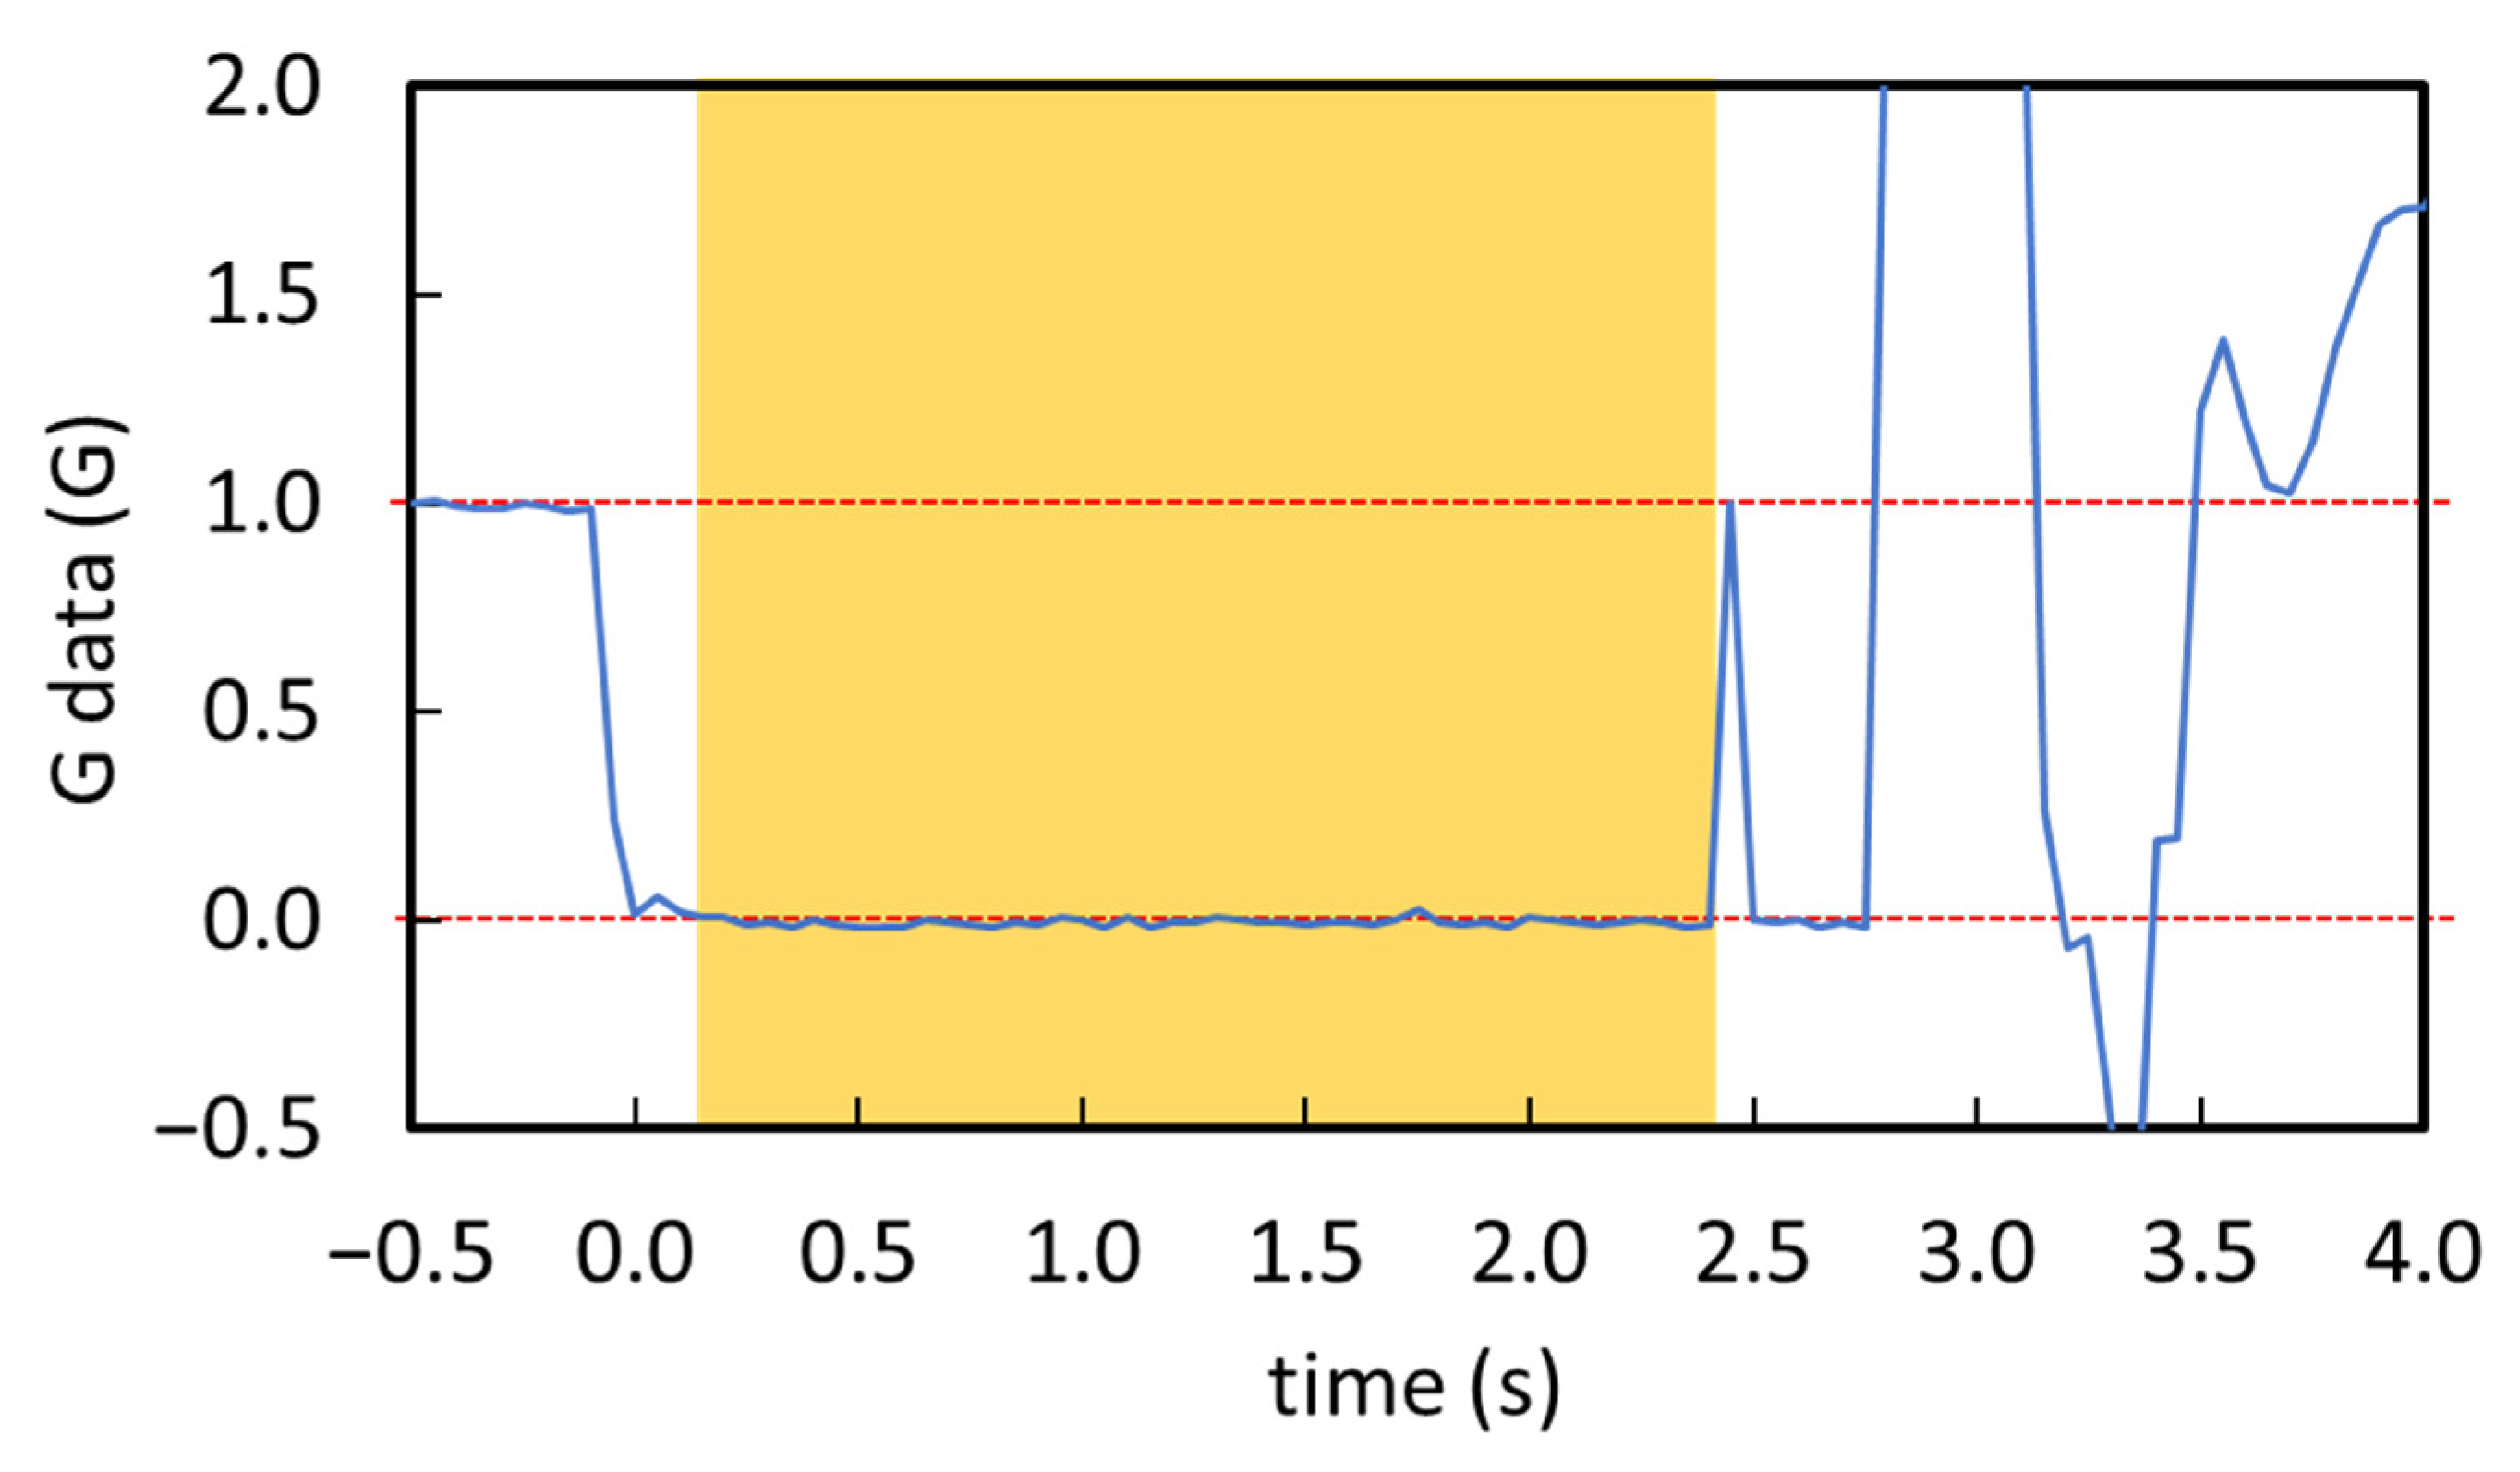
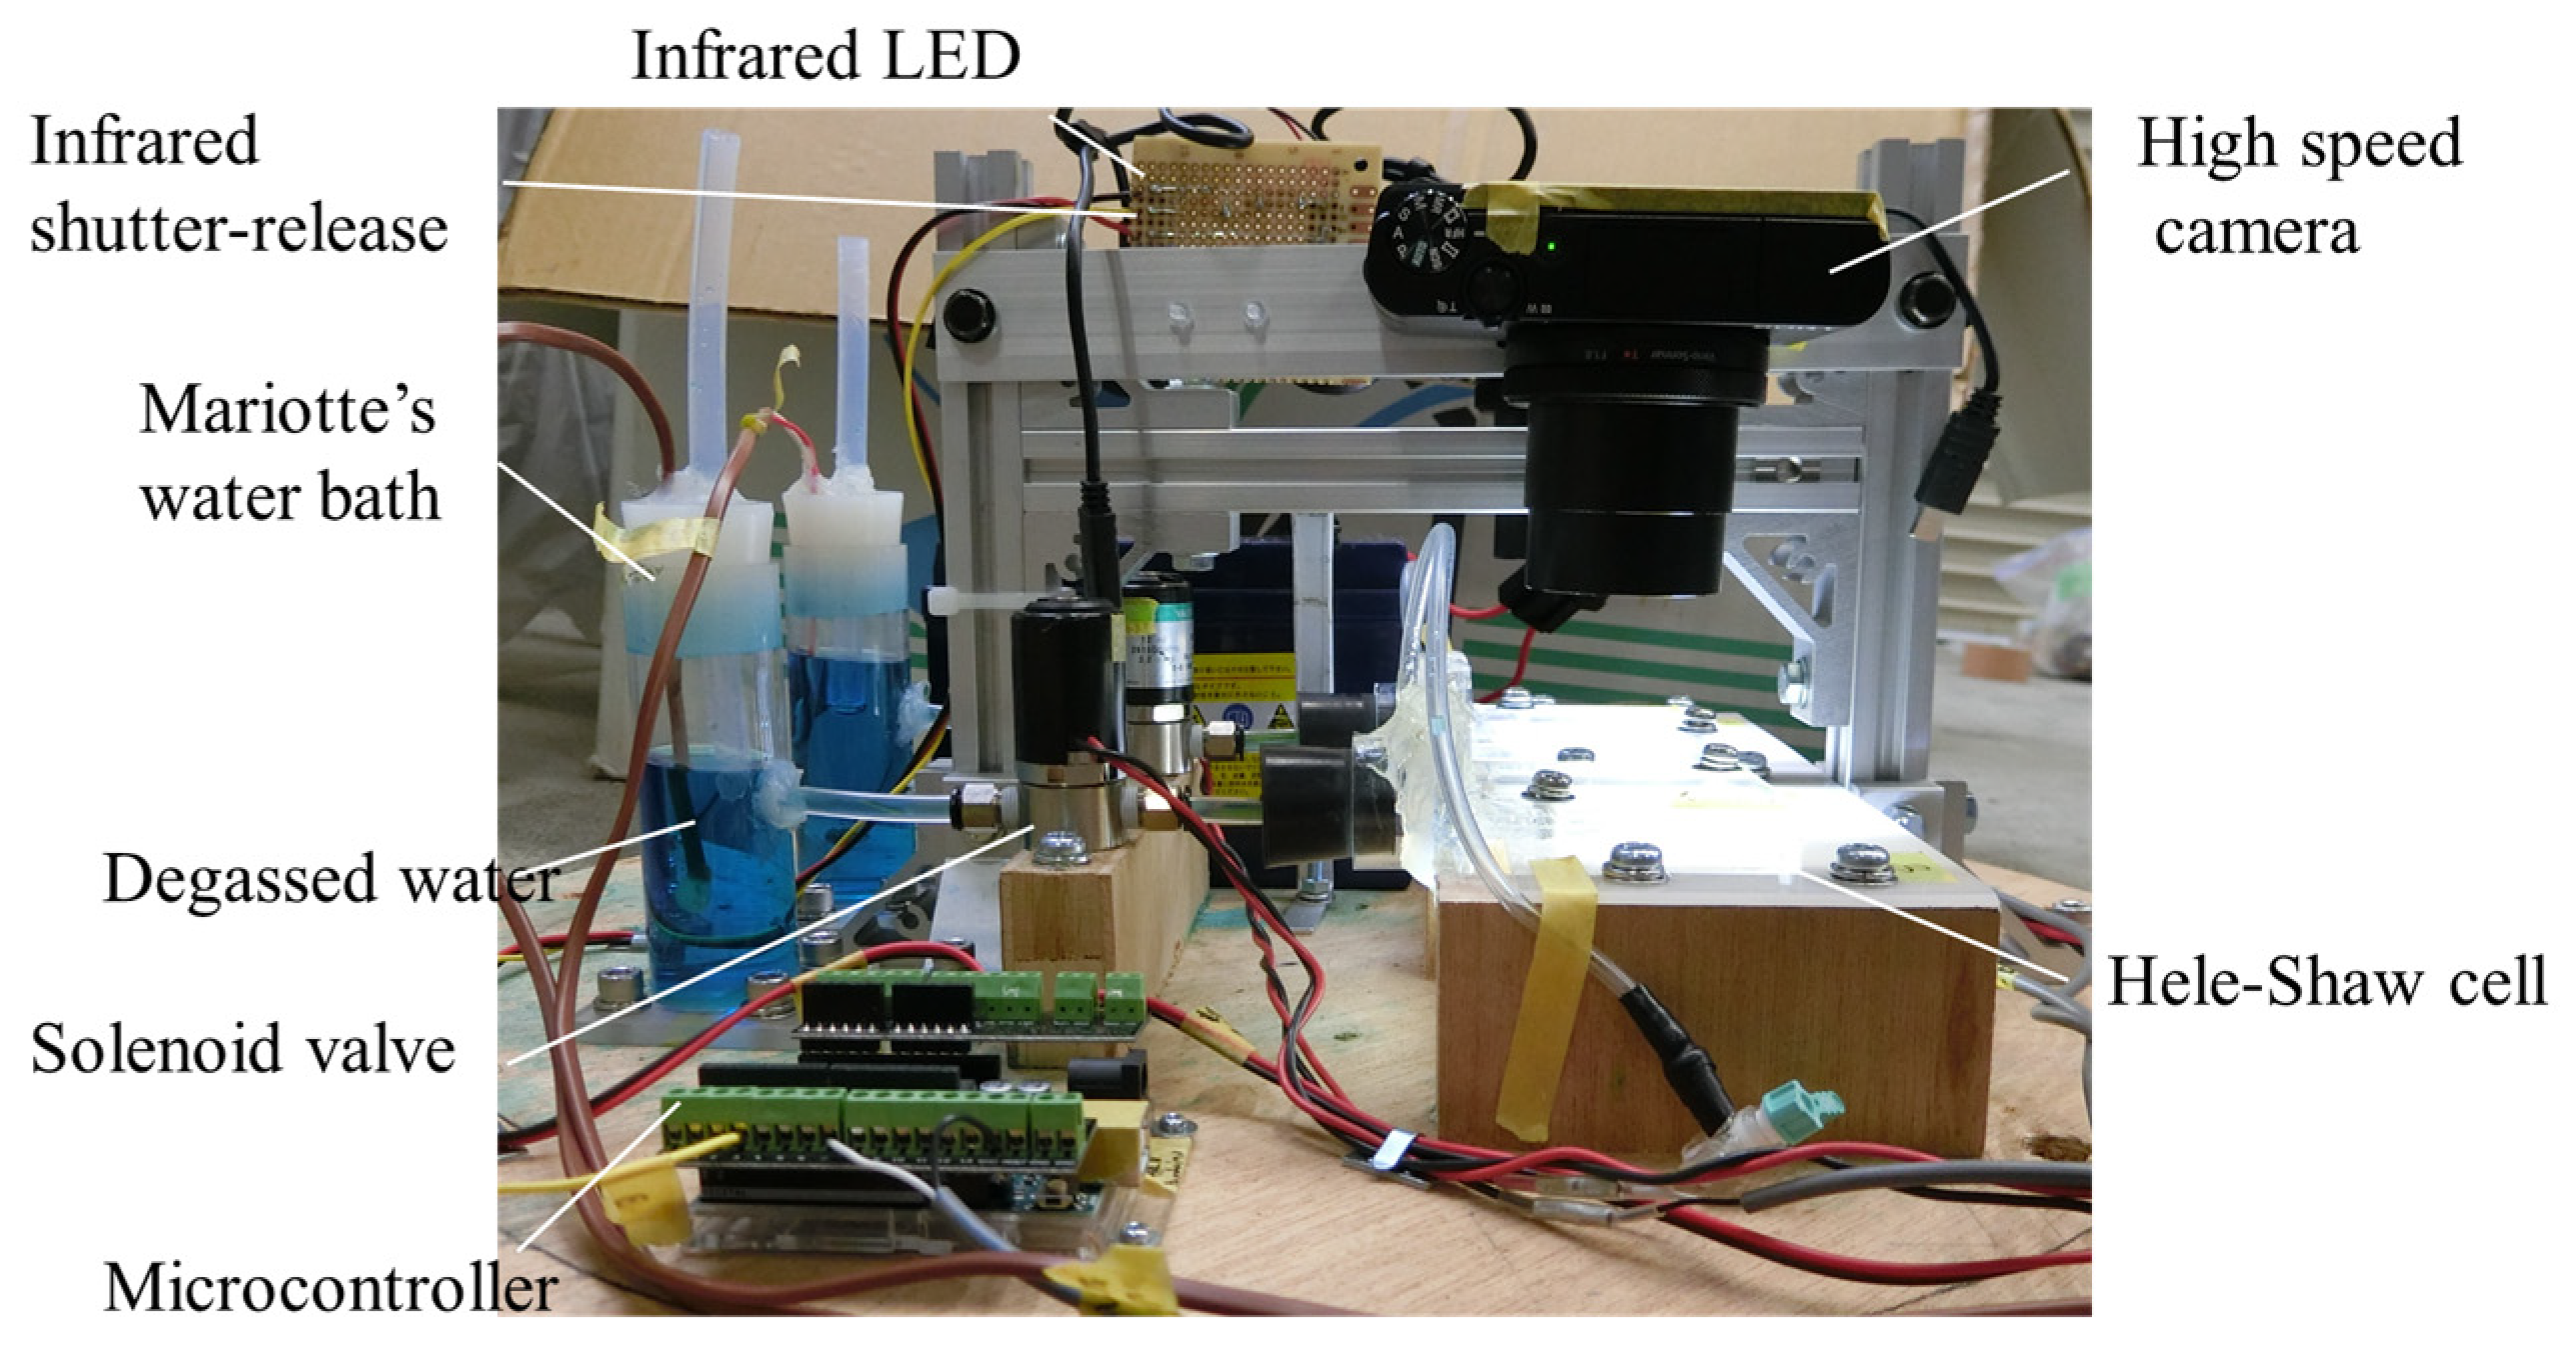
We conducted experiments for the two types of widening: the widening on a single particle and capillary widening as shown in Figure 1. To examine capillary widening, two layers of glass beads, 40 mm in thick for 0.8 mm beads (BZ-08, AS ONE, Osaka, Japan) and 31 mm thick for 1.0 mm diameter beads (BZ-1, AS ONE, Osaka, Japan), were filled in the Hele-Shaw cell made from acrylic plates (inner dimension of 24 mm × 71 mm × 2.4 mm; Figure 2). The boundary of the two layers was the location for widening capillaries (Figure 1b). The beads were packed densely by tapping every 20 mm thick layer using the head of a pestle. The average bulk density and porosity are shown in Table 1. Degassed water with a methylene blue dye in a Mariotte bottle was supplied to the cell by means of a solenoid valve. White LEDs lighted the cell from the bottom via a smoked acrylic board. Water was infiltrated in advance about 5 mm ahead of the boundary before observing the flow during capillary widening (Figure 2). Since water moved upon a single particle quickly and microscopically, infiltration was captured about every 0.001 s with a high-speed and closeup camera (DSC-RX100M5A, SONY, Tokyo, Japan). A 2.4 s microgravity condition ( G; Figure 3) was obtained by free fall from the top of a 50 m drop tower (COSMOTORRE, HASTIC, Hokkaido, Japan) from 17 to 19 October 2019. A microcontroller board (Arduino Uno, Arduino) monitored an accelerometer (MMA7361, Freescale Semiconductor, Austin, TX, USA), controlled the solenoid valve, and released the camera’s shutter (Figure 4). The valve was opened 0.2 s after the beginning of the microgravity condition to allow the infiltration of water into the glass beads (Figure 3). While the valve was open, a green LED was lit as the valve’s status indicator. The movie was recorded for about 2.2 s until the end of the microgravity condition. For reference experiments, horizontal infiltration was observed under 1 G. To compensate for the hydraulic head pressure in the cell, the lower end of the Mariotte tube was arranged at the same height as the center of the porous media. The experiments were conducted three times under microgravity and under 1 G, respectively.
2.2. Image Analysis
Infiltration movies were split into pictures and analyzed by Python 3.8 program using OpenCV library (https://opencv.org/: accessed on 9 April 2022). Pixel intensities between the first and subsequent time steps were compared to determine water flux densities at every 0.001 s. The flux densities under microgravity and under 1 G were compared using p values. p values smaller than 0.05 were considered significant. p values were calculated using the t-test analysis tool in Microsoft Excel. Wetted areas detected using the developed program agreed well with more than 90% of the actual wetted areas. Coordinates of target beads were manually provided to the program. Percentages of a wetted area to the entire area for each target bead were calculated over time. The wetting front’s mobilities under microgravity were compared to that under 1 G. Relative volumetric water contents at each distance from the boundary were evaluated.
3. Results and Discussion
The average macroscopic water flux densities were 0.46 mm/s under microgravity and 0.47 mm/s under 1 G, which were not significantly different (p = 0.30). These results support the conclusion that water flux density in unsaturated porous media does not have gravity dependency when porous media are densely packed.
Our results opposed Yendler et al. [6] and Bula et al. [7], who expressed that macroscopic water flux densities were smaller under microgravity than under 1 G. As Jones and Or [8] noted, “particle separation” likely plays an important role in determining the gravity dependency of the capillary-driven water flux density in unsaturated porous media. In other words, water flux density in unsaturated porous media possibly has gravity dependency only when the porosity is large enough to allow particles to move.
Air entrapment in the pore body was not observed in this experiment. In the small void space of porous media, water wetted the entire pore and the particle’s surface. The entrapment was also not observed in the sinusoidal glass tube, which had a larger void space than porous media [10,15]. Therefore, air entrapment probably occurs only in massive void spaces such as a large bottle [16] under microgravity.
3.1. The Wetting Front Mobility of the Widening on a Single Particle
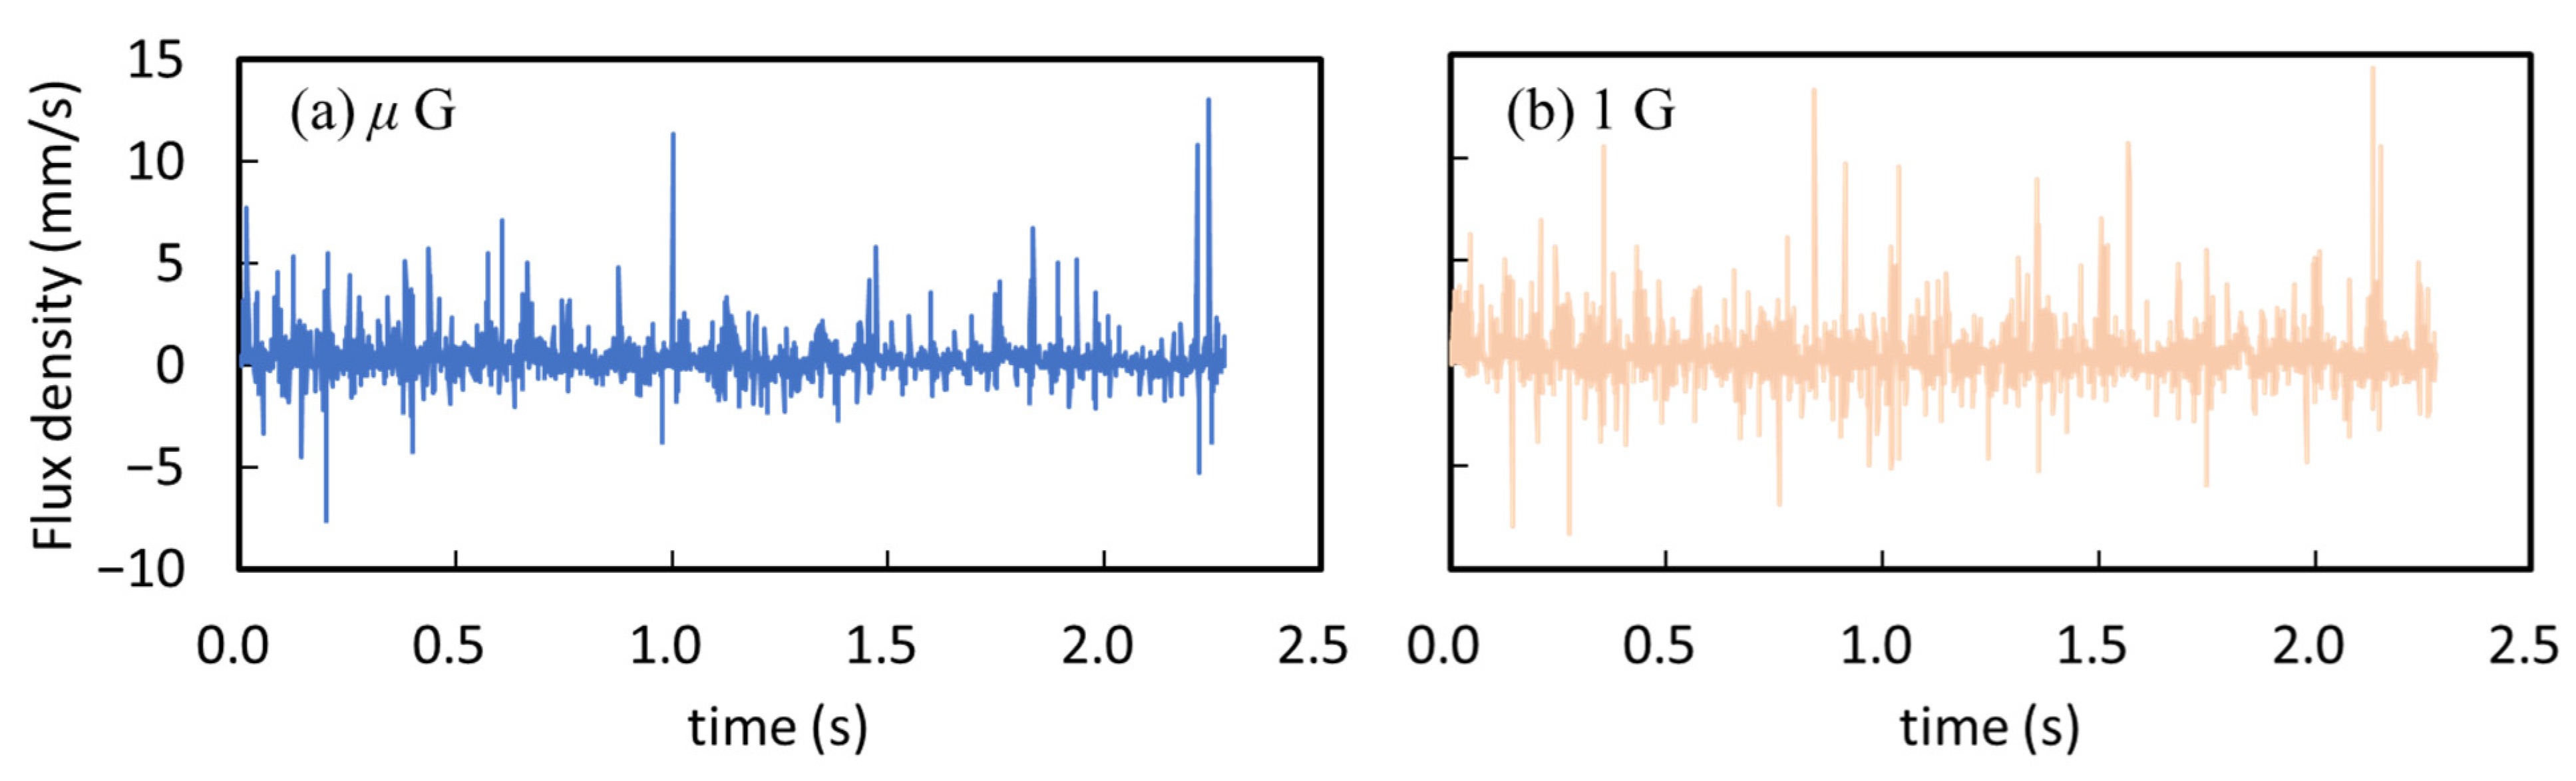
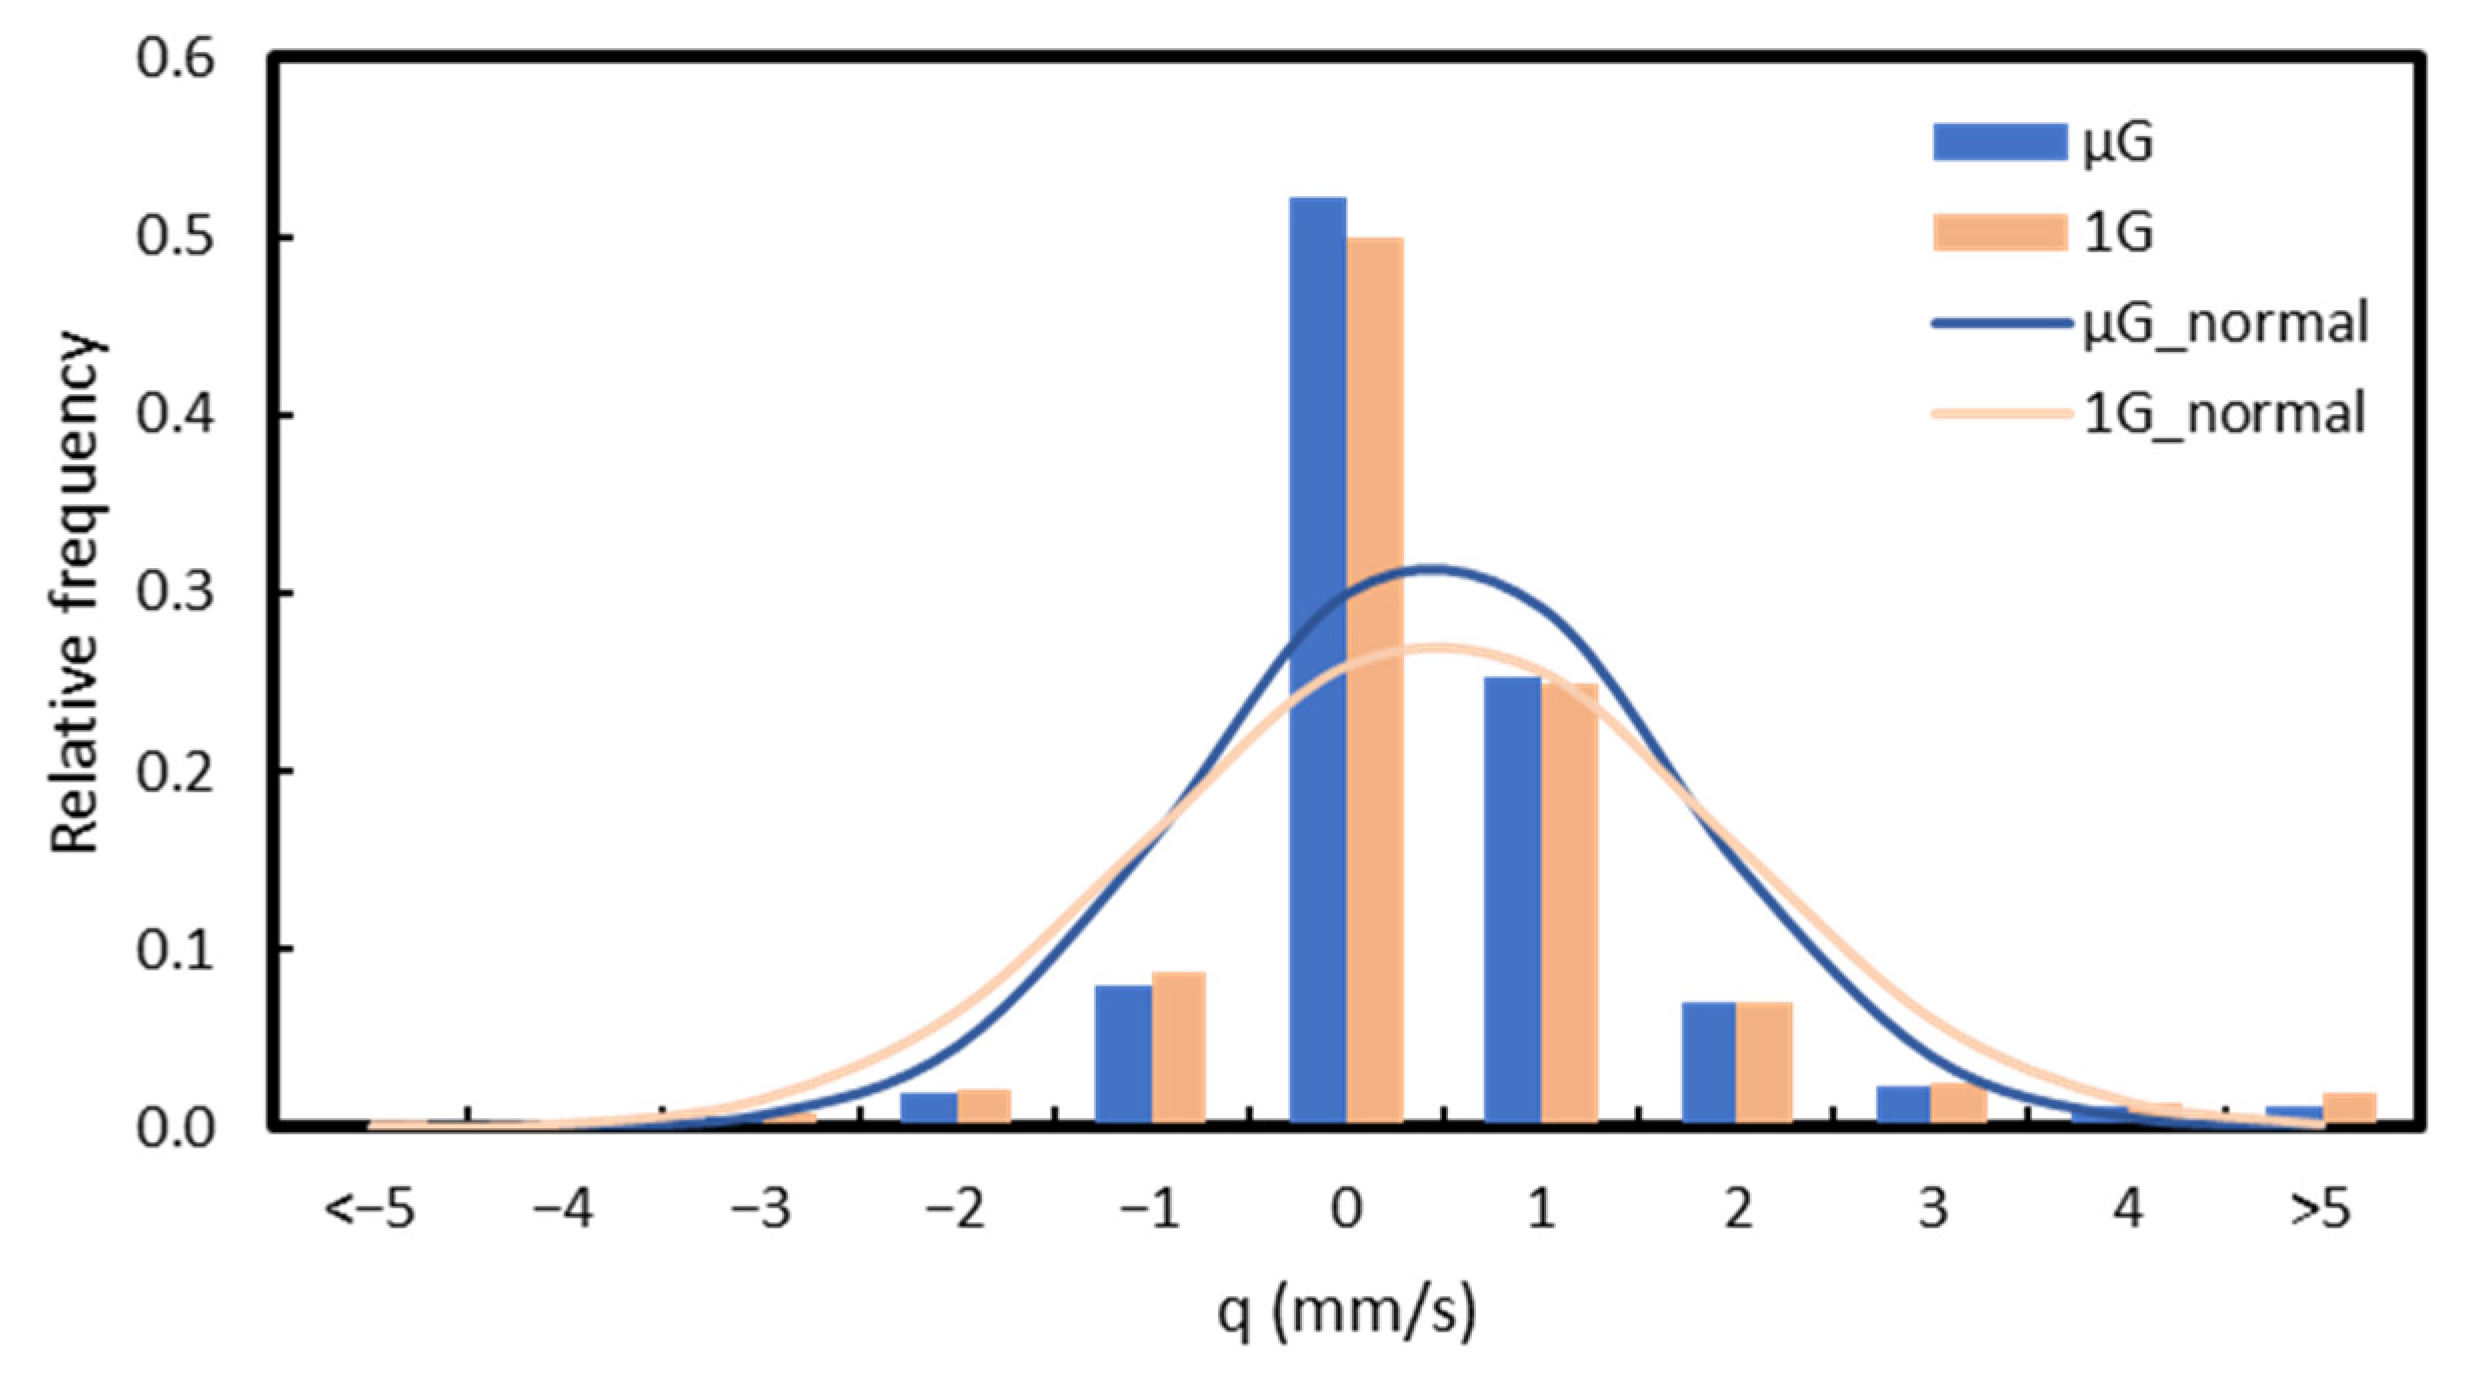
Under microgravity and under 1 G, the wetting front went over the widening of single porous particle. Figure 5 shows water flux densities at every 0.001 s in porous media under microgravity and 1 G. The maximum microscopic flux densities of capillary-driven flows were about 30-times larger than the macroscopic mean flux densities, which is smaller than the pressurized drainage process that is more than 50-times larger [13,14]. Figure 6 shows the relative frequency distribution of the water flux densities in porous media under microgravity and under 1 G. The variances under microgravity and under 1 G were 1.54 and 2.14, respectively, which were slightly larger under 1 G than under microgravity (Figure 6: normal distribution). However, no significant gravity dependency was observed (p = 0.56).
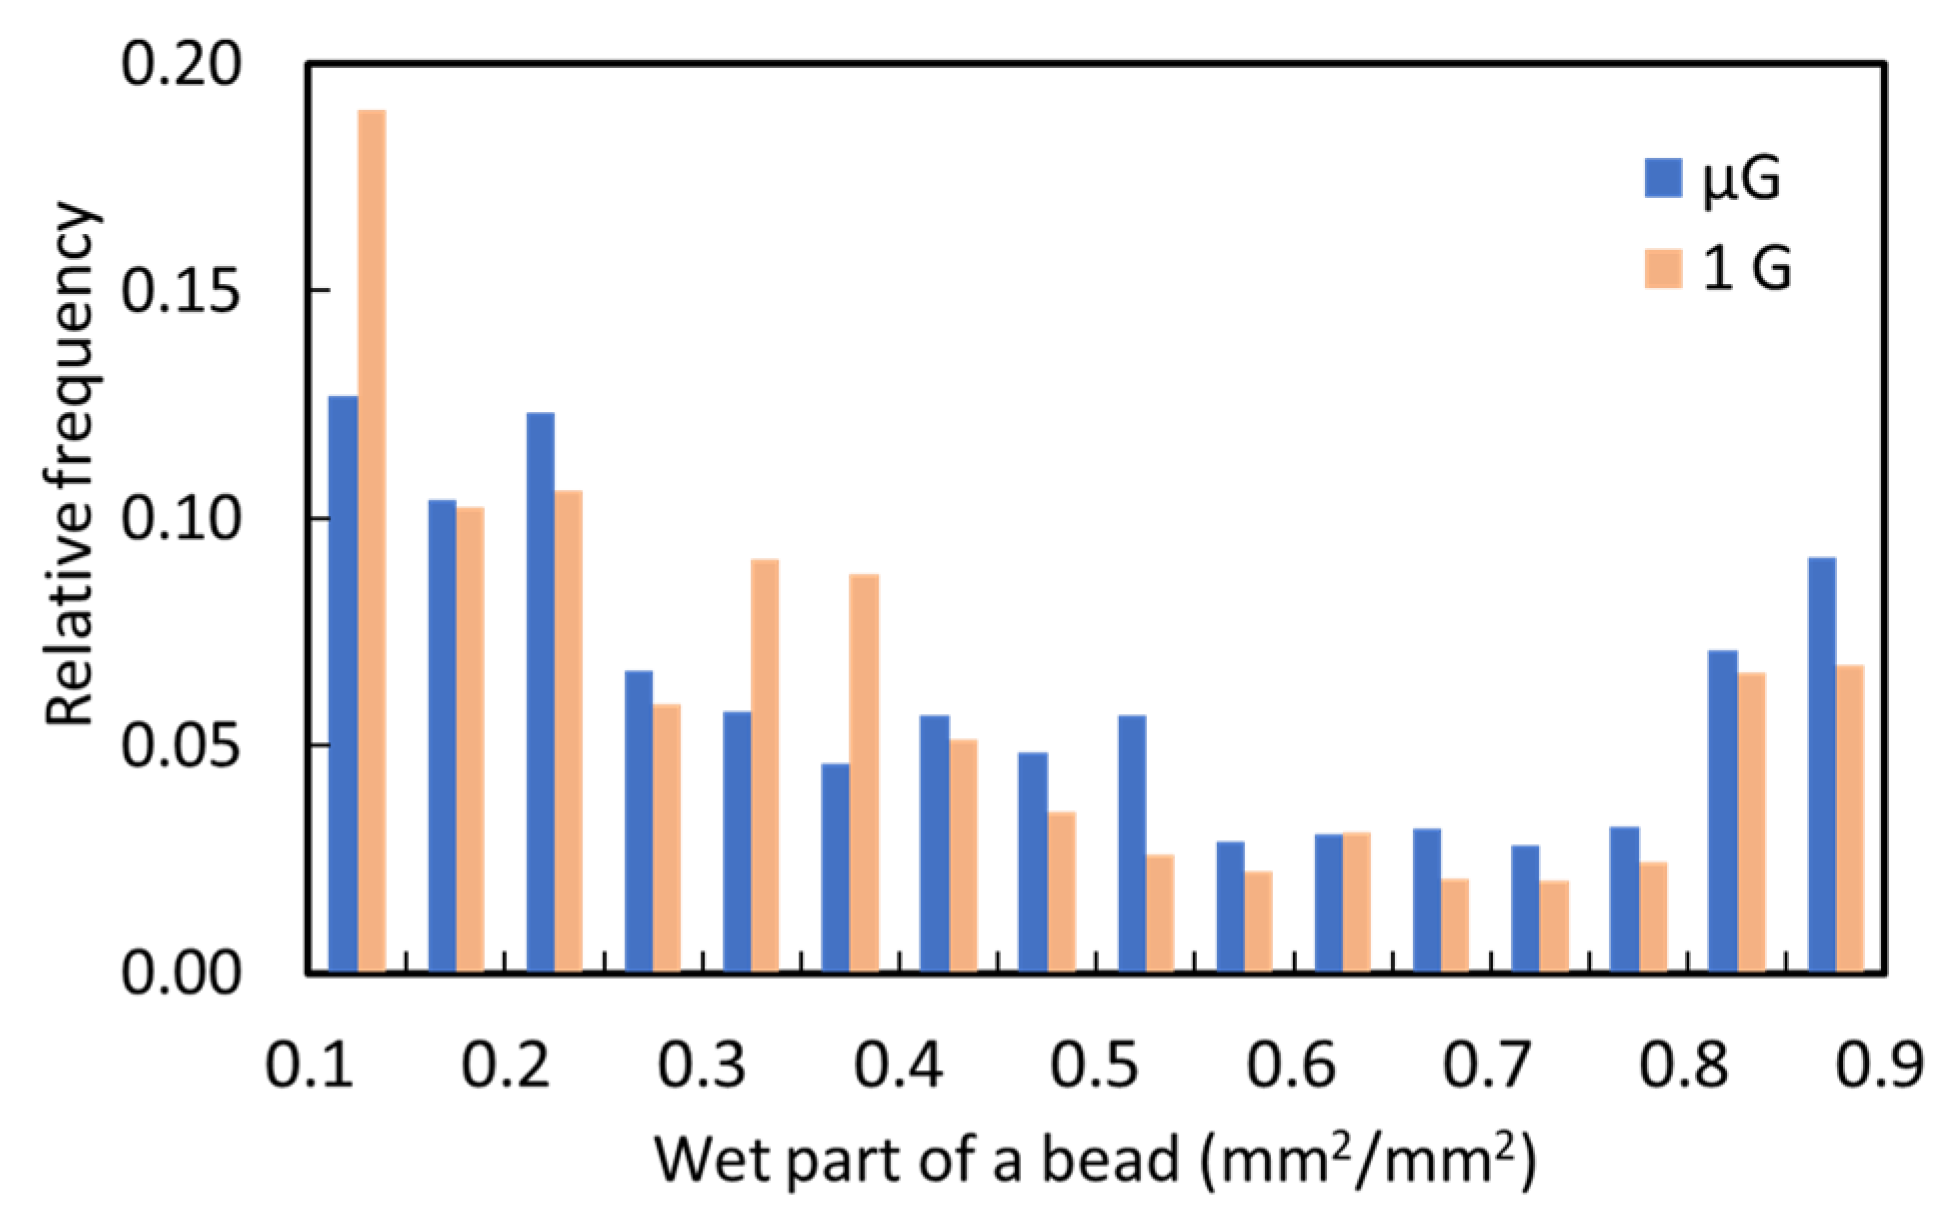
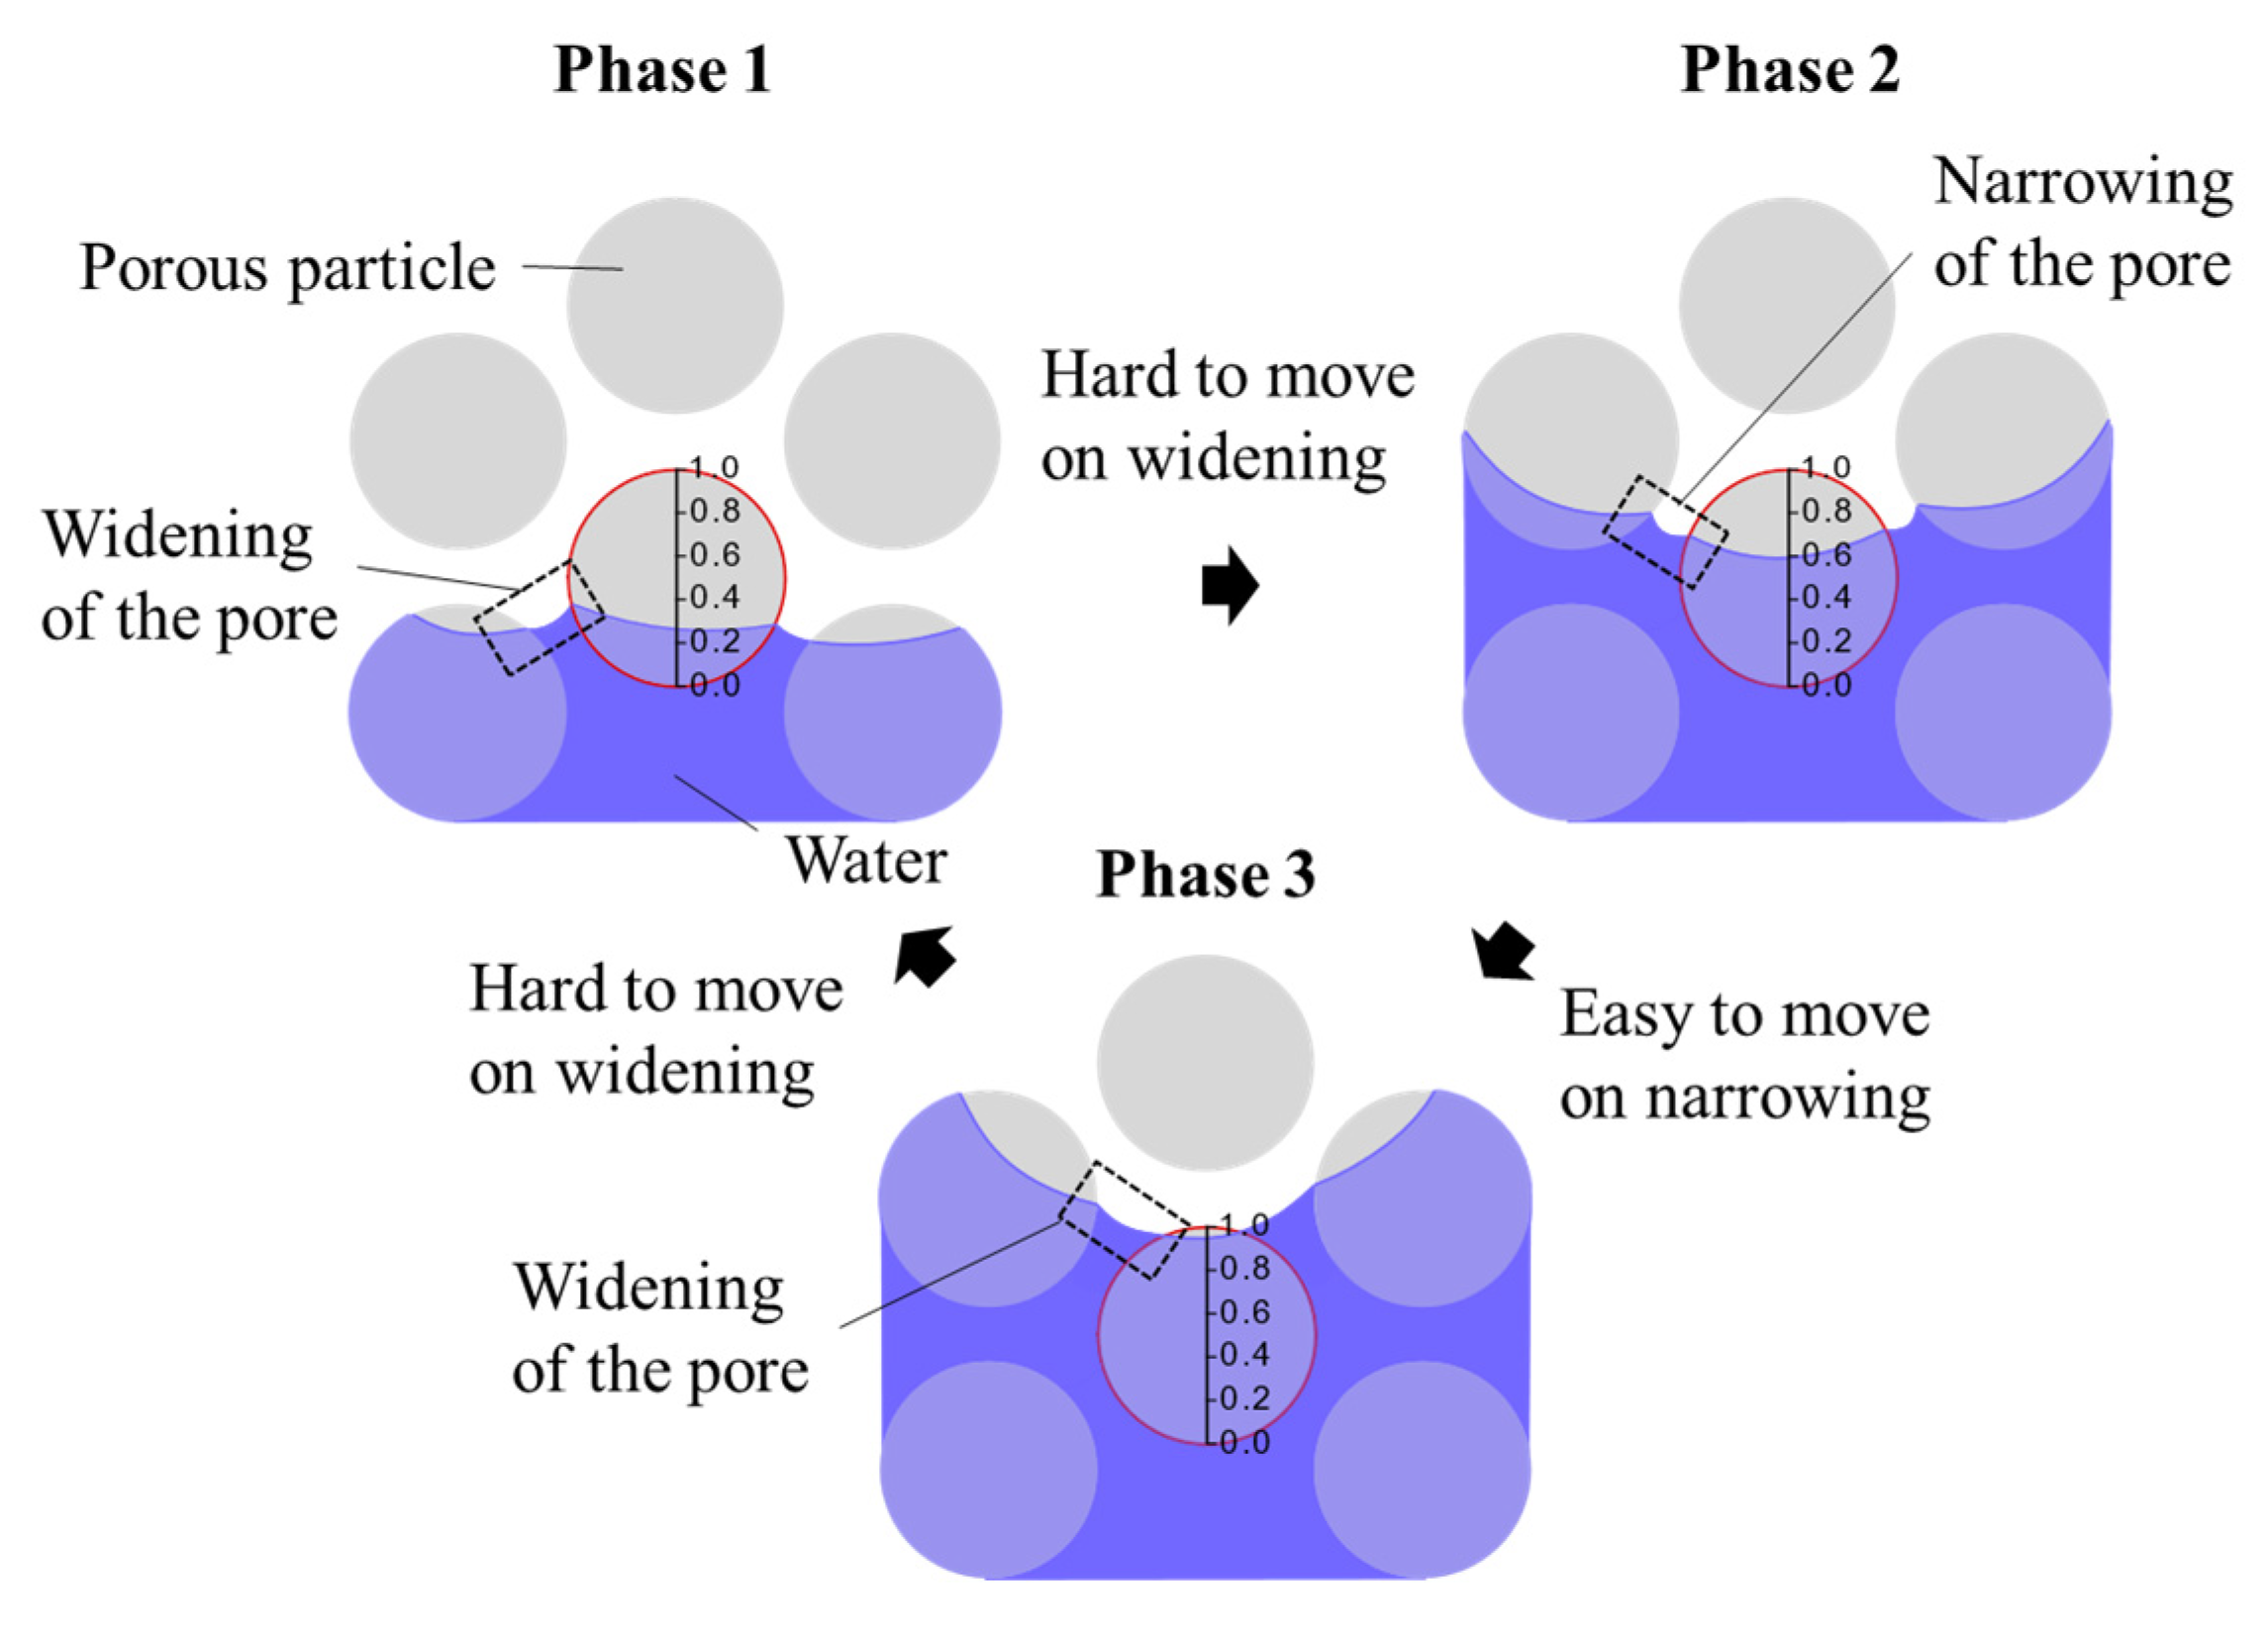
Figure 7 indicates the relative frequency distribution of the wet part on each bead. A higher frequency shows that the wetting front stopped there for a longer period of time. Under microgravity and under 1 G, the wetting front showed bimodal distributions. The wetting front often stopped when 10% to 40% or 80% to 90% of each bead was wetted. Figure 8 shows the diagram of the wetting process observed in this study. When less than 40% of the bead was wetted, the wetting front had difficulties passing over the widening pore; thus, a high relative frequency was observed (Figure 7 and Figure 8: phase 1). On the other hand, the relative frequency was low when 55% to 80% of the bead was wet since the wetting front moved easily upon the narrowing of the pore (Figure 7 and Figure 8: phase 2). When the wetting front reached phase 3 in Figure 8, the wetting front needed to touch the next bead, which allowed it to pass over the widening pore; therefore, a high relative frequency was shown at 80% to 90% of the wetted bead (Figure 7). This wetting process cycle was observed in both gravity conditions. The average wet part of a bead was mm2/mm2 under microgravity and mm2/mm2 under 1 G, which was not a significant difference. Therefore, the widening on a single particle had no significant gravity dependency.
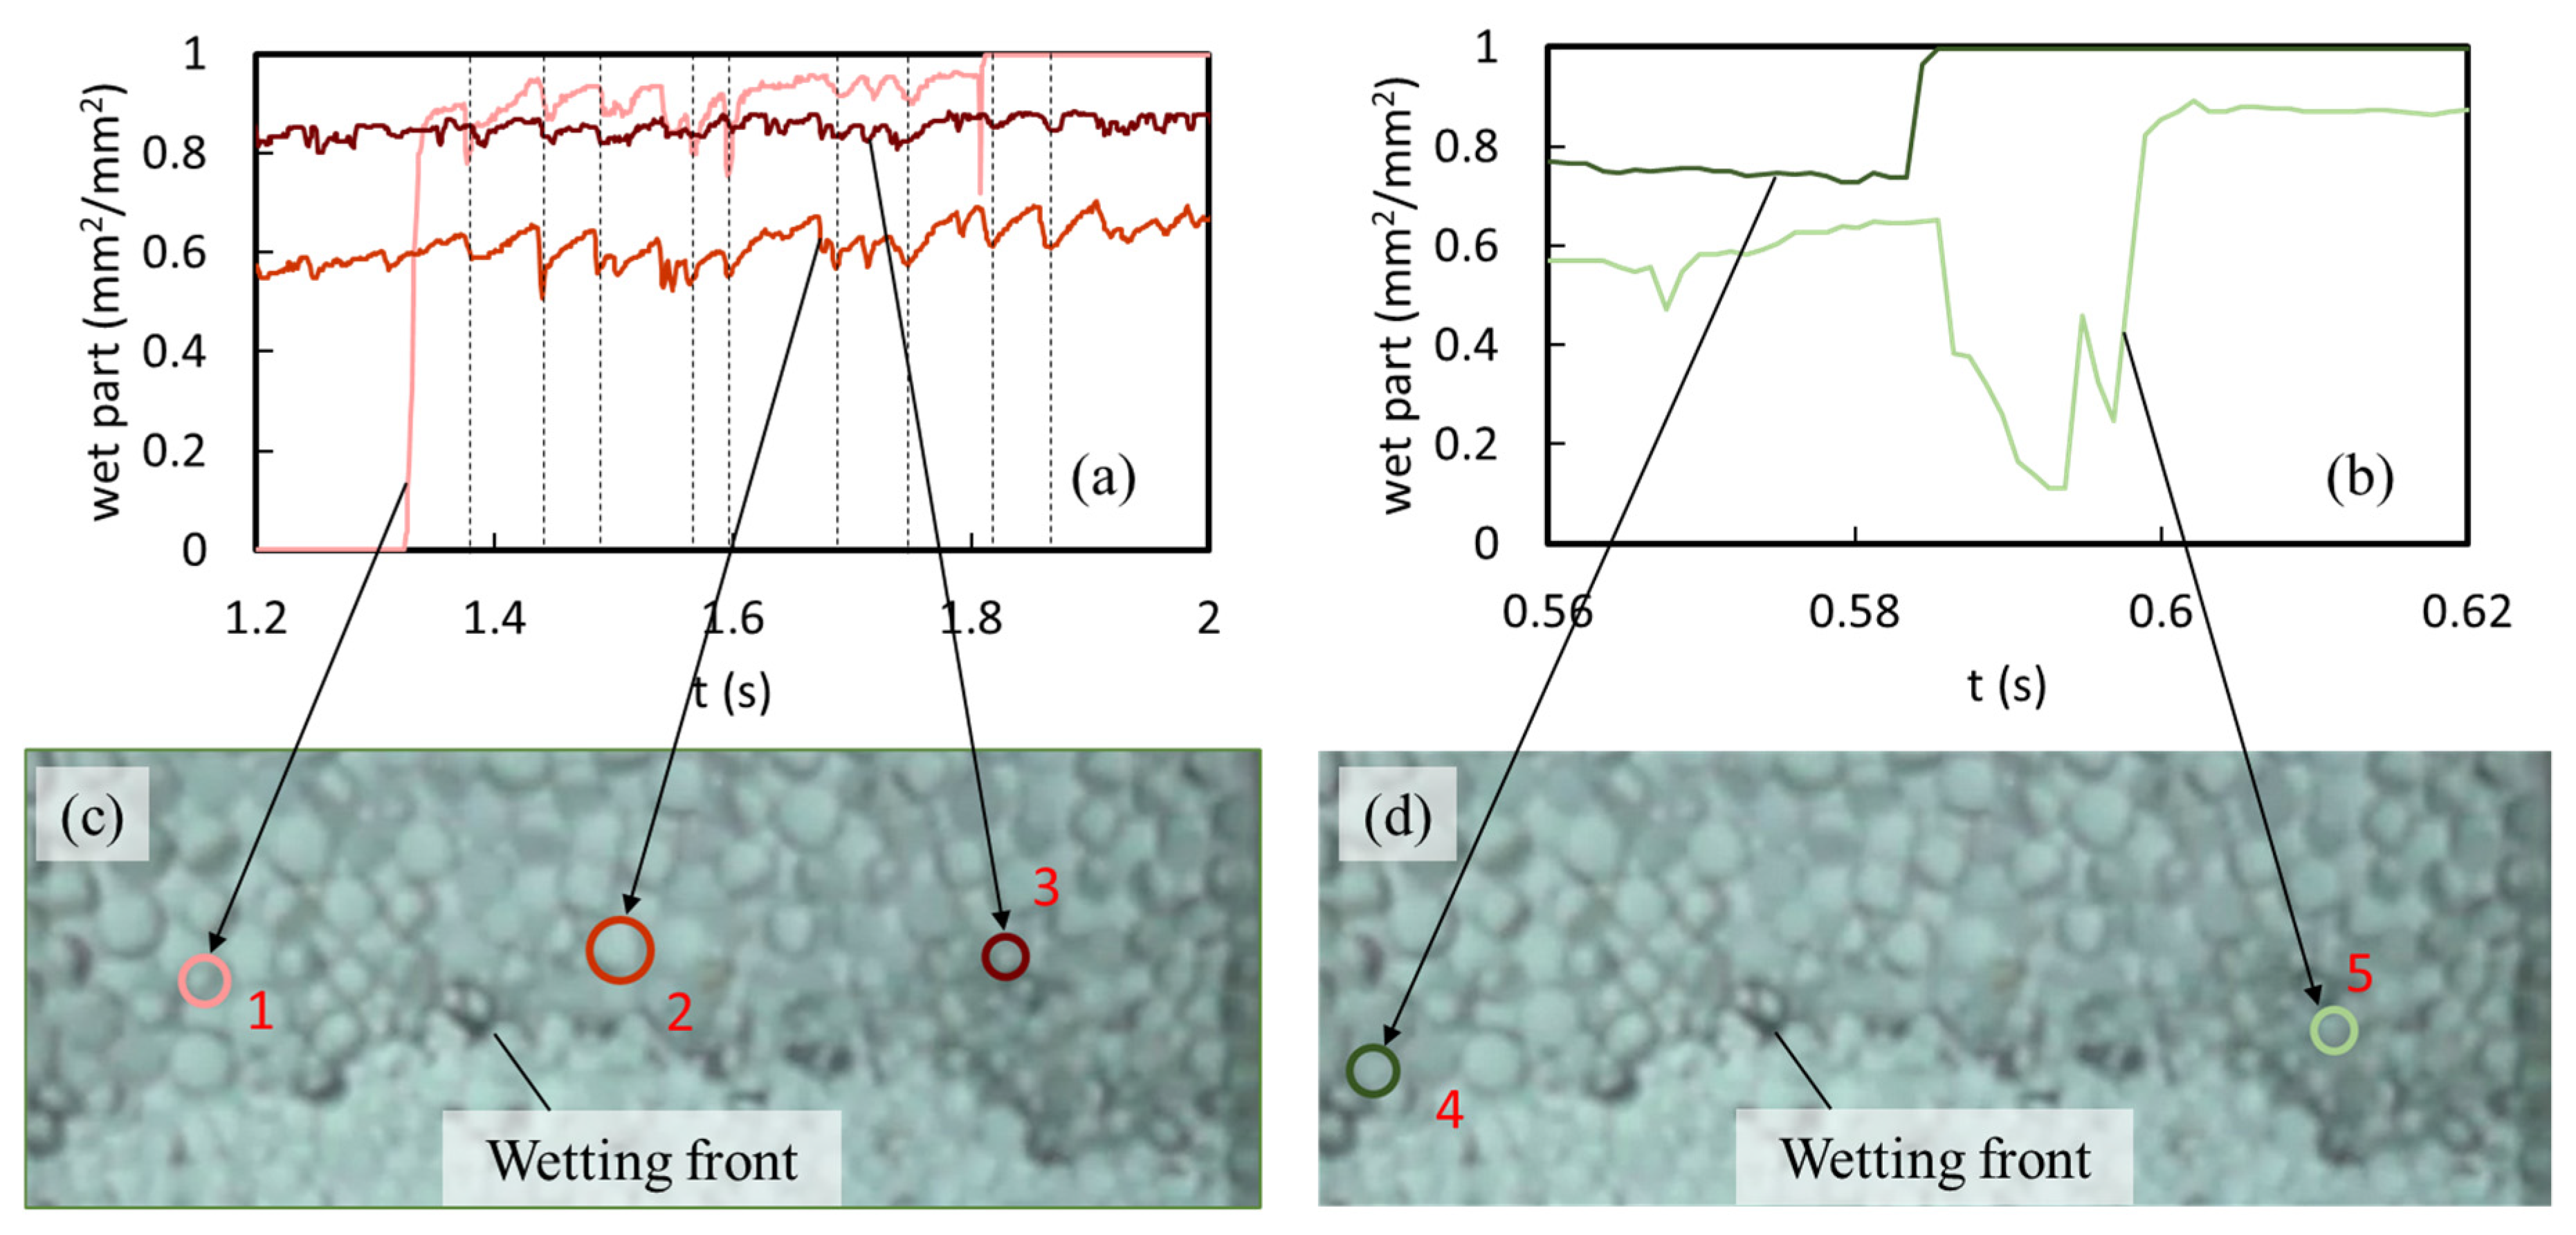
We also found the interesting dynamics of the wetting process both under microgravity and under 1 G. Figure 9a,b indicate the time series of the wet part’s percentage on the five beads shown in Figure 9c,d, respectively. The phenomena shown in Figure 9 were observed under both gravity conditions; 1 G data were shown as representative. Oscillations of the wetting front were observed on the beads and synchronized with each other (Figure 9a). We also found that the wetting front went backward when the front on another bead went forward (Figure 9b). These results suggested that water was supplied not only from the bath but also from the surrounding wetted pores. Armstrong and Berg [14] reported that water replaced oil in the pore neck and drained oil to the pore body. The hydrophilic property of water made it more stable in the pore necks than in the pore bodies. The oscillations and the backward movements of the wetting front observed in this study were probably induced by suction between the pore bodies and the surrounding pore necks, which were in a “tug-and-pull” relationship. In the definition, the backward movement implies negative flux densities. Due to the oscillations and backward movements, 20% of the flux densities took negative values (Figure 6). Armstrong and Berg [14] previously reported that the drainage event was cooperative when more than seven pores apart. However, we found that the wetting event was cooperative as far as 25 pores apart.
It was also observed that the wetting front infiltrated forward more after the front moved backward by “tug-and-pull” movements both under microgravity and 1 G (Figure 9d: bead number 5). Water re-wetted the widening of the pore when suction from the surrounding pore neck was released. Inertia force, induced by this re-wetting momentum, was possibly essential for breaking the balance of the “tug-and-pull” motion and allowed water to infiltrate into the pore body, where larger (less negative) capillary pressure acted at the pore’ neck.
3.2. The Wetting Front Mobility on the Capillary Widening
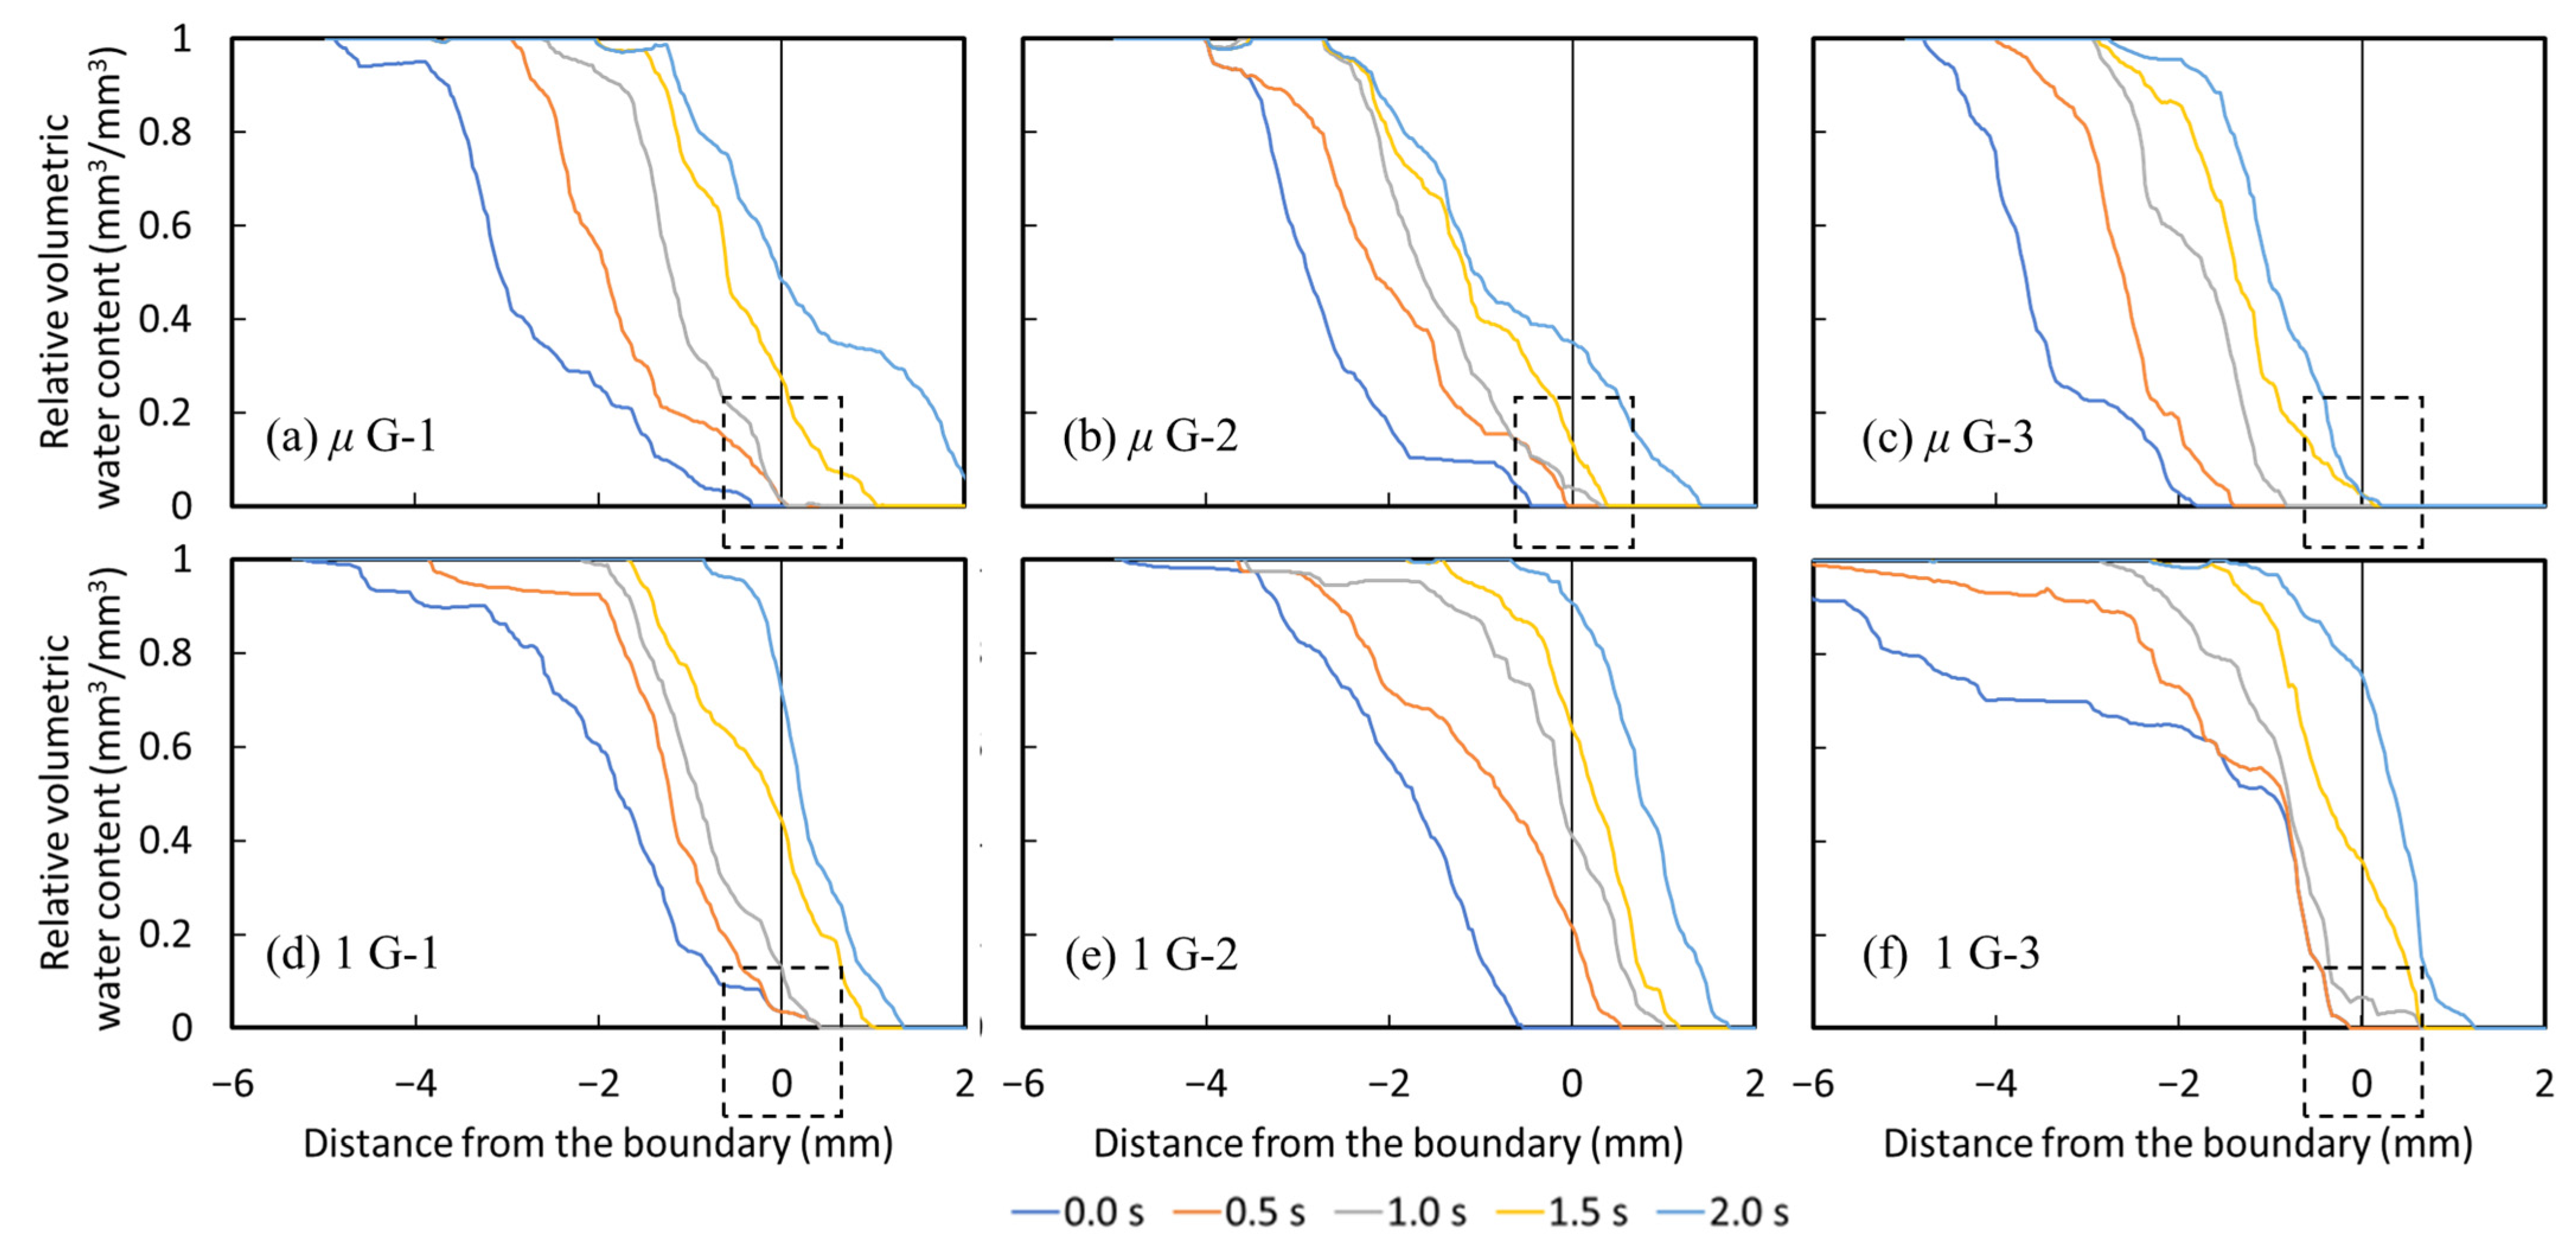
Relative volumetric water content in each 0.5 s was shown under microgravity (Figure 10a–c) and 1 G (Figure 10d–f). The wetting front crossed the boundary both under microgravity and under 1 G. However, when the most advanced wetting front approached the boundary, water content at 0 to 0.2 did not temporarily increase (0.0 to 1.0 s in Figure 10a,b,d,f; 1.5 to 2.0 s in Figure 10c), with the exception of that shown in Figure 10e for which its boundary was uneven. These results suggest that water was temporarily restricted from flowing at the boundary under microgravity and under 1 G. The wetting front crossed the boundary when the surrounding wetting front caught up. The smaller pore in the 0.8 mm beads than in the 1.0 mm beads resulted in smaller (more negative) matric potentials, and the wetting front preferentially moved into pores in the 0.8 mm beads. This temporary restriction of infiltration on the boundary was observed both under microgravity and under 1 G; therefore, water movement during capillary widening may be independent of gravity.
4. Conclusions
This study observed pore-scale and capillary-driven flows in densely packed porous media under micro- and Earth-gravities. The average macroscopic water flux densities were 0.46 mm/s under microgravity and 0.47 mm/s under 1 G, which showed no significant difference (p = 0.30). “Air entrapment” was not observed in the pore space of porous media. The pore-scale frequency distributions of the water flux densities had no significant gravity dependency (p = 0.56). The widening on a single particle disturbed capillary-driven flow; however, no significant gravity dependency was observed. Capillary widening temporarily restricted the infiltration both under microgravity and under 1 G; therefore, water movement at the widening capillary may be independent of gravity. Water flux density in unsaturated porous media may have gravity dependency by particle rearrangement when porosity is large.
The oscillations and the backward movements of the wetting front were observed by the analysis of wet parts on each porous particle. The suctions between the pore bodies and the surrounding pore necks were in a “tug-and-pull” relationship and probably induced wetting front oscillations and backward movements. The wetting event was cooperative as far as 25 pores apart. This is in contrast to the literature, which deems it as seven pores apart. Inertia force, induced by this re-wetting momentum after backward movements, was possibly important for breaking the balance of the “tug-and-pull” relationship and allowed water to infiltrate into the pore’s body from the pore’s neck.
Author Contributions
Conceptualization, Y.M., N.S. and K.N. (Kosuke Noborio); methodology, Y.M., N.S., K.N. (Kosuke Noborio) and K.N. (Kento Nogawa); software, Y.M. and S.A.; validation, Y.M., N.S. and K.N. (Kosuke Noborio); formal analysis, Y.M.; investigation, Y.M., N.S. and K.N. (Kento Nogawa); resources, Y.M., N.S. and K.N. (Kento Nogawa); data curation, Y.M., N.S. and K.N. (Kosuke Noborio); writing—original draft preparation, Y.M.; writing—review and editing, K.N. (Kosuke Noborio), N.S., S.A. and K.N. (Kento Nogawa); visualization, Y.M., N.S. and K.N. (Kento Nogawa); supervision, K.N. (Kosuke Noborio); project administration, K.N. (Kosuke Noborio); funding acquisition, Y.M. and K.N. (Kosuke Noborio). All authors have read and agreed to the published version of the manuscript.
Funding
This research was funded by JSPS KAKENHI with Grants #20J13407, #17H06251, and #20K20300, the Grant-in-Aid for Young Scientists of Meiji University, and the Research and Investigation Program of Meiji University.
Institutional Review Board Statement
Not applicable.
Informed Consent Statement
Not applicable.
Data Availability Statement
Not applicable.
Acknowledgments
We express appreciation to Uematsu Electric Co., Ltd. for the assistance with drop tower experiments.
Conflicts of Interest
The authors declare no conflict of interest. The funders had no role in the design of the study; in the collection, analyses, or interpretation of data; in the writing of the manuscript; or in the decision to publish the results.
References
- International Space Exploration Coordination Group ISECG. The Global Exploration Roadmap Supplement August 2020: Lunar Surface Exploration Scenario Update. 2020, p. 19. Available online: https://www.globalspaceexploration.org/wp-content/uploads/2020/08/GER_2020_supplement.pdf (accessed on 3 December 2021).
- Massa, G.D.; Wheeler, R.M.; Morrow, R.C.; Levine, H.G. Growth Chambers on the International Space Station for Large Plants. Acta Hortic. 2016, 1134, 215–221. [Google Scholar] [CrossRef] [Green Version]
- Massa, G.D.; Dufour, N.F.; Carver, J.A.; Hummerick, M.E.; Wheeler, R.M.; Morrow, R.C.; Smith, T.M. VEG-01: Veggie Hardware Validation Testing on the International Space Station. Open Agric. 2017, 2, 33–41. [Google Scholar] [CrossRef]
- Heinse, R.; Jones, S.B.; Steinberg, S.L.; Tuller, M.; Or, D. Measurements and Modeling of Variable Gravity Effects on Water Distribution and Flow in Unsaturated Porous Media. Vadose Zone J. 2007, 6, 713–724. [Google Scholar] [CrossRef]
- Heinse, R.; Humphries, S.D.; Mace, R.W.; Jones, S.B.; Steinberg, S.L.; Tuller, M.; Newman, R.M. Measurement of Porous Media Hydraulic Properties during Parabolic Flight Induced Microgravity. SAE Int. Pap. 2005, 2950. [Google Scholar] [CrossRef]
- Yendler, B.S.; Webbon, B.; Podolski, I.; Bula, R.J. Capillary Movement of Liquid in Granular Beds in Microgravity. Adv. Space Res. 1996, 18, 233–237. [Google Scholar] [CrossRef]
- Bula, R.J.; Duffie, N.A.; Kliss, M. Capillary Movement in Substrates in Microgravity. NASA STI Repository. 1996; pp. 1–9. Available online: https://ntrs.nasa.gov/citations/19960021026 (accessed on 6 June 2019).
- Jones, S.B.; Or, D. Microgravity Effects on Water Flow and Distribution. Water Resour. Res. 1999, 35, 929–942. [Google Scholar] [CrossRef]
- Nagura, R.; Watanabe, Y.; Sato, N.; Komiya, S.; Suzuki, S.; Katano, K.; Minami, H.; Noborio, K. Water Movement on the Convex Surfaces of Porous Media under Microgravity. Adv. Sp. Res. 2019, 63, 589–597. [Google Scholar] [CrossRef]
- Maruo, Y.; Sato, N.; Noborio, K. Capillary Rise under Microgravity in Variously-Shaped Capillary Glass Tubes. Int. J. Microgravity Sci. 2019, 36, 360206. [Google Scholar] [CrossRef]
- Or, D.; Tuller, M.; Jones, S.B. Liquid Behavior in Partially Saturated Porous Media under Variable Gravity. Soil Sci. Soc. Am. J. 2009, 73, 341–350. [Google Scholar] [CrossRef]
- Haines, W.B. Studies in the Physical Properties of Soil. V. The Hysteresis Effect in Capillary Properties, and the Modes of Moisture Distribution Associated Therewith. J. Agric. Sci. 1930, 20, 97–116. [Google Scholar] [CrossRef]
- Moebius, F.; Or, D. Interfacial Jumps and Pressure Bursts during Fluid Displacement in Interacting Irregular Capillaries. J. Colloid Interface Sci. 2012, 377, 406–415. [Google Scholar] [CrossRef] [PubMed]
- Armstrong, R.T.; Berg, S. Interfacial Velocities and Capillary Pressure Gradients during Haines Jumps. Phys. Rev. E-Stat. Nonlinear Soft Matter Phys. 2013, 88, 1–9. [Google Scholar] [CrossRef] [PubMed] [Green Version]
- Sell, P.J.; Maisch, E.; Siekmann, J. Fluid Transport in Capillary Systems under Microgravity. Acta Astronaut. 1984, 11, 577–583. [Google Scholar] [CrossRef]
- Langbein, D.; Grossbach, R.; Heide, W. Parabolic Flight Experiments on Fluid Surfaces and Wetting. Appl. Micrograv. Technol. 1990, 2, 198–211. [Google Scholar]
Figure 1.
Two types of “interruption on widening void space” under microgravity: (a) the interruption on the widening on the single porous particle [9] and (b) the interruption on the widening of capillary (Maruo et al. [10] for capillary tubes; Or et al. [11] for porous media).

Figure 2.
Two layers of the glass beads’ porous media were packed into the 2.4 mm thickness Hele-Shaw cells. The boundary of the 0.8 mm and 1.0 mm beads’ layers was the widening of the capillary model. The green LED indicated the status of the solenoid valve.
Figure 2.
Two layers of the glass beads’ porous media were packed into the 2.4 mm thickness Hele-Shaw cells. The boundary of the 0.8 mm and 1.0 mm beads’ layers was the widening of the capillary model. The green LED indicated the status of the solenoid valve.

Figure 3.
Typical gravity observed from the free fall from the drop tower. The shaded area represents the analyzed period in which the solenoid valve was opened to let water infiltrate into the glass beads.
Figure 3.
Typical gravity observed from the free fall from the drop tower. The shaded area represents the analyzed period in which the solenoid valve was opened to let water infiltrate into the glass beads.

Figure 4.
Experiment apparatus.

Figure 5.
Water flux densities at every 0.001 s in porous media under (a) microgravity and (b) 1 G.

Figure 6.
The relative frequency distribution of the water flux densities in porous media under microgravity and 1 G. The bar and lined graph indicated the measured and normal frequency distribution, respectively.
Figure 6.
The relative frequency distribution of the water flux densities in porous media under microgravity and 1 G. The bar and lined graph indicated the measured and normal frequency distribution, respectively.

Figure 7.
The relative frequency distribution of the wet part on each bead at every 0.001 s. The higher frequency implies the wetting front stopped there longer. Bimodal distributions were observed both under microgravity and under 1 G.
Figure 7.
The relative frequency distribution of the wet part on each bead at every 0.001 s. The higher frequency implies the wetting front stopped there longer. Bimodal distributions were observed both under microgravity and under 1 G.

Figure 8.
Diagram of the wetting process observed in this study. The scales indicate the wet part of the central beads. A high relative frequency of the wet part was observed in phases 1 and 3, which indicates that the wetting front had difficulties passing over the widening parts.
Figure 8.
Diagram of the wetting process observed in this study. The scales indicate the wet part of the central beads. A high relative frequency of the wet part was observed in phases 1 and 3, which indicates that the wetting front had difficulties passing over the widening parts.

Figure 9.
The time series and the percentage of the wet part of each bead. (a,c) indicated that the oscillations of the wetting front synchronized with each other. The dashed line expresses the time when backward infiltration was observed. (b,d) indicated that the wetting front on bead number 5 went backward when the wetting front on bead number 4 went forward. The wetting front on bead number 5 infiltrated forward more after the front moved backward, which suggested that inertia forces played an important role in the wetting process.

Figure 10.
Relative volumetric water content observed under (a–c) microgravity and under (d–f) 1 G. The wetting front passed over the boundary both under microgravity and under 1 G.
Figure 10.
Relative volumetric water content observed under (a–c) microgravity and under (d–f) 1 G. The wetting front passed over the boundary both under microgravity and under 1 G.


Table 1.
Average bulk density and porosity of 0.8 mm and 1.0 mm beads layers.
| Bead’s Diameter (mm) | Bulk Density (Mg/m3) | Porosity |
|---|---|---|
| 0.8 | 1.48 | 0.41 |
| 1.0 | 1.19 | 0.52 |
Publisher’s Note: MDPI stays neutral with regard to jurisdictional claims in published maps and institutional affiliations. |
© 2022 by the authors. Licensee MDPI, Basel, Switzerland. This article is an open access article distributed under the terms and conditions of the Creative Commons Attribution (CC BY) license (https://creativecommons.org/licenses/by/4.0/).
Share and Cite
MDPI and ACS Style
Maruo, Y.; Sato, N.; Nogawa, K.; Aoki, S.; Noborio, K. Pore-Scale Wetting Process of Capillary-Driven Flow in Unsaturated Porous Media under Micro- and Earth-Gravities. Water 2022, 14, 1995. https://doi.org/10.3390/w14131995
AMA Style
Maruo Y, Sato N, Nogawa K, Aoki S, Noborio K. Pore-Scale Wetting Process of Capillary-Driven Flow in Unsaturated Porous Media under Micro- and Earth-Gravities. Water. 2022; 14(13):1995. https://doi.org/10.3390/w14131995
Chicago/Turabian StyleMaruo, Yuichi, Naoto Sato, Kento Nogawa, Shinsuke Aoki, and Kosuke Noborio. 2022. "Pore-Scale Wetting Process of Capillary-Driven Flow in Unsaturated Porous Media under Micro- and Earth-Gravities" Water 14, no. 13: 1995. https://doi.org/10.3390/w14131995
Note that from the first issue of 2016, this journal uses article numbers instead of page numbers. See further details here.