
Spatial and Seasonal Drinking Water Quality Assessment in a Sub-Saharan Country (Guinea-Bissau)


1
Laboratory of Hydrobiology and Ecology, Instituto de Ciências Biomédicas Abel Salazar (ICBAS—UP), University of Porto, Rua Jorge Viterbo Ferreira 228, 4050-313 Porto, Portugal
2
Interdisciplinary Centre of Marine and Environmental Research (CIIMAR—UP), University of Porto, Novo Edifício do Terminal de Cruzeiros do Porto de Leixões, Avenida General Norton de Matos, S/N, 4450-208 Matosinhos, Portugal
*
Author to whom correspondence should be addressed.
Water 2022, 14(13), 1987; https://doi.org/10.3390/w14131987
Submission received: 23 May 2022
/
Revised: 16 June 2022
/
Accepted: 20 June 2022
/
Published: 21 June 2022
(This article belongs to the Special Issue Groundwater Quality and Public Health)
Abstract
:The United Nations Sustainable Development Goal target 6.1 calls for universal and equitable access to safe and affordable drinking water. Worldwide, about 2.2 billion people live without access to safe water, and millions of people suffer from waterborne pathogens each year, representing the most pressing situation in developing countries. The aim of this study was to investigate the drinking water quality dynamics across an endemic cholera sub-Saharan country (Guinea-Bissau), and understand its implications for public health. Microbiological and physical–chemical quality parameters of 252 major water sources spread all over the country were seasonally surveyed. These comprised hand-dug shallow wells and boreholes, fitted with a bucket or a pump to retrieve water. The results showed that the majority of water sources available to the population were grossly polluted with faecal material (80%), being unsuitable for consumption, with significantly (p < 0.05) higher levels during the wet season. Hand-dug wells revealed the highest contamination levels. The chemical contamination was less relevant, although 83% of the water sources were acidic (pH < 6.5). This study highlights the potential health risk associated with the lack of potable drinking water, reinforcing the evidence for water monitoring, and the need to improve WASH (water, sanitation, and hygiene) infrastructure and water management in West African countries. In addition, the authors suggest easy-to-implement interventions that can have a dramatic impact in the water quality, assisting to reduce the associated waterborne diseases rise.
1. Introduction
Water is essential for human life, and the access to safe and sufficient water and sanitation are recognized as basic human rights [1]. Moreover, the United Nations Sustainable Development Goal (SDG) target 6.1 calls for universal and equitable access to safe and affordable drinking water [2]. However, about 2.2 billion people still live without access to safe water, the majority of which are in low- and middle-income countries [3], mainly in sub-Saharan Africa and Asia. In sub-Saharan Africa countries, about 319 million people live without access to improved reliable drinking water sources, and 695 million lack improved sanitation facilities [4].
Each year, 829,000 deaths are attributed to diarrhoeal diseases linked to inadequate WASH, including 297,000 in children under five [3]. Over the coming decades, with a growth rate of about 2.5%, the sub-Saharan region will account for most of the global population growth [5]. This near-future scenario, with densely populated urban and peri-urban areas, entails an increment in water demand and sanitation, pressuring the already compromised WASH infrastructure. The sub-Saharan country of Guinea-Bissau is one of the poorest countries in the world, ranked 175 out of 189 countries on the Human Development Index in 2019. Presently, with a total population of 1,920,922 inhabitants, the life expectancy at birth in Guinea-Bissau is 57 and 62 years for males and females, respectively. Moreover, the under-five mortality rate is 78.47 [6]. According to the WHO [7], in Guinea-Bissau, each person has only 21 L of water for daily personal needs. This value is well under the 50 L minimum known water requirement for human domestic use [8]. The latest data (2016 and 2017) reported that “improved” water sources (not necessarily meaning potable water, but rather a refurbished facility) were accessible to 73% of the population, whereas only 20.5% of the population has access to proper sanitation [9]. The health system is fragile and not universally available, with a very high health burden from malaria, diarrhoea and respiratory diseases, HIV, and malnutrition. Indeed, diarrhoeal diseases are the third leading cause of death, with 702,974 cases reported in Guinea-Bissau in 2019 [10]. Cholera is endemic in the country, being responsible for 71,307 cases and 1638 deaths between 1996 and 2017 [11].
Although a few studies concerning water quality in Guinea-Bissau are available [12,13,14], these were carried out in limited geographic areas. To the best of our knowledge, no study with broad range has been performed to understand the problem at the national level. However, to design and implement robust measures to ensure safe water for the population, it is pivotal to understand the national status of the water quality, as well as the regional differences. The purpose of this study was to investigate the water quality dynamics across this endemic cholera sub-Saharan country (Guinea-Bissau), and relate it to environmental constrains (including seasonality) and associated WASH components, in order to understand the implications for public health.
2. Materials and Methods
2.1. Study Area
The primary source of water to support the daily needs of the majority of the population in Guinea-Bissau, including drinking water, are open/unprotected, shallow hand-dug wells (<15 m). Previous studies reported that about 80% of those water sources were contaminated with faecal materials and had an acidic pH [12,14]. Guinea-Bissau has a tropical climate (hot and humid), with a dry season (DS) spanning from November to May, and a wet season (WS) with high precipitation from June to October. The most representative soil groups in the country are Ferrallisols, Plinthosols, Gleysols, Fluvisols, and Arenosols [15].
2.2. Sample Collection and Analytical Procedures
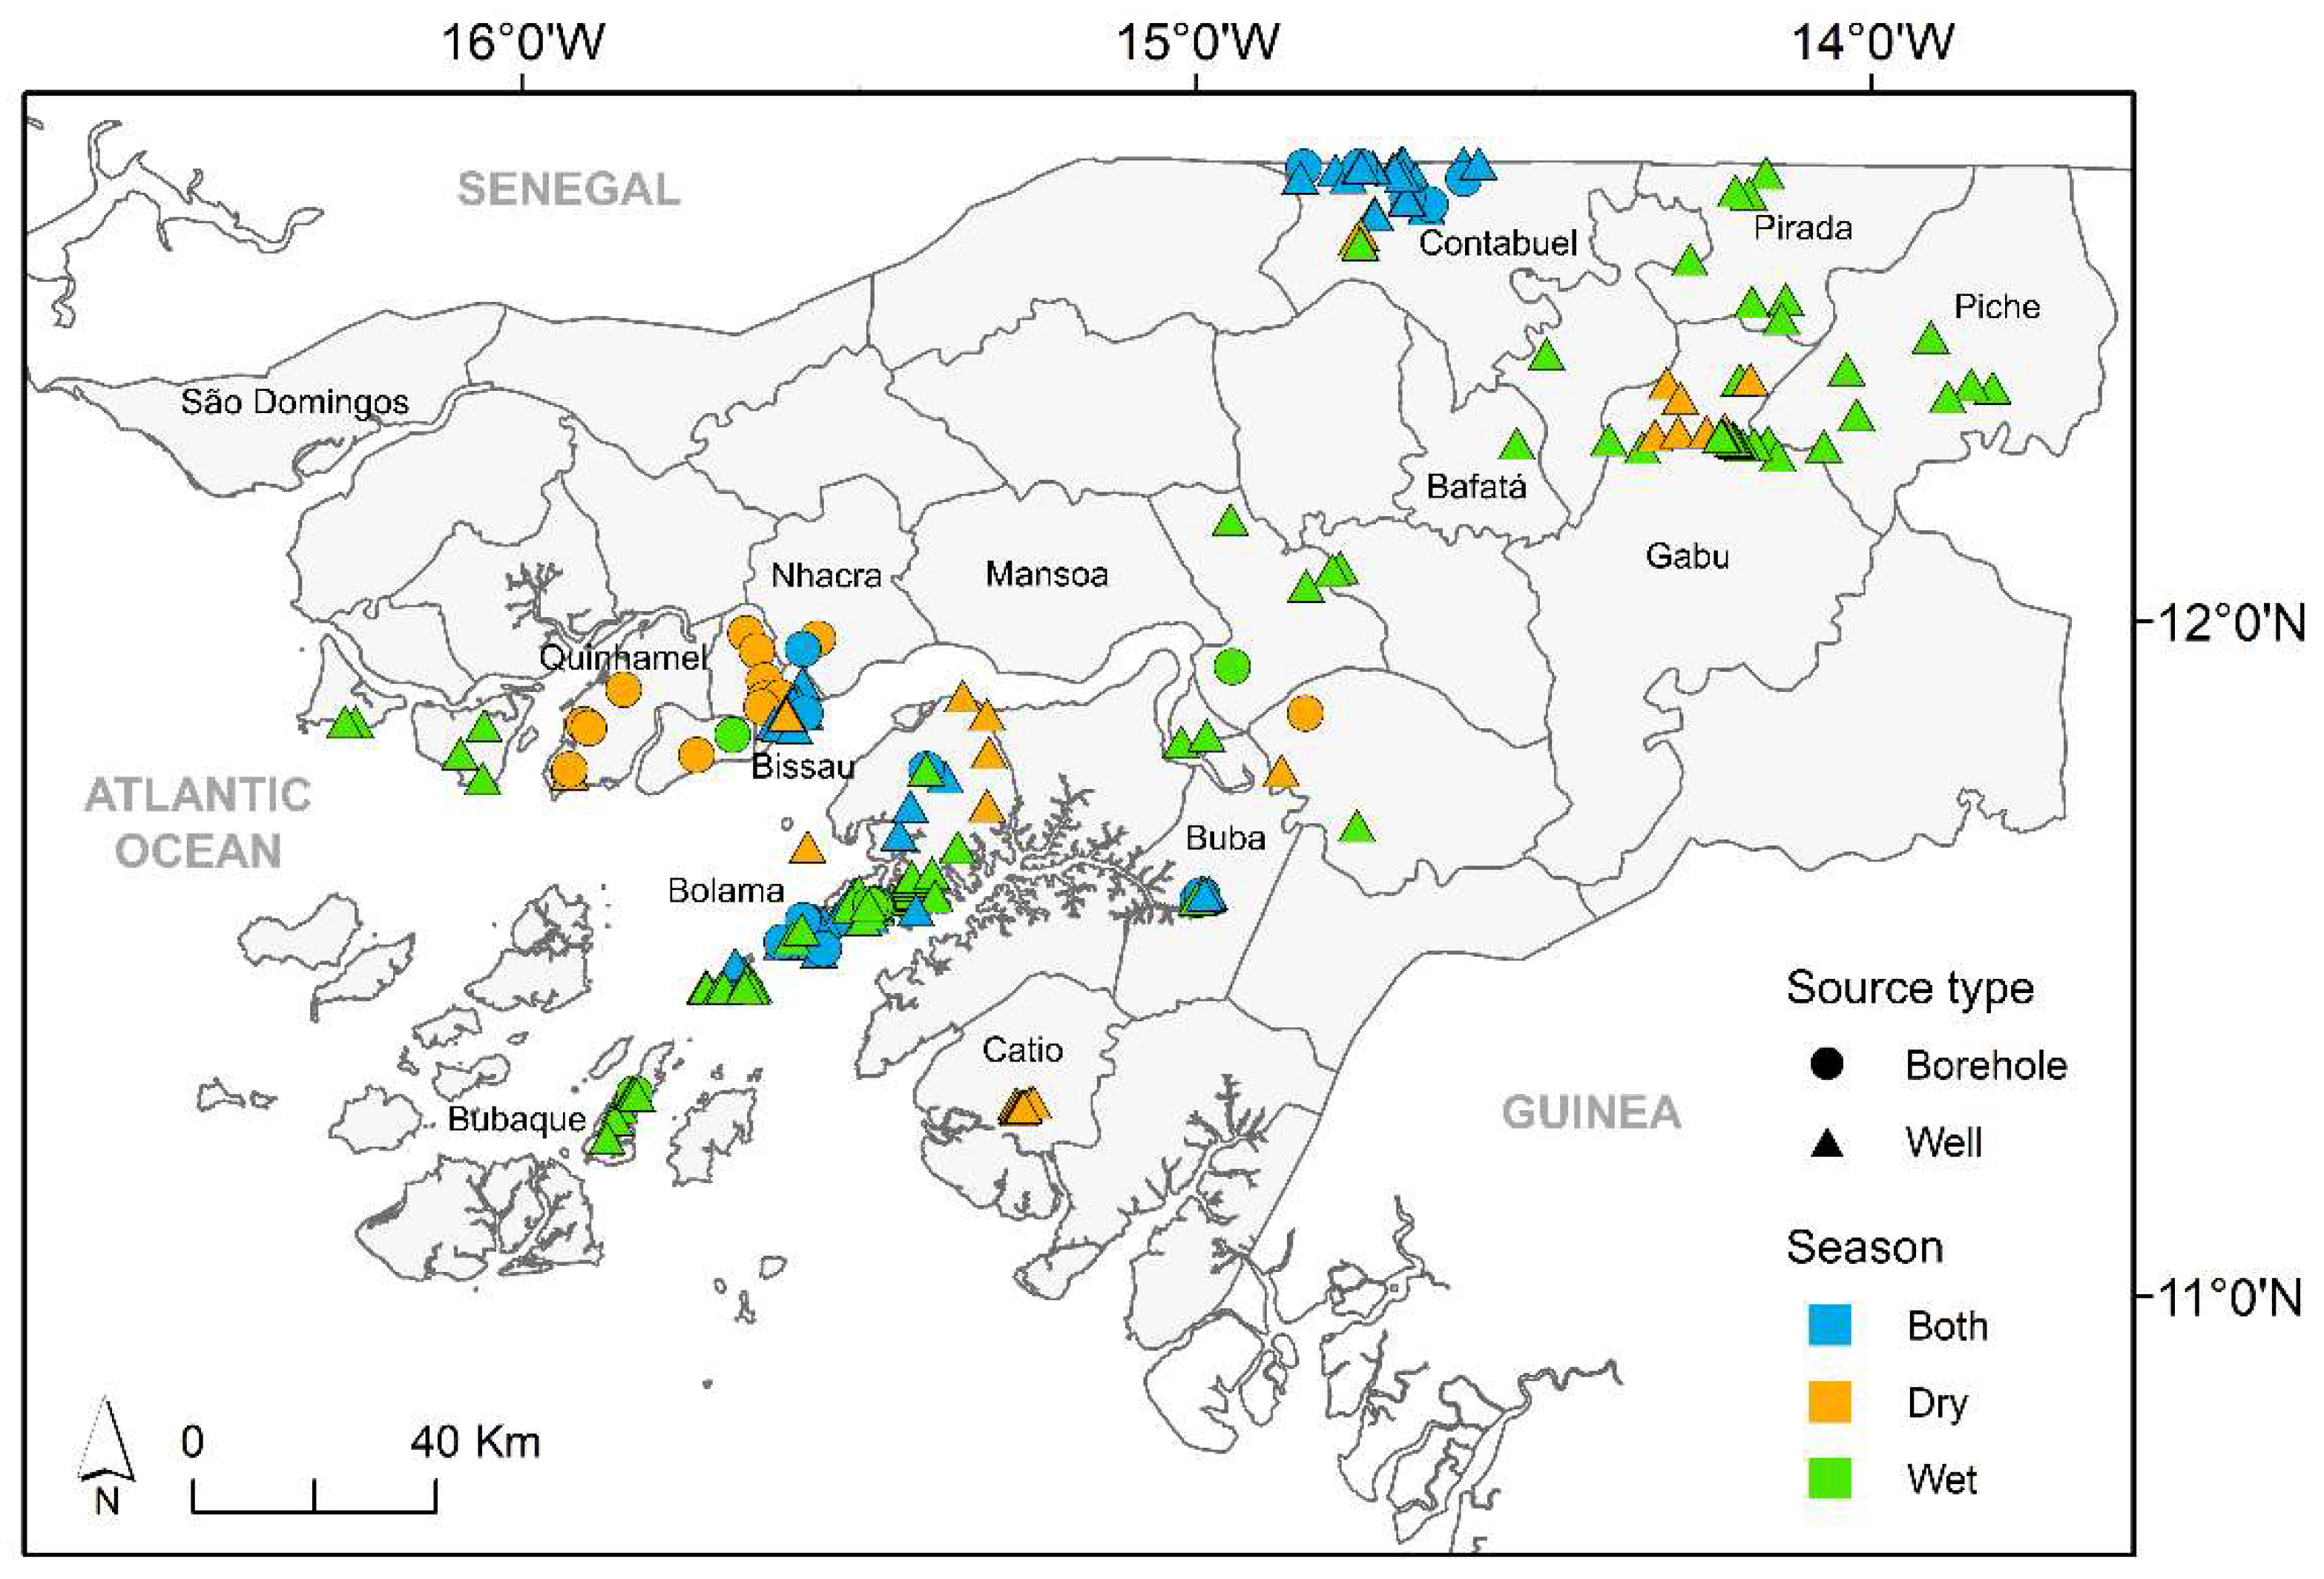
The data used in this study resulted from several surveys carried out throughout the country over a time span of 13 years (2006–2019). Sampling sites within different administrative regions were chosen, taking into account the number of people served and the accessibility (Figure 1). The water sources comprised hand-dug shallow wells (n = 216) and boreholes (n = 35), fitted with a bucket or a pump (manual, solar, or electric) to collect water (Figure S1). Out of the 252 water sources surveyed, 47 were examined in the dry season, whereas 83 were studied in the wet season. The remainder (122) water sources were assessed in both seasons. Moreover, throughout the study period, each sampling location was surveyed between 1 and 17 times.
Water samples were collected using 500 mL plastic sterile flasks. All samples were kept in the dark in refrigerated ice chests and processed within 4 h of collection at a field laboratory similar to the one described in [13]. Water temperature, conductivity, dissolved oxygen, oxygen saturation, and pH were measured in situ using a Hanna Instruments 9828 portable meter. The exact position of each water source was obtained by means of GPS (Magellan 600).
Monthly precipitation data were extracted from the historical GHCN gridded V2 dataset provided by NOAA/OAR/ESRL PSD, available on their website (http://www.esrl.noaa.gov/psd/, accessed on 4 June 2020). Resolution was 2.5 degrees for the available grid of pixels covering the Guinea-Bissau country area (11–13.5° N, 18–14° W).
Samples for water colour, nitrate, nitrite, ammonium, aluminium, arsenic, copper, chromium, cyanide, and iron and were assayed in a 12 V multiparameter Hanna HI83200 photometer, according to standard methods supplied by the manufacturer(www.hannacom.pt, accessed on 1 June 2019). A Hanna HI-93102 Multi Range Portable Turbidity Meter for water analysis was used for turbidity assessment.
Samples for faecal indicators evaluation were filtered onto sterile gridded cellulose nitrate membranes (0.45 µm pore size, 47 mm diameter, Whatman, Maidstone, UK), and placed on mFC-agar (Difco, Le Pont de Claix, France) and Slanetz–Bartley agar (Oxoid, Hants, UK) plates, for faecal coliforms (FC) and intestinal enterococci (IE) enumeration, respectively. Incubation was performed at 44.5 °C for 24 h (FC) or 48 h (IE) [17] using solar-generated electricity in the absence of an electrical supply grid. Typical colonies were counted and results expressed as colony-forming units (CFU)/100 mL.
2.3. Statistical Analysis
Faecal indicators concentrations were Log (n + 1) transformed prior to analysis. The Spearman’s rank correlation coefficient was used to assess the relationship of environmental factors and microbiological indicators. Spatial and seasonal statistically significant differences among samples were evaluated through analysis of variance (one-way ANOVA), followed by a post hoc Tukey honestly significant difference (HSD) multi-comparison test. The significance level used for all tests was 0.05.
Boosted regression trees (BRTs) were used to assess the relationship between environmental factors and microbiological indicators in the hand-dug wells only, because these represented the primary water source in Guinea-Bissau and revealed the highest contamination levels. BRTs are tree-based ensemble methods that combine the algorithms of regression trees and boosting (which build and combine a collection of models). The method works by iteratively fitting simple tree models using a forward stage-wise procedure, which progressively fits trees to the residuals of the previously fitted trees [21,22]. Some of the wells were surveyed several times; therefore, one sample per season (wet and dry) was selected at each location. Data were selected from the years when more samples were collected (2010 and 2009), and, when not available, from the closest years. When more than one sample was collected per season and year, the sample collected in the month closest to the middle of the season was chosen. Two BRT models were built, one for FCs and other for IE, using a Gaussian error distribution. Models were built in R software, version 4.0.5 [23], using the packages “dismo” and “gbm” [22,24]. Combinations of several settings were fitted before finding the optimal final setting: tree complexity (tc) of 1, learning rate of 0.001, bag fraction of 0.5 and k-fold cross validation of 10. The full models were then simplified by removing non-informative variables based on the decrease in variance. Final models were chosen based on their statistical performance, evaluated by the explained cross-validated deviance, i.e., the cross-validated correlation between training and testing data.
3. Results
Microbiological and physical–chemical quality parameters of 252 water sources spread all over Guinea-Bissau were evaluated. All the studied wells were hand-dug, shallow, without proper wall isolation, often located at the vicinity of latrines and waste dumps (<30 m), and most of them lacked any well cover or fence to prevent contamination. Regarding the method of water collection, the majority of the wells were fitted with a bucket (n = 122), 72 with a manual pump, 6 with a solar/electric pump, and 13 with a mixed version combining pump and bucket. Of the analysed boreholes, 4 were fitted with a distribution system with faucets, 23 with a solar/electric pump, 4 with manual pumps, and 4 with a mixed version combining pump and bucket (Table S1).
Microbiological and physical–chemical analysis results are summarized in Table 1 and Figure S2. Water temperature averaged 29.1 °C (22.9–35.3 °C) year-round, with only two wells sampled in each season below the 25 °C recommended maximum temperature for drinking water, according to UK standards [20]. The water conductivity was low to moderate (median 163 μS/cm), with oxygen concentrations averaging 5.5 mg/L (average oxygen saturation 59%). The water was acidic to very acidic, averaging pH 5.3. Averages were similar between seasons, being higher in boreholes (pH 6.6 vs. pH 5.2 in wells). Overall, 83% of the water sources surveyed exhibited pH below the EU parametric value for drinking water, representing 89% and 49% of the wells and boreholes studied, respectively. Acceptable standard values for colour and turbidity were exceeded in 56% and 40% of the sampled water sources, respectively. As expected, extremely high values of these parameters were recorded in the wet season in the shallow wells (Table 1). Additionally, higher values were obtained when a bucket was used to withdraw the water (Figure S2). The nitrate, nitrite, and ammonium concentrations were below the EU and WHO parametric values for drinking water in most wells, although a value slightly above the acceptable parametric threshold was registered in the wet season. The highest concentrations of nitrate and ammonium were observed in wells and associated with the use of buckets (Figure S2). Overall, heavy metal (Al, As, Cr, Cu, and Fe), and cyanide concentrations were under the parametric value for drinking water. However, a higher number of surveyed water sources revealed non-compliance with the standard parametric values related to the wet season, wells, and when using a bucket to collect water (Table 1 and Figure S2).
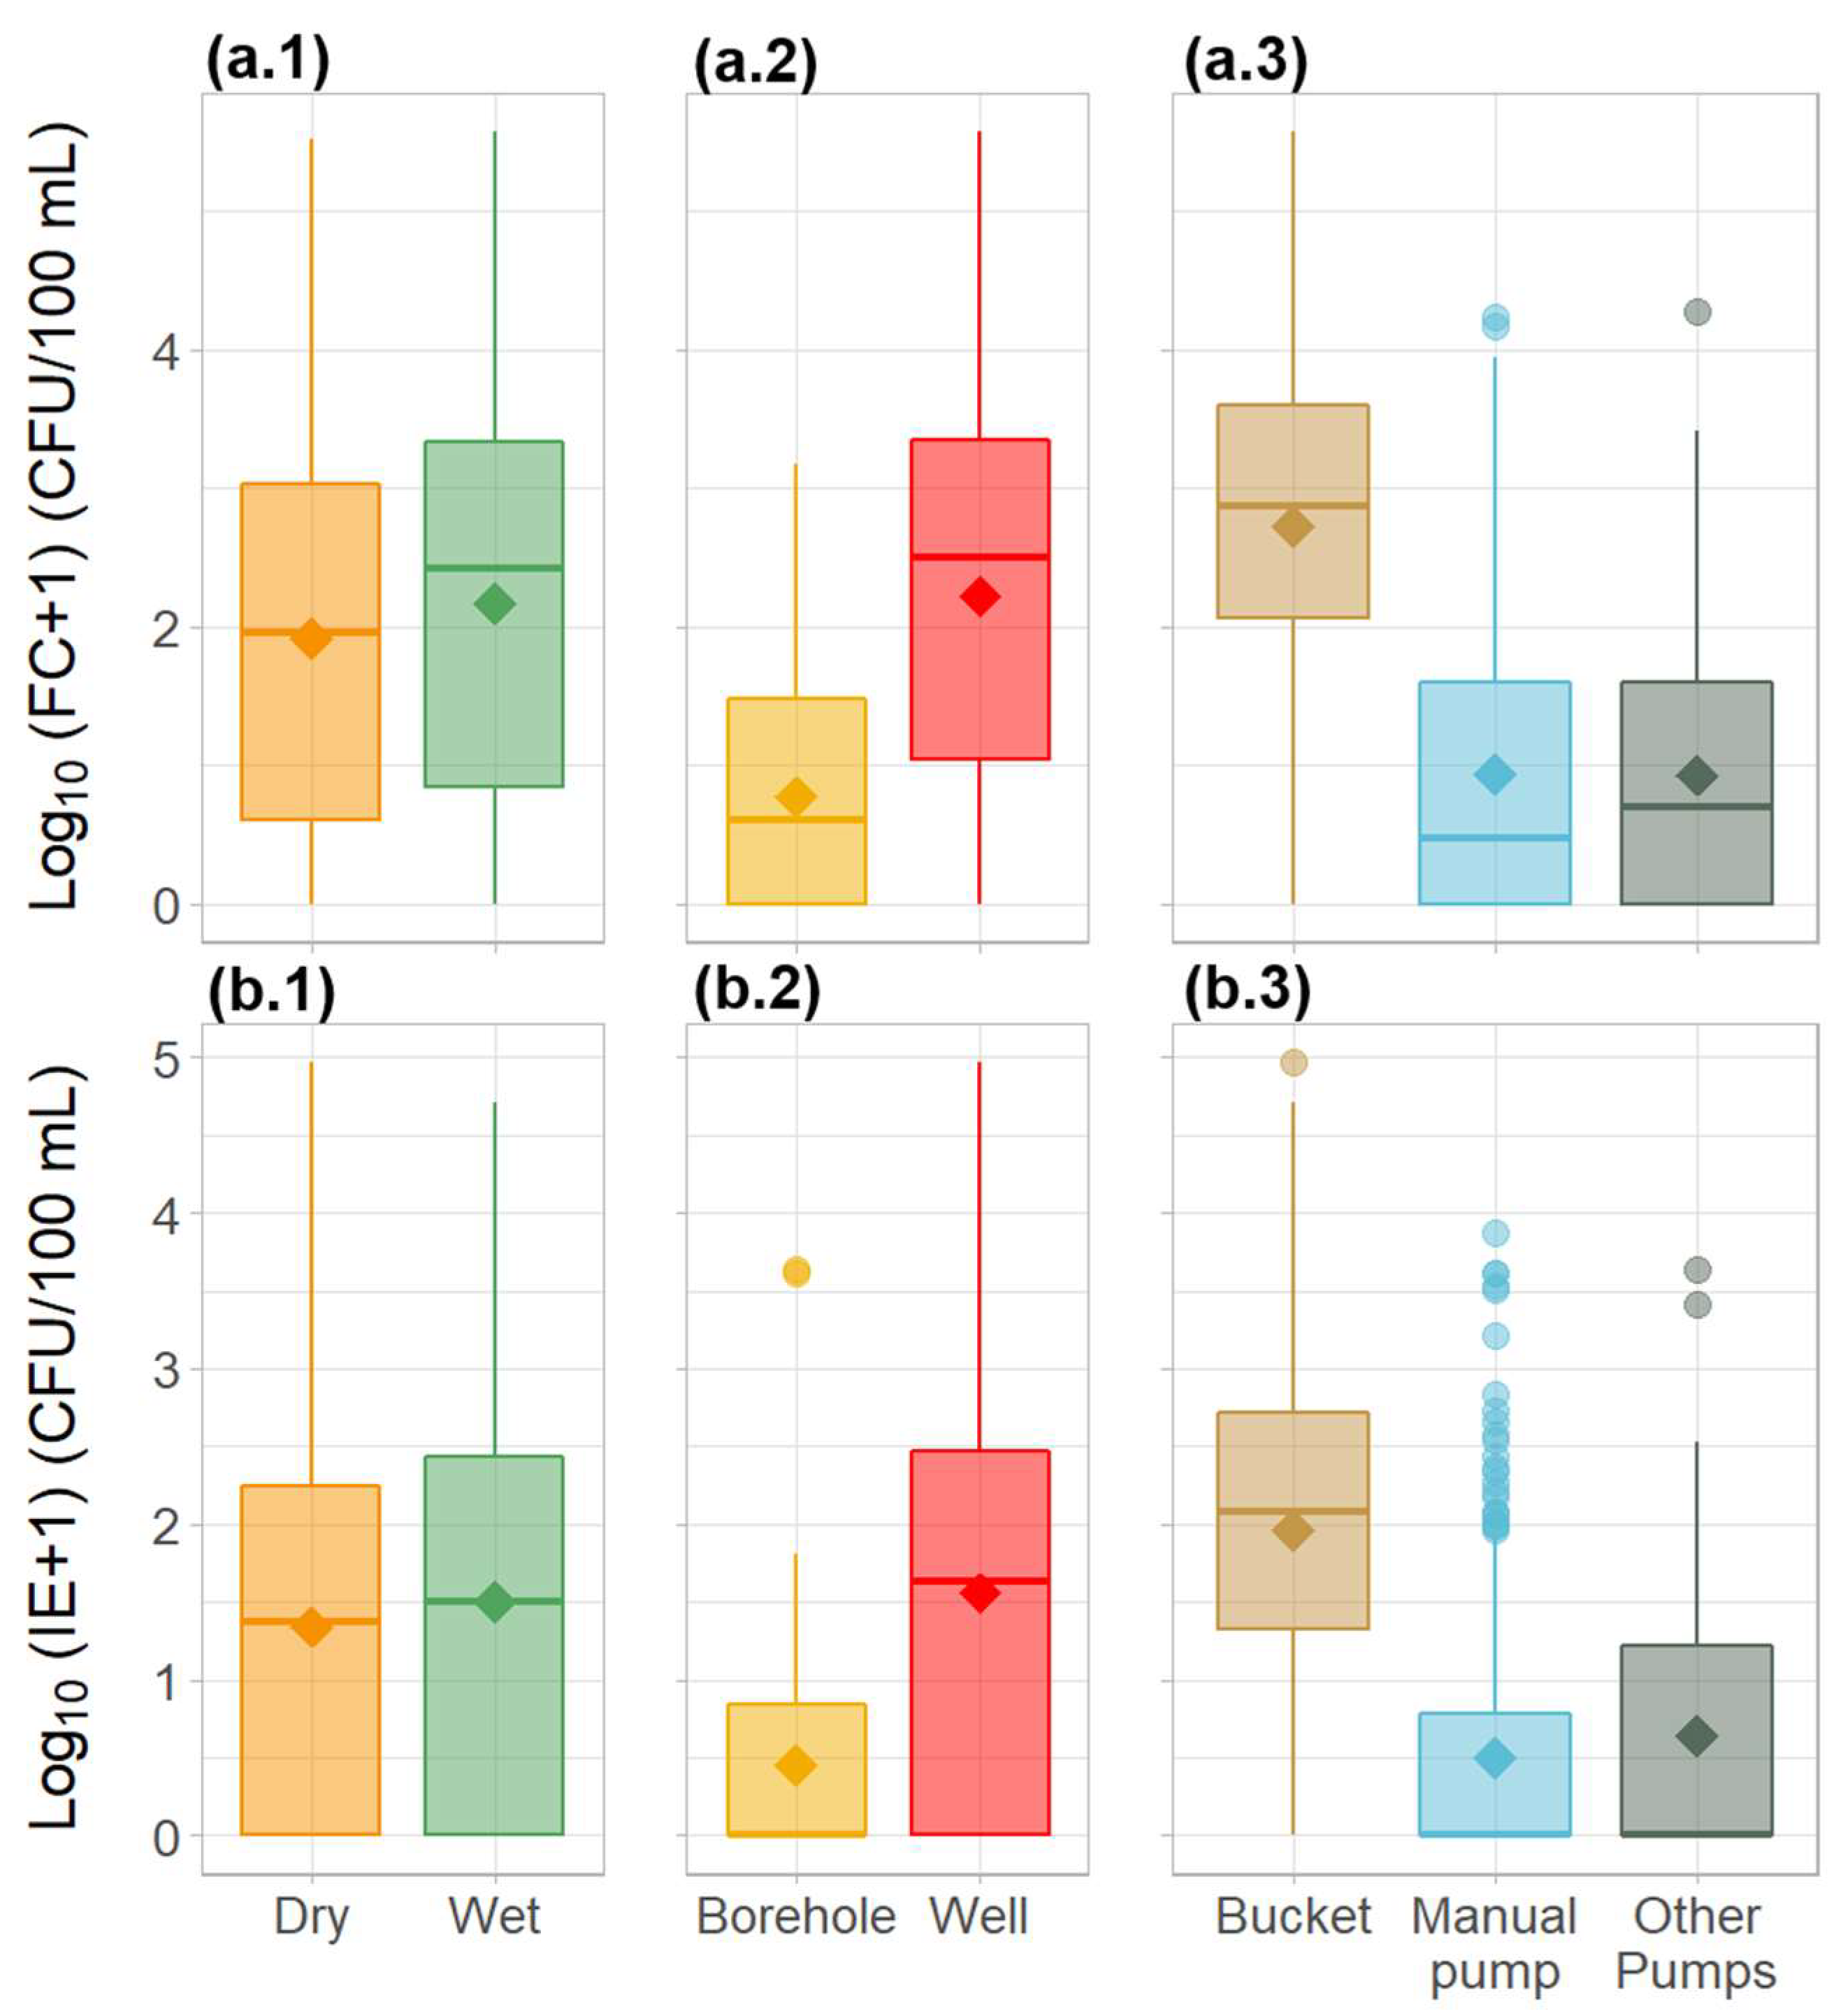
The obtained results showed that the drinking water available to the population was grossly polluted with faecal material. The majority of the water sources sampled (83% and 77% for FC and IE, respectively), failed to meet the microbiological quality standards for drinking water, as recommended by the WHO and the EU. Values averaged 4217 and 800 CFU/100 mL for FC and IE, respectively (Table 1). Overall, faecal contamination levels were significantly higher during the wet season (Tukey’s HSD test, p < 0.05), with values as high as 376, 850 CFU/100 mL for FC, and 33,000 CFU/100 mL for IE. Additionally, significantly higher (Tukey’s HSD test, p < 0.05) faecal contamination levels were associated with wells and the use of a bucket for water collection. The lowest levels of contamination were observed in water samples collected from boreholes associated with electric pumps with small water distribution systems fitted with faucets (Figure 2).
FC and IE were significantly correlated (r = 0.85, p < 0.05), as expected. Significant positive correlations (p < 0.05) were observed between both faecal indicators and colour (rFC = 0.32, rIE = 0.30), turbidity (rFC = 0.50, rIE = 0.49), ammonium (rFC = 0.32, rIE = 0.30), nitrate (rFC = 0.34, rIE = 0.35), nitrite (rFC = 0.33, rIE = 0.30), aluminium (rFC = 0.12, rIE = 0.12), chromium (rFC = 0.20, rIE = 0.14), copper (rFC = 0.15, rIE = 0.20), cyanide (rFC = 0.10). and iron (rFC = 0.22, rIE = 0.26). Turbidity and colour, associated with downpours during the wet season, showed positive significant correlations (p < 0.05) with the nitrogen species, and the majority of metal concentrations (Figure S3).
Hand-dug wells represented the majority of the water sources sampled, with the highest contamination levels; therefore, the relationship between environmental factors and microbiological indicators was further explored using a regression analysis approach. As a result, the fitted BRT models for the microbiological parameters FC and IE were similar in performance, although the FC model performed slightly better, with an explained deviance of 49% and a cross-validated correlation of 0.7 (Table 2).
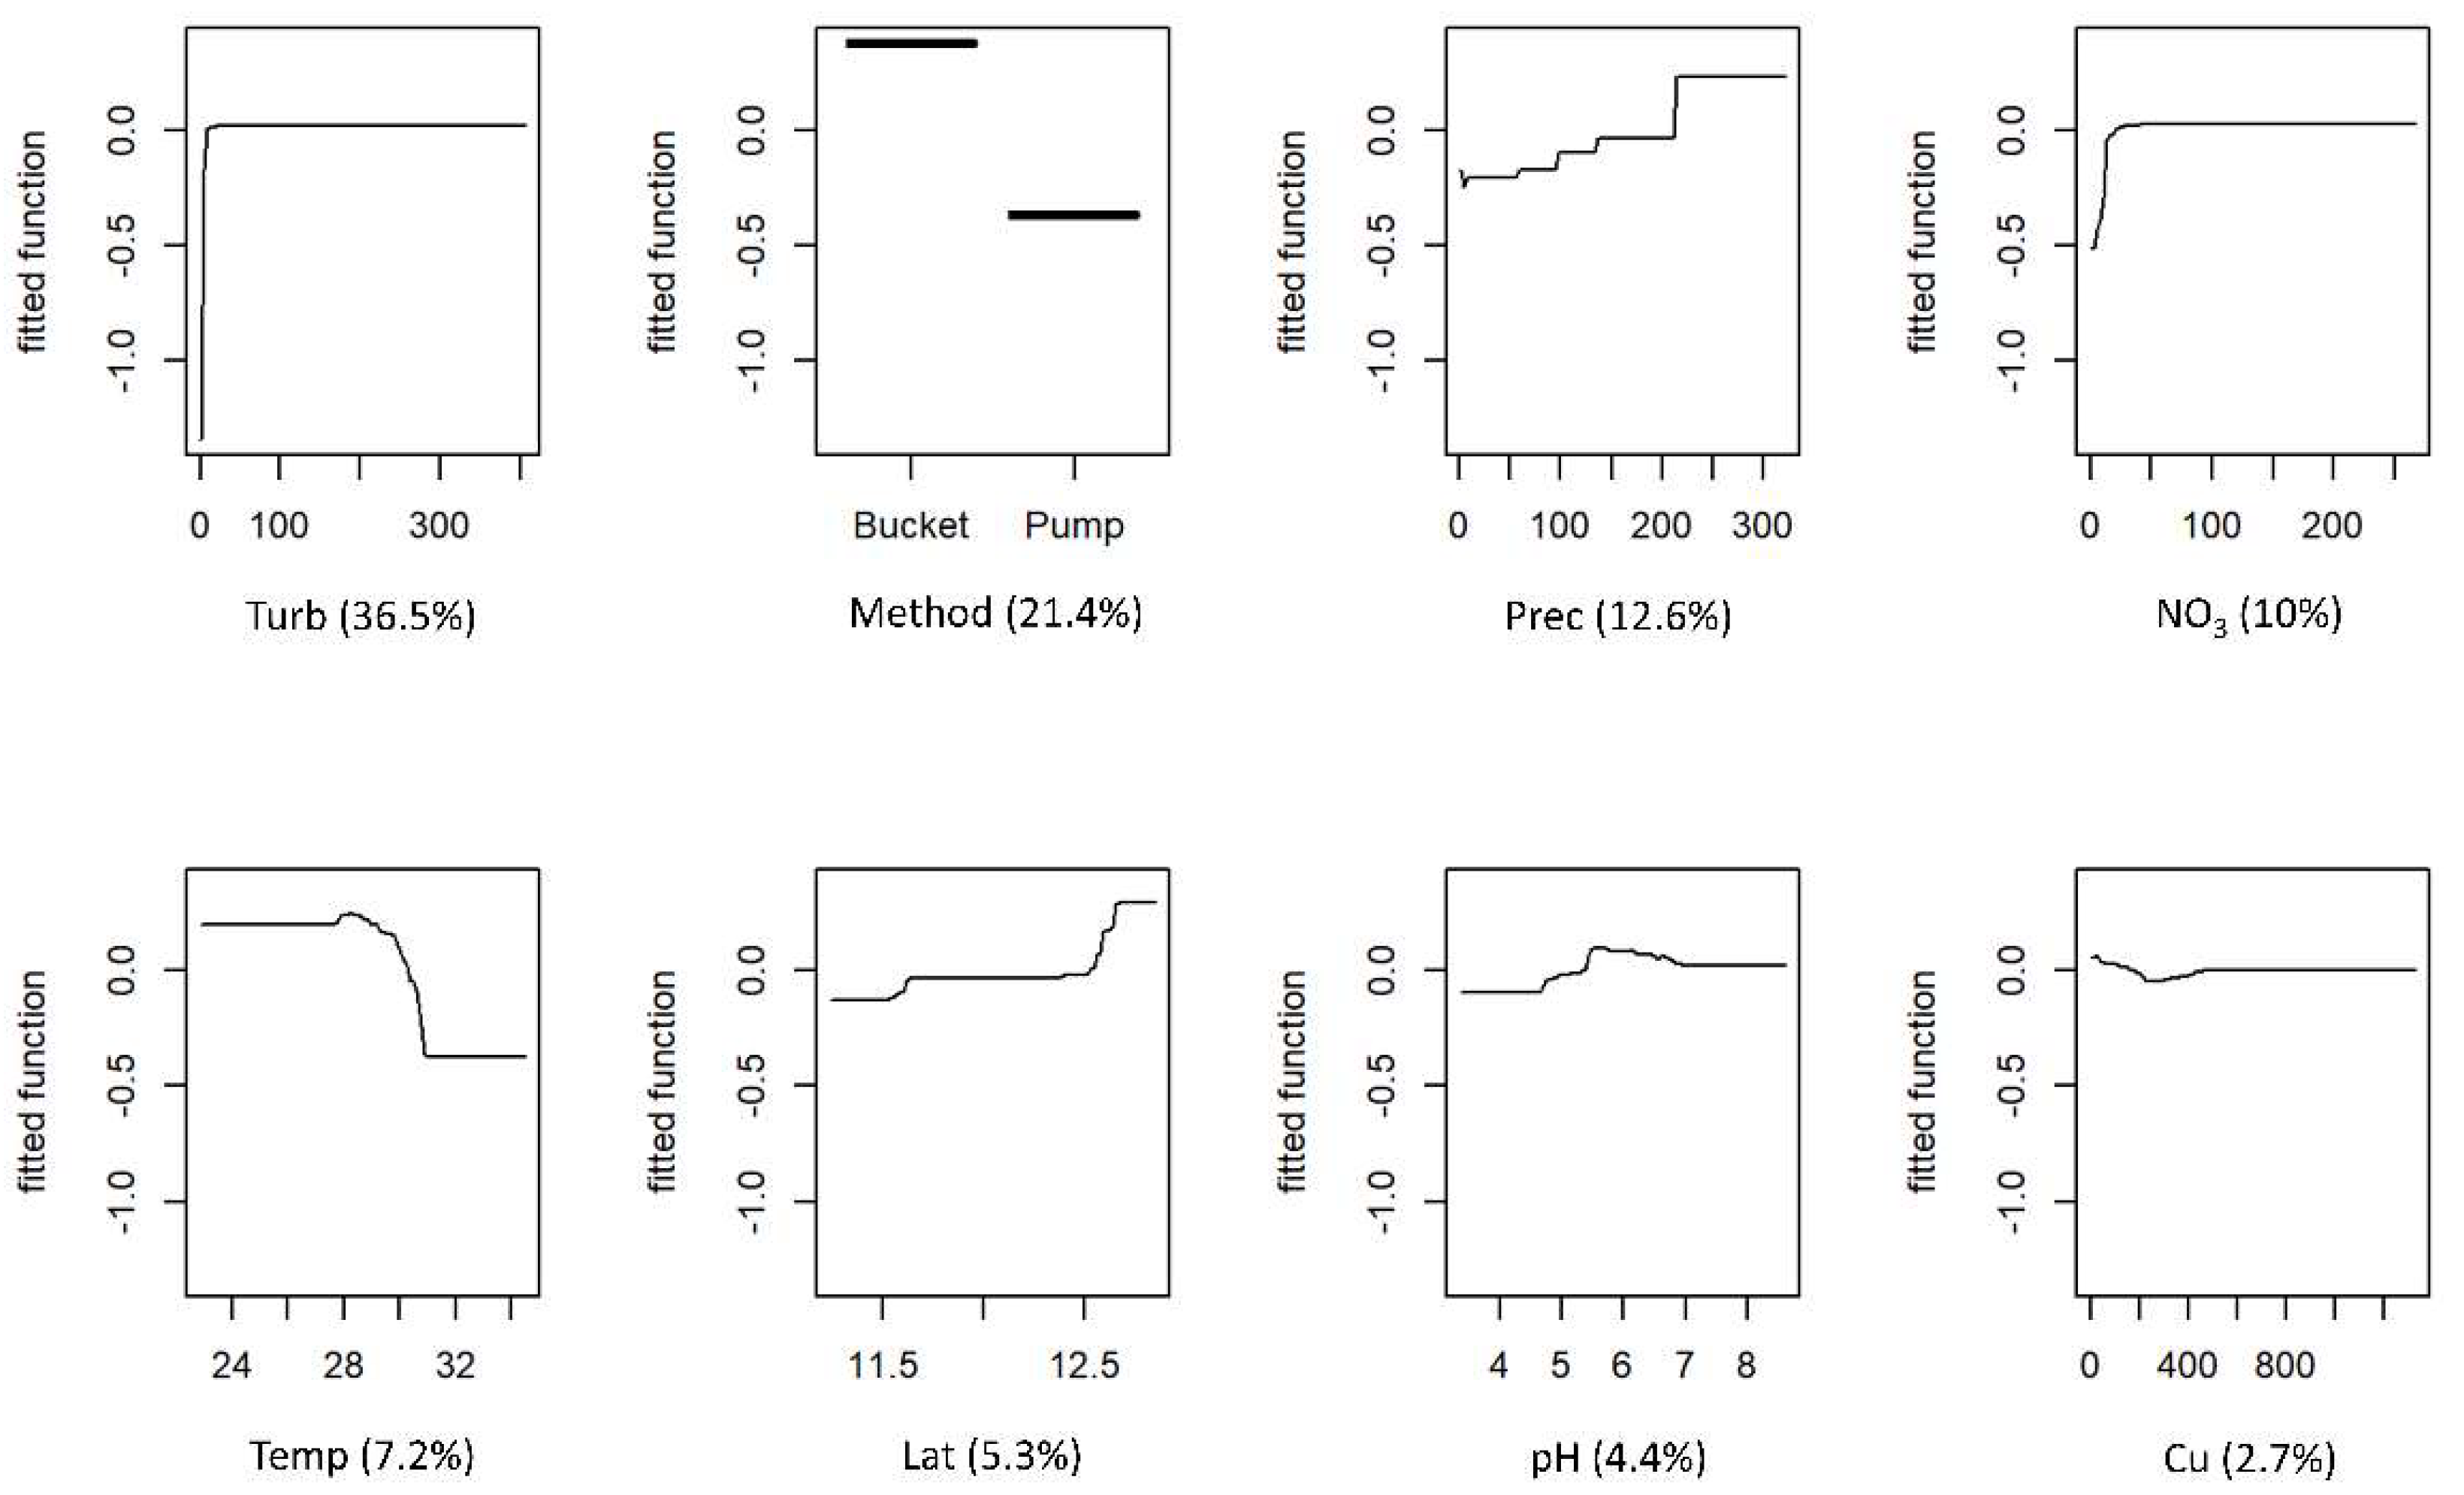
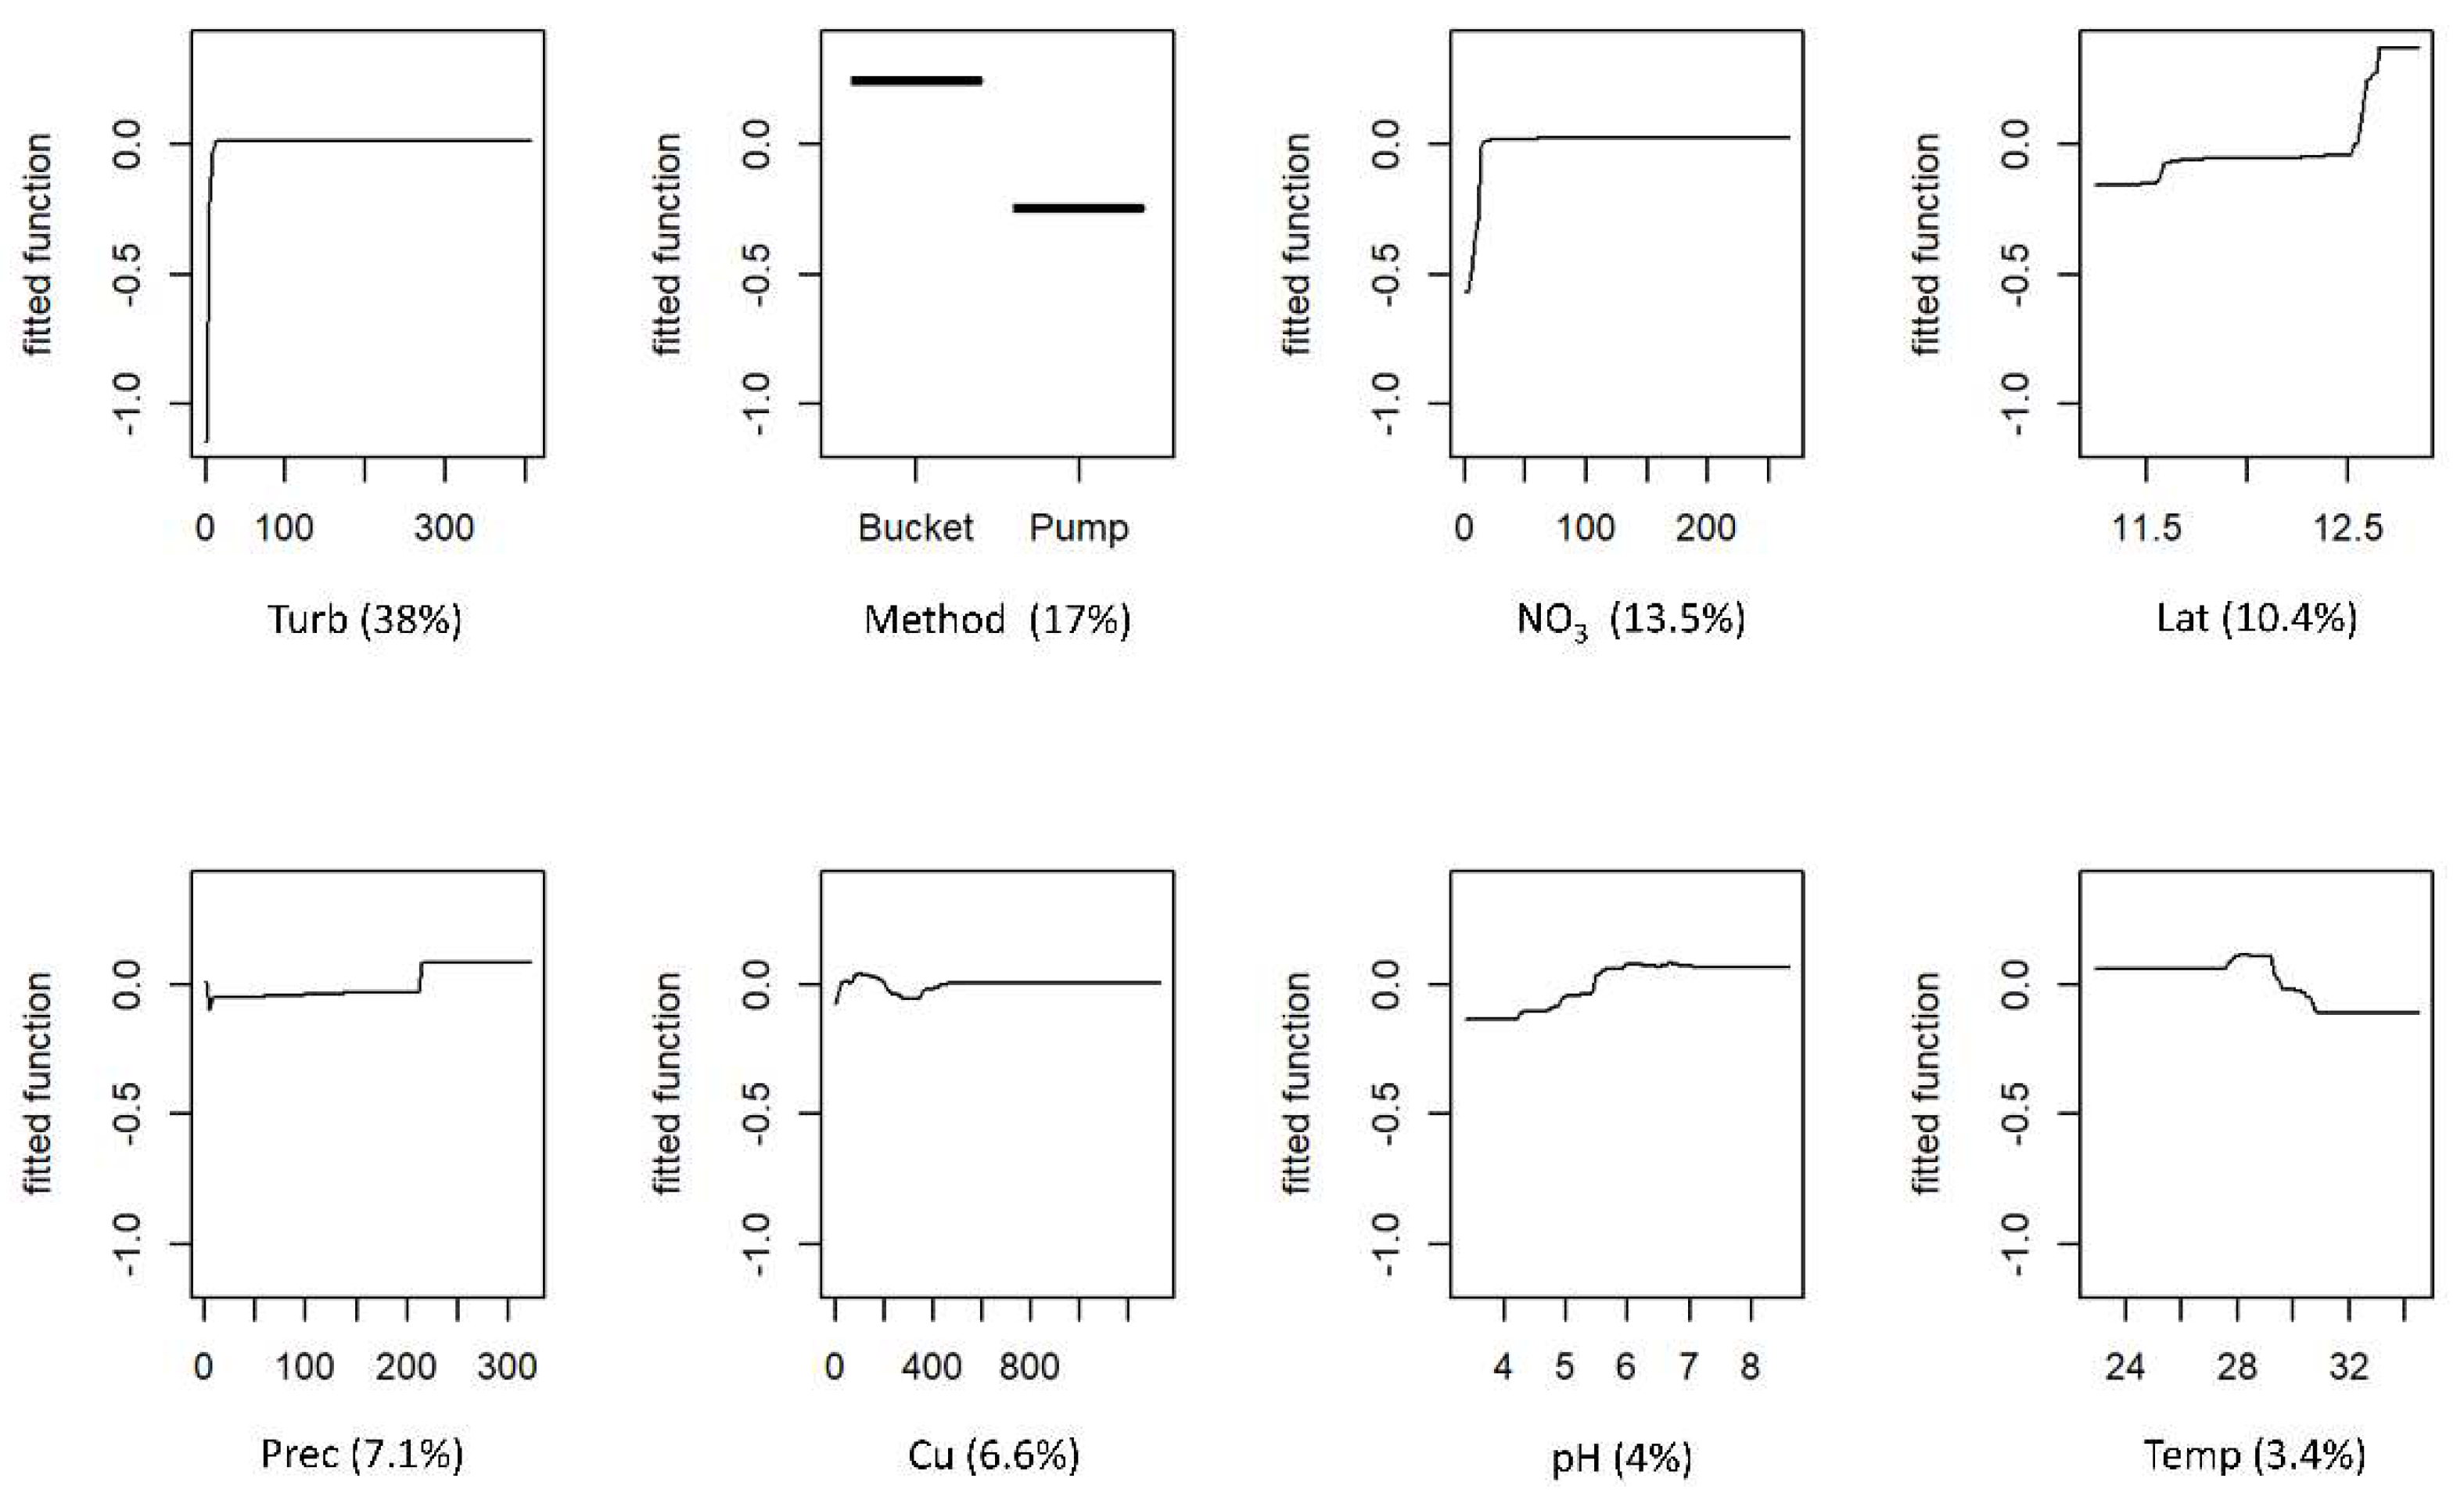
The partial responses for FC and IE for each predictor variable and variable contributions are shown in Figure 3 and Figure 4, respectively. Both models retained the same eight predictor variables. For both models, the two most influential variables were turbidity and the method used to collect water, accounting for 57.9% and 55% of the explained deviance for FC and IE, respectively. The levels of faecal contamination increased with higher turbidity and the use of a bucket to collect water. The contributions of the remaining six variables differed between models, but the effects on the response were similar. The concentrations of faecal indicators were higher in the wet season, although precipitation was a more influential variable for the FC model. Latitude was also an influential variable in both models, with contamination increasing with increasing latitudes (towards northern regions). The levels of contamination also increased with higher concentrations of nitrate and pH. Faecal indicators concentration decreased as temperature rose. The effects of copper were different for the two models: FC concentration showed a slight decrease with higher levels of the metal, whereas IE concentration peaked and then decreased as metal levels increased.
4. Discussion
The water quality assessment in Guinea-Bissau revealed that the water sources used for drinking purposes countrywide were acidic to very acidic, and heavily contaminated with faecal material. Higher levels of contamination were found during the wet season, associated with wells and the use of a bucket to withdraw water. This trend has previously been identified in regional studies performed in the country [12,25].In Guinea-Bissau, the majority of the population retrieve water from shallow (<15 m), hand-dug wells, without any wall isolation or well cover protection. Typically, each well was fitted with a bucket and rope to withdraw water, although some had a manual pump associated. This proportion was visible during the survey, with about one borehole analysed for every six wells. Only 20.5% of the population has access to proper sanitation; thus, communal latrines are the standard, although in rural areas open defecation is still common [9]. Nevertheless, most are single pit latrines, with a basic thatched or galvanized corrugated sheet walls and no doors.
The high faecal contamination observed throughout the year is essentially a consequence of the proximity between wells and latrines (<30 m), the presence of freely wandering domestic animals (including cattle), and the contact of the bucket and rope with contaminated soil, as reported by several previous studies in Guinea-Bissau [12,13,14,26] and perceived by the authors in the field.
The influence of pit latrines on groundwater quality was previously described, being recognized as a major source of water contamination depending on the surrounding environment, particularly hydrological and soil conditions [27,28,29]. Rainfall promotes the mobilization of soil particles through infiltration and percolation that eventually reach the subsurface groundwater, conveying associated bacteria and viruses. Sediments are well known reservoirs for microorganisms, typically revealing higher bacterial levels than the water column [30]. Indeed, in accordance with other studies [13,26], high levels of contamination could be observed in the wet season, associated with a simultaneous increase in turbidity. Turbidity in water is caused by suspended particles or colloidal matter, and may be caused by inorganic or organic matter, or a combination of the two [31]. Due to the high superficial area and metabolic substrate concentration, high turbidity can provide an adequate environment for microorganism growth and persistence. Indeed, drinking water turbidity has been associated with the incidence of gastrointestinal diseases [32]. In Guinea-Bissau, the reported diarrhoea episodes systematically peak at the onset of the wet season [33,34], and the main cholera outbreaks have been reported during the wet season [11]. Additionally, the persistent high water temperature (average 29.1 °C) observed in wells year-round can also contribute to foster microbial growth [35].
Furthermore, the majority of wells were fitted with buckets and ropes that are often placed on the ground due to the lack of a basic overhead frame to hang them when not in use. This may allow contact with animals and human excreta; moreover, the tools may not exclusively be used to retrieve water. The aggravated situation was confirmed by the results obtained from the models, indicating that the method used to collect water was one of the most influential predictors. The use of a bucket considerably increased the contamination levels. On the other hand, boreholes (>20 m) were drilled mechanically and fitted with a pump (solar, electric), and were thus less prone to contamination.
The relationship between faecal indicators and the nitrogen species strengthen the hypothesis stated above; that microbial contamination enters groundwater due to infiltration and percolation from the surface. The presence of high concentrations of ammonium, nitrate, or nitrite in drinking water are recognized as indicators of possible bacterial, sewage, and animal waste pollution or agricultural runoff [36]. Moreover, there is an increased risk of methemoglobinemia development in bottle-fed infants associated with high concentrations of N species in drinking water, which can further be complicated by the concurrent presence of microbial contamination [36,37]. Additionally, nitrate appears to competitively inhibit iodine uptake, and the long-term exposure by drinking water intake can contribute to the iodine deficiency problem felt in countries such as Guinea-Bissau [36,38].
The faecal contamination was revealed to be related with latitude, with an increment towards the northern part of the country, that can be potentially explained by additional faecal contamination associated with the livestock presence. Although recent data are not available, according to the national livestock census in Guinea-Bissau conducted in 2009, it was estimated that the total number of cattle was approximately 1,325,412, mainly concentrated in the northern areas (Gabu, Bafata, and Oio regions) [39], owned by Fulani, Mandinga, and Balanta ethnic groups. The practice of extensive cattle ranching still dominates in Guinea-Bissau, with a marked transhumance period during the dry season for pasturage and water [40]. Cattle lairage is an unused practice in Guinea-Bissau and livestock roam free in the fields, representing a potential pollution source for unprotected shallow wells. It could be argued that the lairage of cattle could somehow contribute to a diffuse contamination decrease; however, the solution is unworkable due to the lack of water and fodder, technical resources, and infrastructure support.
Overall, similarly to other studies [12,13,14], the chemical contamination was less relevant, with metal concentrations below the acceptable limits for the majority of the studied water sources. Nonetheless, it is important to note that high metal levels were observed in several wells, and the consumption of elevated levels of metals through drinking water has been associated with the development of health problems, including cancer [31]. Again, the positive correlation found between metal concentration and turbidity indicated the potential role of soil particles as a natural contamination source. During the wet season, the soil particles and associated metal-rich leachates can easily be mobilized by percolation and infiltration, reaching the subsurface groundwater that feeds the shallow wells. In the dry season, the water–soil contact is promoted by the low water level and higher residence time of the water, with increased contact with the earth walls and bottom sediments, fostering high water turbidity.
The majority of the water sources were outside the suitable pH range for drinking water according to EU standards, in the acidic to very acidic interval, a consequence of red, sulphur-rich, sandy-clay soil characteristics [41]. The consumption of acidic water can have a direct impact on population health, particularly in dental erosion [42,43] and through the potential mobilization of heavy metals [44]. Currently, very limited working water networks are available in the country; therefore, the risk of metal contamination through pipes does not seem to be problematic, although such low pH values have to be taken into account in the construction of future infrastructure or rehabilitation initiatives, in order to choose the most suitable materials. Additionally, the corrosion of the materials used in constructing well and distribution systems can enable the feed and growth of microorganisms from adjacent areas in the water used for drinking. Bacteria can adapt to environmental conditions such as low pH, potentially reducing the stomach acidic barrier efficiency, and consequently, the required infectious dose to cause disease [45].
The access to safe drinking water, in addition to being a basic human right, is associated with population health, and consequently, with poverty. Waterborne diseases linked to inadequate WASH are a key public health concern [46,47,48], particularly in middle- and low-income countries, which needs to be addressed for country development. Furthermore, the expected population growth and the climate change scenario will pose an additional threat to WASH infrastructure and services [49].
This study highlighted the urgent need to improve the access to safe drinking water in sub-Saharan countries, such as Guinea-Bissau. For a long-term solution, a robust, countrywide intervention on WASH infrastructure is pivotal. New construction or rehabilitation of the limited water and sanitation networks should be performed, taking into account the local and regional conditions (such as the acidic groundwater), and forearm periodic maintenance and water quality monitoring, which are presently inexistent. To ensure water quality safety, government administration and non-governmental organizations must favour the construction of deep boreholes, even if it means cooperation and co-ordination between agencies, as well as constructing less infrastructure, due to the higher associated costs. Water quality should be regularly monitored, and if needed, promptly treated using the disinfection treatments techniques currently available and applied in countries with limited resources [50,51]. Emphasis should also be placed on the collection and treatment of effluent from latrines, including the construction of sealed tanks—septic tanks—and the disposal of waste into small collective treatment plants with biological beds. Furthermore, scientific and technical advice, prior and during construction, is essential for correct guidance on the establishment of local infrastructure and maintenance.
The traditional or settled way of living can be a hindrance to development; therefore, the implementation of behaviour change programs, with structured formative and educational interventions to raise awareness at the different societal levels (individual, household, community, and institutional) will be decisive to prevent disease transmission. The integration of local stakeholders and the community, throughout the implementation programs, will help to ensure the sustainable use and management of water.
On other hand, considering the urgency overt in the results of this study, the authors propose the short-term implementation of simple, sustainable measures, which could drastically improve the access to safe drinking water, mitigating the associated health risk:
- Remove potential contamination sources, such as latrines and garbage dumps from the vicinity of the water sources (>30 m). Promote latrine disinfection with quicklime and the controlled disposal of waste. Quicklime is easily available and can be used to disinfect faecal solids [52], with <90% efficiency in removing bacterial and viral pathogens [53].
- Whenever possible, favour the supply of water from boreholes over shallow wells. When using wells, favour those fitted with pumps, over buckets, proven to endure the harsh country conditions.
- Build and maintain proper security perimeters around water sources, deterring wandering animals by fencing and waterproofing the nearby terrain to prevent mud accumulation and avoiding the stagnation of water, particularly in the wet season.
- Fit the wells with covers and support systems for buckets and ropes in order to avoid contact with the soil.
- Promote the household storage of water in narrow-mouth containers fitted with faucets, avoiding contact between drinking water and hands or small containers used to collect water. Therefore, secondary contamination may be prevented. Promote the efficient and correct time frames to perform the disinfection of these containers.
- Promote household-level disinfection of drinking water to decrease the microbial load by filtration, chlorination, boiling, solar water disinfection (SODIS), or using plant extracts. Favouring household-level disinfection will prevent secondary contamination. Filtration through naturally occurring materials is a cost-effective and efficient treatment. For instance, slow sand filtration, ceramic filters, and biochar are widely used as disinfection techniques [50]. Chlorination with commercial bleach can also successfully decrease the bacterial load [50,54]. Although boiling water can be an efficient method of disinfection, in most situations is an unpractical solution, because it implies a time and economic expend. Moreover, boiling water can enhance metal concentrations, generating an additional problem. SODIS is a simple-to-use and inexpensive technique capable of microbial inactivation [55]. Plant extracts, such Moringa oleifera, can also be used as water treatment strategy, due to their antimicrobial and coagulant properties [56]. However, caution should be taken when water presents high turbidity values (>1 NTU), because this can interfere with the disinfection kinetics and efficiency, by providing protection and subtract for organisms [31,57,58]. Thus, resorting to multiple methods may be necessary to reduce particulate matter before disinfection. Filtration through easily available cotton cloth has been shown to be effective in the reduction of particulate matter and associated microbial loads [59]. The addition of Moringa oleifera has also been evaluated as a pretreatment for SODIS, reducing turbidity [60].
5. Conclusions
The majority of the population in Guinea-Bissau still retrieve water for daily needs, including drinking water, from shallow wells. The water was acidic to very acidic and heavily contaminated with faecal matter, and thus unfit for human consumption. This situation was present throughout the year, but deteriorated further in the wet season, associated with high water turbidity. The highest levels of contamination were associated with shallow wells and bucket water retrieval. Although the chemical contamination was less relevant, and no overall trend could be found, several of the surveyed water sources revealed high values of nitrogen species and heavy metals.
A national concert intervention on WASH infrastructure is essential to provide safe drinking water to the population, as recognised in the United Nations Sustainable Development Goals. In the short-term, the authors suggest the implementation of simple measures to improve water potability and reduce the disease burden associated with waterborne pathogens.
The results of this research fill the pressing need for scientific background knowledge concerning the water quality in Guinea-Bissau, decisive to help the design of sustainable mitigation strategies. Improving water quality could have a dramatic impact on the population health status, and consequently, on the development of this low-income country.
Supplementary Materials
The following are available online at https://www.mdpi.com/article/10.3390/w14131987/s1, Figure S1: Example of typical water sources surveyed across Guinea-Bissau with the respective method used to retrieve water, Figure S2: Variation of key water quality parameters according to source type and method of water collection, Figure S3: Matrix of Spearman correlations between the physical–chemical quality parameters of the water sources across Guinea-Bissau, Table S1: Number of water sources surveyed according to the water collection system.
Author Contributions
Conceptualization, A.M. and A.A.B.; methodology, A.M., E.A. and A.A.B.; software, E.A.; validation, A.M., E.A. and A.A.B.; formal analysis A.M. and E.A.; investigation, A.M. and A.A.B.; resources, A.M. and A.A.B.; data curation A.M. and A.A.B.; writing—original draft preparation, A.M. and E.A.; writing—review and editing, A.M., E.A. and A.A.B.; visualization, A.M., E.A. and A.A.B.; supervision, A.A.B.; project administration, A.A.B.; funding acquisition, A.M. and A.A.B. All authors have read and agreed to the published version of the manuscript.
Funding
This study was partially funded through a fellowship to A. Machado (SFRH/BD/46146/2008), co-financed by POPH/FSE. This research was also partially supported by the Project BeachSafe (PTDC/SAU-PUB/31291/2017), co-financed by COMPETE 2020, Portugal 2020 and the European Union through the ERDF, and by FCT through national funds.
Institutional Review Board Statement
Not applicable.
Informed Consent Statement
Not applicable.
Data Availability Statement
All data generated or analysed during this study are included in this published article (and its supplementary information files). Notwithstanding that, the datasets used and/or analysed during the current study are available from the corresponding author upon reasonable request.
Acknowledgments
The authors wish to acknowledge the on-site logistic support of AIDA (Ayuda, Intercambio y Desarrollo), AMI (International Medical Assistance) and Cruz Roja Española. We thank Alfa and Samba, who assisted with sample collection and facilitated contact with the local population.
Conflicts of Interest
The authors declare no conflict of interest. The funders had no role in the design of the study; in the collection, analyses, or interpretation of data; in the writing of the manuscript, or in the decision to publish the results.
References
- UN, United Nations. The Human Right to Water and Sanitation [A/RES/64/292]; United Nations General Assembly; UN, United Nations: New York, NY, USA, 2010; Available online: www.un.org/ga/search/view_doc.asp?symbol=A/RES/64/292 (accessed on 7 July 2021).
- UN, United Nations. Transforming Our World: The 2030 Agenda for Sustainable Development [A/RES/70/1]; United Nations General Assembly. UN, United Nations: New York, NY, USA, 2015. Available online: https://www.un.org/en/development/desa/population/migration/generalassembly/docs/globalcompact/A_RES_70_1_E.pdf (accessed on 3 July 2021).
- WHO, World Health Organization. Results of Round II of the WHO International Scheme to Evaluate Household Water Treatment Technologies; WHO: Geneva Switzerland, 2019; Available online: https://apps.who.int/iris/handle/10665/325896 (accessed on 2 July 2021).
- WHO, World Health Organization. Key Facts from 2015 JMP Report; WHO, World Health Organization: Geneva, Switzerland, 2015. Available online: http://www.who.int/water_sanitation_health/publications/JMP-2015-keyfacts-en-rev.pdf?ua=1 (accessed on 3 July 2021).
- UN, United Nations. World Population Prospects 2019: Highlights [ST/ESA/SER.A/423]; United Nations General Assembly, Department of Economic and Social Affairs, Population Division. UN, United Nations: New York, NY, USA, 2019. Available online: https://www.un.org/development/desa/publications/world-population-prospects-2019-highlights.html (accessed on 3 July 2021).
- WHO, World Health Organization. Guinea-Bissau Data. Global Health Observatory Data Repository; WHO, World Health Organization: Geneva, Switzerland, 2021; Available online: https://apps.who.int/gho/data/view.main.SUBREGchildmortality-GNB (accessed on 3 July 2021).
- WHO, World Health Organization. Global Supply and Sanitation Assessment 2000 Report. Part II: Water Resources Development; Joint Monitoring Programme for Water Supply and Sanitation; WHO: Geneva Switzerland, 2000; Available online: https://www.who.int/publications/i/item/9241562021 (accessed on 4 July 2021).
- Gleick, P.H. The human right to water. Water Policy 1998, 1, 487–503. [Google Scholar] [CrossRef]
- UN, United Nations. Global SDG Indicators Database—Guinea-Bissau. United Nations Statistics Division. 2021. Available online: https://www.sdg6data.org/country-or-area/Guinea-Bissau#anchor_6.1.1 (accessed on 12 October 2021).
- INASA, National Institute of Public Health. Relatório Nacional Sobre Casos de Diarreias em 2018 e 2019; Ministry of Health: Bissau, Guinea-Bissau, 2019.
- UNICEF, United Nations Children’s Fund. Cholera Factsheet Guinea-Bissau; WHO, UNICEF West and Central Africa Regional Office: Geneva, Switzerland, 2017; Available online: https://www.unicef.org/cholera/files/UNICEF-Factsheet-Guinea-Bissau-EN-FINAL.pdf (accessed on 5 July 2021).
- Bancessi, A.; Catarino, L.; José Silva, M.; Ferreira, A.; Duarte, E.; Nazareth, T. Quality Assessment of Three Types of Drinking Water Sources in Guinea-Bissau. Int. J. Environ. Res. Public Health 2020, 17, 7254. [Google Scholar] [CrossRef] [PubMed]
- Bordalo, A.A.; Savva-Bordalo, J. The quest for safe drinking water: An example from Guinea-Bissau (West Africa). Water Res. 2007, 41, 2978–2986. [Google Scholar] [CrossRef] [PubMed]
- Ferrante, M.; Signorelli, S.S.; Ferlito, S.L.; Grasso, A.; Dimartino, A.; Copat, C. Groundwater-based water wells characterization from Guinea Bissau (Western Africa): A risk evaluation for the local population. Sci. Total Environ. 2018, 619, 916–926. [Google Scholar] [CrossRef] [PubMed]
- FAO, Food and Agriculture Organization of the United Nations. World Soil Resources Report 84; Food and Agriculture Organization of the United Nations; International Society of Soil Science: Rome, Italy, 1998; Available online: https://edepot.wur.nl/493579 (accessed on 10 July 2021).
- Hijmans, R.; University of California. Second-Level Administrative Divisions, Guinea-Bissau, 2015. UC Berkeley, Museum of Vertebrate Zoology. 2015. Available online: http://purl.stanford.edu/hy559qv799. (accessed on 1 July 2021).
- Bordalo, A.A. Microbiological water quality in urban coastal beaches: The influence of water dynamics and optimization of the sampling strategy. Water Res. 2003, 37, 3233–3241. [Google Scholar] [CrossRef]
- WHO, World Health Organization. Guidelines for Drinking-Water Quality, Incorporating 1st and 2nd Addenda, Recommendations, 3rd ed.; WHO: Geneva, Switzerland, 2008; Volume 1, Available online: http://www.who.int/water_sanitation_health/dwq/fulltext.pdf?ua=1 (accessed on 5 July 2021).
- EU, European Union. Council Directive 98/83/EC of 3 November on the Quality of Water Intended for Human Consumption; European Union: Brussels, Belgium, 1998; Available online: https://eur-lex.europa.eu/legal-content/EN/TXT/PDF/?uri=CELEX:31998L0083&from=EN (accessed on 5 July 2021).
- Tebutt, T.H.Y. Principles of Water Quality Control, 5th ed.; Butter Worth-Heinemann: Oxford, UK, 1998. [Google Scholar]
- Leathwick, J.; Elith, J.; Francis, M.; Hastie, T.; Taylor, P. Variation in demersal fish species richness in the oceans surrounding New Zealand: An analysis using boosted regression trees. Mar. Ecol. Prog. Ser. 2006, 321, 267–281. [Google Scholar] [CrossRef] [Green Version]
- Elith, J.; Leathwick, J.R.; Hastie, T. A working guide to boosted regression trees. J. Anim. Ecol. 2008, 77, 802–813. [Google Scholar] [CrossRef]
- R Core Team. R: A Language and Environment for Statistical Computing; R Foundation for Statistical Computing: Vienna, Austria, 2021; Available online: https://www.R-project.org/ (accessed on 13 November 2021).
- Ridgeway, G. Generalized Boosted Regression Models. Documentation on the R Package ‘gbm’. Version 1.6-3. 2007. Available online: https://cran.r-project.org/web/packages/gbm/gbm.pdf (accessed on 13 November 2021).
- Machado, A.; Bordalo, A.A. Analysis of the bacterial community composition in acidic well water used for drinking in Guinea-Bissau, West Africa. J. Environ. Sci. 2014, 26, 1605–1614. [Google Scholar] [CrossRef]
- Colombatti, R.; Vieira, C.S.; Bassani, F.; Cristofoli, R.; Coin, A.; Bertinato, L.; Riccardi, F. Contamination of drinking water sources during the rainy season in an urban post-conflict community in Guinea Bissau: Implications for sanitation priority. Afr. J. Med. Med. Sci. 2009, 38, 155–161. [Google Scholar]
- Graham, J.P.; Polizzotto, M.L. Pit latrines and their impacts on groundwater quality: A systematic review. Environ. Health Perspect. 2013, 121, 521–530. [Google Scholar] [CrossRef] [Green Version]
- Escamilla, V.; Knappett, P.S.K.; Yunus, M.; Streatfield, P.K.; Emch, M. Influence of Latrine Proximity and Type on Tubewell Water Quality and Diarrheal Disease in Bangladesh. Ann. Assoc. Am. Geogr. 2013, 103, 299–308. [Google Scholar] [CrossRef]
- Martínez-Santos, P.; Martín-Loeches, M.; García-Castro, N.; Solera, D.; Díaz-Alcaide, S.; Montero, E.; García-Rincón, J. A survey of domestic wells and pit latrines in rural settlements of Mali: Implications of on-site sanitation on the quality of water supplies. Int. J. Hyg. Environ. Health 2017, 220, 1179–1189. [Google Scholar] [CrossRef] [PubMed]
- Sander, B.C.; Kalff, J. Factors controlling bacterial production in marine and freshwater sediments. Microb. Ecol. 1993, 26, 79–99. [Google Scholar] [CrossRef] [PubMed]
- WHO, World Health Organization. Guidelines for Drinking-Water Quality; Fourth Edition Incorporating 1st Addendum; WHO: Geneva, Switzerland, 2017; Available online: https://www.who.int/publications/i/item/9789241549950 (accessed on 8 August 2021).
- Muoio, R.; Caretti, C.; Rossi, L.; Santianni, D.; Lubello, C. Water safety plans and risk assessment: A novel procedure applied to treated water turbidity and gastrointestinal diseases. Int. J. Hyg. Environ. Health 2020, 223, 281–288. [Google Scholar] [CrossRef] [PubMed]
- Mølbak, K.; Jensen, H.; Lngholt, L.; Aaby, P. Risk Factors for Diarrheal Disease Incidence in Early Childhood: A Community Cohort Study from Guinea-Bissau. Am. J. Epidemiol. 1997, 146, 273–282. [Google Scholar] [CrossRef] [PubMed]
- Alves, S. Water Diseases: Dynamic of Malaria and Gastrointestinal Diseases in the Tropical Guinea-Bissau (West Africa). Master’s Thesis, University of Porto, Porto, Portugal, 2018. Available online: https://repositorio-aberto.up.pt/bitstream/10216/119094/2/316303.pdf (accessed on 12 October 2021).
- Shiah, F.K.; Ducklow, H.W. Bacterioplankton growth responses to temperature and chlorophyll variations in estuaries measured by thymidine: Leucine incorporation ratio. Aquatic Microb. Ecol. 1997, 13, 151–159. [Google Scholar] [CrossRef] [Green Version]
- WHO, World Health Organization. Nitrate and Nitrite in Drinking-Water. Background Document for Preparation of WHO Guidelines for Drinking-Water Quality; [WHO/HSE/AMR/07.01/16/Rev/1]; WHO: Geneva, Switzerland, 2011; Available online: https://www.who.int/water_sanitation_health/dwq/chemicals/nitratenitrite2ndadd.pdf. (accessed on 8 August 2021).
- Sadeq, M.; Moe, C.L.; Attarassi, B.; Cherkaoui, I.; Elaouad, R.; Idrissi, L. Drinking water nitrate and prevalence of methemoglobinemia among infants and children aged 1–7 years in Moroccan areas. Int. J. Hyg. Environ. Health 2008, 211, 546–554. [Google Scholar] [CrossRef]
- Carvalho, A.C.; Machado, A.; Embalo, A.R.; Bordalo, A.A. Endemic goiter and iodine deficiency status among Guinea-Bissau school-age children. Eur. J. Clin. Nutr. 2018, 72, 1576–1582. [Google Scholar] [CrossRef] [Green Version]
- Republic of Guinea-Bissau. Third National Communication: Report to the United Nations Framework Convention on Climate Change; Government of the Republic of Guinea-Bissau: Bissau, Guinea-Bissau, 2018. Available online: https://unfccc.int/sites/default/files/resource/TCN_Guinea_Bissau.pdf (accessed on 29 October 2021).
- BOAD, Banque Ouest Africaine de Développement. Enhancing Livestock Resilience to Drought in Guinea Bissau. Project Concept Note. Green Climate Fund. 2018. Available online: https://www.greenclimate.fund/sites/default/files/document/19670-enhancing-livestock-resilience-drought-guinea-bissau.pdf (accessed on 29 October 2021).
- Jalloh, A.; Roy-Macauley, H.; Sereme, P. Major agro-ecosystems of west and central Africa: Brief description, species richness, management, environmental limitations and concerns. Agric. Ecosyst. Environ. 2012, 157, 5–16. [Google Scholar] [CrossRef]
- O’Sullivan, E.; Milosevic, A. UK national clinical guidelines in paediatric dentistry: Diagnosis, prevention and management of dental erosion. Int. J. Paediatr. Dent. 2008, 18, 29–38. [Google Scholar] [CrossRef]
- West, N.X.; Hughes, J.A.; Addy, M. The effect of pH on the erosion of dentine and enamel by dietary acids in vitro. J. Oral Rehabil. 2008, 28, 860–864. [Google Scholar] [CrossRef]
- Calmano, W.; Hong, J.; Förstner, U. Binding and Mobilization of Heavy Metals in Contaminated Sediments Affected by pH and Redox Potential. Water Sci. Technol. 1993, 28, 223–235. [Google Scholar] [CrossRef] [Green Version]
- Merrel, D.S.; Camilli, A. The cadA gene of Vibrio cholerae is induced during infection and plays a role in acid tolerance. Mol. Microbiol. 1999, 34, 836–949. [Google Scholar] [CrossRef] [PubMed]
- WHO, World Health Organization. 2019. Drinking Water [Fact Sheet 391]; WHO: Geneva, Switzerland, 2017; Available online: https://www.who.int/news-room/fact-sheets/detail/drinking-water (accessed on 19 October 2021).
- Prüss, A.; Kay, D.; Fewtrell, L.; Bartram, J. Estimating the burden of disease from water, sanitation, and hygiene at a global level. Environ. Health Perspect. 2002, 110, 537–542. [Google Scholar] [CrossRef]
- Ashbolt, N.J. Microbial contamination of drinking water and disease outcomes in developing regions. Toxicology 2004, 198, 229–238. [Google Scholar] [CrossRef] [PubMed]
- Alhassan, S.; Hadwen, W.L. Challenges and Opportunities for Mainstreaming Climate Change Adaptation into WaSH Development Planning in Ghana. Int. J. Environ. Res. Public Health 2017, 14, 749. [Google Scholar] [CrossRef] [PubMed]
- Pandit, A.B.; Kumar, J.K. Clean water for developing countries. Annu. Rev. Chem. Biomol. Eng. 2015, 6, 217–246. [Google Scholar] [CrossRef] [Green Version]
- Thomas, B.; Vinka, C.; Pawan, L.; David, S. Sustainable groundwater treatment technologies for underserved rural communities in emerging economies. Sci. Total Environ. 2022, 813, 152633. [Google Scholar] [CrossRef]
- Meckes, M.C.; Rhodes, E.R. Evaluation of bacteriological indicators of disinfection for alkaline treated biosolids. J. Environ. Engin. Sci. 2004, 3, 231–236. [Google Scholar] [CrossRef]
- EPA, Environmental Protection Agency. White House Document: Environmental Regulations and Technology: Control of Pathogens and Vector Attraction in Sewage Sludge; EPA/625/R-92/013 [Revised in 2003]; US Environmental Protection Agency: Washington, DC, USA, 1995. Available online: https://www.epa.gov/sites/production/files/2015-07/documents/epa-625-r-92-013.pdf. (accessed on 19 October 2021).
- Quick, R.E.; Kimura, A.; Thevos, A.; Tembo, M.; Shamputa, I.; Hutwagner, L.; Mintz, E. Diarrhea prevention through household-level water disinfection and safe storage in Zambia. Am. J. Trop. Med. Hyg. 2002, 66, 584–589. [Google Scholar] [CrossRef]
- McGuigan, K.G.; Conroy, R.M.; Mosler, H.J.; du Preez, M.; Ubomba-Jaswa, E.; Fernandez-Ibañez, P. Solar water disinfection (SODIS): A review from bench-top to roof-top. J. Hazard. Mater. 2012, 235-236, 29–46. [Google Scholar] [CrossRef] [PubMed]
- Bancessi, A.; Pinto, M.M.F.; Duarte, E.; Catarino, L.; Nazareth, T. The antimicrobial properties of Moringa oleifera Lam. for water treatment: A systematic review. SN Appl. Sci. 2020, 2, 323. [Google Scholar] [CrossRef] [Green Version]
- Rowe, A.R. Chlorinating well water with liquid bleach was not an effective water disinfection strategy in Guinea-Bissau. Int. J. Environ. Health Res. 1998, 8, 339–340. [Google Scholar] [CrossRef]
- Sichel, C.; Blanco, J.; Malato, S.; Fernández-Ibáñez, P. Effects of experimental conditions on E. coli survival during solar photocatalytic water disinfection. J. Photochem. Photobiol. A 2007, 189, 239–246. [Google Scholar] [CrossRef]
- Huq, A.; Yunus, M.; Sohel, S.S.; Bhuiya, A.; Emch, M.; Luby, S.P.; Russek-Cohen, E.; Nair, G.B.; Sack, R.B.; Colwell, R.R. Simple sari cloth filtration of water is sustainable and continues to protect villagers from cholera in Matlab, Bangladesh. MBio 2010, 1, e00034-10. [Google Scholar] [CrossRef] [PubMed] [Green Version]
- Keogh, M.B.; Elmusharaf, K.; Borde, P.; McGuigan, K.G. Evaluation of the natural coagulant Moringa oleifera as a pretreatment for SODIS in contaminated turbid water. Sol. Energy 2017, 158, 448–454. [Google Scholar] [CrossRef]
- Tudor, H.E.A.; Gryte, C.C.; Harris, C.C. Seashells: Detoxifying Agents for Metal-Contaminated Waters. Water Air Soil Pollut. 2006, 173, 209–242. [Google Scholar] [CrossRef]
- Xu, Z.; Valeo, C.; Chu, A.; Zhao, Y. The Efficacy of Whole Oyster Shells for Removing Copper, Zinc, Chromium, and Cadmium Heavy Metal Ions from Stormwater. Sustainability 2021, 13, 4184. [Google Scholar] [CrossRef]
Figure 1.
Location of surveyed water sources across Guinea-Bissau (source of second-level administrative divisions of Guinea-Bissau: Hjmans et al. [16]).
Figure 1.
Location of surveyed water sources across Guinea-Bissau (source of second-level administrative divisions of Guinea-Bissau: Hjmans et al. [16]).

Figure 2.
Variation in the microbiological water quality parameters—(a) faecal coliforms and (b) intestinal enterococci—in the water sources across Guinea-Bissau between (1) seasons, (2) source type, and (3) method of water collection. Diamond shapes represent the mean. Circles represent outliers.
Figure 2.
Variation in the microbiological water quality parameters—(a) faecal coliforms and (b) intestinal enterococci—in the water sources across Guinea-Bissau between (1) seasons, (2) source type, and (3) method of water collection. Diamond shapes represent the mean. Circles represent outliers.

Figure 3.
Boosted regression tree (BRT) partial dependence plots showing the effect of each predictor variable on faecal coliforms (FC) of the water of wells in Guinea-Bissau: Turb—turbidity; Method—method used for water collection; Prec—precipitation; NO3—nitrate; Temp—temperature; Lat—latitude; Cu—copper. At each plot, the fitted function shows the relationship between the response variable (y−axis), and the predictor variable (x−axis), holding the values of all other variables at their mean. The relative contribution (%) of each predictor variable for the BRT model is shown in brackets.

Figure 4.
Boosted regression tree (BRT) partial dependence plots showing the effect of each predictor variable on intestinal enterococci (IE) of the water of wells in Guinea-Bissau: Turb—turbidity; Method—method used for water collection; NO3—nitrate; Lat—latitude; Prec—precipitation; Cu—copper; Temp—temperature. At each plot, the fitted function shows the relationship between the response variable (y−axis), and the predictor variable (x−axis), holding the values of all other variables at their mean. The relative contribution (%) of each predictor variable for the BRT model is shown in brackets.


Table 1.
Minimum and maximum values for water quality parameters seasonally assayed, according to water source type. In italics are the percentage of sites above the parametric values for drinking water, and the respective number of water sources surveyed. EU—European Union parametric values for drinking water [19], WHO—Word Health Organization guidelines values for drinking water [18].
| Parameter | Unit | Season | Water Source | EU | WHO | ||
|---|---|---|---|---|---|---|---|
| Wet | Dry | Well | Borehole | ||||
| Temperature | °C | 24.4–35.3 (n = 650) 99% (n = 204) | 22.9–34.5 (n = 351) 99% (n = 204) | 22.9–35.3 (n = 903) 98% (n = 216) | 25.3–32.8 (n = 98) 100% (n = 35) | - | - |
| Conductivity | µS/cm | 12.0–2550 (n = 648) 0.5% (n = 204) | 12.2–3125 (n = 350) 0.6% (n = 165) | 12.0–2550 (n = 900) 0.5% (n = 216) | 19.1–3125 (n = 98) 3% (n = 35) | 2500 | - |
| DO saturation | % | 3.4–130 (n = 595) | 7.3–97.6 (n = 347) | 3.4–107.9 (n = 847) | 12.5–130 (n = 95) | - | - |
| pH | - | 3.37–8.62 (n = 647) 85% (n = 204) | 3.36–8.33 (n = 352) 88% (n = 165) | 3.36–8.62 (n = 900) 89% (n = 216) | 3.88–8.57 (n = 99) 49% (n = 35) | ≥6.5 and ≤9.5 | - |
| Colour | PtCo | 1–1210 (n = 651) 54% (n = 204) | 1–520 (n = 351) 58% (n = 163) | 1–1210 (n = 902) 59% (n = 212) | 1–720 (n = 100) 40% (n = 35) | a | a |
| Turbidity | NTU | 0.1–407 (n = 610) 42% (n = 191) | 0.1–82 (n = 339) 25% (n = 165) | 0.1–407 (n = 856) 45% (n = 206) | 0.1–45 (n = 93) 13% (n = 31) | a | - |
| Ammonium | mg NH4/L | 0.01–20.70 (n = 650) 22% (n = 204) | 0.01–14.50 (n = 353) 12% (n = 165) | 0.01–20.70 (n = 903) 22% (n = 216) | 0.01–1.22 (n = 100) 23% (n = 35) | 0.5 | - |
| Nitrate | mg NO3/L | 0.1–450 (n = 649) 19% (n = 204) | 0.1–473 (n = 354) 14% (n = 166) | 0.1–473 (n = 903) 20% (n = 216) | 0.1–88 (n = 100) 3% (n = 35) | 50 | 50 |
| Nitrite | mg NO2/L | 0.01–4.50 (n = 649) 4% (n = 204) | 0.01–0.90 (n = 352) 1% (n = 166) | 0.01–4.50 (n = 901) 5% (n = 216) | 0.01–0.24 (n = 100) 0% (n = 35) | 0.5 | 0.2 |
| Aluminium | mg/L | 0.01–1.30 (n = 573) 37% (n = 200) | 0.01–1.42 (n = 166) 36% (n = 166) | 0.01–1.42 (n = 818) 42% (n = 215) | 0.01–0.54 (n = 90) 18% (n = 34) | 0.2 | 0.2 |
| Arsenic | µg/L | 5–250 (n = 174) 27% (n = 51) | 5–22 (n = 75) 39% (n = 44) | 5–290 (n = 241) 80% (n = 30) | 5–10 (n = 8) 25% (n = 4) | 10 | 10 |
| Chromium | µg/L | 1–300 (n = 482) 8% (n = 190) | 1–226 (n = 243) 4% (n = 136) | 1–300 (n = 673) 10% (n = 199) | 1–46 (n = 52) 0% (n = 30) | 50 | 50 |
| Copper | µg/L | 1–1000 (n = 506) 0% (n = 171) | 1–1330 (n = 243) 0% (n = 136) | 1–330 (n = 702) 0% (n = 202) | 1–629 (n = 47) 0% (n = 19) | 2000 | 2000 |
| Cyanide | µg/L | 1–250 (n = 468) 4% (n = 167) | 1–47 (n = 197) 0% (n = 103) | 1–250 (n = 631) 3% (n = 199) | 1–19 (n = 34) 0% (n = 18) | 50 | 70 |
| Iron | µg/L | 1–4770 (n = 649) 23% (n = 204) | 1–2560 (n = 352) 20% (n = 166) | 1–4770 (n = 901) 26% (n = 216) | 2–1050 (n = 100) 29% (n = 35) | 200 | - |
| Faecal coliforms | CFU/100 mL | 0–376,850 (n = 636) 84% (n = 204) | 0–30,000 (n = 354) 83% (n = 166) | 0–376,850 (n = 891) 65% (n = 216) | 0–1520 (n = 99) 66% (n = 35) | 0 | 0 |
| Intestinal enterococci | CFU/100 mL | 0–51,300 (n = 625) 83% (n = 204) | 0–91,800 (n = 354) 73% (n = 166) | 0–91,800 (n = 881) 81% (n = 216) | 0–4320 (n = 98) 54% (n = 35) | 0 | 0 |
a—Acceptable for consumption (<5 PtCo).
Table 2.
Predictive performance of the final models developed for the microbiological indicators quantified in wells in Guinea-Bissau. Final settings: bag fraction—0.5; tree complexity—1; no. folds—10; learning rate—0.001.
Table 2.
Predictive performance of the final models developed for the microbiological indicators quantified in wells in Guinea-Bissau. Final settings: bag fraction—0.5; tree complexity—1; no. folds—10; learning rate—0.001.
| Faecal Coliforms | Intestinal Enterococci | |
|---|---|---|
| Number of trees | 7650 | 6950 |
| Deviance explained (%) | 49 | 45 |
| CV correlation | 0.7 | 0.68 |
Publisher’s Note: MDPI stays neutral with regard to jurisdictional claims in published maps and institutional affiliations. |
© 2022 by the authors. Licensee MDPI, Basel, Switzerland. This article is an open access article distributed under the terms and conditions of the Creative Commons Attribution (CC BY) license (https://creativecommons.org/licenses/by/4.0/).
Share and Cite
MDPI and ACS Style
Machado, A.; Amorim, E.; Bordalo, A.A. Spatial and Seasonal Drinking Water Quality Assessment in a Sub-Saharan Country (Guinea-Bissau). Water 2022, 14, 1987. https://doi.org/10.3390/w14131987
AMA Style
Machado A, Amorim E, Bordalo AA. Spatial and Seasonal Drinking Water Quality Assessment in a Sub-Saharan Country (Guinea-Bissau). Water. 2022; 14(13):1987. https://doi.org/10.3390/w14131987
Chicago/Turabian StyleMachado, Ana, Eva Amorim, and Adriano A. Bordalo. 2022. "Spatial and Seasonal Drinking Water Quality Assessment in a Sub-Saharan Country (Guinea-Bissau)" Water 14, no. 13: 1987. https://doi.org/10.3390/w14131987
Note that from the first issue of 2016, this journal uses article numbers instead of page numbers. See further details here.