
Study on the Ablation of the Glacier Covered by Mineral Dust in Alpine Regions

1
School of Ecology and Environment, Xinjiang University, Urumchi 830046, China
2
School of Geology and Mining Engineering, Xinjiang University, Urumchi 830046, China
3
Collaborative Innovation Center of Green Mining and Ecological Restoration for Xinjiang Mineral Resources, Urumqi 830046, China
*
Author to whom correspondence should be addressed.
Water 2022, 14(13), 1982; https://doi.org/10.3390/w14131982
Submission received: 18 May 2022
/
Revised: 18 June 2022
/
Accepted: 19 June 2022
/
Published: 21 June 2022
(This article belongs to the Special Issue Water Supply Assessment Systems Developing)
Abstract
:Glaciers, known as solid reservoirs, are important water supply sources in northwest China. In this paper, mineral dust collected from a Chinese alpine mining area (Beizhan iron mine) and an ice cube (with a 225 cm2 section and a volume of 1000 mL) were employed via a delicate physical experiment to study the ablation of glaciers covered by mineral dust in alpine regions. After that, the ablation mechanism was revealed using the energy conservation theory. The main findings are as follows: (1) When the solar radiation intensity is 993 W/m2, the glacier ablation rate increases by 13.9% (from 282 to 321.2 mL/h) as the mineral dust coverage rate increases from 0% to 42.7%. (2) When the mineral dust coverage rate remains at 30%, the glacier ablation rate increases by 11.6% (from 291.8 to 325.78 mL/h) as the solar radiation intensity increases from 1007 to 1153 W/m2. (3) When the solar radiation intensity and mineral dust coverage rate remain unchanged, the ablation rate of the glacier covered by the mineral dust inversely increases with the dust particle size. The ablation rates of the particle size gradings C, B, and A (the dust particle sizes of gradings A, B, and C in 0.0375–0.075 mm, 0.075–0.125 mm, and 0.125–0.25 mm accounted for 5%:50%:45%, 30%:40%:30%, and 70%:30%:0%, respectively) were 293.4, 301.2, and 305.6 mL /h, respectively, and the corresponding ablation rates increased by 2.7% and 1.5%. (4) The smaller the average particle size of the mineral dust, the greater the contribution to the ablation rate; a 1 °C temperature increase to the glacier ablation rate is equivalent to 29.1%, 33.6%, and 40.6% increases in dust coverage for particle size classes C, B, and A. (5) The mineral dust covering the glacier surface could not only reduce the reflectivity of the glacier surface to solar radiation but could also continuously transfer the absorbed radiant energy and its own chemical energy to the glacier body, accelerating the glacier’s meltwater speed. The findings of this paper can provide the necessary theoretical basis for mineral dust control and glacier water conservation in alpine mining areas.
1. Introduction
Mineral dust dispersion in alpine mines has become an important factor in the acceleration of glacier ablation. Among the glaciers in the middle and low latitude belts, 66% are distributed in Asia; China—the country with the largest number (and scale) of glaciers in the middle and low latitude belts—accounts for 30%. According to statistics, China has a total of 46,377 glaciers, with 59,425 km2 of area and 5590 km3 of ice reserves [1]. Most of these glaciers are distributed in northwest China, such as Xinjiang, Tibet, and Qinghai provinces. Correspondingly, the Altai Mountains, Tianshan Mountains, Kunlun Mountains, Qilian Mountains, and other mountain belts in northwest China are rich in gold, silver, copper, iron, and other metal mineral resources, which are important mineral resource reserve bases in China [2,3]. In recent years, with the continuous promotion of the national “The Belt and Road” strategy and the profound transformation in the global mineral supply and demand patterns, the exploitation of mineral resources in northwest China is gradually increasing, and the exploitation range of mineral resources is rapidly extending from the middle and low mountain areas to the high mountain areas (with a large number of glaciers) [4,5,6]. In the mineral resource development process, a large amount of mineral dust is generated. These are light-absorbing impurities [7,8,9,10], which reduce the albedo of glaciers and accelerate glacier ablation (after being attached to the glacier surface) [11]. The glaciers, which are known as “solid reservoirs”, are important water supply sources in the local area. On the one hand, the meltwater produced by the accelerated ablation of glaciers will increase the flow of rivers in a short period of time and increase the risk of flooding in downstream areas. On the other hand, the accelerated rate of glacier ablation will result in the eventual disappearance of glaciers, affecting the long-term healthy development of regional societies and economies.
The ablation of glaciers(covered by mineral dust in alpine regions) needs to be further studied. Glacier mass balance is an important glaciological parameter used to characterize the accumulation and ablation of glaciers [1]. Glacier ablation is mainly influenced by many factors, such as air temperature, surface wind speed, and solar radiation energy [12]; solar radiation energy is one of the main energy sources for glacier ablation [13]. The amount of solar radiation energy absorbed by the glacier surface is determined by the albedo of the glacier surface [14]. According to Dal et al., mineral dust is one of the strongest light-absorbing impurities in visible and near-infrared spectra [15], and its attachment to the glacier surface will increase the solar radiation energy received by the glacier, resulting in more energy participating in the original glacier mass balance. Yue et al., when observing Urumqi Glacier No. 1, found that the ice–albedo varied between 0.06 and 0.44 [16]. Cuffey et al. noted that the albedo value of fresh snow on the glacier surface can reach a maximum of 0.9 or higher, while the albedo of the contaminated glacier surface can be as low as 0.1 [17], so it is particularly important to study the mineral dust cover on the glacier surface. At present, the method used to study the glacier mass balance mainly involves the combination of remote sensing technology with a physical model to construct spatiotemporal monitoring and to study large-scale glaciers [12,18,19,20,21,22,23,24]. Although great progress has been made in remote sensing technology [25,26], and the physical model of glacier ablation is constantly optimized [27,28], its accuracy is still insufficient [29,30,31,32] for small-scale glaciers near mining areas, which are greatly affected by mineral dust. Therefore, in this study, we used physically similar simulations to explore the changes in the ablation rate of the glacier surface under different mineral dust cover parameters.
In this paper, the Beizhan iron mine and its adjacent glaciers (at an altitude of 3500 m at the southern foot of Tianshan Mountain) were used as the research objects. By conducting physically similar simulation experiments and quantitatively analyzing the effect of mineral dust on the glacier ablation rate, combined with energy transfer and transformation models, the intrinsic mechanism of mineral dust accelerating glacier ablation was revealed. The results of the study can provide a basis for evaluating and predicting the reliability and security of water resources due to accelerated ablation of glaciers located in alpine and high-altitude areas and affected by mines.
2. Materials and Methods
2.1. Study Area
The Beizhan iron mine and its adjacent glacier (43°14′ N, 85°33′ E) are located on the north slope of the Boroholo Mountain, on the south side of Tianshan Mountain, only 3 km away from the main peak of Tianshan Mountain, at an altitude of 3160–4575 m, belonging to the middle–high mountain area, as shown in Figure 1A. There are permanent mountain glaciers to the south and west of the mine, and the closest distance from the glacier to the mine edge is 1.3 km. The study area is in the alpine region of the continent with a cold climate characterized by long winters (October to April of the following year), short summers (June), and insignificant spring and autumn seasons (meteorological data according to the local weather monitoring centers). The climate in this area is variable, with a large temperature difference (20–30 °C) between day and night, and very frequent rainfall and snowfall. The Xiaoxigou River and the Xiaodong River in the study area are seasonal rivers, and Figure 1B shows the accelerated glacier ablation by mineral dust.
2.2. Ice Cube Preparation
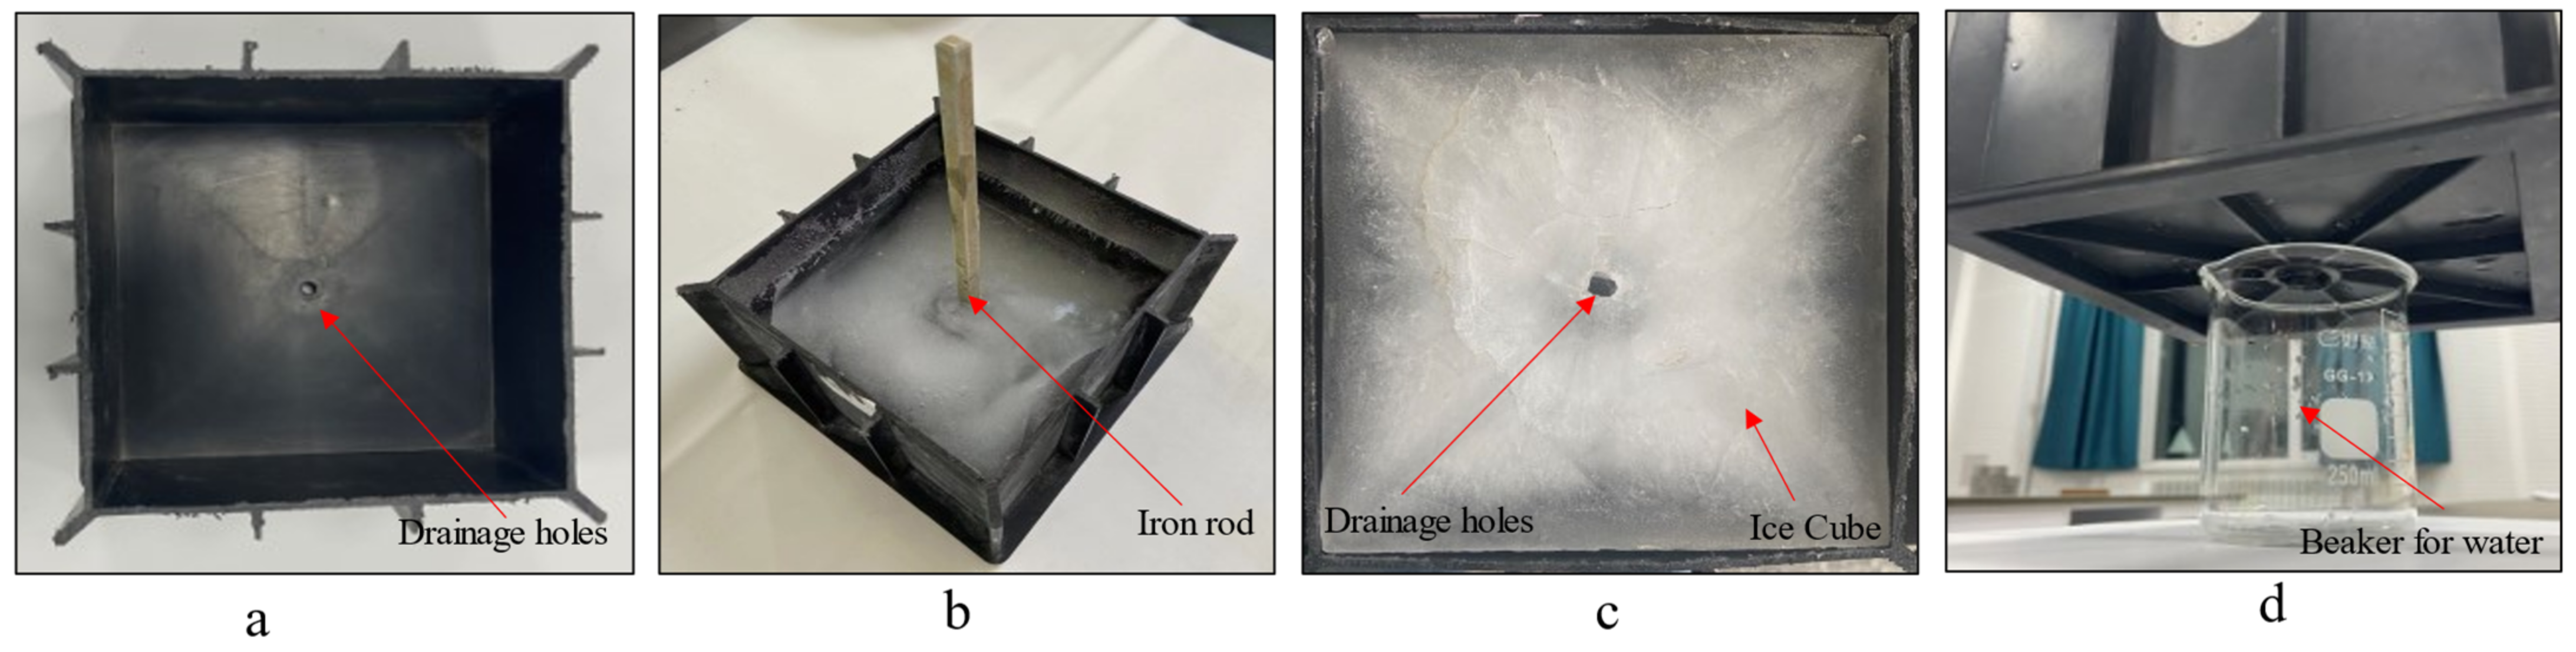
According to the principle of physically similar simulation experiments, the glaciers were simulated by using mechanism ice cubes. Firstly, a mold of the same size of 15 × 15 × 10 cm was used, and a drainage hole was left in the center of the mold, as shown in Figure 2a; the drainage hole facilitated the timely discharge of meltwater when the ice melted. Secondly, a thin iron rod was used through the lower center of the mold (drainage hole), as shown in Figure 2b, and the contact parts of the iron rod and the mold were sealed well. Then, 1000 mL of distilled water was injected into the freezer for low-temperature freezing. Finally, the thin iron rod was pulled out after freezing, as shown in Figure 2c, which was the prepared ice cube. A beaker (receiving water) was placed in the center below the mold, as shown in Figure 2d, to facilitate the statistics of the melting water amount of ice cubes during the experiment.
2.3. Mineral Dust Particle Size Gradation and Coverage
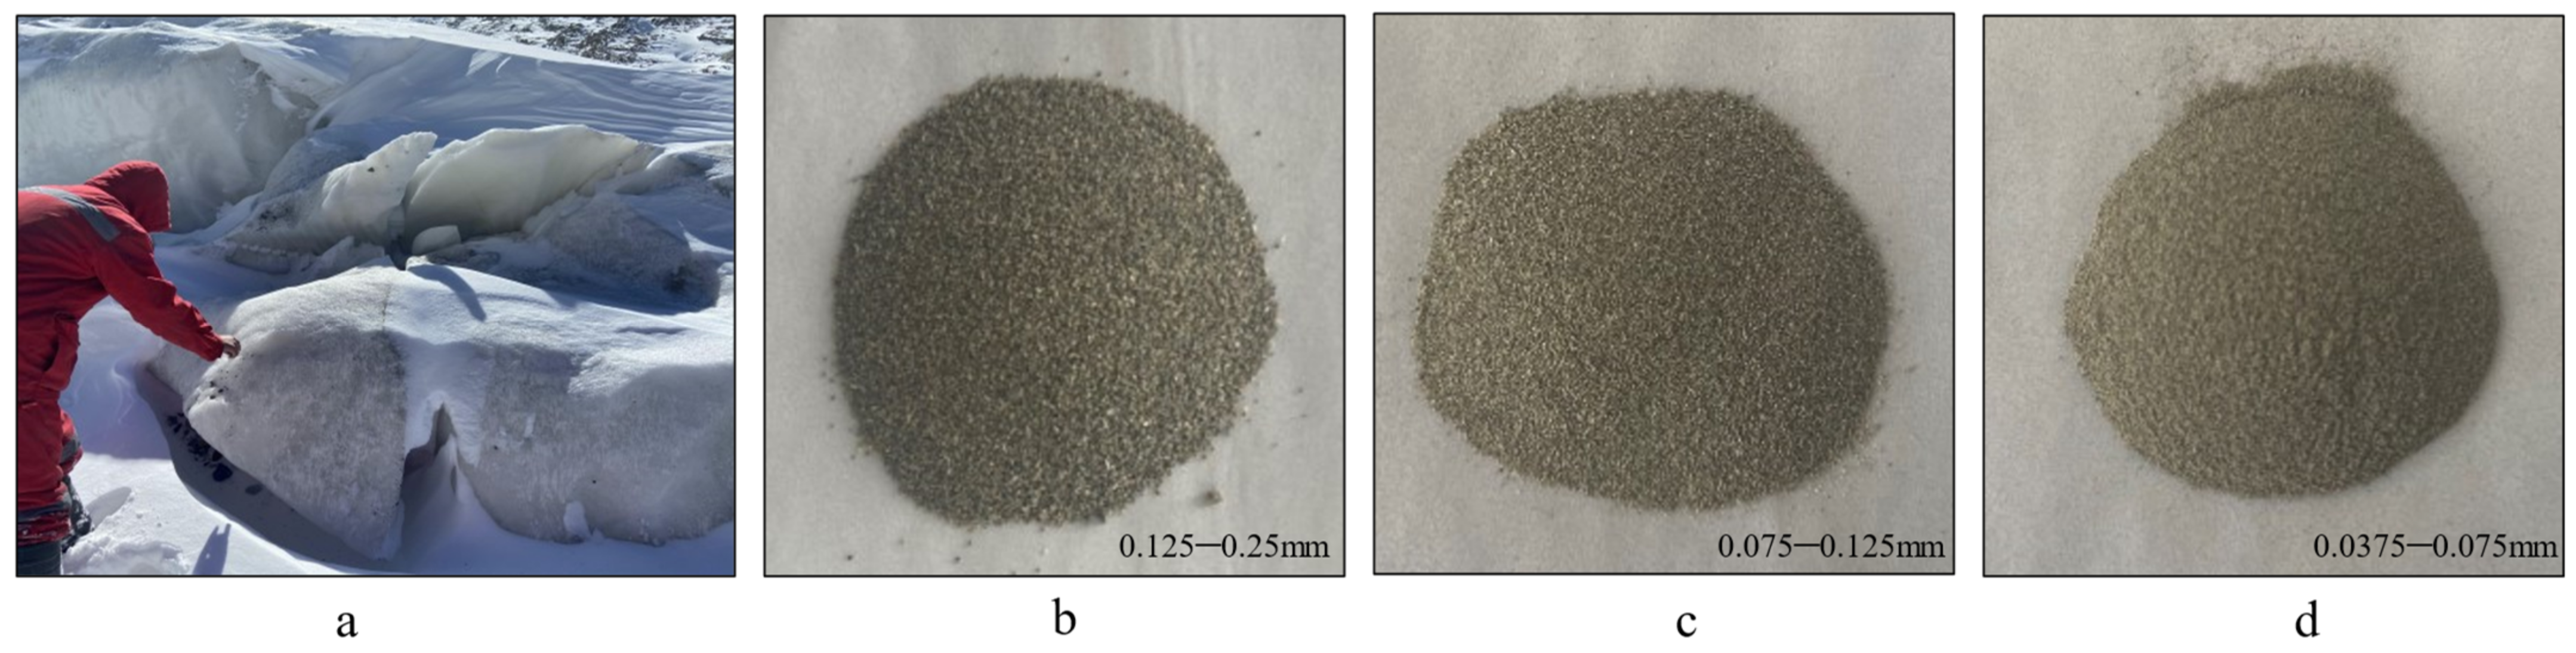
The mineral dust used in this experiment was obtained in situ from the surface of the glacier in the study area, as shown in Figure 3a. The multi-point sampling method was adopted to conduct an outdoor operation in October 2021 at the glacier adjacent to the Beizhan iron mine. A geological hammer and clean shovel were used to obtain the required samples (each point sampling area of 50 × 50 cm), taking the surface glacier and its overlying snow layer. A total of 10 groups of samples were obtained, and the acquired samples were placed in the cryogenic sample box. After the original samples were delivered to the laboratory, the specimens were taken out and left to stand until the snow and ice melted into water. The excess water was then poured out and dried in a dryer (Electric Blast and Constant Temperature Drying Oven of 101-2ES, Beijing Ever Bright Medical Treatment Instrment Co., LTD, Beijing, China) for 24 h; the dried specimens were then pretreated using a standard sieve to remove mineral particles larger than 0.25 mm because such particles are derived from the disintegration of rocks near the glacier and not from the mine area dispersed by the wind. Standard sieves with apertures of 0.125, 0.075, and 0.0375 mm were used for sieving. Mineral dust particles smaller than 0.0375 mm were too minute and were eliminated from consideration of the operability of the experiment and the effect on the final results. The mineral dust particles of different particle sizes are shown in Figure 3b–d; according to the distributions of different particle sizes during mineral dust sampling, the mineral dust particle size gradation was divided into A, B, and C. The mineral dust particle size gradation is shown in Table 1.
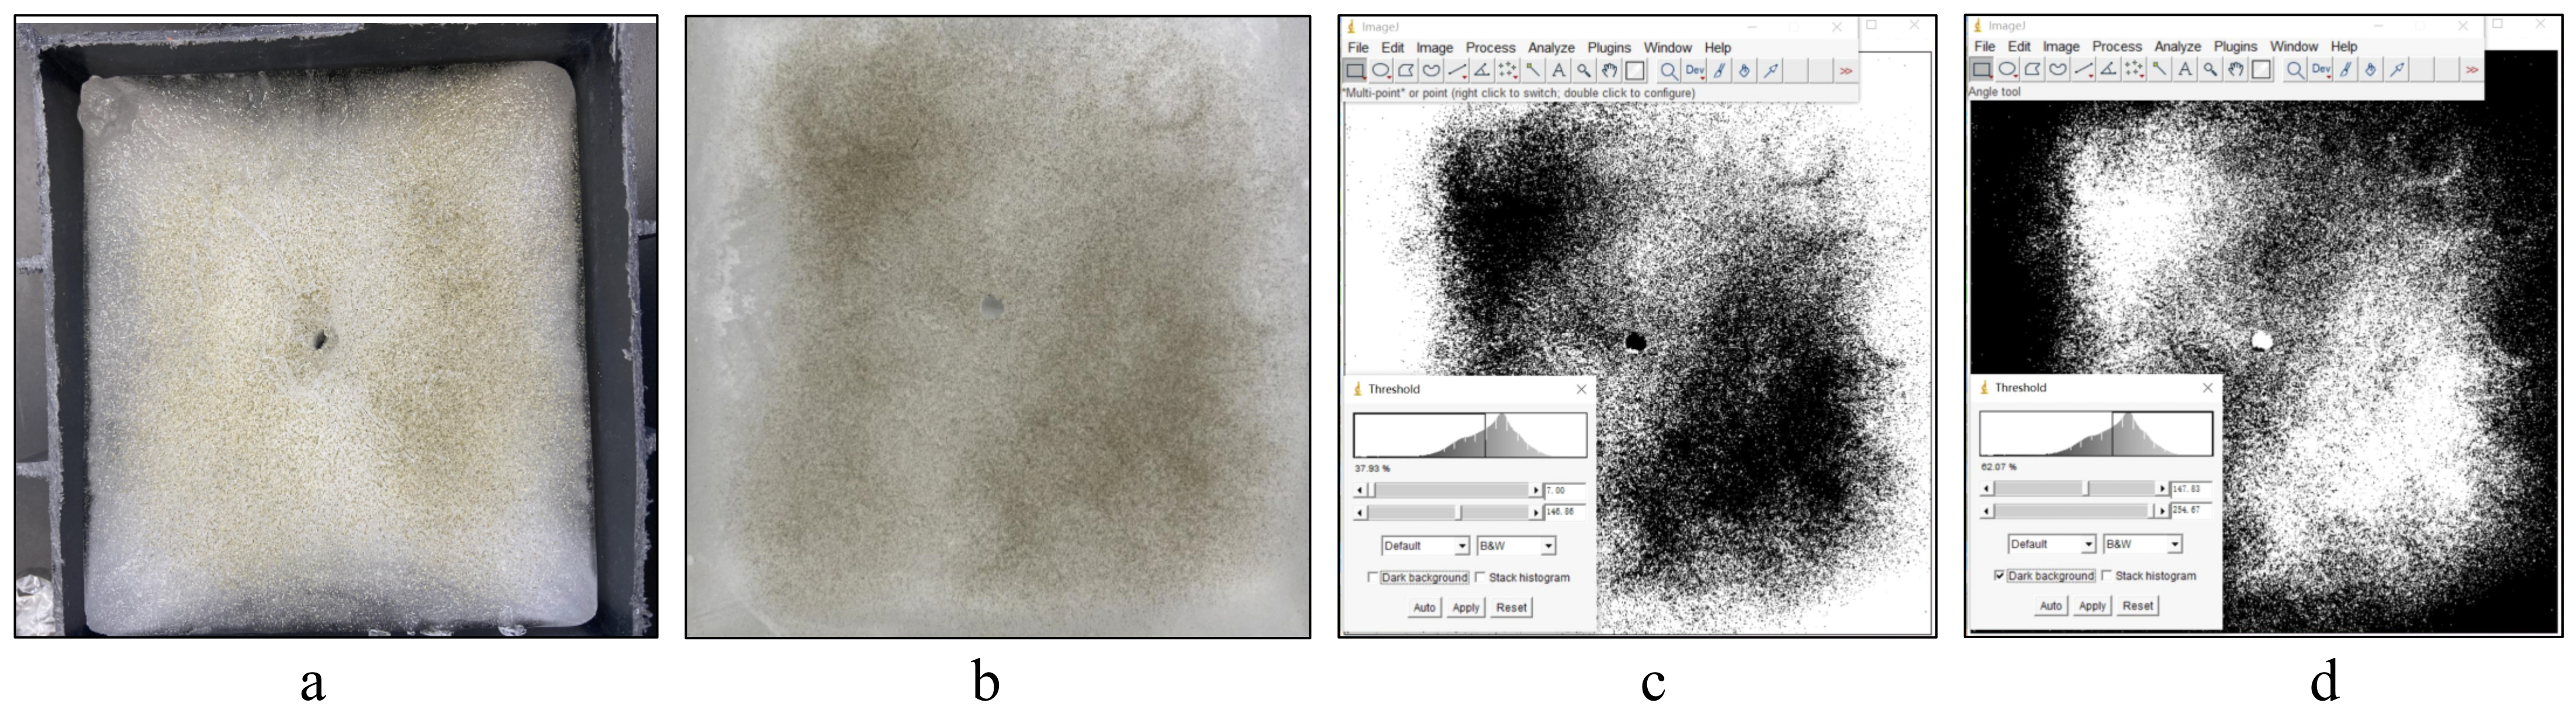
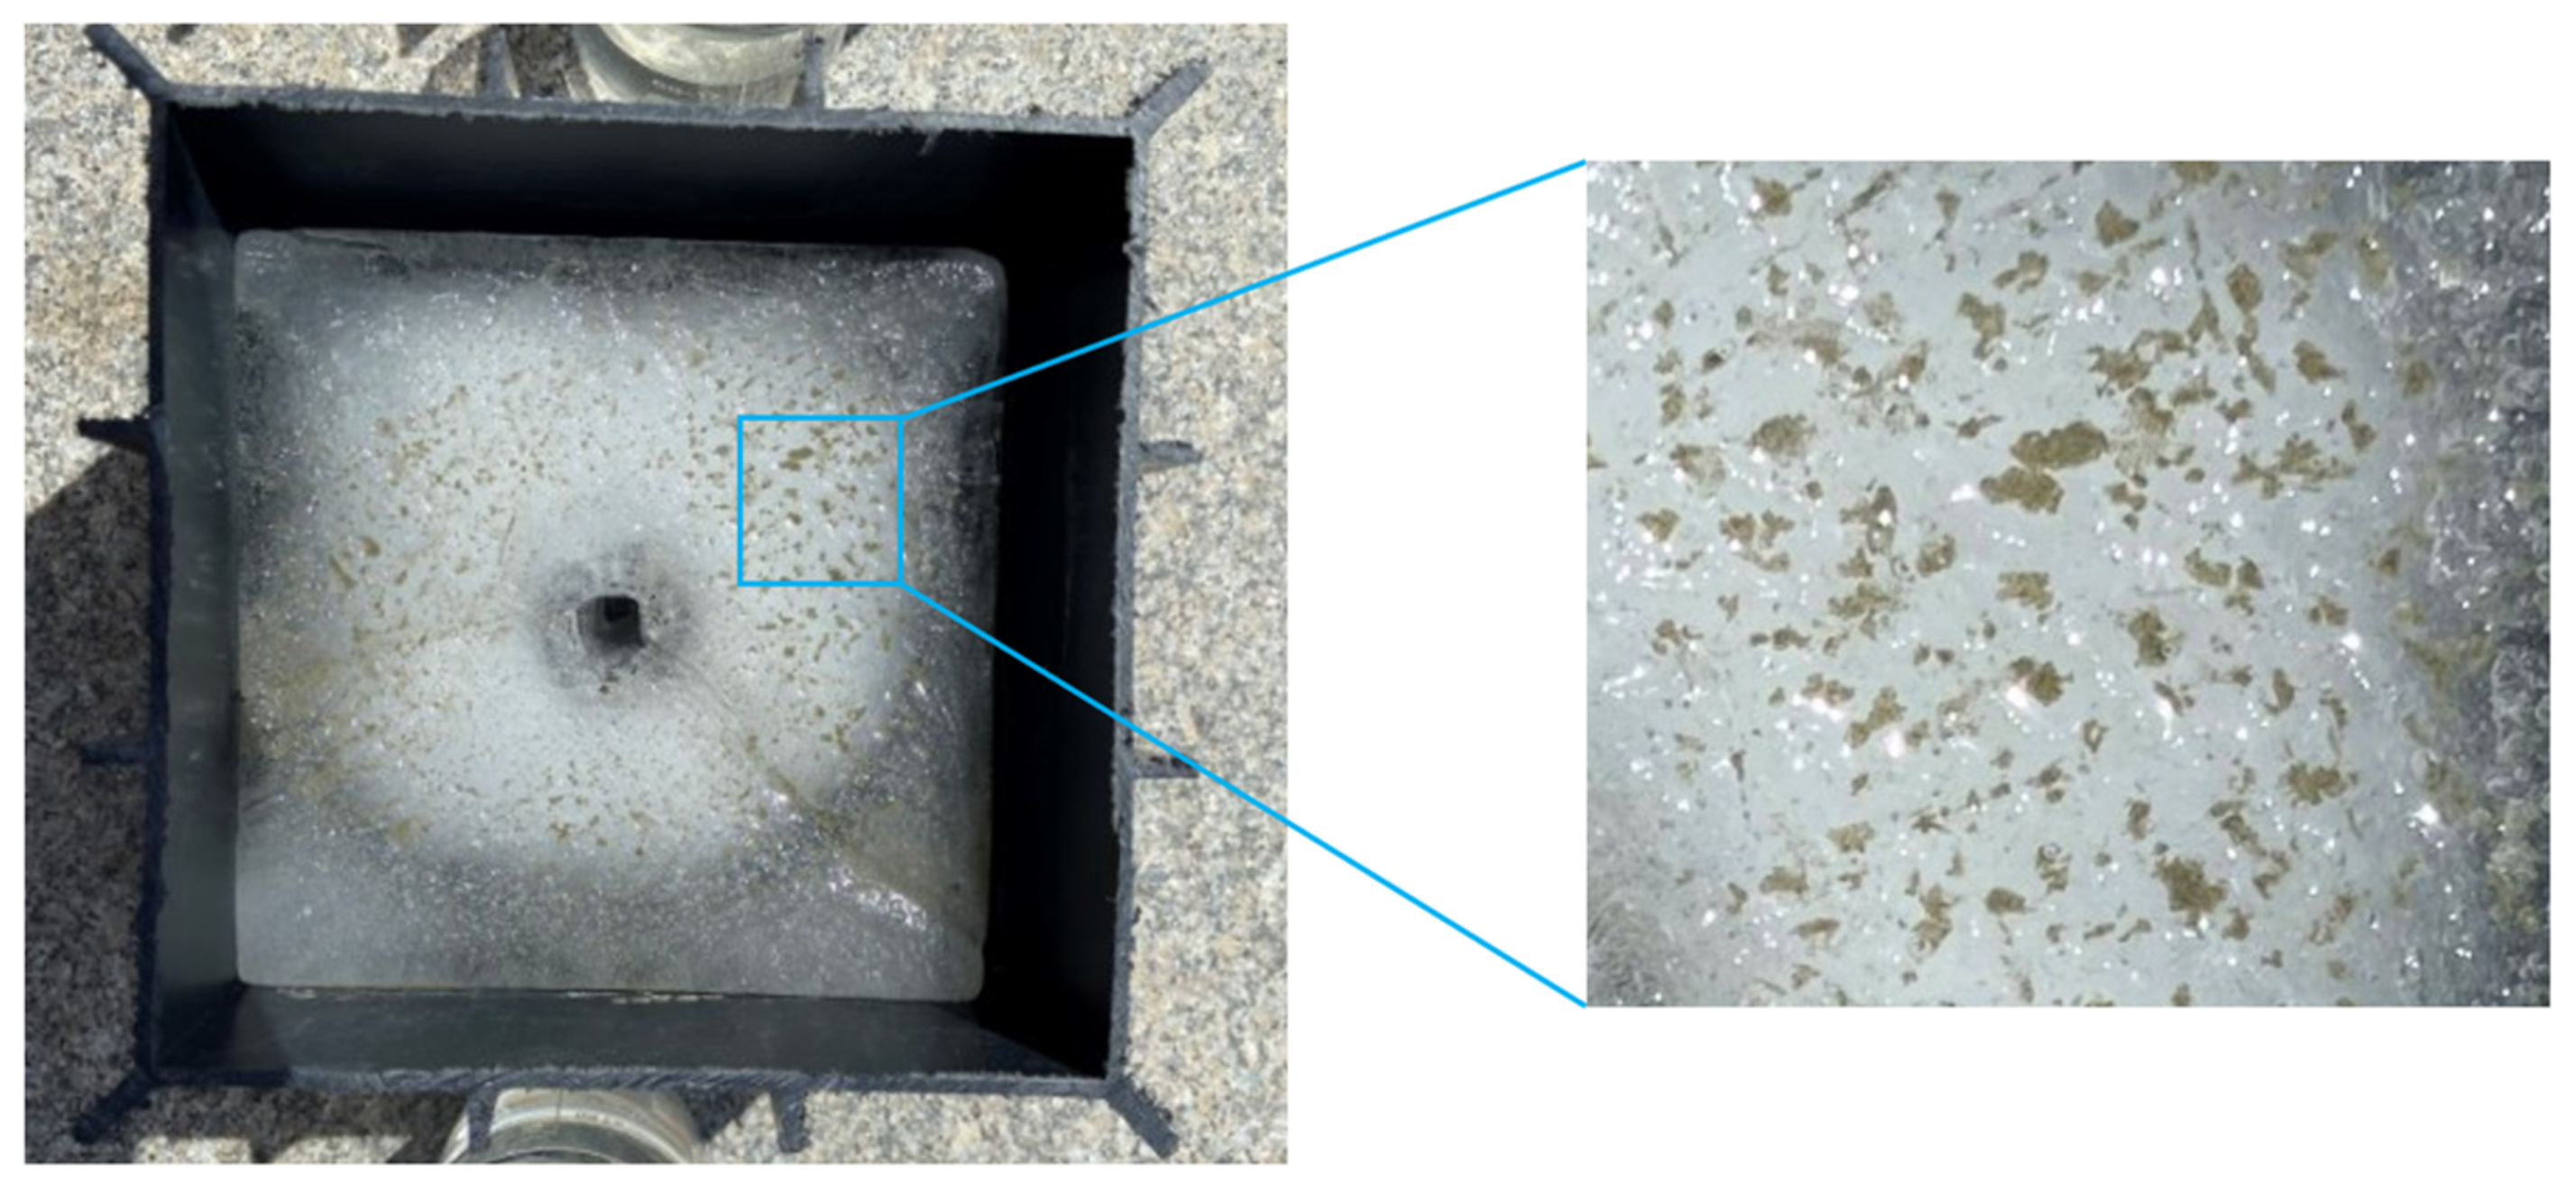
The mineral dust coverage rate of the ice surface was calculated using ImageJ (1.8.0_112) image processing software. Since the mineral dust was tiny and the amount used in arranging the mineral dust was also very tiny, it was difficult to precisely control its mass or volume, so its mass and volume were not measured. Regarding the actual mineral dust samples collected in the field, the mineral dust coverage rate on the glacier surface was less than 50%, so the mineral dust coverage rate was also controlled between 0 and 50% in this experiment. The mineral dust particles were arranged on a sieve of a suitable aperture size, and the sieve was gently shaken to allow the mineral dust particles to fall naturally on the surface of the prepared ice cube due to gravity, after which the ice cube with the mineral dust arrangement was photographed in high-resolution at close range, as shown in Figure 4a. The photos were imported into ImageJ image processing software. Firstly, the images were pre-processed to determine the calculated area, as shown in Figure 4b; after which, the software automatically identified the darker mineral dust particles by adjusting the color scale and calculating the mineral dust coverage rate on the ice surface, as shown in Figure 4c. The inaccurate images could be manually calibrated. The dark background adjustment function allows a comparison with the identified image, reducing the errors in the mineral dust coverage rate due to visual errors, as shown in Figure 4d. Using ImageJ could not only quickly and accurately determine the size of coverage, but it could also solve the problem of small mineral dust particles that are difficult to accurately count.
2.4. Experimental Protocol
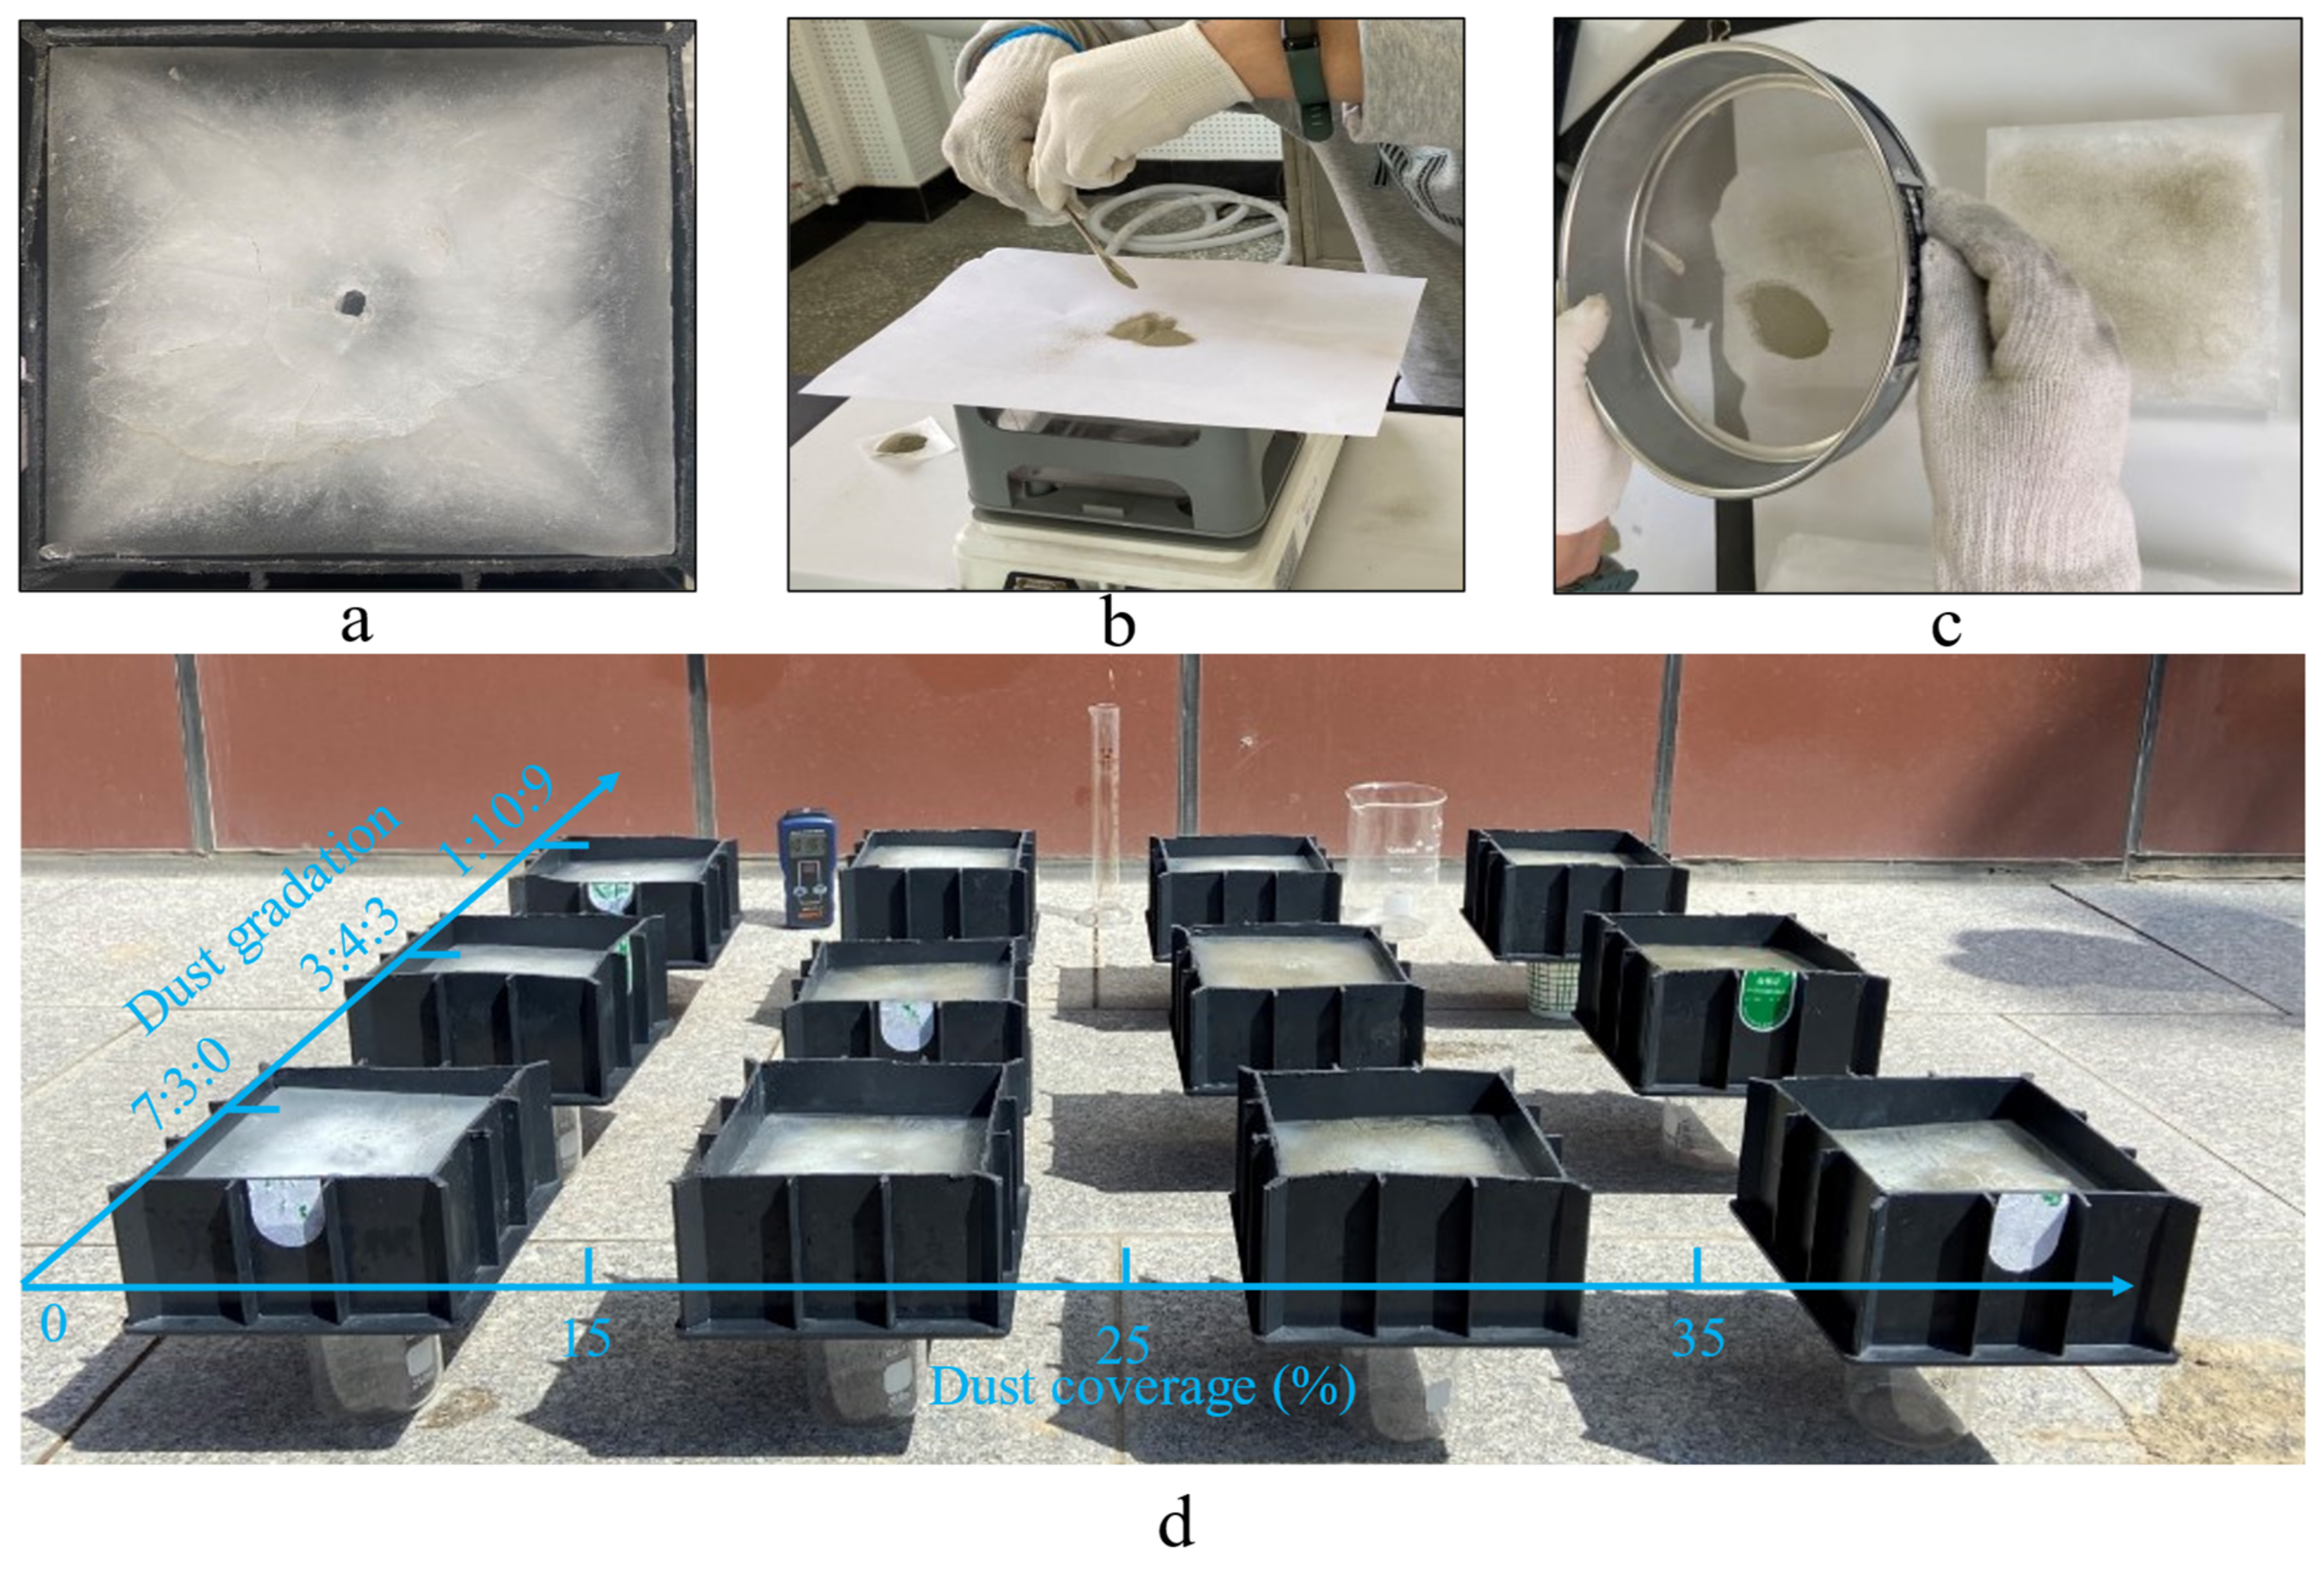
To explore the relationship between mineral dust and the glacier ablation rate under different weather conditions, and the mineral dust coverage rate at the same mineral dust particle size gradation—two experiments were conducted for each of the three dust particle size gradations (for a total of six groups of experiments). Six ice cubes were used in each group of experiments, five of which were arranged with mineral dust (the coverage rate was evenly distributed between 0 and 50%, as far as possible), leaving one without mineral dust cover as a control experiment, as shown in Table 2 for A1, A2, B1, B2, C1, and C2. To explore the relationship between mineral dust and the glacier ablation rate under different particle size gradations and mineral dust cover conditions at the same meteorological conditions, twelve ice cubes were used in one experiment, and each mineral dust particle size gradation was set with four kinds of coverage rates (the coverage rates were evenly distributed between 0 and 50%, as far as possible), as shown in Table 2, A3, B3, and C3. All experiments were carried out outdoors, without wind or sunlight shade; solar radiation value, air temperature, and other meteorological parameters were recorded during the experiment, as shown in Table 2. The experiment was immediately stopped when the bottom of the ice cube was about to melt at the bottom of the experiment.
The operation process of the whole experiment was shown in Figure 5.
3. Results
3.1. Relationship between Mineral Dust Coverage Rate, Radiation Intensity, and Ablation Rate
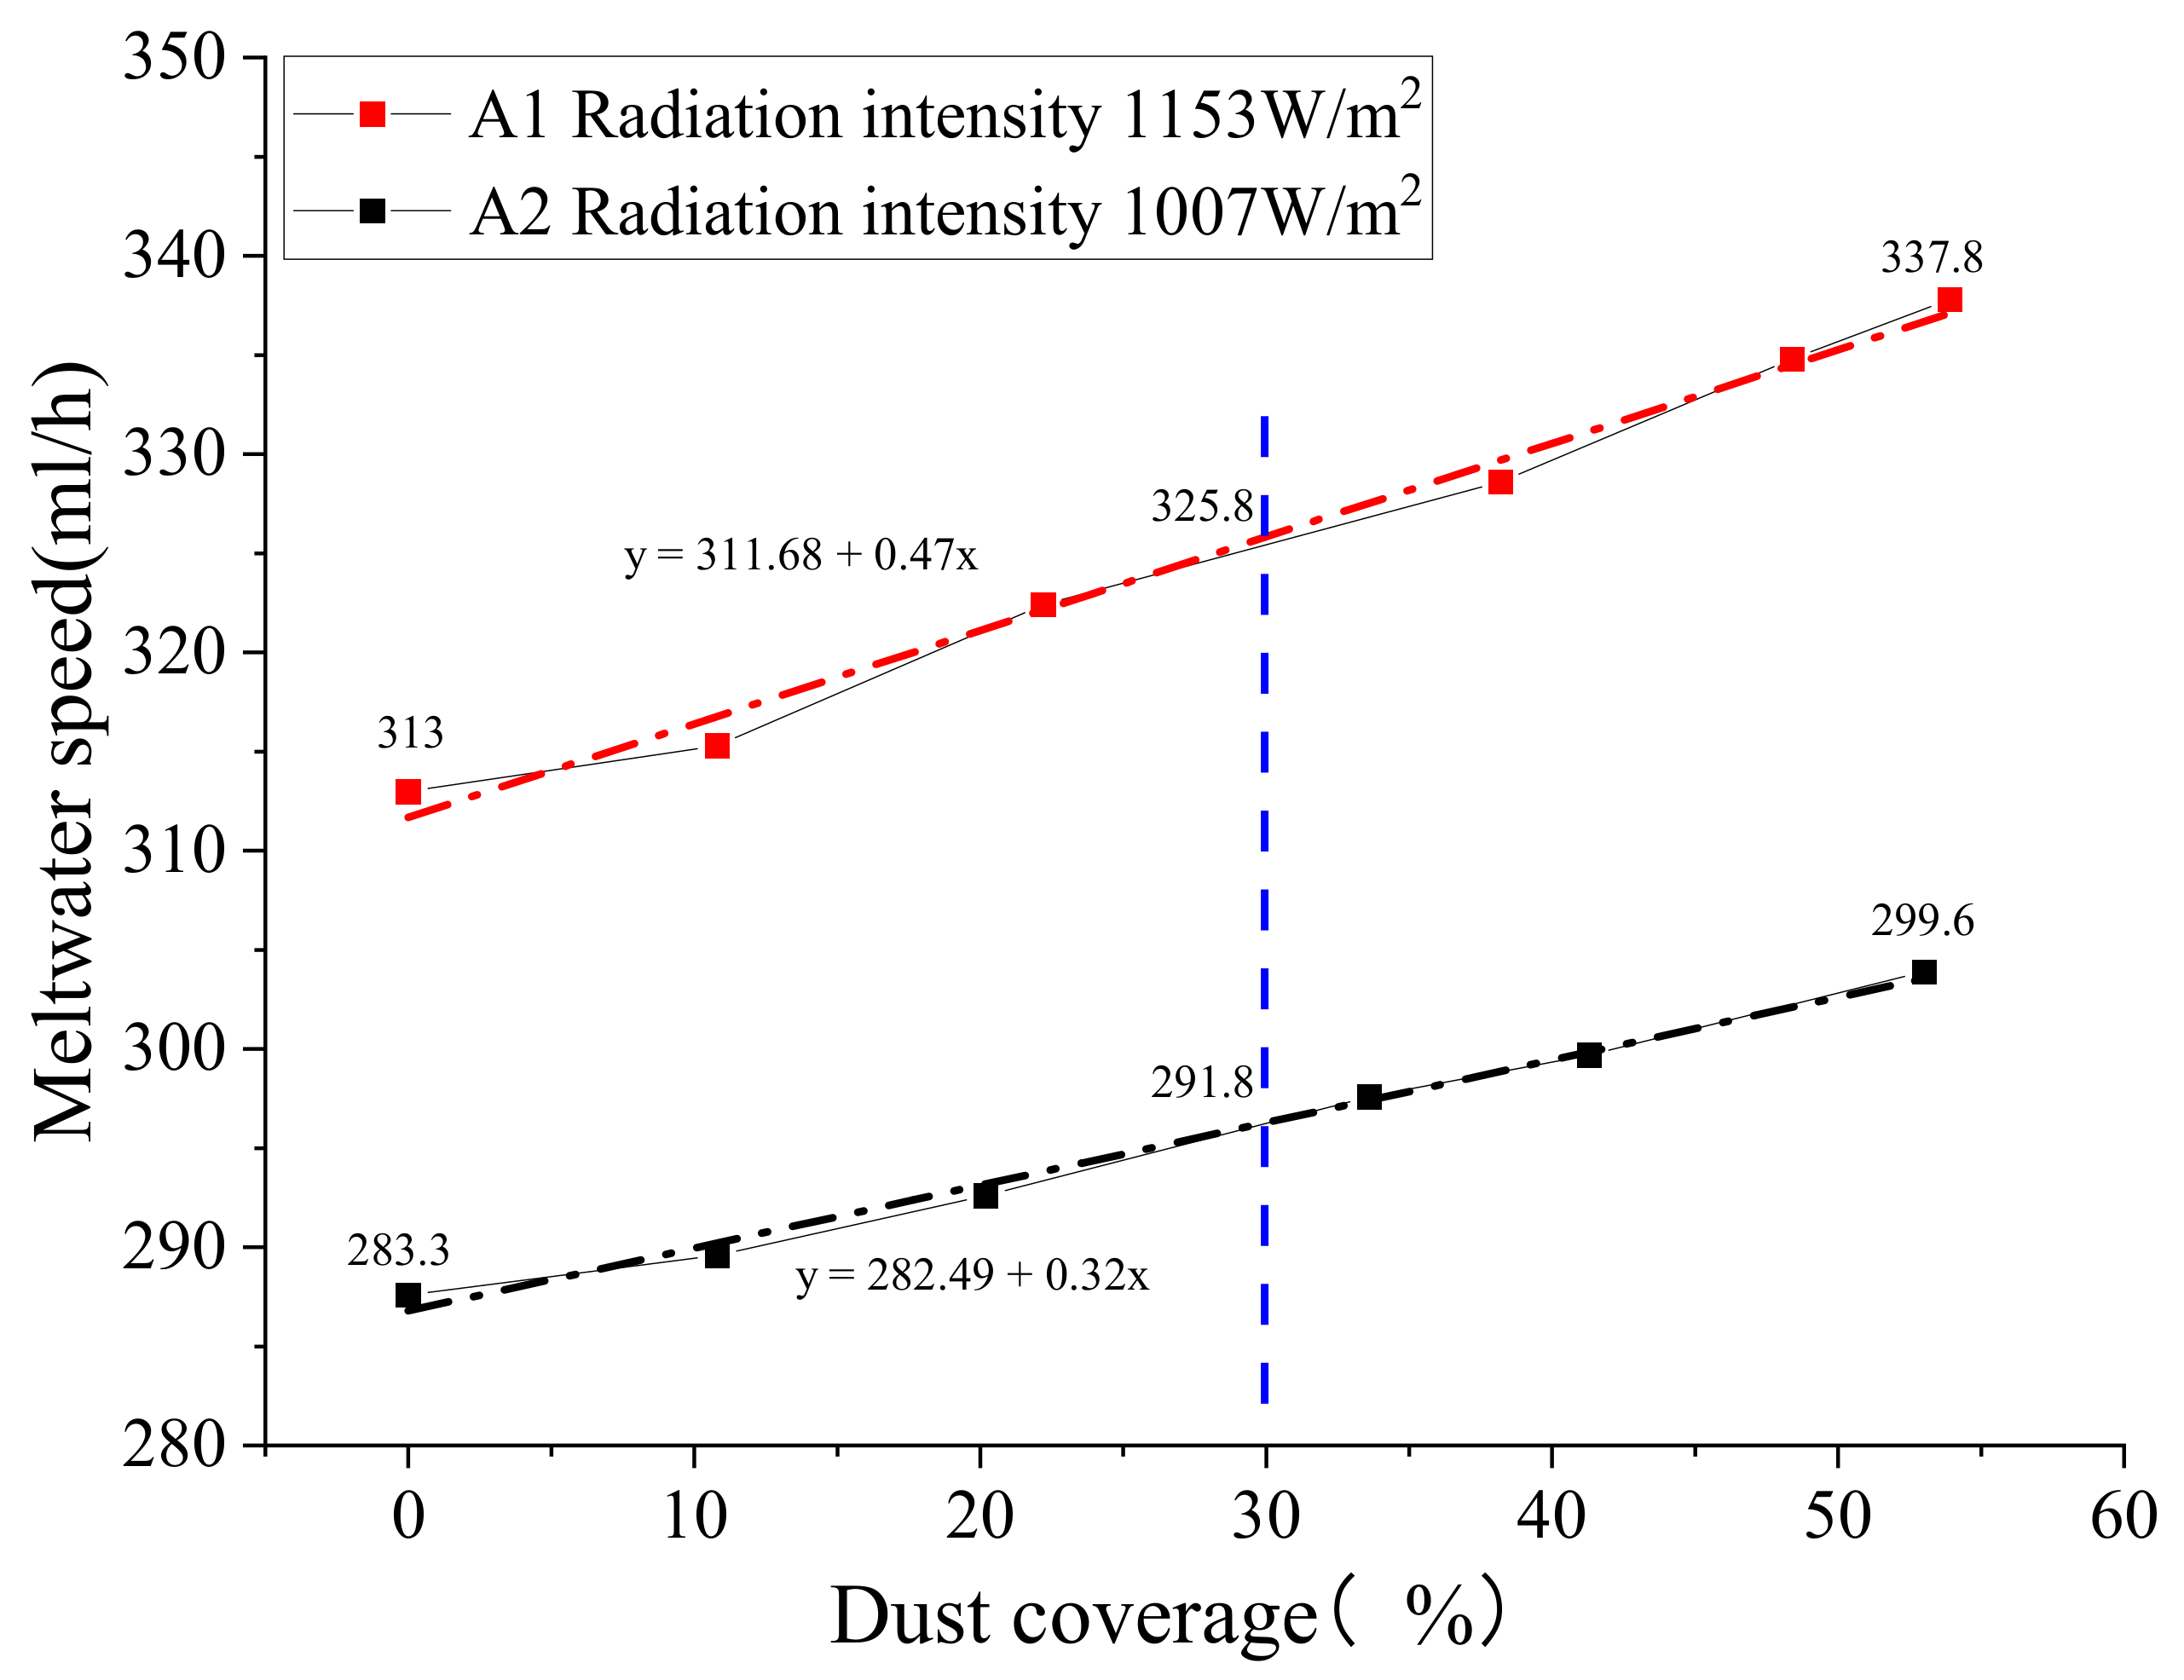
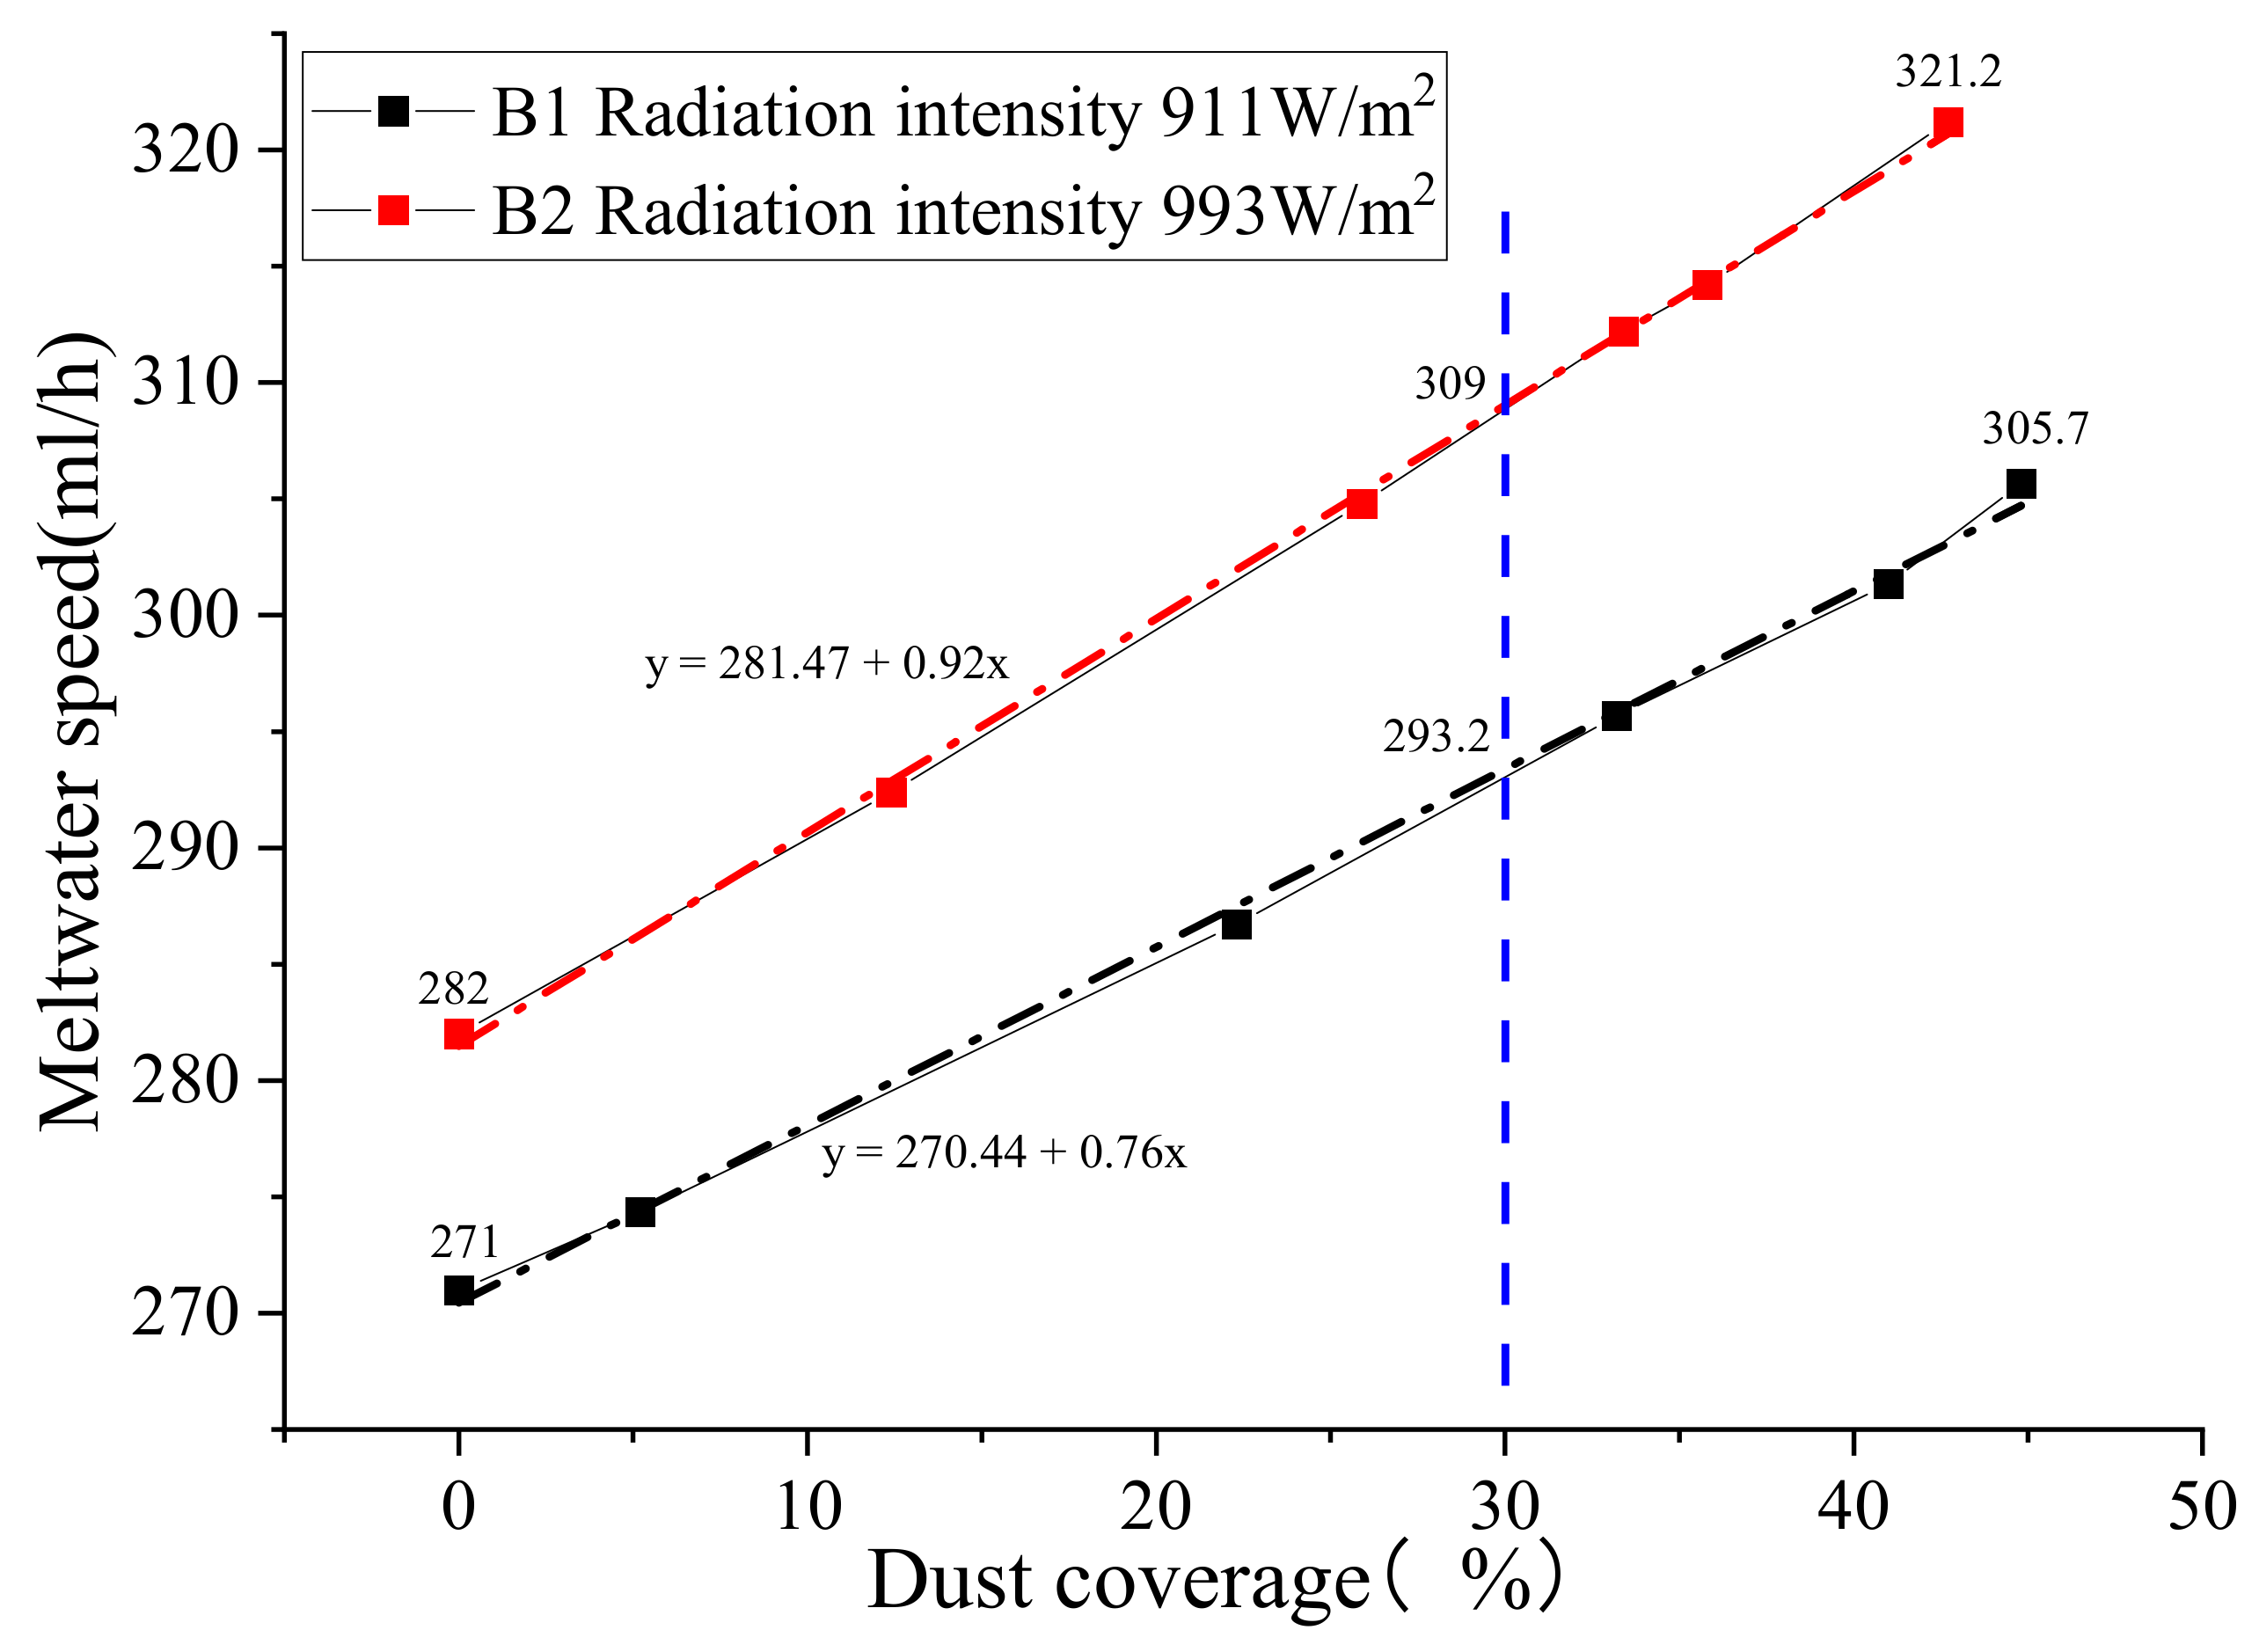
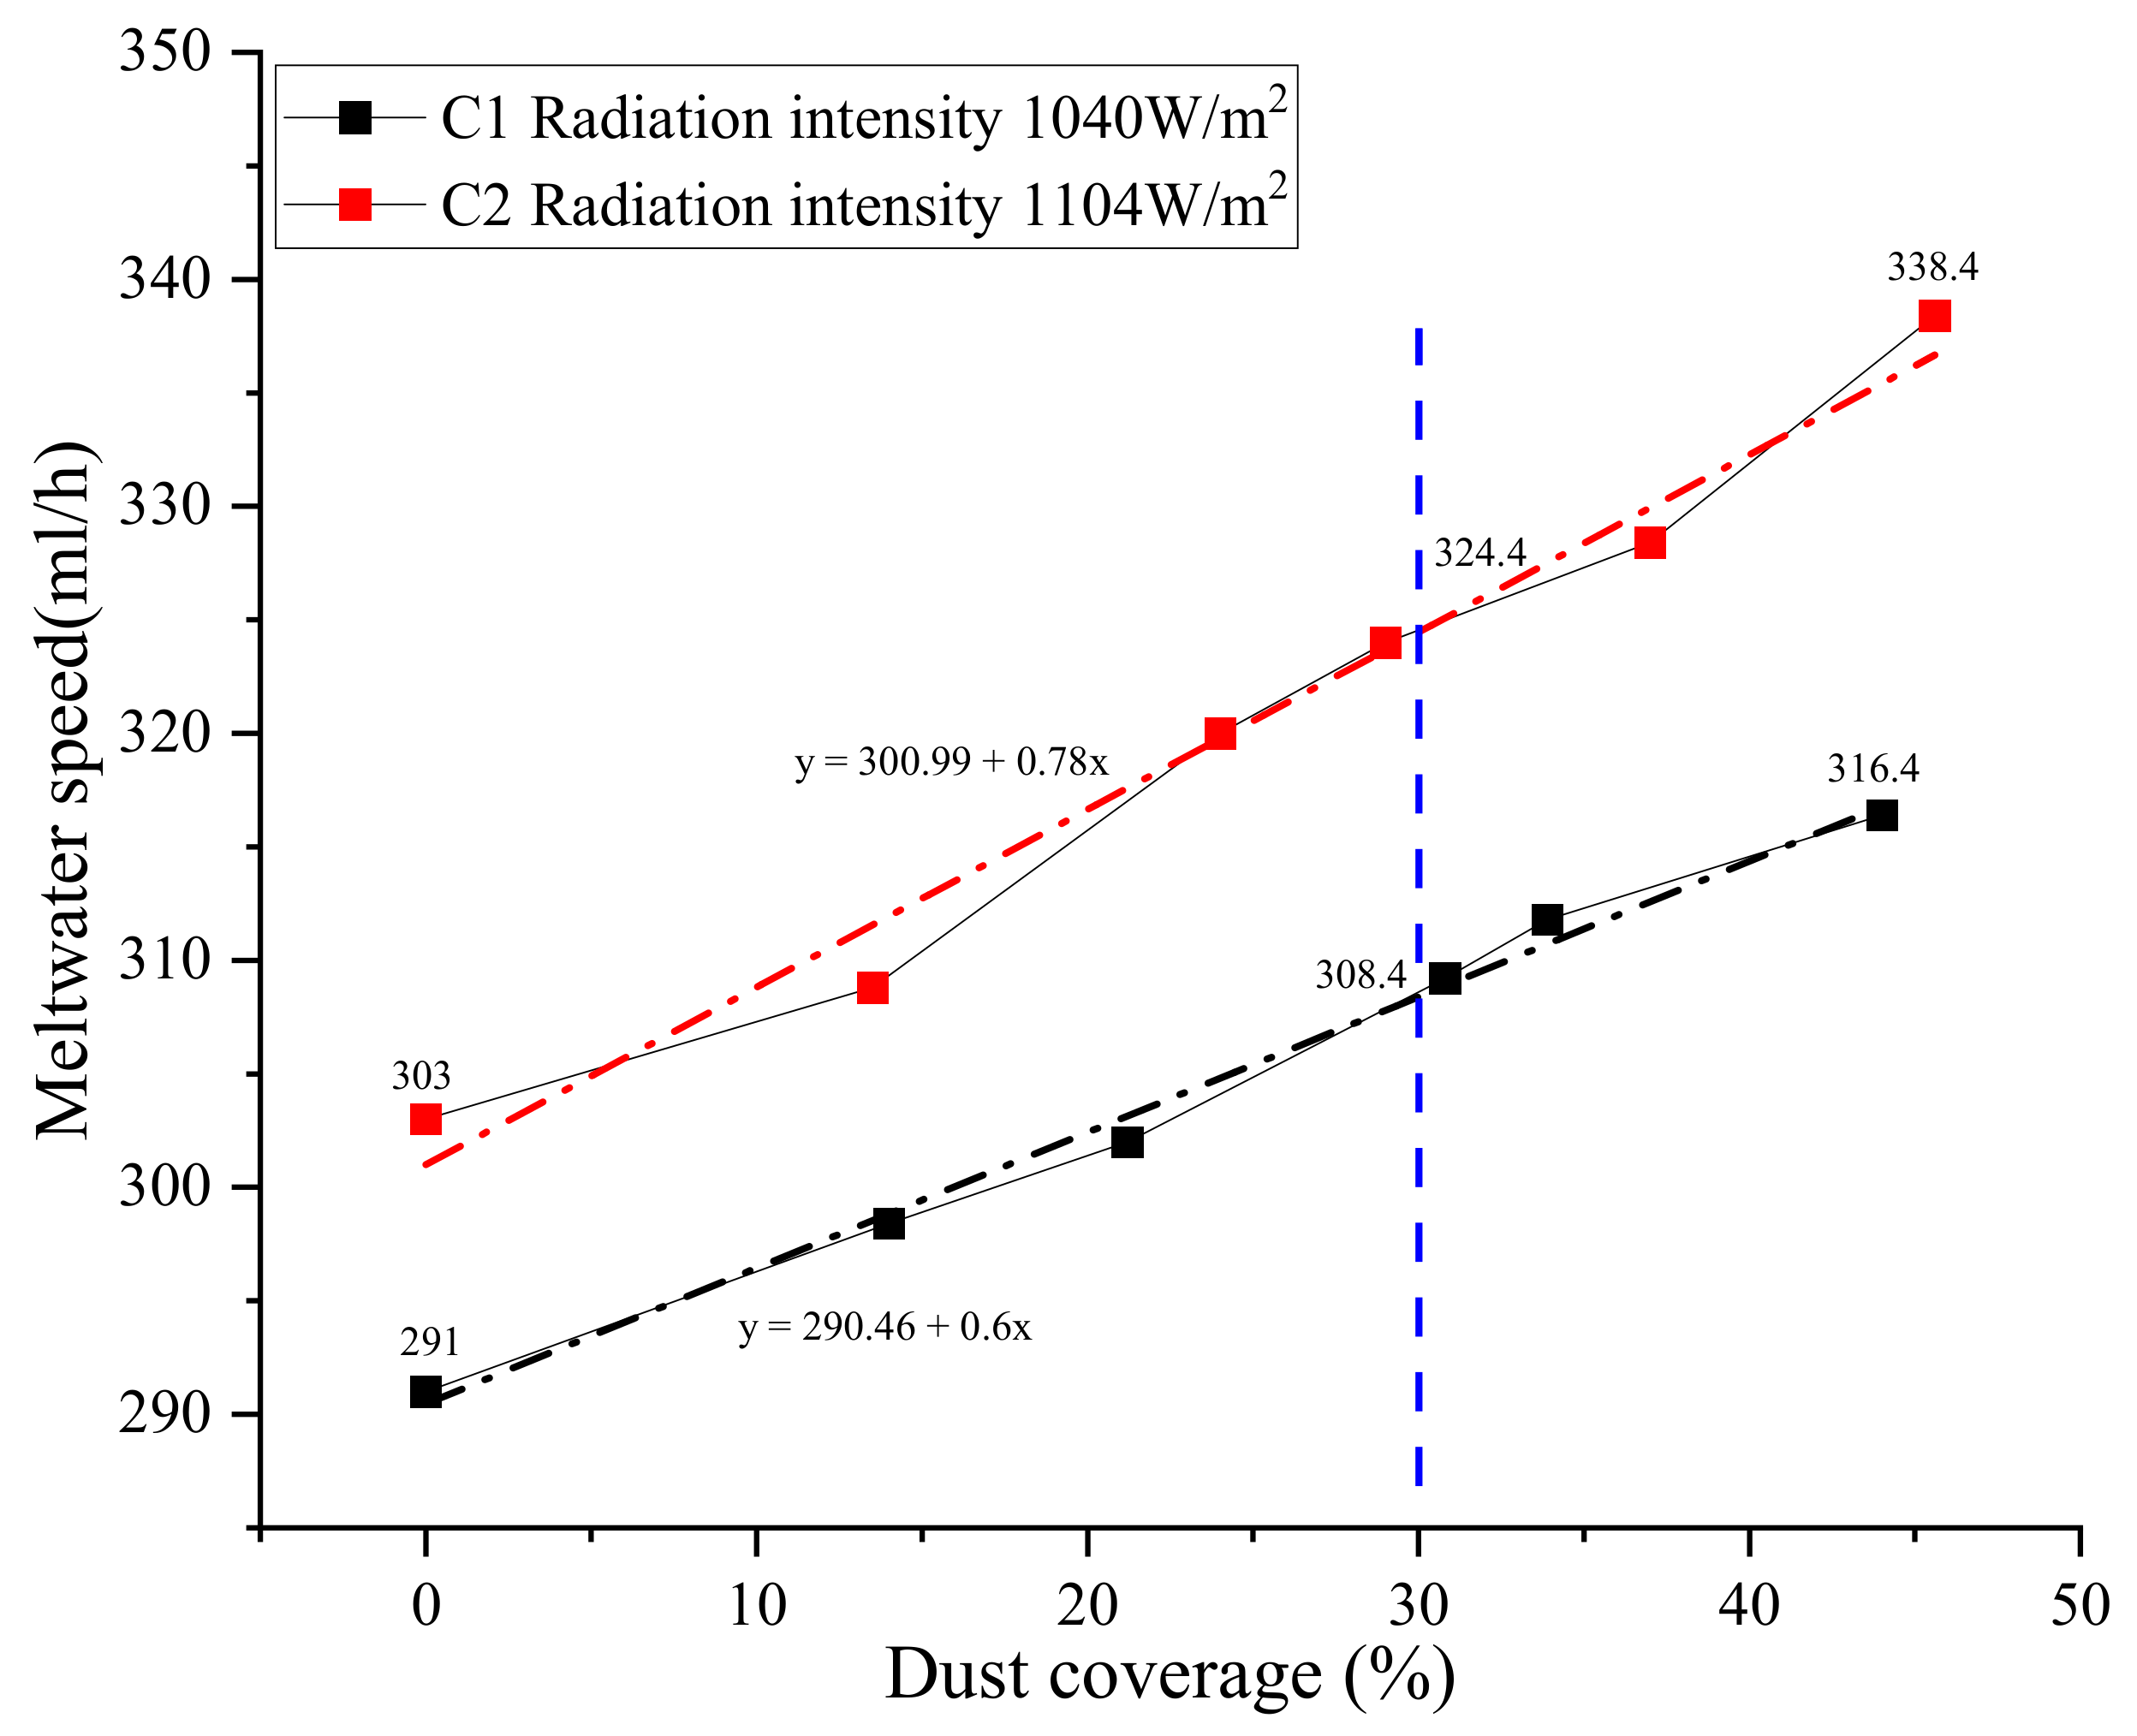
To study the effect of dust on the glacier ablation rate under different coverage rates and different radiation intensities, the meltwater speed of mineral dust with three particle size gradations under different coverage rates and radiation intensities were counted, as shown in Figure 6, Figure 7 and Figure 8.
From Figure 6, Figure 7 and Figure 8, it can be seen that under the same radiation intensity and mineral dust particle size gradation conditions, the meltwater speed of the ice cube increased with the increase of the mineral dust coverage rate. In the six experiments, the higher the mineral dust coverage rate, the faster the ablation rate. In Group A1, when the mineral dust coverage rate increased from 0% to 53.9%, the ice meltwater speed increased from 313 to 337.8 mL/h (increasing by 7.9%). In Group B2, when the mineral dust coverage rate increased from 0% to 42.7%, the ice meltwater speed increased from 282 to 321.2 mL/h (increasing by 13.9%). In Group C2, when the mineral dust coverage rate increased from 0% to 45.6%, the ice meltwater speed increased from 303 to 338.4 mL/h (increasing by 11.7%). This is because most of the mineral dust from the mining area is highly light-absorbing particles. With the increase of the coverage rate, the energy injected by the mineral dust on the ice surface into the system also increases, increasing the ablation rate.
From Figure 6, Figure 7 and Figure 8, it can be seen that under the same conditions of mineral dust particle size gradation and the mineral dust coverage rate, the higher the value of radiation intensity, the higher the rate of glacier ablation. Taking the coverage rate of 30%, as an example, in group A, the radiation intensity was 1153 and 1007 W/m2, respectively, and the corresponding meltwater speed was 325.8 and 291.8 mL/h, respectively, which increased by 11.7%. In group B, the radiation intensity was 993 and 911 W/m2, respectively, and the corresponding meltwater speed was 309 and 293.2 mL/h, respectively, which increased by 5.4%. In group C, the radiation intensity was 1104 and 1040 W/m2, respectively, and the corresponding meltwater speed was 324.4 and 308.4 mL/h, respectively, which increased by 5.2%. This is because the radiation intensity can directly affect the amount of energy available for mineral dust absorption; the greater the radiation intensity, the higher the ablation rate naturally increases.
From the above two conclusions, we can learn that the glacier ablation rate is mainly determined by how much energy (E) is absorbed by the mineral dust; the general expression of how much energy is absorbed by the mineral dust is:
E = K·S
S represents the area covered by mineral dust; K represents the physical properties of mineral dust, including the material composition of mineral dust, particle size, etc.
3.2. Relationship between Mineral Dust Particle Size Gradation, Air Temperature, and Ablation Rate
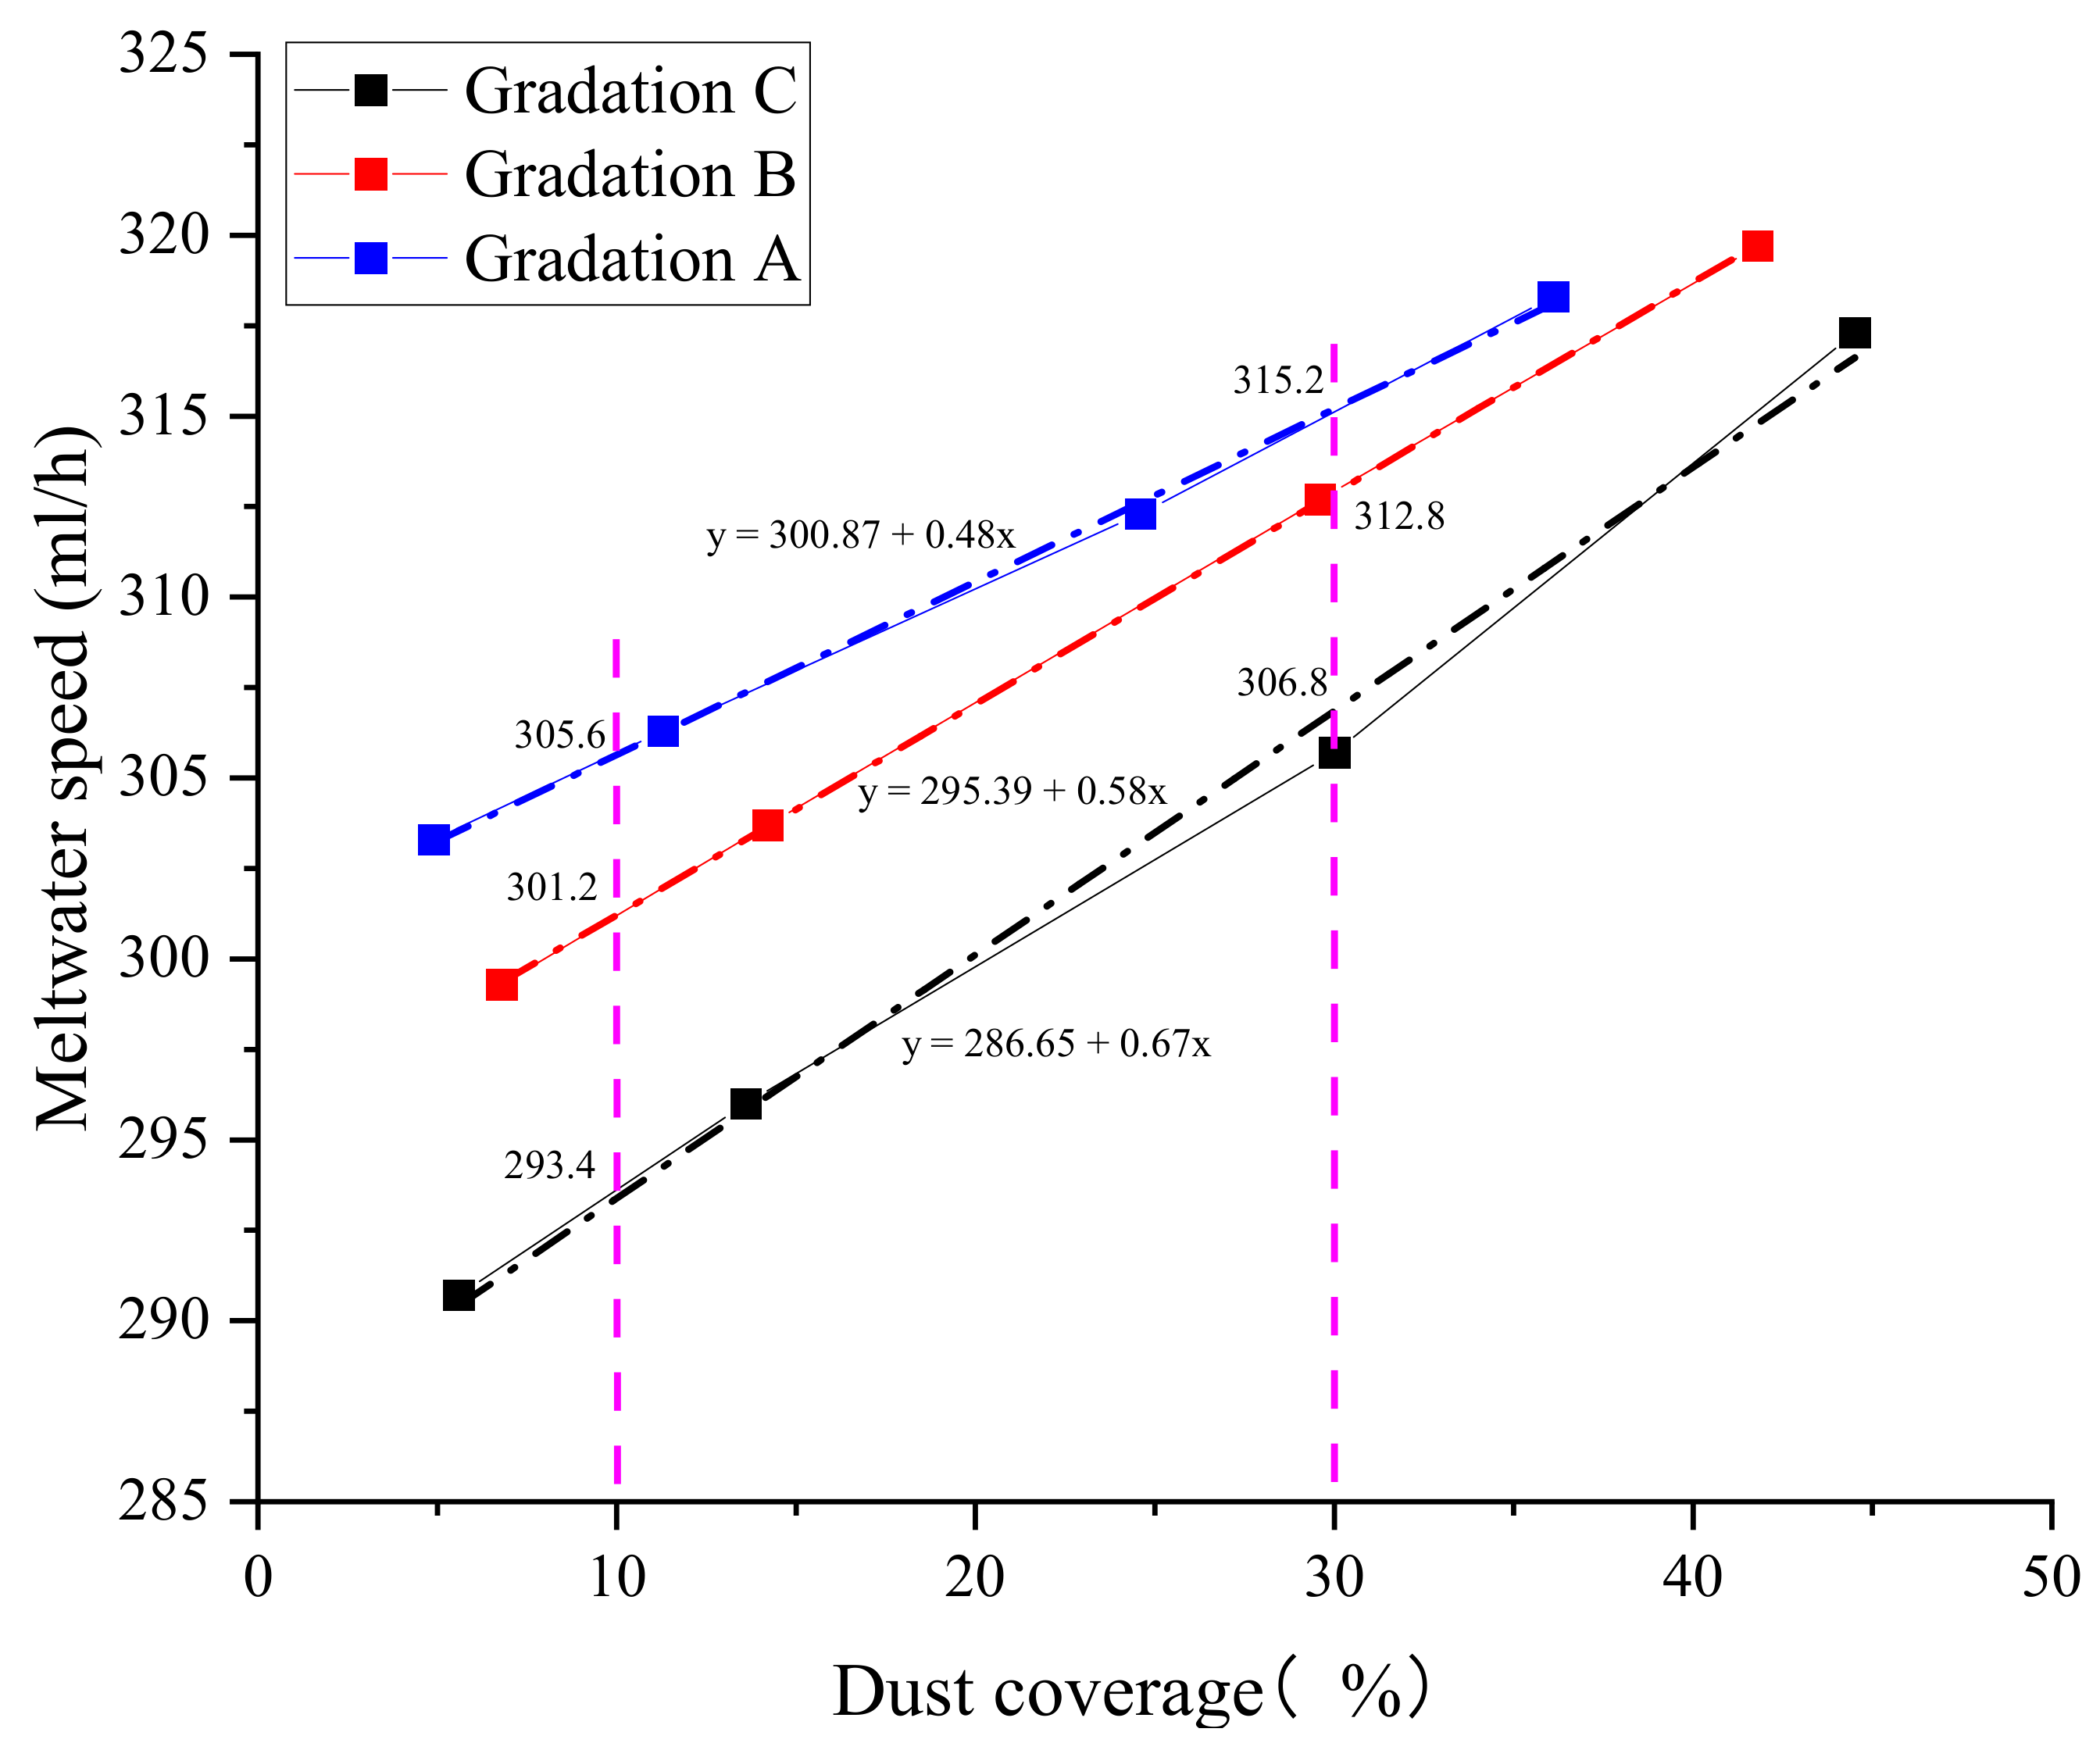
According to the results of the field mineral dust sampling, it can be seen that the surface mineral dust particle size gradations of glaciers at different distances from the pit were different. To further explore the effect of dust particle size gradation on the ablation rate, the dust from different particle size gradations under the same radiation intensity and temperature were studied, as shown in Figure 9.
As can be seen from Figure 9, the larger the mineral dust particle size gradation, the greater the ablation rate. When the mineral dust coverage rate was 10%, the meltwater speed of the mineral dust particle size gradations A, B, and C were 305.6, 301.2, and 293.4 mL/h, respectively, which means that the meltwater speed of the mineral dust particle size gradation increased by 4.2% when the mineral dust coverage rate increased from 70%:30%:0% to 5%:50%:45%. When the mineral dust coverage rate was 30%, the meltwater speed of the mineral dust particle size gradations A, B, and C were 315.2, 312.8, and 306.8 mL/h, respectively, which means that the meltwater speed of the mineral dust particle size gradation increased 2.7%, when it increased from 70%:30%:0% to 5%:50%:45%. This is mainly due to the fact that, after the meltwater was generated on the surface of the ice as the experiment proceeded, the mineral dust with smaller particle sizes (dragged by the water flow) moved to the lower part of the surrounding area. During the movement of the mineral dust by its own gravity, it would gradually adhere to the glacier again and finally stay in the lower part of the surrounding area (countless amounts of mineral dust after the movement and accumulation of the surface, as shown in Figure 10). Regarding the accumulation of mineral dust in the ablation process—on the one hand, it reduces the area of mineral dust receiving radiation and weakens the injection of system energy; on the other hand, the gathered mineral dust affects the heat transfer effect.
As can be seen from Figure 9, the larger the mineral dust particle size gradation, the smaller the rate of increase of the ablation rate. When the mineral dust particle size gradation was A, the meltwater speed increased with the mineral dust coverage rate of 0.48. When the mineral dust particle size gradation was B, the meltwater speed increased with the mineral dust coverage rate of 0.58. When the mineral dust particle size gradation was C, the growth rate of the meltwater speed with mineral dust coverage rate was 0.67 (indicating that the increasing rate of meltwater speed is gradually decreasing). This is mainly because—for mineral dust with large particle size gradations—the change of the mineral dust quantity is not obvious with a slight change in the coverage rate, but for mineral dust with small particle size gradations, a slight change in the coverage rate will increase or decrease a large amount of mineral dust with small particle sizes, and mineral dust with small particle sizes have a smaller volume and larger specific surface areas; this is conducive to the accumulation and transfer of energy, so the change of the meltwater speed is more obvious.
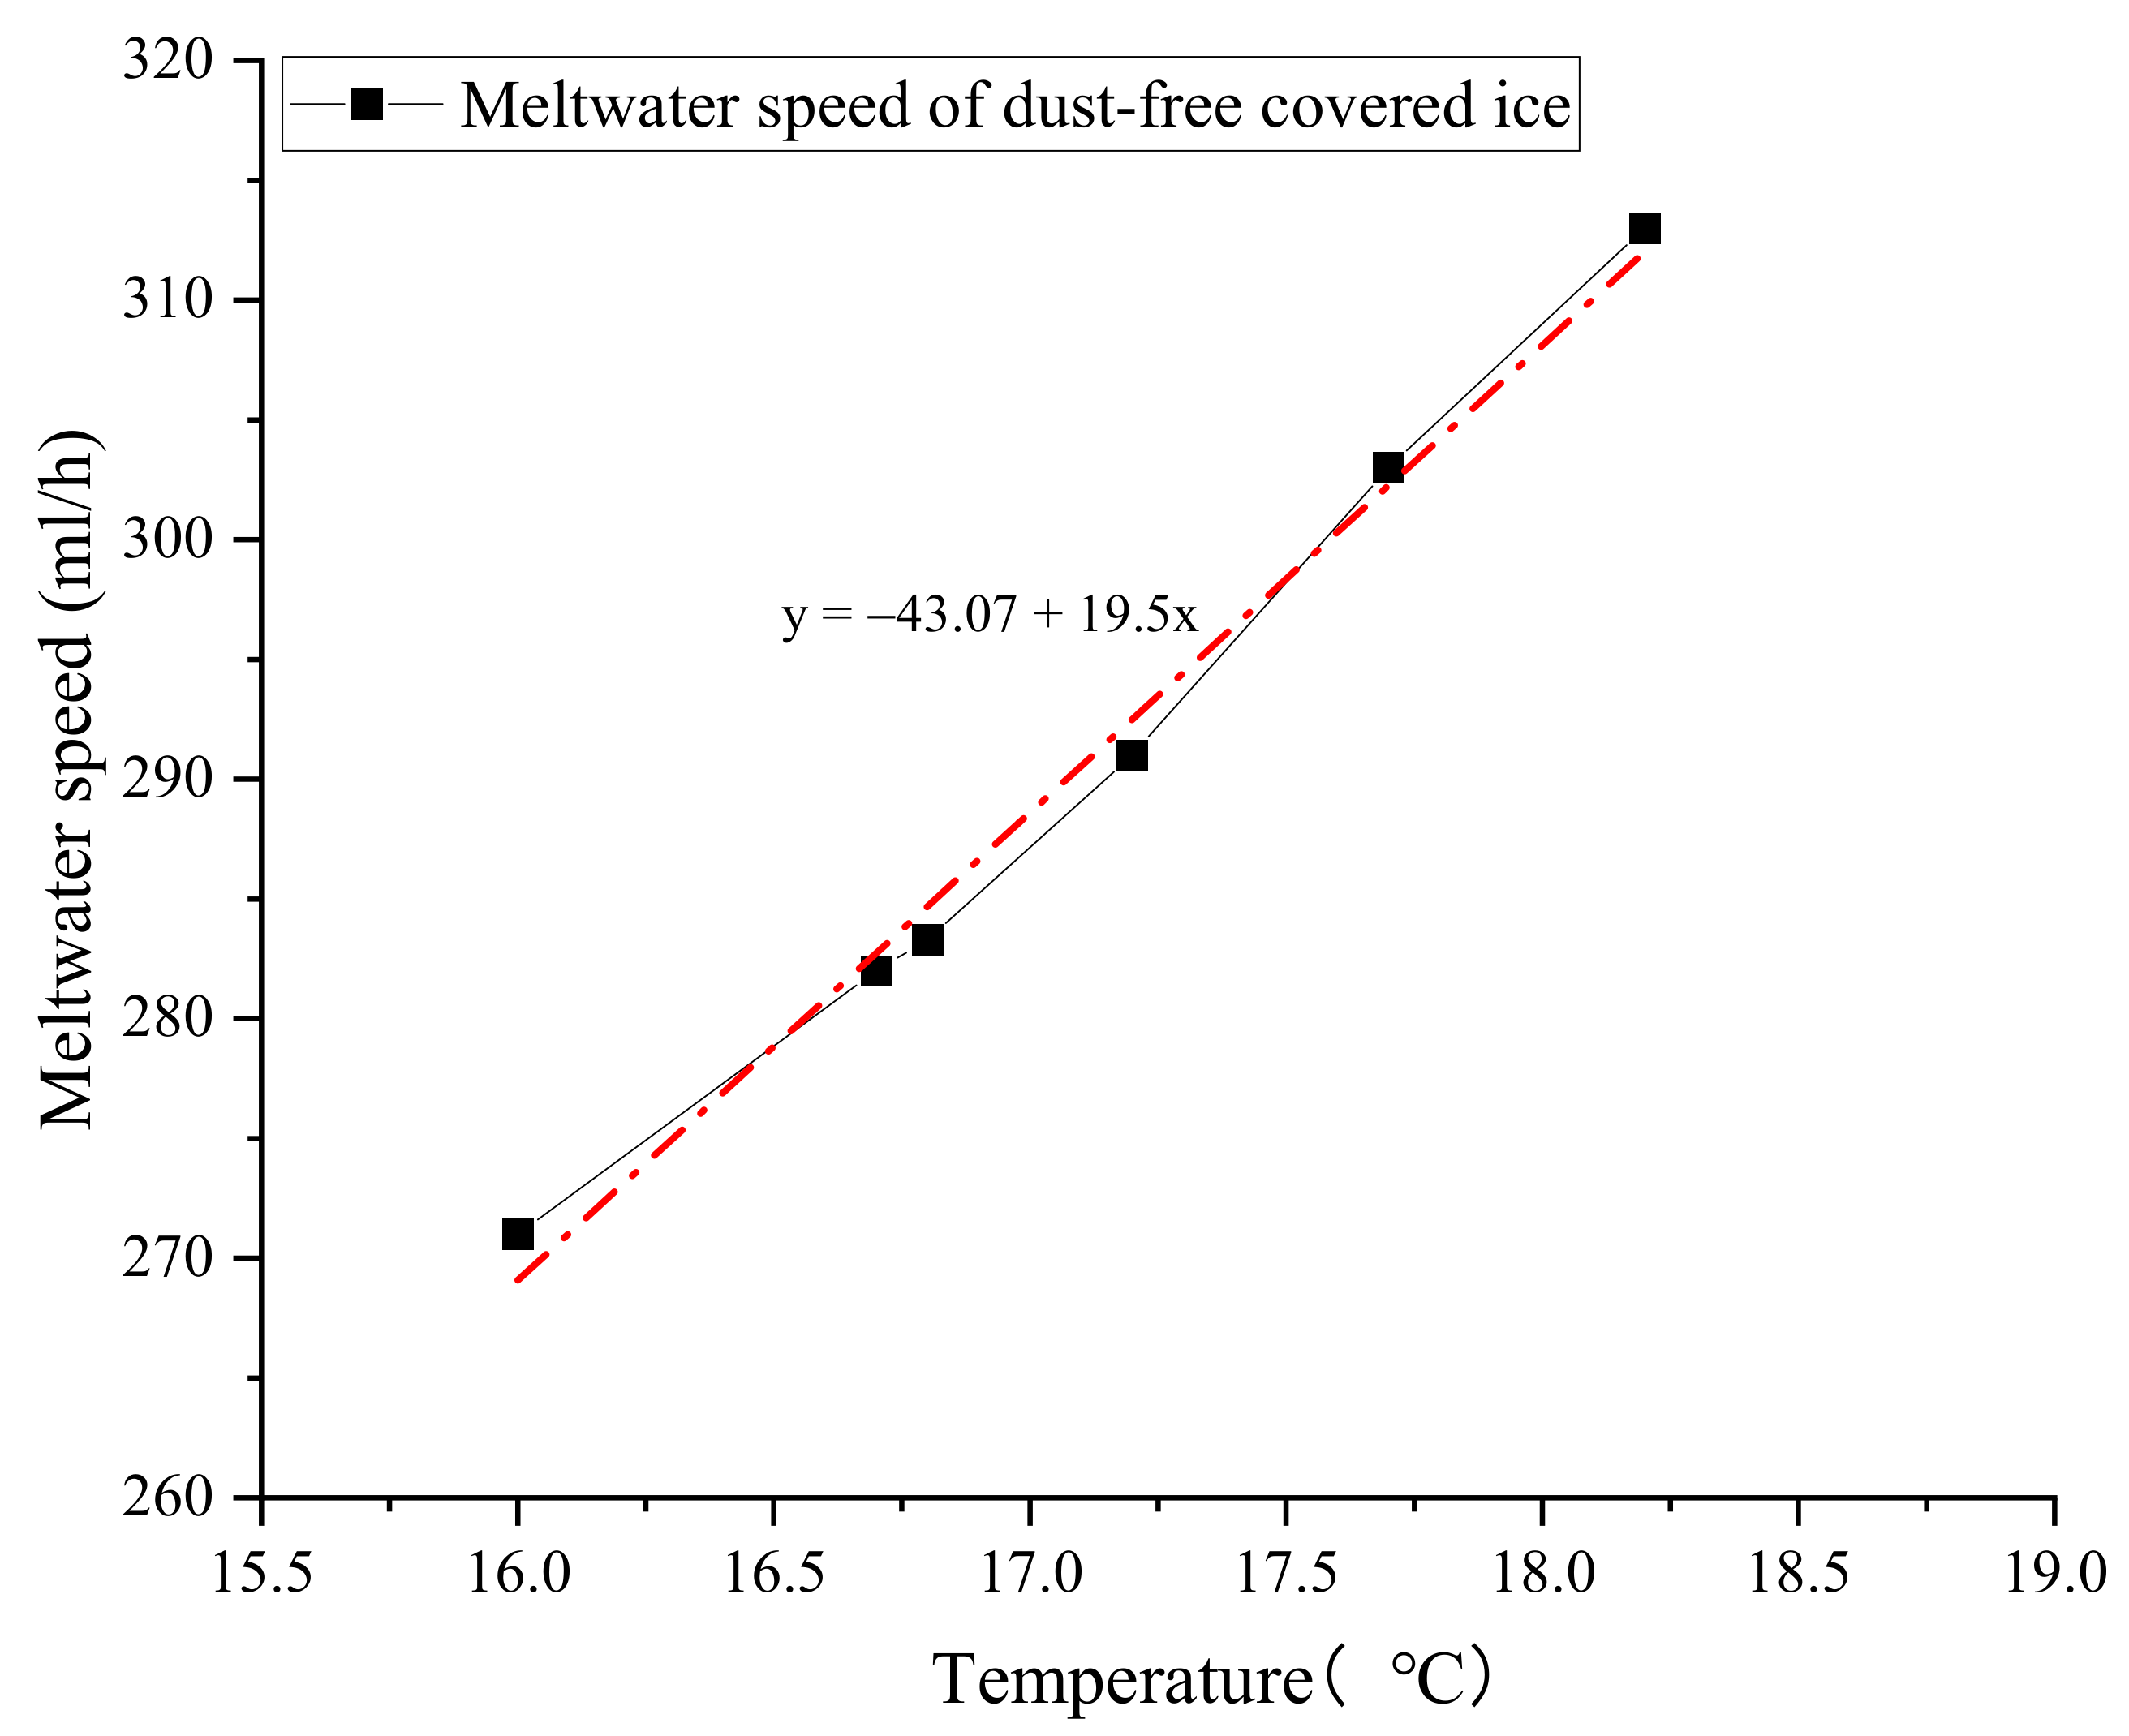
Considering the current global temperature rise, the temperature is also one of the reasons for the accelerated melting of glaciers; the sizes of the ice cubes in this physically similar simulation experiment were small, and the surrounding air temperature had a greater impact on them. To explore the magnitude of the contribution of holding air temperature and mineral dust to the ablation rate, the meltwater speeds of six groups of ice cubes without mineral dust covers were taken as the ablation rate influenced by the air temperature. The relationship between the ablation rate under the influence of temperature and mineral dust was analyzed, as shown in Figure 11.
The ablation rate is more influenced by air temperature than by mineral dust. Figure 9 and Figure 11 show that when the mineral dust particle size grading was A, the meltwater speed accelerated by 4.8 mL per hour when the mineral dust coverage rate increased by 10%. When the mineral dust particle size grading was B, the meltwater speed accelerated by 5.8 mL per hour when the mineral dust coverage rate increased by 10%. When the mineral dust particle size grading was C, the meltwater speed increased by 6.7 mL per hour when the mineral dust coverage rate increased by 10%; the meltwater speed increased by 19.5 mL per hour when the temperature increased by 1 °C. Therefore, when the mineral dust particle size gradation was A, each 40.6% increase in mineral dust coverage rate was equivalent to the effect caused by a 1 °C increase in air temperature; when the mineral dust particle size gradation was B, each 33.6% increase in mineral dust coverage rate was equivalent to the effect caused by a 1 °C increase in air temperature; when the mineral dust particle size gradation was C, each 29.1% increase in the mineral dust coverage rate was equivalent to the effect caused by a 1 °C increase in air temperature. By comparing the changes in the meltwater speed under the influence of mineral dust with that under the influence of air temperature, it can be seen that the influence of air temperature plays a dominant role. Under the same coverage rate, the smaller the particle size distribution in mineral dust, the greater the contribution to the ablation rate and the greater the increase rate of the ablation rate.
4. Discussion
4.1. Physical Energy Transfer Mechanism
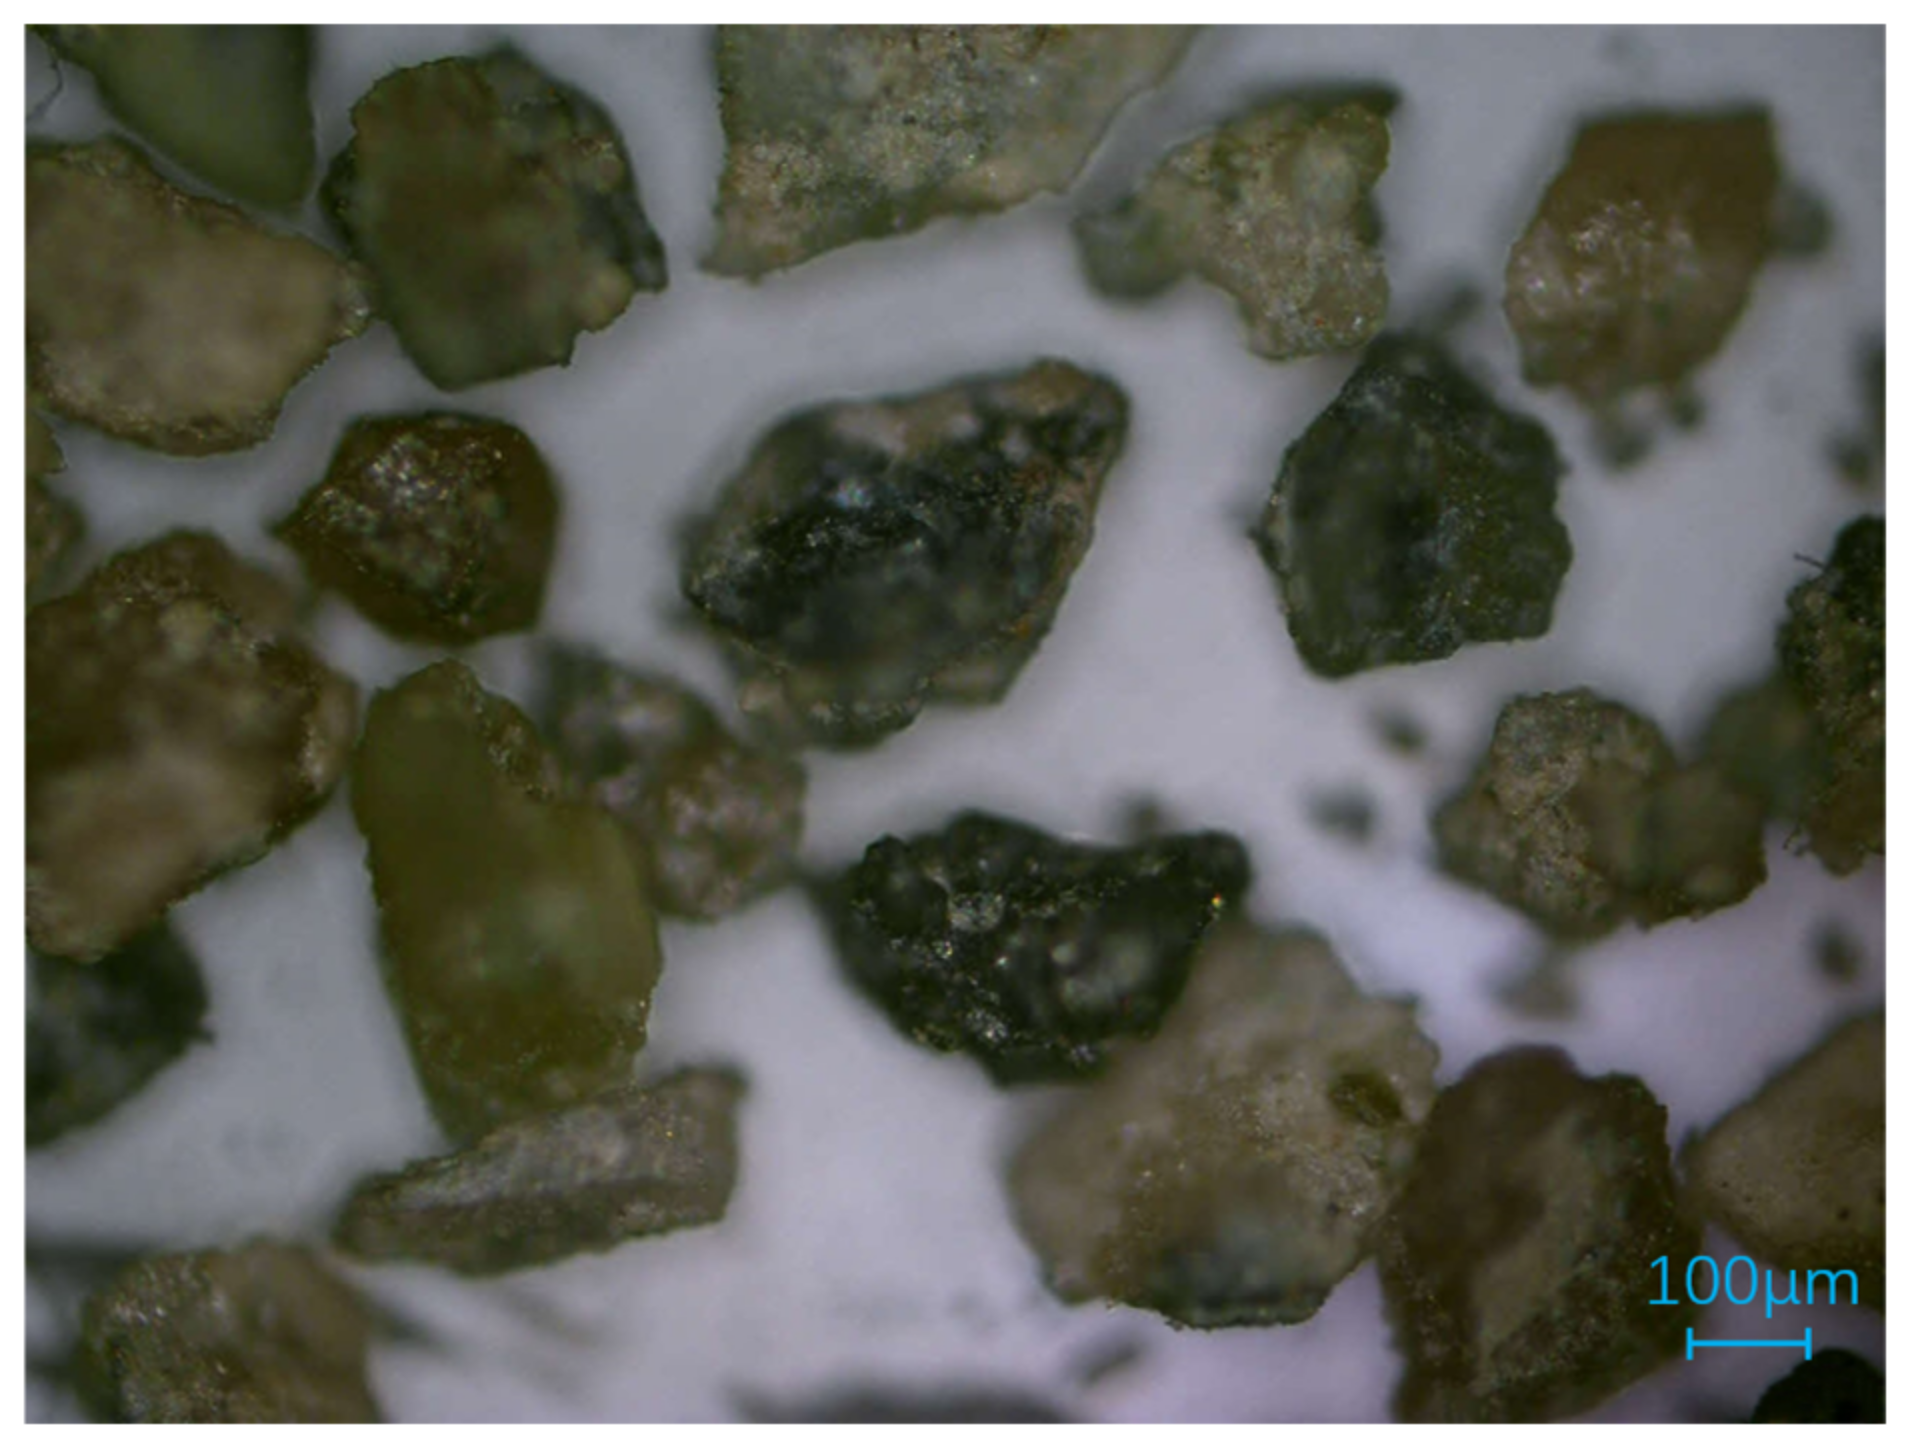
The presence of mineral dust forces more energy to participate in the glacial mass balance, accelerating the glacial ablation. The imbalance of the glacial mass balance stems from the alteration of the energy balance of the glacial mass balance system. The mineral dust is a dark-colored, light-absorbing particulate matter, as shown in Figure 12. Under the same conditions of solar radiation intensity, the mineral dust can apparently absorb more solar radiation energy relative to the ice and snow in its original position. This is in good agreement with the findings by Jonsell, Naegeli, Takeuchi, and Yue et al. [16,33,34,35]. From the first law of thermodynamics (conservation of energy), it is clear that the intervention of mineral dust injects additional energy into the glacier mass balance for the original glacier system compared to the glacier mass balance system without mineral dust cover, which accelerates the glacier ablation.
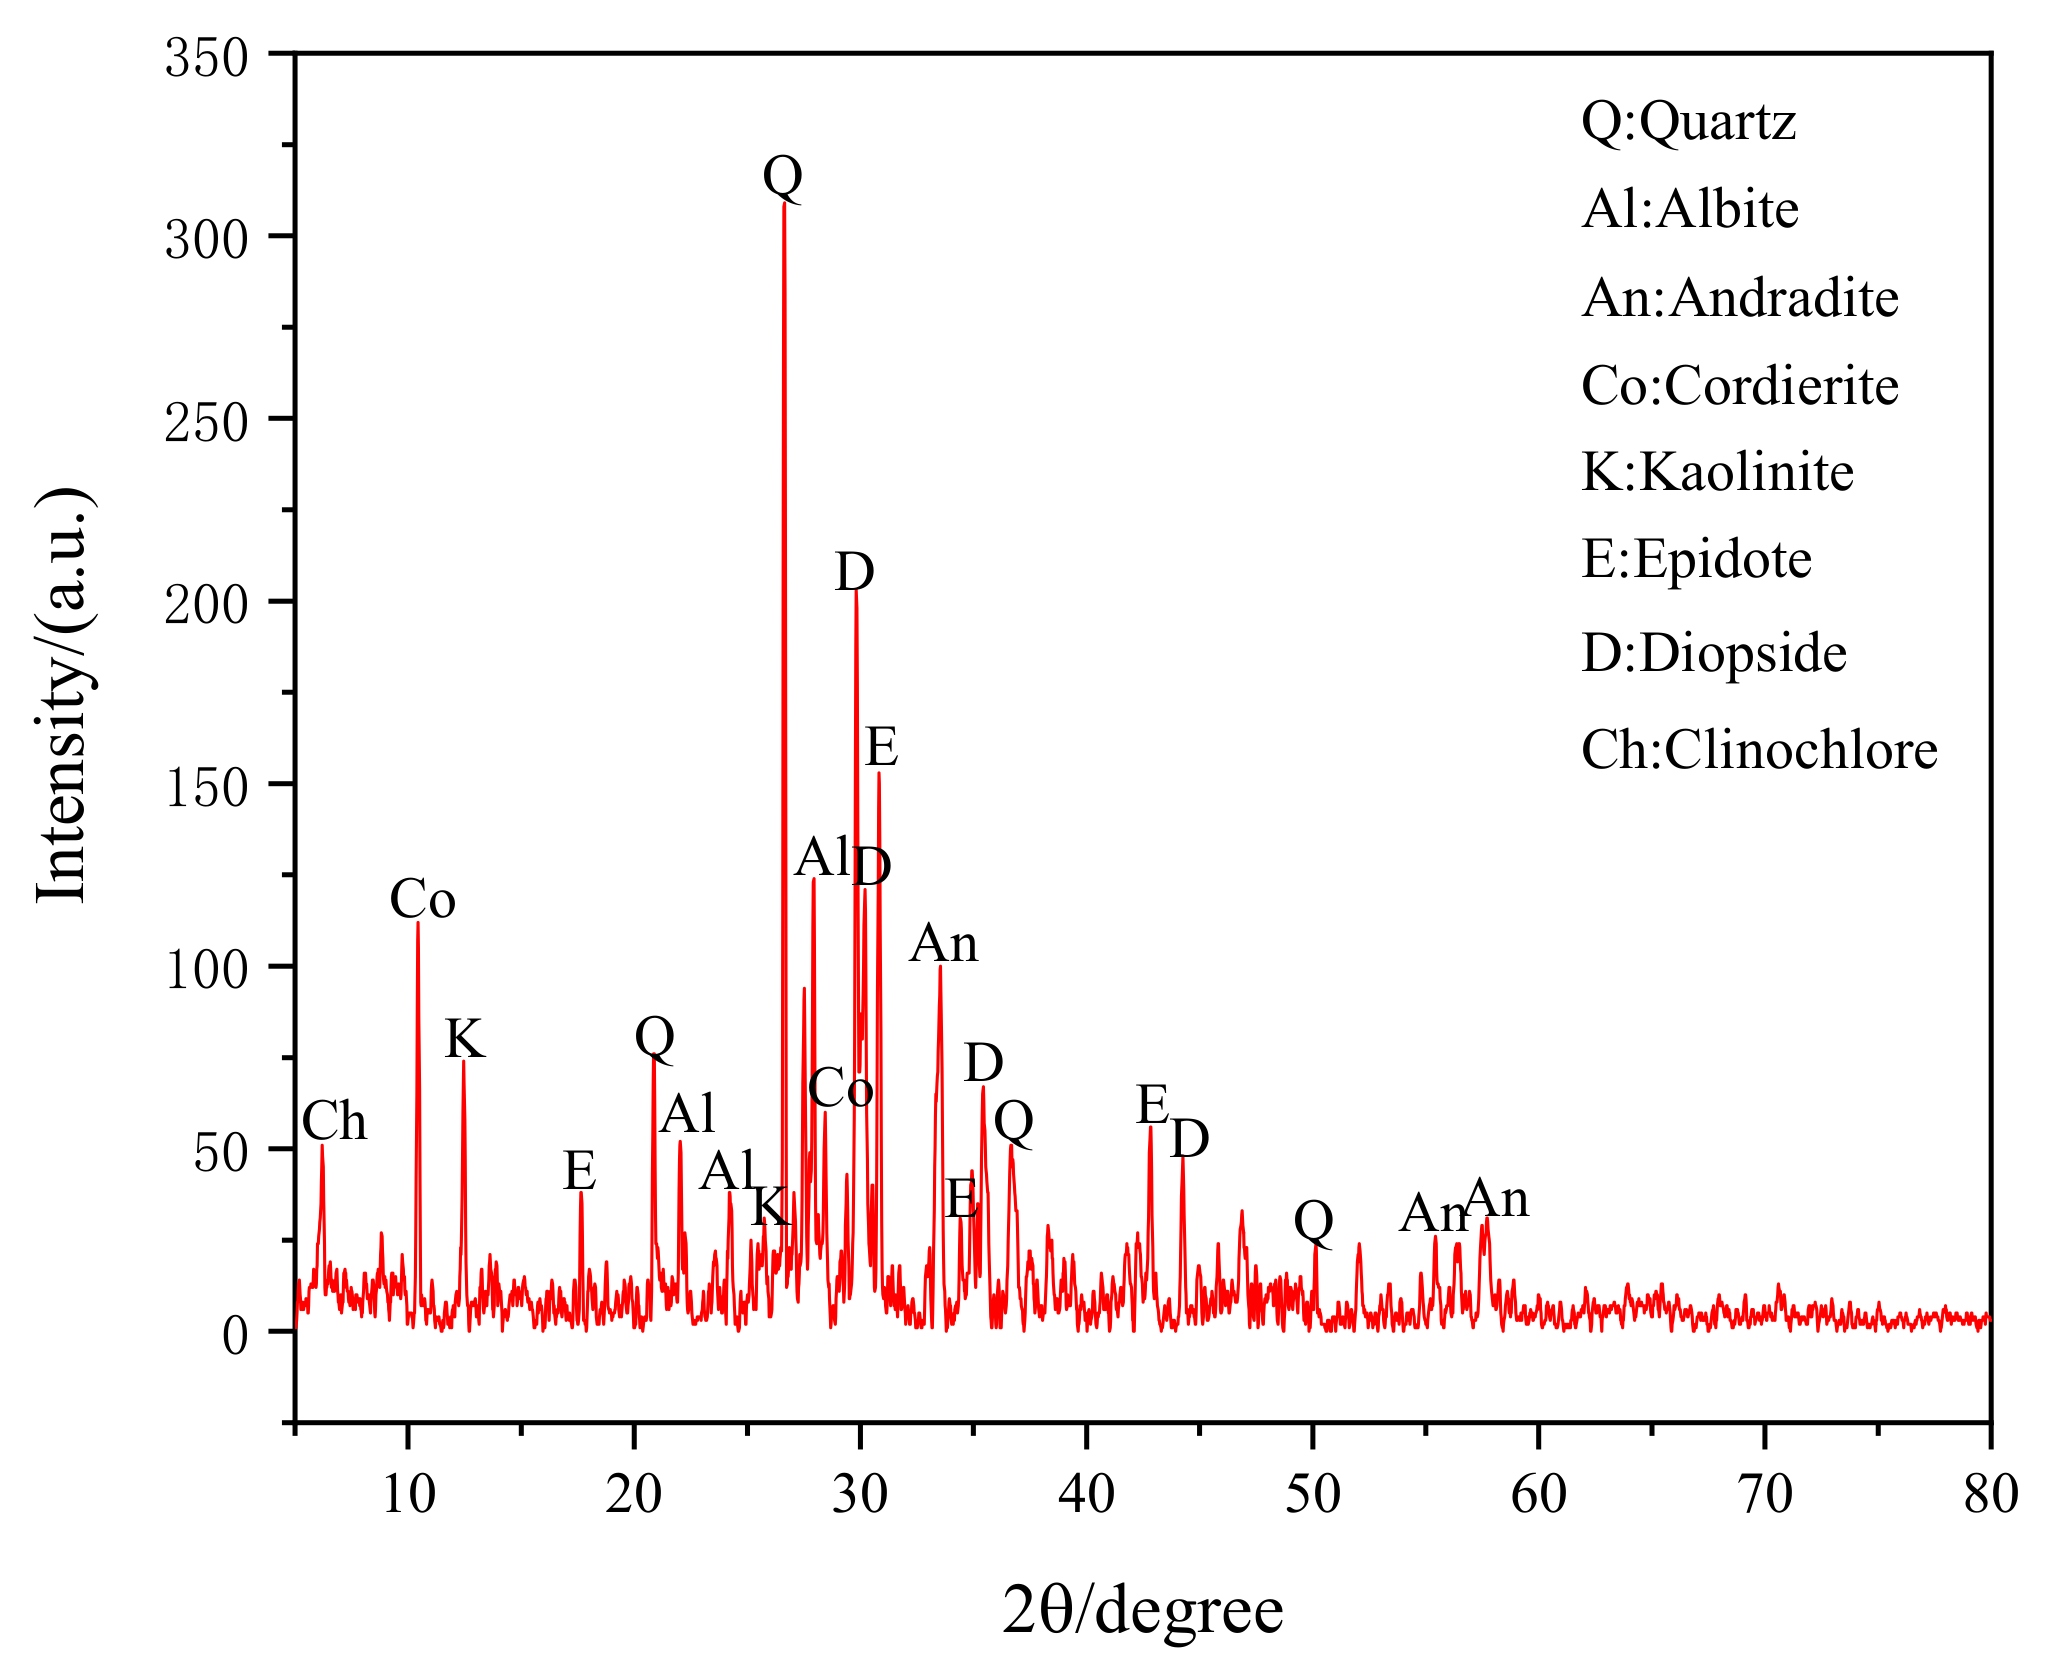
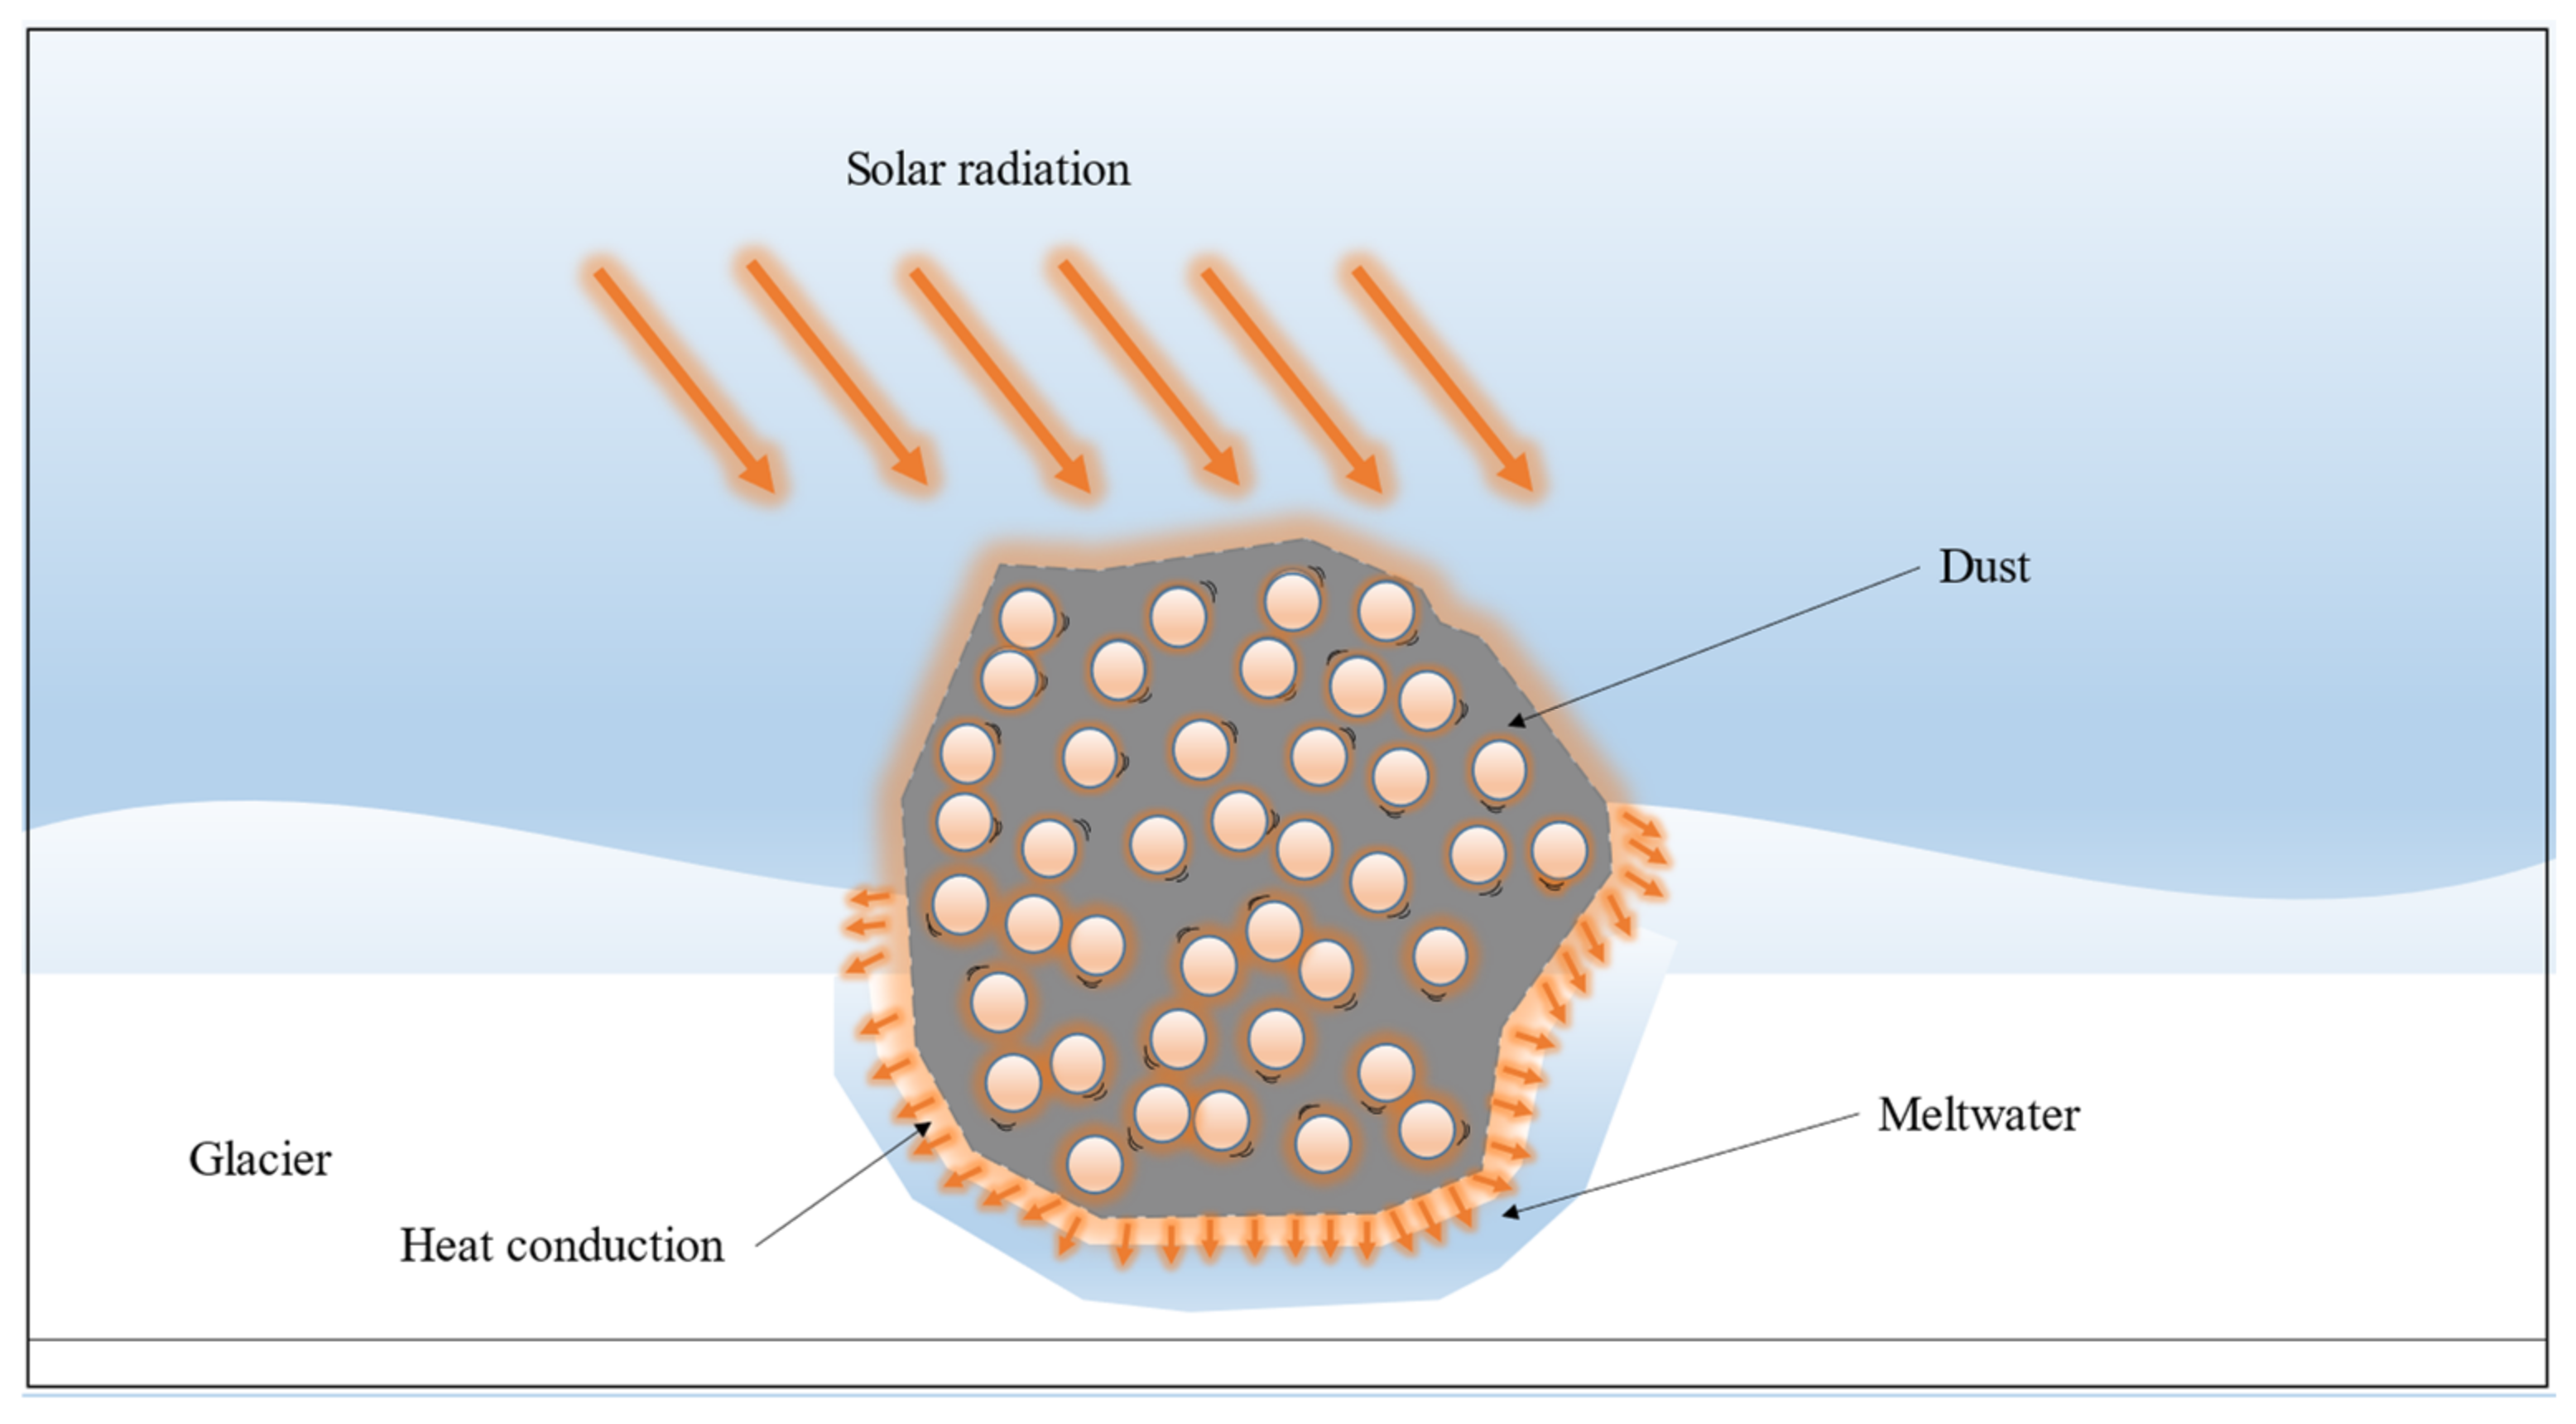
The rapid accumulation and transfer of energy from the mineral dust itself accelerate glacial ablation. X-ray diffraction (XRD) of the mineral dust shows that the mineral dust on the glacier adjacent to the prepared iron ore contains minerals, such as quartz, kaolinite, chlorite, diopside, and chlorite, as shown in Figure 13. The minerals that make up the mineral dust contain metallic elements, such as iron, magnesium, aluminum, and sodium, and all of these substances have smaller specific heat capacities and larger thermal conductivities, with a higher capacity to absorb and release energy than snow and ice. The specific heat capacity and thermal conductivity of the main substances contained in the above-mentioned minerals are shown in Table 3, plus the fine volume and large specific surface area of the mineral dust, which is very conducive to the accumulation of its own internal energy and the transfer of heat. According to the second law of thermodynamics, after converting solar radiation energy into its own internal energy, the mineral dust will transfer its own internal energy in the form of heat to the glacier below (by heat conduction) to accelerate the ablation of the glacier; the heat conduction process is shown in Figure 14.
4.2. Chemical Energy Conversion Mechanism
The minerals composed of mineral dust particles contain substances that undergo exothermic reactions, such as oxidation and hydration, which can further accelerate the ablation of glaciers. From the XRD results in the above figure, it is clear that the minerals that make up the mineral dust are diverse, with chlorite containing theoretical values of FeO, ranging from approximately 34.3% to 42.3% [36], and the theoretical content of CaO in diopside ranging from 16% to 25.83% [37]. When the mineral dust (rich in these substances) attached to the glacier surface, on the one hand, the soluble silicate mineral dust in the role of solar radiation constantly accelerated its own internal molecular movement, on the other hand, in the glacier surface, in this kind of humid, oxygenated environment, it is very easy for a chemical exothermic reaction to occur; see Table 4; the exothermic reaction process is shown in Figure 15.
By studying the physical and chemical properties of mineral dust, the mechanism of accelerated glacial ablation by mineral dust in mining areas was revealed using the laws of thermodynamics and chemical exothermic reactions. From the above analysis, we can learn that the inherent mechanism of mineral dust accelerating the ablation of glaciers is:
(1) Physically—the mineral dust diffused to the surface of the glacier can receive more solar radiation than the original surface ice and snow. The mineral dust will receive the solar radiation energy into its own internal energy, and conduct, in the form of heat to below the glacier, its own specific heat capacity, thermal conductivity, etc., conducive to the accumulation and transfer of energy, accelerating the ablation of glaciers.
(2) Chemically—the minerals that make up the mineral dust particles contain substances that can cause chemical exothermic reactions, further accelerating the ablation rate of the glaciers. The study of energy transfer and the conversion mechanism of mineral dust particles reveal the intrinsic mechanism of accelerated glacial ablation by mineral dust.
5. Conclusions
In this paper, the influence of mineral dust on the rate of glacier ablation was studied by physically similar simulation experiments; the following conclusions were drawn based on the analysis combined with the laws of thermodynamics and the principles of chemical exothermic reactions:
(1) The higher the mineral dust coverage rate, the faster the glacier ablation rate. Under the same conditions of radiation intensity and mineral dust particle size gradation, the higher the mineral dust coverage rate, the faster the ablation rate of the glacier; in the B2 experiment, when the coverage rate increased from 0% to 42.7%, the ablation rate of the ice cube increased from 282 to 321.2 mL/h, accelerating by 13.9%. It was the group with the most significant increase in the ablation rate affected by the mineral dust coverage rate in this experiment; all other groups also had different degrees of improvement.
(2) The larger the mineral dust particle size gradation, the faster the ablation rate of the glacier, and the slower the growth rate of the ablation rate. The smaller the particle size gradation of the mineral dust, the more it contributes to the increase of the glacier melting rate compared with the temperature. By comparing three different mineral dust particle size gradations under the same temperature and radiation intensity conditions, it was concluded that the larger the mineral dust particle size gradation, the faster the glacier ablation rate and the slower the growth rate of the ablation rate. When the mineral dust coverage rate was 10% and 30%, respectively, the mineral dust particle size gradation increased from A to C and the ablation rate increased by 4.2% and 2.7%, respectively. With the increase of the particle size gradations of groups A, B, and C, the increasing ratio of the ablation rate was 0.67, 0.58, and 0.48, which gradually decreased. By analyzing the growth rate of the ice ablation rate for the same air temperature and radiation intensity, the increase in the ablation rate by a 1 °C increase in air temperature corresponded to 40.6%, 33.6%, and 29.1% increases in the mineral dust coverage rates for particle size gradations A, B, and C, respectively.
(3) By constructing a mineral dust energy transfer and transformation model, the intrinsic mechanism of mineral dust accelerating the glacier ablation was revealed. The mineral dust particles on the glacier surface could not only reduce the albedo of the glacier surface to solar radiation but could also transfer the received radiation energy and chemical energy when reacting with the meltwater and oxygen to the glacier, causing the imbalance of the glacier income and expenditure, accelerating the rate of glacier ablation.
Author Contributions
Conceptualization, Z.Z.; methodology, Z.Z.; validation, Y.S. and Q.Z.; formal analysis, X.X.; investigation, Z.Z. and X.X.; data curation, X.X. and Y.S.; writing—original draft preparation, X.X.; writing—review and editing, Z.Z.; funding acquisition, Z.Z. All authors have read and agreed to the published version of the manuscript.
Funding
This research was funded by the Natural Science Foundation of Autonomous Region, grant number 2019D01C035.
Data Availability Statement
Not applicable.
Acknowledgments
We acknowledge the administrators and technicians at the Beizhan iron mine for their dust sampling and weather observation contributions in the mining field. We are also grateful to the editors and reviewers for their comments in this paper.
Conflicts of Interest
The authors declare no conflict of interest.
References
- Liu, S.Y.; Yao, X.J.; Guo, W.Q.; Xu, J.L.; Shangguan, D.H.; Wei, J.F.; Bao, W.J.; Wu, L.Z. The contemporary glaciers in China based on the Second Chinese Glacier Inventory. Acta Geogr. Sin. 2015, 70, 3–16. [Google Scholar] [CrossRef]
- Zhang, Z.Z.; Li, H.M.; Pan, Z.S.; Che, D.; Zhao, T. The present situation of national mineral resources conditions investigation and appraisal (NMRCIA) and its supporting technological systems in the new development stage, China. China Min. Mag. 2022, 31, 21–27. [Google Scholar] [CrossRef]
- Liu, Z.Q. Analysis on the types and characteristics of mineral resources in Xinjiang. World Nonferrous Met. 2018, 18, 106–107. [Google Scholar]
- Chen, X.F.; Shi, J.F.; Chen, X.F.; Ye, J.H. Distribution characteristic and potential analysis of important solid mineral resources in “Belt and Road” area. China Min. Mag. 2017, 26, 32–41. [Google Scholar]
- Wang, Y. An analysis of the situation of mineral resources exploration and development and supply and demand in Western China. World Nonferrous Met. 2020, 4, 119–120. [Google Scholar]
- Xie, X. A Study of the Coupling Relation between Mineral Resources Exploitation and Ecological Environment: Evidence from the Grassland of Inner Mongolia. In IOP Conference Series Earth and Environmental Science; IOP Publishing Ltd.: Bristol, UK, 2021; Volume 811, pp. 190–201. [Google Scholar] [CrossRef]
- Kutuzov, S.; Shahgedanova, M.; Krupskaya, V.; Goryachkin, S. Optical, Geochemical and Mineralogical Characteristics of Light-Absorbing Impurities Deposited on Djankuat Glacier in the Caucasus Mountains. Water 2021, 13, 2993. [Google Scholar] [CrossRef]
- Painter, T.H.; Barrett, A.P.; Landry, C.C.; Neff, J.; Cassidy, M.P.; Lawrence, C.; McBride, K.E.; Farmer, G.L. Impact of disturbed desert soils on duration of mountain snow cover. Geophys. Res. Lett. 2007, 34, L12502. [Google Scholar] [CrossRef] [Green Version]
- Di Mauro, B.; Fava, F.; Ferrero, L.; Garzonio, R.; Baccolo, G.; Delmonte, B.; Colombo, R. Mineral mineral dust impact on snow radiative properties in the European Alps combining ground, UAV, and satellite observations. J. Geophys. Res. 2015, 120, 6080–6097. [Google Scholar] [CrossRef]
- Painter, T.H.; Skiles, S.M.K.; Deems, J.S.; Bryant, A.C.; Landry, C.C. Mineral dust radiative forcing in snow of the Upper Colorado River Basin: 1. A 6 year record of energy balance, radiation, and mineral dust concentrations. Water Resour. Res. 2012, 48, W07521. [Google Scholar] [CrossRef] [Green Version]
- Wiscombe, J.W.; Warren, S.G. A Model for the Spectral Albedo of Snow. II: Snow Containing Atmospheric Aerosols. J. Atmos. Sci. 1980, 37, 2734–2745. [Google Scholar] [CrossRef] [Green Version]
- Wang, P.; Li, Z.; Schneider, C.; Li, H.; Hamm, A.; Jin, S.; Xu, C.; Li, H.; Yue, X.; Yang, M. A Test Study of an Energy and Mass Balance Model Application to a Site on Urumqi Glacier No. 1, Chinese Tian Shan. Water 2020, 12, 2865. [Google Scholar] [CrossRef]
- Zou, X.W.; Sun, W.J.; Yang, D.Y.; Wang, Y.S.; Li, Y.Z.; Jin, Z.Z.; Du, W.T.; Qin, X. Effect of cloud on surface energy balance of Laohugou Glacier No.12, Qilian Mountains. J. Glaciol. Geocryol. 2021, 43, 342–356. [Google Scholar] [CrossRef]
- Yue, X.Y.; Li, Z.G.; Wang, F.T.; Li, H.L.; Shen, S.M. The characteristics of surface albedo on the Urumgi Glacier No.1 during the ablation season in eastern Tien Shan. J. Glaciol. Geocryol. 2021, 43, 1412–1423. [Google Scholar] [CrossRef]
- Dal, F.A.; Kaspari, S.; Beach, J.; Bucheli, T.; Schaepman, M.; Schwikowski, M. Spectral signatures of submicron scale light-absorbing impurities in snow and ice using hyperspectral microscopy. J. Glaciol. 2018, 64, 377–386. [Google Scholar] [CrossRef] [Green Version]
- Yue, X.; Zhao, J.; Li, Z.; Zhang, M.; Fan, J.; Wang, L.; Wang, P. Spatial and temporal variations of the surface albedo and other factors influencing Urumqi Glacier No. 1 in Tien Shan, China. J. Glaciol. 2017, 63, 899–911. [Google Scholar] [CrossRef] [Green Version]
- Cuffey, K.M.; Paterson, W.S.B. The Physics of Glaciers; Academic Press: New York, NY, USA, 2010. [Google Scholar]
- Hock, R.; Holmgren, B. A distributed surface energy balance model for complex topography and its application to Storglaciären, Sweden. J. Glaciol. 2005, 51, 25–36. [Google Scholar] [CrossRef] [Green Version]
- Zhang, G.S.; Kang, S.C.; Fujita, K.; Huintjes, E.; Xu, J.Q.; Yamazaki, T.; Haginoya, S.; Yang, W.; Scherer, D.; Schneider, C.; et al. Energy and mass balance of Zhadang glacier surface, central Tibetan Plateau. J. Glaciol. 2013, 59, 137–148. [Google Scholar] [CrossRef] [Green Version]
- Huintjes, E.; Sauter, T.; Schröter, B.; Maussion, F.; Yang, W.; Kropáček, J.; Buchroithner, M.; Scherer, D.; Kang, S.C.; Schneider, C. Evaluation of a coupled snow and energy balance model for Zhadang Glacier, Tibetan Plateau, using glaciological measurements and time-lapse photography. Arct. Antarct. Alp. Res. 2015, 47, 573–590. [Google Scholar] [CrossRef]
- Zhao, W.; Zhao, L.; Tian, L.; Wolovick, M.; Moore, J.C. Simulating the Evolution of Da Anglong Glacier, Western Tibetan Plateau over the 21st Century. Water 2022, 14, 271. [Google Scholar] [CrossRef]
- Altmann, M.; Piermattei, L.; Haas, F.; Heckmann, T.; Fleischer, F.; Rom, J.; Betz-Nutz, S.; Knoflach, B.; Müller, S.; Ramskogler, K.; et al. Long-Term Changes of Morphodynamics on Little Ice Age Lateral Moraines and the Resulting Sediment Transfer into Mountain Streams in the Upper Kauner Valley, Austria. Water 2020, 12, 3375. [Google Scholar] [CrossRef]
- Pratap, B.; Sharma, P.; Patel, L.; Singh, A.T.; Gaddam, V.K.; Oulkar, S.; Thamban, M. Reconciling High Glacier Surface Melting in Summer with Air Temperature in the Semi-Arid Zone of Western Himalaya. Water 2019, 11, 1561. [Google Scholar] [CrossRef] [Green Version]
- Wu, J.F.; Zhang, Y.S.; Gao, H.F.; Zou, X.J.; Muhammad Atif Wazir. Variation of Degree-day Factors and Its Affecting Factors in the Upper Indus Basin. Arid. Zone Res. 2020, 37, 264–274. [Google Scholar] [CrossRef]
- Tang, W.J.; Li, J.; Yang, K.; Qin, J.; Zhang, G.Q.; Wang, Y. Dependence of remote sensing accuracy of global horizontal irradiance at different scales on satellite sampling frequency. J. Sol. Energy 2019, 193, 597–603. [Google Scholar] [CrossRef]
- Morales-Barquero, L.; Lyons, M.B.; Phinn, S.; Roelfsema, C. Trends in Remote Sensing Accuracy Assessment Approaches in the Context of Natural Resources. J. Remote Sens. 2019, 11, 2305. [Google Scholar] [CrossRef] [Green Version]
- Julia, E.; Fabien, M.; Ben, M. Initialization of a global glacier model based on present-day glacier geometry and past climate information: An ensemble approach. J. Cryosphere 2019, 13, 4464–4472. [Google Scholar] [CrossRef]
- Vandecrux, B.; Mottram, R.; Langen, P.L.; Fausto, R.S.; Olesen, M.; Stevens, C.M.; Verjans, V.; Leeson, A.; Ligtenberg, S.; Munneke, K.M.; et al. The firn meltwater Retention Model Intercomparison Project (RetMIP): Evaluation of nine firn models at four weather station sites on the Greenland ice sheet. J. Cryosphere 2020, 14, 3785–3810. [Google Scholar] [CrossRef]
- Cox, L.H.; March, R.S. Comparison of geodetic and glaciological mass−balance techniques. Gulkana Glaciers, Alaska, U.S.A. J. Glaciol. 2004, 50, 363–370. [Google Scholar] [CrossRef] [Green Version]
- Cogley, J.G. Geodetic and direct mass balance measurements: Comparison and joint analysis. Ann. Glaciol. 2009, 50, 96–100. [Google Scholar] [CrossRef] [Green Version]
- Fischer, A. Comparison of direct and geodetic mass balances on a multi-annual time scale. Cryosphere 2011, 5, 107–124. [Google Scholar] [CrossRef] [Green Version]
- Zemp, M.; Thiber, E.; Huss, M.; Stumm, D.; Denby, C.R.; Nuth, C.; Nussbaumer, S.U.; Moholdt, G.; Mercer, A.; Mayer, C.; et al. Reanalysing glacier mass balance measurement series. Cryosphere 2013, 7, 1227–1245. [Google Scholar] [CrossRef] [Green Version]
- Jonsell, U.; Hock, R.; Holmgren, B. Spatial and temporal variations in albedo on Storglaciären, Sweden. J. Glaciol. 2003, 49, 59–68. [Google Scholar] [CrossRef] [Green Version]
- Naegeli, K.; Huss, M.; Hoelzle, M. Change detection of bare-ice albedo in the Swiss Alps. Cryosphere 2019, 13, 397–412. [Google Scholar] [CrossRef] [Green Version]
- Takeuchi, N.; Li, Z. Characteristics of Surface Dust on Ürümqi Glacier No. 1 in the Tien Shan Mountains, China. Arct. Antarct. Alp. Res. 2008, 40, 744–750. [Google Scholar] [CrossRef]
- Wang, Z.Z.; Zhao, Q.Y.; Wang, D.Y.; Cui, C. Preparation of porous silica from natural chlorite via selective acid leaching and its application in methylene blue adsorption. J. Cent. South Univ. 2022, 29, 1173–1184. [Google Scholar] [CrossRef]
- Yang, Z.J.; Yang, H.; Xue, X.X.; Duan, P.N. Study on diopside synthesis and its photocatalysis. J. Mater. Metall. 2010, 9, 101–104. [Google Scholar] [CrossRef]
- Yang, D.R. Some Thermodynamic Aspects of Inorganic Chemistry; Shanghai Scientific & Technical Publishers: Shanghai, China, 1986; pp. 315–340. [Google Scholar]
Figure 1.
Location of the research area, spatial distribution of the mining area and glacier (A); diagram of dust accelerating glacier ablation (B).
Figure 1.
Location of the research area, spatial distribution of the mining area and glacier (A); diagram of dust accelerating glacier ablation (B).

Figure 2.
Preparation of ice cubes, (a) a mold for the preparation of ice cubes; (b) ice cubes taken from the freezer; (c) front of the ice cube with the thin iron bar removed; (d) a beaker for measuring meltwater is placed beneath the mold.
Figure 2.
Preparation of ice cubes, (a) a mold for the preparation of ice cubes; (b) ice cubes taken from the freezer; (c) front of the ice cube with the thin iron bar removed; (d) a beaker for measuring meltwater is placed beneath the mold.

Figure 3.
Mineral dust collected on-site in the study area (a), mineral dust of different particle sizes after sieving by standard sieves (b–d).
Figure 3.
Mineral dust collected on-site in the study area (a), mineral dust of different particle sizes after sieving by standard sieves (b–d).

Figure 4.
Mineral dust collected on-site in the study area (a); mineral dust of different particle sizes after sieving by standard sieves (b–d).
Figure 4.
Mineral dust collected on-site in the study area (a); mineral dust of different particle sizes after sieving by standard sieves (b–d).

Figure 5.
The operation process of the whole ablation experiment, (a) ice preparation; (b) mineral dust preparation; (c) layout of mineral dust; (d) ablation experiments were initiated.
Figure 5.
The operation process of the whole ablation experiment, (a) ice preparation; (b) mineral dust preparation; (c) layout of mineral dust; (d) ablation experiments were initiated.

Figure 6.
Relationship between the dust coverage rate and meltwater speed (Group A), chain dotted lines are fitted curves of experimental data (same as figures below).
Figure 6.
Relationship between the dust coverage rate and meltwater speed (Group A), chain dotted lines are fitted curves of experimental data (same as figures below).

Figure 7.
Relationship between the dust coverage rate and meltwater speed (Group B).

Figure 8.
Relationship between the dust coverage rate and meltwater speed (Group C).

Figure 9.
Relationship between the dust coverage rate and meltwater speed under different grading conditions, chain dotted lines are fitted curves of experimental data.
Figure 9.
Relationship between the dust coverage rate and meltwater speed under different grading conditions, chain dotted lines are fitted curves of experimental data.

Figure 10.
The accumulation phenomenon of small particle size mineral dust.

Figure 11.
Relationship between air temperature and meltwater speed, chain dotted lines are fitted curves of experimental data.
Figure 11.
Relationship between air temperature and meltwater speed, chain dotted lines are fitted curves of experimental data.

Figure 12.
Apparent color of mineral dust (the length of the ruler in the figure is 100 μm).

Figure 13.
XRD pattern of mineral dust.

Figure 14.
Energy transfer mechanism of mineral dust.

Figure 15.
Energy conversion mechanism of mineral dust.


Table 1.
Mineral dust particle size gradation.
| Particle Size Range (mm) | 0.0375–0.075 | 0.075–0.125 | 0.125–0.25 | Group |
|---|---|---|---|---|
| Percentage of particle size (%) | 5 | 50 | 45 | A |
| 30 | 40 | 30 | B | |
| 70 | 30 | 0 | C |
Table 2.
Ice surface mineral dust coverage rate, radiation intensity, and air temperature.
| Experimental Group | |||||||||
|---|---|---|---|---|---|---|---|---|---|
| A1 | A2 | B1 | B2 | C1 | C2 | A3 | B3 | C3 | |
| Mineral dust coverage rate (%) | 0 | 0 | 0 | 0 | 0 | 0 | 4.9 | 6.8 | 5.6 |
| 10.8 | 10.8 | 5.2 | 12.4 | 14 | 13.5 | 11.3 | 14.2 | 13.6 | |
| 22.2 | 20.2 | 22.3 | 25.9 | 21.2 | 24 | 24.6 | 29.6 | 30 | |
| 38.2 | 33.6 | 33.2 | 33.4 | 30.8 | 29 | 36.1 | 41.8 | 44.5 | |
| 48.4 | 41.3 | 41 | 35.8 | 33.9 | 37 | ||||
| 53.9 | 53 | 44.8 | 42.7 | 44 | 45.6 | ||||
| Radiation intensity (W/m2) | 1153 | 1007 | 911 | 993 | 1040 | 1104 | 1089 | 1089 | 1089 |
| Air temperature (°C) | 18.2 | 16.8 | 16 | 16.7 | 17.2 | 17.7 | 17.5 | 17.5 | 17.5 |
Note: radiation intensity and air temperature were averaged using the data recorded during the experiment.
Table 3.
Specific heat capacity and thermal conductivity.
| Ice | MgO | SiO2 | Al2O3 | |
|---|---|---|---|---|
| Specific heat capacity (J·kg−1·K−1) | 2100 | 1460 | 840 | 750 |
| Thermal conductivity (W·m−1·K−1) | 2.1 | 36 | 10 | 10 |
Publisher’s Note: MDPI stays neutral with regard to jurisdictional claims in published maps and institutional affiliations. |
© 2022 by the authors. Licensee MDPI, Basel, Switzerland. This article is an open access article distributed under the terms and conditions of the Creative Commons Attribution (CC BY) license (https://creativecommons.org/licenses/by/4.0/).
Share and Cite
MDPI and ACS Style
Zhang, Z.; Xu, X.; Song, Y.; Zeng, Q. Study on the Ablation of the Glacier Covered by Mineral Dust in Alpine Regions. Water 2022, 14, 1982. https://doi.org/10.3390/w14131982
AMA Style
Zhang Z, Xu X, Song Y, Zeng Q. Study on the Ablation of the Glacier Covered by Mineral Dust in Alpine Regions. Water. 2022; 14(13):1982. https://doi.org/10.3390/w14131982
Chicago/Turabian StyleZhang, Zhiyi, Xinyi Xu, Yongze Song, and Qiang Zeng. 2022. "Study on the Ablation of the Glacier Covered by Mineral Dust in Alpine Regions" Water 14, no. 13: 1982. https://doi.org/10.3390/w14131982
Note that from the first issue of 2016, this journal uses article numbers instead of page numbers. See further details here.