
Assessment of Riverbank Erosion Hotspots along the Mekong River in Cambodia Using Remote Sensing and Hazard Exposure Mapping


1
Environment, Development and Sustainability Program, Graduate School, Chulalongkorn University, Bangkok 10330, Thailand
2
Stockholm Environment Institute, Asia Center, Bangkok 10330, Thailand
3
Department of Water Resources Engineering, Faculty of Engineering, Chulalongkorn University, Bangkok 10330, Thailand
*
Author to whom correspondence should be addressed.
Water 2022, 14(13), 1981; https://doi.org/10.3390/w14131981
Submission received: 6 May 2022
/
Revised: 6 June 2022
/
Accepted: 17 June 2022
/
Published: 21 June 2022
(This article belongs to the Special Issue Geographic Information Systems (GIS) and Water Resources Engineering toward Environmental Sustainability)
Abstract
:The large-scale monitoring of riverbank erosion is challenging because of human, equipment, and financial limitations, particularly in developing countries. This study aims to detect riverbank erosion and identify riverbank erosion hotspots along the Mekong River in Cambodia. A riverbank erosion rate map was developed using satellite images from Landsat 5, 7, and 8 (1990–2020) using the modified normalized difference water index (MNDWI) at a resolution of 30 m and Sentinel-2 (2016–2021) using the normalized difference water index (NDWI) at a resolution of 10 m. Detecting riverbanks in satellite images using a water index depends greatly on image resolution and water threshold. The riverbank lines were validated using Google Earth images. In the data used in December 2017, the root mean square error (RMSE) of Sentinel-2 was 6.00 m, while the RMSE of Landsat was 6.04 m. In the data used in January 2019, the RMSE of Sentinel-2 was 4.12 m, while the RMSE of Landsat was 5.90 m. The hotspots were identified by overlaying the riverbank erosion rate map and the exposure map of population density and land cover. Field surveys and interviews were conducted to verify riverbank erosion hotspots in the Ruessei Srok and Kaoh Soutin communes. The results showed that within the last 30 years (1990–2020), the riverbank eroded more than 1 km in a direction perpendicular to the river in some segments of the Mekong River in Cambodia. The highest average annual erosion rate was in the Ruessei Srok Commune in Kampong Cham Province, at approximately 43 m/yr. Most eroded areas were farmland and rural residential areas. The riverbank hotspots are situated mainly in the lower part of the Mekong River, where the population is dense, and the erosion rate is high. Riverbank erosion hotspots with a very high impact level and ongoing active erosion include the Peam Kaoh Sna, Kampong Reab, Kaoh Soutin, and Ruessei Srok communes in Kampong Cham Province. This study provides an efficient tool for using satellite images to identify riverbank erosion hotpots in a large river basin. The riverbank erosion hotspot map is essential for decision-makers to prioritize interventions to reduce the risk of riverbank erosion and to improve the livelihood of the people residing along the Mekong River.
1. Introduction
Riverbank erosion is a major hazard of public concern. Although erosion is a natural process, human activities may have a significant impact on the rate of morphological change [1]. Riverbank erosion affects millions of people worldwide every year [2,3]. For example, one of the worst cases of riverbank erosion occurred in September 2018 in the Naria region of Bangladesh, leaving around 5000 families homeless [4]. Riverbank erosion negatively affects people’s livelihoods, increasing their economic, social, and psychological distress over time [3]. Riverbank erosion also causes loss of life and substantial damage to property and public infrastructure. Moreover, riverbank erosion can affect river ecology [5]. For instance, riverbank erosion is the main source of suspended sediments in the Kharaa River, which negatively affects water quality as well as the dimension and function of the hyporheic zone in several ways [6]. Both natural and anthropogenic factors contribute to riverbank erosion.
Most rivers are subject to devastating riverbank erosion, including the Mekong River in Asia [5]. The Mekong River, which is one of the world’s longest rivers, with a total length of almost 4800 km [7], faces many sediment-related issues, specifically, riverbank erosion [8]. According to State of the Basin Reports in 2010 [9] and 2018 [10] and council study reports on the sustainable management and development of the Mekong River [11] by the Mekong River Commission (MRC), the decline in sediment transport due to dam development will likely increase riverbank erosion. Due to dam development along the main river and major tributaries in the upstream parts of the Mekong River Basin in China, Lao PDR, and Vietnam, riverbank erosion is expected to increase in the lower parts of the basin, including Cambodia and the Mekong Delta in Vietnam. The Lower Mekong River Basin is prone to the potential risk of riverbank instability due to sand extraction [12,13]. Approximately less than 8% of the Mekong River is protected by riverbank protection structures, and Thailand has invested more in riverbank protection than other countries in the Lower Mekong River Basin [8].
Riverbank erosion is a problem for people in Cambodia, especially communities along the Mekong River where entire villages have been swept away by the river. The severity and impact of riverbank erosion vary from year to year according to water level fluctuations. According to the National Committee for Disaster Management, during the flood season in 2019, 22,545 m of the riverbank collapsed in four provinces: Stung Treng, Kratie, Kampong Cham, and Tboung Khmum [14]. Among the four provinces, Kampong Cham experienced the worst damage due to riverbank erosion, with a record riverbank collapse of 19,652 m. Eleven houses were destroyed, and 83 families in the four provinces relocated to a safe place. Another serious riverbank erosion incident occurred in February 2014 in Kandal Province, where three people disappeared [15].
Riverbank erosion monitoring is essential to the development planning and management of rivers. Two main approaches are involved: ground surveys [16,17] and remote sensing techniques [18,19,20,21,22,23]. Some previous studies have combined these two techniques to increase accuracy and continuity in quantifying riverbank erosion [24,25]. Remote sensing techniques have been employed, including unmanned aerial vehicle imagery [23,26,27], and laser scanning techniques (i.e., terrestrial or airborne laser scanning) [20,28]. Such approaches can provide accurate results, but they are typically used in small-scale study areas. Another remote sensing technique uses satellite images, such as those acquired by Landsat [18,29,30,31] and Sentinel-2 [32]. The use of satellite images in this technique enables the reconstruction of historical changes in the riverbank of a large river with fewer resources and at minimal cost. Moreover, some satellite products, such as those from Landsat and Sentinel, are openly accessible.
Monitoring riverbank erosion using satellite images is usually done by generating the river’s water body and assuming that its boundary is the riverbank. Water body detection by remote sensing can be conducted using various methods: (1) single-band analysis [33,34]; (2) the water index method [35,36]; (3) supervised or unsupervised classification using machine learning or deep learning (i.e., pixel-based classification) [37,38]; and (4) object-based image analysis methods [39,40]. Water index methods have been widely applied because they could suppress background features and enhance water characteristics [41]. Moreover, they can effectively detect water bodies at low computational costs. In recent years, many advanced techniques have been proposed for detecting water bodies using machine learning/deep learning [42,43,44,45,46,47,48]. These techniques were developed to improve the accuracy of water body detection, especially small water bodies in complex terrains, and to overcome the limitations of spectral resolution in high-resolution images (e.g., Ikonos and Quickbird). According to Yang et al. [49], convolutional neural network-based models are the most frequently used in water body detection. Machine learning methods were found to outperform the water index-based method in specific areas and terrains [42,43,44,45,46]. However, when water detection was performed in the same location at different image acquisition times using the same machine learning algorithm, accuracy was significantly reduced [50], requiring the model to be retrained, which was resource intensive. Machine learning algorithms help to improve accuracy; however, they are still in the developmental stage [50]. Based on the above literature, large scale riverbank detection along the Mekong River and the assessment of river body changes over time, the water index method was selected for application in this study.
Several previous studies have quantified changes in the riverbank in the Lower Mekong River Basin. Kummu et al. [1] examined the riverbank movement rate in the Vientiane–Nong Khai section of the Mekong River (i.e., at the border of Thailand and Lao PDR) using two hydrographic atlases derived from aerial photos and a field survey, as well as SPOT5 satellite images at a resolution of 2.5 m. The authors analyzed the rate of change in riverbank movement during two periods: 1961–1992 and 1992–2005. The average riverbank erosion rate in a direction perpendicular to the river in the two periods ranged from 0.8 m/yr to 1.0 m/yr, which was small in relation to a global scale. Lam-Dao et al. [19] detected riverbank erosion along rivers in the Mekong Delta using time series satellite images, including Landsat, SPOT, and RADARSAT images. Topographic maps (1966–1968) were employed as baseline data and compared with satellite images from 1989–2009. The results showed that erosion in the Mekong River branch was more severe than in the Bassac River branch. The riverbank eroded landward from 100 m to 1000 m, which extended from 4 to 10 km along the length of the Mekong River in the Mekong Delta in Vietnam. Recently, Khoi et al. [18] used Landsat images from 1989 to 2014 to detect river morphology changes in the Mekong Delta in Vietnam. The authors suggested that erosion processes commonly occur along the Mekong River branch. For example, the left riverbank of the Mekong River in Tan Chau and Sa Dec erodes landward at a high average rate of about 30 m/yr and 42 m/yr, respectively. In a study by Binh et al. [30], the authors improved the method of riverbank detection, specifically in the Mekong Delta in Vietnam, using Landsat images and water indices in combination with a modified automated method for extracting rivers and lakes.
Although several studies have been conducted to detect riverbank erosion in the Mekong Delta in Vietnam, few studies have been conducted in Cambodia. Thus, this study aims to achieve the following: (1) detect riverbank erosion using images from Landsat 5, 7, and 8 and Sentinel-2 using Google Earth Engine and (2) develop a methodology for identifying riverbank erosion hotspots and considering socio-economic exposure along the Mekong River in Cambodia. A hotspot map is important in highlighting areas that are potentially highly impacted by riverbank erosion. This study demonstrates the potential improvement of riverbank line detection using Landsat and Sentinel-2 and their applicability to the continuous monitoring of riverbank changes in large-scale river basins.
2. Study Area
2.1. Mekong River
The 10th largest in terms of mean annual discharge (approximately 475 km3 at its mouth), the Mekong River is the 12th longest river in the world [7]. This transboundary river originates in the Tibetan Plateau in China and flows through Myanmar, Lao PDR, Thailand, Cambodia, and Vietnam, where it enters the South China Sea. The Mekong River Basin covers an area of 795,000 km2, and the total length of the river is approximately 4800 km [7,51]. The slope of the river varies considerably from its headwaters to its outlet in the South China Sea. The upper part of Mekong River is steep, with an average slope of 2 m/km. From Chiang Saen to Kratie, the river has a moderately steep slope of about 0.25 m/km, on average. Downstream from Kratie, the riverbed is relatively flat on the Mekong floodplain and Delta, with an average slope of 0.03 m/km [52]. The Mekong River flows on rocks through narrow valleys roughly 3000 km upstream and on rocks and alluvium the next 1000 km before running freely on alluvium in Cambodia and Vietnam [53,54].
2.2. Mekong River in Cambodia
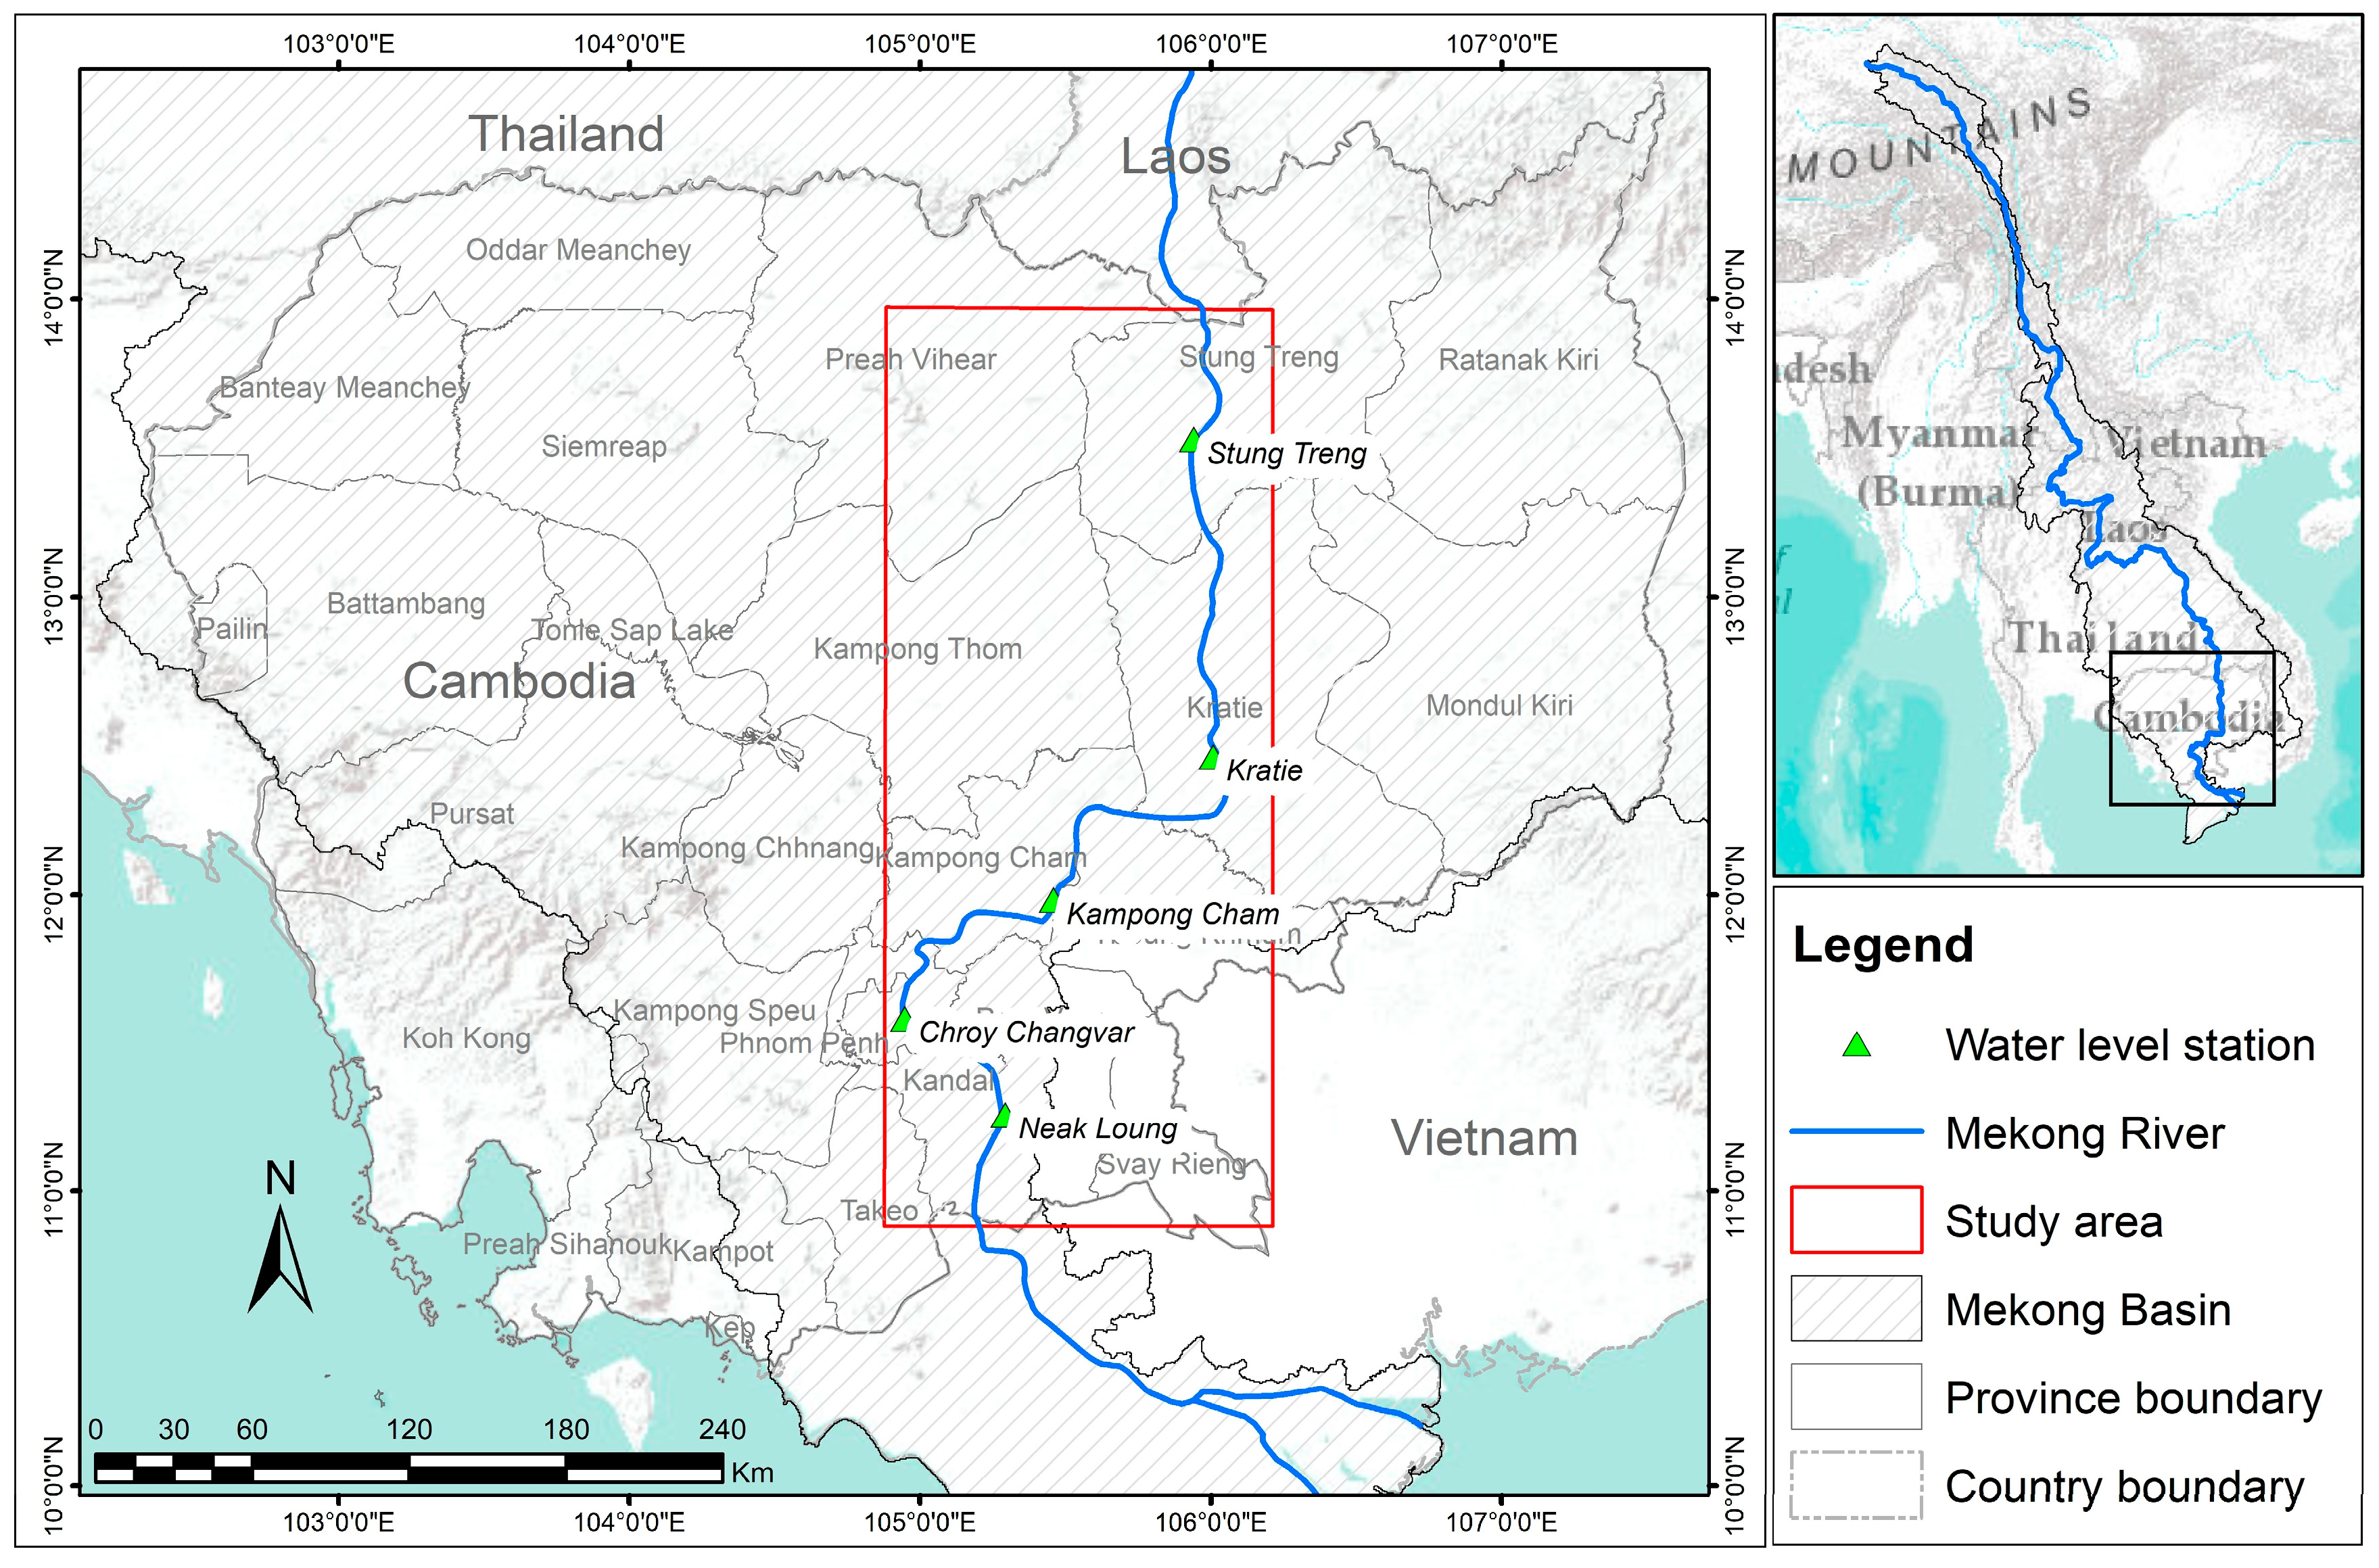
The study area was a section of the Mekong River that flows in Cambodia (see Figure 1), passing through five provinces (Stung Treng, Kratie, Kampong Cham, Kandal, and Prey Veng) and the capital city of Phnom Penh, with a total length and an average width of around 500 km and 1.5 km, respectively. Approximately 86% of Cambodia’s total area lies within the Mekong River Basin [9]. In Cambodia, the river runs over variable thicknesses of alluvium, with local exposures of Triassic sedimentary rocks and Neogene basalts near the river [53]. South of Stung Treng, the Mekong River has bedrock-confined channel characteristics [55]. The river near Kratie has an especially noticeable alluvial character, running over a large zone of Quaternary alluvium that overlies Lower to Middle Jurassic and Triassic continental red beds, which are mainly composed of calcareous shales and sands [55]. The river becomes alluvial after passing through Kratie until it reaches the delta [54]. The Mekong River consists of multiple channels, rapids, local shallows and deep pools within all channels [56]. The depth of the river varies greatly because of these features. One pool in the Mekong River, located between Stung Treng and Kratie, is up to 80 m deep [57]. Based on cross-section data collected at water level monitoring stations, the depth of the river changed from 42 m at Stung Treng to around 26 m downstream at Neak Loung station. At Kratie, Kampong Cham, and Phnom Penh (Bassac) stations, river depths were measured at 21 m, 40 m, and 25 m, respectively [58].
The climate of Cambodia is characterized by tropical monsoons with two major wet and dry seasons of relatively equal length [9,59]. The rainy season is from mid-May to early October and the dry season is between early November and mid-March and there are transition periods in between. The average annual rainfall in Cambodia is approximately 1400 mm in the central lowlands, and it may reach up to 4000 mm in some coastal zones or highland areas [59].
In the dry season, the Mekong River flow consists of predominantly melted snow and water released from reservoirs in the Upper Mekong River Basin and Lao PDR, whereas in the wet season, the flow is dominated by monsoon rains. According to historical data from 1960–2004 (45 years), the river’s mean annual discharge was about 419 km3 at Kratie in Cambodia, and the mean monthly discharge varied from 2220 m3/s in April to 36,700 m3/s in September following the dry and wet seasons [60]. In terms of water levels, seasonal change is remarkably high. According to recorded data from the MRC data portal [61], from 1933–2022, the minimum and maximum water levels were 3.75 m in March 1933 and 24.28 m in September 1939. In 2000 (a big flood year in terms of flow volume), the water level was 22.60 m at Kratie station during the flood peak. Between 2009 and 2013, the average suspended sediment load at Kratie was 72.5 Mt/yr [62].
3. Methodology
Figure 2 provides a summary of the methodology used in this study. First, a riverbank erosion and deposition map was developed using satellite images from Landsat 5, 7, and 8 and Sentinel-2 on Google Earth Engine platform. The normalized difference water index (NDWI) and modified NDWI (MNDWI) were employed to detect water bodies and identify riverbank lines. The results were validated using Google Earth images. Second, a long-term historical map of morphological changes from 1990–2020 was created based on Landsat images. In addition, a short-term river morphological map showing changes from 2016–2021 was created using Sentinel-2 images. Long-term and short-term rates of change in a direction perpendicular to the river were analyzed using the Digital Shoreline Analysis System (DSAS) [63] and other tools in ArcMap. Third, an exposure map was created by combining maps showing population density and land cover. Finally, the riverbank erosion rate maps were overlaid with a hazard exposure map to develop a map of riverbank erosion hotspots. The riverbank erosion hotspots were verified by data collected from a field survey and interviews. The methodology is described in detail in the following section.
3.1. Riverbank Erosion and Deposition Mapping
Riverbank erosion and deposition maps were created using algorithms in the Google Engine Platform. First, images collected between January and June were selected to represent the annual river water body because the variations in water level within this period are small and this small variation helps reduce the uncertainty of riverbank line detection, especially in locations where the riverbank slope is slight. The data on daily water levels used in this study were recorded at the Kampong Cham station from the MRC between 1984 and 2020. Second, the cloud pixels in each image were removed. The median was used in the image collection each year to remove outliers from each pixel, which might have been due to image quality and extreme water levels. Third, data on river water bodies were generated using the water index method (see Section 3.2.1). Finally, riverbank erosion and deposition were determined by comparing data on river water bodies collected in two different years. A pixel was classified as erosion when a non-water pixel in one year became a water pixel in the following year. Conversely, a pixel was classified as a deposition when a water pixel in one year became a non-water pixel in the following year.
3.2. Riverbank Line Identification Using Water Indices
3.2.1. Water Indices
Water indices are widely used to identify bodies of water. In this study, riverbank lines were generated from water bodies detected by MNDWI and NDWI. These two indices are commonly used in water body detection [41]. NDWI was developed by McFeeters [35] using green and near-infrared (NIR) bands to highlight water bodies. The NDWI helps to identify water surface effectively; however, it is sensitive to built-up areas [64]. The reason is that water, and shadows from buildings and clouds have similar properties, which makes it difficult to differentiate between water and non-water surfaces [49]. To address this limitation, Xu [36] developed the MNDWI by replacing the NIR that was previously used in NDWI by the shortwave infrared (SWIR) band. Many previous studies have shown that MNDWI detected water bodies with greater accuracy than NDWI [64,65,66,67] in floodplain areas [66], urban areas, and open water [65,67]. The main limitation of MNDWI is that it cannot differentiate between water and snow [68].
Although MNDWI has performed better than NDWI in several cases, when the band resolution increases from 20 m to 10 m, NDWI at 10 m resolution (NDWI10m) has outperformed MNDWI at 20 m resolution (MNDWI20m) [64]. Du et al. [64] compared the accuracy of water body detection in a study area covered by open water bodies, urban built-up and vegetation features using NDWI10m, MNDWI20m and the downscaled MNDWI at a 10 m resolution (MNDWI10m) from Sentinel-2 images. The SWIR band in Sentinel-2 images is available only at 20 m resolution; thus, to calculate MNDWI10m, the SWIR band needed to be downscaled to 10 m, which was done using pan-sharpening algorithms. The results showed that MNDWI10m performed slightly better than NDWI10m. NDWI10m has a smaller commission error (CE) compared with MNDWI10m. However, compared with MNDWI20m, the performance of NDWI10m was significantly better.
In the present study, the MNDWI was used to detect river water bodies in Landsat images recorded between 1990 and 2020. The NDWI10m was used for the Sentinel-2 images to take advantage of 10 m resolution without the need to downscale the SWIR band to 10 m. Even though a different water index was used for the Landsat and Sentinel-2 images, the results were comparable in detecting riverbanks from water indices based on the finest image resolution available.
The NDWI [35] was computed using Equation (1).
where Green is the reflectance value of the green band, and NIR is the reflectance value of the near-infrared band.
The MNDWI [36] was computed using Equation (2).
where SWIR is the reflectance of the shortwave infrared band.
3.2.2. Water Threshold
The accuracy of water body detection could be affected by several factors, including image quality (e.g., the presence of clouds), image spatial resolution, the selected method or water index, and water threshold values. The water threshold is an important factor that affects the accuracy of water body detection. The water pixels of the NDWI and MNDWI usually have values greater than zero [64,68], and the default threshold value is zero [64]. However, this value may vary according to image scenes from different satellites, regions, and times. Therefore, adjusting this threshold value for use in a specific study could result in better water body detection. According to previous studies [40,64,65,68,69,70], the optimal water threshold was found to be between 0 and 0.3 for the NDWI and between 0 and 0.35 for the MNDWI. The water threshold of the MNDWI is frequently greater than that of the NDWI. The optimal water threshold value can sometimes be negative. Ogilvie et al. [71] found that the mean optimal thresholds of MNDWI were −0.05, 0.15, −0.19, and 0.02 for Landsat 7, Landsat 8, MODIS, and Sentinel-2, respectively. In this study, the water thresholds of the MNDWI and NDWI were determined by adjusting the threshold values so that the generated water body was close to the reference maps. Several experiments were conducted for each water index. The water thresholds of 0 for the NDWI (for Sentinel-2) and 0.1 for the MNDWI (for Landsat 5, 7, and 8) were found to effectively determine the water boundaries.
3.2.3. Validation of Landsat and Sentinel-2 Images with Google Earth Images
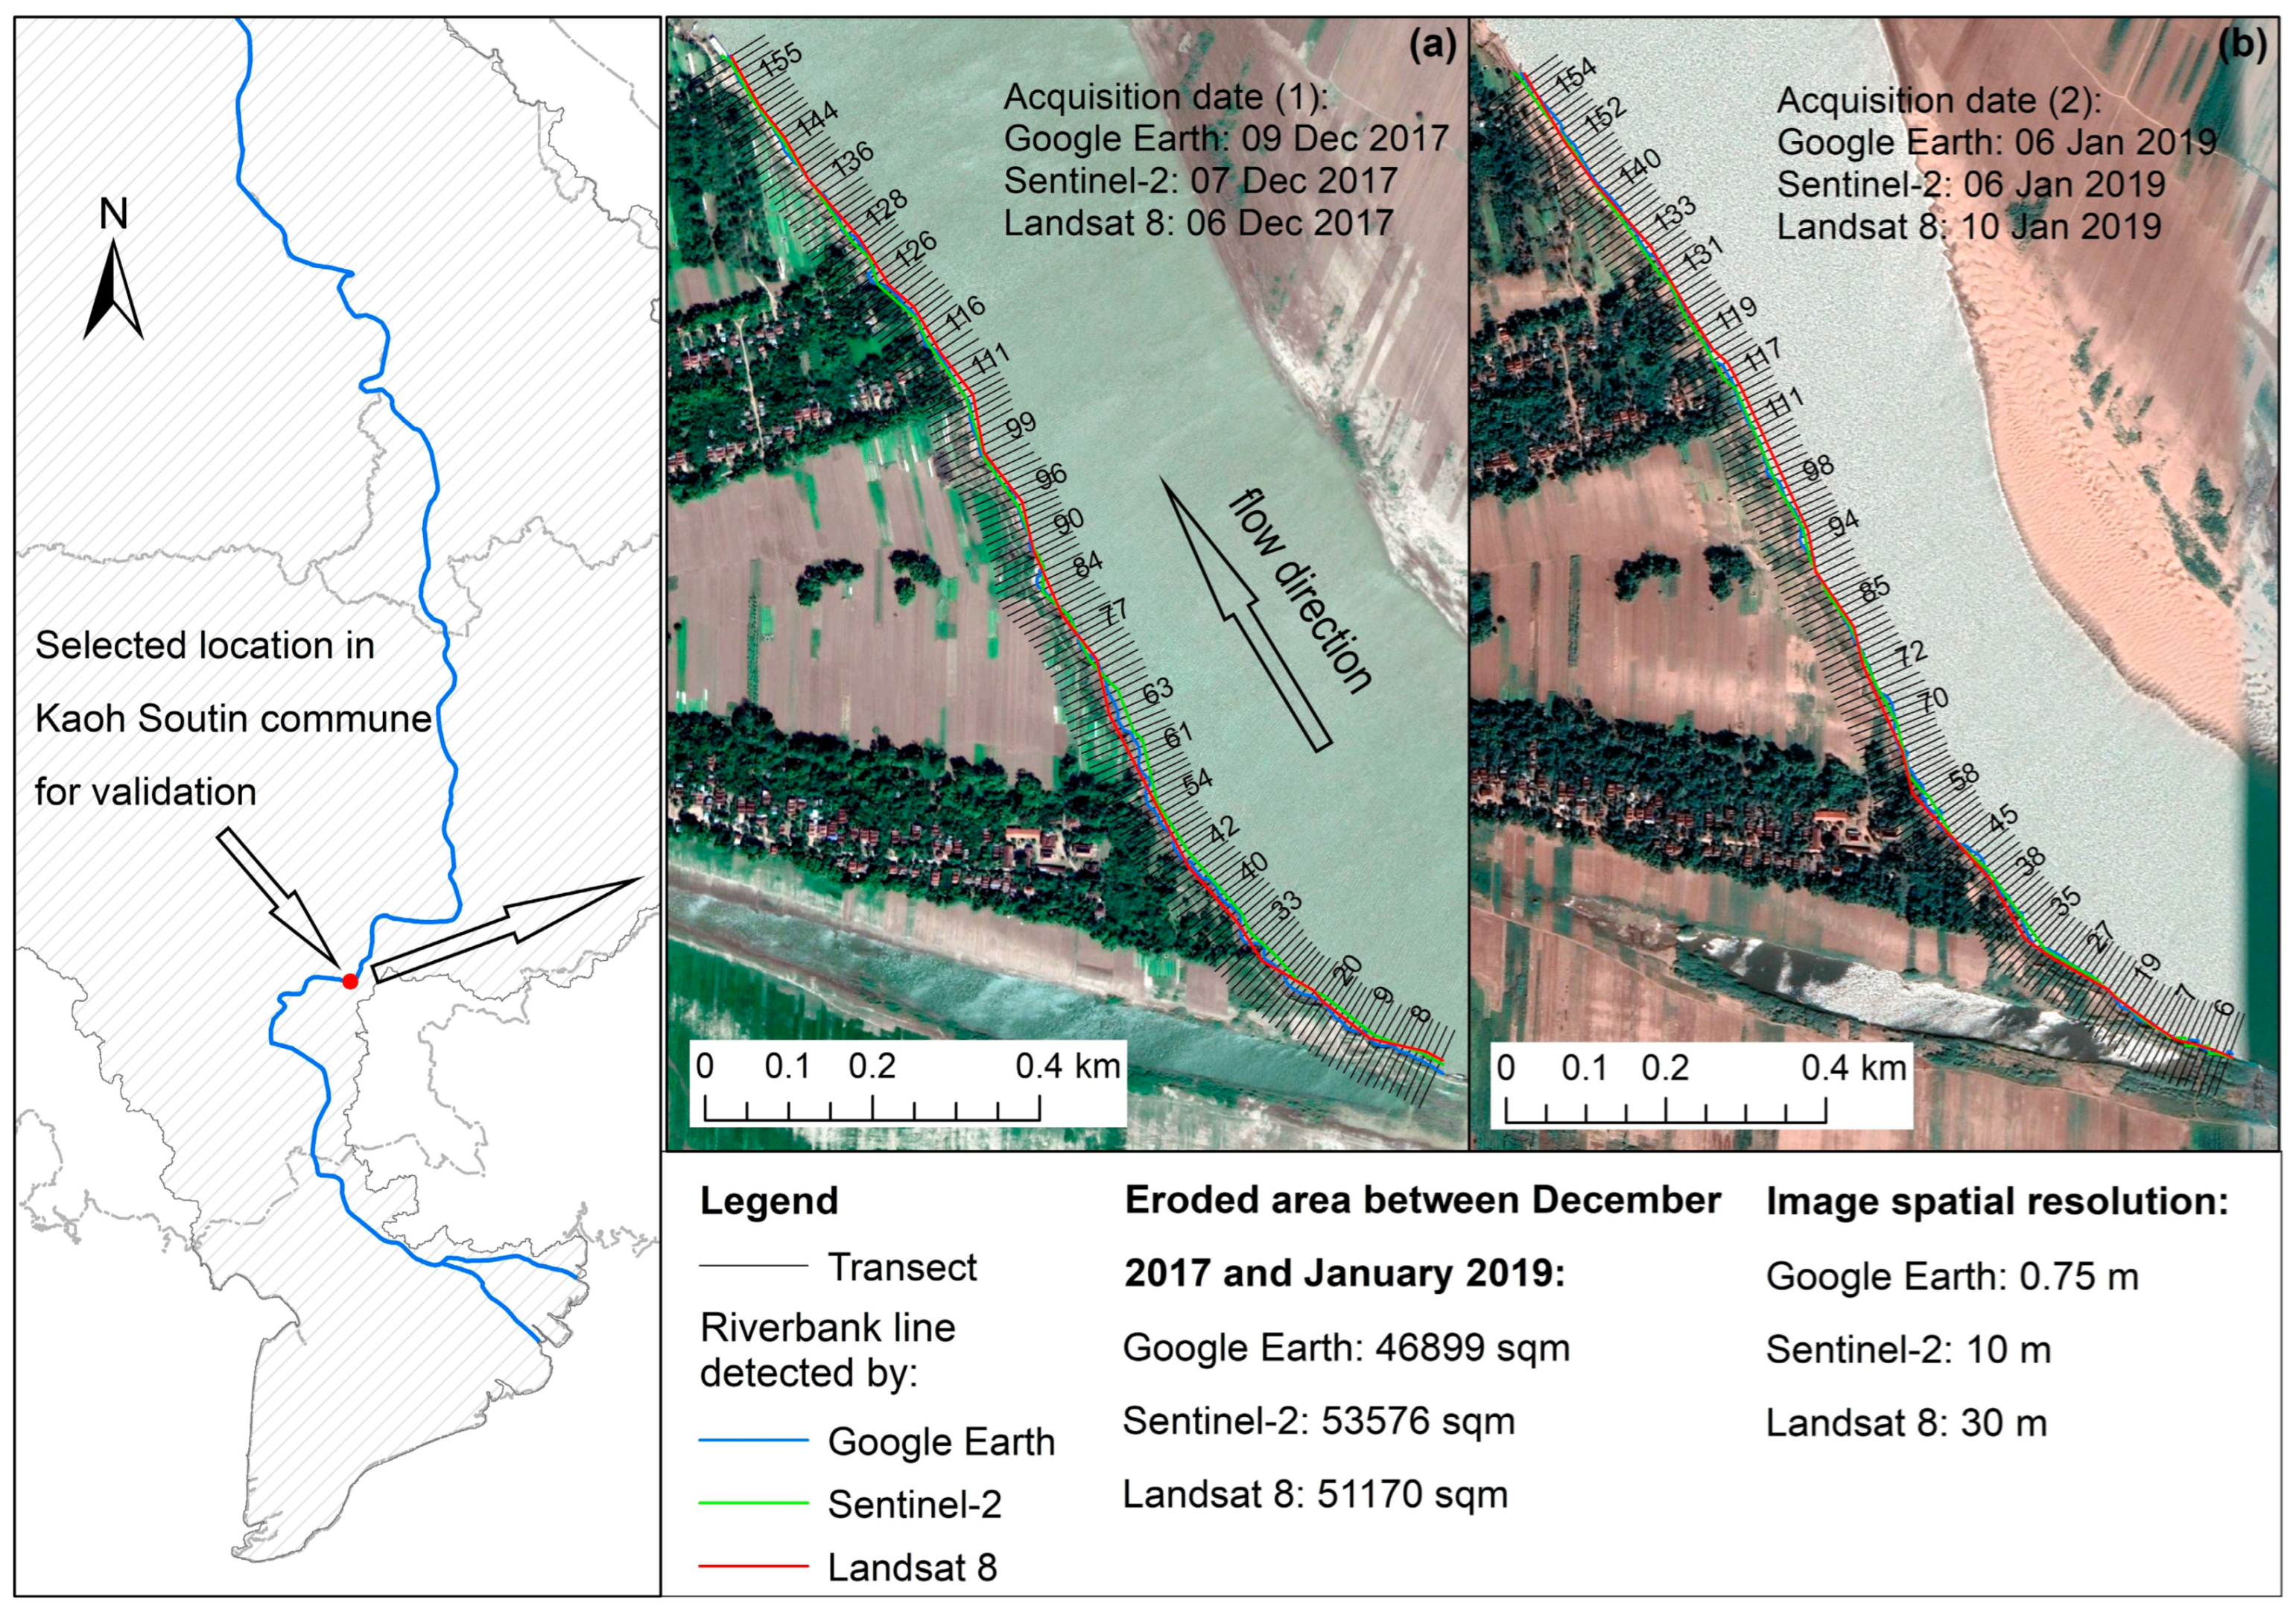
In the study area, there is no riverbank erosion monitoring system installed yet; therefore, in situ river water body mapping was not available. Images with a spatial resolution of 0.75 m from Google Earth were used instead of in situ data to validate the riverbank. Google Earth images have high spatial resolution, and they have previously been used as references for validation [41]. One river segment in the Kaoh Soutin Commune in Kampong Cham Province was selected for validation. The distance of each transect from the baseline to the riverbank line detected in the Google Earth images and satellite images was calculated. The root mean square error (RMSE) was used as a criterion for validating the capability of Landsat and Sentinel-2 to detect riverbank lines. The RMSE was computed using Equation (3).
where Lobs,i is the ith transect distance from the baseline to the riverbank detected in the Google Earth images, and Lextract,i is the ith transect distance from the baseline to the riverbank detected in the Landsat and Sentinel-2 images.
3.3. Riverbank Change Rate
Riverbank erosion and deposition rates were computed using DSAS [63] which is an open-access tool in the ArcGIS software. DSAS was developed to analyze changes in shorelines. This tool is also used to study changes in riverbanks. DSAS can provide statistics on the rate of change in a time series of shorelines/riverbank lines. First, riverbank lines in different years were imported. Then, a baseline riverbank and transects along the Mekong River for every 1 km were created. Finally, the rate of change in every transect was calculated using the end point rate (EPR) method. Changes in the riverbank were analyzed using Landsat and Sentinel-2 images.
3.4. Exposure and Hotspot Mapping
To identify hotspots, Dilley et al. [72] defined a natural disaster “hotspot” as a specific area or region that may be at relatively high risk of an adverse impact by one or more natural hazard events. In this study, a riverbank erosion hotspot is defined as an area subject to substantial and frequent erosion, with a high exposure level. According to the Intergovernmental Panel on Climate Change [73], the term “exposure” refers to “the presence of people, livelihoods, environmental services and resources, infrastructure, or economic, social, or cultural assets in places that could be adversely affected”. Despite the high severity of a hazard, it is not considered a hotspot if it does not affect humans or human infrastructure. This study did not evaluate the value of assets at risk but focused on the potential impact of riverbank erosion on human livelihoods.
The exposure map was created by considering two main factors: land cover and population situated within 1500 m from the riverbank. Both factors were weighted equally. Next, the exposure map was combined with the erosion rate to generate a map of riverbank erosion hotspots. The erosion rate was calculated as the area of land eroded in each commune in hectares per year. Because erosion rates change over time, long-term and current erosion rates based on Landsat images were considered. The long-term erosion rate was between 1990 and 2020, whereas the current erosion rate was between 2015 and 2020. The erosion rate and exposure level were also weighted equally. Two communes with very high potential impacts were selected from the hotspot map for validation. Field surveys and interviews with community leaders and residents of the two communes were conducted to verify the actual situation of riverbank erosion on the ground.
3.5. Data
Table 1 presents the data required to analyze the riverbank erosion rate and map riverbank erosion hotspots, their availability, and their sources. In this study, satellite images captured by different instruments were used. The consistency of Landsat and Sentinel-2 images has been assessed in previous studies [74,75,76,77,78] to determine the potential of combining both products to provide continuity in data used for monitoring purpose, shorten the revisit times, as well as to increase resolution and the variety of data. The results showed good agreement between the reflectance of different bands of Landsat and Sentinel-2 images [74,75,77]. In a study by Flood [77], Sentinel-2 was found to have good compatibility with Landsat 7 and 8. The Pearson correlation value ranged from 0.97–0.99 based on the band. The slope of the orthogonal distance regression ranged from 0.93–1.09, while the RMSE ranged from 0.005–0.021. These values indicate adequate agreement when combinations of Landsat and Sentinel-2 are needed [77].
3.5.1. Landsat
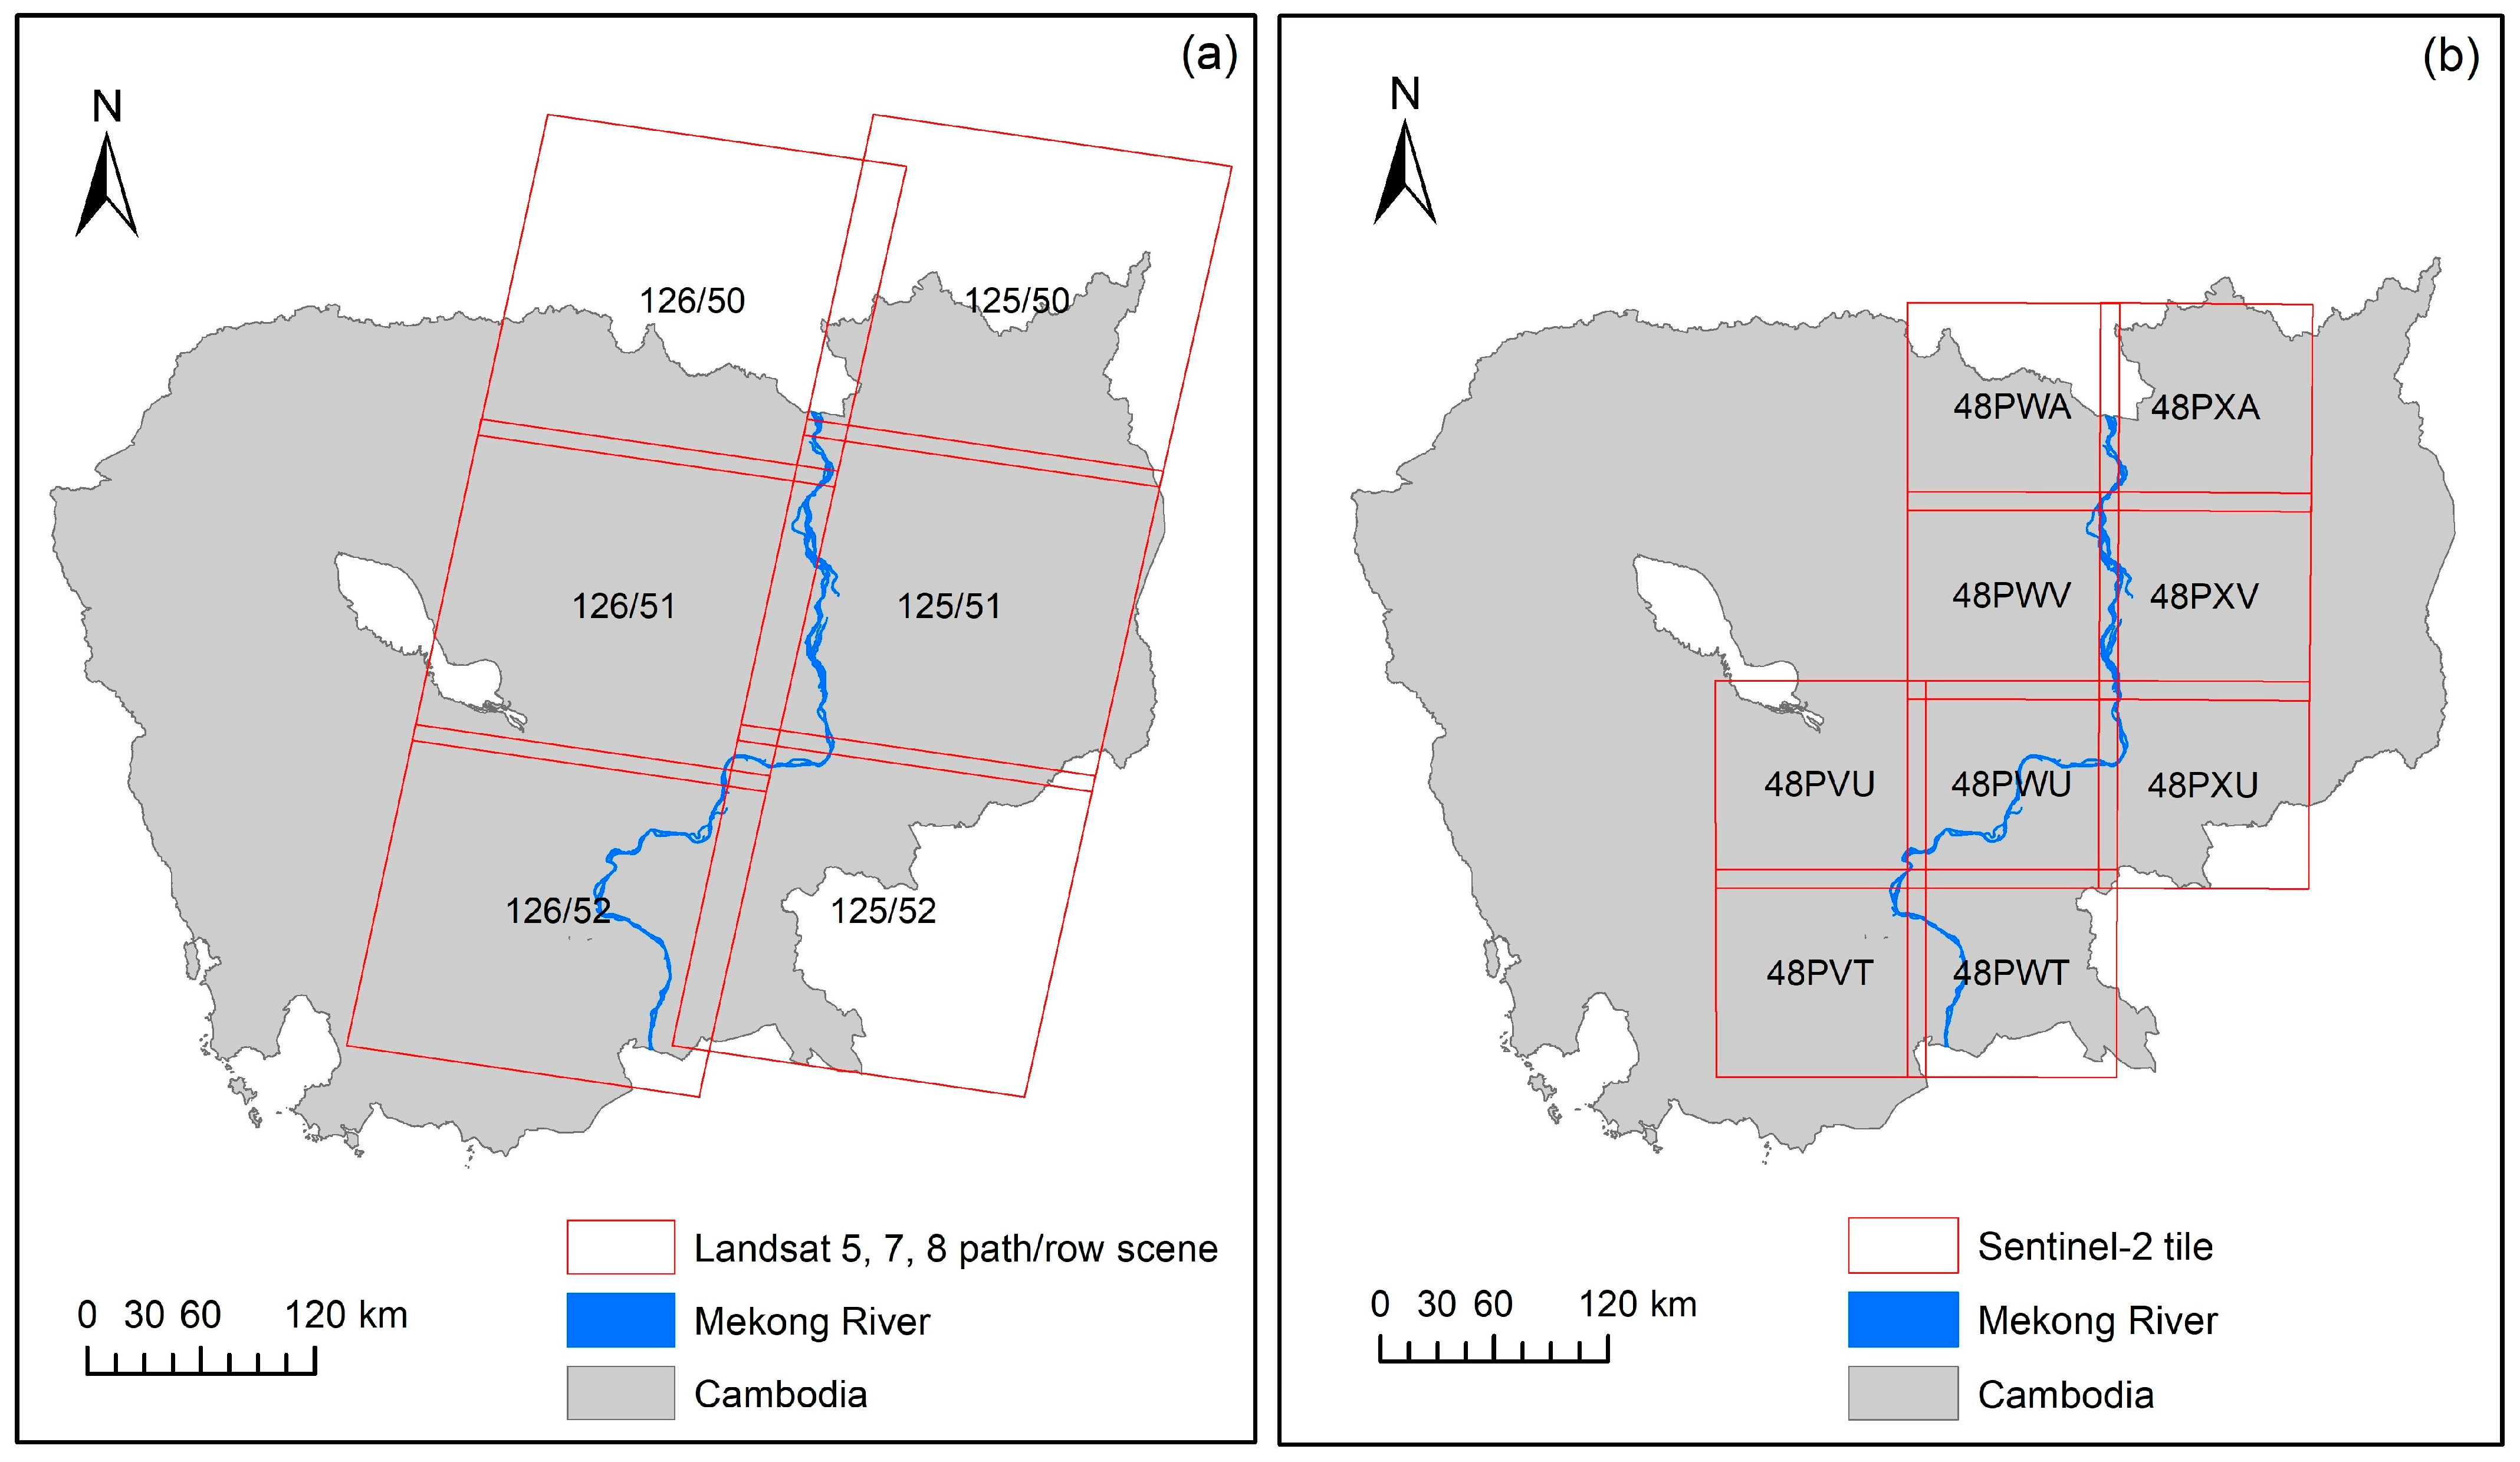
Landsat was first placed in orbit in 1972 [79]. Since then, seven Landsats have been successfully launched to capture global land conditions and dynamics. Landsat is described and explained in detail in Williams et al. [79], Woodcock et al. [80], Irons et al. [81], Loveland and Dwyer [82], and Roy et al. [83]. In this study, images collected by Landsat 5, 7, and 8 from 1990–2020 with a spatial resolution of 30 m were employed (see Table 2). The path/row scenes of Landsat 5, 7, and 8 used in this study are shown in Figure 3.
3.5.2. Sentinel-2
Copernicus Sentinel-2 [84] is a new earth observation mission operated by the European Space Agency. The mission consists of two identical Sentinel-2 satellites that operate simultaneously in the same orbit 180° apart, resulting in a five-day global revisit time [85]. The two satellites, Sentinel-2A and Sentinel-2B, were launched in 2015 and 2017, respectively [85]. Sentinel-2 carries an optical instrument that is a multispectral imager (MSI) that can capture 13 spectral bands at 10 m, 20 m, and 60 m spatial resolutions [84]. The orbital swath width of the instruments is 290 km [85]. In this study, green, and NIR bands with a spatial resolution of 10 m were used to assess the annual changes in riverbanks between 2016 and 2021. The Sentinel-2 tiles covering the study area are shown in Figure 3.
3.5.3. Land Cover
Land cover data in 2010 were developed by the MRC, an intergovernmental organization in the region. The land cover map was developed based on time series Landsat 5 Thematic Mapper images and data collected in the field [86]. Land cover classification was conducted using a semi-automatic approach: supervised classification (based on the area of interest with data collected in fieldwork) and unsupervised classification. The classification included 20 types of land cover. To simplify the computation, the land cover types were reclassified into five main groups: built-up areas (i.e., urban areas), agricultural land (paddy rice rotated with the annual crop, annual crops, shifting cultivation, orchards, industrial plantations, aquaculture, and aquaculture rotated with paddy rice), forest (flooded forests, deciduous forests, evergreen forests, forest plantations, bamboo forests, coniferous forests, and mangroves), vegetation and bare land (grassland, shrubland, bare land, and marsh and swamp areas), and water bodies.
3.5.4. Population Density
The population density used in the present study was acquired from the Gridded Population of the World, version 4 (GPWv4) [87]. This dataset consists of estimated global population densities in the years 2000, 2005, 2010, 2015, and 2020 on 1-km grid cells. The input datasets in GPWv4 include geographic boundaries, census data, United Nations population estimates, and a global water mask [88]. The input population data were collected from the results of the 2010 round of censuses, which took place between 2005 and 2014. These input population data were extrapolated to calculate population estimates for each modeled year mentioned above. The population counts from census and administrative units were assigned to grid cells using a proportional allocation gridding algorithm. The gridded population density provides estimates of the number of people per square kilometer corresponding to national censuses and population registers.
4. Results and Discussion
4.1. Comparison of Riverbank Erosion Detected by Landsat 8 and Sentinel-2
Riverbank detection from satellite images using the water index depends greatly on image resolution and water threshold. In this study, the finest resolution available from Landsat 8 at 30 m and Sentinel-2 at 10 m were employed, and the water threshold of 0.1 for the MNDWI of Landsat 8 and 0 for the NDWI of Sentinel-2 were found to effectively determine water boundaries. The performances of Landsat 8 and Sentinel-2 in detecting riverbank erosion were assessed by comparing the riverbank lines generated in images from both satellites with the riverbank lines generated from Google Earth images. Aerial images from Google Earth were exported and rectified in ArcMap and used as a reference to validate the riverbank lines detected by Landsat 8 and Sentinel-2. The river section in the Kaoh Soutin Commune was selected for comparison. To minimize bias in the comparison, the three product images had to be cloud free and acquired on the same date or the closest possible dates. The acquisition date of each image was selected as noted in Figure 4.
Although different water indices were used for Landsat and Sentinel-2, the results were comparable in terms of detecting riverbanks from the water indices based on the finest image resolution available. Figure 4 shows the riverbank lines detected from Landsat 8, Sentinel-2, and Google Earth images in December 2018 and January 2019. Based on the comparison of the two satellite products, the riverbank lines detected by Sentinel-2 well matched the riverbank lines in the Google Earth images during both periods. However, when the land-eroded areas were compared, the results of both satellite images did not show considerable differences. The results of Landsat 8 in this specific case were better than Sentinel-2 because the negative and positive errors canceled each other.
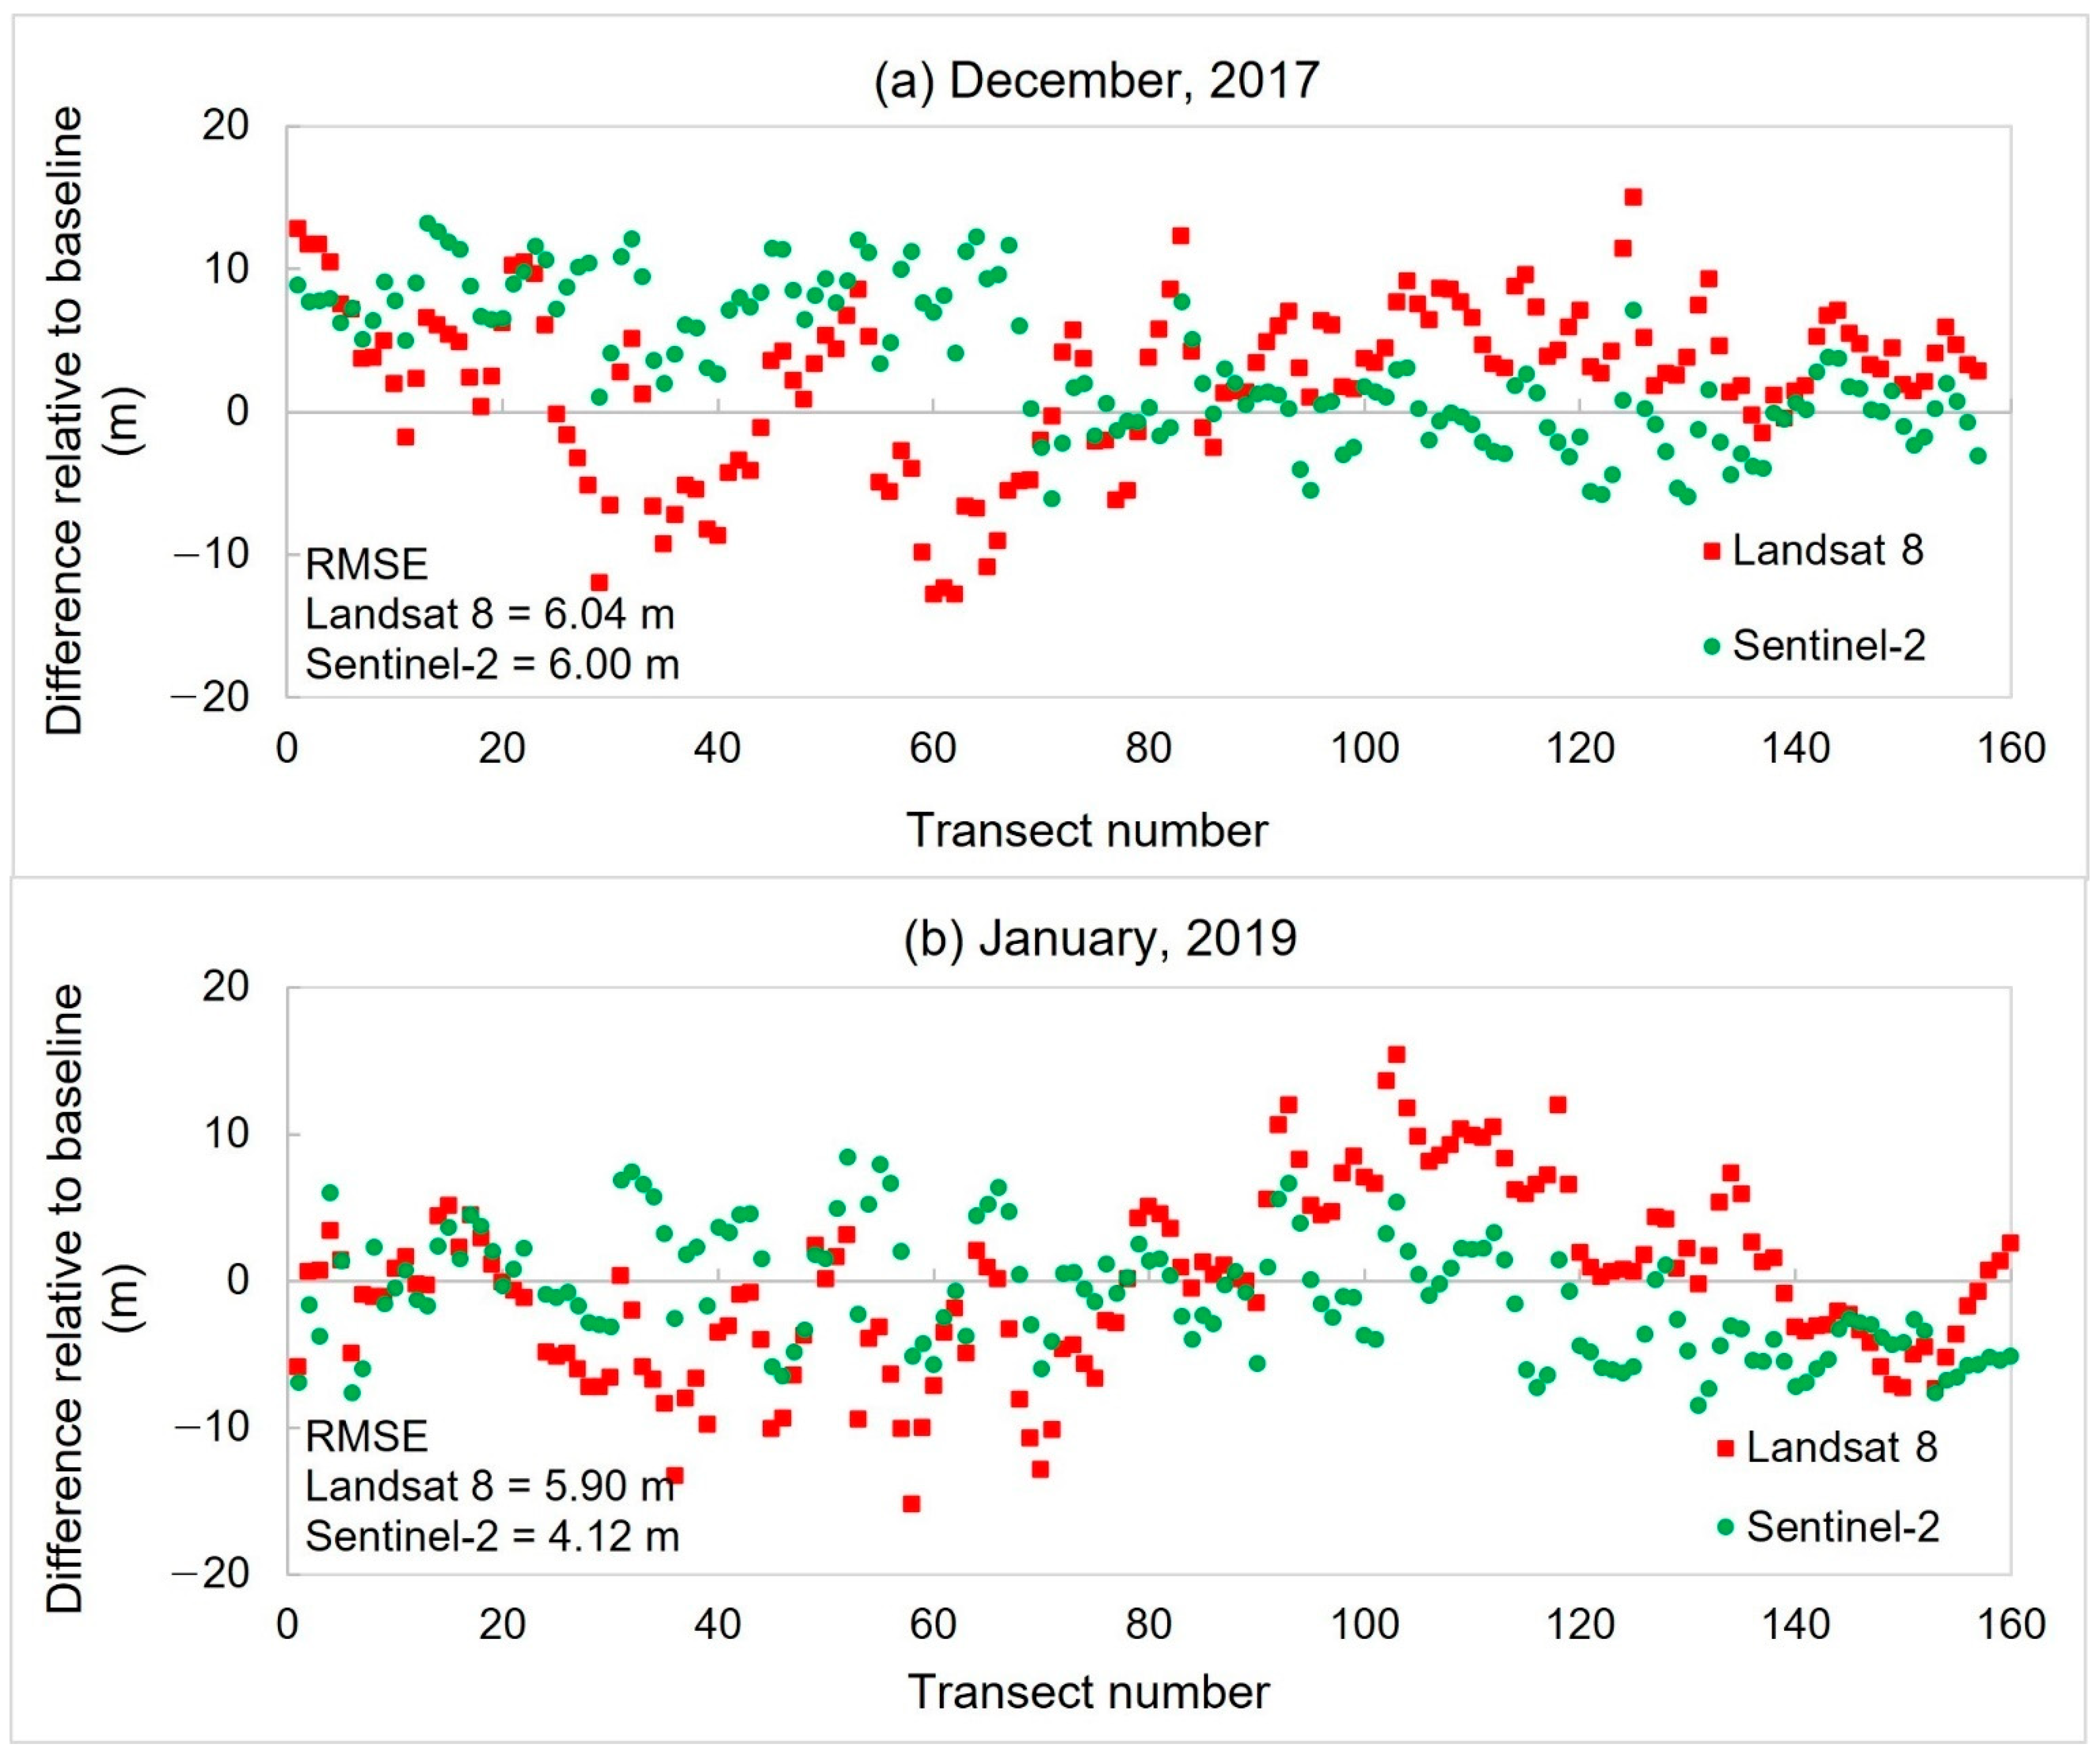
Figure 5 presents the results of the comparison of errors between the riverbank lines detected by Landsat 8 and Sentinel-2 and the baseline detected in the Google Earth images. The riverbank lines detected by Landsat 8 had a slightly higher error range compared to those detected by Sentinel-2, which was due to coarser resolution. The riverbank lines detected by both satellites in 2017 showed a similar error, as indicated by RMSEs of 6.04 m and 6 m for Landsat 8 and Sentinel-2, respectively. In another comparison conducted in 2019, Sentinel-2 performed better than Landsat 8, with RMSEs of 4.12 m and 5.90 m, respectively.
4.2. Riverbank Erosion and Deposition
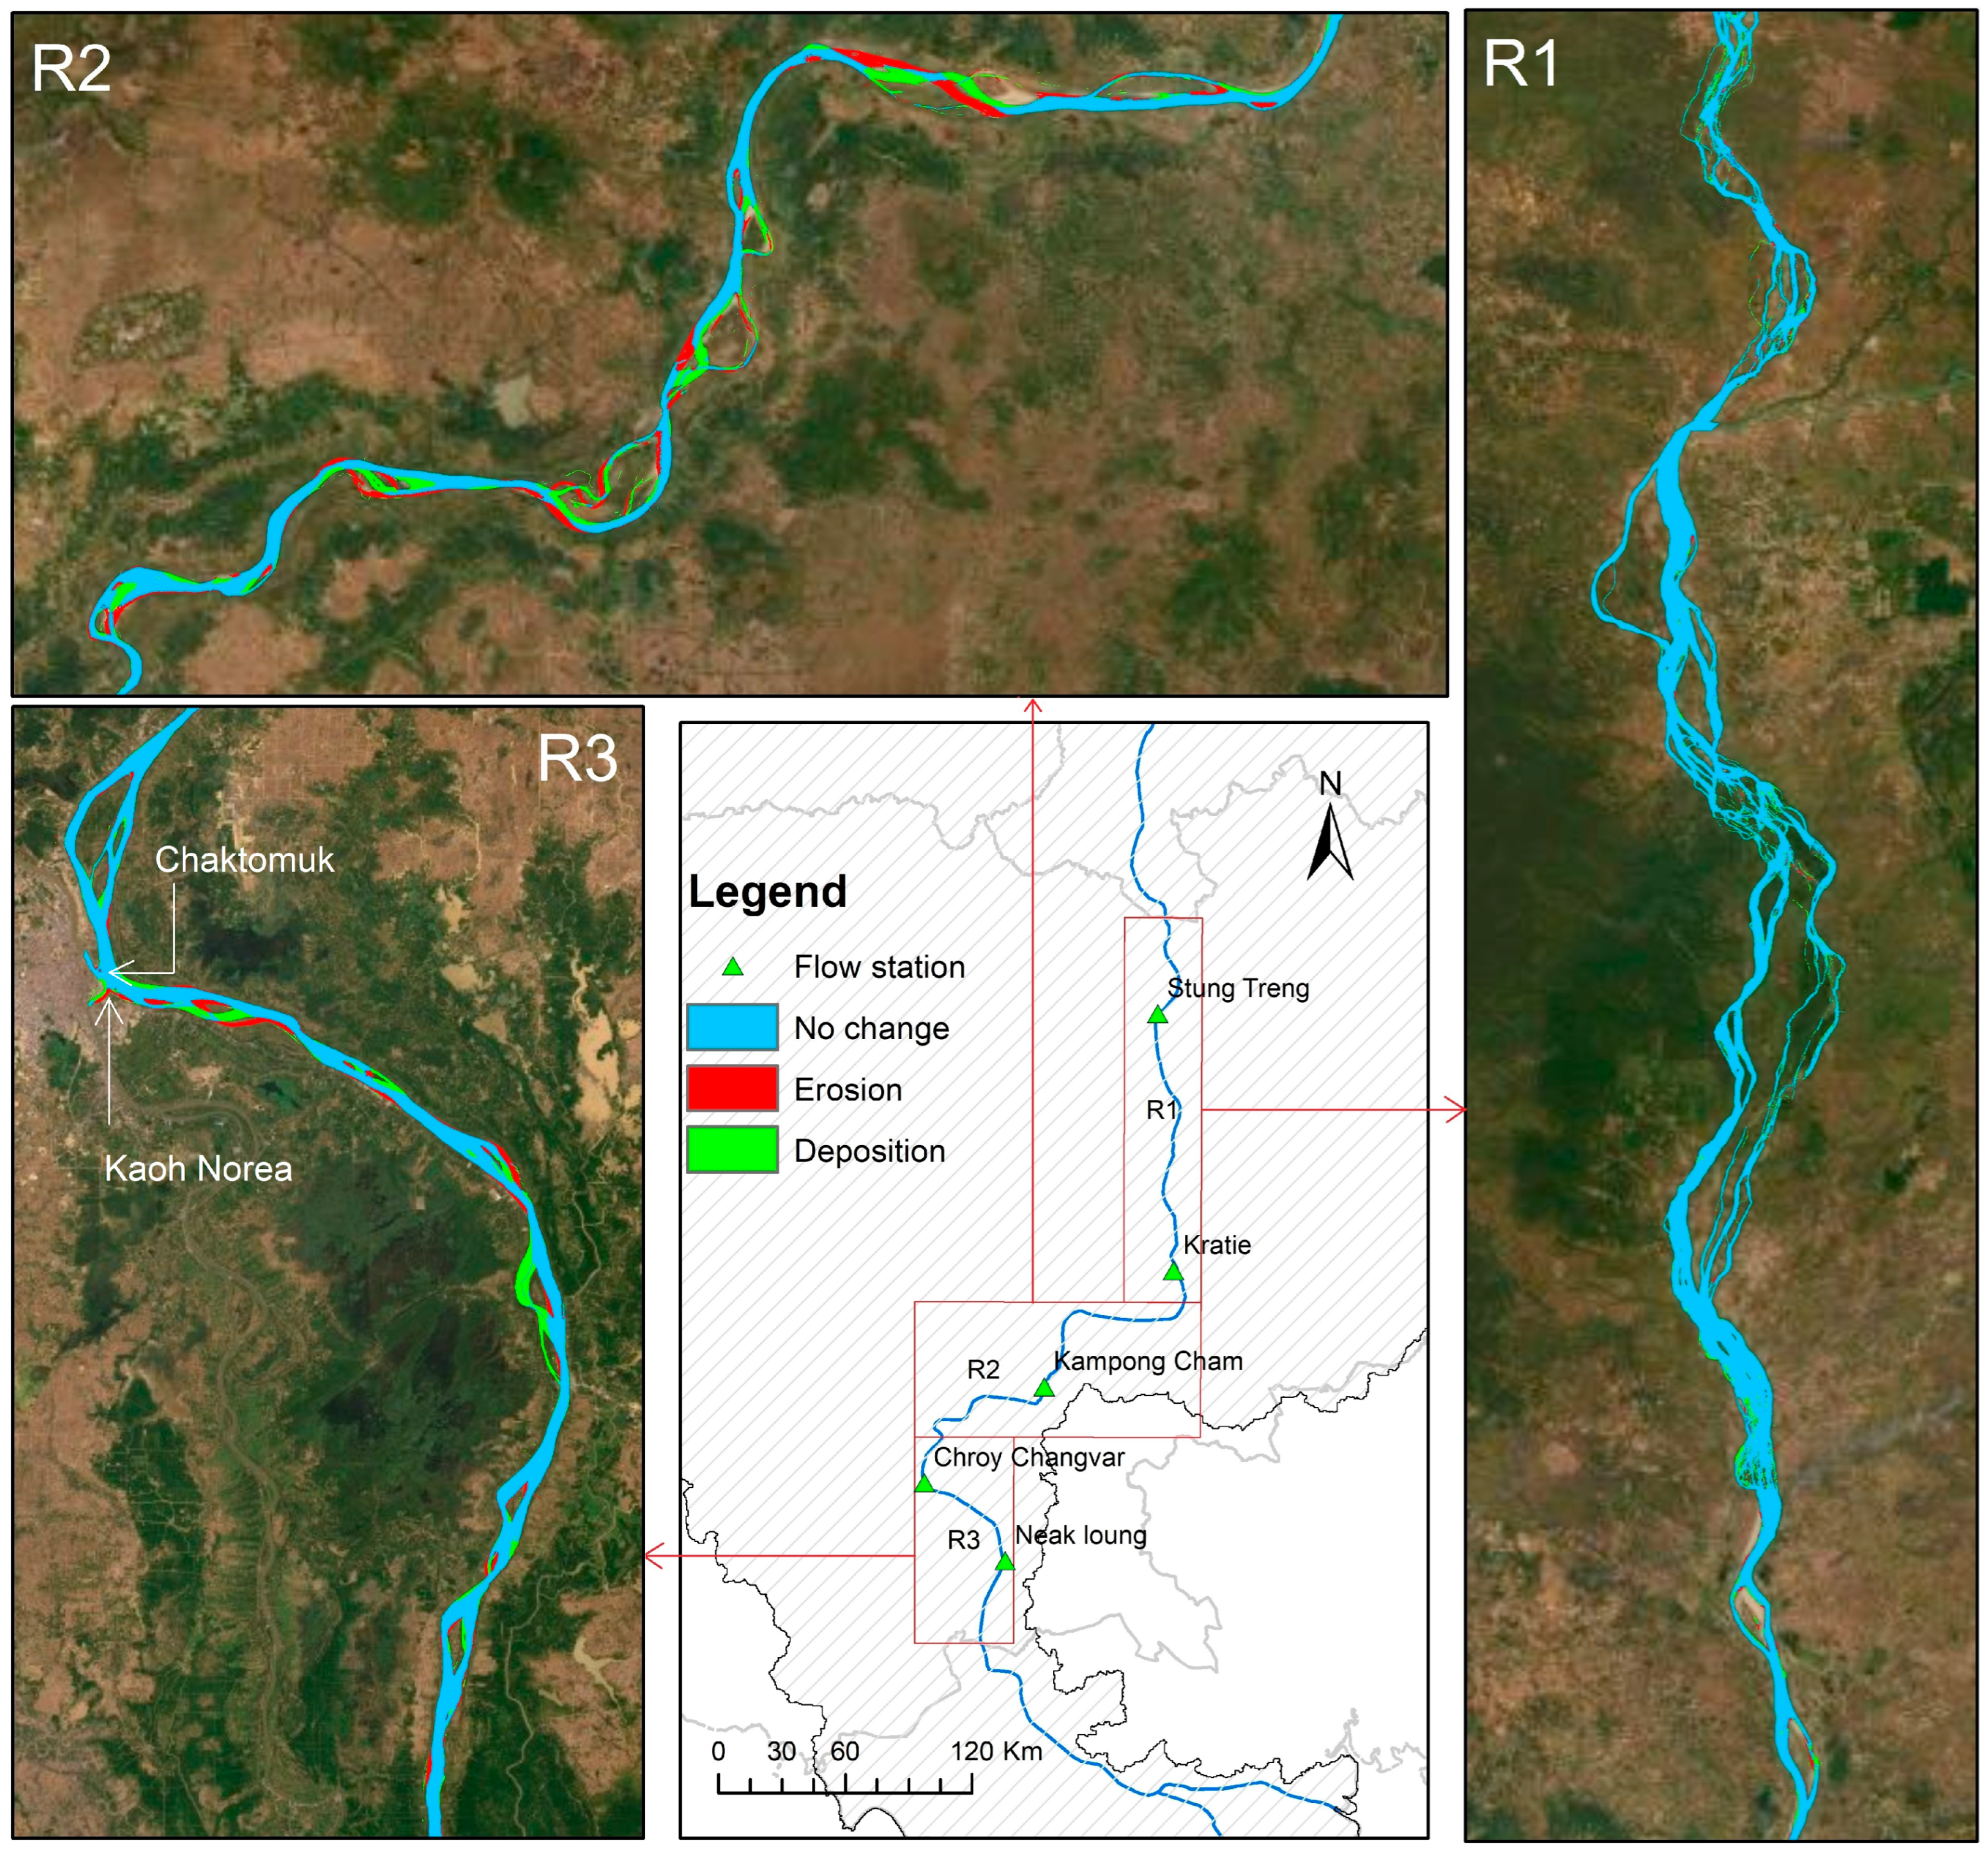
Figure 6 shows the long-term changes (1990–2020) in riverbanks along the Mekong River in Cambodia. In this study, the river was divided into three main reaches. The upper reach (R1) is from the Cambodia–Laos border to Kratie, which is characterized by braided channels with islands occupied by shrubs, bare land, forests, flooded forests, marshes, and swamp areas, as well as some agricultural land. Along this part of the river, changes in the riverbank were too small to be detected by Landsat. The braided channels consist of many small streams and islands, which makes the extent of the water body highly sensitive to variations in water levels. This condition could lead to poor accuracy in riverbank line detection and false classifications of erosion and deposition. Figure 6 shows erosions and depositions on islands; however, there are more depositions than erosion. On the main banks, riverbank erosion has not been severe over the last 30 years.
Riverbank erosion was predominant in the lower reaches of the Mekong River in Cambodia (R2 and R3). R2 and R3 are located in the Mekong Delta region. The elevation of this area is relatively low, and the slope of the river is gentle. Overbank flooding and inundation beyond riverbanks are common during the rainy season [53]. Figure 6 shows very high erosion along R2, especially near the bends. While vast areas of land (mainly agricultural) had been swept away by the river, newly deposited land emerged in nearby locations. Some patterns of riverbank shifting were observed in this reach. The lowermost reach in this study (R3) has also experienced high erosion and deposition over the last 30 years. In the Chaktomuk Confluence, the amount of previous erosion observed at Kaoh Norea was remarkable. However, recently, the area was filled with sand to construct high-rise buildings. Downstream of the Chaktomuk area, remarkable changes in river morphology were observed.
4.3. Riverbank Erosion Rate
4.3.1. Long-Term Erosion
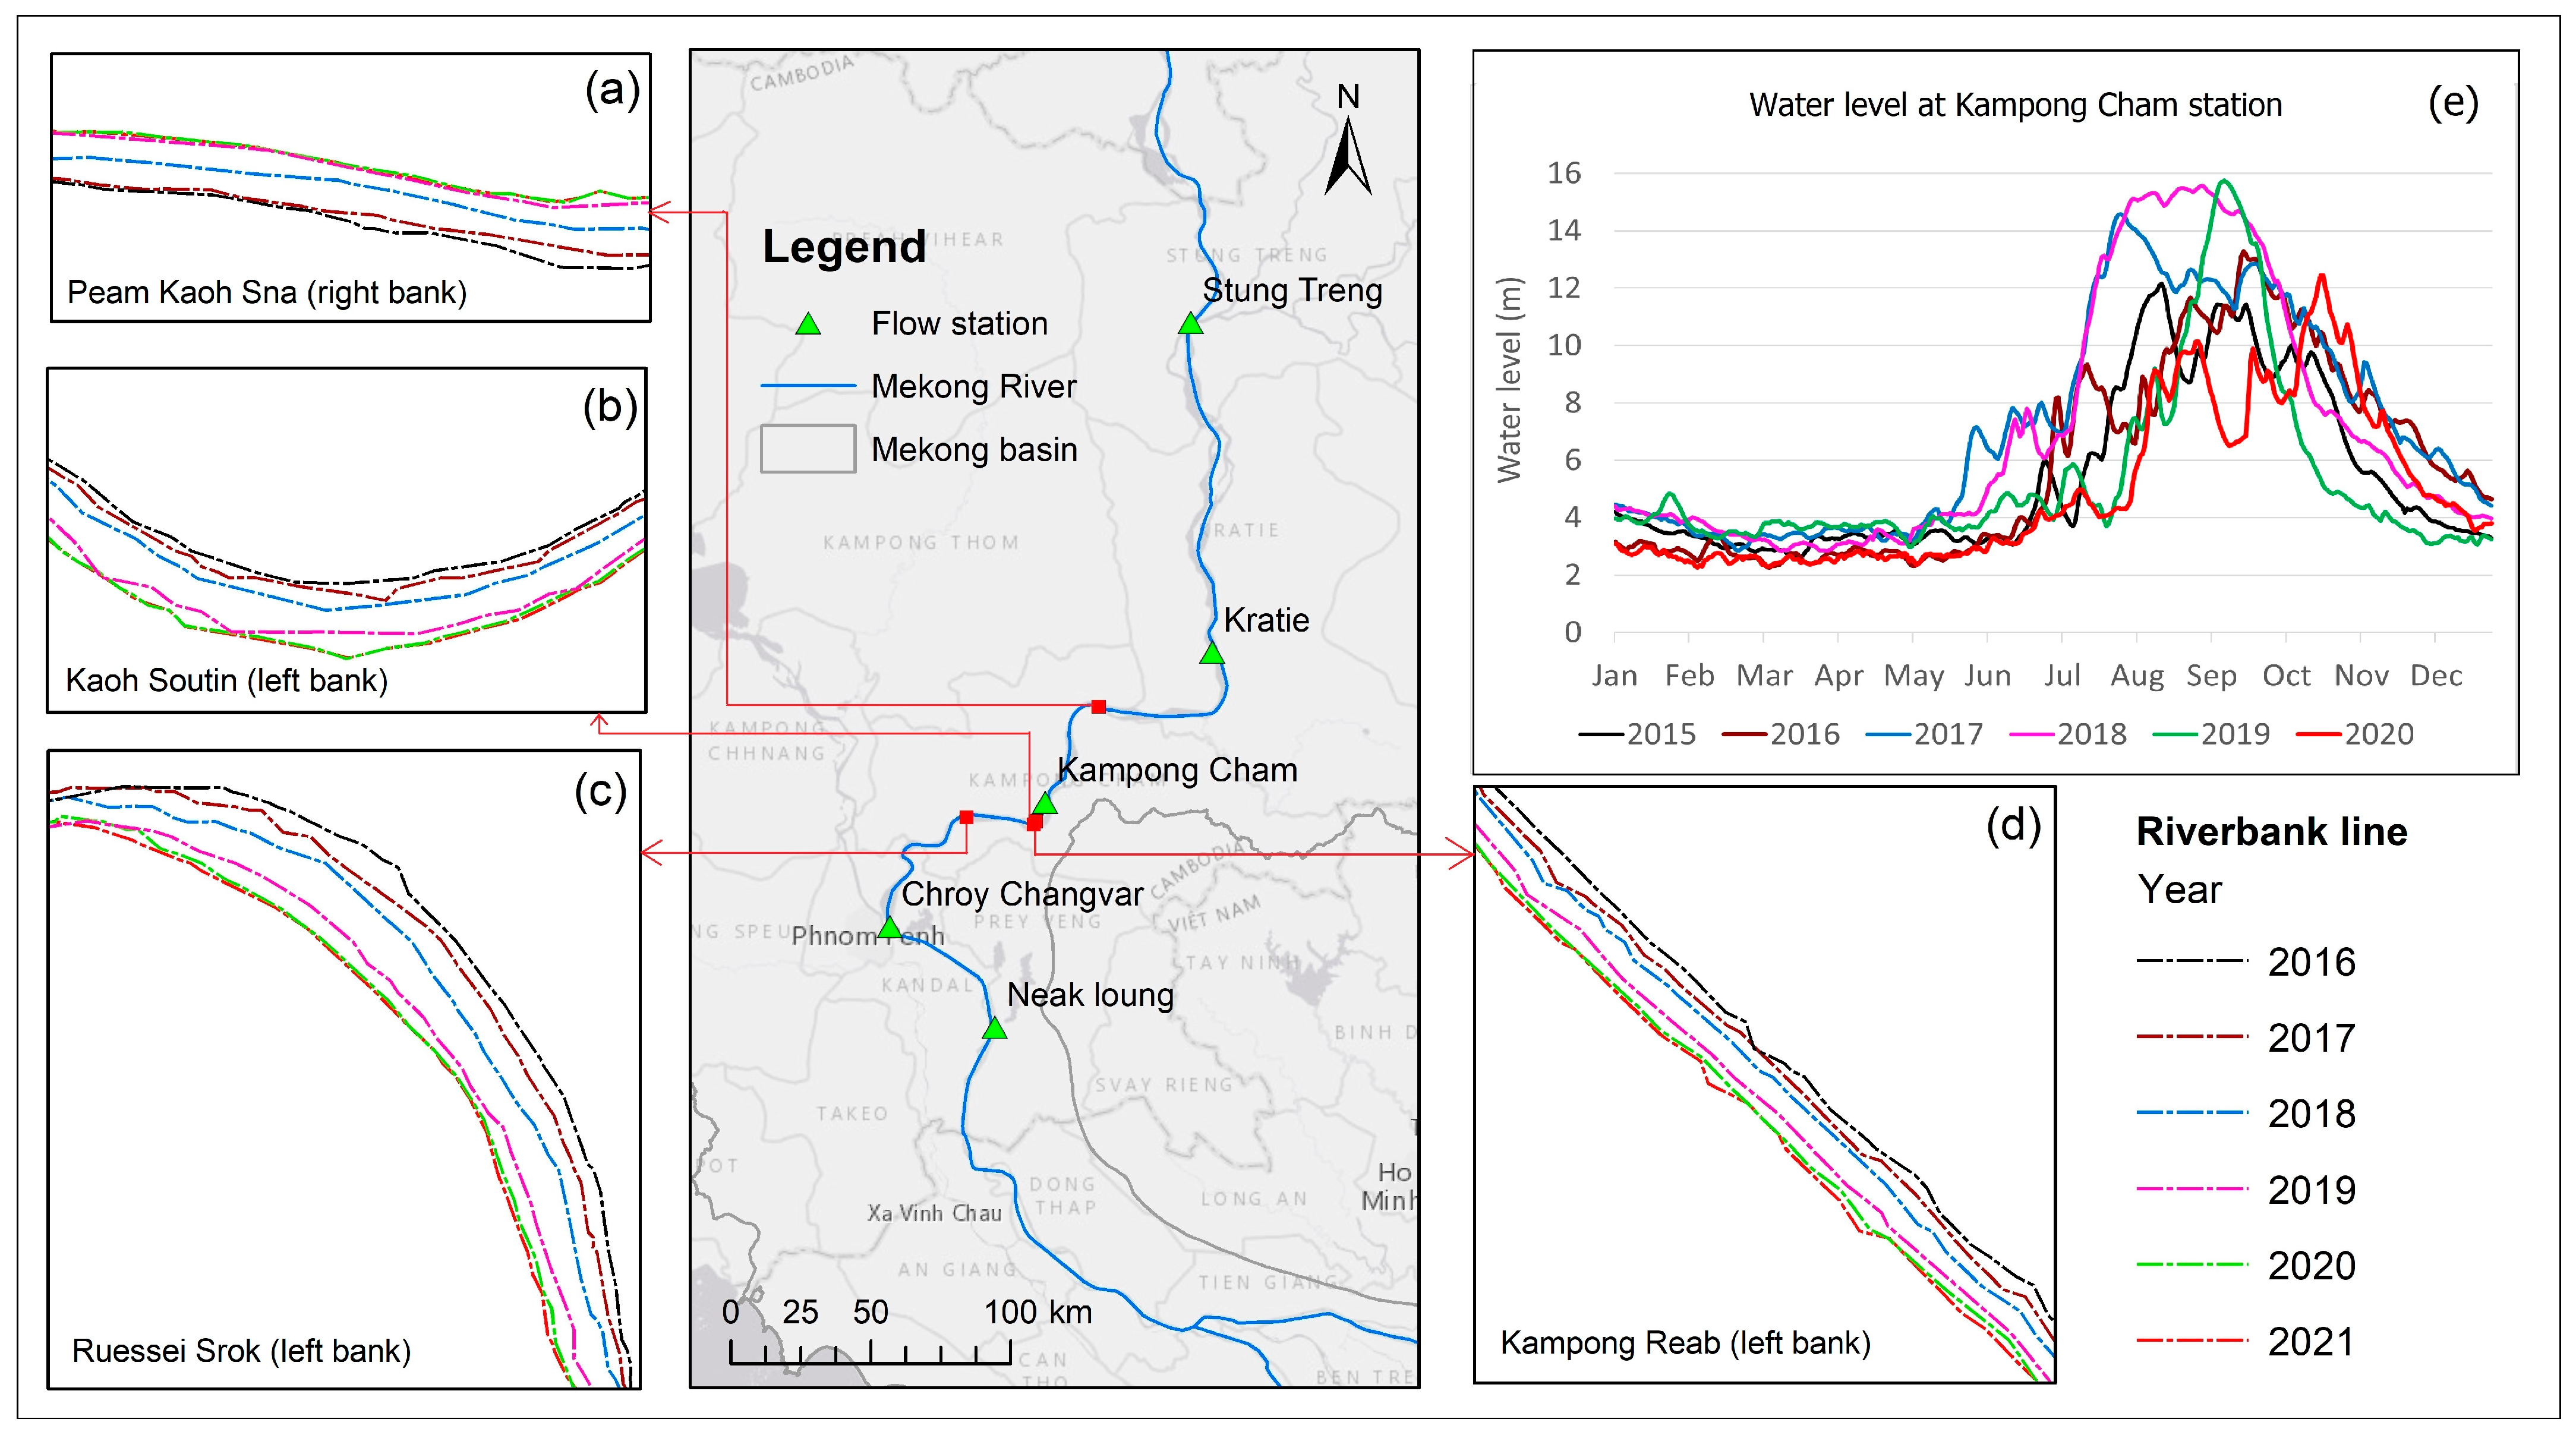
Because of the availability of historical and continuous data, long-term changes in the riverbank were analyzed using Landsat images with the MNDWI. Figure 7 presents the average annual riverbank erosion and deposition rates generated by the DSAS tool between 1990 and 2020. In several locations in R2, the annual erosion rate was higher than 20 m (e.g., Peam Kaoh Sna, Kampong Reab, and Ruessei Srok). The highest average annual erosion rate of more than 40 m/yr was at Ruessei Srok. The cumulative eroded riverbank (at the indicated transect) in this commune over the 30-year period was around 1300 m in the landward direction. In addition to erosion, new land emerged. The highest annual deposition rate was over 50 m (see Figure 7 of R2). Figure 7 also shows the evolution of the riverbank line in some highly eroded areas during five-year periods. As shown in Figure 7, the speed of erosion differed at specific transects every five years. Erosion in the highly eroded areas in R2 continues to occur. The pattern of erosion in these areas indicates a potential risk of erosion in the community in the future. However, in certain locations, erosion has slowed considerably, or the riverbank has stabilized in recent years. An example is the erosion in R3 at Phnom Thum, where the amount of cumulative erosion between 2010 and the present was slight.
From 1990 to 2020, the eroded land on both riverbanks was estimated to be around 3891 ha, whereas the newly deposited land was estimated to be around 3709 ha. The erosion and deposition rates were approximately 129.70 ha/yr and 123.64 ha/yr, respectively. The erosion and deposit rates on the right riverbank were higher than those on the left riverbank. Additional details are shown in Table 3.
4.3.2. Short-Term Erosion
The short-term monitoring of riverbank erosion is crucial to understand its current trend and to link it with specific events, such as flooding and human activities. Sentinel-2 images with the NDWI were used in this study to detect annual riverbank lines and calculate the short-term erosion rate because its performance is better than that of Landsat, and it is more suitable for monitoring the annual change of the riverbank. Figure 8a–d illustrates the erosion lines in some highly eroded areas between 2016 and 2021, while Figure 8e shows the water levels at the Kampong Cham station between 2015 and 2020. The riverbank lines shifted substantially between 2018 and 2019 in all locations, as shown in Figure 8. This remarkable shift may be linked to high water levels and prolonged flooding during the rainy season in 2018 (see Figure 8e). Conversely, the riverbank lines in all locations changed slightly between 2020 and 2021 due to the low flow in 2020. These results indicate that the riverbank erosion rate was highly linked to the water level each year.
4.4. Riverbank Erosion Hotspots
4.4.1. Riverbank Erosion Exposure
The severity of a riverbank erosion event, as well as the presence of humans, infrastructure, agricultural land, and so on, contribute to the potential impact of this hazard, which is known as exposure to the hazard. In this study, the study area was based on the administrative boundaries of communes located along the Mekong River in Cambodia. However, because of variations in population density and land cover in the communes, the computation of the exposure of each commune was based only on the combination of population density and land cover within a buffered area within 1500 m from the riverbank.
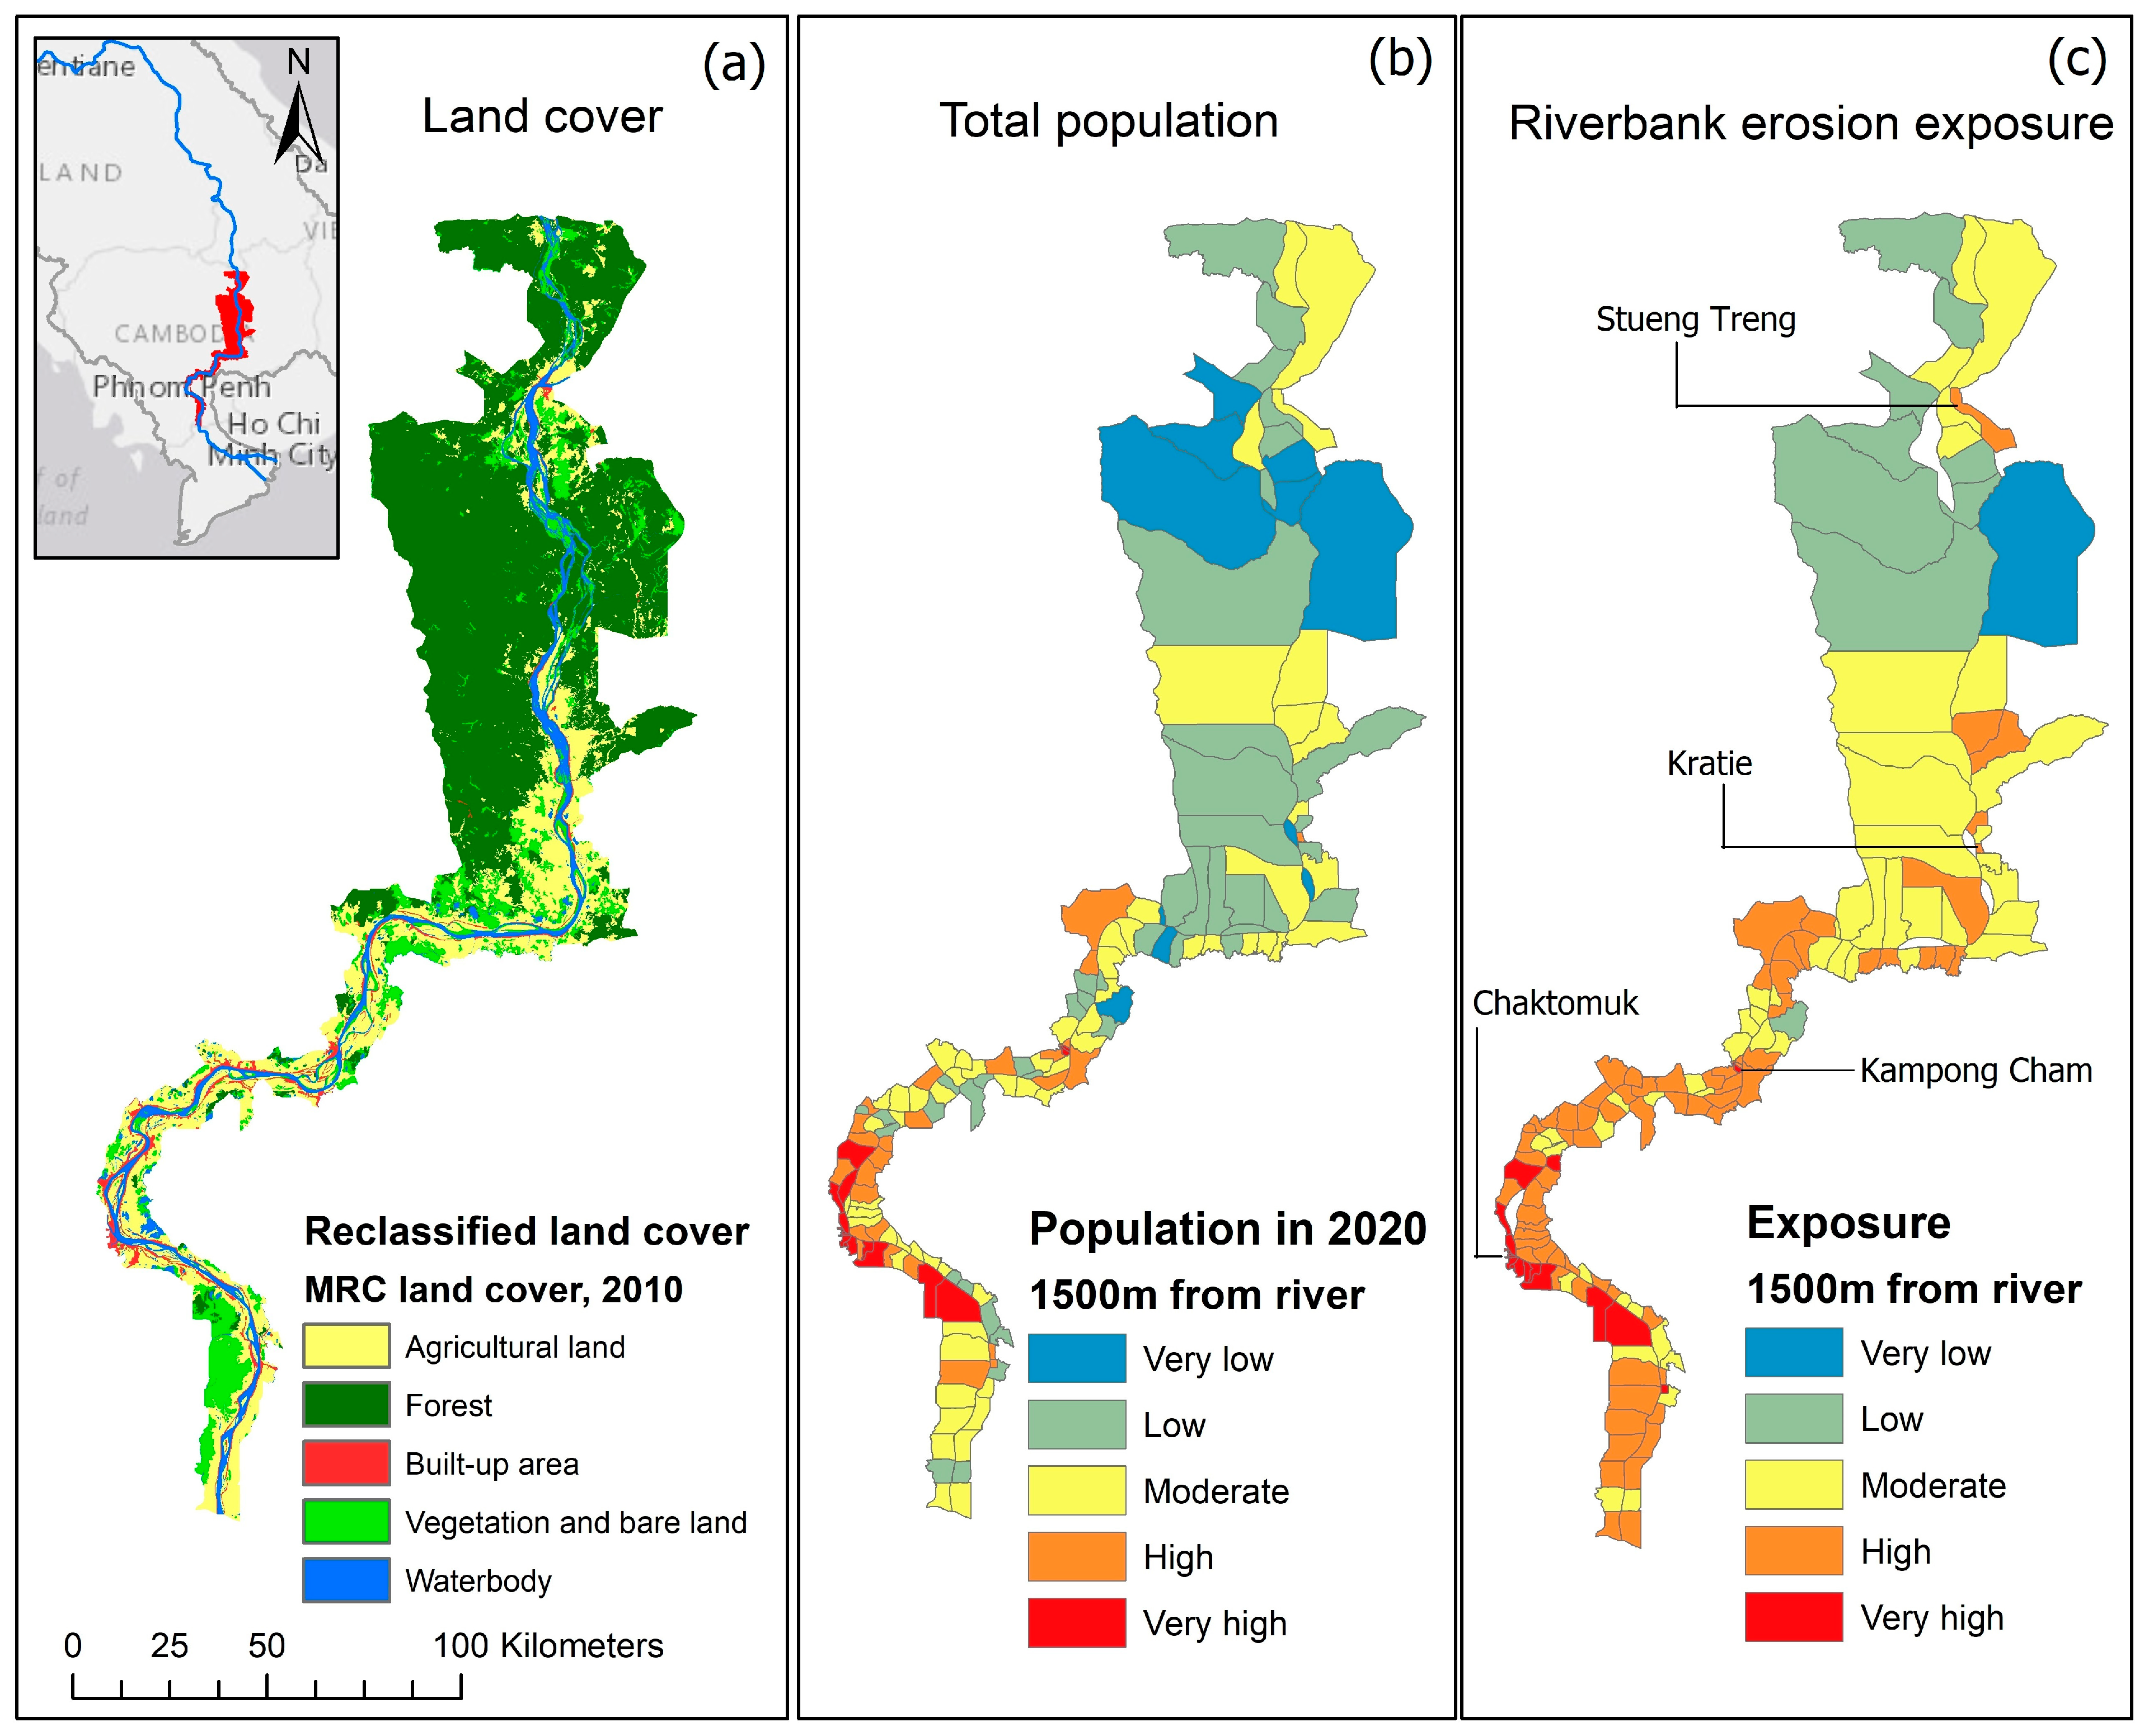
In this study, land cover types were classified into five main groups: built-up areas, agricultural land, forests, vegetation and bare land, and water bodies. The built-up areas consisted mainly of buildings, infrastructure, and villages along the riverbank. The land cover map in Figure 9a shows that the upper part of the river was predominantly forest of different types, followed by agricultural land, vegetation, and bare land located near the river. The built-up area in the upper part of the river is relatively low, except in Stung Treng City. In the lower part, which is a floodplain, the land cover is predominantly agricultural, specifically rice fields and other croplands. The built-up area along the river is also denser than the built-up area in the upper part. Similarly, the population density in the lower reaches is high, especially at Chaktomuk Confluence and in nearby areas.
Figure 9 presents the exposure map generated by combining equally weighted land cover and population density. The exposure levels were divided into five classes, ranging from very low to very high. The map shows low and moderate exposure levels in the upper part of the Mekong River, except at Stung Treng, where the exposure level was high. Between Kratie and Kampong Cham, the exposure level in most communes was moderate, followed by a high exposure level in some communes and a low exposure level in one commune. Most areas along the reach from Kampong Cham downstream were highly exposed to riverbank erosion. On the right bank of the Chaktomuk area, the exposure level was very high because of the dense population. Downstream of the Chaktomuk area, the exposure level was also high in most communes, especially on the right bank.
4.4.2. Erosion Hotspots
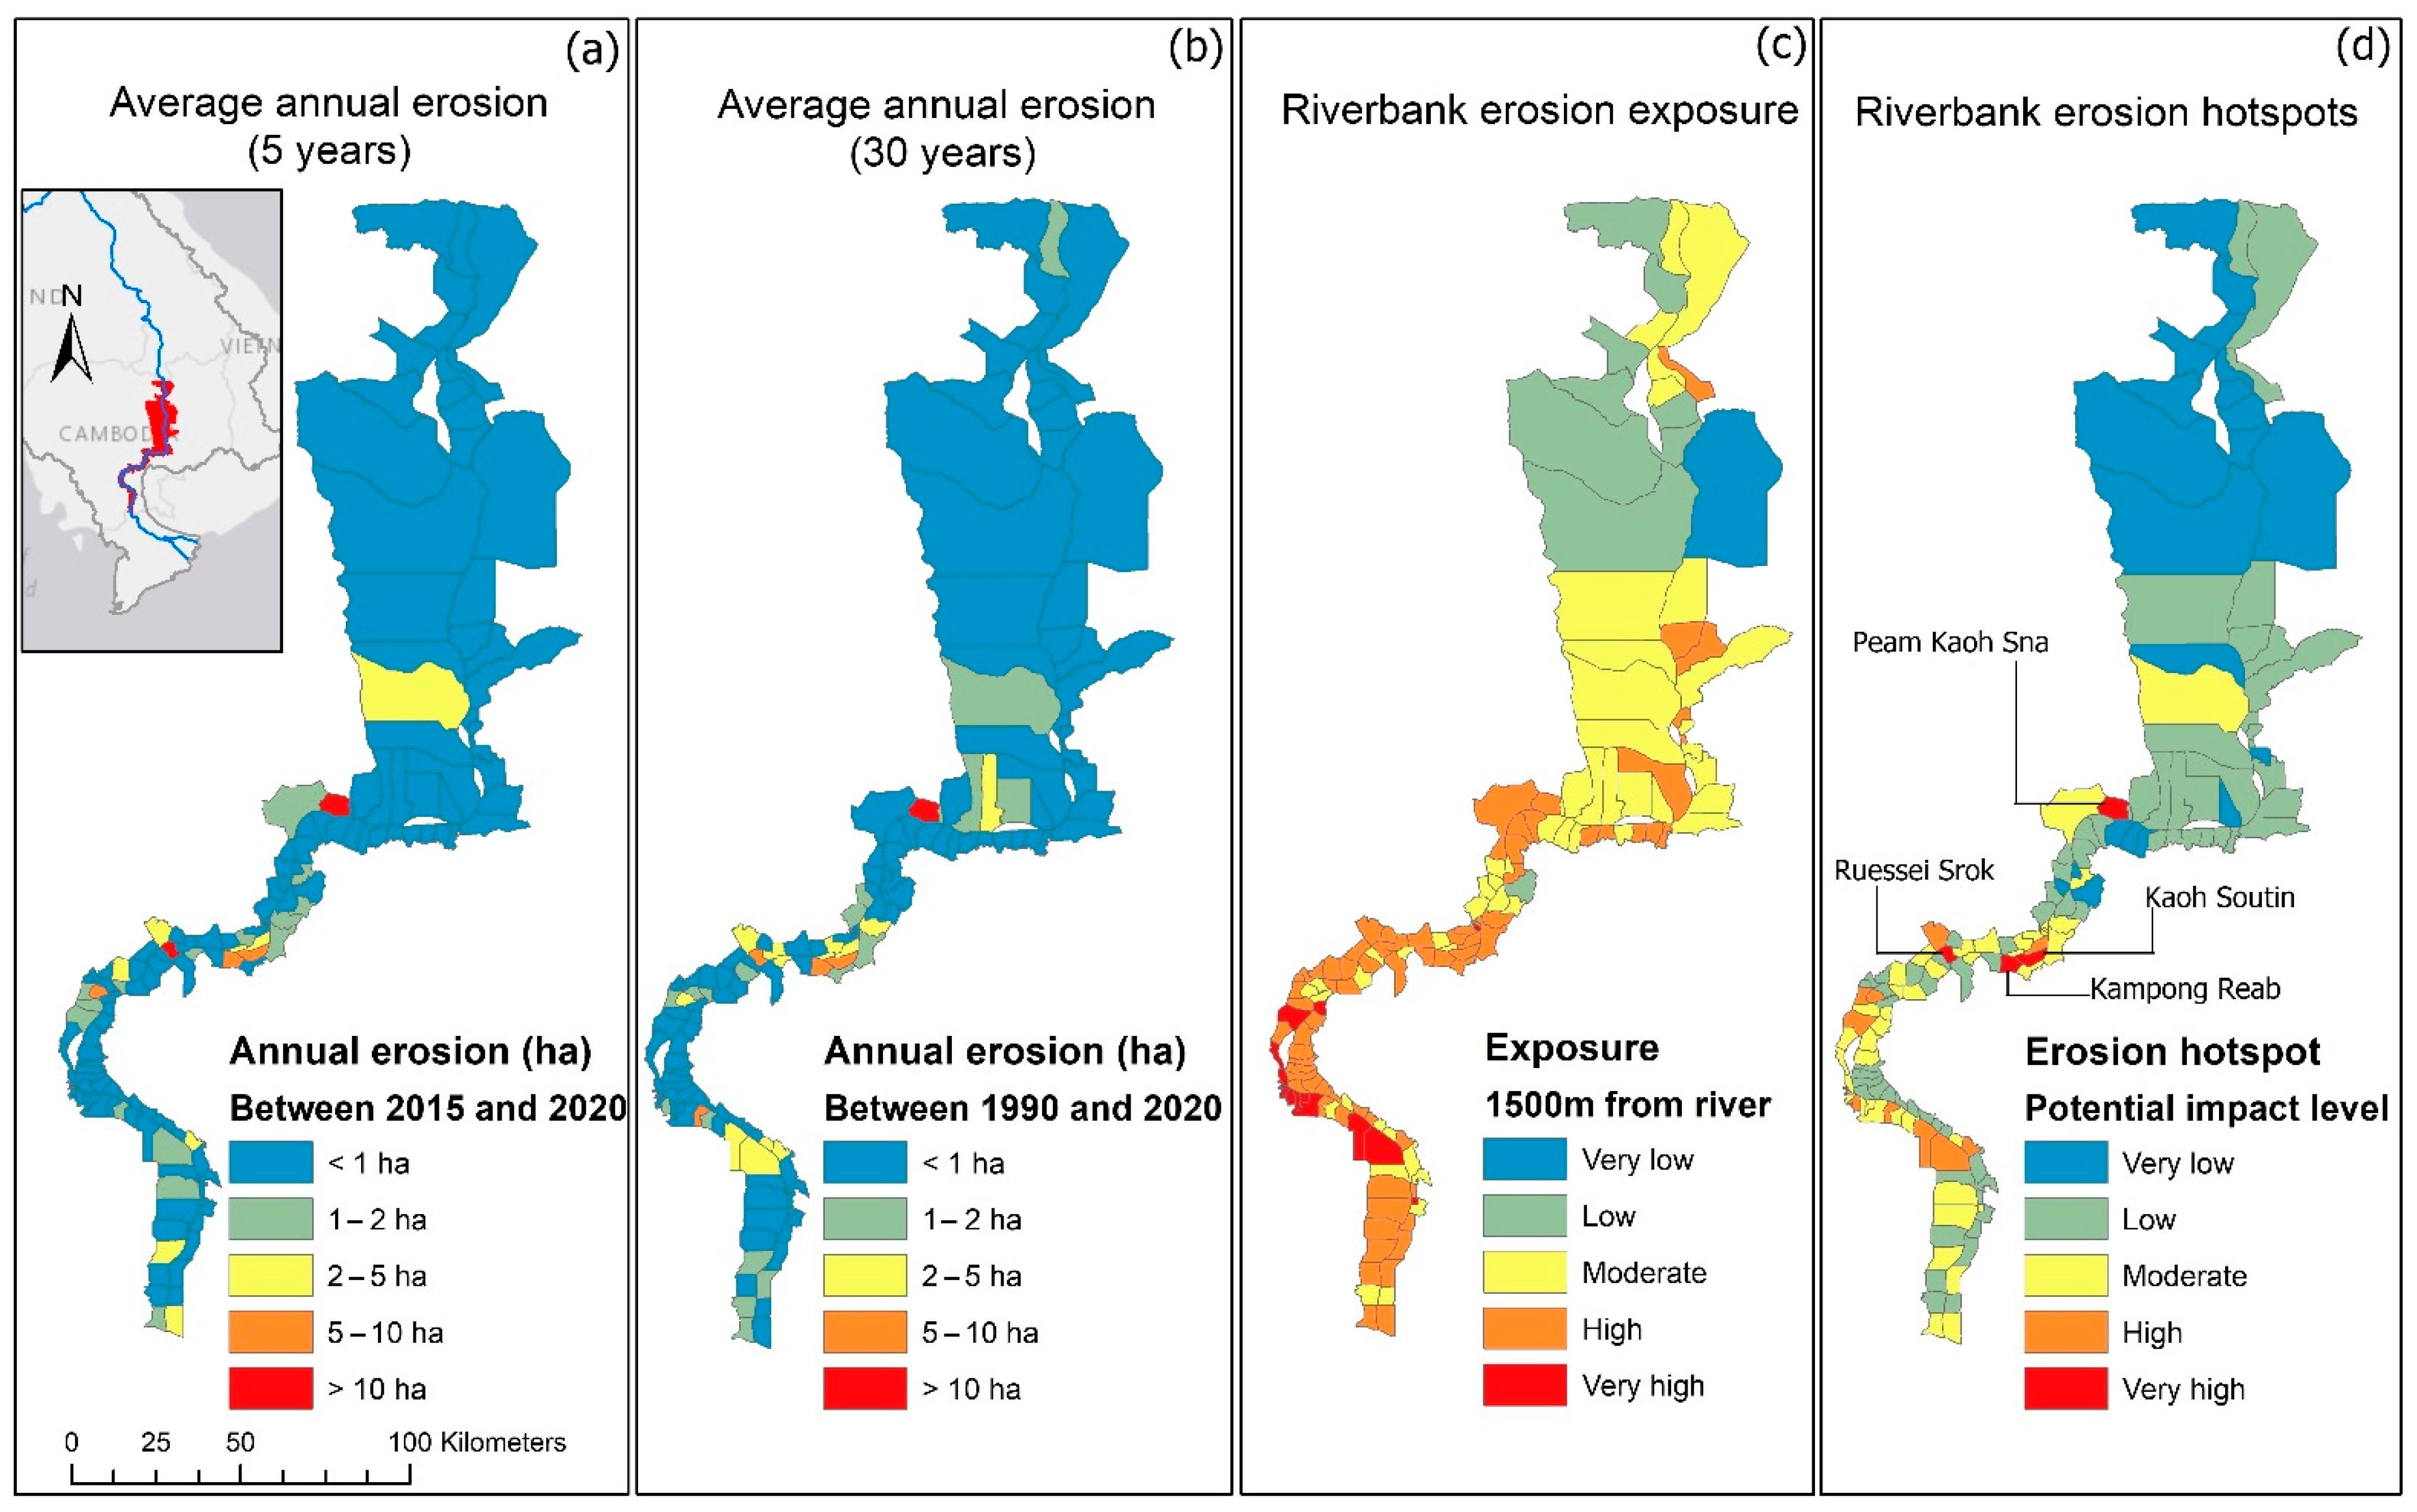
A map of riverbank erosion hotspots was created by combining the exposure level, long-term erosion rate (1990–2020), and current erosion rate (2015–2020) of each commune. The erosion rate was measured in hectares per year. An erosion hotspot was defined as an area subject to substantial and frequent erosion with a high exposure level. Without the presence of human settlements, riverbank erosion is not a serious problem. Such conditions are not considered hotspots, despite a high erosion rate.
According to Figure 10, the riverbank erosion hotspots in the Mekong River in Cambodia are located mainly in the lower reaches. Areas with a very high potential impact on humans include the Peam Kaoh Sna, Kampong Reab, Kaoh Soutin, and Ruessei Srok communes in Kampong Cham Province. Severe riverbank erosion at these communes is ongoing. Some families in the communes had relocated to other areas more than once. Downstream of the Chaktomuk area, several hotspots were observed on the right bank of the river. The results showed that erosion occurred mainly in the floodplain area of the Mekong River in Cambodia, with high frequency and intensity. This area is highly populated; therefore, riverbank erosion could potentially seriously impact human livelihoods and economies.
In Cambodia, field visits and interviews were conducted in Ruessei Srok and Kaoh Soutin. Interviews were conducted with residents between December 2021 and February 2022. The analysis of the interview data confirmed that riverbank erosion is a serious problem in both communes. Figure 11 shows images of the riverbank taken during the field visit. Typically, during the flood season, because the riverbank is submerged, it is not visible; moreover, it sometimes collapses. Riverbanks collapse mainly during flood peaks and recession periods, according to the interviewed commune residents. The respondents understood that flooding and deposition on the other side of the riverbank were the main factors that caused riverbank erosion in their commune. Some residents had relocated their houses several times, especially those in Ruessei Srok Commune who had experienced relocations as many as seven times. Although erosion has been mild in the last few consecutive years because of the low water level of the Mekong River, riverbank erosion could occur at any time in the future.
According to the data collected in the interviews held in Kaoh Soutin Commune, the last serious flooding and riverbank erosion occurred in 2018. In Kaoh Soutin, floods typically last between 10 and 15 days, except in 2018, when the flood lasted about a month. Other severe riverbank erosion events occurred in 1996 and 2000. Some households had moved starting in 1996 and in 2000 the entire village of Ti Prampi had moved and settled in another location in the commune and later they were also given land. In 2020 and 2021, the water level of the river was remarkably low during the rainy season, which resulted in a very low rate of riverbank erosion.
In Ruessei Srok Commune, the riverbank collapsed between 500 m and 1200 m during the last 40 years, depending on the location. Riverbank erosion remains a challenge for the residents of this community, as they need to relocate repeatedly. Recently, the road near the river partially collapsed, thereby disrupting daily lives and the transport of agricultural products. However, when 1000 m (of the proposed 1500 m) of sandbags were installed along the riverbank in 2021, combined with a low water level, the riverbank became quite stable. In the future, if a flood occurred and 1500-m sandbags were not installed completely, then the riverbank could continue to collapse, thereby threatening houses, a pagoda, and a road. Despite the risk of riverbank collapse, around 70% of displaced families continue to live in Ruessei Srok Commune.
5. Conclusions
Large-scale riverbank monitoring requires intensive resources and continuity, which is vital for the Mekong River Basin, where several developments on the main river and its tributaries significantly affect sedimentation. In recent years, machine learning algorithms have helped to improve the accuracy of water body detection; however, they are still in the developmental stage [50]. Hence, the water index method is more suitable for detecting large-scale riverbanks along the Mekong River and assessing changes in the river body over time. In this study, historical and recent changes in riverbanks along the Mekong River in Cambodia were analyzed using Landsat 5, 7, and 8, and Sentinel-2 images. Riverbank erosion hotspots were identified by combining the riverbank erosion rate and an exposure map. Erosion rates were analyzed using the DSAS and other tools in ArcMap, and an exposure map was created using population density and land cover data. Riverbank detection from satellite images using the water index depends greatly on image resolution and water thresholds. The results of using Sentinel-2 with the NDWI at 10 m resolution and Landsat 8 with the MNDWI at 30 m resolution showed that the riverbank line generated from the Sentinel-2 images is closer to the referenced riverbank generated from Google Earth images. This was indicated by the RMSE of 6.04 m and 6 m in December 2017 and the RMSE of 5.90 m and 4.12 m in January 2019 for Landsat 8 and Sentinel-2, respectively. Riverbank erosion occurs mainly in the floodplains of the Mekong River in Cambodia, and the most severely eroded areas are agricultural land and built-up areas. Between 1990 and 2020, the average long-term erosion rate was more than 40 m/yr in some locations in the Ruessei Srok Commune, and the intensity of erosion was highly linked to high water levels during the monsoon season. In most highly eroded areas, erosion is ongoing, and it shifts to nearby areas. However, in some highly eroded locations (e.g., Phum Thum Commune), riverbank erosion has been very mild in the past 10 years. Riverbank erosion hotspots with very high impact levels and ongoing active erosion include Peam Kaoh Sna, Kampong Reab, Kaoh Soutin, and Ruessei Srok communes in Kampong Cham Province. A limitation of the use of satellite images to detect riverbank erosion is that some locations are highly sensitive to water levels (especially islands), which could lead to inaccurate riverbank line detection. However, this methodology can be used to monitor large-scale morphological changes along the Mekong River, thereby filling the existing capacity gap in field monitoring. Increased field data measurements of riverbank erosion are necessary to improve the accuracy of assessments. Future research should be conducted to investigate the performance of alternative satellite imagery products in detecting riverbank erosion, such as Sentinel-1 synthetic aperture radar products, which can overcome cloud problems. Moreover, local social and economic data and perspectives should be combined to develop riverbank erosion hotspots. Further research should also be conducted on the social and economic aspects of riverbank erosion to provide comprehensive policy recommendations. This study demonstrated the applicability of high-resolution satellite images with appropriate water thresholds to detect riverbanks effectively and continuously in large-scale riverbank monitoring. The results provided an overview of the severity of riverbank erosion along the Mekong River in Cambodia. Furthermore, a map of riverbank erosion hotspots is essential for decision-makers to prioritize interventions to reduce the risk of riverbank erosion and to improve the livelihoods of the communities residing along the Mekong River.
Author Contributions
Conceptualization, T.T., T.P. and P.R.; methodology, T.T., D.B., T.P. and P.R.; coding and programing, D.B. and T.T.; validation, T.T., T.P. and P.R.; formal analysis, T.T., T.P. and P.R.; investigation, T.T., T.P. and P.R.; resources, T.P. and P.R.; data curation, T.T., T.P. and D.B.; writing—original draft preparation, T.T.; writing—review and editing, P.R. and T.P.; visualization, T.T. and D.B.; supervision, P.R. and T.P.; project administration, T.T., T.P. and P.R.; funding acquisition, T.T., T.P. and P.R. All authors have read and agreed to the published version of the manuscript.
Funding
T.T. is supported by the 100th Anniversary Chulalongkorn University Fund and Stockholm Environment Institute for Doctoral Scholarship under grant number GCUGE28-30, and this study is partially supported by the 90th Anniversary of Chulalongkorn University Scholarship under grant number GCUGR1225643021D.
Institutional Review Board Statement
Not applicable.
Informed Consent Statement
Not applicable.
Data Availability Statement
Satellite images (Landsat 5, 7, and 8 and Sentinel-2) and population density (GPWv4) were acquired from Google Earth Engine platform (https://earthengine.google.com/) (accessed on 2 June 2021). Water level data can be accessed through MRC Data portal (https://portal.mrcmekong.org/time-series/water-level) (accessed on 10 July 2021).
Acknowledgments
We thank U.S. Geological Survey (USGS) and European Space Agency (ESA) for Landsat and Sentinel-2 imagery. We also thank the Mekong River Commission for landcover and river water level data. We would like to thank the reviewers for the constructive comments that help improve this work.
Conflicts of Interest
The authors declare no conflict of interest.
References
- Kummu, M.; Lu, X.; Rasphone, A.; Sarkkula, J.; Koponen, J. Riverbank changes along the Mekong River: Remote sensing detection in the Vientiane–Nong Khai area. Quat. Int. 2008, 186, 100–112. [Google Scholar] [CrossRef] [Green Version]
- Naher, J.; Soron, T.R. Impact of River Bank Erosion on Mental Health and Coping Capacity in Bangladesh. Glob. Psychiatry 2019, 2, 195–200. [Google Scholar] [CrossRef] [Green Version]
- Rahman, M.S.; Gain, A. Adaptation to river bank erosion induced displacement in Koyra Upazila of Bangladesh. Prog. Disaster Sci. 2020, 5, 100055. [Google Scholar] [CrossRef]
- Daily Sun. River Erosion Turns Terrible in Naria. Available online: https://www.daily-sun.com/arcprint/details/336162/River-erosion-turns-terrible-in-Naria-/2018-09-15 (accessed on 29 December 2020).
- Das, T.K.; Haldar, S.K.; Gupta, I.D.; Sen, S. River bank erosion induced human displacement and its consequences. Living Rev. Landsc. Res. 2014, 8, 1–35. [Google Scholar] [CrossRef] [Green Version]
- Hartwig, M.; Schäffer, M.; Theuring, P.; Avlyush, S.; Rode, M.; Borchardt, D. Cause–effect–response chains linking source identification of eroded sediments, loss of aquatic ecosystem integrity and management options in a steppe river catchment (Kharaa, Mongolia). Environ. Earth Sci. 2016, 75, 855. [Google Scholar] [CrossRef]
- MRC. Basin Development Strategy 2016–2020 for the Lower Mekong Basin; Mekong River Commission: Phnom Penh, Cambodia, 2016. [Google Scholar]
- Miyazawa, N.; Sunada, K.; Sokhem, P. Bank erosion in the Mekong River Basin: Is Bank Erosion In My Town Caused by the activities of my neighbours? In A Critical Review of Water and Development Concepts, Principles and Policies; Water & Development Publications, Helsinki University of Technology: Helsinki, Finland, 2008; pp. 19–26. [Google Scholar]
- MRC. State of the Basin Report 2010; Mekong River Commission for Sustainable Development: Vientiane, Laos, 2010. [Google Scholar]
- MRC. State of the Basin Report 2018; Mekong River Commission for Sustainable Development: Vientiane, Laos, 2019. [Google Scholar]
- MRC. The Council Study: Study on the sustainable Management and Development of the Mekong River, Including Impacts of Mainstream Hydropower Projects. In Volume 4: Assessment of Planned Development Scenarios; BioRA Final Technical Report Series; Mekong River Commission for Sustainable Development: Vientiane, Laos, 2017; 145p. [Google Scholar]
- Hackney, C.R.; Darby, S.E.; Parsons, D.R.; Leyland, J.; Best, J.L.; Aalto, R.; Nicholas, A.P.; Houseago, R.C. River bank instability from unsustainable sand mining in the lower Mekong River. Nat. Sustain. 2020, 3, 217–225. [Google Scholar] [CrossRef]
- Jordan, C.; Tiede, J.; Lojek, O.; Visscher, J.; Apel, H.; Nguyen, H.Q.; Quang, C.N.X.; Schlurmann, T. Sand mining in the Mekong Delta revisited-current scales of local sediment deficits. Sci. Rep. 2019, 9, 17823. [Google Scholar] [CrossRef]
- Khmer Times. Riverbank Collapses Affect Nearly 40 Homes in Two Provinces. Available online: https://www.khmertimeskh.com/650536/riverbank-collapses-affect-nearly-40-homes-in-two-provinces/?fbclid=IwAR1ZhGVWTwlmFq40vkk8nrdahM7KsWaIWenu9_6EgEbPg6I0l1p29lsyIcs (accessed on 3 December 2020).
- RFA. Three Cambodians Missing After Mekong Bank Collapse. Available online: https://www.rfa.org/english/news/myanmar/cambodia/collapse-02192014171310.html (accessed on 3 December 2020).
- Palmer, J.A.; Schilling, K.E.; Isenhart, T.M.; Schultz, R.C.; Tomer, M.D. Streambank erosion rates and loads within a single watershed: Bridging the gap between temporal and spatial scales. Geomorphology 2014, 209, 66–78. [Google Scholar] [CrossRef] [Green Version]
- Chapuis, M.; Dufour, S.; Provansal, M.; Couvert, B.; de Linares, M. Coupling channel evolution monitoring and RFID tracking in a large, wandering, gravel-bed river: Insights into sediment routing on geomorphic continuity through a riffle–pool sequence. Geomorphology 2015, 231, 258–269. [Google Scholar] [CrossRef]
- Khoi, D.N.; Dang, T.D.; Pham, L.T.; Loi, P.T.; Thuy, N.T.D.; Phung, N.K.; Bay, N.T. Morphological change assessment from intertidal to river-dominated zones using multiple-satellite imagery: A case study of the Vietnamese Mekong Delta. Reg. Stud. Mar. Sci. 2020, 34, 101087. [Google Scholar] [CrossRef]
- Lam-Dao, N.; Pham-Bach, V.; Nguyen-Thanh, M.; Pham-Thi, M.-T.; Hoang-Phi, P. Change detection of land use and riverbank in Mekong Delta, Vietnam using time series remotely sensed data. J. Resour. Ecol. 2011, 2, 370–374. [Google Scholar]
- Longoni, L.; Papini, M.; Brambilla, D.; Barazzetti, L.; Roncoroni, F.; Scaioni, M.; Ivanov, V.I. Monitoring riverbank erosion in mountain catchments using terrestrial laser scanning. Remote Sens. 2016, 8, 241. [Google Scholar] [CrossRef] [Green Version]
- Langat, P.K.; Kumar, L.; Koech, R. Monitoring river channel dynamics using remote sensing and GIS techniques. Geomorphology 2019, 325, 92–102. [Google Scholar] [CrossRef]
- Thakur, P.K.; Laha, C.; Aggarwal, S. River bank erosion hazard study of river Ganga, upstream of Farakka barrage using remote sensing and GIS. Nat. Hazards 2012, 61, 967–987. [Google Scholar] [CrossRef]
- Hemmelder, S.; Marra, W.; Markies, H.; De Jong, S.M. Monitoring river morphology & bank erosion using UAV imagery–A case study of the river Buëch, Hautes-Alpes, France. Int. J. Appl. Earth Obs. Geoinf. 2018, 73, 428–437. [Google Scholar] [CrossRef]
- Hamshaw, S.D.; Bryce, T.; O’Neil Dunne, J.; Rizzo, D.M.; Frolik, J.; Engel, T.; Dewoolkar, M.M. Quantifying streambank erosion using unmanned aerial systems at site-specific and river network scales. In Geotechnical Frontiers 2017; ASCE: Anaheim, CA, USA, 2017; pp. 499–508. [Google Scholar]
- Dragićević, S.; Pripužić, M.; Živković, N.; Novković, I.; Kostadinov, S.; Langović, M.; Milojković, B.; Čvorović, Z. Spatial and temporal variability of bank erosion during the period 1930–2016: Case Study—Kolubara River Basin (Serbia). Water 2017, 9, 748. [Google Scholar] [CrossRef] [Green Version]
- Miřijovský, J.; Langhammer, J. Multitemporal monitoring of the morphodynamics of a mid-mountain stream using UAS photogrammetry. Remote Sens. 2015, 7, 8586–8609. [Google Scholar] [CrossRef] [Green Version]
- Boonpook, W.; Tan, Y.; Ye, Y.; Torteeka, P.; Torsri, K.; Dong, S. A deep learning approach on building detection from unmanned aerial vehicle-based images in riverbank monitoring. Sensors 2018, 18, 3921. [Google Scholar] [CrossRef] [Green Version]
- Thoma, D.P.; Gupta, S.C.; Bauer, M.E.; Kirchoff, C. Airborne laser scanning for riverbank erosion assessment. Remote Sens. Environ. 2005, 95, 493–501. [Google Scholar] [CrossRef]
- Billah, M.M. Mapping and monitoring erosion-accretion in an alluvial river using satellite imagery–the river bank changes of the Padma river in Bangladesh. Quaest. Geogr. 2018, 37, 87–95. [Google Scholar] [CrossRef] [Green Version]
- Binh, D.V.; Wietlisbach, B.; Kantoush, S.; Loc, H.H.; Park, E.; Cesare, G.d.; Cuong, D.H.; Tung, N.X.; Sumi, T. A Novel Method for River Bank Detection from Landsat Satellite Data: A Case Study in the Vietnamese Mekong Delta. Remote Sens. 2020, 12, 3298. [Google Scholar] [CrossRef]
- Yao, Z.; Ta, W.; Jia, X.; Xiao, J. Bank erosion and accretion along the Ningxia–Inner Mongolia reaches of the Yellow River from 1958 to 2008. Geomorphology 2011, 127, 99–106. [Google Scholar] [CrossRef]
- Tu, N.A.; Stéphane, G.; Le, P.T.; Xuan, N.H.; Doi, N.T. Rapid detection of changes in the riverbanks of Laigiang river of the South Central Coast Vietnam: A methodology based on Digital Shoreline Analysis System and Sentinel-2. Disaster Adv. 2021, 14, 13–24. [Google Scholar] [CrossRef]
- Mondejar, J.P.; Tongco, A.F. Near infrared band of Landsat 8 as water index: A case study around Cordova and Lapu-Lapu City, Cebu, Philippines. Sustain. Environ. Res. 2019, 29, 16. [Google Scholar] [CrossRef] [Green Version]
- Work, E.A.; Gilmer, D.S. Utilization of satellite data for inventorying prairie ponds and lakes. Photogramm. Eng. Remote Sens. 1976, 42, 685–694. [Google Scholar]
- McFeeters, S.K. The use of the Normalized Difference Water Index (NDWI) in the delineation of open water features. Int. J. Remote Sens. 1996, 17, 1425–1432. [Google Scholar] [CrossRef]
- Xu, H. Modification of normalised difference water index (NDWI) to enhance open water features in remotely sensed imagery. Int. J. Remote Sens. 2006, 27, 3025–3033. [Google Scholar] [CrossRef]
- Dang, B.; Li, Y. MSResNet: Multiscale Residual Network via Self-Supervised Learning for Water-Body Detection in Remote Sensing Imagery. Remote Sens. 2021, 13, 3122. [Google Scholar] [CrossRef]
- Chen, Y.; Fan, R.; Yang, X.; Wang, J.; Latif, A. Extraction of urban water bodies from high-resolution remote-sensing imagery using deep learning. Water 2018, 10, 585. [Google Scholar] [CrossRef] [Green Version]
- Kaplan, G.; Avdan, U. Object-based water body extraction model using Sentinel-2 satellite imagery. Eur. J. Remote Sens. 2017, 50, 137–143. [Google Scholar] [CrossRef] [Green Version]
- Huang, X.; Xie, C.; Fang, X.; Zhang, L. Combining pixel-and object-based machine learning for identification of water-body types from urban high-resolution remote-sensing imagery. IEEE J. Sel. Top. Appl. Earth Obs. Remote Sens. 2015, 8, 2097–2110. [Google Scholar] [CrossRef]
- Wang, L.; Bie, W.; Li, H.; Liao, T.; Ding, X.; Wu, G.; Fei, T. Small Water Body Detection and Water Quality Variations with Changing Human Activity Intensity in Wuhan. Remote Sens. 2022, 14, 200. [Google Scholar] [CrossRef]
- Li, L.; Yan, Z.; Shen, Q.; Cheng, G.; Gao, L.; Zhang, B. Water body extraction from very high spatial resolution remote sensing data based on fully convolutional networks. Remote Sens. 2019, 11, 1162. [Google Scholar] [CrossRef] [Green Version]
- Wang, G.; Wu, M.; Wei, X.; Song, H. Water identification from high-resolution remote sensing images based on multidimensional densely connected convolutional neural networks. Remote Sens. 2020, 12, 795. [Google Scholar] [CrossRef] [Green Version]
- Li, M.; Wu, P.; Wang, B.; Park, H.; Yang, H.; Wu, Y. A deep learning method of water body extraction from high resolution remote sensing images with multisensors. IEEE J. Sel. Top. Appl. Earth Obs. Remote Sens. 2021, 14, 3120–3132. [Google Scholar] [CrossRef]
- Zhang, L.; Fan, Y.; Yan, R.; Shao, Y.; Wang, G.; Wu, J. Fine-Grained Tidal Flat Waterbody Extraction Method (FYOLOv3) for High-Resolution Remote Sensing Images. Remote Sens. 2021, 13, 2594. [Google Scholar] [CrossRef]
- Isikdogan, L.F.; Bovik, A.; Passalacqua, P. Seeing through the clouds with deepwatermap. IEEE Geosci. Remote Sens. Lett. 2019, 17, 1662–1666. [Google Scholar] [CrossRef]
- Feng, W.; Sui, H.; Huang, W.; Xu, C.; An, K. Water body extraction from very high-resolution remote sensing imagery using deep U-Net and a superpixel-based conditional random field model. IEEE Geosci. Remote Sens. Lett. 2018, 16, 618–622. [Google Scholar] [CrossRef]
- Jiang, W.; He, G.; Long, T.; Ni, Y. Detecting water bodies in landsat8 oli image using deep learning. Int. Arch. Photogramm. Remote Sens. Spat. Inf. Sci. 2018, 42, 3. [Google Scholar] [CrossRef] [Green Version]
- Yang, L.; Driscol, J.; Sarigai, S.; Wu, Q.; Lippitt, C.D.; Morgan, M. Towards Synoptic Water Monitoring Systems: A Review of AI Methods for Automating Water Body Detection and Water Quality Monitoring Using Remote Sensing. Sensors 2022, 22, 2416. [Google Scholar] [CrossRef]
- Li, A.; Fan, M.; Qin, G.; Xu, Y.; Wang, H. Comparative Analysis of Machine Learning Algorithms in Automatic Identification and Extraction of Water Boundaries. Appl. Sci. 2021, 11, 10062. [Google Scholar] [CrossRef]
- Lu, X.; Kummu, M.; Oeurng, C. Reappraisal of sediment dynamics in the Lower Mekong River, Cambodia. Earth Surf. Process. Landf. 2014, 39, 1855–1865. [Google Scholar] [CrossRef]
- Lauri, H.; De Moel, H.; Ward, P.; Räsänen, T.; Keskinen, M.; Kummu, M. Future changes in Mekong River hydrology: Impact of climate change and reservoir operation on discharge. Hydrol. Earth Syst. Sci. Discuss 2012, 9, 6569–6614. [Google Scholar] [CrossRef]
- Gupta, A. The Mekong River: Morphology, evolution, management. In Large Rivers: Geomorphology and Management, 2nd ed.; Gupta, A., Ed.; John Wiley & Sons Ltd.: Chichester, UK, 2007; pp. 435–455. [Google Scholar]
- Gupta, A.; Liew, S.C. The Mekong from satellite imagery: A quick look at a large river. Geomorphology 2007, 85, 259–274. [Google Scholar] [CrossRef]
- Carling, P.A. The geology of the lower Mekong River. In The Mekong; Elsevier: Amsterdam, The Netherlands, 2009; pp. 13–28. [Google Scholar]
- Meshkova, L.V.; Carling, P.A. The geomorphological characteristics of the Mekong River in northern Cambodia: A mixed bedrock–alluvial multi-channel network. Geomorphology 2012, 147, 2–17. [Google Scholar] [CrossRef]
- Chan, S.; Putrea, S.; Sean, K.; Hortle, K. Using local knowledge to inventory deep pools, important fish habitats in Cambodia. In Proceedings of the 6th Technical Symposium on Mekong Fisheries, Pakse, Laos, 26–28 November 2003. [Google Scholar]
- MRC. Mekong River Commission for Sustainable Development. Available online: http://ffw.mrcmekong.org/aboutus.php (accessed on 10 May 2022).
- Thoeun, H.C. Observed and projected changes in temperature and rainfall in Cambodia. Weather Clim. Extrem. 2015, 7, 61–71. [Google Scholar] [CrossRef] [Green Version]
- MRC. The Flow of the Mekong; Mekong River Commission for Sustainable Development: Vientiane, Laos, 2009. [Google Scholar]
- MRC. MRC Data and Information Service. Available online: https://portal.mrcmekong.org (accessed on 6 April 2022).
- Koehnken, L. Discharge Sediment Monitoring Project (DSMP), 2009–2013: Summary & Analysis of Results; Final Report Mekong River Commission; Mekong River Commission for Sustainable Development: Vientiane, Laos, 2014. [Google Scholar]
- Himmelstoss, E.A.; Henderson, R.E.; Kratzmann, M.G.; Farris, A.S. Digital Shoreline Analysis System (DSAS) Version 5.0 User Guide; US Geological Survey: Reston, VA, USA, 2018; pp. 1258–2331.
- Du, Y.; Zhang, Y.; Ling, F.; Wang, Q.; Li, W.; Li, X. Water bodies’ mapping from Sentinel-2 imagery with modified normalized difference water index at 10-m spatial resolution produced by sharpening the SWIR band. Remote Sens. 2016, 8, 354. [Google Scholar] [CrossRef] [Green Version]
- Sarp, G.; Ozcelik, M. Water body extraction and change detection using time series: A case study of Lake Burdur, Turkey. J. Taibah Univ. Sci. 2017, 11, 381–391. [Google Scholar] [CrossRef] [Green Version]
- Nandi, I.; Srivastava, P.K.; Shah, K. Floodplain mapping through support vector machine and optical/infrared images from Landsat 8 OLI/TIRS sensors: Case study from Varanasi. Water Resour. Manag. 2017, 31, 1157–1171. [Google Scholar] [CrossRef]
- Li, W.; Du, Z.; Ling, F.; Zhou, D.; Wang, H.; Gui, Y.; Sun, B.; Zhang, X. A comparison of land surface water mapping using the normalized difference water index from TM, ETM+ and ALI. Remote Sens. 2013, 5, 5530–5549. [Google Scholar] [CrossRef] [Green Version]
- Huang, C.; Chen, Y.; Zhang, S.; Wu, J. Detecting, extracting, and monitoring surface water from space using optical sensors: A review. Rev. Geophys. 2018, 56, 333–360. [Google Scholar] [CrossRef]
- Zhai, K.; Wu, X.; Qin, Y.; Du, P. Comparison of surface water extraction performances of different classic water indices using OLI and TM imageries in different situations. Geo-Spat. Inf. Sci. 2015, 18, 32–42. [Google Scholar] [CrossRef]
- Gautam, V.K.; Gaurav, P.K.; Murugan, P.; Annadurai, M. Assessment of surface water Dynamicsin Bangalore using WRI, NDWI, MNDWI, supervised classification and KT transformation. Aquat. Procedia 2015, 4, 739–746. [Google Scholar] [CrossRef]
- Ogilvie, A.; Poussin, J.-C.; Bader, J.-C.; Bayo, F.; Bodian, A.; Dacosta, H.; Dia, D.; Diop, L.; Martin, D.; Sambou, S. Combining multi-sensor satellite imagery to improve long-term monitoring of temporary surface water bodies in the Senegal river floodplain. Remote Sens. 2020, 12, 3157. [Google Scholar] [CrossRef]
- Dilley, M.; Chen, R.S.; Deichmann, U.; Lerner-Lam, A.L.; Arnold, M. Natural Disaster Hotspots: A Global Risk Analysis; The World Bank: Reston, VA, USA, 2005. [Google Scholar]
- IPCC. Managing the Risks of Extreme Events and Disasters to Advance Climate Change Adaptation: Special Report of the Intergovernmental Panel on Climate Change; Cambridge University Press: Cambridge, UK, 2012. [Google Scholar]
- Wang, H.; Wang, J.; Cui, Y.; Yan, S. Consistency of suspended particulate matter concentration in turbid water retrieved from Sentinel-2 MSI and Landsat-8 OLI sensors. Sensors 2021, 21, 1662. [Google Scholar] [CrossRef] [PubMed]
- Arekhi, M.; Goksel, C.; Sanli, F.B.; Senel, G. Comparative evaluation of the spectral and spatial consistency of Sentinel-2 and Landsat-8 OLI data for Igneada longos forest. ISPRS Int. J. Geo-Inf. 2019, 8, 56. [Google Scholar] [CrossRef] [Green Version]
- Pahlevan, N.; Chittimalli, S.K.; Balasubramanian, S.V.; Vellucci, V. Sentinel-2/Landsat-8 product consistency and implications for monitoring aquatic systems. Remote Sens. Environ. 2019, 220, 19–29. [Google Scholar] [CrossRef]
- Flood, N. Comparing Sentinel-2A and Landsat 7 and 8 using surface reflectance over Australia. Remote Sens. 2017, 9, 659. [Google Scholar] [CrossRef] [Green Version]
- Aguilar, M.Á.; Jiménez-Lao, R.; Nemmaoui, A.; Aguilar, F.J.; Koc-San, D.; Tarantino, E.; Chourak, M. Evaluation of the consistency of simultaneously acquired Sentinel-2 and Landsat 8 imagery on plastic covered greenhouses. Remote Sens. 2020, 12, 2015. [Google Scholar] [CrossRef]
- Williams, D.L.; Goward, S.; Arvidson, T. Landsat: Yesterday, today, and tomorrow. Photogramm. Eng. Remote Sens. 2006, 72, 1171–1178. [Google Scholar] [CrossRef]
- Woodcock, C.E.; Allen, R.; Anderson, M.; Belward, A.; Bindschadler, R.; Cohen, W.; Gao, F.; Goward, S.N.; Helder, D.; Helmer, E. Free access to Landsat imagery. Science 2008, 320, 1011. [Google Scholar] [CrossRef] [PubMed]
- Irons, J.R.; Dwyer, J.L.; Barsi, J.A. The next Landsat satellite: The Landsat data continuity mission. Remote Sens. Environ. 2012, 122, 11–21. [Google Scholar] [CrossRef] [Green Version]
- Loveland, T.R.; Dwyer, J.L. Landsat: Building a strong future. Remote Sens. Environ. 2012, 122, 22–29. [Google Scholar] [CrossRef]
- Roy, D.P.; Wulder, M.A.; Loveland, T.R.; Woodcock, C.; Allen, R.G.; Anderson, M.C.; Helder, D.; Irons, J.R.; Johnson, D.M.; Kennedy, R. Landsat-8: Science and product vision for terrestrial global change research. Remote Sens. Environ. 2014, 145, 154–172. [Google Scholar] [CrossRef] [Green Version]
- Drusch, M.; Del Bello, U.; Carlier, S.; Colin, O.; Fernandez, V.; Gascon, F.; Hoersch, B.; Isola, C.; Laberinti, P.; Martimort, P. Sentinel-2: ESA's optical high-resolution mission for GMES operational services. Remote Sens. Environ. 2012, 120, 25–36. [Google Scholar] [CrossRef]
- Szantoi, Z.; Strobl, P. Copernicus Sentinel-2 calibration and validation. Eur. J. Remote Sens. 2019, 52, 253–255. [Google Scholar] [CrossRef] [Green Version]
- Kityuttachai, K.; Heng, S.; Sou, V. Land Cover Map of the Lower Mekong Basin; MRC Technical Paper No. 59, Information and Knowledge Management Programme; Mekong River Commission: Phnom Penh, Cambodia, 2016; p. 82. [Google Scholar]
- Center for International Earth Science Information Network—CIESIN—Columbia University. Gridded Population of the World; Version 4 (GPWv4): Population Density, Revision 11; CIESIN: Palisades, NY, USA, 2018. [Google Scholar] [CrossRef]
- Center for International Earth Science Information Network—CIESIN—Columbia University. Documentation for the Gridded Population of the World; Version 4 (GPWv4), Revision 11 Data Sets; CIESIN: Palisades, NY, USA, 2018. [Google Scholar] [CrossRef]
Figure 1.
Map of the study area.

Figure 2.
Methodology used in riverbank erosion rate analysis and hotspot mapping.

Figure 3.
Coverage of (a) Landsat 5, 7, and 8 scenes and (b) Sentinel-2 tiles over the study area.

Figure 4.
Comparison of riverbank lines detected in Landsat 8 and Sentinel-2 images with the baseline detected from Google Earth images; (a) data recorded in December 2017; (b) data recorded in January 2019.
Figure 4.
Comparison of riverbank lines detected in Landsat 8 and Sentinel-2 images with the baseline detected from Google Earth images; (a) data recorded in December 2017; (b) data recorded in January 2019.

Figure 5.
Comparison of differences in distance of riverbank lines detected by Landsat 8 and Sentinel-2 to the baseline (Google Earth images); (a) data recorded in December 2017 at Kaoh Soutin; (b) data recorded in January 2019 at Kaoh Soutin.
Figure 5.
Comparison of differences in distance of riverbank lines detected by Landsat 8 and Sentinel-2 to the baseline (Google Earth images); (a) data recorded in December 2017 at Kaoh Soutin; (b) data recorded in January 2019 at Kaoh Soutin.

Figure 6.
Long-term erosion and deposits map generated from Google Earth Engine.

Figure 7.
Average annual riverbank erosion rate and evolution of riverbank line between 1990 and 2020; the negative value represents the average annual erosion rate, and the positive value represents the average annual deposition rate.
Figure 7.
Average annual riverbank erosion rate and evolution of riverbank line between 1990 and 2020; the negative value represents the average annual erosion rate, and the positive value represents the average annual deposition rate.

Figure 8.
Annual riverbank lines detected from Sentinel-2 images; (a) Peam Kaoh Sna; (b) Kaoh Soutin; (c) Ruessei Srok; (d) Kampong Reab; (e) water level at Kampong Cham station.
Figure 8.
Annual riverbank lines detected from Sentinel-2 images; (a) Peam Kaoh Sna; (b) Kaoh Soutin; (c) Ruessei Srok; (d) Kampong Reab; (e) water level at Kampong Cham station.

Figure 9.
Riverbank erosion exposure map along the Mekong River in Cambodia; (a) land cover map; (b) population density map; (c) exposure map.
Figure 9.
Riverbank erosion exposure map along the Mekong River in Cambodia; (a) land cover map; (b) population density map; (c) exposure map.

Figure 10.
Map of riverbank erosion hotspots along the Mekong River in Cambodia; (a) average annual riverbank erosion rate between 2015 and 2020; (b) average annual riverbank erosion rate between 1990 and 2020; (c) exposure map; (d) hotspot map.
Figure 10.
Map of riverbank erosion hotspots along the Mekong River in Cambodia; (a) average annual riverbank erosion rate between 2015 and 2020; (b) average annual riverbank erosion rate between 1990 and 2020; (c) exposure map; (d) hotspot map.

Figure 11.
Photo of the riverbank in (a) Ruessei Srok and (b) Kaoh Soutin.


Table 1.
Required data for riverbank erosion rate analysis and hotspot mapping.
| Data | Data Availability (Data Used) | Data Sources |
|---|---|---|
| Landsat 5, 7, and 8 | 1984–Present (1990–2020) | NASA/USGS |
| Sentinel-2 | 2015–Present (2016–2021) | EC/ESA |
| Landcover | 2010 (2010) | MRC |
| Population density | 2000–2020 (2020) | GPWv4 |
Table 2.
Summary of Landsat data used in this study.
| Mission | Instruments | Band | Scene ID | Repeat Cycle | Date |
|---|---|---|---|---|---|
| Landsat 5 | TM 1, MSS 2 | B2 (Green) & B5 (SWIR) | 125/50; 125/51; 125/52; 126/50; 126/51; 126/52 (Path/Row) | 16 days | 1 January 1990–31 December 2011 |
| Landsat 7 | ETM+ 3 | B2 (Green) & B5 (SWIR) | 16 days | 1 January 2012–31 December 2013 | |
| Landsat 8 | OLI 4, TIRS 5 | B3 (Green) & B6 (SWIR) | 16 days | 1 January 2014–31 December 2020 |
1 Thematic Mapper; 2 Multi Spectral Scanner; 3 ETM: Enhanced Thematic Mapper Plus; 4 OLI: Operational Land Imager; 5 Thermal InfraRed Sensor.
Table 3.
Estimated erosion and deposition rates along the Mekong River in Cambodia.
| Period | Location | Erosion | Deposition | ||
|---|---|---|---|---|---|
| Total Area (ha) | Rate (ha/yr) | Total Area (ha) | Rate (ha/yr) | ||
| 1990–2020 | Left bank | 1785.69 | 59.52 | 1291.44 | 43.05 |
| Right bank | 2105.37 | 70.18 | 2417.81 | 80.59 | |
| Total | 3891.06 | 129.7 | 3709.25 | 123.64 | |
Publisher’s Note: MDPI stays neutral with regard to jurisdictional claims in published maps and institutional affiliations. |
© 2022 by the authors. Licensee MDPI, Basel, Switzerland. This article is an open access article distributed under the terms and conditions of the Creative Commons Attribution (CC BY) license (https://creativecommons.org/licenses/by/4.0/).
Share and Cite
MDPI and ACS Style
Tha, T.; Piman, T.; Bhatpuria, D.; Ruangrassamee, P. Assessment of Riverbank Erosion Hotspots along the Mekong River in Cambodia Using Remote Sensing and Hazard Exposure Mapping. Water 2022, 14, 1981. https://doi.org/10.3390/w14131981
AMA Style
Tha T, Piman T, Bhatpuria D, Ruangrassamee P. Assessment of Riverbank Erosion Hotspots along the Mekong River in Cambodia Using Remote Sensing and Hazard Exposure Mapping. Water. 2022; 14(13):1981. https://doi.org/10.3390/w14131981
Chicago/Turabian StyleTha, Theara, Thanapon Piman, Dhyey Bhatpuria, and Piyatida Ruangrassamee. 2022. "Assessment of Riverbank Erosion Hotspots along the Mekong River in Cambodia Using Remote Sensing and Hazard Exposure Mapping" Water 14, no. 13: 1981. https://doi.org/10.3390/w14131981
Note that from the first issue of 2016, this journal uses article numbers instead of page numbers. See further details here.