
Seasonal Development of Phytoplankton in South Bohemian Fishponds (Czechia)


1
Institute of Aquaculture and Protection of Waters, South Bohemian Research Center of Aquaculture and Biodiversity of Hydrocenoses, Faculty of Fisheries and Protection of Waters, University of South Bohemia in České Budějovice, Na Sádkách 1780, 370 05 Ceske Budejovice, Czech Republic
2
Faculty of Science, University of South Bohemia in Ceske Budejovice, Branišovská 1760, 370 05 Ceske Budejovice, Czech Republic
3
Watershed of Vltava State Enterprise, Emila Pittera 1, 370 01 Ceske Budejovice, Czech Republic
*
Author to whom correspondence should be addressed.
Water 2022, 14(13), 1979; https://doi.org/10.3390/w14131979
Submission received: 29 April 2022
/
Revised: 14 June 2022
/
Accepted: 15 June 2022
/
Published: 21 June 2022
Abstract
:Fishponds with a relatively small water volume, high fish abundance, and wide range of nutrient concentrations serve as suitable models for ecological studies. Intensified fish production, together with increased input of nutrients from the watershed, resulted in hypertrophic conditions in the majority of fishponds, the most common type of lentic ecosystems worldwide. In order to understand the processes driving plankton succession, we analyzed eight-year data from nine fishponds in Czechia with differing trophic status. The mean concentration of phosphorus (P) was 200 µg L−1 in hypertrophic ponds, 130 µg L−1 in eutrophic, and 40 µg L−1 in mesotrophic. Correspondingly the mean concentration of phytoplankton was 14.9 mg L−1 in hypertrophic ponds, 7.3 mg L−1 in eutrophic, and 1.96 mg L−1 in mesotrophic. Although the fish stock of 200–900 kg ha−1 eliminated zooplankton in eutrophic and hypertrophic ponds the faster-growing algae did not prevail over cyanobacteria. Zooplankton grazing pressure on algae is thus not relevant in studied food webs. Due to the rapid biological denitrification in hypertrophic and eutrophic fishponds resulting in low concentration of mineral nitrogen (N), these ponds were dominated by N-fixing cyanobacteria throughout the whole season. Similarly, the faster-growing algae prevail over cyanobacteria in mesotrophic ponds until the decrease of available mineral nitrogen. The limitation by mineral N is thus the primary driver of phytoplankton composition reflected in cyanobacterial dominance, independently of the trophic status and fish density in studied fishponds.
1. Introduction
Cultural eutrophication has dramatically transformed the ecosystems of lakes and rivers worldwide. It is widely accepted that the main limiting element of primary production in aquatic environments is phosphorus (P) that acts as the primary driver of ecosystem status [1]. Hypertrophy, defined by concentration of P higher than 100 µg L−1, is expected to become a feature of many lakes in the near future [2] due to continuous P input by human activity, accelerated by climate change connected to decreased rainfall in affected regions [3,4]. The study of biological processes in hypertrophic water bodies is of crucial relevance due to their extend in the near future.
General patterns in the seasonal succession of plankton are complex, but relatively well documented in oligotrophic to eutrophic lakes [5]. All basic ecological interactions, including grazing, predation, competition, symbiosis, and parasitism influence plankton composition and biomass [6,7]. A combination of ecological processes and unstable abiotic conditions drives plankton succession, making it unpredictable at the population level. This phenomenon is reflected in the ‘paradox of plankton’ (i.e., the continual change of species composition and community structure) [8]. The typical annual pattern of plankton succession might be overridden by fluctuations in weather, hampering year-to-year comparisons. To compensate for these difficulties, data from numerous seasons and water bodies are usually evaluated to establish the general pattern of seasonal plankton succession.
Fishponds, having relatively low water volume and high fish abundance, might serve as suitable models for ecological studies. With a combined area of 41,080 ha, they are the dominant water bodies in South Bohemia, Czech Republic. High nutrient input from their watersheds and in the form of manure and fish feed makes them ideal sites for trophic studies, as their trophic status has progressed from mesotrophic to hypertrophic within the past 60 years [9].
The natural seasonal dynamics of plankton communities were observed in Czech fishponds through the 1960s and 1970s [10,11]. Their seasonal succession corresponded to a predictable scenario for shallow lakes not influenced by human activity. The low transparency during spring driven by phytoplankton growth and later a high-transparency stage caused by filtration activity of large zooplankton, mainly Daphnia spp., is well reflected in the revised PEG model [6]. Seasonal dynamics of plankton has been well economized in fishery management, with moderate fish biomass below 300 kg ha−1 [11], providing efficient production [12]. Zooplankton played a major role in energy transfer from phytoplankton to fish, and natural fish production relied on the abundance of large Daphnia as keystone species [10]. Since the 1980s, intensified fish production practices, together with increased input of nutrients from the watershed, changed the status of the majority of fishponds from mesotrophic to eutrophic and altered the structure and dynamics of plankton communities [9]. Long-term nutrient loads from watersheds and fish stock biomass reaching 1000 kg ha−1 [13] resulted in hypertrophic conditions and impaired efficiency of fish production [12].
To better understand the influence of variable nutrient levels and fish densities on plankton behavior, we studied nine fishponds for eight years.
Hypothesis 1. (H1).
We hypothesized that the concentrations of main nutrients, both P and N, are positively correlated with the biomass of phytoplankton.
Hypothesis 2. (H2).
We suggest that PEG model would be sufficient to describe the plankton dynamics in studied fish ponds.
We also try to explain the seasonal development of phytoplankton and particularly the cyanobacterial dominance in eutrophic and hypertrophic fishponds.
Hypothesis 3. (H3).
We also hypothesized that zooplankton will preferentially consume algae, thus providing a free niche for the development and dominance of cyanobacteria in all studied types of fishponds.
2. Material and Methods
2.1. Study Area
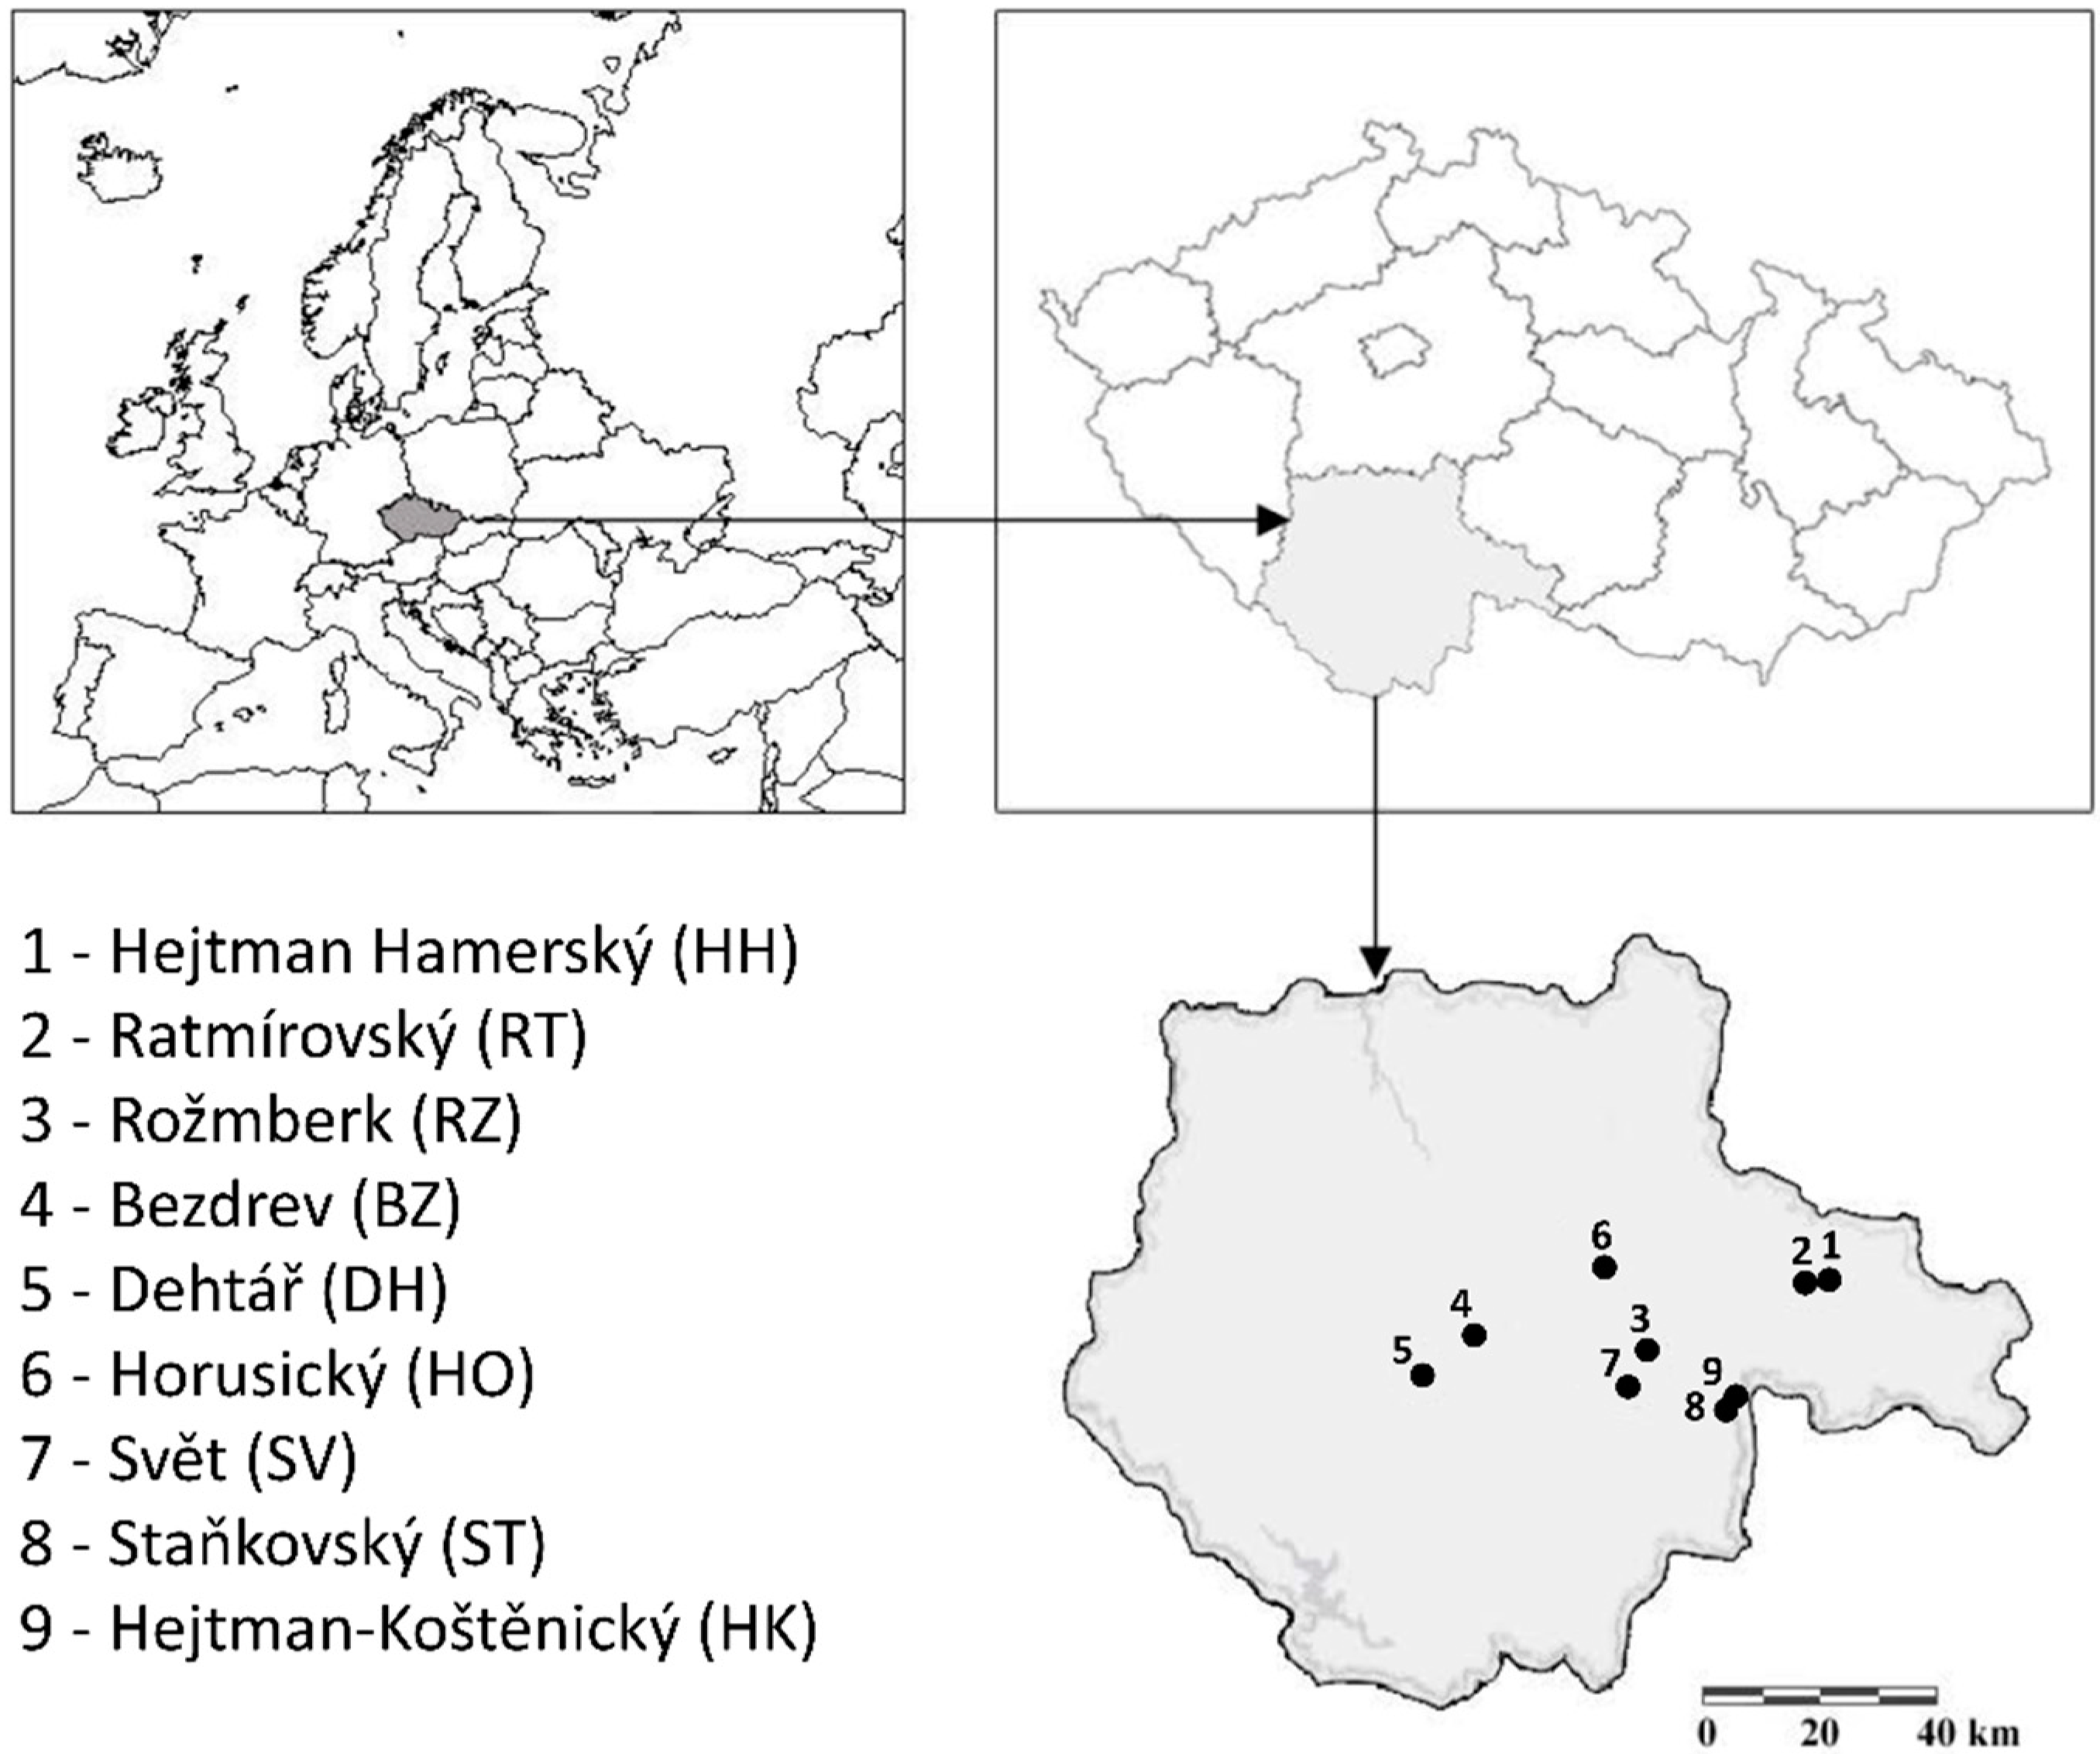
Nine fishponds in the Czech Republic, with an area from 68 to 449 ha, water volume from 1.3 × 10³ to 5.9 × 10³ m3, and mean depth in the range from 1.0 to 2.6 m were selected for the study (Figure 1). They were monitored in the context of the EU Water Framework Directive by the Vltava River Authority, State Enterprise. Fishponds Rožmberk (RZ), Dehtář (DH), Svět (SV), Horusický (HO), Ratmírovský (RT), Hejtman Hamerský (HH), Bezdrev (BZ), Staňkovský (ST), and Hejtman-Koštěnický (HK) belong to the largest in the South Bohemian region and are all located in the South Bohemian basin. Basic parameters of the fishponds are shown in Table 1. The hydrobiological sampling season was set from April to August, and it is referred to throughout the text as “season”. The mean monthly temperature during the spring part of the season (April to May) rises from 8 to 17 °C, and daylight period increases from 12:56 h to 15:56 h. The summer season (June to August), is usually warm, with a mean monthly temperature ranging from 21 to 24 °C, and daylight period ranging from 16:06 h in June to 15:04 h in August. In autumn (September to October), the monthly mean temperatures decrease from 18 °C to 8 °C, and daylight period is reduced from 13:23 h to 11:37 h.
2.2. Chemical Parameters
The upper layer (0–1 m depth) of each fishpond was sampled biweekly or monthly using a Bayer tube sampler at the deepest site in each pond between 08:00 and 10:00 h from April to October 2008 through to 2016, (Table 2, Figure 1). Ponds were also sampled at monthly intervals from November to March during the ice-free period. Sampling duration and frequency varied among ponds, as shown in Table 1.
Water samples were analysed for total P (TP) and soluble reactive P (SRP) by inductively coupled plasma spectrometry (Agilent 8800 ICP-QQQ, Santa Clara, California, USA; [14]). The concentration of total N (TN) was measured by determination of bound N following oxidation of N-oxides (Analytik Jena multi N/C 2100, Jena, Germany) according to ISO SIST [15]. Spectrometry and liquid chromatography were used for ammonium (NH4-N) and nitrate (NO3-N) determination (Shimadzu UV-1650PC, Shimadzu Corporation, Tokyo, Japan; Dionex ICS-1000, ThermoFisher Scientific, Waltham, MA, USA) [16]. Chlorophyll-a (Chl-a) concentration was determined spectrophotometrically after extraction by hot ethanol (Shimadzu UV-1650PC, Shimadzu Corporation, Tokyo, Japan) [17]. Water transparency was measured by Secchi disc.
2.3. Phytoplankton
Phytoplankton was collected simultaneously with chemical samples at monthly intervals from April to October as unfiltered subsamples from the euphotic layer using a Van Dorn sampler (392 analyzed communities in total; Table 2). Samples were preserved with Lugol’s solution, stored in the dark, and counted in Utermöhl’s chamber using an inverted microscope (Olympus IX 71, Tokyo, Japan) [18]. Biovolume calculation was based on the mean algal cell dimensions using the approximation of cell morphology to regular geometric shapes, according to Komárková and Cronberg [19]. The algal cell volume was converted to wet biomass, assuming a specific gravity of 1.0 [20].
2.4. Zooplankton
Sampling was carried out simultaneously with phytoplankton (Table 2), zooplankton was collected by vertical hauls from the bottom to the surface using an Apstein plankton net (net mesh = 40 µm). Each sample was divided by two sieves of mesh size 0.71 mm and 0.42 mm [21] and fixed with 4% formaldehyde. Zooplankton species were determined and counted in a total of 386 samples. The zooplankton abundance was estimated by counts using optical microscopy in sedimentation chambers. Dry weight for each species was calculated using taxon-specific regressions [22,23,24,25,26,27].
2.5. Fish and Feed
Commercial fisheries provided fish data for five ponds in the studied years, while data for fishpond RT were available for 2011 only. Fish that were stocked into ponds at the beginning of each production cycle, together with data of fish added or harvested in corresponding dates, were calculated as monthly data consistent with fish harvest every second year or annually for RZ. The total biomass consisted of 90% common carp (Cyprinus carpio L.). The remainder was bighead and silver carp (Hypophthalmichthys nobilis Richardson 1845 and H. molitrix Val., respectively), grass carp (Ctenopharyngodon idella Valenciennes 1844), northern pike (Esox lucius L.), pike-perch (Sander lucioperca L.), tench (Tinca tinca L.), Prussian carp (Carassius gibelio Bloch), common and silver bream (Abramis brama L. and A. bjoerkna L., respectively). The weight of annual supplemental feed, mainly whole grain wheat or barley, was calculated to monthly values according to the standard practice of South Bohemian commercial fisheries [28]. Values were further converted to TP using a conversion ratio of 1 g of P to 1 kg whole grain [28].
No quantitative survey of fish abundance and feed supplied was undertaken in pond BZ and mesotrophic ponds. ST and HK were not managed and used only for recreational fishing.
2.6. Data and Statistical Analyses
The concentrations of TP, SRP, TN, NO3-N, NH4-N, and Chl-a, along with transparency, were used to describe habitat variables and pond trophic status. To investigate the seasonal trends in zooplankton (Zoo), phytoplankton (Phy), fish biomass density, and cumulative supplemental feed, data were fitted by locally weighted smoothing (LOESS) with a span of 95%. Linear mixed models (LMM) were employed to test the relationship among Phy TB vs. TP and TN. The variables were analyzed independently of one another. Assumptions of the models were checked using diagnostic plots of residuals and correlograms [29]. The data were log-transformed to improve normality. The predictive accuracy of each model was assessed using leave-one-out cross-validated relative median absolute error (RMAE).
The principal component analysis (PCA) was performed according to the similarity in the variables of concentrations of TP, NO3-N, NH4-N, TN, SRP, and Chl-a between studied ponds.
3. Results
3.1. Chemical Parameters
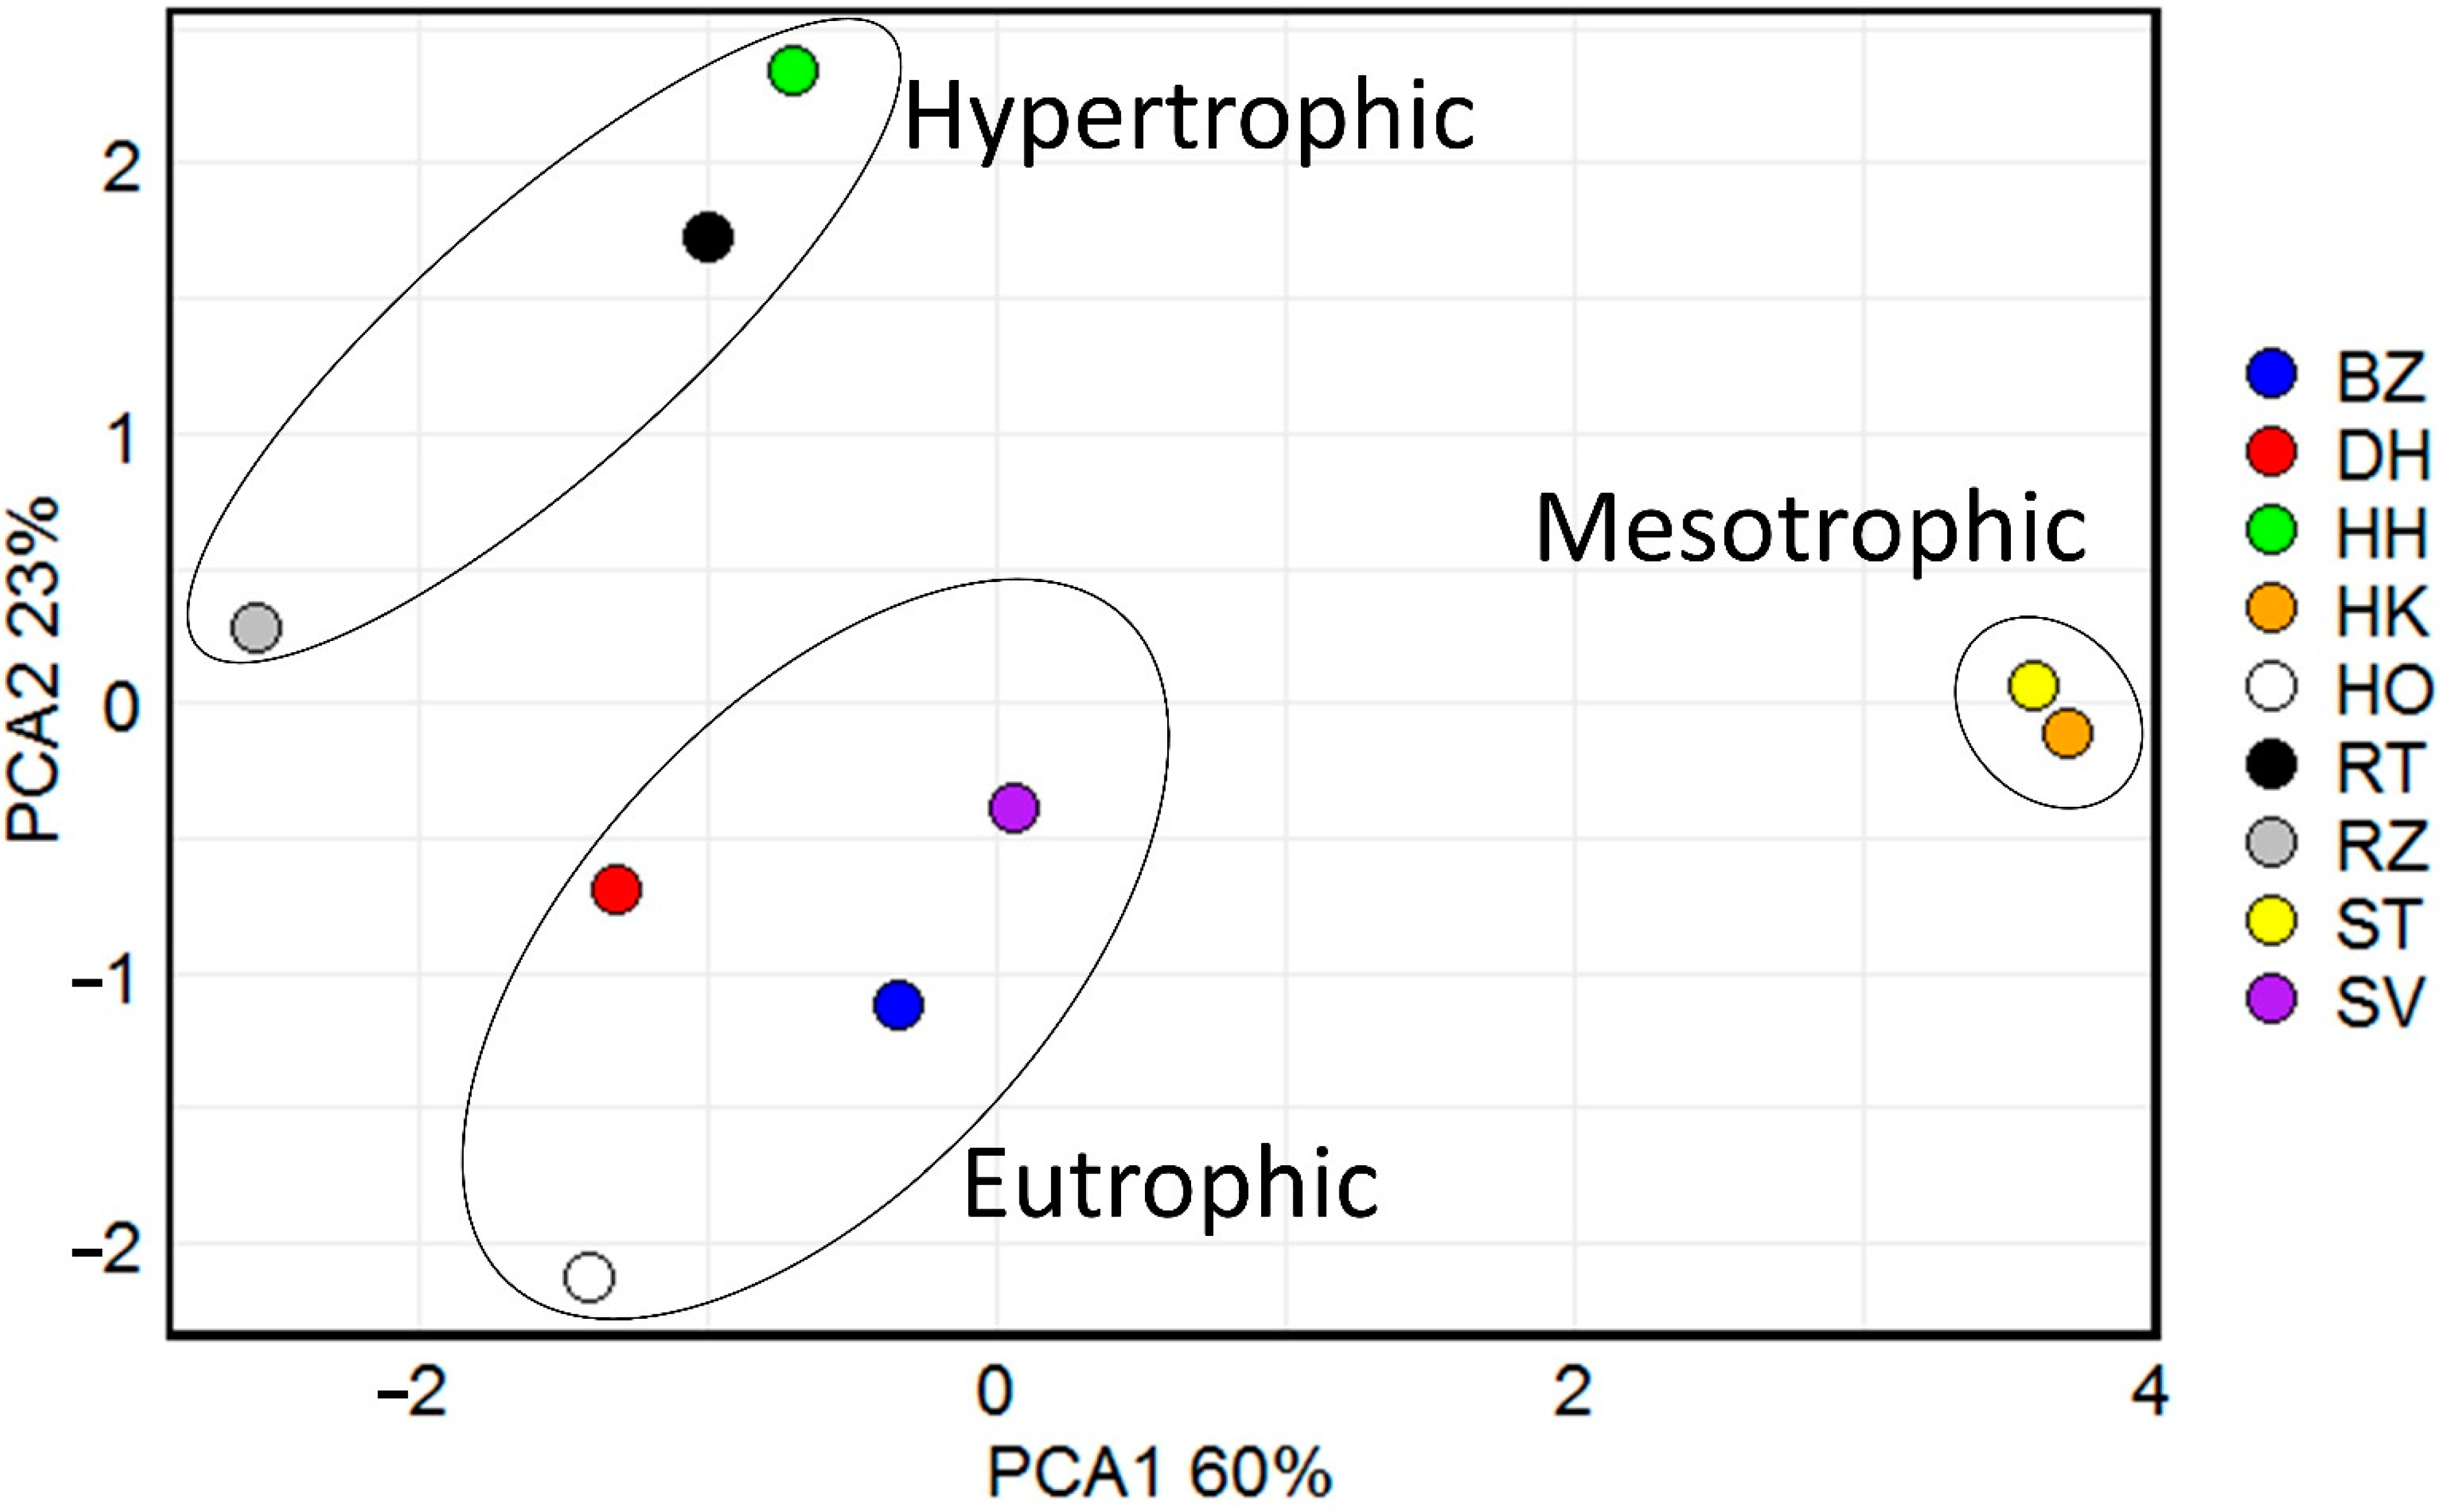
The averages and ranges of physical and water parameters (TP, SRP, NO3-N, NH4-N, TN, Chl-a), and biomass of phytoplankton in nine fishponds are presented in Table 1. The 9 ponds were grouped into three clusters according to the similarity in the variables of water parameters (Figure 2).
PCA clustered the hypertrophic ponds (RZ, RT, HH) into a closely related group. The concentration of TP gradually increased from April to August and ranged from 0.04 mg L−1 to 0.7 mg L−1, with an average concentration 0.2 mg L−1 (Supplementary Figure S1a). The concentration of SRP ranged from 0.01 to 0.2 mg L−1 and reached maximum values in the early summer, with the average concentration of 0.03 mg L−1 (Supplementary Figure S1b). The mean Chl-a concentration was 0.1 mg L−1, and the maximum and minimum concentrations were found in RZ in April and August 0.5 mg L−1 and 0.004 mg L−1, respectively (Supplementary Figure S1c). The transparency of these ponds had lowest values in summer (0.1 m) and highest in April (2 m), averaging at 0.5 m (Supplementary Figure S1d).
Maximum values of TN and NO3-N in RZ were recorded in August and April (3.4 mg L−1 and 1.7 mg L−1, respectively; Supplementary Figure S2a,b). The mean concentration of NH4-N ranged from 0.1 mg L−1 to 0.2 mg L−1 with a maximum value in the beginning of October (0.68 mg L−1; Supplementary Figure S2c).
Eutrophic ponds (SV, HO, DH, and BZ) were also grouped by PCA analysis (Figure 2). The average concentration of TP was 0.1 mg L−1 and, except for one case (DH 0.6 mg L−1 in May), it remained below 0.4 mg L−1 (Supplementary Figure S1a). The concentration of SRP ranged from 0.02 mg L−1 to 0.06 mg L−1, peaking in the period between June and July (Supplementary Figure S1b).
The mean concentration of Chl-a was 0.06 mg L−1 and ranged from 0.001 mg L−1 to 2.2 mg L−1 (Supplementary Figure S1c). The average transparency was 0.63 m. The maximum transparency was found in SV (3.5 m in May; Supplementary Figure S1d).
The average concentration of TN ranged from 1.54 mg L−1 to 2.01 mg L−1 and peaked twice, namely in late spring and September (Supplementary Figure S2a). The concentration of NO3-N ranged from 0.1 mg L−1 to 2.7 mg L−1 and peaked in April (Supplementary Figure S2b). The average concentration of NH4-N was 0.22 mg L−1 and peaked in early summer and (Supplementary Figure S2c).
Mesotrophic ponds ST and HK formed the third cluster in the PCA, with the lowest concentration of nutrients (Figure 2). The mean concentration of TP was 0.04 mg L−1, with a maximum 0.06 mg L−1 in HK during the autumn (Supplementary Figure S1a). The concentration of SRP in this group was lower than 0.3 mg L−1 throughout all seasons (Supplementary Figure S1b). The mean concentration of Chl-a was 0.027 and ranged from 0.002 mg L−1 to 0.21 mg L−1 (Supplementary Figure S1c). The mean transparency was the highest among all ponds, with 1.38 m and its maximal value was measured in May in ST 2.5 m (Supplementary Figure S1d).
Maximum of 2.1 mg L−1 TN within mesotrophic ponds was found in ST in April (Supplementary Figure S2a). The average concentration of TN was 1.1 mg L−1, NH4-N 0.09 mg L−1, and NO3-N 0.4 mg L−1. Maximum of 1.6 mg L−1 NO3-N was found in ST during the spring (Supplementary Figure S2b). The peak of NH4-N in this group was found in October 0.4 mg L−1 (Supplementary Figure S2c).
3.2. Phytoplankton
The total biomass of phytoplankton (Phy TB) of the hypertrophic ponds ranged from 534 mg L−1 (RT) to 1943 mg −1 (RZ). In these ponds, the biomass of cyanobacteria was twice as large as the biomass of algae, except for the RT pond, where algae biomass was 256 mg L−1 and cyanobacteria 278 mg L−1.
The Phy TB in eutrophic ponds ranged from 390 mg L−1 (HO) to 778 mg L−1 (SV). The TB of algae was bigger than the TB of cyanobacteria except for SV, where the concentration of algae was 357 mg L−1 and for cyanobacteria 421mg L−1.
In mesotrophic ponds, the Phy TB was in 158 mg L−1 (HK) and 284 mg L−1 (ST). The TB of algae was 109 mg L−1 and 172 mg L−1 in HK and ST, respectively. The TB of cyanobacteria was 49 mg L−1 and 113 mg L−1 in HK and ST, respectively.
The Phy TB continuously increased until August and September in hypertrophic ponds. In eutrophic ponds, Phy TB peaked in the beginning of autumn, and in mesotrophic ponds maximum values were found in July.
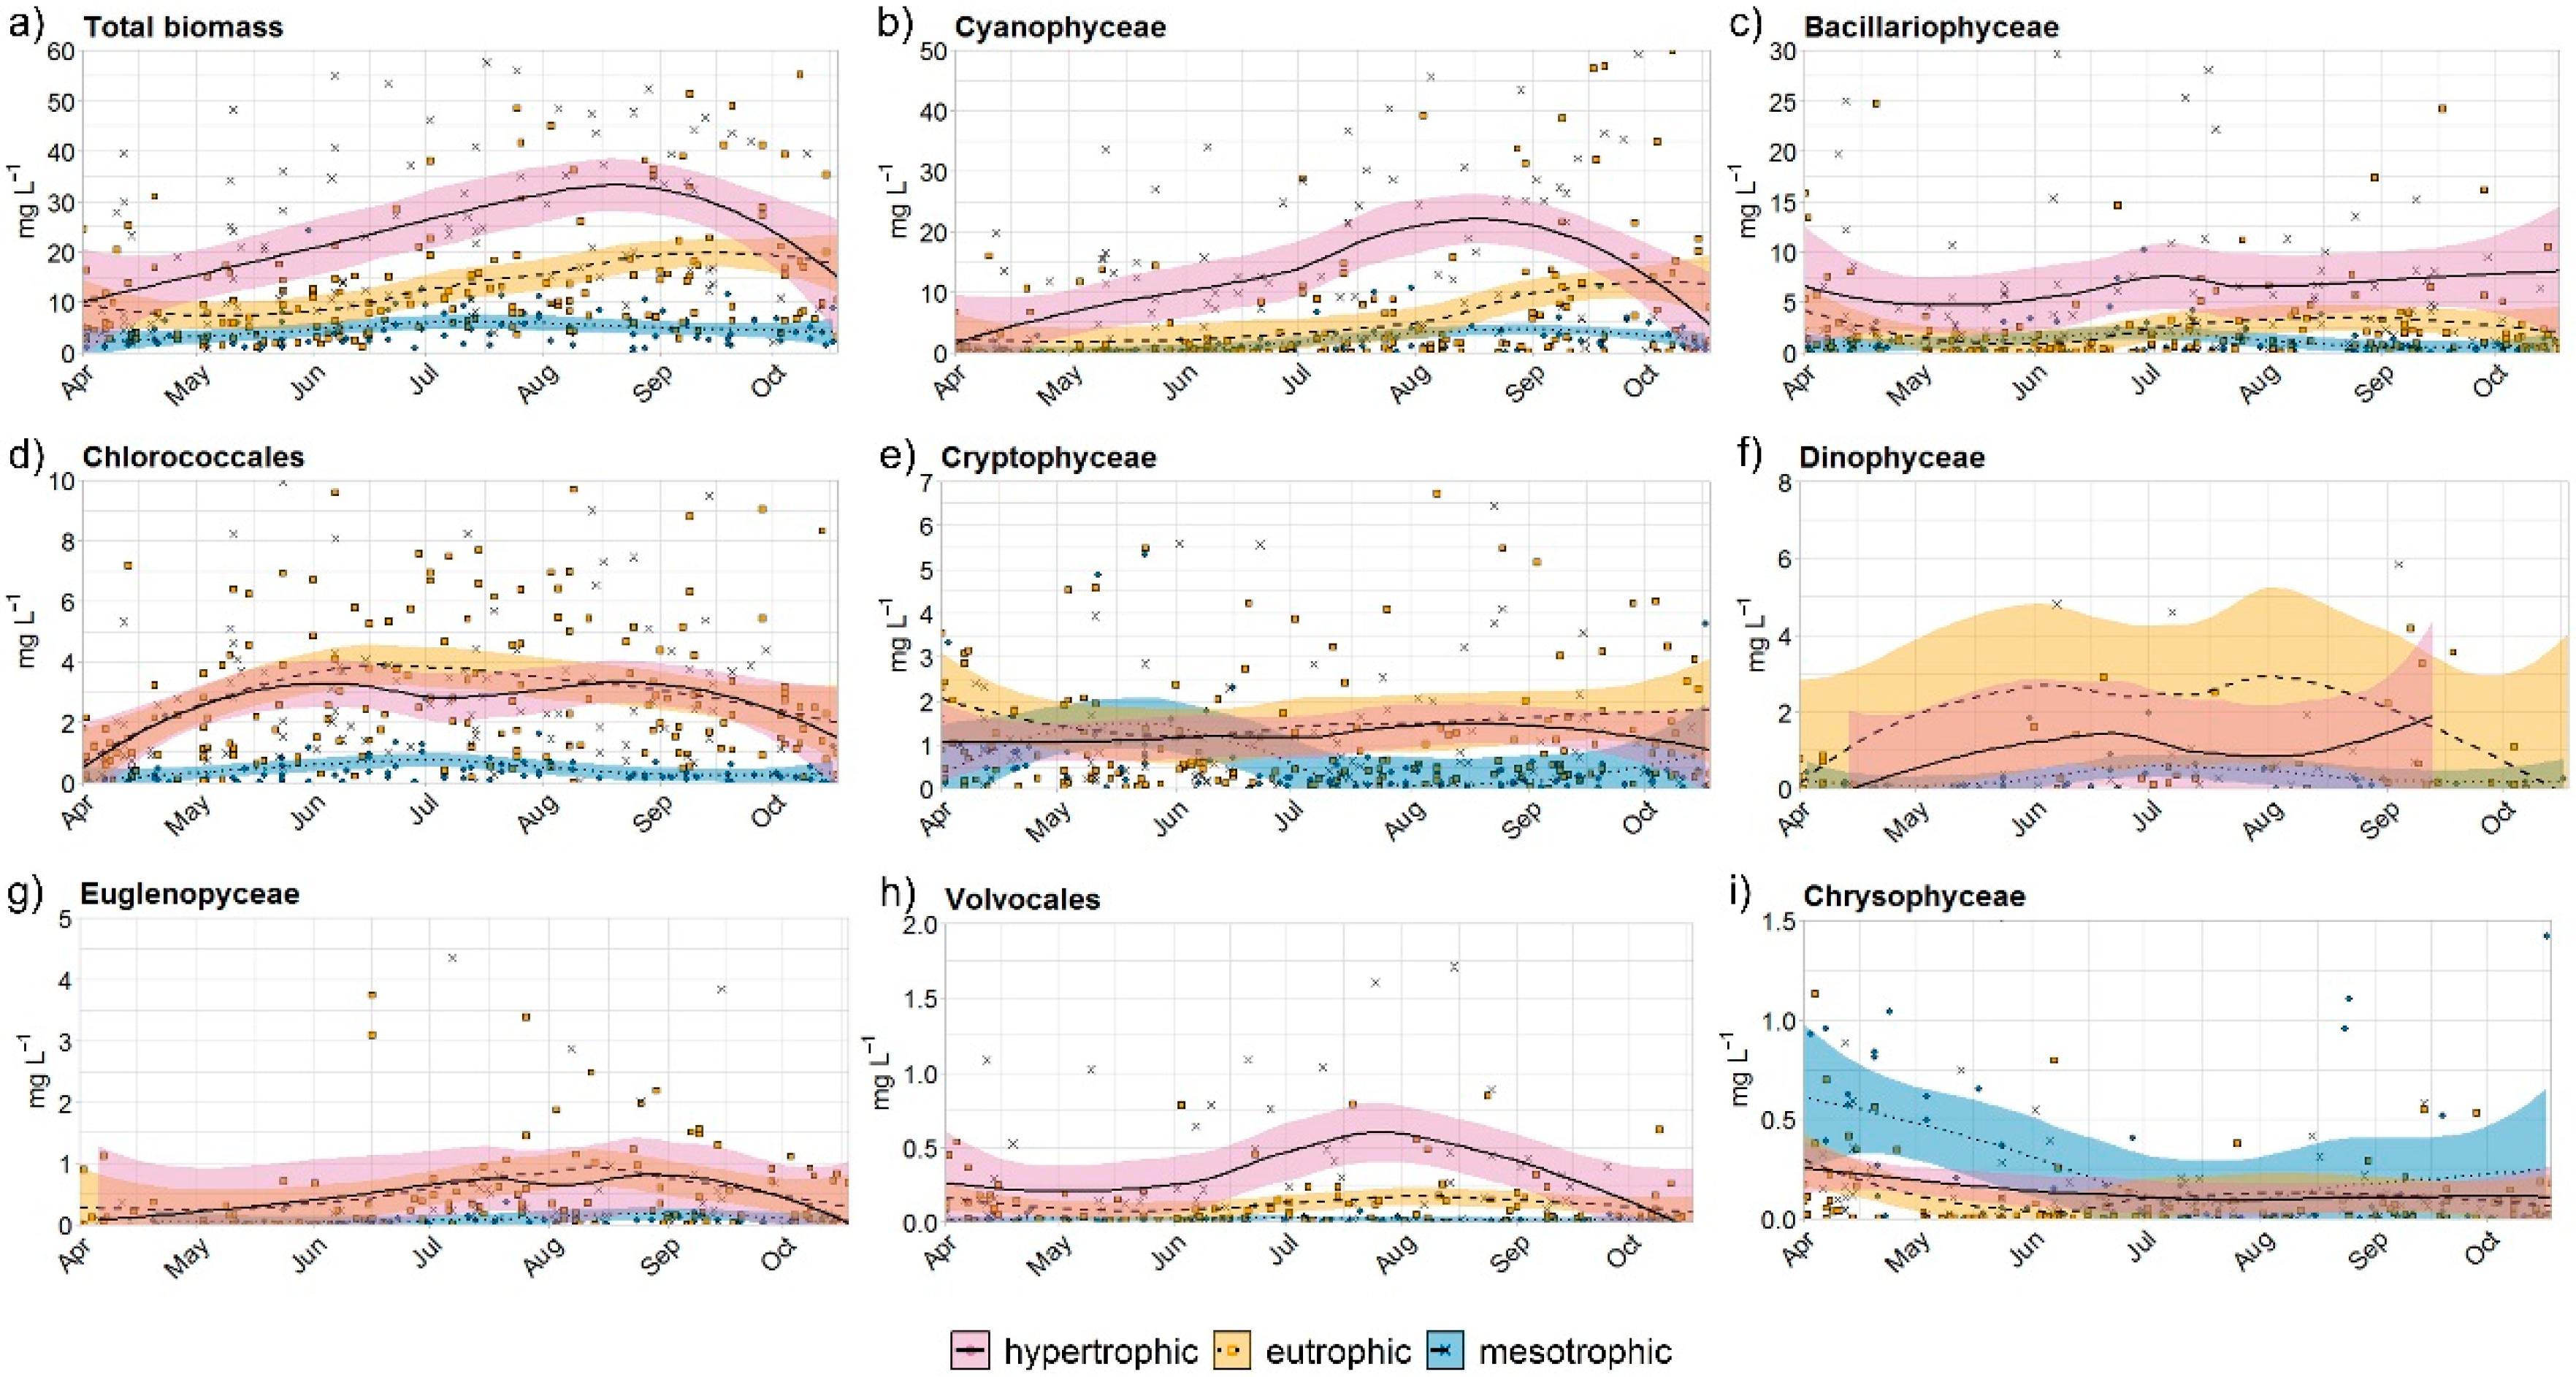
Phytoplankton communities in all 9 ponds consisted mainly of Cyanophyceae (on average 52% of total biomass), Bacillariophyceae (18%), and Chlorococcales (16%), with smaller contributions of Cryptophyceae (7%), Dinophyceae (2%), and Euglenophyceae, Volvocales and Chysophyceae (1%). Phytoplankton community structure varied among ponds (Figure 3). Biomasses of the phytoplankton are listed in Table 3.
From June onwards, bloom-forming Cyanobacteria began to dominate the community of phytoplankton (Figure 3b). The dominant species of cyanobacteria in hypertrophic ponds were representatives of Nostocales, such as Anabaena flos-aquae and Aphanizomenon gracile. The peak of these species was from July to September. Species such as Planktothrix agardhii (RZ), Microcystis aeruginosa (HH), and Pseudanabaena limnetica (RT) were present in lower abundances.
Species of Nostocales (mostly Anabaena flos-aquae and Aphanizomenon gracile) were the dominant species in some eutrophic ponds (SV and DH) in the late summer period. However, in BZ and HO, Planktothrix agardhii represented bigger biomass than Anabaena spp., with a maximum in September in BZ (37.1 mg L−1, compared to the biomass of Nostocales species of only 11.1 mg L−1).
In the mesotrophic ponds, cyanobacteria were the dominant species from August to October, ranging from 69.7 mg L−1 in HK to 222 mg L−1 in ST (Figure 3b). The dominant cyanobacteria species were Anabaena viguieri and Aphanizomenon yezoense, with maximum values in August (28 mg L−1 and 58 mg L−1, respectively). The biomass of colonial cyanobacteria such as Woronichinia naegeliana, Coelomoron pusillum, and species of the genera Chroococcus and Synechococcus were most common in ponds HK (13.1 mg L−1) and ST (39.4 mg L−1). Their populations peaked in summer and their maximum was observed in July (2.81 mg L−1), mainly caused by Woronichinia naegeliana.
Bacillariophyceae a had a peak of growth in the early spring in hypertrophic and from mid-summer to the end of the growing season in eutrophic ponds (Figure 3c). The maximum biomass of Bacillariophyceae in the hypertrophic ponds was 54.5 mg L–1 in RZ during summer and was mainly composed of Aulacoseira species (A. granulate, A. ambigua), Nitzschia acicularis, and Synedra acus. In eutrophic ponds, the highest peak of Bacillariophyceae was in DH in July (45.3 mg L–1), caused by Aulacoseira and Synedra species. In mesotrophic ponds, the maximum of Bacillariophyceae was observed in ST throughout June (28.1 mg L–1) and was mainly caused by Fragilaria crotonensis and Asterionella Formosa (Figure 3c).
The development of Chlorococcales occurred from the beginning of spring till autumn (Figure 3d). In hypertrophic ponds, maximum values were found in May in RT and HH (8.2 mg L−1 and 9.93 mg L−1, respectively) and September in RZ (9.5 mg L−1), the biomass constituting mainly of Scenedesmus quadricauda and Pediastrum boryanum. In eutrophic ponds, the maximum concentration was found in DH in May (16.2 mg L−1), in June in BZ (10.8 mg L−1), in August in SV (9.7 mg L−1), and in October in HO (9.1 mg L−1). The maximum values were mostly caused by the genera Pediastrum, Coelastrum, and Oocystis. In mesotrophic ponds, the maximum values were found in June in HK and ST (1.7 mg L−1 and 3.9 mg L−1, respectively). In these ponds, the bloom of Chlorophyta was caused by the genera Planktosphaeria and Botryococcus.
Species of Cryptophyceae such as Cryptomonas reflexa, C. marssonii, and Rhodomonas minuta did not have a clear peak of biomass in hypertrophic and eutrophic ponds, and were evenly distributed throughout the year (Figure 3e). The Cryprophyceae biomass maximum in hypertrophic ponds was found in RT in August (6.5 mg L−1); in eutrophic ponds the peak was shifted to the end of October (HO; 14.4 mg L−1). Cryprophyceae in mesothrophic ponds peaked from April to July, with maximum biomass (13 mg L−1, HK) in June, and minimum during late summer (0.01 mg L−1, ST; Figure 3e).
The biomass of Dinophyceae, Euglenophyceae, Volvocales and Chrysophyceae was small compared to the previous groups (Figure 3).
3.3. Zooplankton
The total biomass of zooplankton (Zoo TB) ranged from 6.0 mg L−1 (HH)to 25.8 mg L−1 (RZ) in hypertrophic ponds. Zoo TB in eutrophic ponds ranged from 25.6 mg L−1 (HO) to 45.1 mg L−1 (DH). In mesotrophic ponds Zoo TB was 2.9 mg L−1 (HK) and 8.5 mg L−1 (ST). Zoo TB in all ponds had maximum values during the late spring (Figure 5). Biomass of large Daphnia species such as D. cucullata, D. galeata, and D. magna had diverse dynamics in the different ponds (Figure 5b). In hypertrophic ponds maximum of the dry biomass of these species was found in May in RZ (1.5 mg L−1), in June in RT (2.4 mg L−1), and in HH in August (1 mg L−1). The average concentration of biomass ranged from 0.2 mg L−1 (RT) to 1.7 mg L−1 (RZ). In eutrophic ponds, DH and SV, the biomass maximum of large Daphnia species was detected at the end of the spring (5.4 mg L−1 and 7.9 mg L−1, respectively), and in HO in July (3.75 mg L−1). The average concentration of biomass ranged from 0.6 mg L−1 (SV) to 1.5 mg L−1 (HO) In mesotrophic ponds, Dapnia peaked in April (0.4 C mg L−1, HK) and in May (1.3 mg L−1, ST) and the average concentration was 0.08 mg L−1 in both ponds. The biomass of Other Cladocera, adult and copepodid Copepoda, and Rotifers was small compared to the previous group (Figure 5). Biomasses of the zooplankton are listed in Table 4 and Figure 5.
3.4. Fish and Feed Supplement
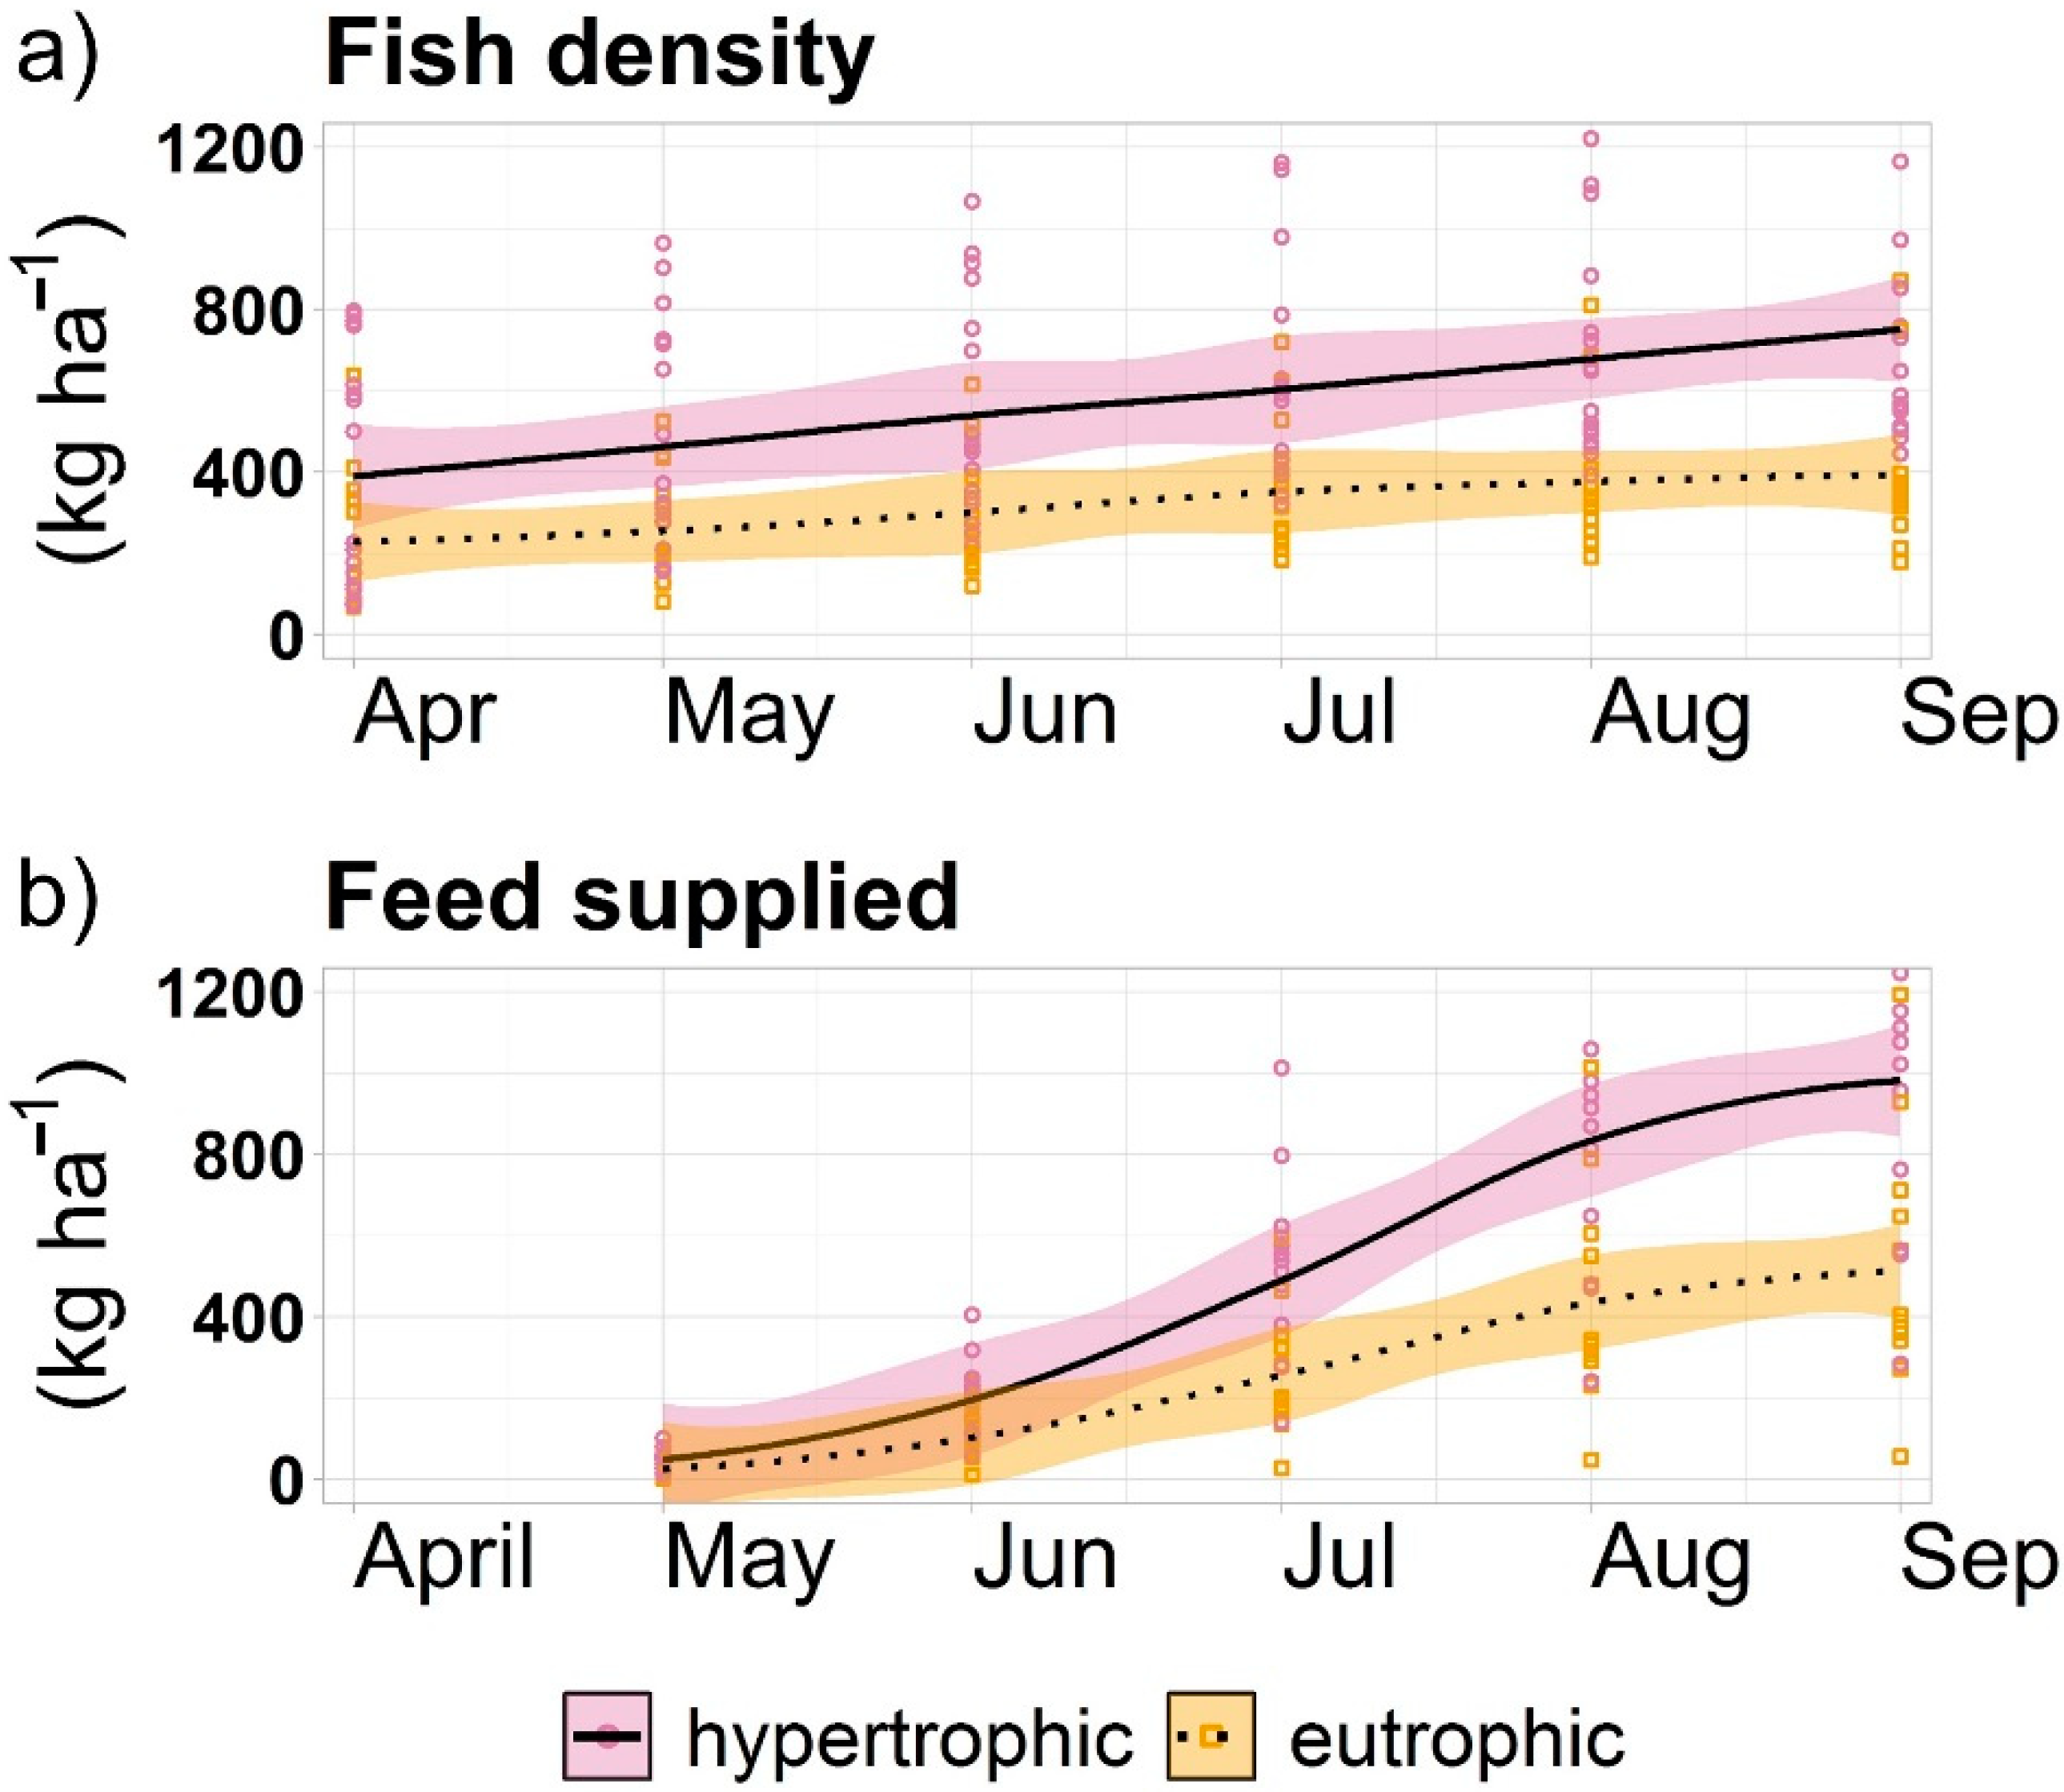
At the start of the season, fish biomass in hypertrophic ponds ranged between 86 kg ha−1 and 383 kg ha−1. The fish biomass at harvest was ranging between 307 kg ha−1 and 811 kg ha−1 (Figure 6a). Fish biomass in eutrophic ponds in the beginning of the season was approximately 391 kg ha−1, and at harvest ranged between 649 kg ha−1 and 891 kg ha−1.
The quantity of feed supplied to hypertrophic ponds annually was 403 ± 194 kg ha−1 in RT and RZ, and 1095 ± 431 kg ha−1 in HH. In eutrophic ponds, it was 885 ± 392 kg ha−1 in SV and HO, and 1095 ± 431 kg ha−1 in DH. The average monthly P supplied in feed to hypertrophic ponds was 81 ± 39 g ha−1 at RT and RZ, and 219 ± 86 g ha−1 at HH. In eutrophic ponds it was 177 ± 78 g ha−1 at SV and HO, and 219 ± 86 g ha−1 at HH.
4. Discussion
The considerable differences in trophic state between ponds were caused by the fisheries management regime that entirely changed the metabolic pathways in hypertrophic and eutrophic fishponds compared to mesotrophic (Figure 7). Studied hypertrophic and eutrophic fishponds (with a mean TP of 200 μg L−1 and 130 μg L−1, respectively) were used for commercial fish farming. The high concentration of TP was caused by weekly auxiliary feeding by cereals, which added more than 50% of the overall nutrient supply to the pond ecosystem [32,33]. On the other hand, mesotrophic ponds, with a mean TP concentration of 40 μg L−1, were used only for recreational fishing. Their P input came mainly from the inflows, and less than 5% came from fishery management [32]. These different trophic levels significantly influenced phytoplankton communities and overall seasonal plankton development.
Hypothesis 2. (H2).
In line with a high fish predation scenario of the revised PEG model (Figure 2 in [33]), neither the spring peak of phytoplankton nor the clear-water phase were observed in the studied fishponds.
In hypertrophic and eutrophic ponds, Phy TB rose continuously from spring to autumn, with cyanobacteria dominating throughout the whole season (Figure 3a,b). Interestingly, in mesotrophic ponds with a stable total Phy TB throughout the season (Figure 3a and Figure 8c), the algae significantly dominated over cyanobacteria until the end of July, when algal biomass declined, and cyanobacterial biomass grew, reaching an identical Phy TB. Hypertrophic ponds contained a similar ratio of nostocalean N-fixing cyanobacteria and other cyanobacterial biomass throughout the season. It is generally agreed that many species without heterocysts fix nitrogen even less efficiently than Nostocales. These were present in phytoplankton of hypertrophic fishponds as e.g., Pseudanabaena, Oscillatoria or Chroococcalean species. However, further studies should resolve their role. In eutrophic ponds, biomass of nostocalean N-fixing cyanobacteria such as Anabaena, Aphanizomenon generally dominated the cyanobacterial community until September (Figure 8a,b).
Bacillariophyceae were the most abundant algae in all ponds, representing 18% of PhyTB. Bacillariophyceae generally have a lower thermal optimum than cyanobacteria, giving them the advantage of being dominant in early spring [34].
The grazing pressure of zooplankton is considered as a major factor regulating phytoplankton biomass in shallow eutrophic lakes [35]. The zooplankton biomass was low in all studied ponds; while being surprisingly highest in eutrophic ponds (Figure 5a). The major part of zooplankton biomass consisted of small cladocerans that were not able to effectively suppress phytoplankton. In addition, visually-oriented predators such as weed fish consume preferentially large Daphnia with multiple offsprings [36]. The lack of decline in Phy TB reflected a low density of zooplankton that was effectively suppressed by fish (Figure 6a).
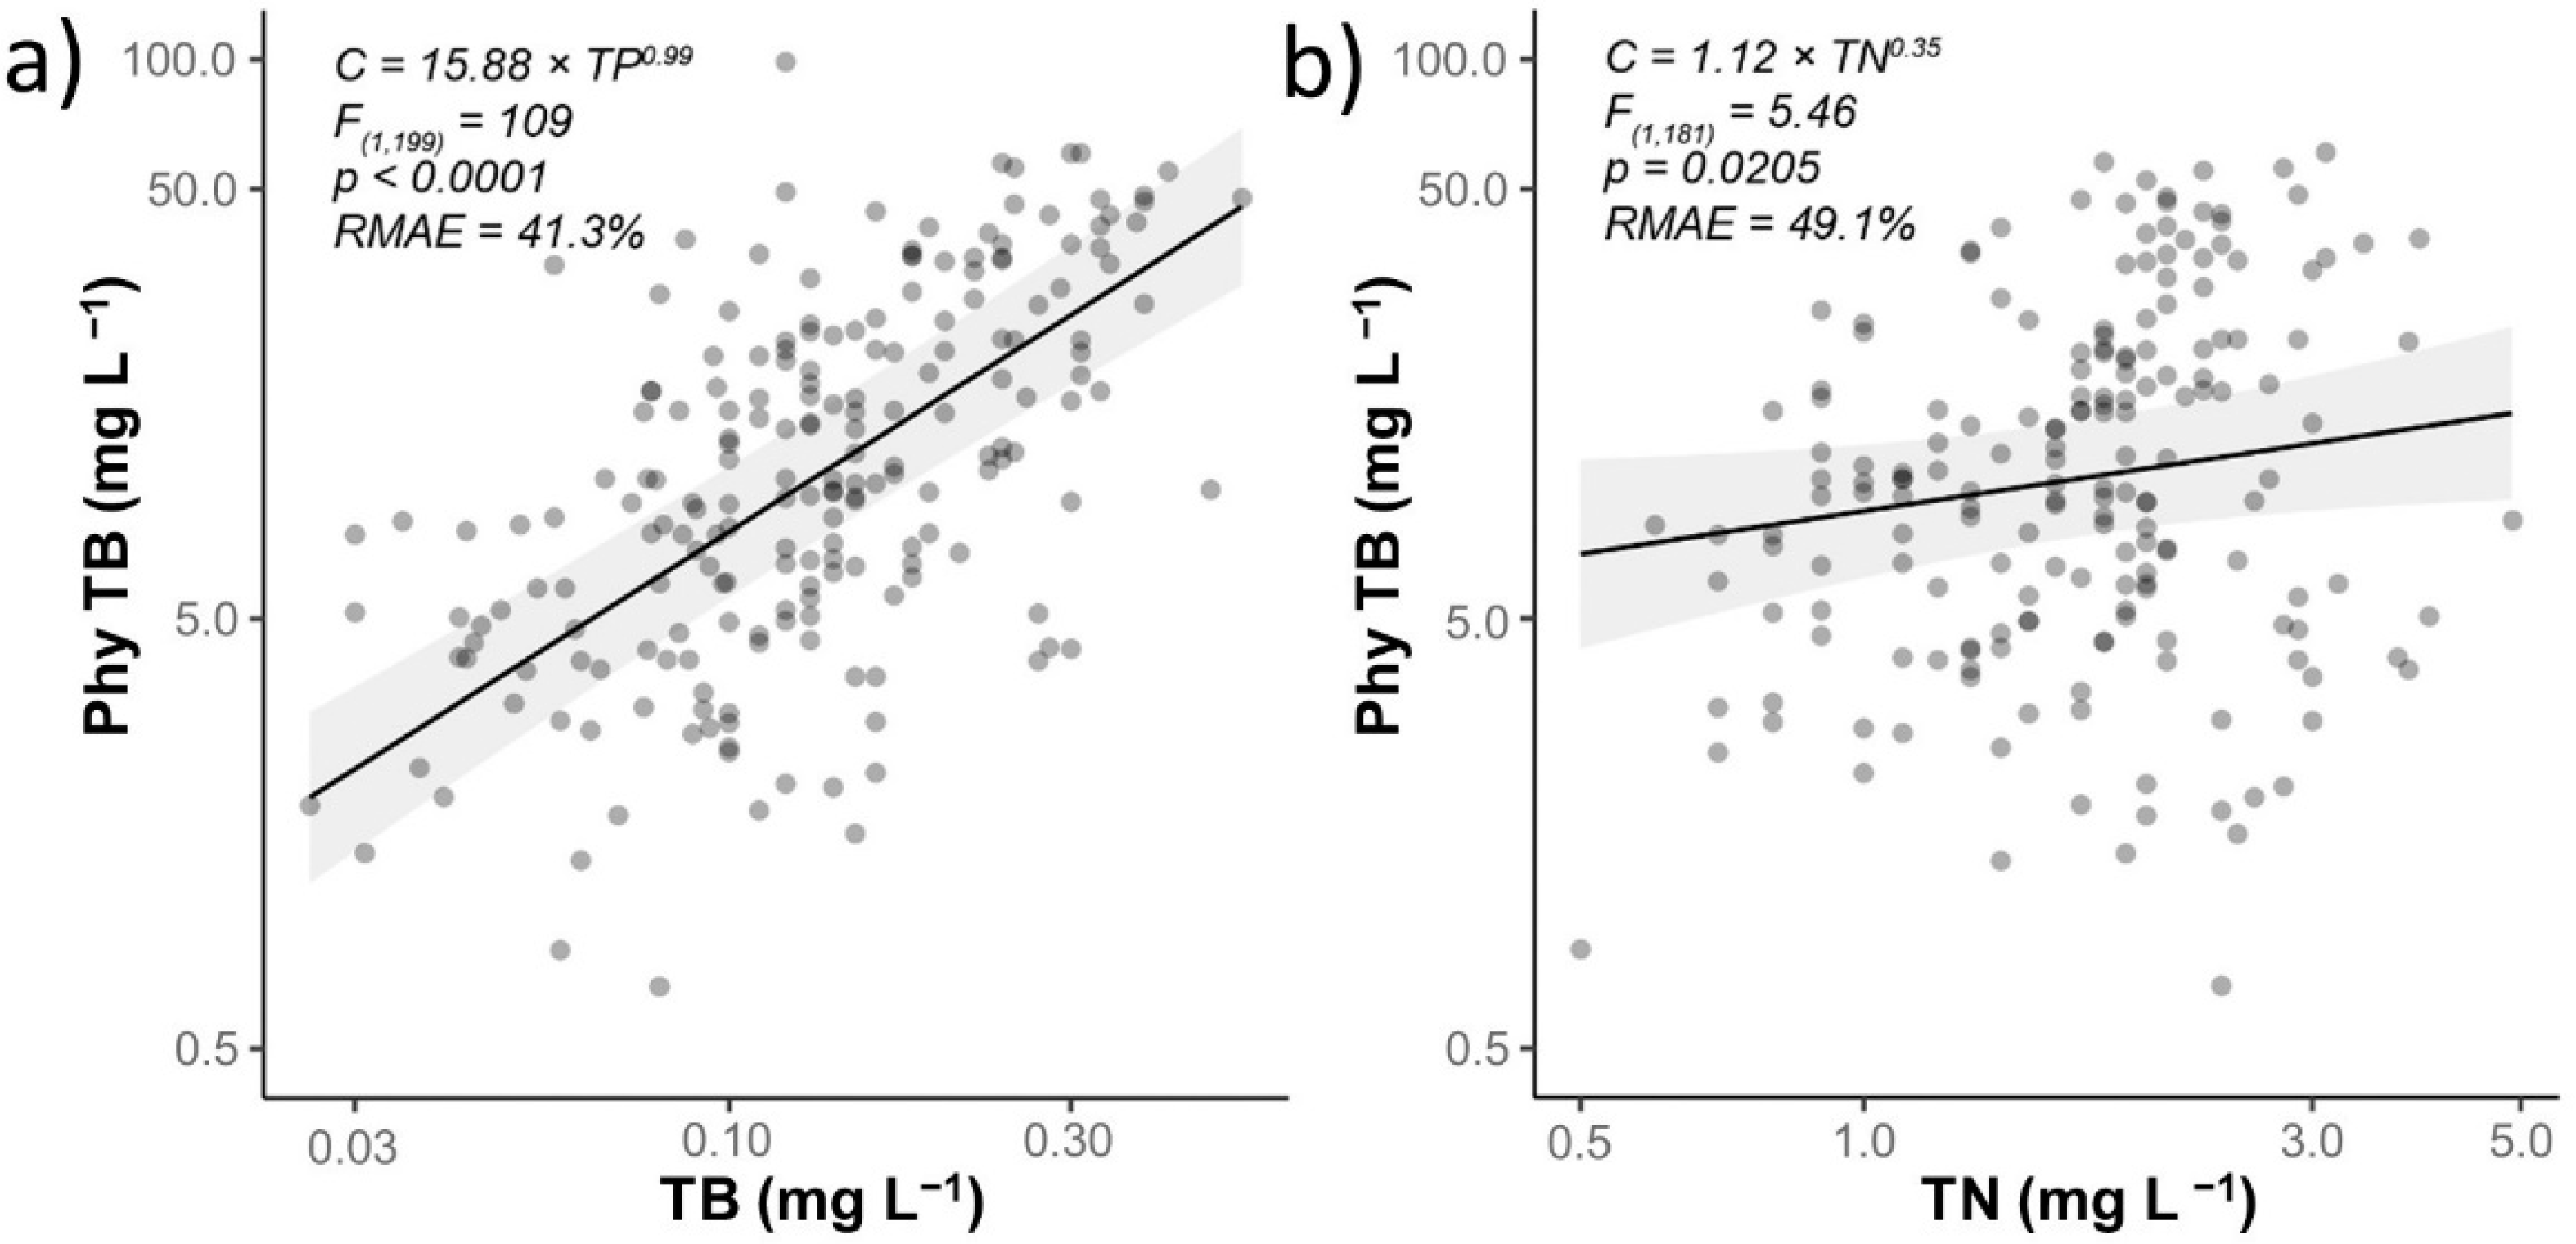
The well-established key role of P in phytoplankton growth [37] (as proposed in hypothesis 1) was confirmed by our data and corresponded with the summer peak of TP concentration (Figure 3 and Figure 4a; Supplementary Figure S1a).
Nitrogen input from the watershed [33] was not denitrified during winter and early spring, resulting in high NO3-N concentration during spring (Supplementary Figure S2b). Rising temperatures in spring triggered the denitrification that effectively released N from fishponds, including that from auxiliary feed (Figure 7). The reported rate of denitrification in eutrophic lakes ranges from ~150 to 700 mg N m−2 d−1 [38,39,40]. At this rate, all N would be effectively released from the studied ponds in 3–21 days. Despite rapid denitrification, the TN levels remained high in the studied hypertrophic ponds and eutrophic ponds.
A long-standing debate exists over whether N effects on phytoplankton growth are dependent on the type of water body, trophic status, or season [41,42]. Data obtained during this study indicate that eutrophication of the water bodies could not be controlled by reducing N input. Soluble mineral N was almost absent in studied fishponds (Supplementary Figure S2). Proliferation of heterocystous as N-fixing cyanobacteria indicates low concentration of mineral N in water. As cyanobacteria fix inorganic C as well as molecular N dissolved in water, the concentration of NH4-N and NO3-N in water is not critical to their proliferation (Figure 8). Such result is inconsistent with hypothesis 1 and it is not plausible for mineral N.
The amount of phytoplankton steadily increased throughout the season, following the increase in P concentration (supplied by fish feed) in hypertrophic and eutrophic ponds, or remained stable in mesotrophic ponds. Rising phytoplankton biomass can be attributed to biomass of N-fixing cyanobacteria, which similarly increased throughout the growing season and declined at its end (Figure 8). Zooplankton biomass moderately increased in spring until temperatures over 17 °C allowed fish feeding, suppressing zooplankton throughout the rest of the growing season and efficiently disconnecting the entire food web. Hypothesis 3 proposed in the introduction is thus entirely invalid. In consequence, zooplankton was not able to suppress the proliferation of phytoplankton. Therefore, the seasonal plankton dynamics in hypertrophic and eutrophic fishponds is constrained by the concentration of P and fish stock density, whereas in the mesotrophic ponds by P only. Cyanobacterial prevalence in nutrient-rich water reflects high N turnover rate by bacteria using high levels of organic carbon connected with rapid denitrification. Counterintuitively, the limitation of algae was caused by low levels of inorganic nitrogen during summer and autumn (Figure 8). Fixation of N by cyanobacteria is then assumed to explain their dominance in fishponds under a low mineral N state during summer in hypertrophic and eutrophic ponds and during autumn in hypertrophic, eutrophic, and mesotrophic fishponds.
5. Conclusions
Nutrient concentration, phytoplankton, zooplankton composition, and fish stock densities were evaluated to study the seasonal succession of plankton in nine fishponds of different trophic status in the Czech Republic. High fish densities reduced the zooplankton biomass that did not grow fast enough to even marginally influence the phytoplankton. The all-over growth of phytoplankton was constrained by the concentration of P according to its trophic levels. Algae were limited by low levels of inorganic nitrogen. The cyanobacteria formed a significant part of the phytoplankton community. Phytoplankton composition was driven by available mineral N that was reflected in the dominance of N-fixing cyanobacteria.
Supplementary Materials
The following supporting information can be downloaded at: https://www.mdpi.com/article/10.3390/w14131979/s1. Figure S1: Concentration of (a) TP, (b) SRP, (c) Chl-a, and (d) transparency during the studied period in hypertrophic, eutrophic, and mesotrophic ponds. The black line is based on the locally weighted smoothing (LOESS) function. The coloured area represents the 95% confidence interval. Each symbol represents an individual measurement; Figure S2: Concentration of (a) TN, (b) NO3-N, (c) NH4-N throughout the monitored period in hypertrophic, eutrophic, and mesotrophic ponds. The black line is based on locally weighted smoothing (LOESS) function. The coloured area represents 95% confidence interval for the fitted curve. Symbols represent individual measurements.
Author Contributions
A.P.I. and O.S. contributed substantially to the study’s conception, data acquisition and analysis; J.P. gatherd and analysed data for the study; A.P.I., O.S. and J.V. contributed substantially to drafting the manuscript.; A.P.I. performed statistical analysis.; A.P.I., O.S. and J.V. designed the figures; J.R. analyzed the fish data. All authors have read and agreed to the published version of the manuscript.
Funding
This research was funded by the Ministry of Education, Youth and Sports of the Czech Republic, CENAKVA (LM2018099), the Ministry of Agriculture (No. QK22010177), European Regional Development Fund-Project (No. CZ.02.1.01/0.0/0.0/15_003/0000441), and Czech Science Foundation (GACR) Project No. 17-09310S.
Institutional Review Board Statement
Not applicable.
Informed Consent Statement
Not applicable.
Data Availability Statement
Not applicable.
Acknowledgments
We thank Vlastimil Stejskal for his support.
Conflicts of Interest
No potential conflict of interest were reported by the authors.
References
- Schindler, D.W.; Hecky, R.E.; Findlay, D.L.; Stainton, M.P.; Parker, B.R.; Paterson, M.J.; Beaty, K.G.; Lyng, M.; Kasian, S.E. Eutrophication of lakes cannot be controlled by reducing nitrogen input: Results of a 37-year whole-ecosystem experiment. Proc. Natl. Acad. Sci. USA 2008, 105, 11254–11258. [Google Scholar] [CrossRef] [PubMed] [Green Version]
- Jones, J.; Brett, M.T. Lake Nutrients, Eutrophication, and Climate Change. In Global Environmental Change; Freedman, B., Ed.; Springer: Dordrecht, The Netherlands, 2014; pp. 273–279. [Google Scholar]
- Charlton, M.B.; Bowes, M.J.; Hutchins, M.G.; Orr, H.G.; Soley, R.; Davison, P. Mapping eutrophication risk from climate change: Future phosphorus concentrations in English rivers. Sci. Total Environ. 2018, 613, 1510–1526. [Google Scholar] [CrossRef] [PubMed] [Green Version]
- Sinha, E.; Michalak, A.M.; Balaji, V. Eutrophication will increase during the 21st century as a result of precipitation changes. Science 2017, 357, 405–408. [Google Scholar] [CrossRef] [Green Version]
- Sommer, U.; Gliwicz, Z.M.; Lampert, W.; Duncan, A. The Peg-Model of Seasonal Succession of Planktonic Events in Fresh Waters. Arch. Hydrobiol. 1986, 106, 433–471. [Google Scholar]
- Sommer, U.; Adrian, R.; De Senerpont Domis, L.; Elser, J.J.; Gaedke, U.; Ibelings, B.; Jeppesen, E.; Lürling, M.; Molinero, J.C.; Mooij, W.M.; et al. Beyond the Plankton Ecology Group (PEG) Model: Mechanisms Driving Plankton Succession. Annu. Rev. Ecol. Evol. Syst. 2012, 43, 429–448. [Google Scholar] [CrossRef]
- Reynolds, C. The Ecology of Phytoplankton; Cambridge University Press: Cambridge, UK, 2006; p. 564. [Google Scholar]
- Hutchinson, G.E. The paradox of the plankton. Am. Nat. 1961, 95, 137–145. [Google Scholar] [CrossRef] [Green Version]
- Pechar, L. Impacts of long-term changes in fishery management on the trophic level water quality in Czech fish ponds. Fish. Manag. Ecol. 2000, 7, 23–31. [Google Scholar] [CrossRef]
- Kořínek, V. Primary production of plankton in ponds in vicinity of Blatná. Arch. Hydrobiol. 1967, 63, 520. [Google Scholar]
- Fott, J.; Pechar, L.; Pražáková, M. Fish as a factor controlling water quality in ponds. In Hypertrophic Ecosystems; Springer: Berlin, Germany, 1980; pp. 255–261. [Google Scholar]
- Potužák, J.; Hůda, J.; Pechar, L. Changes in fish production effectivity in eutrophic fishponds—Impact of zooplankton structure. Aquac. Int. 2007, 15, 201–210. [Google Scholar] [CrossRef]
- Francová, K.; Šumberová, K.; Janauer, G.A.; Adámek, Z. Effects of fish farming on macrophytes in temperate carp ponds. Aquac. Int. 2019, 27, 413–436. [Google Scholar] [CrossRef]
- ISO_EN; Water Quality. Application of Inductively Coupled Plasma Mass Spectrometry (icp-ms). Part 2: Determination of 62 Elements. International Organization for Standardization: Geneva, Switzerland, 2003.
- ISO_SIST; Water Quality–Determination of Nitrogen–Determination of Bound Nitrogen (TNb), Following Oxidation to Nitrogen Oxides. Slovenian Institute for Standardization: Ljubljana, Slovenia, 2003.
- ISO_SFSEN; Water Quality–Determination of Dissolved Anions by Liquid Chromatography of Ions—Part 1: Determination of Bromide, Chloride, Fluoride, Nitrate, Nitrite, Phosphate and Sulfate. Slovenian Institute for Standardization: Ljubljana, Slovenia, 2009.
- ISO_Hungarian_Standard; Water Quality. Measurement of Biochemical Parameters. Spectrometric Determination of the Chlorophyll-a Concentration. International Organization for Standardization: Geneva, Switzerland, 1992.
- Lund, J.; Kipling, C.; Le Cren, E. The inverted microscope method of estimating algal numbers and the statistical basis of estimations by counting. Hydrobiologia 1958, 11, 143–170. [Google Scholar] [CrossRef]
- Komárková-Legnerová, J.; Cronberg, G. Planktic blue-green algae from lakes in South Scania, Sweden. Part I. Chroococcales. Algol. Stud. Arch. Für Hydrobiol. Suppl. 1994, 72, 13–51. [Google Scholar]
- Hillebrand, H.; Dürselen, C.-D.; Kirschtel, D.; Pollingher, U.; Zohary, T. Biovolume Calculation for Pelagic And Benthic Microalgae. J. Phycol. 1999, 35, 403–424. [Google Scholar] [CrossRef]
- Seda, J.; Dostalkova, I. Live sieving of freshwater zooplankton: A technique for monitoring community size structure. J. Plankton Res. 1996, 18, 513–520. [Google Scholar] [CrossRef] [Green Version]
- McCauley, E. The estimation of the abundance and biomass of zooplankton in samples. A Man. Methods Assess. Second. Product. Fresh Waters 1984, 17, 228–265. [Google Scholar]
- Wetzel, R.G.; Likens, G.E. Collection, Enumeration, and Biomass of Zooplankton. In Limnological Analyses; Springer: New York, NY, USA, 2000; pp. 175–188. [Google Scholar]
- Culver, D.A.; Boucherle, M.M.; Bean, D.J.; Fletcher, J.W. Biomass of freshwater crustacean zooplankton from length–weight regressions. Can. J. Fish. Aquat. 1985, 42, 1380–1390. [Google Scholar] [CrossRef]
- Bottrell, H.H.; Duncan, A.; Gliwicz, Z.; Grygierek, E.; Herzig, A.; Hilbricht-Ilkowska, A.; Kurasawa, H.; Larsson, P.; Weglenska, T. Review of some problems in zooplankton production studies. Norweg. J. Zool. 1976, 21, 477–483. [Google Scholar]
- Dumont, H.J.; Van de Velde, I.; Dumont, S. The dry weight estimate of biomass in a selection of Cladocera, Copepoda and Rotifera from the plankton, periphyton and benthos of continental waters. Oecologia 1975, 19, 75–97. [Google Scholar] [CrossRef]
- Rosen, R.A. Length-dry weight relationships of some freshwater zooplanktona. J. Freshw. Ecol. 1981, 1, 225–229. [Google Scholar] [CrossRef]
- Hartman, P.; Regenda, J. Praktika v Rybníkářství; FROV JU: Vodňany, Czech Republic, 2016. [Google Scholar]
- Bjørnstad, O.N.; Falck, W. Nonparametric spatial covariance functions: Estimation and testing. Environ. Ecol. Stat. 2001, 8, 53–70. [Google Scholar] [CrossRef]
- R_Core_Team. R: A Language and Environment for Statistical Computing; Version 3.5.2; R Foundation for Statistical Computing: Vienna, Austria, 2018. [Google Scholar]
- Wickham, H. ggplot2: Elegant Graphics for Data Analysis; Springer: Berlin, Germany, 2016. [Google Scholar]
- Potužák, J.; Duras, J.; Drozd, B. Mass balance of fishponds: Are they sources or sinks of phosphorus? Aquac. Int. 2016, 24, 1725–1745. [Google Scholar] [CrossRef]
- Rutegwa, M.; Potužák, J.; Hejzlar, J.; Drozd, B. Carbon metabolism and nutrient balance in a hypereutrophic semi-intensive fishpond. Knowl. Manag. Aquat. Ecosyst. 2019, 420, 49. [Google Scholar] [CrossRef] [Green Version]
- Nalley, J.O.; O’Donnell, D.R.; Litchman, E. Temperature effects on growth rates and fatty acid content in freshwater algae and cyanobacteria. Algal Res. 2018, 35, 500–507. [Google Scholar] [CrossRef]
- Hrbáček, J.; Dvořaková, M.; Kořínek, V.; Procházková, L. Demonstration of the effect of the fish stock on the species composition of zooplankton and the intensity of metabolism of the whole plankton association. SIL Proc. 1961, 14, 192–195. [Google Scholar] [CrossRef]
- Zemanová, J.; Šorf, M.; Hejzlar, J.; Šorfová, V.; Vrba, J. Planktivorous fish positively select Daphnia bearing advanced embryos. Mar. Freshw. Res. 2020, 71, 505–511. [Google Scholar] [CrossRef] [Green Version]
- Schindler, D.W. Evolution of phosphorus limitation in lakes. Science 1977, 195, 260–262. [Google Scholar] [CrossRef] [Green Version]
- Jensen, J.P.; Jeppesen, E.; Kristensen, P.; Bondo, P.; Sondergaar, C.; Sondergaard, M. Nitrogen loss and denitrification as studied in relation to reductions in nitrogen loading in a shallow, hypertrophic lake (Lake Sobygard, Denmark). Int. Rev. Ges. Hydrobiol. 1992, 77, 29–42. [Google Scholar] [CrossRef]
- Olah, J.; Pekar, F.; Szabo, P. Nitrogen cycling and retention in fish-cum-livestock ponds. J. Appl. Ichthyol. 1994, 10, 341–348. [Google Scholar] [CrossRef]
- Piña-Ochoa, E.; Álvarez-Cobelas, M. Denitrification in Aquatic Environments: A Cross-system Analysis. Biogeochemistry 2006, 81, 111–130. [Google Scholar] [CrossRef]
- Kolzau, S.; Wiedner, C.; Rücker, J.; Köhler, J.; Köhler, A.; Dolman, A.M. Seasonal Patterns of Nitrogen and Phosphorus Limitation in Four German Lakes and the Predictability of Limitation Status from Ambient Nutrient Concentrations. PLoS ONE 2014, 9, e96065. [Google Scholar] [CrossRef] [Green Version]
- Downing, J.A.; McCauley, E. The nitrogen: Phosphorus relationship in lakes. Limnol. Oceanogr. 1992, 37, 936–945. [Google Scholar] [CrossRef] [Green Version]
Figure 1.
Location of monitored fishponds.

Figure 2.
Biplot of the principal component analysis (PCA) according to the similarity in the variables of concentrations of total phosphorus (TP), nitrate (NO3-N), ammonium (NH4-N), total nitrogen (TN), soluble reactive phosphorus (SRP), Chlorophyll-a (Chl-a) Colored dots represent studied ponds. Percentages of total variance are explained by coordinates 1 and 2, accounting for 60 % and 23 %, respectively.

Figure 3.
Seasonal course of (a) Total biomass (b) Cyanophyceae, (c) Bacillariophyceae (d) Chlorococcales, (e) Cryptophyceae (f) Dinophyceae, (g) Euglenophyceae, (h) Volvocales, (i) Chysophyceae in hypertrophic, eutrophic and mesotrophic ponds. The black lines are based on locally weighted smoothing (LOESS) function. The grey area represents 95% confidence interval. Each symbol represents an individual measurement.

Figure 4.
Pairwise relationship of Phy TB with (a) TP, (b) TN. LMM estimates and 95% confidence bands are displayed as lines and grey polygons. Summary of each model includes test statistics (F(df1,df2)), probability (p), and measure of predictive accuracy (RMAE).
Figure 4.
Pairwise relationship of Phy TB with (a) TP, (b) TN. LMM estimates and 95% confidence bands are displayed as lines and grey polygons. Summary of each model includes test statistics (F(df1,df2)), probability (p), and measure of predictive accuracy (RMAE).

Figure 5.
Seasonal course of (a) Total biomass of zooplankton (b) large Daphnia, (c) other Cladocera, (d) adult and copepodid Copepodae in hypertrophic, eutrophic and mesotrophic ponds. The black lines are based on locally weighted smoothing (LOESS) function. The grey area represents 95% confidence interval. Each symbol represents an individual measurement.

Figure 6.
Fish density (a) and weekly cumulative feed (b) during the season in all studied ponds. The black lines are based on the locally weighted smoothing (LOESS) function. The colored area represents 95% confidence interval.
Figure 6.
Fish density (a) and weekly cumulative feed (b) during the season in all studied ponds. The black lines are based on the locally weighted smoothing (LOESS) function. The colored area represents 95% confidence interval.

Figure 7.
Schematic diagram of plankton food webs and nutrient cycling in fishponds. (a) Mesotrophic conditions and (b) eutrophic and hypertrophic conditions with high fish stocking density. The coloured lines represent nutrient pathways. Solid lines show assimilation of nutrients; dashed lines nutrient release or regeneration.

Figure 8.
Seasonal changes in the total biomass of algae, Nostocales, and other cyanobacteria in (a) hypertrophic ponds, (b) eutrophic ponds, (c) mesotrophic ponds. The black lines are based on locally weighted smoothing (LOESS) function. The coloured area represents 95% confidence interval. Each symbol represents an individual measurement.


Table 1.
Overview of the fishpond’s basic characteristics including their trophic status.
| Ponds: | GPS Location | Surface Area (ha) | Volume (106 m3) | Depth Average/max (m) | Fishery Trophic Status |
|---|---|---|---|---|---|
| Hejtman-Hamerský (HH) | 49°8′44″ N 15°9′57″ E | 68 | 1.60 | 2.4/6.0 | H |
| Ratmírovský (RT) | 49°8′36″ N 15°7′12″ E | 78 | 1.30 | 1.7/6.0 | H |
| Rožmberk (RZ) | 49°2′51″ N 14°45′42″ E | 449 | 5.94 | 1.3/4.1 | H |
| Bezdrev (BZ) | 49°2′53″ N 14°23′10″ E | 434 | 6.63 | 1.5/7.0 | E |
| Dehtář (DH) | 49°0′29″ N 14°18′21″ E | 228 | 4.71 | 2.1/6.0 | E |
| Horusický (HR) | 49°9′54″ N 14°41′30″ E | 415 | 3.97 | 1.0/6.0 | E |
| Svět (SV) | 48°59′ N 14°45′ E | 214 | 3.39 | 1.6/3.0 | E |
| Staňkovský (ST) | 48°58′37″ N 14°57′25″ E | 246 | 6.33 | 2.6/10.0 | M |
| Hejtman-Koštěnický (HK) | 48°57′45″ N 14°56′23″ E | 80 | 1.46 | 1.8/6.0 | M |
Table 2.
The sampling duration and number of measured parameters in ponds. Chemical analyses include TP, SRP, TN, NO3-N, NH4-N, POC, and Chlorophyll-a. Sampling frequency was two weeks or one month, as indicated in the table.
Table 2.
The sampling duration and number of measured parameters in ponds. Chemical analyses include TP, SRP, TN, NO3-N, NH4-N, POC, and Chlorophyll-a. Sampling frequency was two weeks or one month, as indicated in the table.
| Site | Chemical Analyses | Phytoplankton | Zooplankton | Sampling Frequency and Duration |
|---|---|---|---|---|
| Hejtman-Hamerský (HH) | 36 (2008–2009, 2011–2012) | 26 (2009–2012) | 12 (2008–2011) | 2008–2009, 2012—monthly; 2010–2011—bi-weekly |
| Ratmírovský (RT) | 38 (2008–2009, 2011–2012) | 27 (2009–2012) | 16 (2008–2012) | 2008–2009, 2011—monthly; 2012—bi-weekly |
| Rožmberk (RŽ) | 99 (2008–2015) | 58 (2009–2015) | 47 (2008–2015) | 2008–2009, 2015—monthly; 2010–2014—bi-weekly |
| Bezdrev (BZ) | 61 (2007–2015) | 46 (2009–2015) | 51 (2008–2015) | 2008–2015—monthly |
| Dehtář (DH) | 103 (2008–2015) | 66 (2009–2016) | 40 (2008–2015) | 2008–2009, 2013–2014, 2016—monthly; 2010–2012, 2015—bi-weekly |
| Horusický (HR) | 48 (2012–2015) | 26 (2012–2015) | 21 (2012–2015) | 2012–2013—bi-weekly; 2014–2015—monthly |
| Svět (SV) | 80 (2008–2015) | 50 (2009–2015) | 36 (2008–2015) | 2008–2012—monthly; 2013–2015—bi-weekly |
| Staňkovský (ST) | 93 (2007–2015) | 59 (2009–2015) | 54 (2008–2015) | 2008–2009, 2012—monthly; 2010–2011—bi-weekly |
| Hejtman-Koštěnický (HK) | 70 (2007–2012) | 34 (2009–2012) | 26 (2008–2011) | 2008–2009, 2012–2015—monthly; 2010–2011—bi-weekly |
Table 3.
Minimum, average, and maximum in mg L−1 of Phy TB and groups of algae and cyanobacteria in 3 groups of ponds.
Table 3.
Minimum, average, and maximum in mg L−1 of Phy TB and groups of algae and cyanobacteria in 3 groups of ponds.
| Phytoplankton | Hypertrophic | Eutrophic | Mesotrophic | ||||||
|---|---|---|---|---|---|---|---|---|---|
| min | Mean | max | min | Mean | max | min | Mean | max | |
| Phy TB | 0.7 (RZ) | 24.5 | 130.3 (RZ) | 1.1 (BZ) | 13.3 | 74 (SV) | 0.1 | 4.8 | 32.5 |
| Cyanobacteria | 0.003 (HH) | 13.8 | 77.7 (RZ) | 0.0005 (DH) | 5.6 | 50.1 (HO) | 0.005(HK) | 1.8 | 10.9(HK) |
| Bacillariophyceae | 0.02 (HH) | 6.2 | 54.5 (RZ) | 0.001 (DH) | 2.5 | 45.3 (DH) | 0.002(HK) | 1.3 | 28.1(ST) |
| Chlorococcales | 0.03 (HH) | 2.7 | 9.9 (HH) | 0.005 (SV) | 2.9 | 16.2 (DH) | 0.0044 (ST) | 0.4 | 3.9 (ST) |
| Cryptophyceae | 0.02 (RZ) | 1.2 | 6.4 (RT) | 0.01 (DH) | 1.6 | 14.4 (HO) | 0.01 (ST) | 0.7 | 13.0 (HK) |
| Dinophyceae | 0.005 (RZ) | 1.0 | 5.8 (RZ) | 0.01 (SV) | 1.8 | 14.7 (SV) | 0.0014 (ST) | 0.3 | 2.0 (ST) |
| Euglenophyceae | 0.004 (RZ) | 0.6 | 4.3 (RZ) | 0.002 (SV) | 0.6 | 6.7 (SV) | 0.0044 (ST) | 0.1 | 0.8 (HK) |
| Volvocales | 0.001 (RZ) | 0.3 | 2.0 (RZ) | 0.002 (BZ) | 0.1 | 0.8 (DH) | 0.0012 (ST) | 0.02 | 0. 1(ST) |
| Chysophyceae | 0.001 (RZ) | 0.2 | 0.9 (HH) | 0.001 (BZ) | 0.1 | 2.3 (DH) | 0.001 (ST) | 0.3 | 2.9 (HK) |
Table 4.
Minimum, mean, and maximum in mg L−1 of Zoo TB and groups of algae and cyanobacteria in 3 groups of ponds. *—concentration < 0.001 mg L−1.
Table 4.
Minimum, mean, and maximum in mg L−1 of Zoo TB and groups of algae and cyanobacteria in 3 groups of ponds. *—concentration < 0.001 mg L−1.
| Zooplankton | Hypertrophic | Eutrophic | Mesotrophic | ||||||
|---|---|---|---|---|---|---|---|---|---|
| min | Mean | max | min | Mean | max | min | Mean | max | |
| Zoo TB | 0.008 (RZ) | 0.5 | 4.4 (RZ) | 0.005 (SV) | 0.8 | 8 (SV) | 0.002 (HK) | 0.1 | 1.6 (ST) |
| large Daphnia | 0.001 (RT) | 0.3 | 2.4 (RT) | 0.002 (BZ) | 0.2 | 7.9 (SV) | 0.007 (ST) | 0.08 | 1.2 (ST) |
| small Daphnia | * | * | * | 0.001 (BZ) | 0.1 | 0.4 (DH) | * | * | * |
| Other Cladocera | * (RZ) | 0.07 | 2.8(RZ) | * (SV) | 0.09 | 0.8 (HO) | 0.002 (HK) | 0.03 | 0.3 (ST) |
| adult Copepoda | * (RZ) | 0.02 | 0.8 (RZ) | * (BZ) | 0.02 | 0.4 (SV.HO, DH) | 0.001 (HK) | 0.03 | 0.2 (ST) |
| copepodid Copepoda | * (HH) | 0.01 | 0.4 (RT) | * (SV) | 0.02 | 0.1 (DH) | * (HK) | 0.008 | 0.04 (ST, HK) |
| Rotifers | * (RZ) | 0.01 | 0.04 (RZ) | * (BZ) | 0.006 | 0.08(SV) | * (ST) | 0.006 | 0.02 (ST) |
Publisher’s Note: MDPI stays neutral with regard to jurisdictional claims in published maps and institutional affiliations. |
© 2022 by the authors. Licensee MDPI, Basel, Switzerland. This article is an open access article distributed under the terms and conditions of the Creative Commons Attribution (CC BY) license (https://creativecommons.org/licenses/by/4.0/).
Share and Cite
MDPI and ACS Style
Ivanova, A.P.; Vrba, J.; Potužák, J.; Regenda, J.; Strunecký, O. Seasonal Development of Phytoplankton in South Bohemian Fishponds (Czechia). Water 2022, 14, 1979. https://doi.org/10.3390/w14131979
AMA Style
Ivanova AP, Vrba J, Potužák J, Regenda J, Strunecký O. Seasonal Development of Phytoplankton in South Bohemian Fishponds (Czechia). Water. 2022; 14(13):1979. https://doi.org/10.3390/w14131979
Chicago/Turabian StyleIvanova, Anna Pavlovna, Jaroslav Vrba, Jan Potužák, Ján Regenda, and Otakar Strunecký. 2022. "Seasonal Development of Phytoplankton in South Bohemian Fishponds (Czechia)" Water 14, no. 13: 1979. https://doi.org/10.3390/w14131979
Note that from the first issue of 2016, this journal uses article numbers instead of page numbers. See further details here.