
Characterisation of Hydro-Geochemical Processes Influencing Groundwater Quality in Rural Areas: A Case Study of Soutpansberg Region, Limpopo Province, South Africa


Abstract
:1. Introduction
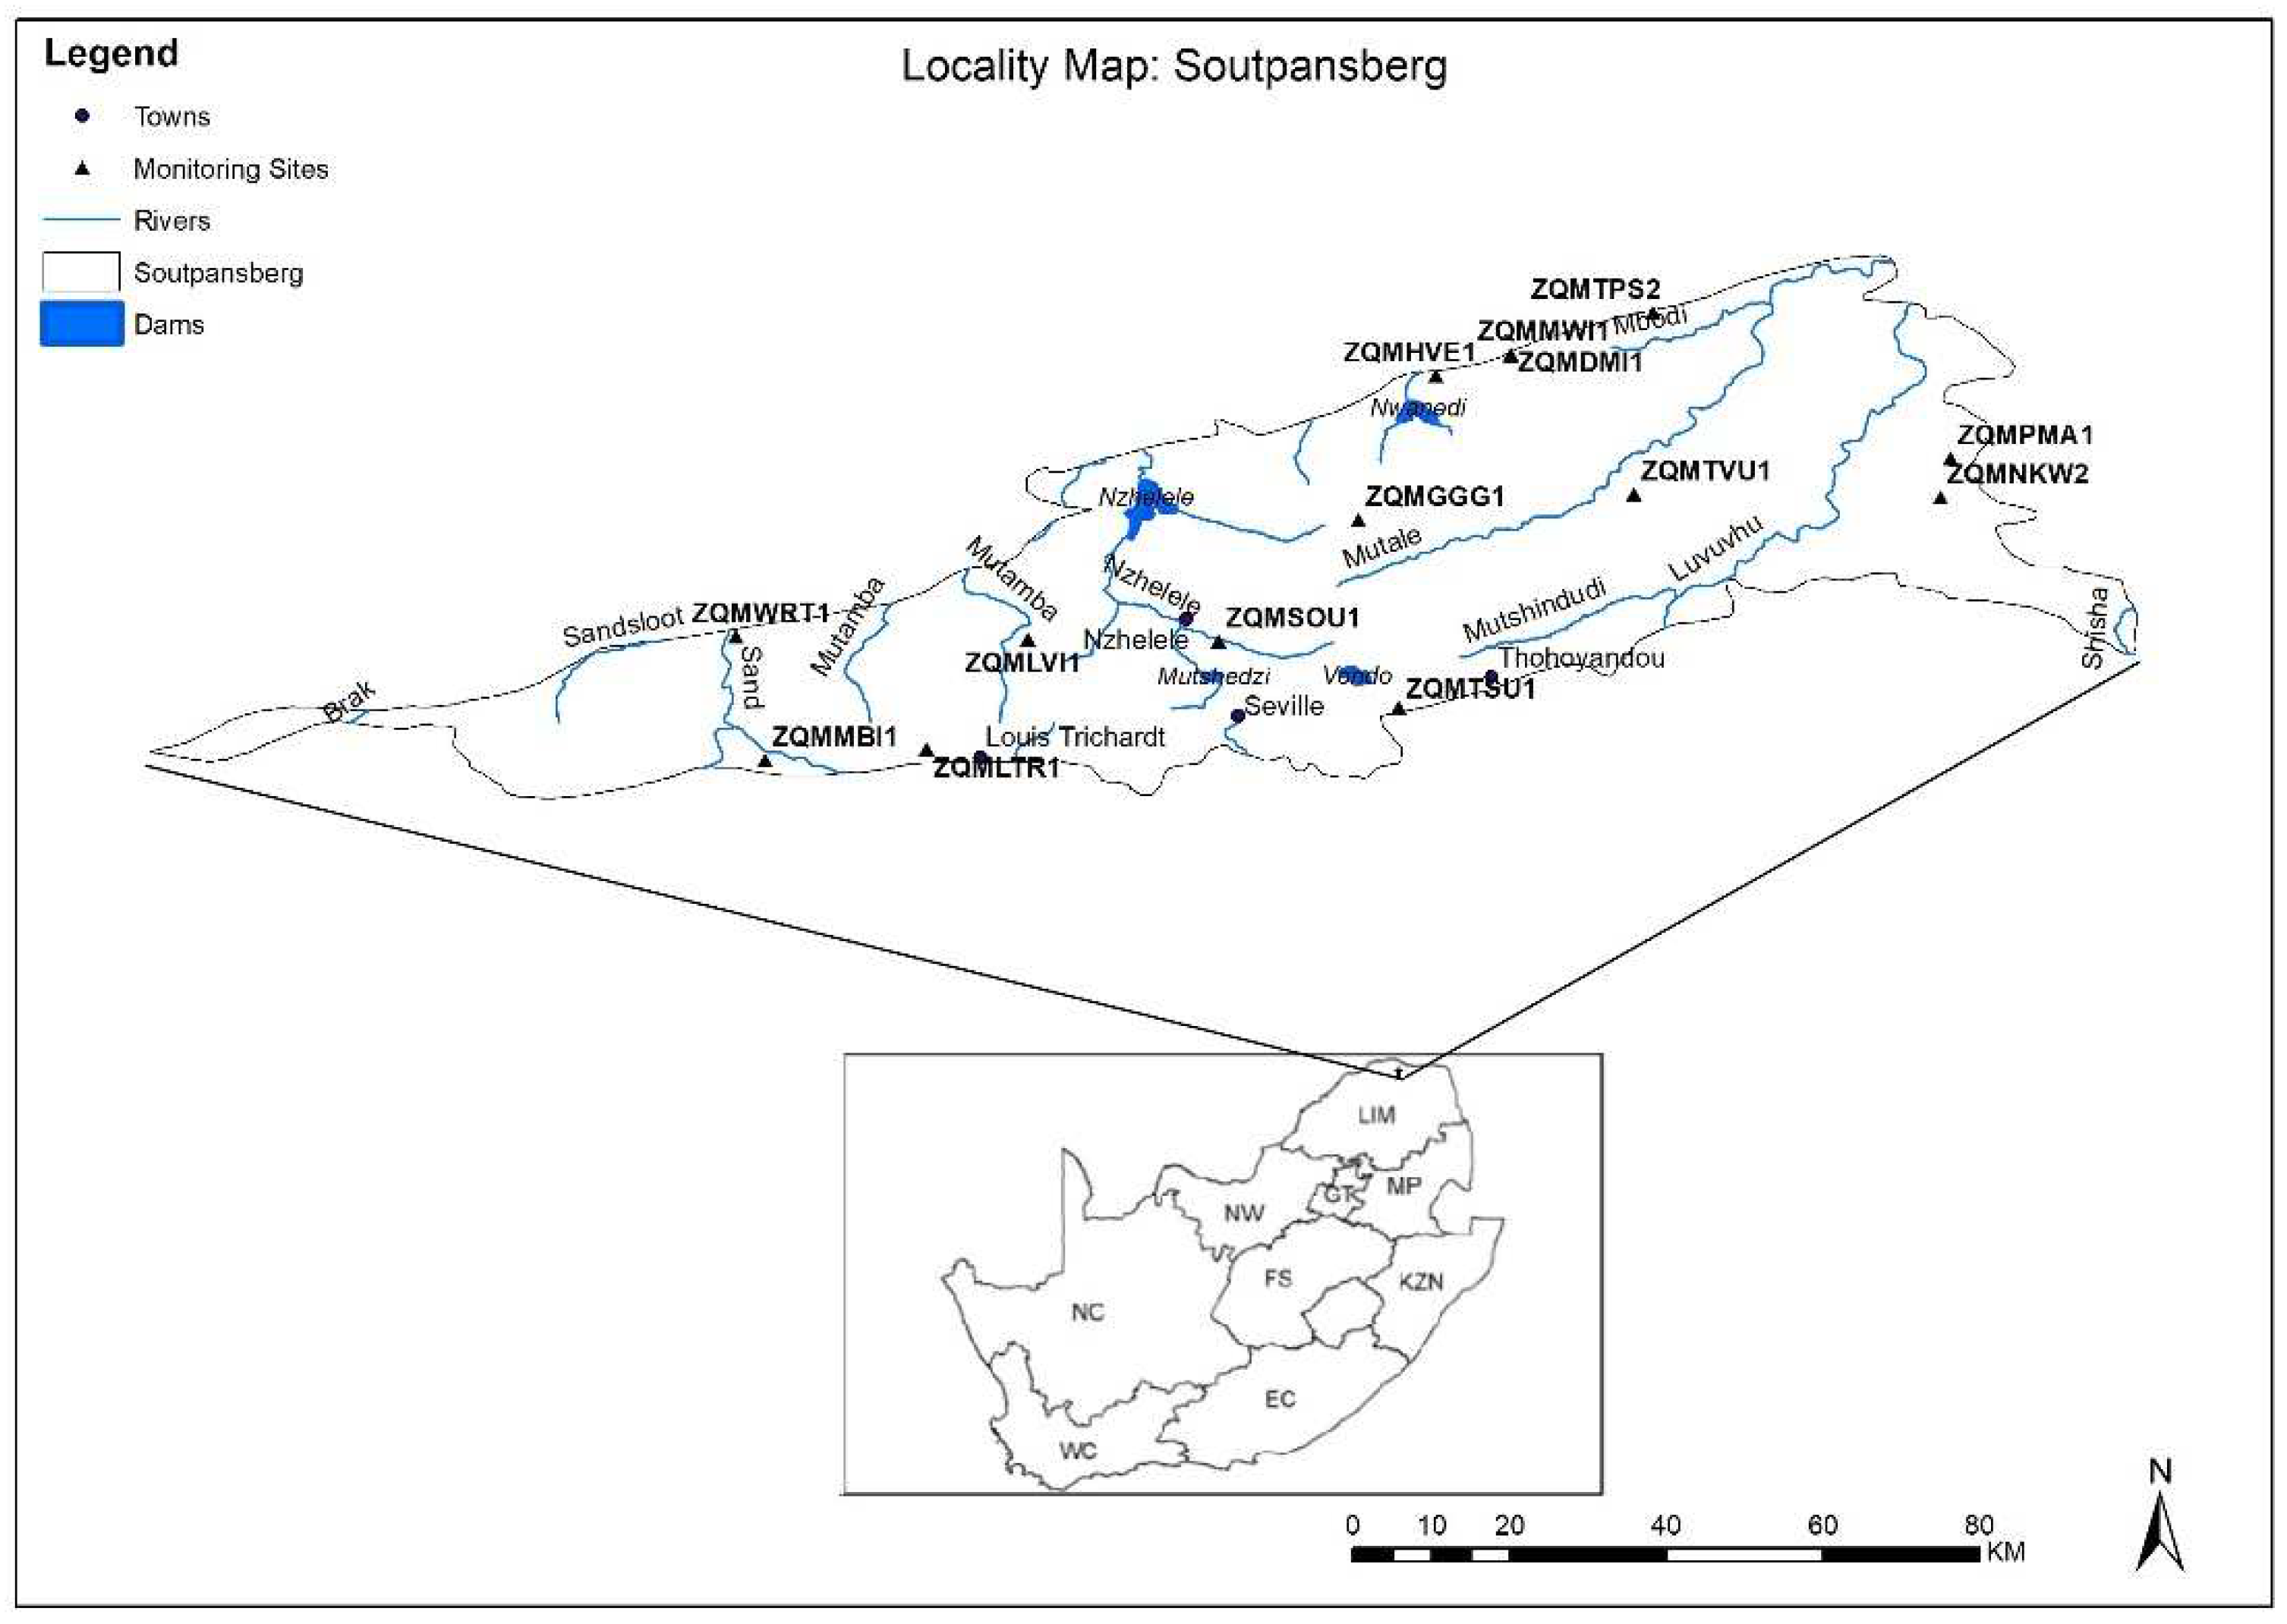
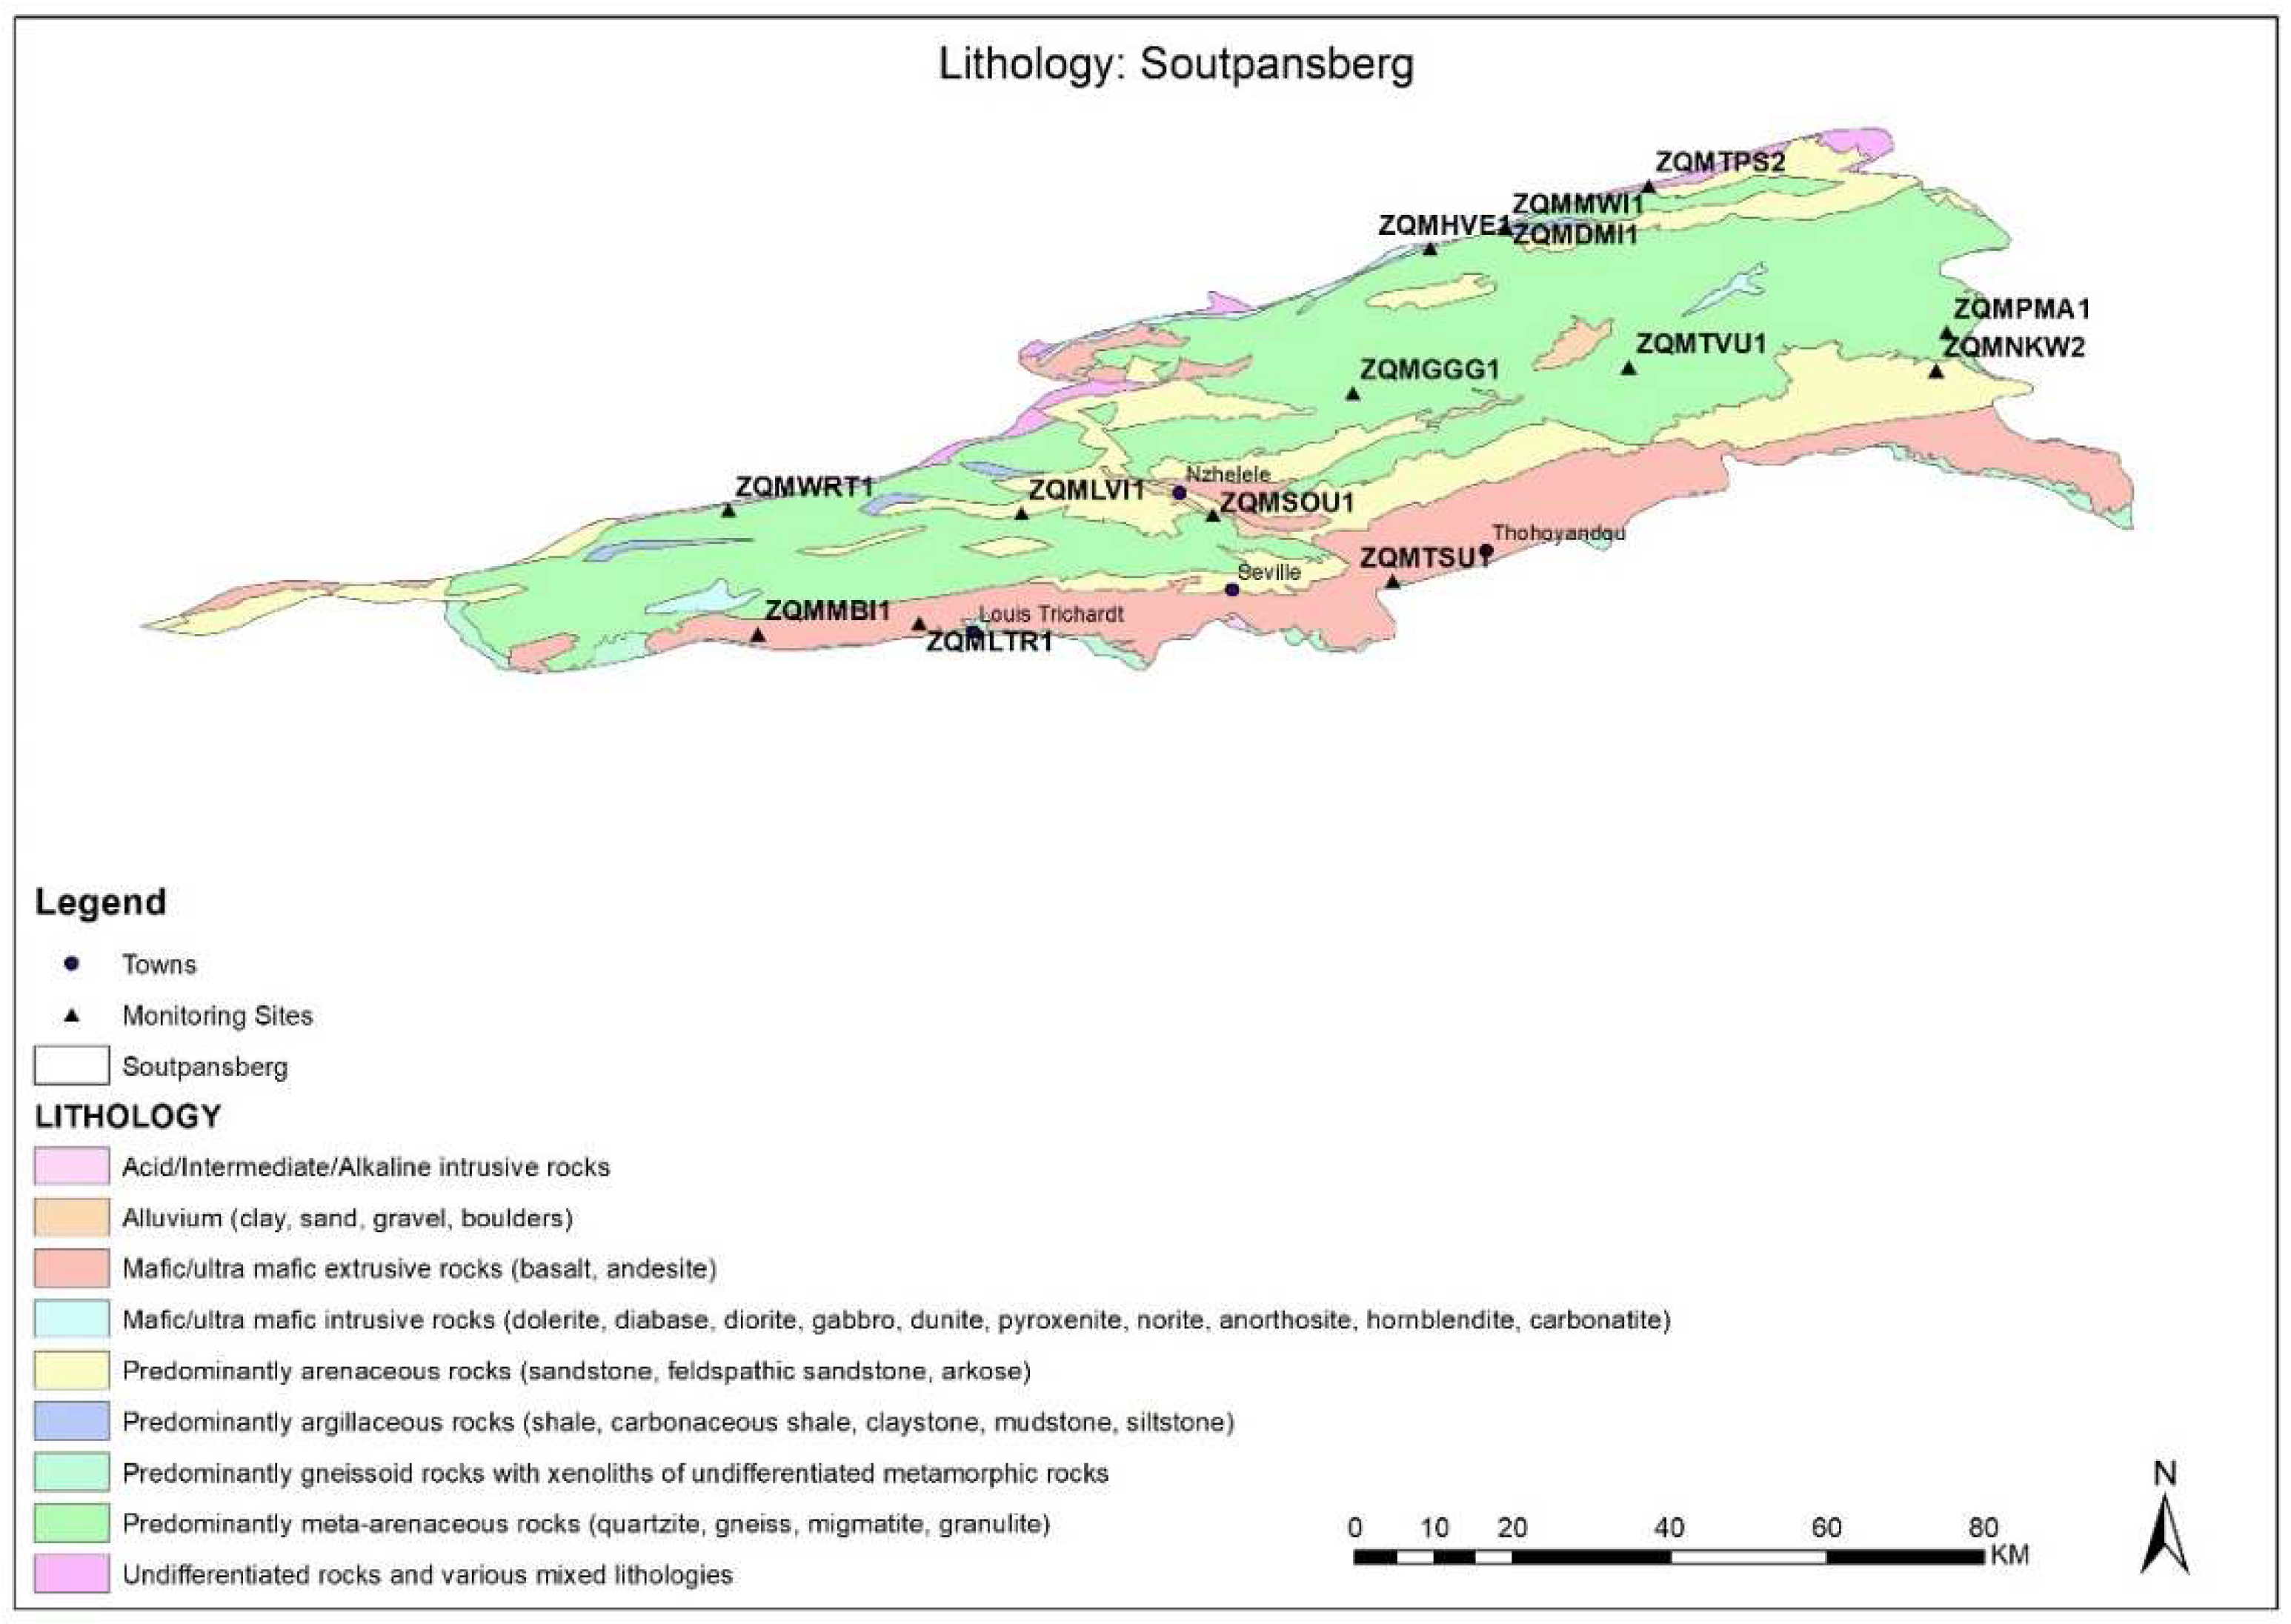
2. Description of the Study Area
3. Material and Methods
3.1. Sampling
3.2. Determination of Hydro-Geochemical Processes Influencing Groundwater Quality
4. Results and Discussions
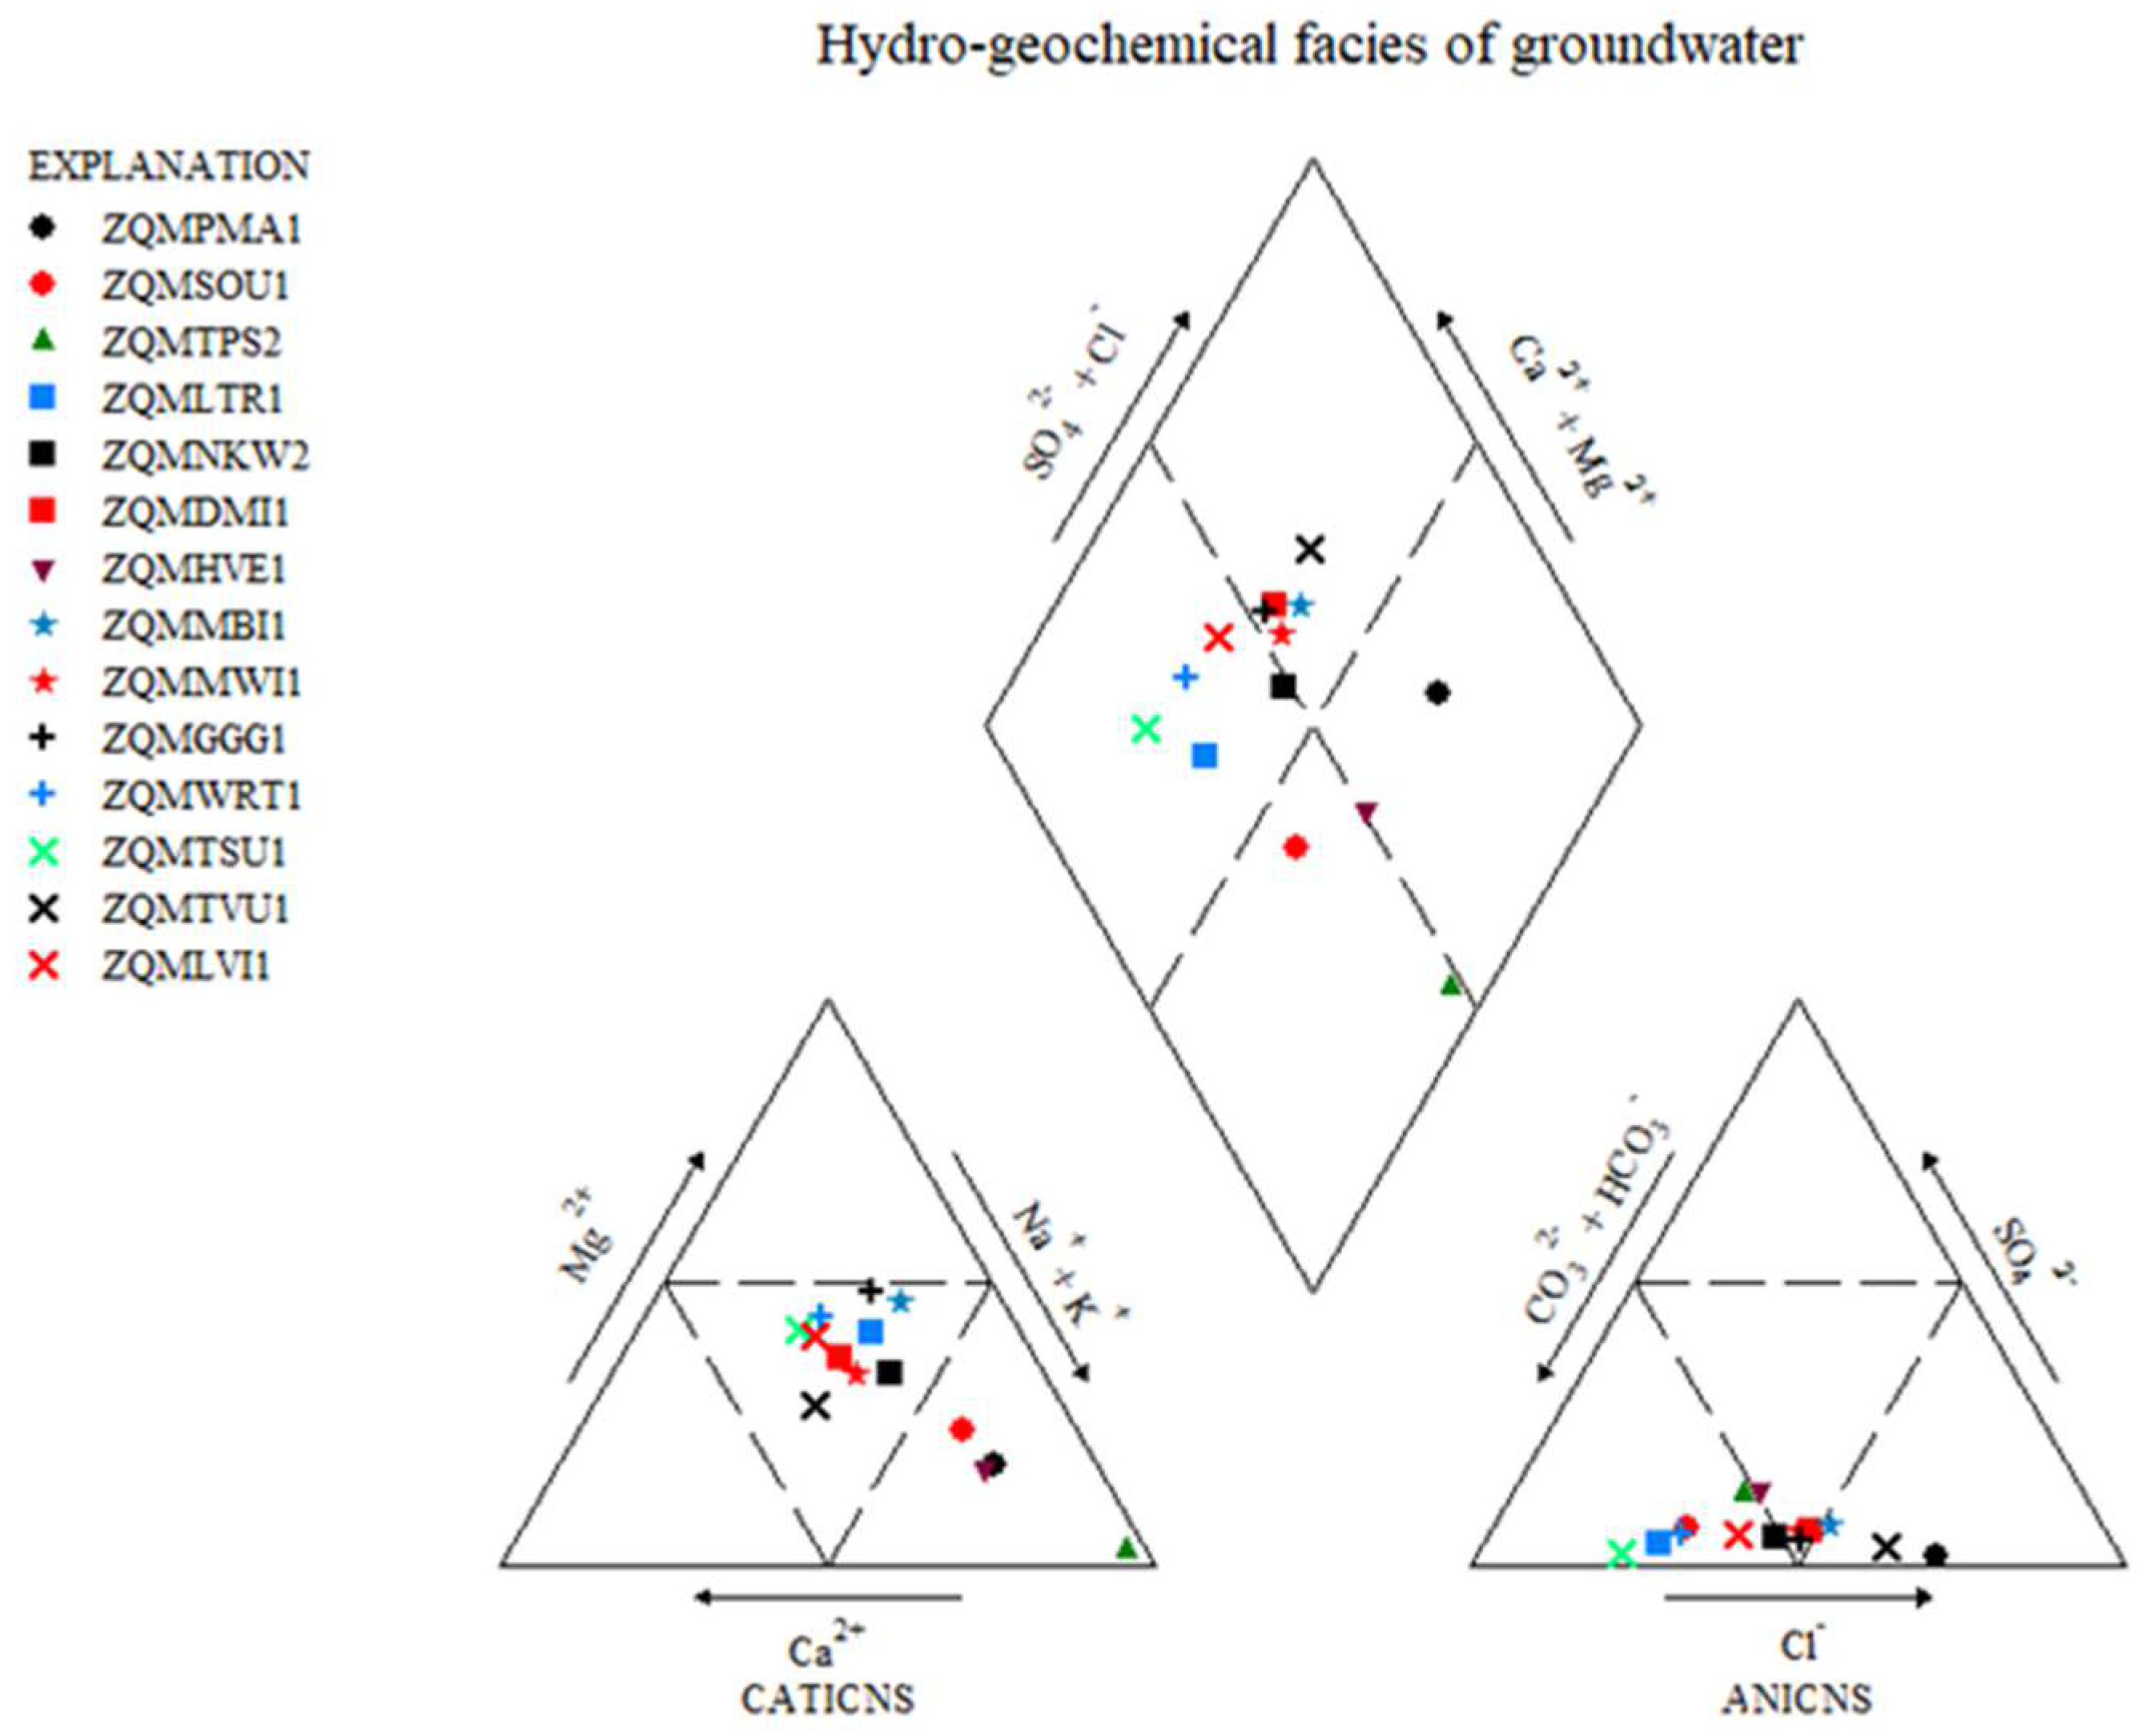
4.1. Hydro-Geochemistry
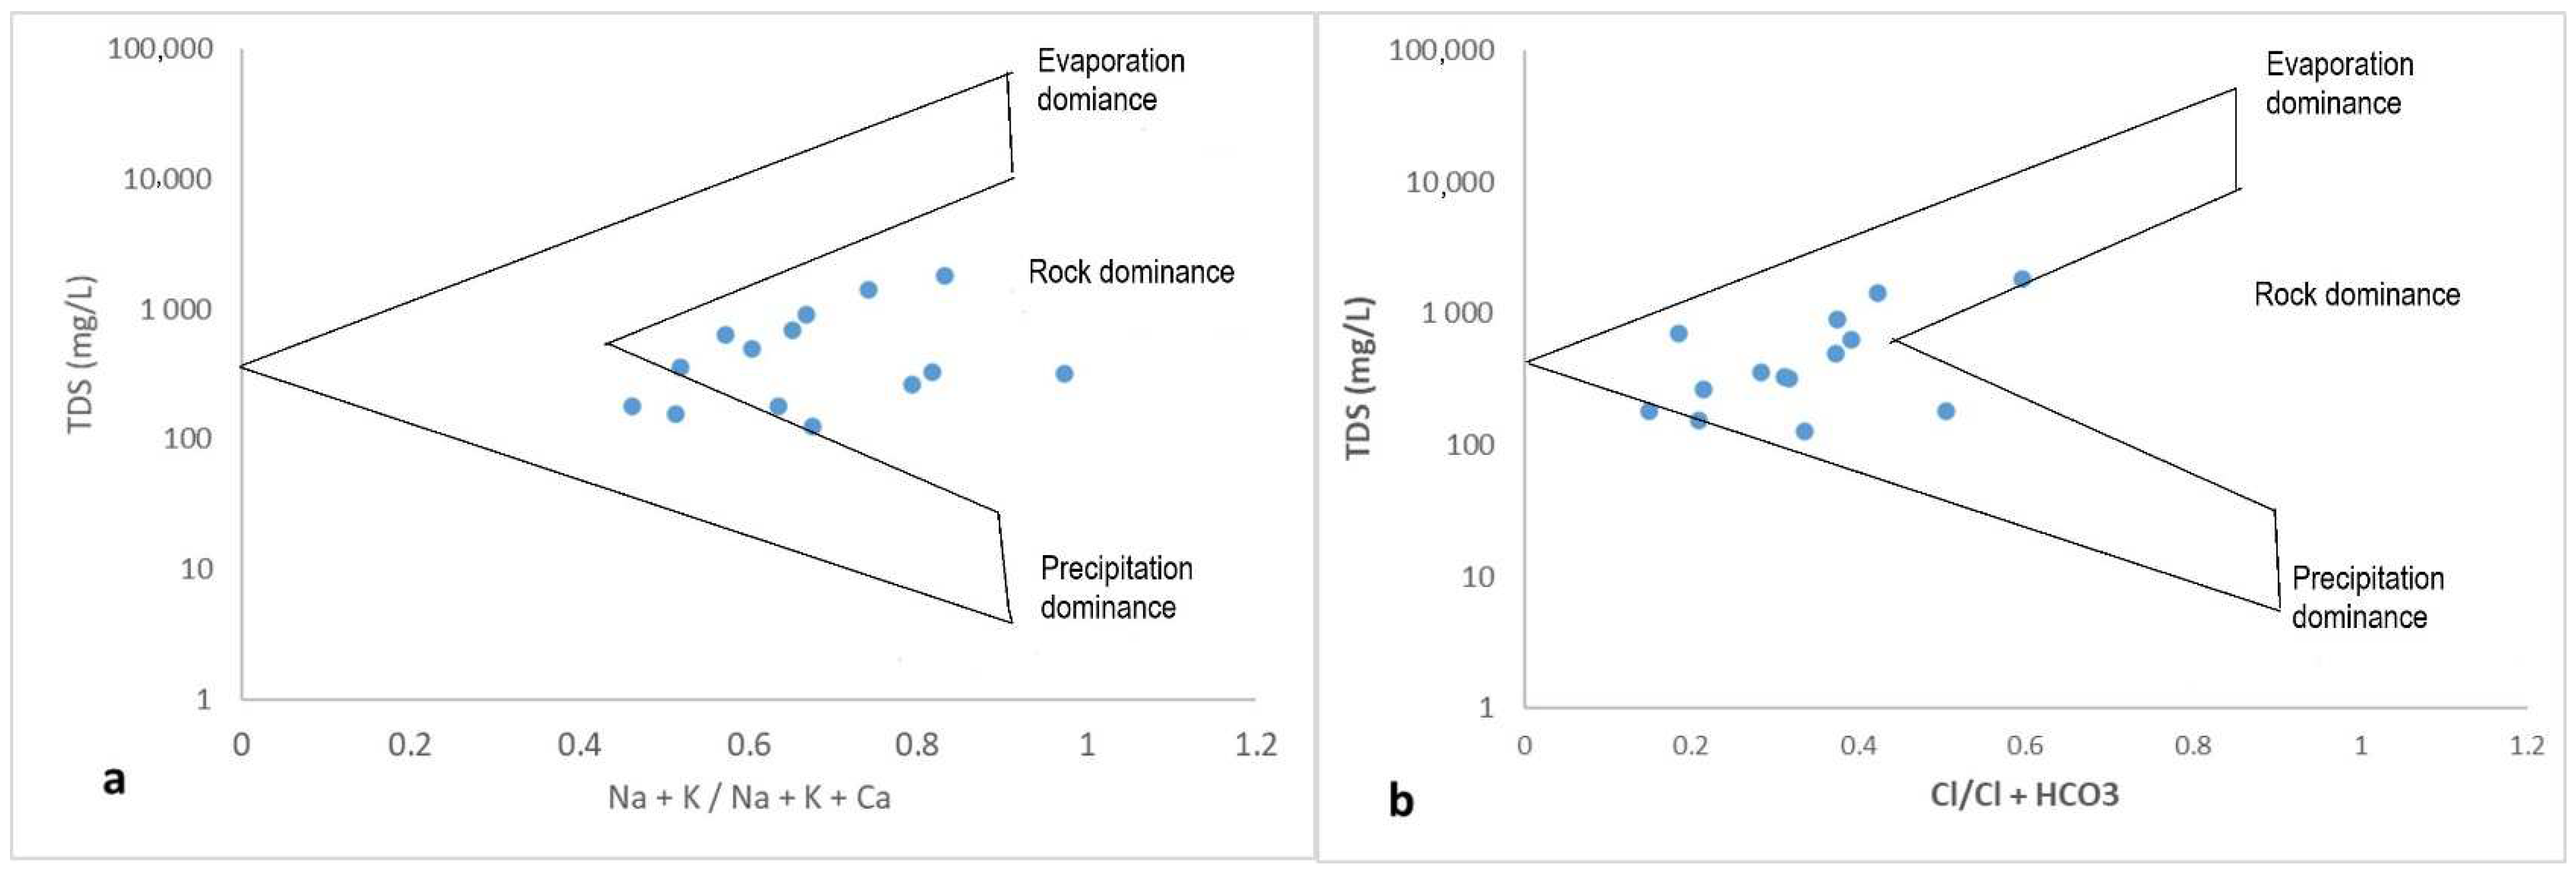
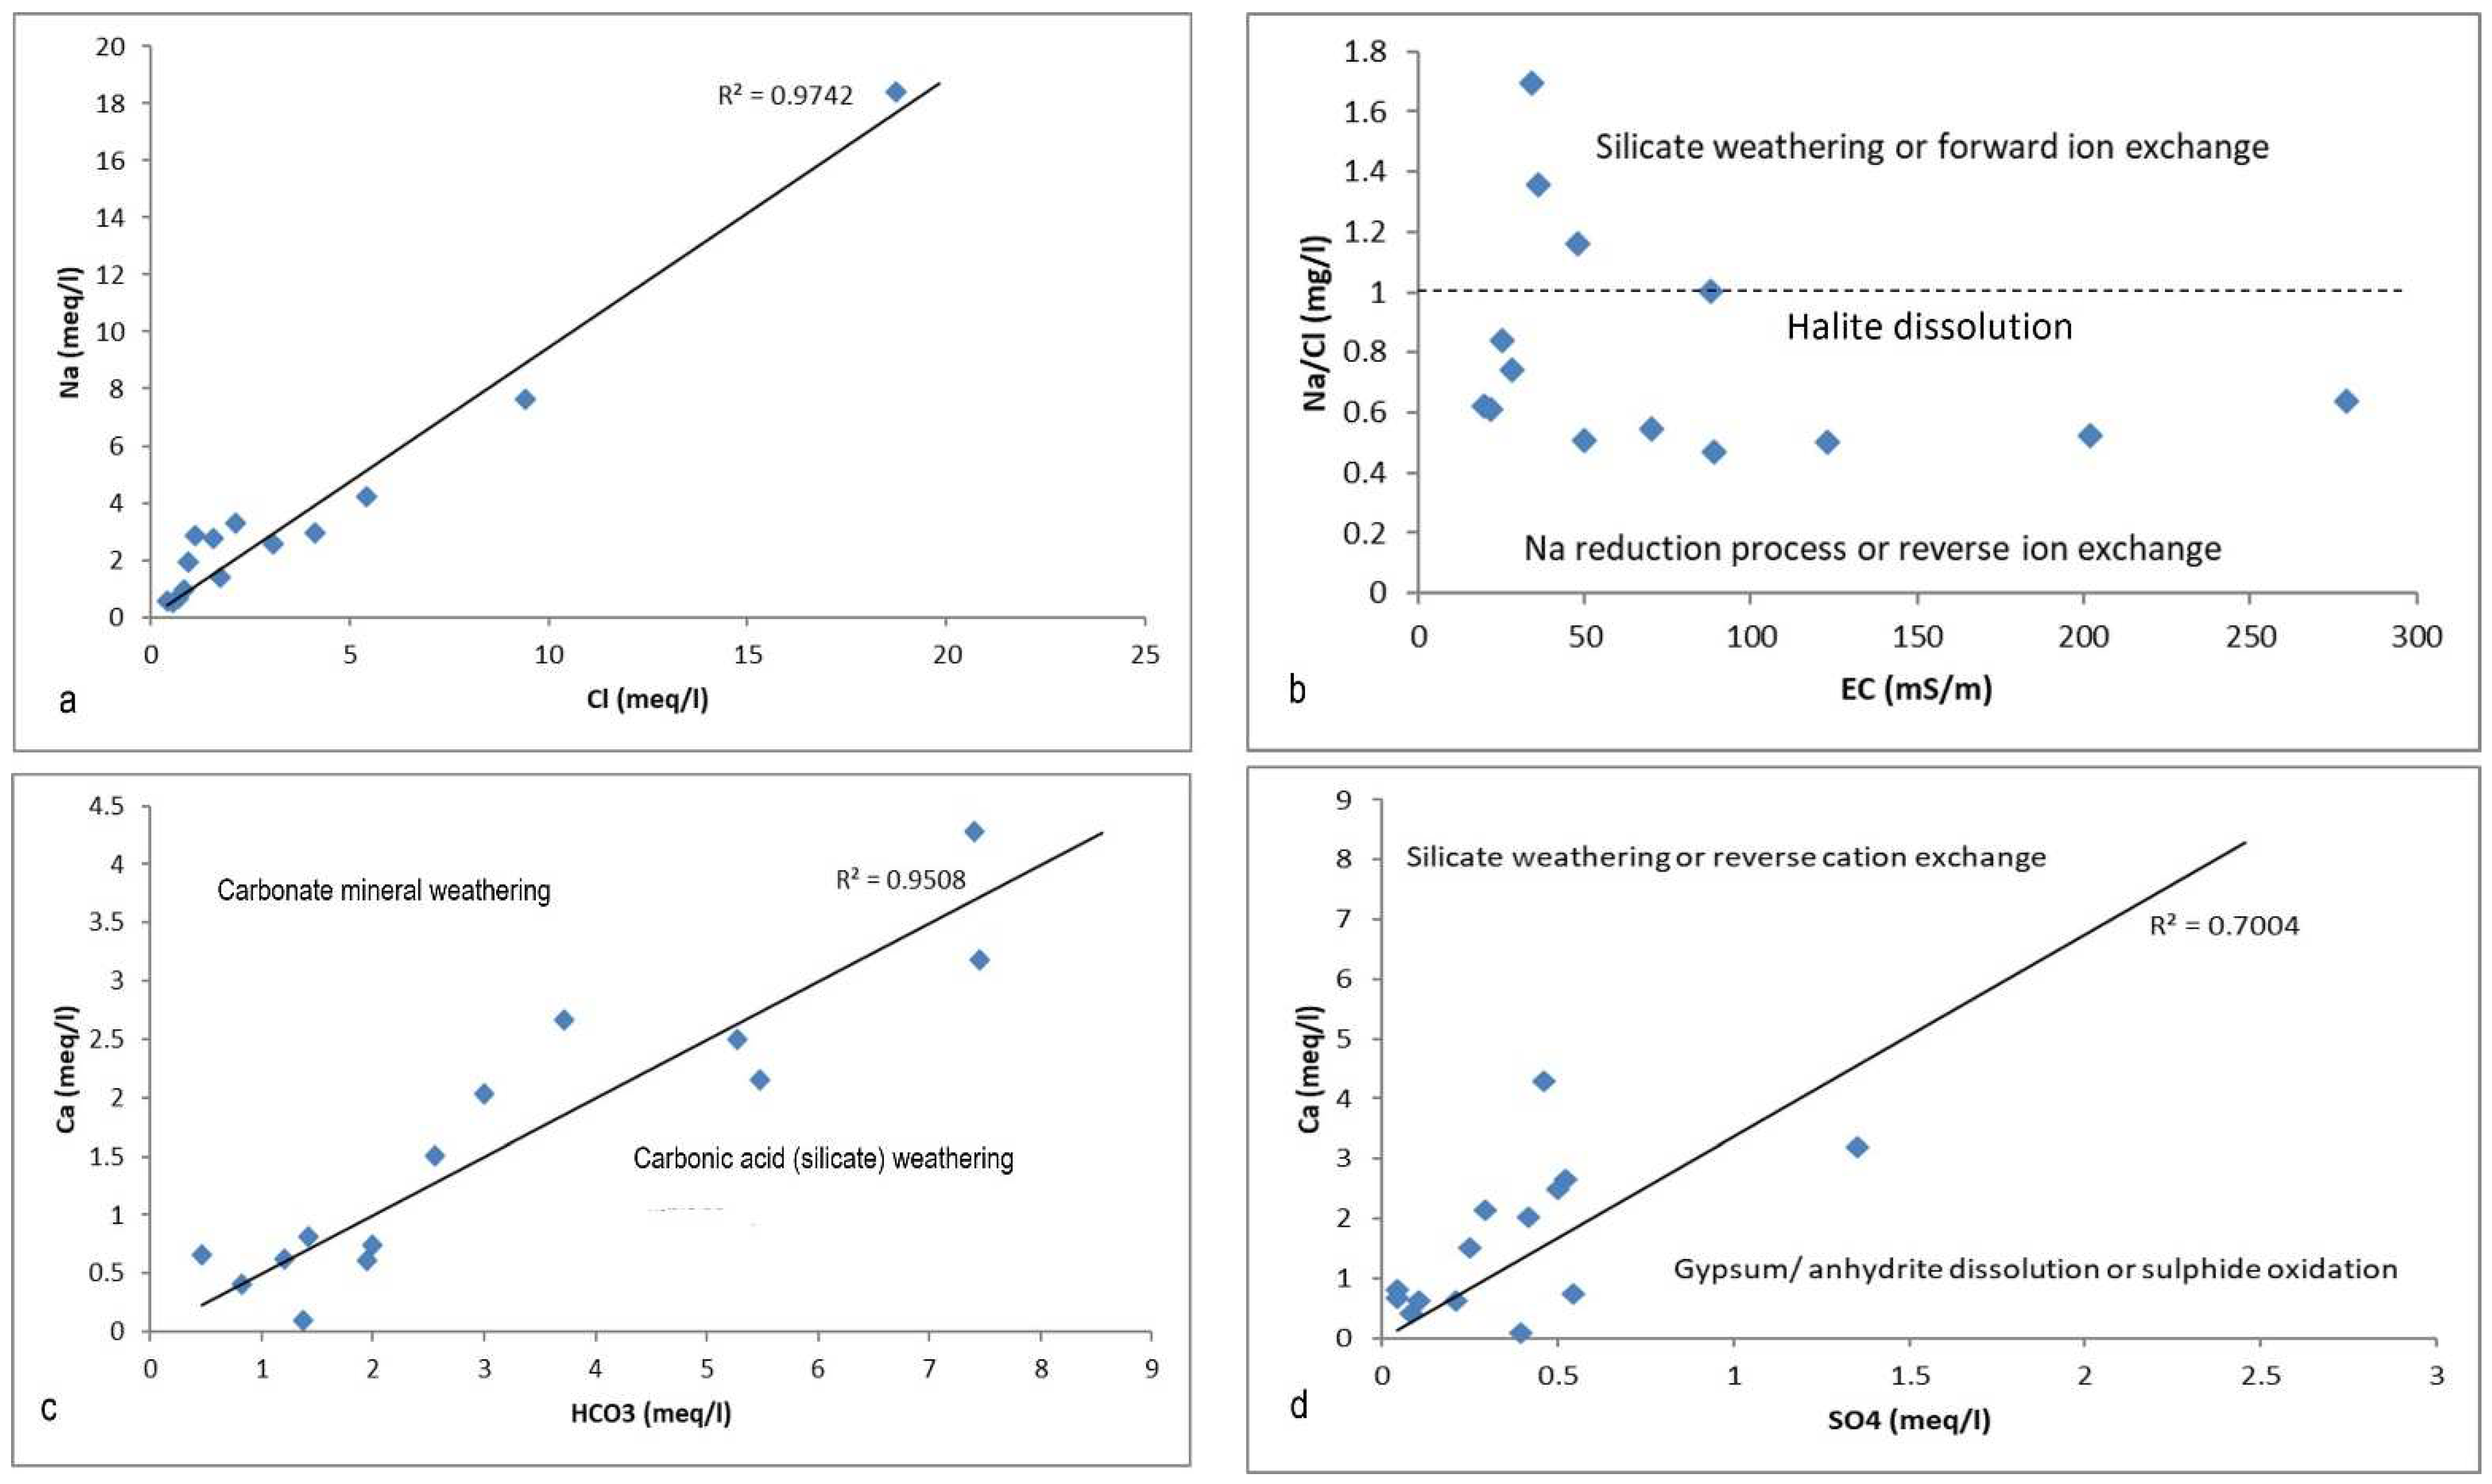
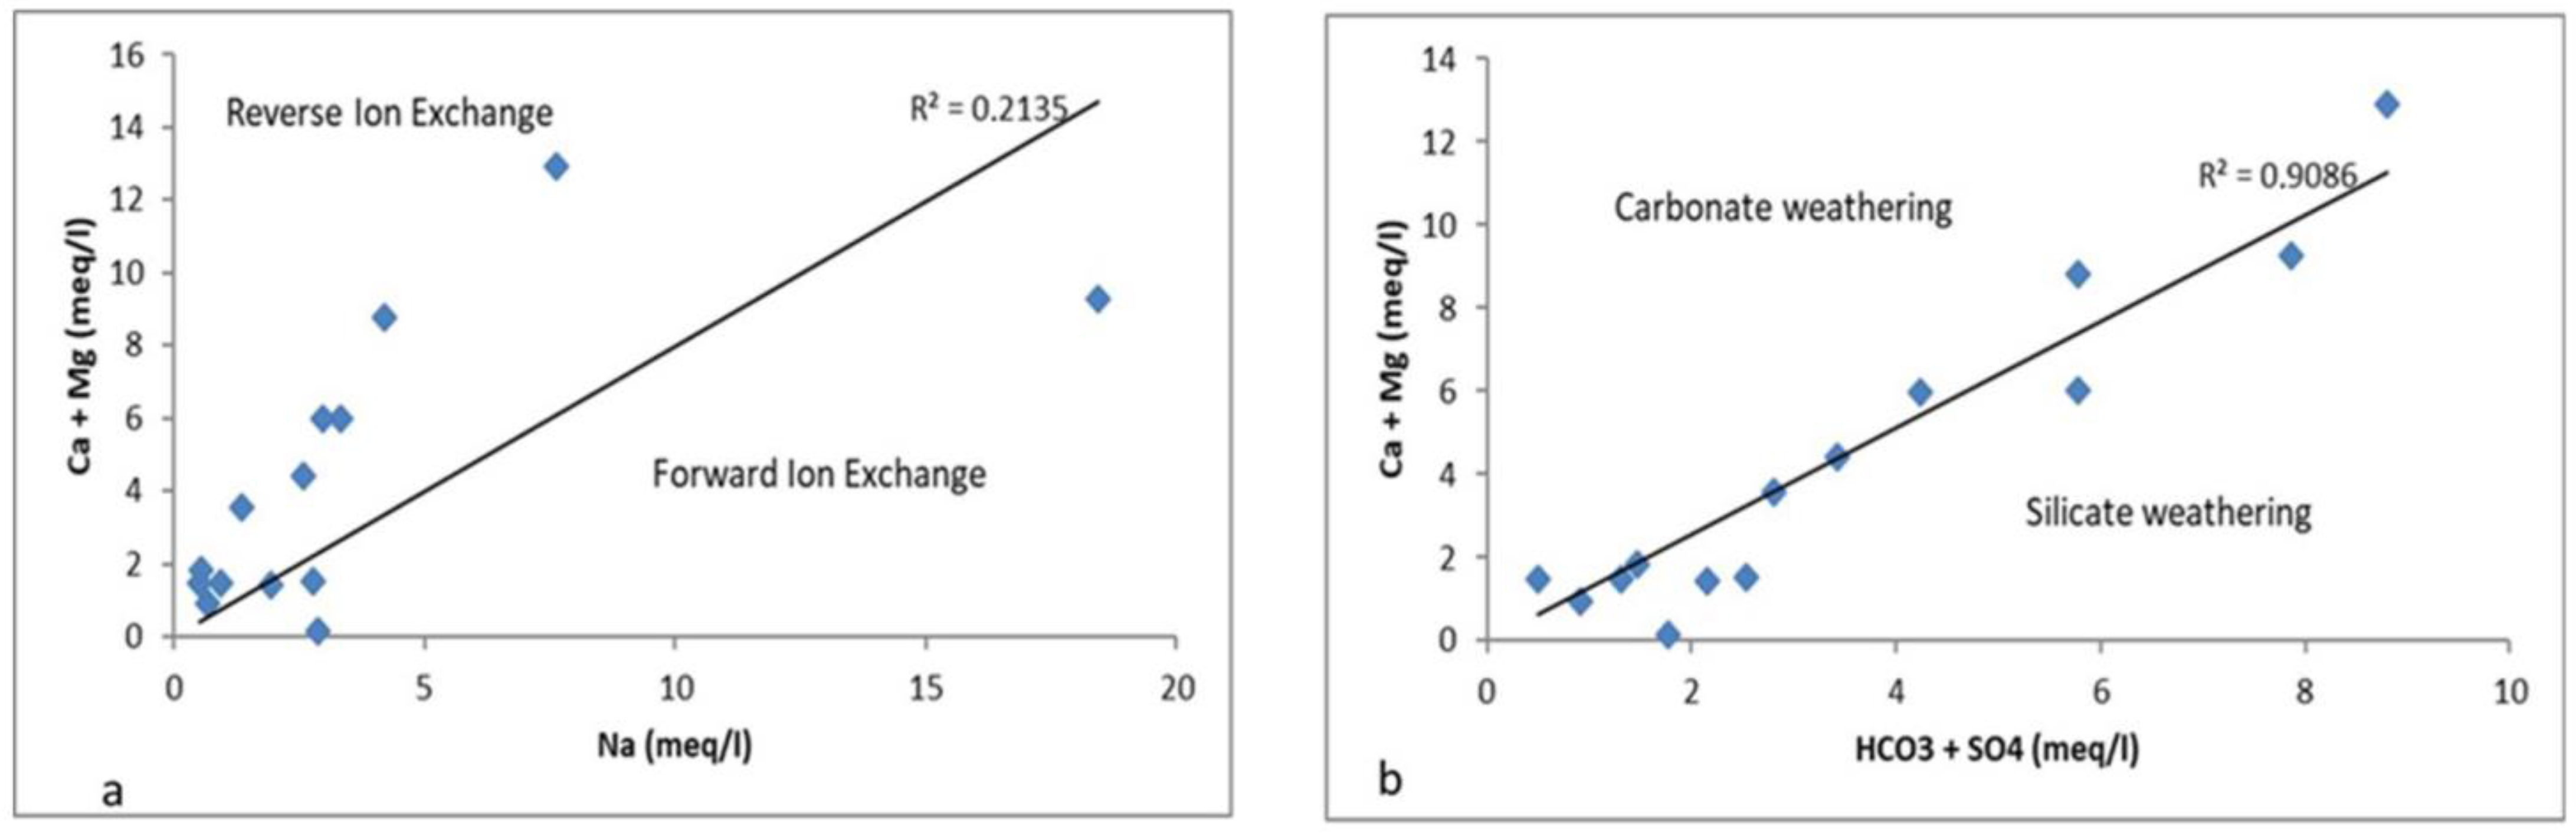
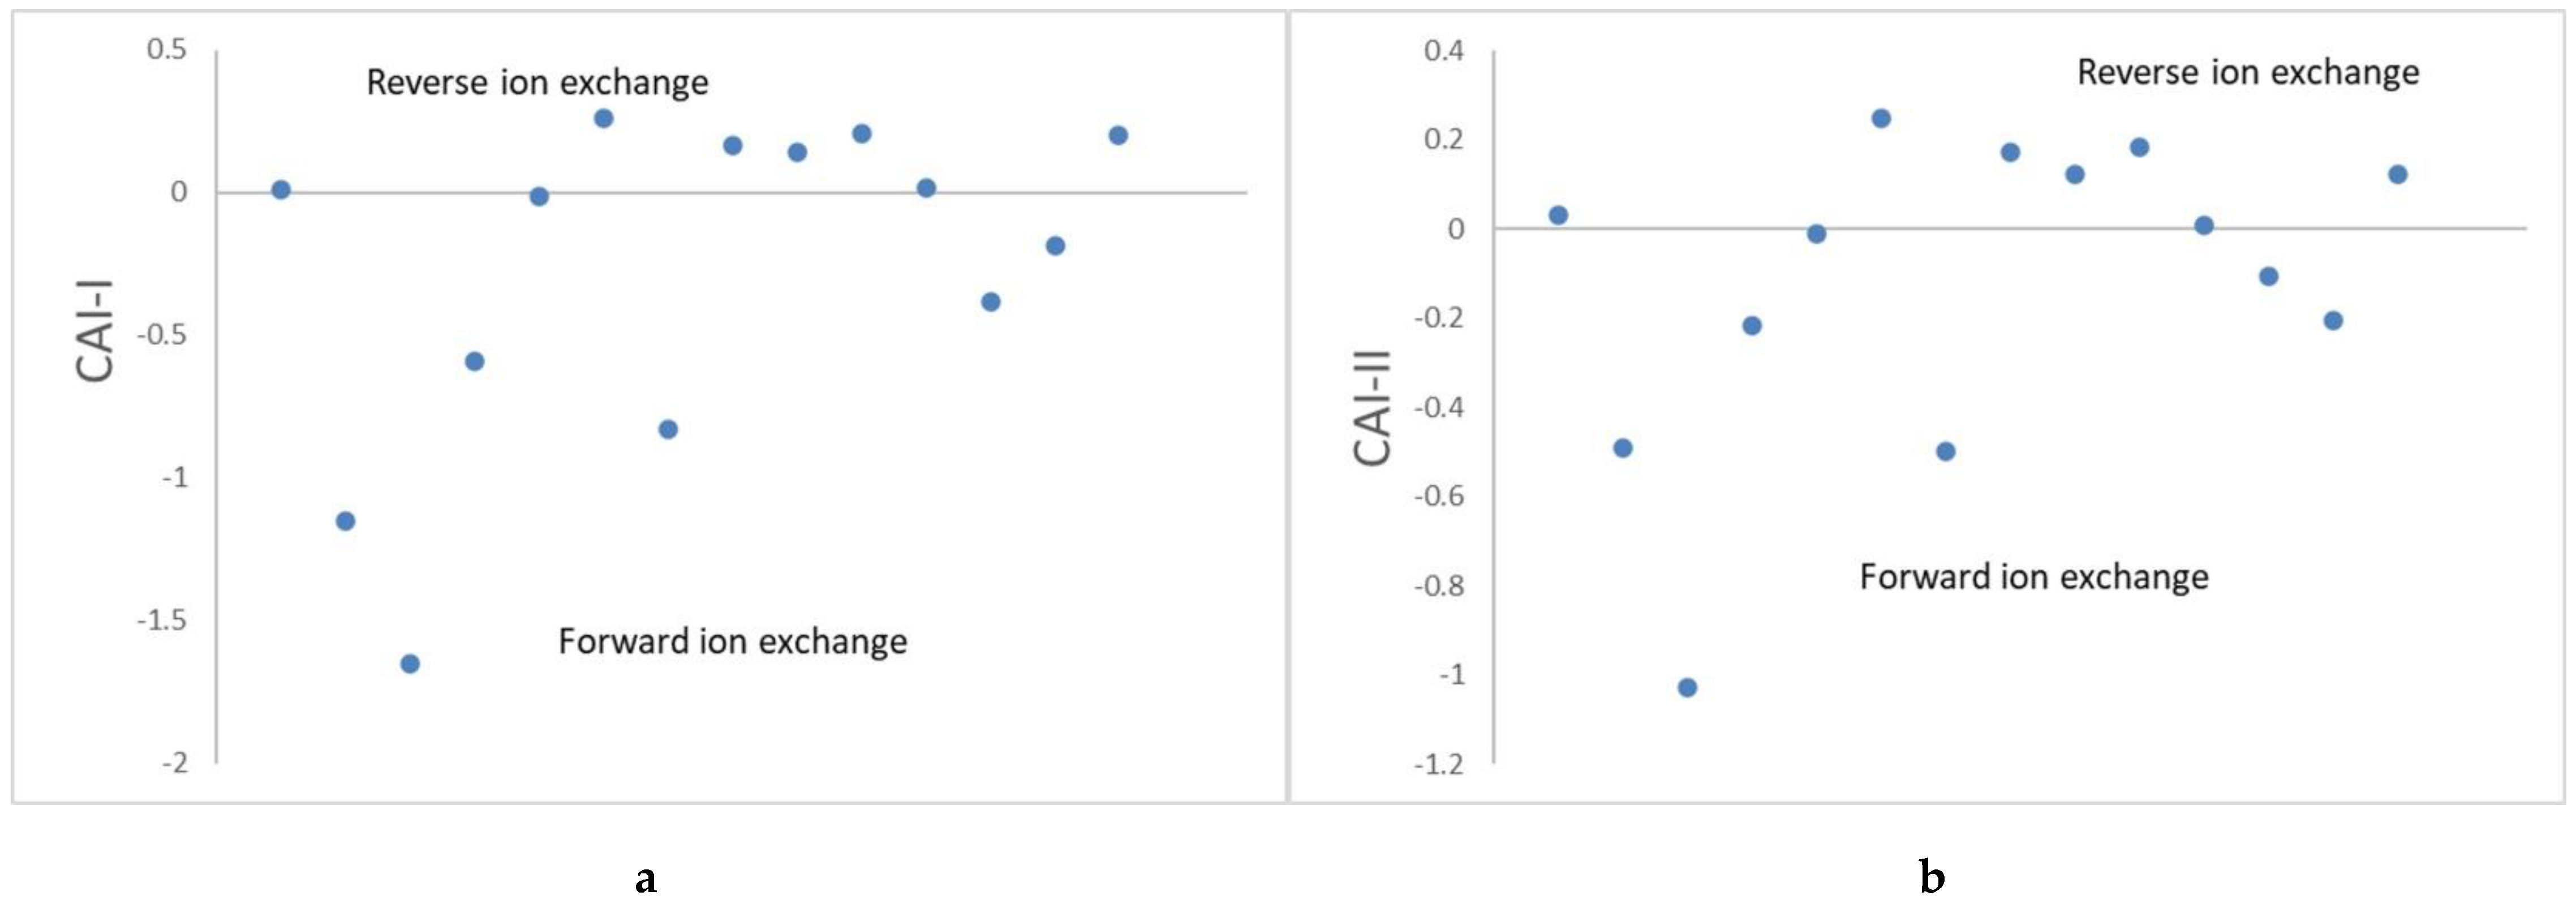
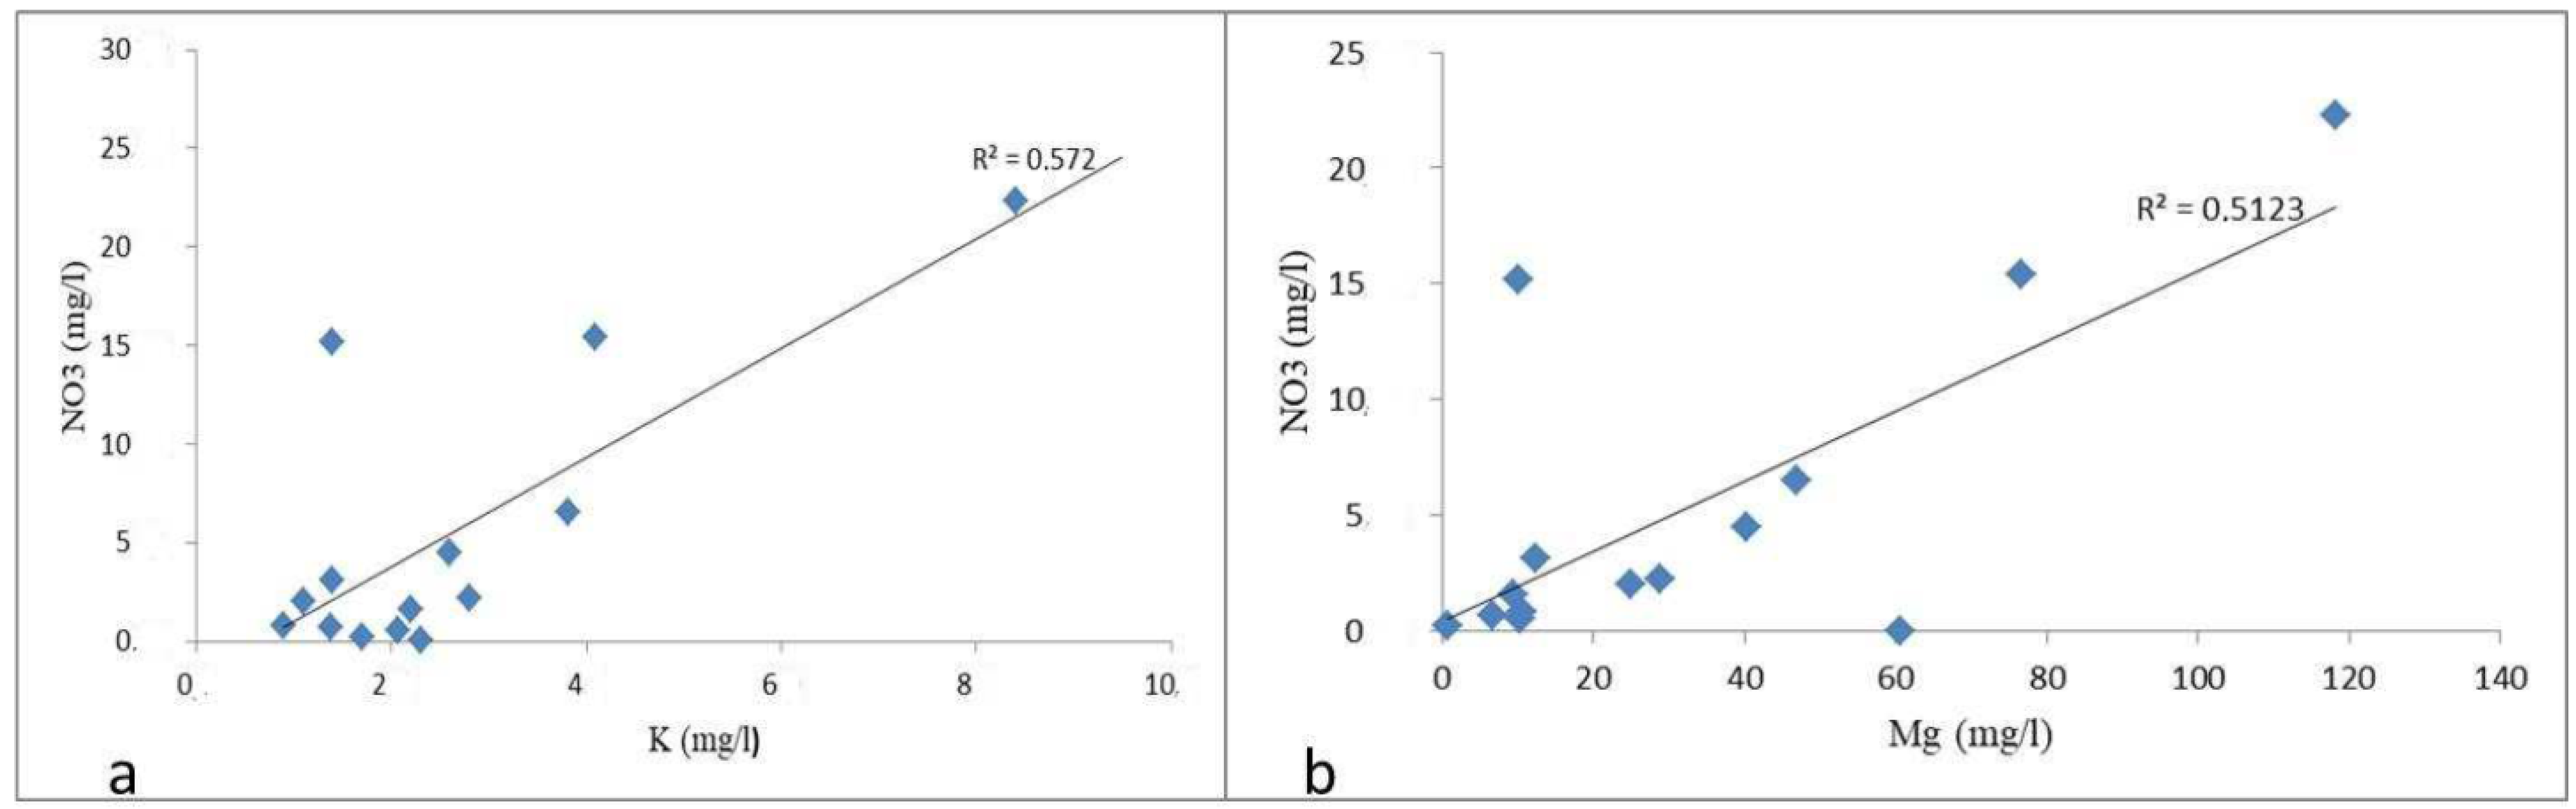
4.2. Hydro-Geochemical Processes
5. Conclusions
Supplementary Materials
Author Contributions
Funding
Institutional Review Board Statement
Informed Consent Statement
Data Availability Statement
Acknowledgments
Conflicts of Interest
References
- Chen, J.; Wu, H.; Qian, H.; Gao, Y. Assessing Nitrate and Fluoride Contaminants in Drinking Water and Their Health Risk of Rural Residents Living in a Semiarid Region of Northwest China. Expo. Health 2017, 9, 183–195. [Google Scholar] [CrossRef]
- Li, P.; Tian, R.; Xue, C.; Wu, J. Progress, opportunities, and key fields for groundwater quality research under impacts of human activities in China with special focus on Western China. Environ. Sci. Pollut. Res. 2017, 24, 13224–13234. [Google Scholar] [CrossRef] [PubMed]
- Raheli-Namin, S.; Mortazavi, M.; Mobinifar, M.A. Groundwater quality probability mapping and assessment for domestic and irrigation purposes in Ghara-Su Basin of Golestan Province, Iran. J. Mater. Environ. Sci. 2016, 7, 259–271. [Google Scholar]
- Li, X.; Wu, H.; Qian, H.; Gao, Y. Groundwater Chemistry Regulated by Hydrochemical Processes and Geological Structures: A Case Study in Tongchuan, China. Water 2018, 10, 338. [Google Scholar] [CrossRef] [Green Version]
- WHO/UNICEF. World Health Organization (WHO) and United Nations Children’s (UNECEF), Progress on Sanitation and Drinking Water e 2015 Update and MDG Assessment; WHO: Geneva, Switzerland, 2015; Available online: https://www.unicef.org/publication/index_82419.html (accessed on 10 February 2022).
- Kulinkina, A.V.; Plummer, J.D.; Chuic, K.H.K.; Kosinski, C.J.; Adomako-Adjei, T.; Egorov, A.I.; Nwankwoala, H.O.; Amadi, A.N.; Oborie, E.; Ushie, F.A. Hydrochemical factors and correlation analysis in groundwater quality in Yenagoa, Bayeka State, Nigeria. Appl. Ecol. Environ. Sci. 2014, 2, 100–105. [Google Scholar]
- Alexakis, D.E. Linking DPSIR Model and Water Quality Indices to Achieve Sustainable Development Goals in Groundwater Resources. Hydrology 2021, 8, 90. [Google Scholar] [CrossRef]
- WHO. Guidelines or Drinking-Water Quality, 4th ed.; World Health Organization: Geneva, Switzerland, 2011. [Google Scholar]
- SABS. South African National Standard 241: Drinking Water, Part 1: Micro-Biological, Physical, Aesthetic and Chemical Determinands; SABS (South African Bureau of Standards): Pretoria, South Africa, 2015; Available online: https://web.mwa.co.th/download/prd01/iDW_standard/South_African_Water_Standard_SANS_241-2015.pdf (accessed on 18 January 2022).
- Kumar, M.; Ramanathan, A.L.; Rao, M.S.; Kumar, B. Identification and evaluation of hydrogeochemical processes in the groundwater environment of Delhi, India. Environ. Earth Sci. 2006, 50, 1025–1039. [Google Scholar] [CrossRef]
- Abdelshafy, M.; Saber, M.; Abdelhaleem, A.; Abdelrazek, S.M.; Seleem, E.M. Hydrogeochemical processes and evaluation of groundwater aquifer at Sohag city, Egypt. Sci. Afr. 2019, 6, e00196. [Google Scholar] [CrossRef]
- Tarawneh, M.S.M.; Janardhana, M.R.; Ahmed, M.M. Hydrochemical processes and groundwater quality assessment in North eastern region of Jordan valley, Jordan. J. Hydro-Environ. Res. 2020, 2, 129–145. [Google Scholar] [CrossRef]
- Tiwari, A.K.; Singh, A.K. Hydrogeochemical investigation and groundwater quality assessment of Pratapgarh district, Uttar Pradesh. J. Geol. Soc. India 2014, 83, 329–343. [Google Scholar] [CrossRef]
- Selvakumar, S.; Chandrasekar, N.; Kumar, G. Hydrogeochemical characteristics and groundwater contamination in the rapid urban development areas of Combatore, India. Water Resour. Urban Ind. J. 2017, 17, 26–33. [Google Scholar] [CrossRef]
- Kaur, L.; Rishi, M.S.; Sharma, S.; Sharma, B.; Lata, R.; Singh, G. Hydrogeochemical characterization of groundwater in alluvial plains of river Yamuna in northern India: An insight of controlling processes. J. King Saud Univ. Sci. 2019, 31, 1245–1253. [Google Scholar] [CrossRef]
- Mohanty, A.K.; Rao, V.G. Hydrogeochemical, seawater intrusion and oxygen isotope studies on a coastal region in the Puri District of Odisha, India. CATENA 2019, 172, 558–571. [Google Scholar] [CrossRef]
- Adimalla, N.; Taloor, A.J. Hydrogeochemical investigation of groundwater quality in the hard rock terrain of South India using Geographic Information System (GIS) and groundwater quality index (GWQI) techniques. Groundw. Sustain. Dev. 2019, 10, 100288. [Google Scholar] [CrossRef]
- Abiye, T.; Bybee, G.; Leshomo, J. Fluoride concentrations in the arid Namaqualand and the Waterberg groundwater, South Africa: Understanding the controls of mobilization through hydrogeochemical and environmental isotopic approaches. Groundw. Sustain. Dev. 2018, 6, 112–120. [Google Scholar] [CrossRef]
- Alassane, A.; Trabelsi, R.; Dovonon, L.F.; Odeloui, D.J.; Boukari, M.; Zouari, K.; Mama, D. Chemical Evolution of the Continental Terminal Shallow Aquifer in the South of Coastal Sedimentary Basin of Benin (West-Africa) Using Multivariate Factor Analysis. J. Water Resour. Prot. 2015, 7, 496–515. [Google Scholar] [CrossRef] [Green Version]
- Durowoju, O.S.; Butler, M.; Ekosse, G.I.; Odiyo, J.O. Hydrochemical Processes and Isotopic Study of Geothermal Springs within Soutpansberg, Limpopo Province, South Africa. Appl. Sci. 2019, 9, 1688. [Google Scholar] [CrossRef] [Green Version]
- Malaza, N. Hydrogeochemical assessment of groundwater quality in the Soutpansberg Basin around Tshikondeni, Limpopo Province, South Africa. Geochem. Explor. Environ. Anal. 2017, 17, 35–41. [Google Scholar] [CrossRef]
- Mokoena, P.; Kanyerere, T.; van Bever Donker, J. Hydrogeochemical characteristics and evaluation of groundwater quality for domestic and irrigation purposes: A case study of the Heuningnes Catchment, Western Cape Province, South Africa. SN Appl. Sci. 2020, 2, 1548. [Google Scholar] [CrossRef]
- Molekoa, M.D.; Avtar, R.; Kumar, P.; Minh, H.V.T.; Kurniawam, T.A. Hydrogeochemical Assessment of Groundwater Quality of Mokopane Area, Limpopo, South Africa Using Statistical Approach. Water 2019, 11, 1891. [Google Scholar] [CrossRef] [Green Version]
- Hwang, J.Y.; Park, S.; Kim, H.K.; Kim, M.S.; Jo, H.J.; Kim, J.I.; Lee, G.M.; Shin, I.K.; Kim, T.S. Hydrochemistry for the Assessment of Groundwater Quality in Korea. J. Agric. Chem. Environ. 2017, 6, 1–29. [Google Scholar] [CrossRef] [Green Version]
- Napacho, A.; Manyele, V. Quality assessment of drinking water in Temeke district (Part II): Characterization of chemical parameters. Afr. J. Environ. Sci. Technol. 2010, 4, 775–789. [Google Scholar]
- Brandl, G. Soutpansberg Group: Catalogue of South African Lithostratigraphic units. SA Committee for stratigraphy. Council Geosci. 1999, 6, 39–41. [Google Scholar]
- Barker, O.B. A proposed geotectonic model for the Soutpansberg Group within the Limpopo Mobile Belt, South Africa. Spec. Publ. Geol. Soc. S. Afr. 1983, 8, 181–190. [Google Scholar]
- Brandl, G. The Geology of the Pietersburg Area: Explanation; Sheet 2230; Geological Survey: Pretoria, South Africa, 1986. [Google Scholar]
- Weaver, J.M.C.; Cave, L.; Talma, A.S. Groundwater Sampling, 2nd ed.; WRC Report No. TT303/07; Water Research Commission: Pretoria, South Africa, 2007. [Google Scholar]
- Weight, W.D. Hydrogeology Field Manual, 2nd ed.; McGraw-Hill Companies Inc.: New York, NY, USA, 2008. [Google Scholar]
- Piper, A.M. A graphical procedure in the geochemical interpretation of water analysis. Geophys. Union. Trans. 1944, 25, 914–928. [Google Scholar] [CrossRef]
- Gibbs, R.J. Mechanisms Controlling World Water Chemistry. Science 1970, 170, 1088–1090. [Google Scholar] [CrossRef] [PubMed]
- Schoeller, H. Qualitative Evaluation of Groundwater Resources. In Methods and Techniques of Groundwater Investigations and Development; UNESCO: Paris, France, 1965; pp. 54–83. [Google Scholar]
- Parkhurst, D.; Appelo, C. User’s Guide to PHREEQC (Version 2); US Geological Survey: Reston, VA, USA, 1999. [Google Scholar]
- Deutsch, W.J. Groundwater Geochemistry: Fundamentals and Application to Contamination; CRS Press: Boca Raton, FL, USA, 1997. [Google Scholar]
- Kokkat, A.; Jegathambal, P.; James, E.J. Spatial and temporal variation in groundwater quality and impact of sea water in the Cauvery delta, South India. Int. J. Earth. Sci. 2016, 9, 383–392. [Google Scholar]
- Freeze, R.A.; Cherry, J.A. Groundwater; Prentice-Hall: Englewood Cliffs, NJ, USA, 1979. [Google Scholar]
- Odiyo, J.O.; Makungo, R. Fluoride concentrations in groundwater and impact on human health in Siloam Village, Limpopo Province, South Africa. Water SA 2012, 38, 731–736. [Google Scholar] [CrossRef] [Green Version]
- Hagedorn, B.; Cartwright, I. Climatic and lithologic control on the temporal and spatial variability of CO2 consumption via chemical weathering: An example from the Australian Victorian ALPS. Chem. Geol. 2009, 260, 234–253. [Google Scholar] [CrossRef]
- Khan, A.; EghbalBakhtiari, A. Groundwater assessment of coastal aquifers in Karachi: Impact of seawater intrusion. Int. J. Ground Sediment Water 2017, 6, 248. [Google Scholar]
- Nematollahi, M.J.; Clark, M.J.R.; Ebrahimi, P.; Ebrahimi, M. Preliminary assessment of groundwater hydrogeochemistry within Gilam, a northern province of Iran. Environ. Monit. Assess. 2018, 190, 242. [Google Scholar] [CrossRef] [PubMed]
- Yu, H.; Gui, H.; Zhao, H.; Wang, M.; Li, J.; Fang, H.; Jiang, Y.; Zhang, Y. Hydrochemical characteristics and water quality evaluation of shallow groundwater in Suxian mining area, Huaibei coalfield, China. Int. J. Coal Sci. Technol. 2020, 7, 825–835. [Google Scholar] [CrossRef]
- Gamvroula, D.; Alexakis, D.; Stamatis, G. Diagnosis of groundwater quality and assessment of contamination sources in the Megara basin (Attica, Greece). Arab. J. Geosci. 2012, 6, 2367–2381. [Google Scholar] [CrossRef]
- Stamatis, G.; Alexakis, D.; Gamvroula, D.; Migiros, G. Groundwater quality assessment in Oropos–Kalamos basin, Attica, Greece. Environ. Earth Sci. 2011, 64, 973–988. [Google Scholar] [CrossRef]
- Alexakis, D.; Gotsis, D.; Giakoumakis, S. Assessment of drainage water quality in pre- and post-irrigation seasons for supplemental irrigation use. Environ. Monit. Assess. 2011, 184, 5051–5063. [Google Scholar] [CrossRef] [PubMed]
- Aghazadeh, N.; Mogaddam, A.A. Assessment of Groundwater Quality and its Suitability for Drinking and Agricultural Uses in the Oshnavieh Area, Northwest of Iran. J. Environ. Prot. 2010, 1, 30–40. [Google Scholar] [CrossRef] [Green Version]
- Mokoena, P.; Manyama, K.; van Bever Donker, J.; Kanyerere, T. Investigation of groundwater salinity using geophysical and geochemical approaches: Heuningnes catchment coastal aquifer. Western Cape Province, South Africa. Environ. Earth Sci. 2021, 80, 191. [Google Scholar] [CrossRef]
- Talib, M.A.; Tang, Z.; Shahab, A.; Siddique, J.; Faheem, M.; Fatima, M. Hydrogeochemical Characterization and Suitability Assessment of Groundwater: A Case Study in Central Sindh, Pakistan. Int. J. Environ. Res. Public Health 2019, 16, 886. [Google Scholar] [CrossRef] [Green Version]
- Rajmohan, N.; Elango, L. Identification and evolution of hydrogeochemical processes in the groundwater environment in an area of the Palar and Cheyyar River Basins, Southern India. Environ. Geol. 2004, 46, 47–61. [Google Scholar] [CrossRef]
- Agoubi, B.; Kharroubi, A.; Abichou, T.; Abida, H. Hydrochemical and geoelectrical investigation of Marine Jeffara Aquifer, southeastern Tunisia. Appl. Water Sci. 2013, 3, 415–429. [Google Scholar] [CrossRef]
- Kanagaraj, G.; Elango, L.; Sridhar, S.G.D.; Gowrisankar, G. Hydrogeochemical processes and influence of seawater intrusion in coastal aquifers south of Chennai, Tamil Nadu, India. Environ. Sci. Pollut. Res. 2018, 25, 8989–9011. [Google Scholar] [CrossRef] [PubMed]
- Subba Rao, N.; Surya Rao, P. Major ion chemistry of groundwater in a river basin: A study from India. Environ. Earth Sci. 2010, 61, 757–775. [Google Scholar] [CrossRef]
- Marghade, D.; Malpe, D.B.; Subba Rao, N. Applications of geochemical and multivariate statistical approaches for the evaluation of groundwater quality and human health risks in a semi-arid region of eastern Maharashtra, India. Environ. Geochem. Health 2019, 43, 683–703. [Google Scholar] [CrossRef] [PubMed]
- Li, P.; Wu, J.; Qian, H. Hydrochemical appraisal of groundwater quality for drinking and irrigation purposes and the major influencing factors: A case study in and around Hua County, China. Arab. J. Geosci. 2016, 9, 15. [Google Scholar] [CrossRef]
- Subba Rao, N.; Marghade, D.; Dinakar, A.; Chandana, I.; Sunitha, B.; Ravindra, B.; Balaji, T. Geochemical characteristics and controlling factors of chemical composition of groundwater in a part of Guntur district, Andhra Pradesh, India. Environ. Earth Sci. 2017, 76, 747. [Google Scholar] [CrossRef]
- Marghade, D.; Malpe, D.B.; Duraisamy, K.; Patil, P.D.; Li, P. Hydrogeochemical evaluation, suitability, and health risk assessment of groundwater in the watershed of Godavari basin, Maharashtra, Central India. Environ. Sci. Pollut. Res. 2020, 28, 18471–18494. [Google Scholar] [CrossRef]
- Ramesh, K.; Elango, L. Groundwater quality and its suitability for domestic and agricultural use in Tondiar river basin, Tamil Nadu, India. Environ. Monit. Assess. 2011, 184, 3887–3899. [Google Scholar] [CrossRef]
- Chacha, N.; Njau, K.N.; Lugomela, G.V.; Muzuka, A.N.N. Hydrogeochemical characteristics and spatial distribution of groundwater quality in Arusha well fields, Northern Tanzania. Appl. Water Sci. 2018, 8, 118. [Google Scholar] [CrossRef] [Green Version]
- Singh, A.K.; Giri, S.; Chaturvedi, A. Fluvial geochemistry of Subarnarekha River basin, India. J. Earth Syst. Sci. 2018, 127, 119. [Google Scholar] [CrossRef] [Green Version]
- Kohn, J.; Soto, D.X.; Iwanyshyn, M.; Olson, B.; Kalischuk, A.; Lorenz, K.; Hendry, M.J. Groundwater nitrate and chloride trends in an agriculture-intensive area in Southern Alberta, Canada. Water Qual. Res. J. 2016, 51, 47–59. [Google Scholar] [CrossRef] [Green Version]
- Madison, R.; Brunett, J.O. Overview of the Occurrence of Nitrate in Groundwater of the United States. In National Water Summary 1984: Hydrologic Events, Selected Water-Quality Trends, and Groundwater Resources; United States Geological Survey Water Supply Paper: Reston, VA, USA, 1985; Volume 2275, pp. 93–105. [Google Scholar]
- Sigter, T.Y.; van Ooijen, S.P.T.; Post, V.E.A.; Appelo, C.A.J.; Carvalho, A.M.M.D. A hydrogeological and hydrochemical explanation of the groundwater composition under irrigated land in a Mediterranean environment, Algarve. Port. J. Hydrol. 1998, 208, 262–279. [Google Scholar] [CrossRef]
- Kumar, P.J.S.; Jegathambal, P.; James, G.J. Chemometric evaluation of nitrate contamination in the groundwater of a hard rock area in Dharapuram, South India. Appl. Water Sci. 2014, 4, 397–405. [Google Scholar] [CrossRef] [Green Version]
- Reddy, A.G.S. Geochemical evaluation of nitrate and fluoride contamination in varied hydrogeological environs of Prakasam District, Southern India. Environ. Earth Sci. 2013, 71, 4473–4495. [Google Scholar] [CrossRef]
- Ako, A.A.; Jun, S.; Takahiro, H.; Kimpei, I.; Nkeng, G.G.; Fantong, W.Y.; Eyong, G.E.T.; Ntankouo, N.R. Evaluation of groundwater quality and its suitability for drinking, domestic and agricultural uses in the Banana Plain (Mbonga, Njambe, Penja) of Cameroon volcanic. Environ. Geochem. Health 2011, 34, 615–639. [Google Scholar] [CrossRef]
- Lorenz, K.; Iwanyshyn, M.; Olson, B.; Kalischuk, A.; Pentland, J. Livestock Manure Impacts on Groundwater Quality in Alberta: 2008 to 2011 Progress Report; Alberta Agriculture and Rural Development: Lethbridge, AB, Canada, 2014. [Google Scholar]
- Mgbenu, C.N.; Egbueri, J.C. The hydrogeochemical signatures, quality indices and health risk assessment of water resources in Umunya district, southeast Nigeria. Appl. Water Sci. 2019, 9, 22. [Google Scholar] [CrossRef] [Green Version]
- Kumar, S.; Venkatesh, A.S.; Singh, R.; Udayabhanu, G.; Saha, D. Geochemical signatures and isotopic systematics constraining dynamics of fluoride contamination in groundwater across Jamui, India. Chemosphere 2018, 205, 493–505. [Google Scholar] [CrossRef]
- Appelo, C.A.J.; Postma, D. Geochemistry, Groundwater and Pollution; CRC Press: New York, NY, USA, 2004. [Google Scholar]
- Egbueri, J.C. Water quality appraisal of selected farm provinces using integrated hydrogeochemical, multivariate statistical, and microbiological technique. Model. Earth Syst. Environ. 2019, 5, 997–1013. [Google Scholar] [CrossRef]
- Magesh, N.S.; Chandrasekar, N.; Elango, L. Occurrence and distribution of fluoride in the groundwater of the Tamiraparani River basin, South India: A geostatistical modeling approach. Environ. Earth Sci. 2016, 75, 1483. [Google Scholar] [CrossRef]
- Erdogan, I.G.; Fosso-Kankeu, E.; Ntwampe, S.K.O.; Waanders, F.; Hoth, N. Seasonal variation of hydrochemical characteristics of open-pit groundwater near a closed metalliferous mine in O’Kiep, Namaqualand Region, South Africa. Environ. Earth Sci. 2020, 79, 119. [Google Scholar] [CrossRef]
- Verlicchi, P.; Grillini, V. Surface Water and Groundwater Quality in South Africa and Mozambique—Analysis of the Most Critical Pollutants for Drinking Purposes and Challenges in Water Treatment Selection. Water 2020, 12, 305. [Google Scholar] [CrossRef] [Green Version]
- Madilonga, R.T.; Edokpayi, J.N.; Volenzo, E.T.; Durowoju, O.S.; Odiyo, J.O. Water Quality Assessment and Evaluation of Human Health Risk in Mutangwi River, Limpopo Province, South Africa. Int. J. Environ. Res. Public Health 2021, 18, 6765. [Google Scholar] [CrossRef] [PubMed]


| Site ID | pH | T | EC | TDS | Ca2+ | Mg2+ | Na+ | K+ | Cl− | HCO3− | NO3− | SiO2 | F− | SO42− |
|---|---|---|---|---|---|---|---|---|---|---|---|---|---|---|
| ZQMPMA1 | 7.9 | 27 | 279 | 1810 | 86 | 61 | 424 | 2 | 664 | 452 | 0 | 30 | 0.5 | 22 |
| ZQMSOU1 | 8.2 | 39 | 36 | 262 | 12 | 10 | 45 | 2 | 33 | 119 | 1 | 22 | 2.5 | 10 |
| ZQMTPS2 | 9.3 | 45 | 34 | 231 | 2 | 1 | 66 | 2 | 39 | 84 | 0 | 34 | 0.7 | 19 |
| ZQMLRT1 | 8.3 | 22 | 88 | 697 | 43 | 47 | 76 | 4 | 76 | 335 | 7 | 21 | 0.4 | 14 |
| ZQMNKW2 | 7.7 | 24 | 20 | 125 | 8 | 7 | 16 | 1 | 25 | 50 | 1 | 17 | 0.1 | 4 |
| ZQMDMI1 | 8.4 | 22 | 89 | 633 | 53 | 40 | 68 | 3 | 146 | 227 | 5 | 11 | 0.4 | 25 |
| ZQMHVE1 | 8.2 | 26 | 48 | 328 | 15 | 9 | 64 | 2 | 55 | 122 | 2 | 19 | 0.8 | 26 |
| ZQMMBI1 | 8.3 | 26 | 202 | 1418 | 64 | 118 | 175 | 8 | 334 | 455 | 22 | 30 | 0.3 | 65 |
| ZQMMWI1 | 8.5 | 24 | 70 | 494 | 41 | 29 | 59 | 3 | 109 | 183 | 2 | 10 | 0.7 | 20 |
| ZQMGGG1 | 8.1 | 24 | 123 | 905 | 50 | 77 | 97 | 4 | 192 | 322 | 15 | 26 | 0.4 | 24 |
| ZQMWRT1 | 8.4 | 23 | 22 | 155 | 12 | 11 | 12 | 1 | 20 | 74 | 1 | 11 | 0.1 | 5 |
| ZQMTSU1 | 8.2 | 25 | 25 | 180 | 16 | 12 | 13 | 1 | 15 | 87 | 3 | 25 | 0.3 | 2 |
| ZQMTVU1 | 7.8 | 26 | 28 | 179 | 13 | 10 | 22 | 1 | 29 | 28 | 15 | 7 | 0.2 | 2 |
| ZQMLVI1 | 8.3 | 25 | 50 | 360 | 30 | 25 | 32 | 1 | 62 | 156 | 2 | 18 | 0.3 | 12 |
| Min | 6.7 | 13 | 5 | 33 | 1 | 1 | 3 | 0 | 5 | 5 | 0 | 2 | 0 | 1 |
| Max | 9.6 | 47 | 287 | 1869 | 99 | 154 | 460 | 10 | 755 | 612 | 37 | 58 | 3 | 71 |
| Mean | 8.4 | 31 | 59 | 372 | 22 | 23 | 65 | 2 | 75 | 170 | 4 | 23 | 1 | 14 |
| Median | 8.3 | 28 | 36 | 248 | 13 | 10 | 59 | 2 | 34 | 109 | 1 | 22.0 | 0 | 11 |
| Detection limit | 2 | 0 | 1 | 1 | 1 | 1 | 2 | 0.1 | 3 | 4 | 0.01 | 0.4 | 0.1 | 0.8 |
| pH | EC | TDS | Ca2+ | Mg2+ | Na+ | K+ | Cl− | SO42− | HCO3− | F− | NO3− | ||
|---|---|---|---|---|---|---|---|---|---|---|---|---|---|
| pH | 1 | ||||||||||||
| EC | −0.2 | 1 | |||||||||||
| TDS | −0.1 | 1.0 | 1 | ||||||||||
| Ca2+ | −0.2 | 0.9 | 0.9 | 1 | |||||||||
| Mg2+ | −0.1 | 0.8 | 0.8 | 0.8 | 1 | ||||||||
| Na+ | −0.2 | 0.9 | 0.9 | 0.8 | 0.6 | 1 | |||||||
| K+ | 0.0 | 0.6 | 0.6 | 0.6 | 0.9 | 0.3 | 1 | ||||||
| Cl− | −0.2 | 1.0 | 1.0 | 0.9 | 0.7 | 1.0 | 0.4 | 1 | |||||
| SO42− | 0.2 | 0.6 | 0.7 | 0.6 | 0.8 | 0.4 | 0.9 | 0.5 | 1 | ||||
| HCO3− | −0.1 | 0.9 | 0.9 | 0.9 | 0.9 | 0.8 | 0.8 | 0.8 | 0.7 | 1 | |||
| F− | 0.2 | −0.1 | −0.1 | −0.2 | −0.2 | 0.01 | 0.05 | −0.1 | 0.03 | −0.1 | 1 | ||
| NO3− | −0.2 | 0.3 | 0.4 | 0.3 | 0.7 | 0.1 | 0.8 | 0.2 | 0.6 | 0.4 | −0.3 | 1 |
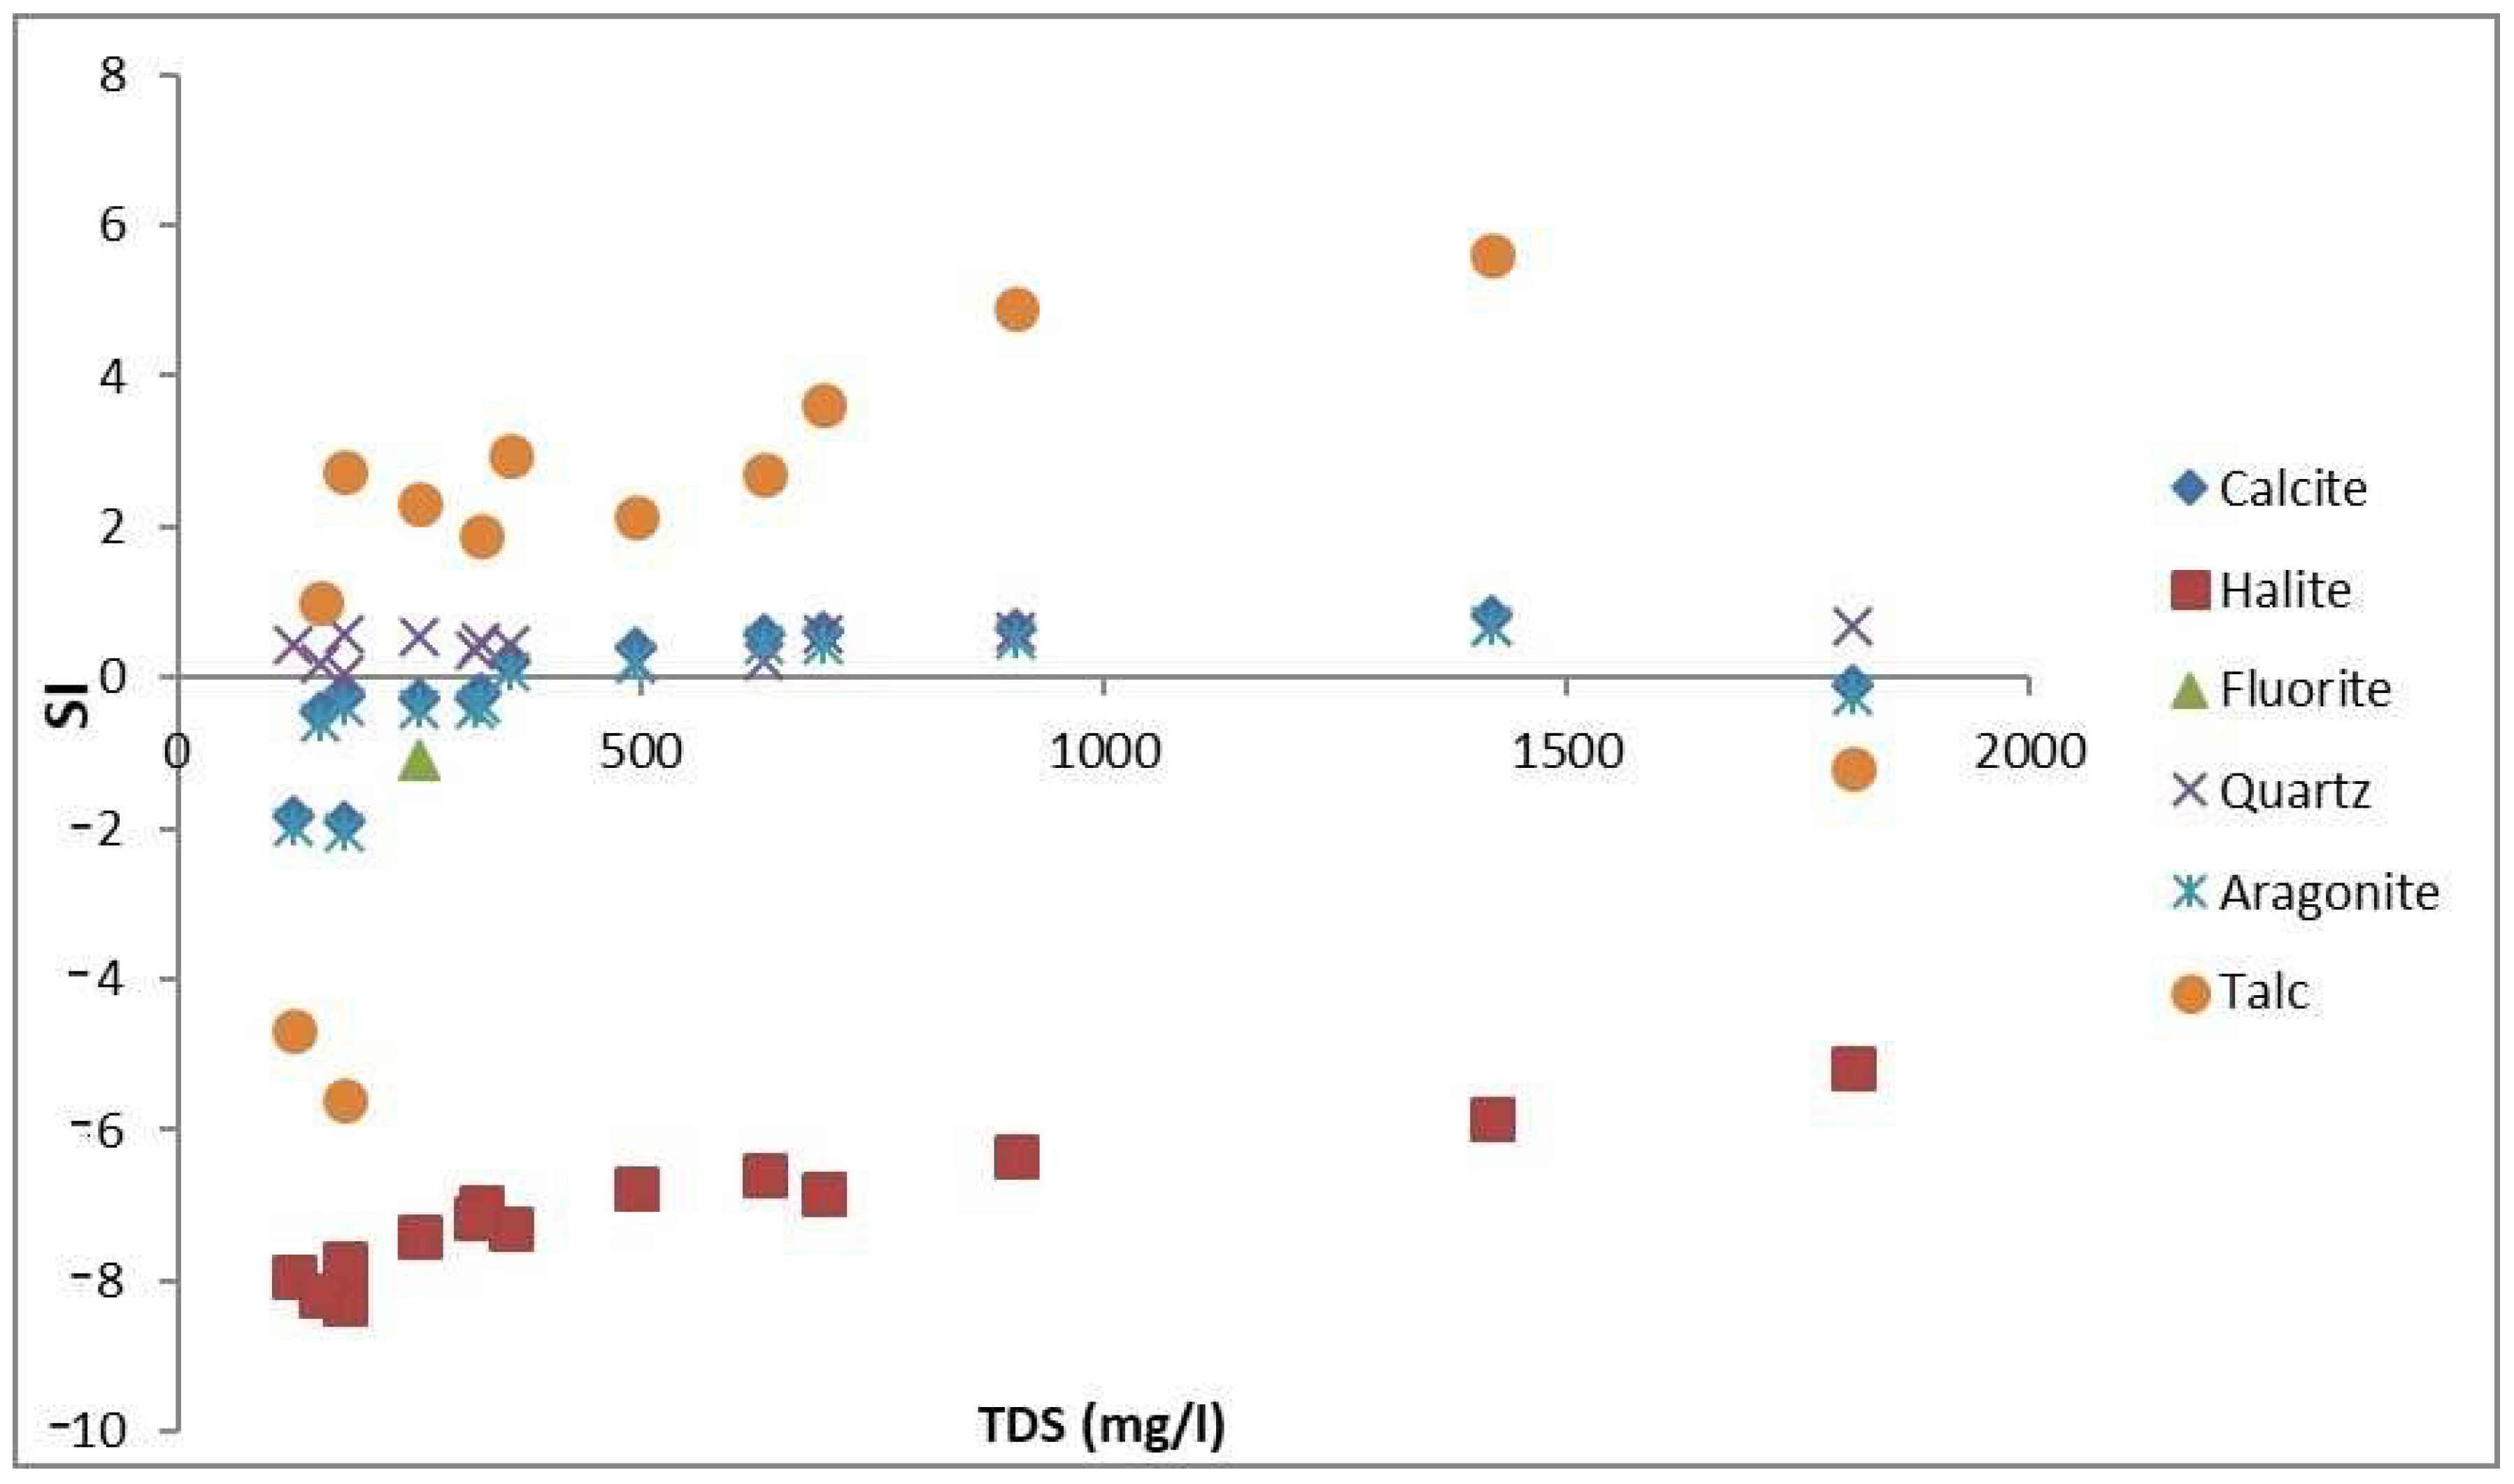
| Site ID | CAI-I | CAI-II | SI Calcite | SI Halite | SI Fluorite | SI Quartz | SI Aragonite | SI Talc |
|---|---|---|---|---|---|---|---|---|
| ZQMPMA1 | 0.013 | 0.032 | −0.09 | −5.18 | * | 0.65 | −0.23 | −1.2 |
| ZQMSOU1 | −1.150 | −0.493 | −0.26 | −7.39 | −1.08 | 0.54 | −0.4 | 2.3 |
| ZQMTPS2 | −1.651 | −1.029 | −0.29 | −7.15 | * | 0.35 | −0.42 | * |
| ZQMLRT1 | −0.592 | −0.216 | 0.6 | −6.82 | * | 0.56 | 0.45 | 3.64 |
| ZQMNKW2 | −0.011 | −0.009 | −1.83 | −7.95 | * | 0.43 | −1.97 | −4.67 |
| ZQMDMI1 | 0.262 | 0.250 | 0.57 | −6.58 | * | 0.24 | 0.43 | 2.69 |
| ZQMHVE1 | −0.828 | −0.500 | −0.19 | −7.01 | * | 0.47 | −0.33 | 1.89 |
| ZQMMBI1 | 0.168 | 0.173 | 0.84 | −5.85 | * | 0.67 | 0.69 | 5.6 |
| ZQMMWI1 | 0.139 | 0.124 | 0.39 | −6.76 | * | 0.2 | 0.24 | 2.13 |
| ZQMGGG1 | 0.206 | 0.185 | 0.65 | −6.33 | * | 0.61 | 0.5 | 4.9 |
| ZQMWRT1 | 0.019 | 0.008 | −0.44 | −8.17 | * | 0.2 | −0.58 | 1 |
| ZQMTSU1 | −0.380 | −0.106 | −0.25 | −8.28 | * | 0.58 | −0.39 | 2.73 |
| ZQMTVU1 | −0.187 | −0.206 | −1.89 | −7.76 | * | 0.05 | −2.04 | −5.6 |
| ZQMLVI1 | 0.200 | 0.124 | 0.22 | −7.28 | * | 0.43 | 0.08 | 2.96 |
Publisher’s Note: MDPI stays neutral with regard to jurisdictional claims in published maps and institutional affiliations. |
© 2022 by the authors. Licensee MDPI, Basel, Switzerland. This article is an open access article distributed under the terms and conditions of the Creative Commons Attribution (CC BY) license (https://creativecommons.org/licenses/by/4.0/).
Share and Cite
Lalumbe, L.; Kanyerere, T. Characterisation of Hydro-Geochemical Processes Influencing Groundwater Quality in Rural Areas: A Case Study of Soutpansberg Region, Limpopo Province, South Africa. Water 2022, 14, 1972. https://doi.org/10.3390/w14121972
Lalumbe L, Kanyerere T. Characterisation of Hydro-Geochemical Processes Influencing Groundwater Quality in Rural Areas: A Case Study of Soutpansberg Region, Limpopo Province, South Africa. Water. 2022; 14(12):1972. https://doi.org/10.3390/w14121972
Chicago/Turabian StyleLalumbe, Lindelani, and Thokozani Kanyerere. 2022. "Characterisation of Hydro-Geochemical Processes Influencing Groundwater Quality in Rural Areas: A Case Study of Soutpansberg Region, Limpopo Province, South Africa" Water 14, no. 12: 1972. https://doi.org/10.3390/w14121972