
Inverse Trend in Runoff in the Source Regions of the Yangtze and Yellow Rivers under Changing Environments

 , ,
, ,
Abstract
:1. Introduction
2. Study Area and Datasets
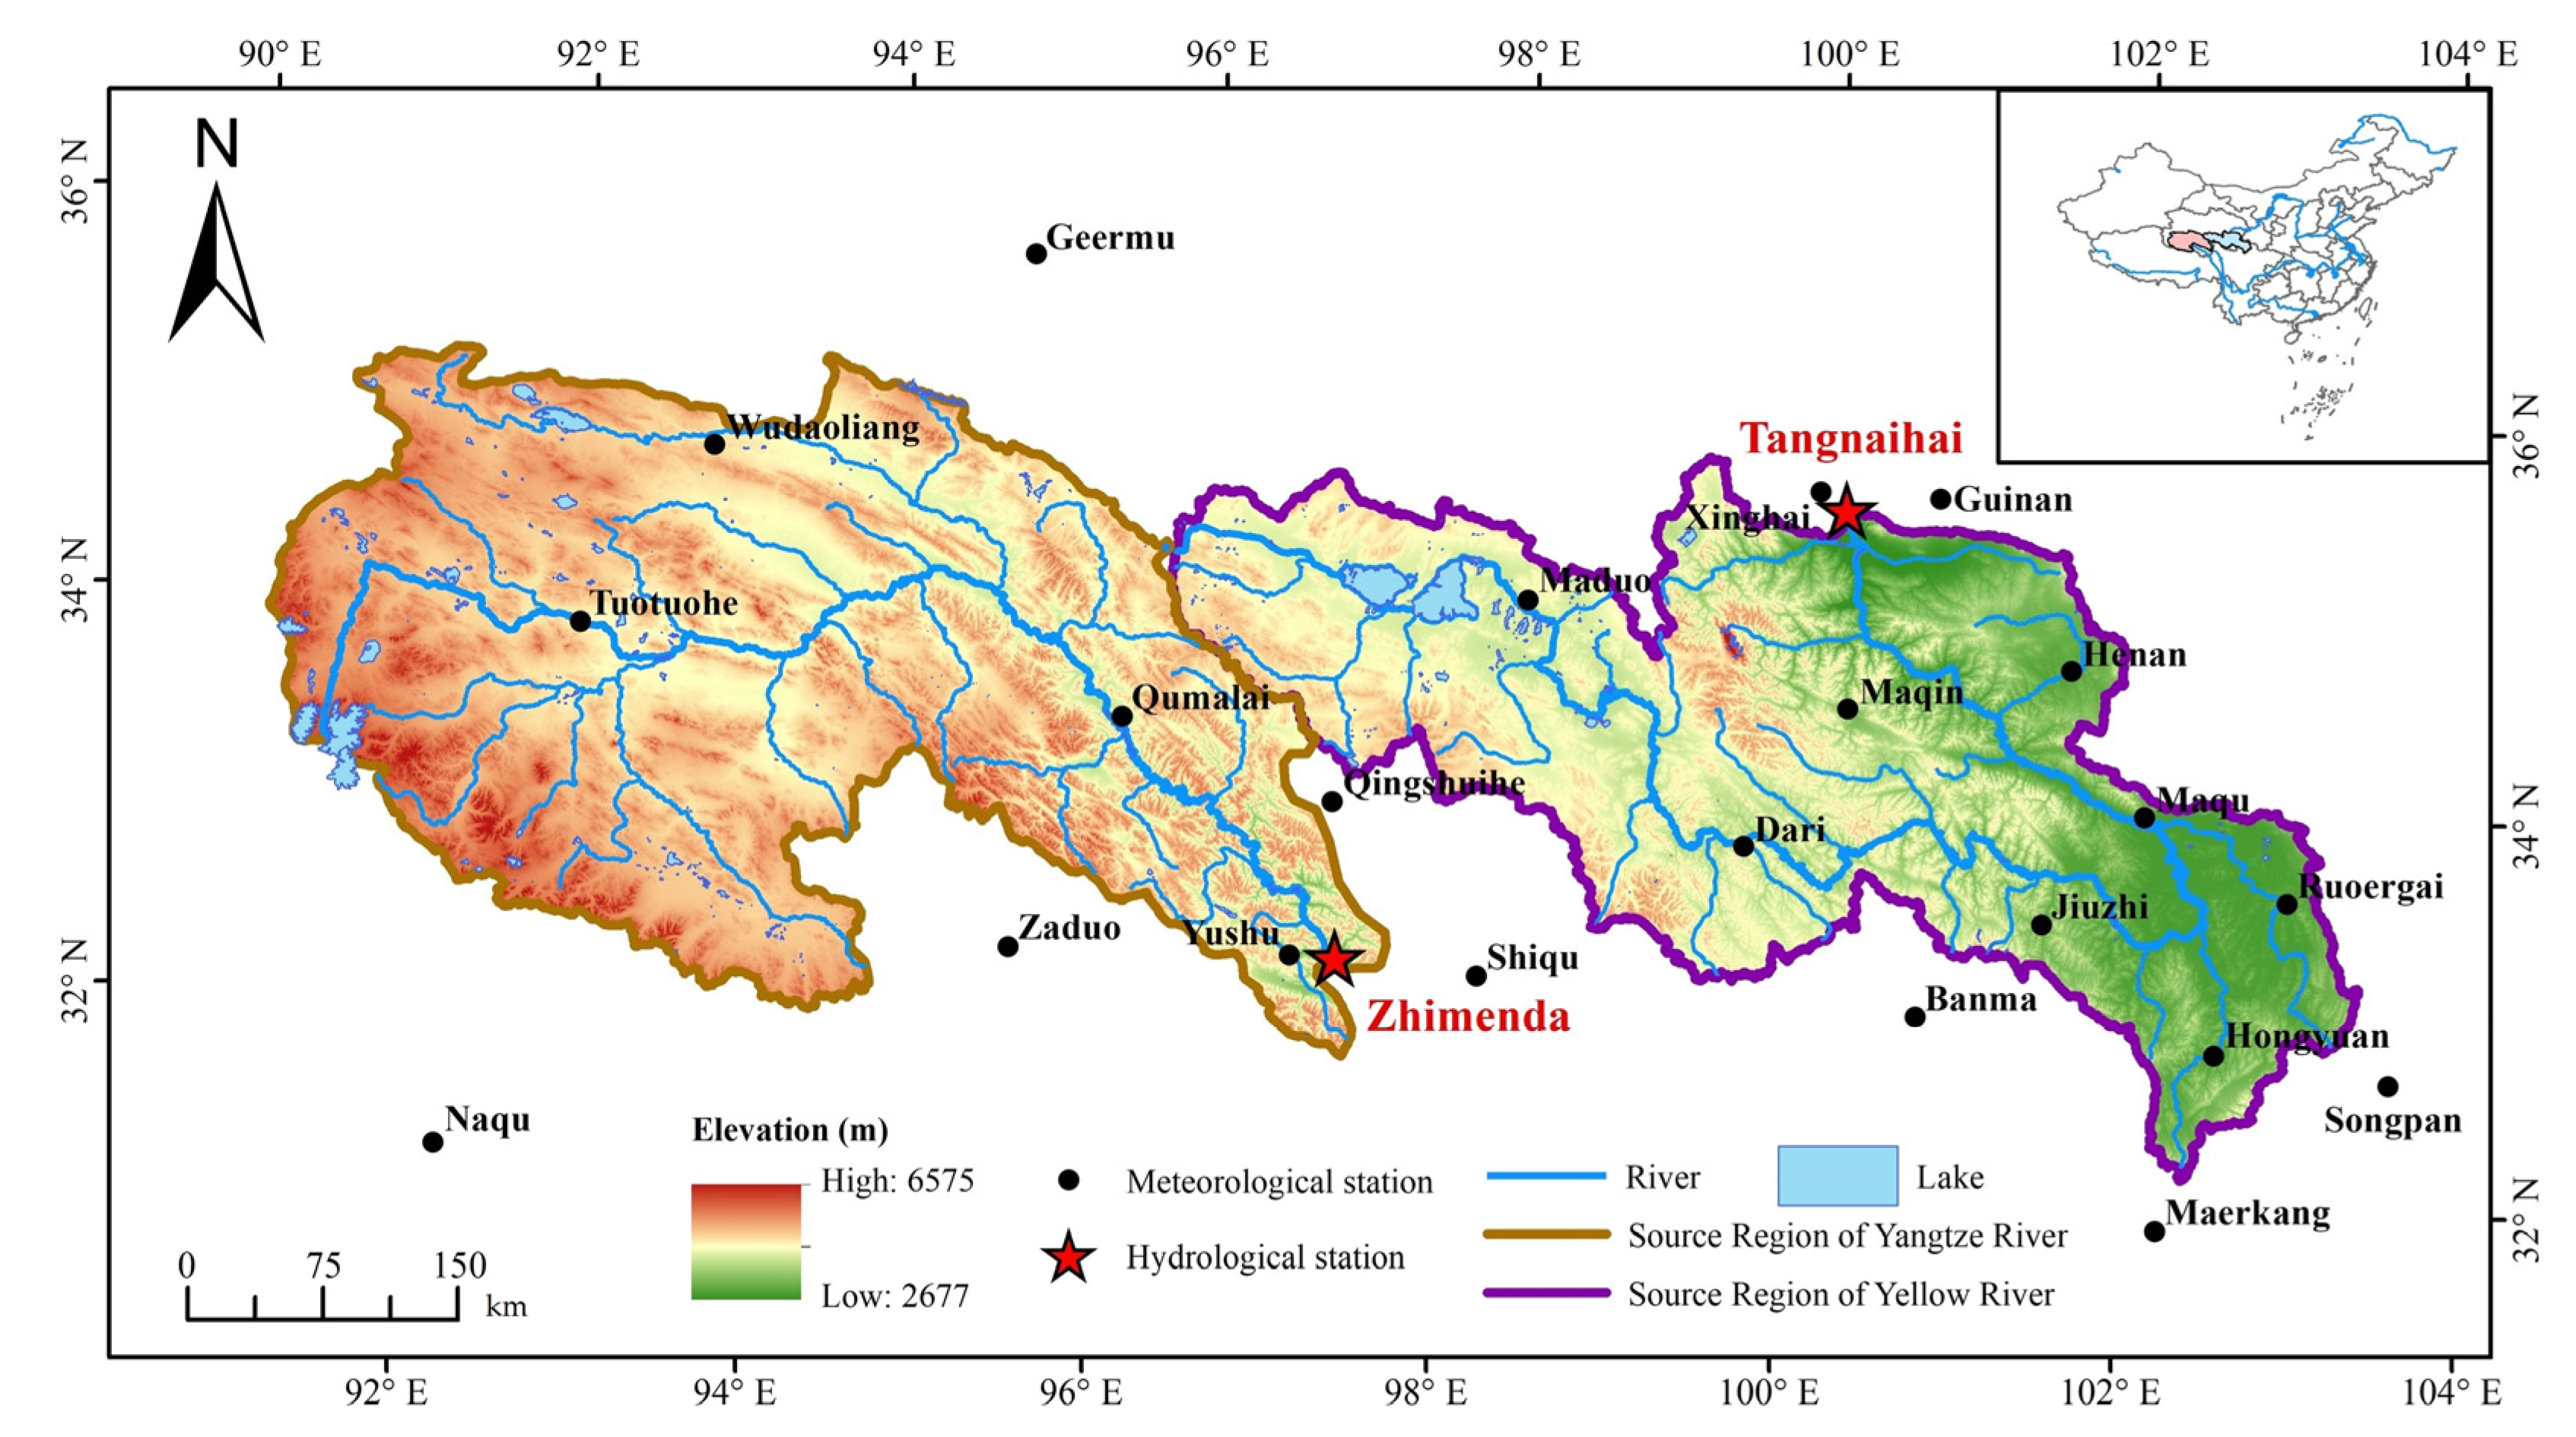
2.1. Study Area
2.2. Data Sources
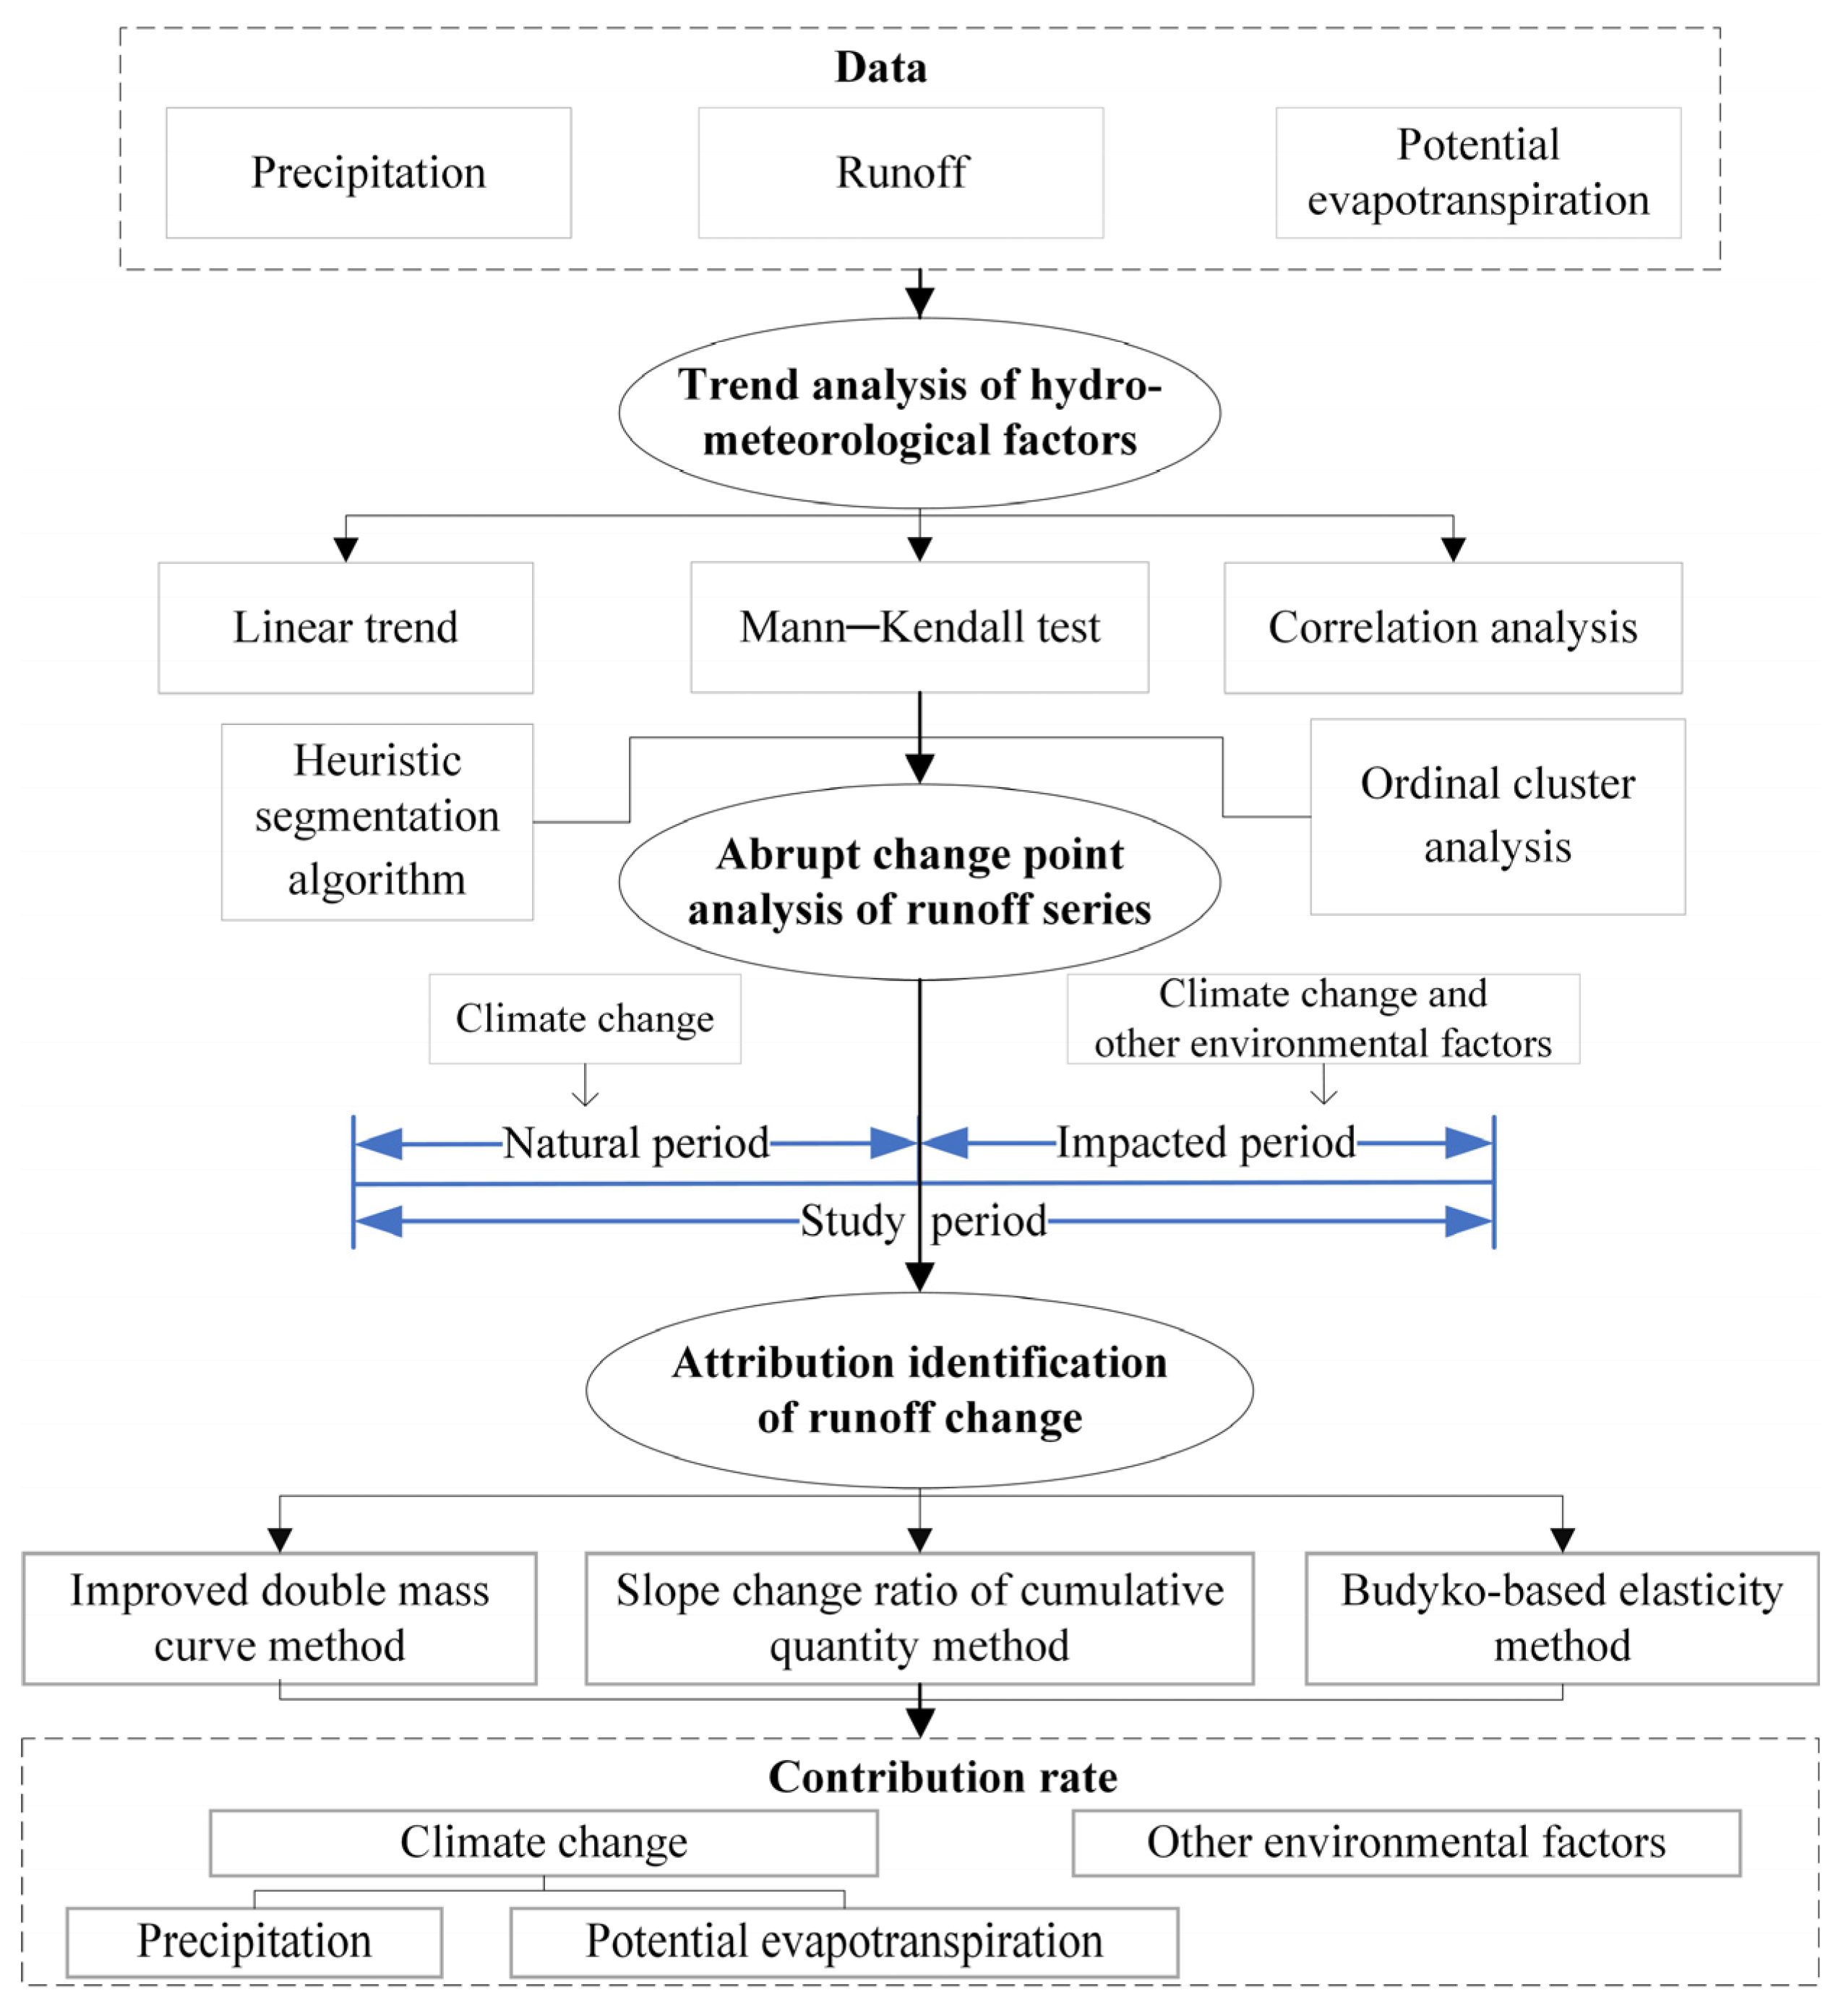
3. Methodology
3.1. Abrupt Change Point Detection
3.2. Statistical Methods for Attribution Analysis of Runoff Changes
3.3. Budyko-Based Elasticity Method
4. Result
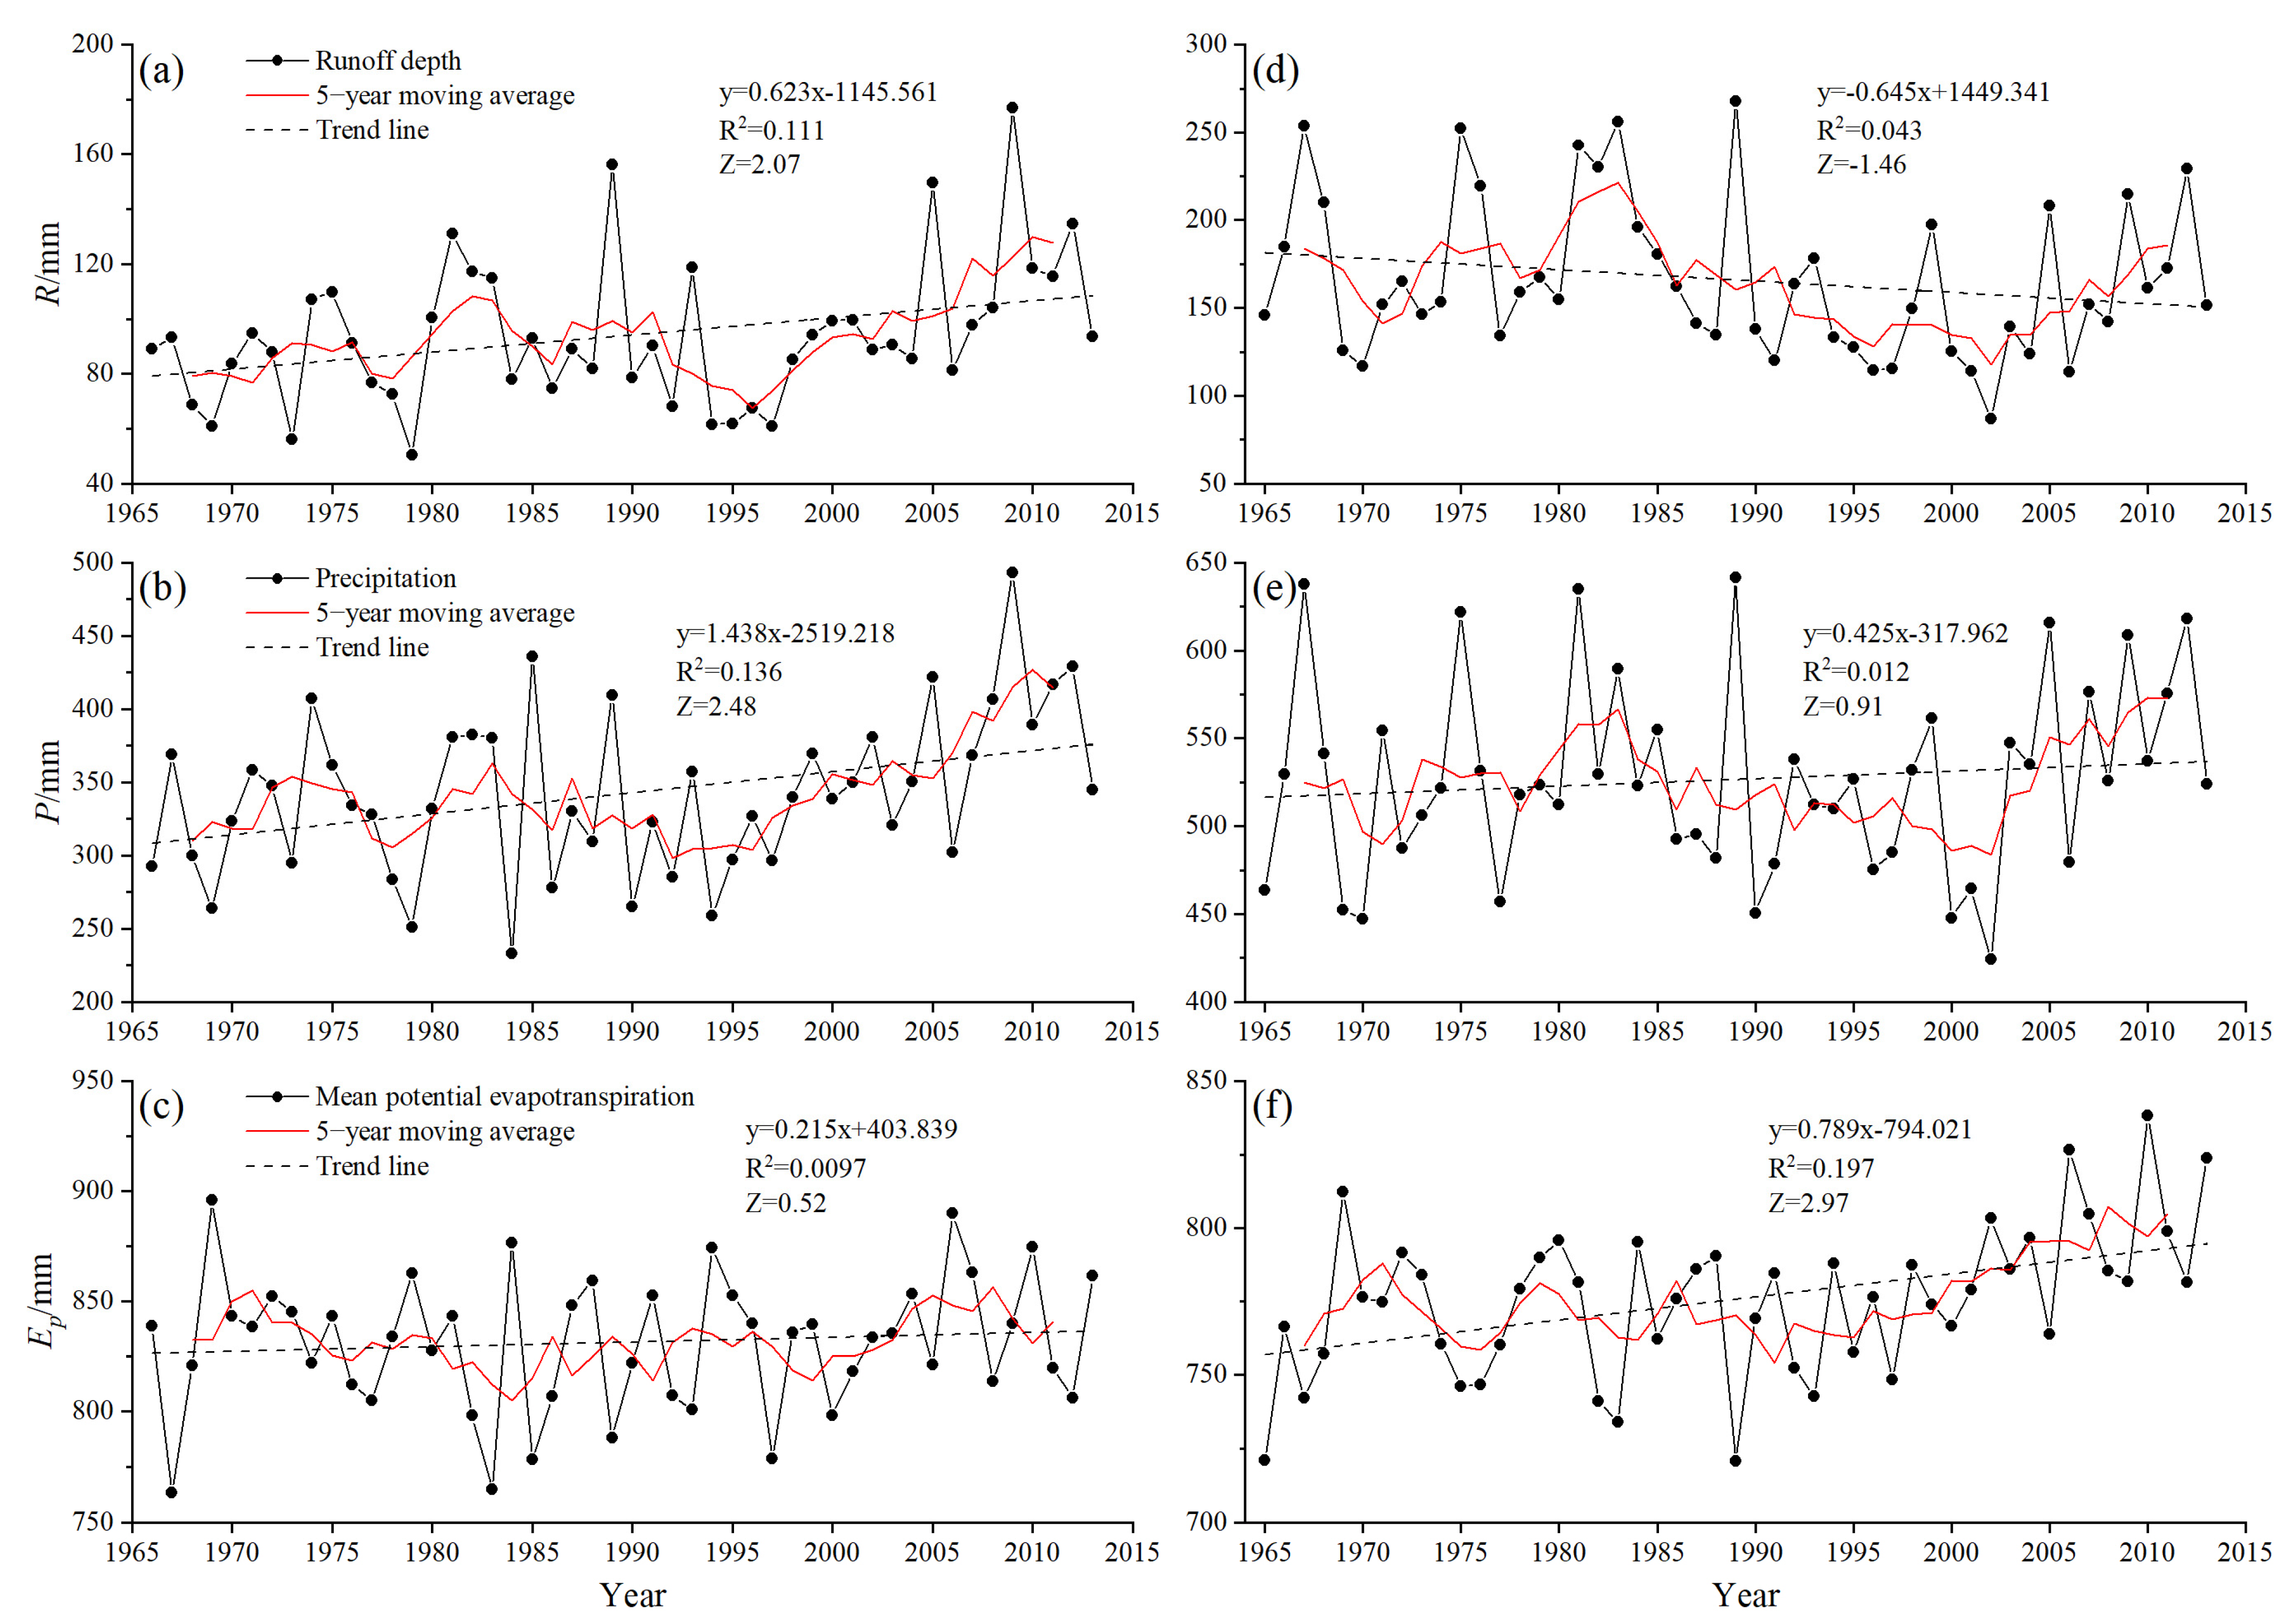
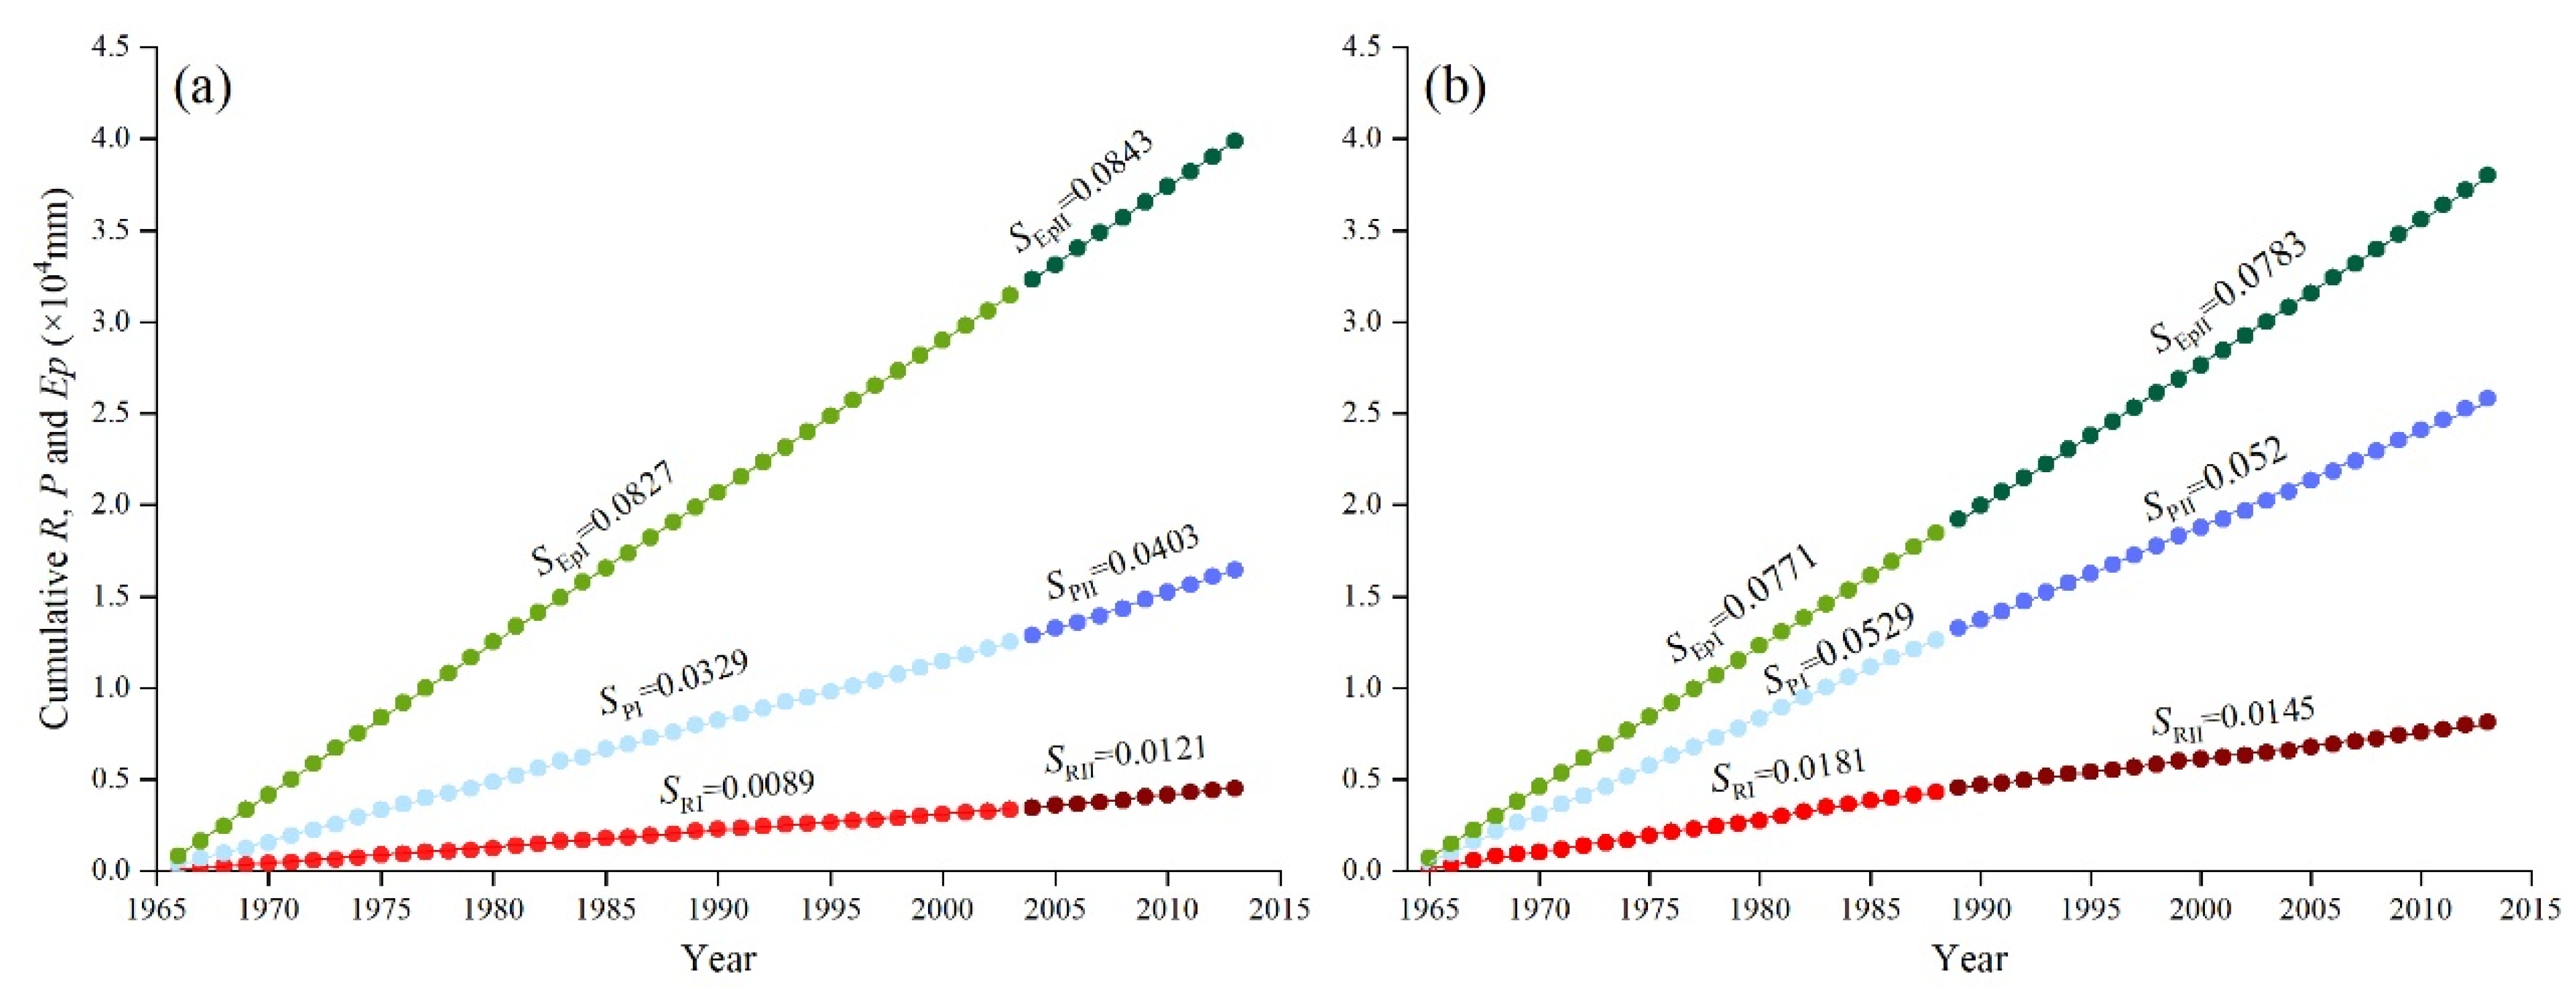
4.1. Variation Characteristics of Hydrometeorological Variables
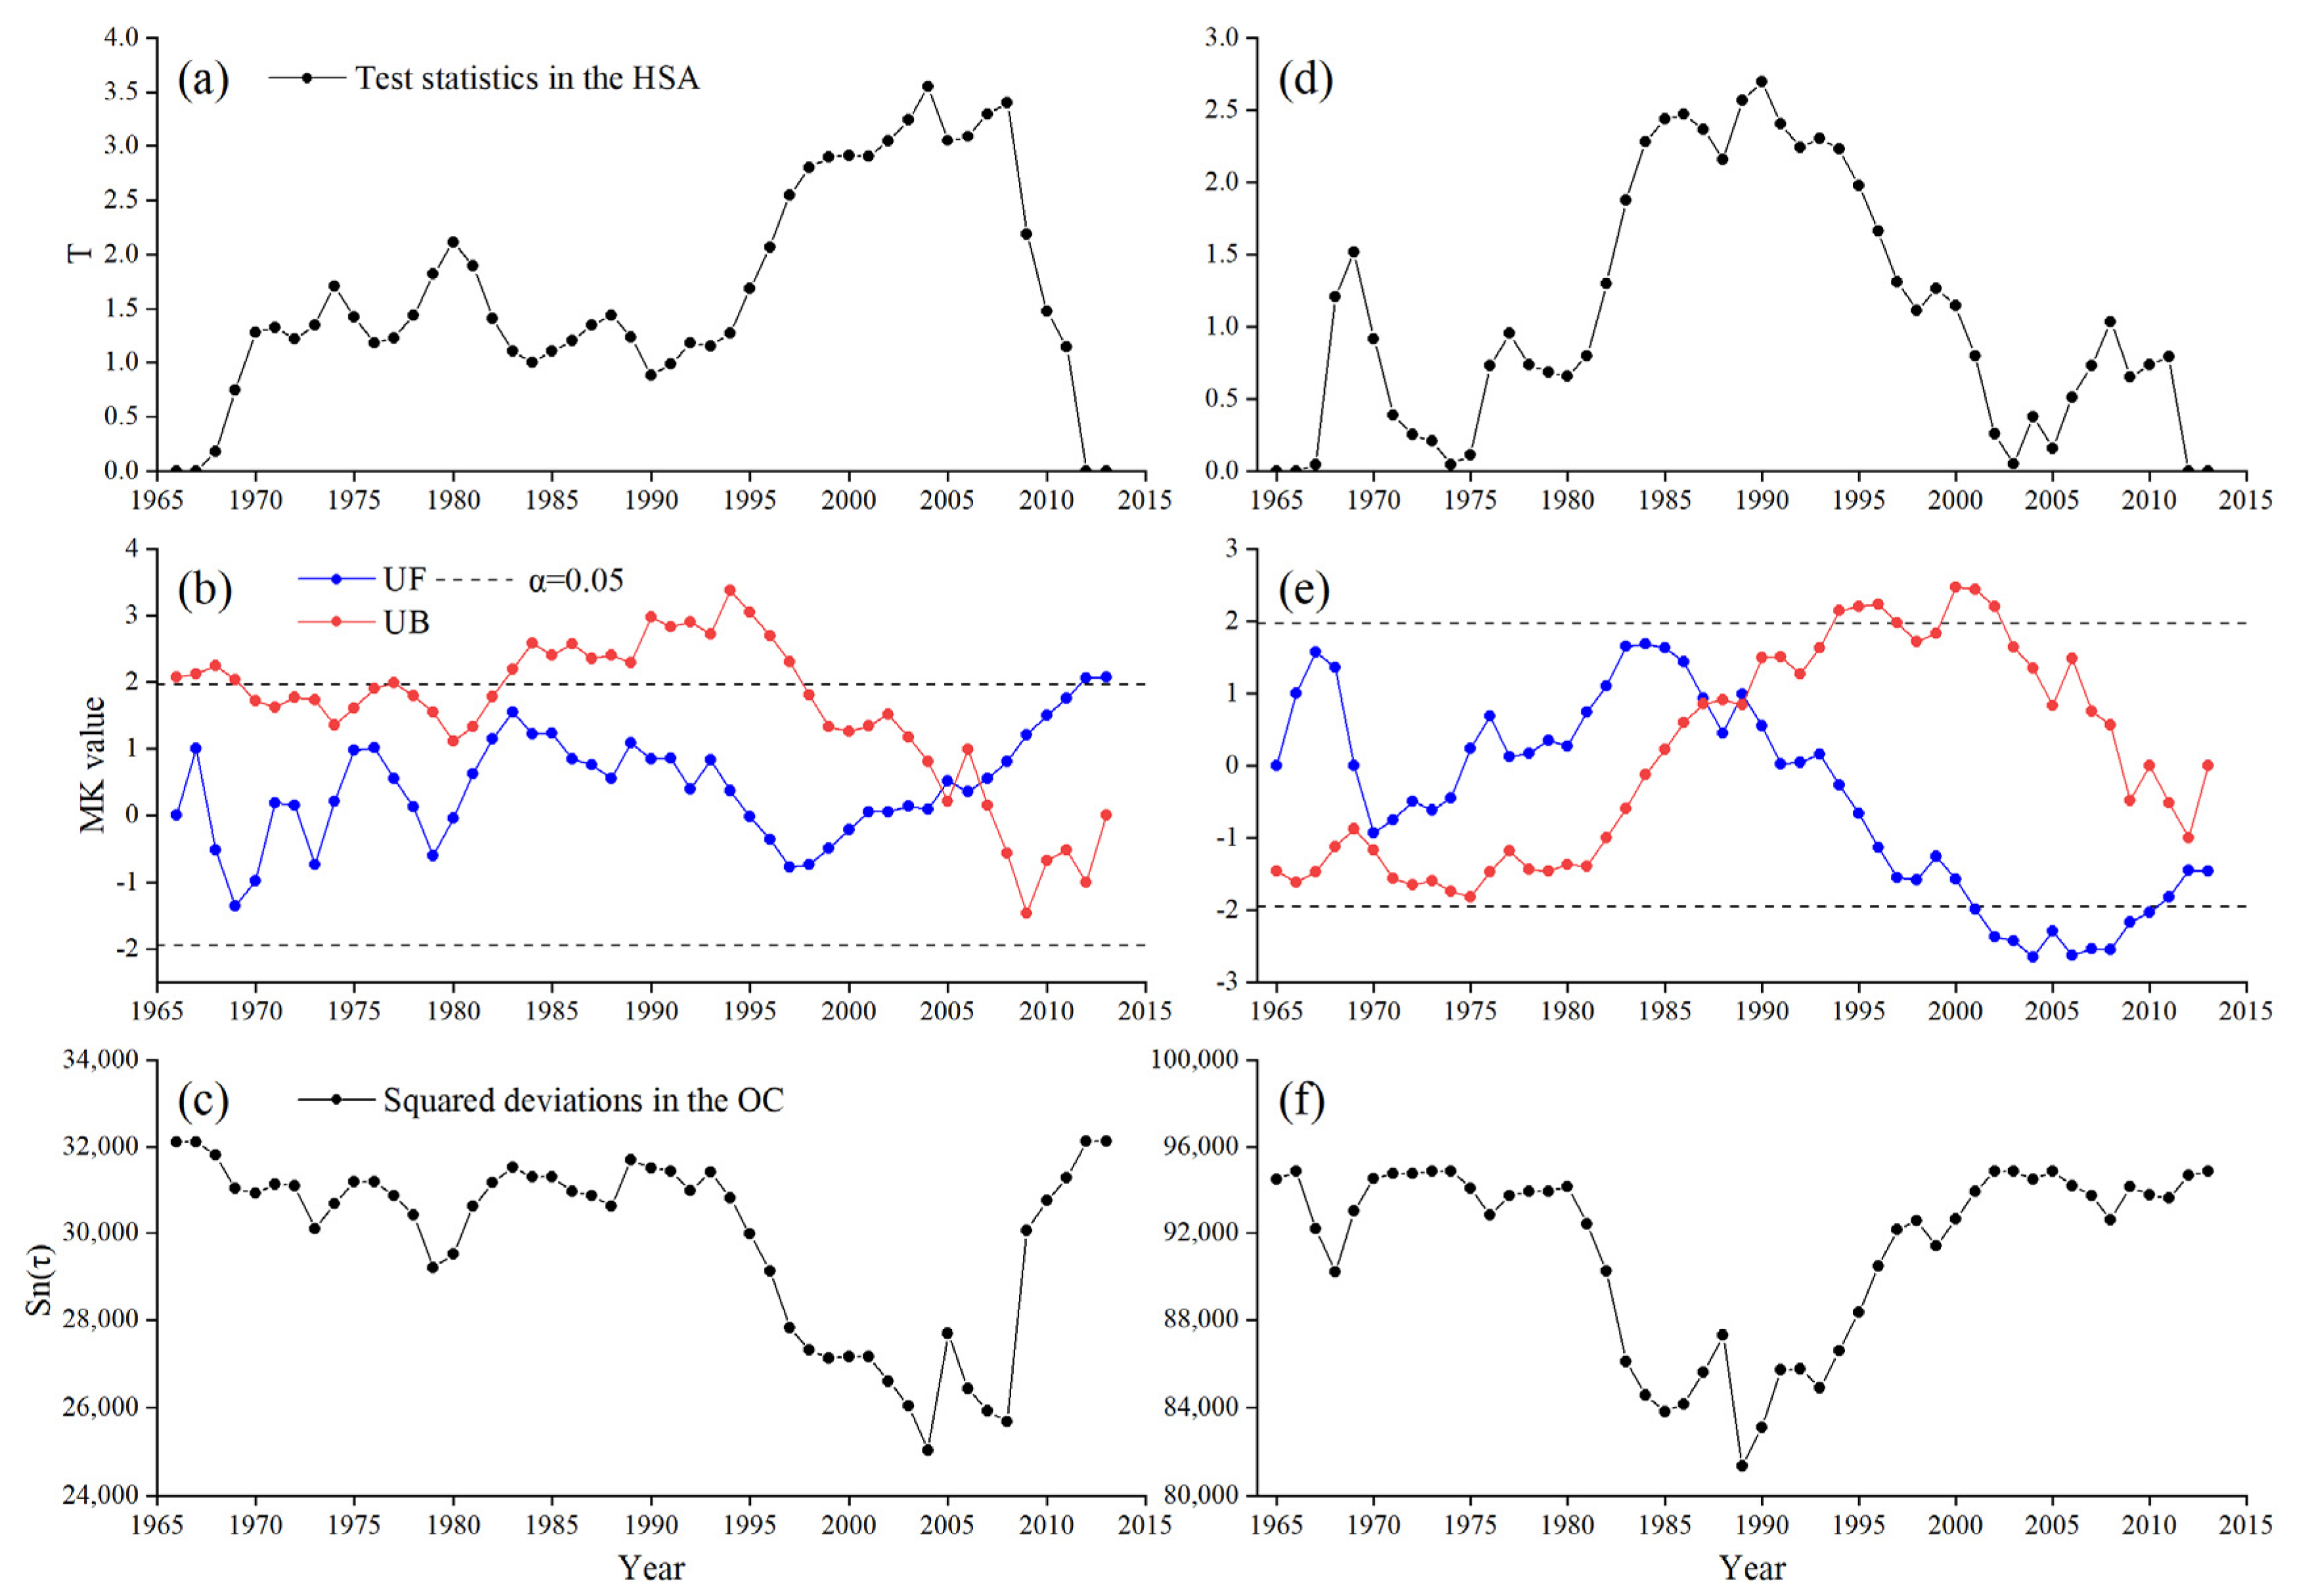
4.2. Change Points Analysis of Runoff Series
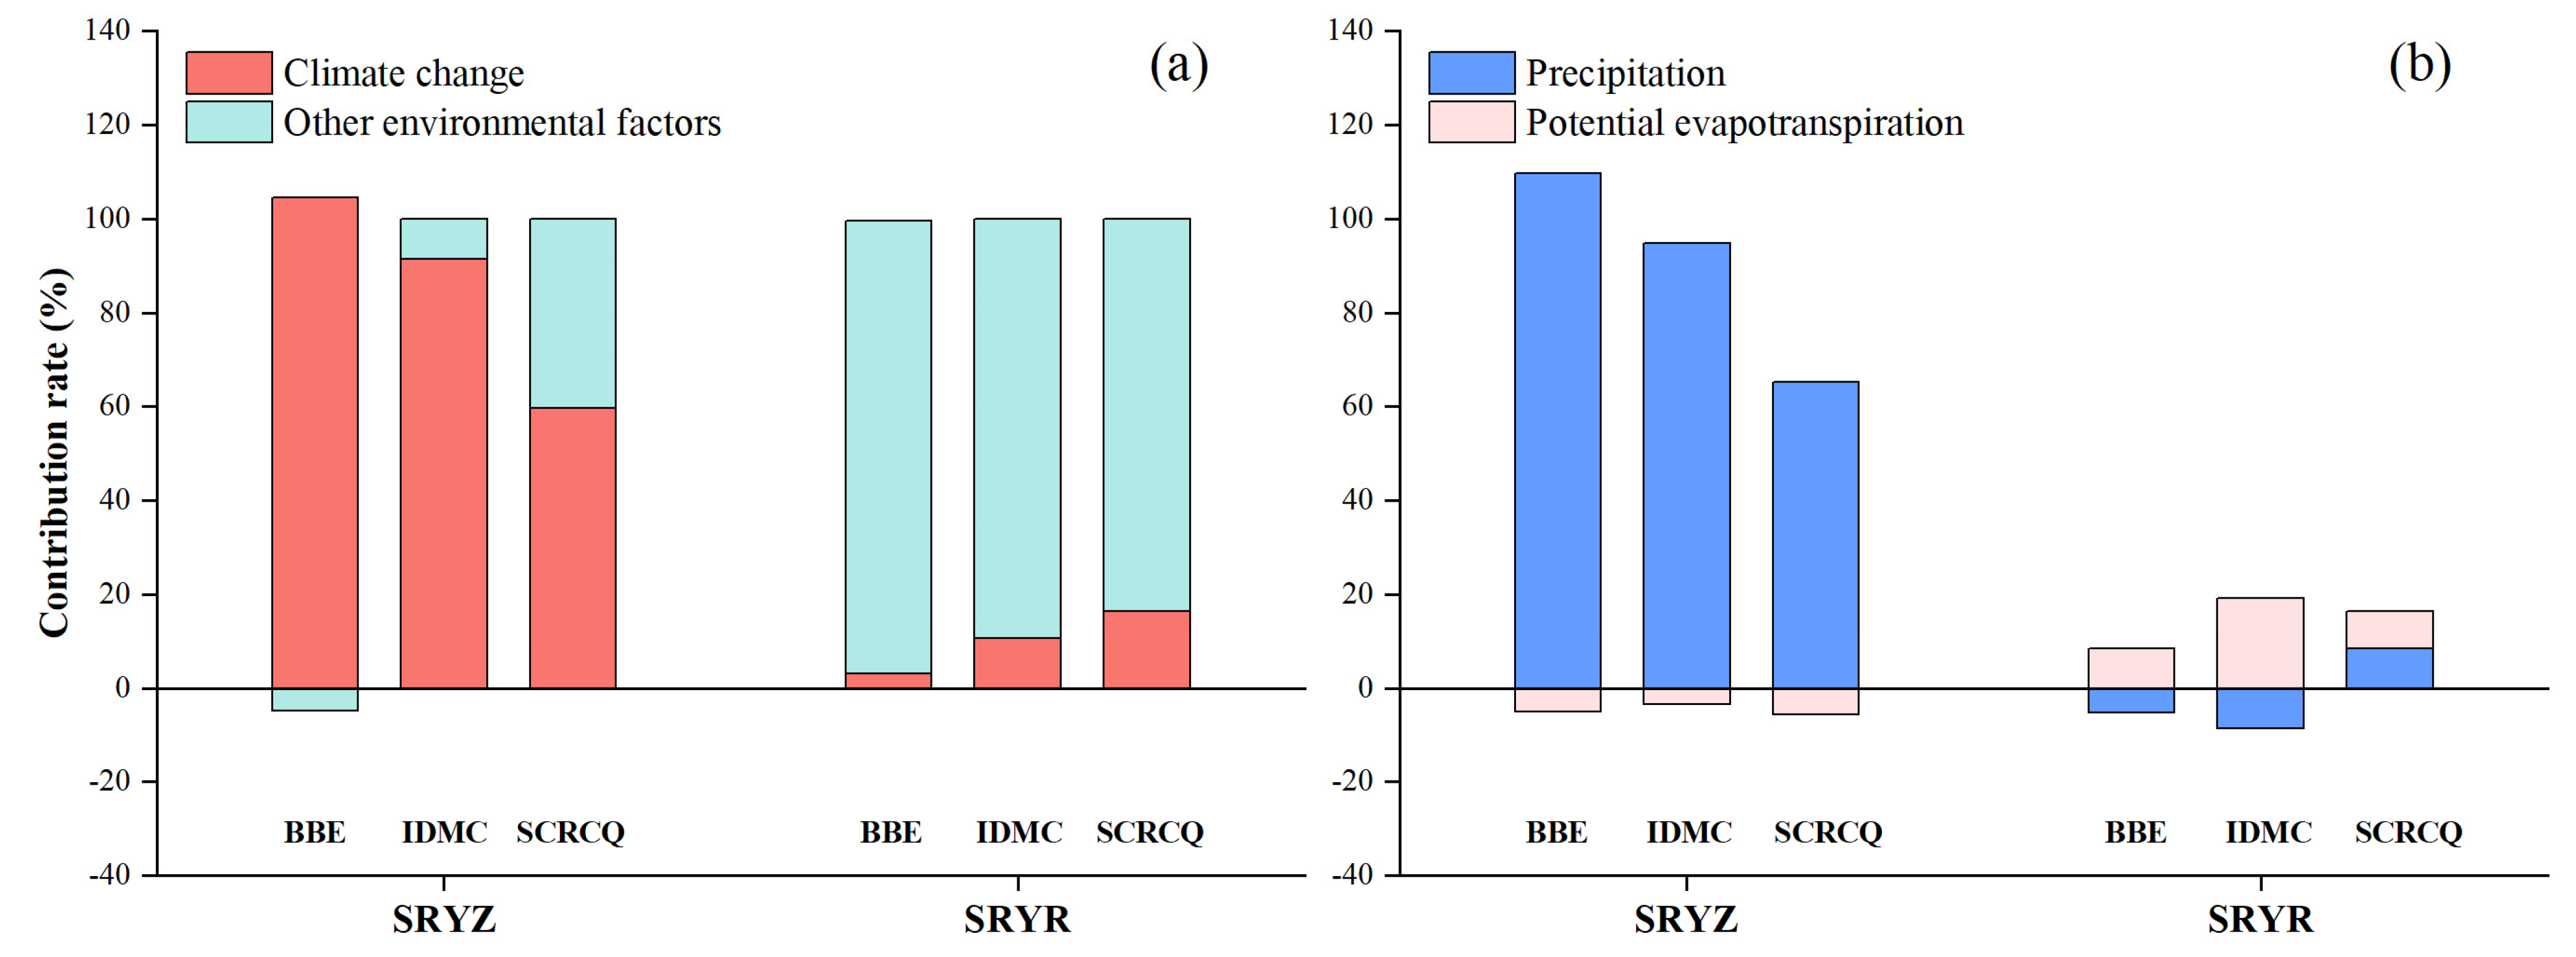
4.3. Contributions of Different Factors to Runoff Variation
5. Discussion
5.1. Influencing Factors of Runoff in the SRYZ
5.2. Influencing Factors of Runoff in the SRYR
5.3. Comparison of Runoff Variation
5.4. Uncertainties and Limitations
6. Conclusions
- (1)
- The annual runoff and precipitation in the SRYZ indicated a significant increasing trend during 1966–2013, while the potential evapotranspiration increased insignificantly. From 1966 to 2013, the annual runoff for SRYR exhibited an insignificant decreasing trend, with the rate of −6.45 mm/10a, whereas potential evapotranspiration increased significantly, with the rate of 7.89 mm/10a.
- (2)
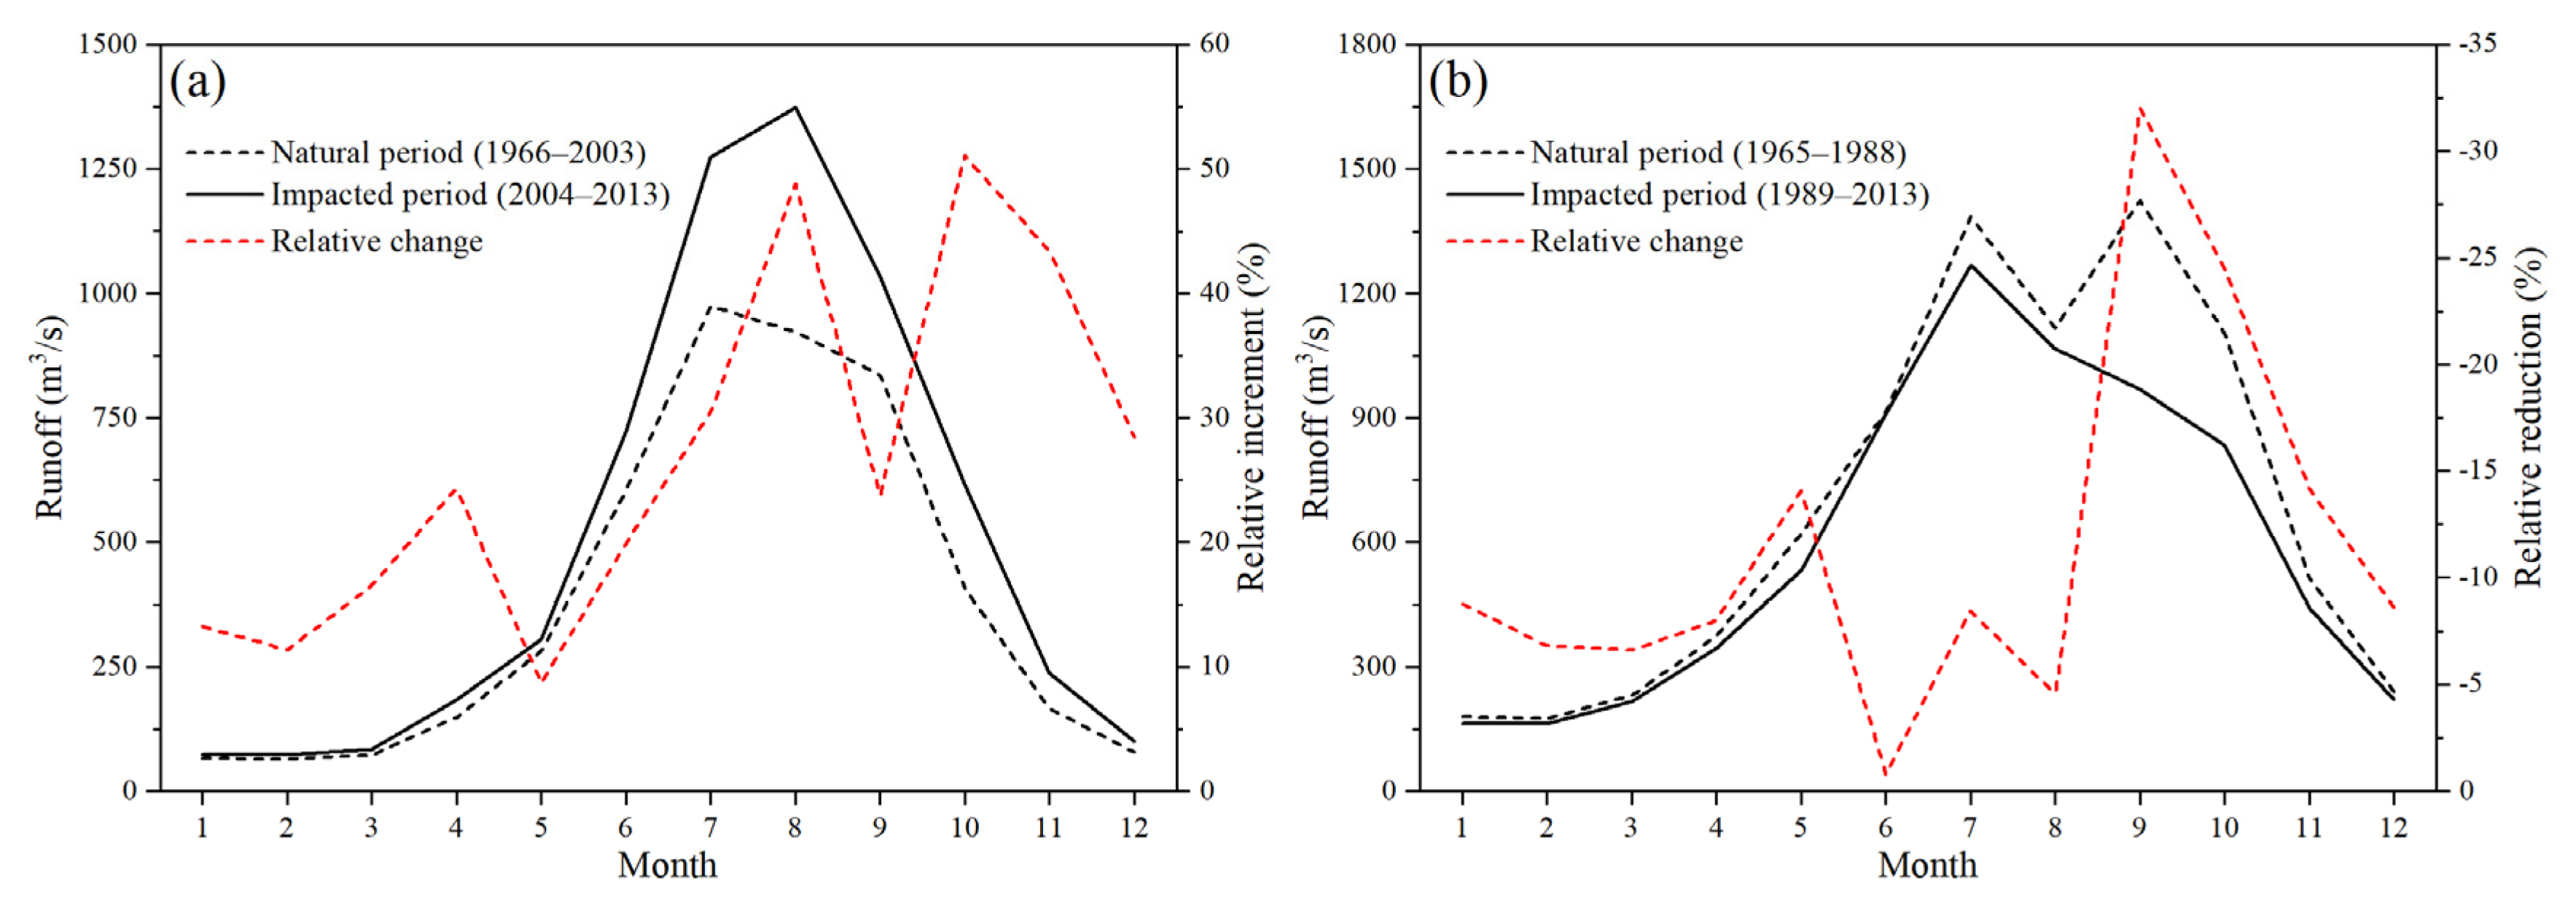
- Runoff in the SRYZ showed an upward trend in all seasons, with the summer runoff increasing significantly. The summer runoff in the SRYR exhibited an insignificant upward trend, and the runoff in the autumn decreased significantly. During the natural period, the intra-annual distribution of runoff in the SRYZ was unimodal and was bimodal in the SRYR.
- (3)
- By evaluating the three mutation detection results comprehensively, it was determined that the annual runoff series in the SRYZ and SRYR changed abruptly in 2004 and 1989, respectively.
- (4)
- Climate change was the dominant factor for runoff variation in the SRYZ, with a contribution of 59.6%~104.6%, while the runoff in the SRYR was mainly controlled by other environmental factors, contributing 83.7%~96.5%. Moreover, precipitation changes accounted for 65.3%~109.6% of the increase in annual runoff in the SRYZ, and the potential evapotranspiration contributed 7.8%−19.2% of runoff variation in the SRYR. Generally, the significant increase of runoff in the SRYZ could be attributed to the precipitation and glacial meltwater, while the decrease of runoff in the SRYR was the combined effects of the permafrost degradation, land desertification and human water consumption.
Author Contributions
Funding
Institutional Review Board Statement
Informed Consent Statement
Data Availability Statement
Conflicts of Interest
References
- Yan, D.; Lai, Z.Z.; Ji, G.X. Using Budyko-Type Equations for Separating the Impacts of Climate and Vegetation Change on Runoff in the Source Area of the Yellow River. Water 2020, 12, 3418. [Google Scholar] [CrossRef]
- Milly, P.C.D.; Dunne, K.A.; Vecchia, A.V. Global pattern of trends in streamflow and water availability in a changing climate. Nature 2005, 438, 347–350. [Google Scholar] [CrossRef] [PubMed]
- Saifullah, M.; Li, Z.J.; Li, Q.L.; Zaman, M.; Hashim, S. Quantitative Estimation of the Impact of Precipitation and Land Surface Change on Hydrological Processes through Statistical Modeling. Adv. Meteorol. 2016, 2016, 6130179. [Google Scholar] [CrossRef] [Green Version]
- Walling, D.E.; Fang, D. Recent trends in the suspended sediment loads of the world’s rivers. Glob. Planet. Chang. 2003, 39, 111–126. [Google Scholar] [CrossRef]
- Mlynski, D.; Cebulska, M.; Walega, A. Trends, Variability, and Seasonality of Maximum Annual Daily Precipitation in the Upper Vistula Basin, Poland. Atmosphere 2018, 9, 313. [Google Scholar] [CrossRef] [Green Version]
- Guo, M.J.; Li, J.; Wang, Y.S.; Bai, P.; Wang, J.W. Distinguishing the Relative Contribution of Environmental Factors to Runoff Change in the Headwaters of the Yangtze River. Water 2019, 11, 1432. [Google Scholar] [CrossRef] [Green Version]
- Abbas, S.A.; Xuan, Y.Q. Impact of Precipitation Pre-Processing Methods on Hydrological Model Performance using High-Resolution Gridded Dataset. Water 2020, 12, 840. [Google Scholar] [CrossRef] [Green Version]
- Zhang, P.P.; Cai, Y.P.; Yang, W.; Yi, Y.J.; Yang, Z.F. Climatic and anthropogenic impacts on water and sediment generation in the middle reach of the Jinsha River Basin. River Res. Appl. 2020, 36, 338–350. [Google Scholar] [CrossRef]
- Zeng, F.; Ma, M.G.; Di, D.R.; Shi, W.Y. Separating the Impacts of Climate Change and Human Activities on Runoff: A Review of Method and Application. Water 2020, 12, 2201. [Google Scholar] [CrossRef]
- Wang, G.Q.; Yan, X.L.; Zhang, J.Y.; Liu, C.S.; Jin, J.L.; Liu, Y.L.; Bao, Z.X. Detecting evolution trends in the recorded runoffs from the major rivers in China during 1950-2010. J. Water Clim. Chang. 2013, 4, 252–264. [Google Scholar] [CrossRef]
- Liang, S.Q.; Wang, W.S.; Zhang, D.; Li, Y.Q.; Wang, G.Q. Quantifying the Impacts of Climate Change and Human Activities on Runoff Variation: Case Study of the Upstream of Minjiang River, China. J. Hydrol. Eng. 2020, 25, 05020025. [Google Scholar] [CrossRef]
- Zhang, K.; Ruben, G.B.; Li, X.; Li, Z.J.; Yu, Z.B.; Xia, J.; Dong, Z.C. A comprehensive assessment framework for quantifying climatic and anthropogenic contributions to streamflow changes: A case study in a typical semi -arid North China basin. Environ. Modell. Softw. 2020, 128, 104704. [Google Scholar] [CrossRef]
- Mokhtar, A.; He, H.M.; Zhao, H.F.; Keo, S.; Bai, C.Y.; Zhang, C.J.; Ma, Y.; Ibrahim, A.; Li, Y.; Li, F.; et al. Risks to water resources and development of a management strategy in the river basins of the Hengduan Mountains, Southwest China. Environ. Sci. Water Res. Technol. 2020, 6, 656–678. [Google Scholar] [CrossRef]
- Li, L.J.; Li, B.; Liang, L.Q.; Li, J.Y.; Liu, Y.M. Effect of climate change and land use on stream flow in the upper and middle reaches of the Taoer River, northeastern China. For. Stud. China 2010, 12, 107–115. [Google Scholar] [CrossRef]
- Jiang, S.H.; Ren, L.L.; Yong, B.; Fu, C.B.; Yang, X.L. Analyzing the effects of climate variability and human activities on runoff from the Laohahe basin in northern China. Hydrol. Res. 2012, 43, 3–13. [Google Scholar] [CrossRef]
- Li, H.J.; Shi, C.X.; Zhang, Y.S.; Ning, T.T.; Sun, P.C.; Liu, X.F.; Ma, X.Q.; Liu, W.; Collins, A.L. Using the Budyko hypothesis for detecting and attributing changes in runoff to climate and vegetation change in the soft sandstone area of the middle Yellow River basin, China. Sci. Total Environ. 2020, 703, 135588. [Google Scholar] [CrossRef] [PubMed]
- Gan, G.J.; Liu, Y.B.; Sun, G. Understanding interactions among climate, water, and vegetation with the Budyko framework. Earth-Sci. Rev. 2020, 212, 103451. [Google Scholar] [CrossRef]
- Jiang, C.; Xiong, L.H.; Wang, D.B.; Liu, P.; Guo, S.L.; Xu, C.Y. Separating the impacts of climate change and human activities on runoff using the Budyko-type equations with time-varying parameters. J. Hydrol. 2015, 522, 326–338. [Google Scholar] [CrossRef]
- Liang, W.; Bai, D.; Wang, F.Y.; Fu, B.J.; Yan, J.P.; Wang, S.; Yang, Y.; Long, D.; Feng, M. Quantifying the impacts of climate change and ecological restoration on streamflow changes based on a Budyko hydrological model in China’s Loess Plateau. Water Resour. Res. 2015, 51, 6500–6519. [Google Scholar] [CrossRef]
- Zuo, D.P.; Xu, Z.X.; Wu, W.; Zhao, J.; Zhao, F.F. Identification of Streamflow Response to Climate Change and Human Activities in the Wei River Basin, China. Water Resour. Manag. 2014, 28, 833–851. [Google Scholar] [CrossRef]
- Liang, W.; Bai, D.; Jin, Z.; You, Y.C.; Li, J.X.; Yang, Y.T. A Study on the Streamflow Change and its Relationship with Climate Change and Ecological Restoration Measures in a Sediment Concentrated Region in the Loess Plateau, China. Water Resour. Manag. 2015, 29, 4045–4060. [Google Scholar] [CrossRef]
- Ma, Y.M.; Han, C.B.; Zhong, L.; Wang, B.B.; Zhu, Z.K.; Wang, Y.J.; Zhang, L.; Meng, C.; Xu, C.; Amatya, P.M. Using MODIS and AVHRR data to determine regional surface heating field and heat flux distributions over the heterogeneous landscape of the Tibetan Plateau. Theor. Appl. Climatol. 2014, 117, 643–652. [Google Scholar] [CrossRef] [Green Version]
- Xu, M.; Kang, S.C.; Chen, X.L.; Wu, H.; Wang, X.Y.; Su, Z.B. Detection of hydrological variations and their impacts on vegetation from multiple satellite observations in the Three-River Source Region of the Tibetan Plateau. Sci. Total Environ. 2018, 639, 1220–1232. [Google Scholar] [CrossRef]
- Chu, H.B.; Wei, J.H.; Qiu, J.; Li, Q.; Wang, G.Q. Identification of the impact of climate change and human activities on rainfall-runoff relationship variation in the Three-River Headwaters region. Ecol. Indic. 2019, 106, 105516. [Google Scholar] [CrossRef]
- Meng, X.H.; Chen, H.; Li, Z.G.; Zhao, L.; Zhou, B.R.; Lv, S.H.; Deng, M.S.; Liu, Y.M.; Li, G.W. Review of Climate Change and Its Environmental Influence on the Three-River Regions. Plateau Meteorol. 2020, 39, 1133–1143. (In Chinese) [Google Scholar]
- Zhang, Y.Y.; Zhang, S.F.; Zhai, X.Y.; Xia, J. Runoff variation and its response to climate change in the Three Rivers Source Region. J. Geogr. Sci. 2012, 22, 781–794. [Google Scholar] [CrossRef]
- Luo, D.L.; Jin, H.J.; Lu, L.Z.; Zhou, J. Spatiotemporal changes in extreme ground surface temperatures and the relationship with air temperatures in the Three-River Source Regions during 1980-2013. Theor. Appl. Climatol. 2016, 123, 885–897. [Google Scholar] [CrossRef]
- Yang, J.P.; Ding, Y.J.; Chen, R.S. Climatic causes of ecological and environmental variations in the source regions of the Yangtze and Yellow Rivers of China. Environ. Geol. 2007, 53, 113–121. [Google Scholar] [CrossRef]
- Shi, H.Y.; Li, T.J.; Wei, J.H.; Fu, W.; Wang, G.Q. Spatial and temporal characteristics of precipitation over the Three-River Headwaters region during 1961-2014. J. Hydrol. Reg. Stud. 2016, 6, 52–65. [Google Scholar] [CrossRef] [Green Version]
- Bai, X.L.; Wei, J.H.; Xie, H.W. Characteristics of wetness/dryness variation and their influences in the Three River Headwaters region. Acta Ecol. Sin. 2017, 37, 8397–8410. (In Chinese) [Google Scholar]
- Zhang, D.; Wang, W.S.; Yu, S.Y.; Liang, S.Q.; Hu, Q.F. Assessment of the Contributions of Climate Change and Human Activities to Runoff Variation: Case Study in Four Subregions of the Jinsha River Basin, China. J. Hydrol. Eng. 2021, 26, 05021024. [Google Scholar] [CrossRef]
- Liu, J.L.; Chen, J.; Xu, J.J.; Lin, Y.R.; Yuan, Z.; Zhou, M.Y. Attribution of Runoff Variation in the Headwaters of the Yangtze River Based on the Budyko Hypothesis. Int. J. Environ. Res. Public Health 2019, 16, 2506. [Google Scholar] [CrossRef] [Green Version]
- Wang, Y.Q.; Yuan, Z.; Xu, J.J.; Yan, B.; Hong, X.F. Research on the attribution identification of source runoff variation in the Yellow River Source Region based on water and energy balance model. In Proceedings of the 5th International Conference on Water Resource and Environment (WRE), Macao, China, 16–19 July 2019; p. 344. [Google Scholar]
- Li, Z.X.; Li, Z.J.; Feng, Q.; Zhang, B.J.; Gui, J.; Xue, J.; Gao, W.D. Runoff dominated by supra-permafrost water in the source region of the Yangtze River using environmental isotopes. J. Hydrol. 2020, 582, 124506. [Google Scholar] [CrossRef]
- Meng, F.C.; Su, F.G.; Yang, D.Q.; Tong, K.; Hao, Z.C. Impacts of recent climate change on the hydrology in the source region of the Yellow River basin. J. Hydrol. Reg. Stud. 2016, 6, 66–81. [Google Scholar] [CrossRef] [Green Version]
- Jiang, C.; Li, D.Q.; Gao, Y.N.; Liu, W.F.; Zhang, L.B. Impact of climate variability and anthropogenic activity on streamflow in the Three Rivers Headwater Region, Tibetan Plateau, China. Theor. Appl. Climatol. 2017, 129, 667–681. [Google Scholar] [CrossRef]
- Bernaola-Galvan, P.; Ivanov, P.C.; Amaral, L.A.N.; Stanley, H.E. Scale invariance in the nonstationarity of human heart rate. Phys. Rev. Lett. 2001, 87, 168105. [Google Scholar] [CrossRef] [Green Version]
- Huang, S.Z.; Huang, Q.; Leng, G.Y.; Liu, S.Y. A nonparametric multivariate standardized drought index for characterizing socioeconomic drought: A case study in the Heihe River Basin. J. Hydrol. 2016, 542, 875–883. [Google Scholar] [CrossRef]
- Zhang, H.W.; Xu, W.; Xu, X.T.; Lu, B.H. Responses of Streamflow to Climate Change and Human Activities in a River Basin, Northeast China. Adv. Meteorol. 2017, 2017, 1023821. [Google Scholar] [CrossRef]
- Choudhury, B.J. Evaluation of an empirical equation for annual evaporation using field observations and results from a biophysical model. J. Hydrol. 1999, 216, 99–110. [Google Scholar] [CrossRef]
- Yang, H.B.; Yang, D.W.; Lei, Z.D.; Sun, F.B. New analytical derivation of the mean annual water-energy balance equation. Water Resour. Res. 2008, 44, 893–897. [Google Scholar] [CrossRef]
- Schaake, J.C. Climate change and U.S. water resources: From climate to flow. Wiley 1990, 89, 129–130. [Google Scholar]
- Fowler, K.J.A.; Peel, M.C.; Western, A.W.; Zhang, L.; Peterson, T.J. Simulating runoff under changing climatic conditions: Revisiting an apparent deficiency of conceptual rainfall-runoff models. Water Resour. Res. 2016, 52, 1820–1846. [Google Scholar] [CrossRef] [Green Version]
- Jiang, Y.C. Analysis of runoff evolution and driving factors in the source region of Yangtze River under climate change. Master’s Thesis, Xihua University, Chengdu, China, 2021. (In Chinese). [Google Scholar]
- Han, L.; Song, K.C.; Zhang, W.J.; Liu, L.; Jiang, H.R. Temporal and Spatial Variations of Hydrological Factors in the Source Area of the Yangtze River and Its Responses to Climate Change. Mt. Res. 2017, 35, 129–141. (In Chinese) [Google Scholar]
- Qian, K.Z.; Wang, X.S.; Lv, J.J.; Wan, L. The wavelet correlative analysis of climatic impacts on runoff in the source region of Yangtze River, in China. Int. J. Climatol. 2014, 34, 2019–2032. [Google Scholar] [CrossRef]
- Duan, S.Q.; Liu, T.; Cao, G.C.; Wu, Q.; Li, Y.; Liu, X.S. Expansion of the lakes and its causes in the source region of the Yangtze River. Arid Zone Res. 2015, 32, 15–22. (In Chinese) [Google Scholar]
- Zhang, Y.; Kang, S.; Grigholm, B.; Zhang, Y.; Kaspari, S.; Morgenstern, U.; Ren, J.; Qin, D.; Mayewski, P.A.; Zhang, Q.; et al. Twentieth-century warming preserved in a Geladaindong mountain ice core, central Tibetan Plateau. Ann. Glaciol. 2016, 57, 70–80. [Google Scholar] [CrossRef] [Green Version]
- Wu, S.S.; Yao, Z.J.; Huang, H.Q.; Liu, Z.F.; Chen, Y.S. Glacier retreat and its effect on stream flow in the source region of the Yangtze River. J. Geogr. Sci. 2013, 23, 849–859. [Google Scholar] [CrossRef]
- Han, P.F.; Long, D.; Han, Z.Y.; Du, M.D.; Dai, L.Y.; Hao, X.H. Improved understanding of snowmelt runoff from the headwaters of China’s Yangtze River using remotely sensed snow products and hydrological modeling. Remote Sens. Environ. 2019, 224, 44–59. [Google Scholar] [CrossRef]
- Shi, R.J.; Yang, H.B.; Yang, D.W. Spatiotemporal variations in frozen ground and their impacts on hydrological components in the source region of the Yangtze River. J. Hydrol. 2020, 590, 125237. [Google Scholar] [CrossRef]
- Zhang, L.L.; Su, F.G.; Yang, D.Q.; Hao, Z.C.; Tong, K. Discharge regime and simulation for the upstream of major rivers over Tibetan Plateau. J. Geophys. Res. Atmos. 2013, 118, 8500–8518. [Google Scholar] [CrossRef]
- Qin, Y.; Yang, D.W.; Gao, B.; Wang, T.H.; Chen, J.S.; Chen, Y.; Wang, Y.H.; Zheng, G.H. Impacts of climate warming on the frozen ground and eco-hydrology in the Yellow River source region, China. Sci. Total Environ. 2017, 605, 830–841. [Google Scholar] [CrossRef] [PubMed] [Green Version]
- Wang, T.H.; Yang, H.B.; Yang, D.W.; Qin, Y.; Wang, Y.H. Quantifying the streamflow response to frozen ground degradation in the source region of the Yellow River within the Budyko framework. J. Hydrol. 2018, 558, 301–313. [Google Scholar] [CrossRef]
- Ji, G.X.; Wu, L.Y.; Wang, L.D.; Yan, D.; Lai, Z.Z. Attribution Analysis of Seasonal Runoff in the Source Region of the Yellow River Using Seasonal Budyko Hypothesis. Land 2021, 10, 542. [Google Scholar] [CrossRef]
- Haddeland, I.; Heinke, J.; Biemans, H.; Eisner, S.; Florke, M.; Hanasaki, N.; Konzmann, M.; Ludwig, F.; Masaki, Y.; Schewe, J.; et al. Global water resources affected by human interventions and climate change. Proc. Natl. Acad. Sci. USA 2014, 111, 3251–3256. [Google Scholar] [CrossRef] [Green Version]
- Zhang, S.F.; Jia, S.F.; Liu, C.M.; Cao, W.B.; Hao, F.H.; Liu, J.Y.; Yan, H.Y. Study on the changes of water cycle and its impacts in the source region of the Yellow River. Sci. China Ser. E Technol. Sci. 2004, 47, 142–151. [Google Scholar] [CrossRef]
- Guo, B.; Wei, C.X.; Yu, Y.; Liu, Y.F.; Li, J.L.; Meng, C.; Cai, Y.M. The dominant influencing factors of desertification changes in the source region of Yellow River: Climate change or human activity? Sci. Total Environ. 2022, 813, 152512. [Google Scholar] [CrossRef]
- Ma, L.J.; Liu, Z.; Zhao, B.F.; Lyu, J.W.; Zheng, F.M.; Xu, W.; Gan, X.B. Variations of runoff and sediment and their response to human activities in the source region of the Yellow River, China. Environ. Earth Sci. 2021, 80, 552. [Google Scholar] [CrossRef]
- Lan, Y.C.; Kang, E.S.; Ma, Q.J.; Yang, W.H.; Yao, Z.Z. Runoff Forecast Model for Inflow to the Longyangxia Reservoir in the Upper Yellow River Basin During Spring. J. Glaciol. Geocryol. 1999, 21, 391–395. (In Chinese) [Google Scholar]
- Zhao, E.R.; Chen, H.C.; Zhu, S.L.; Zhao, L.Q. Analysis on Variations of Runoff and Reasons of Headwater Region of the Yellow River. Yellow River 2007, 29, 15–16. (In Chinese) [Google Scholar]
- Zhou, D.G.; Huang, R.H. Exploration of Reason of Runoff Decrease in the Source Regions of the Yellow River. Clim. Environ. Res. 2006, 11, 302–309. (In Chinese) [Google Scholar]
- Wu, X.L.; Zhang, X.; Xiang, X.H.; Zhang, K.; Jin, H.J.; Chen, X.; Wang, C.H.; Shao, Q.Q.; Hua, W.J. Changing runoff generation in the source area of the Yellow River: Mechanisms, seasonal patterns and trends. Cold Reg. Sci. Technol. 2018, 155, 58–68. [Google Scholar] [CrossRef]
- Hu, Y.R.; Maskey, S.; Uhlenbrook, S.; Zhao, H.L. Streamflow trends and climate linkages in the source region of the Yellow River, China. Hydrol. Process. 2011, 25, 3399–3411. [Google Scholar] [CrossRef]
- Xie, C.W.; Ding, Y.J.; Liu, S.Y.; Wang, G.X. Comparison Analysis of Runoff Change in the Source Regions of the Yangtze and Yellow Rivers. J. Glaciol. Geocryol. 2003, 25, 414–422. (In Chinese) [Google Scholar]
- Wu, Y.H.; Qin, N.S.; Peng, X.B. Similarities and Differences of Runoff Changes in the Source Region of the Yangtze River and the Yellow River. Plateau Mt. Meteorol. Res. 2021, 41, 43–47. (In Chinese) [Google Scholar]
- Liang, X.W.; Yang, M.X.; Wan, G.N.; Wang, X.J.; Li, Q. Research on the homogeneity of air temperature series over Tibetan Plateau. J. Glaciol. Geocryol. 2015, 37, 275–285. [Google Scholar]
- Hu, J.; Ma, J.; Nie, C.; Xue, L.; Zhang, Y.; Ni, F.; Deng, Y.; Liu, J.; Zhou, D.; Li, L.; et al. Attribution Analysis of Runoff Change in Min-Tuo River Basin based on SWAT model simulations, China. Sci. Rep. 2020, 10, 2900. [Google Scholar] [CrossRef] [Green Version]
- Xu, X.Y.; Yang, D.W.; Yang, H.B.; Lei, H.M. Attribution analysis based on the Budyko hypothesis for detecting the dominant cause of runoff decline in Haihe basin. J. Hydrol. 2014, 510, 530–540. [Google Scholar] [CrossRef]


| Region | Result | Spring | Summer | Autumn | Winter |
|---|---|---|---|---|---|
| SRYZ | Trend (mm/10a) | 0.277 | 4.377 | 1.482 | 0.126 |
| Z | 1.289 | 2.142 * | 1.573 | 1.484 | |
| SRYR | Trend (mm/10a) | −1.226 | 0.057 | −5.100 | −0.177 |
| Z | −1.845 | −0.259 | −1.974 * | −0.948 |
| Region | Natural Period | Impacted Period | k1 | k2 | c | |||
|---|---|---|---|---|---|---|---|---|
| SRYZ | 1966–2003 | 2004–2013 | 0.41 | −0.06 | −27.77 | 26.29 | −0.94 | 27.73 |
| SRYR | 1965–1988 | 1989–2013 | 0.93 | −0.40 | −11.93 | 2.14 | −4.78 | −24.89 |
| Region | Period | R/mm | P/mm | Ep/mm | n | Ep/P | εP | εEp | εn |
|---|---|---|---|---|---|---|---|---|---|
| SRYZ | 1966–2003 | 87.99 | 328.81 | 827.73 | 1.04 | 2.52 | 1.76 | −0.76 | −1.55 |
| 2004–2013 | 115.72 | 392.20 | 844.28 | 1.05 | 2.15 | 1.73 | −0.73 | −1.40 | |
| SRYR | 1965–1988 | 178.47 | 525.28 | 769.52 | 1.19 | 1.46 | 1.76 | −0.76 | −1.10 |
| 1989–2013 | 153.58 | 527.58 | 781.39 | 1.35 | 1.48 | 1.91 | −0.91 | −1.19 |
| Region | Natural Period | Impacted Period | ΔRP | ΔREp | ΔRn | Re (%) | ηP (%) | ηEp (%) | ηo (%) | ηc (%) |
|---|---|---|---|---|---|---|---|---|---|---|
| SRYZ | 1966–2003 | 2004–2013 | 30.40 | −1.40 | −1.36 | −0.3 | 109.6 | −5.0 | −4.9 | 0.3 |
| SRYR | 1965–1988 | 1989–2013 | 1.32 | −2.09 | −24.02 | −0.4 | −5.3 | 8.4 | 96.5 | 0.4 |
Publisher’s Note: MDPI stays neutral with regard to jurisdictional claims in published maps and institutional affiliations. |
© 2022 by the authors. Licensee MDPI, Basel, Switzerland. This article is an open access article distributed under the terms and conditions of the Creative Commons Attribution (CC BY) license (https://creativecommons.org/licenses/by/4.0/).
Share and Cite
Wu, H.; Bao, Z.; Wang, J.; Wang, G.; Liu, C.; Yang, Y.; Zhang, D.; Liang, S.; Zhang, C. Inverse Trend in Runoff in the Source Regions of the Yangtze and Yellow Rivers under Changing Environments. Water 2022, 14, 1969. https://doi.org/10.3390/w14121969
Wu H, Bao Z, Wang J, Wang G, Liu C, Yang Y, Zhang D, Liang S, Zhang C. Inverse Trend in Runoff in the Source Regions of the Yangtze and Yellow Rivers under Changing Environments. Water. 2022; 14(12):1969. https://doi.org/10.3390/w14121969
Chicago/Turabian StyleWu, Houfa, Zhenxin Bao, Jie Wang, Guoqing Wang, Cuishan Liu, Yanqing Yang, Dan Zhang, Shuqi Liang, and Chengfeng Zhang. 2022. "Inverse Trend in Runoff in the Source Regions of the Yangtze and Yellow Rivers under Changing Environments" Water 14, no. 12: 1969. https://doi.org/10.3390/w14121969