
Effect of Consistency Limit on the Strength of Cement-Solidified Dredged Sludge: Modelling and Micro-Mechanism

 ,
,
Abstract
:1. Introduction
2. Materials and Methods
2.1. Raw Materials
2.2. Mix Design and Samples Preparation
2.3. Testing Methods
3. Results and Discussion
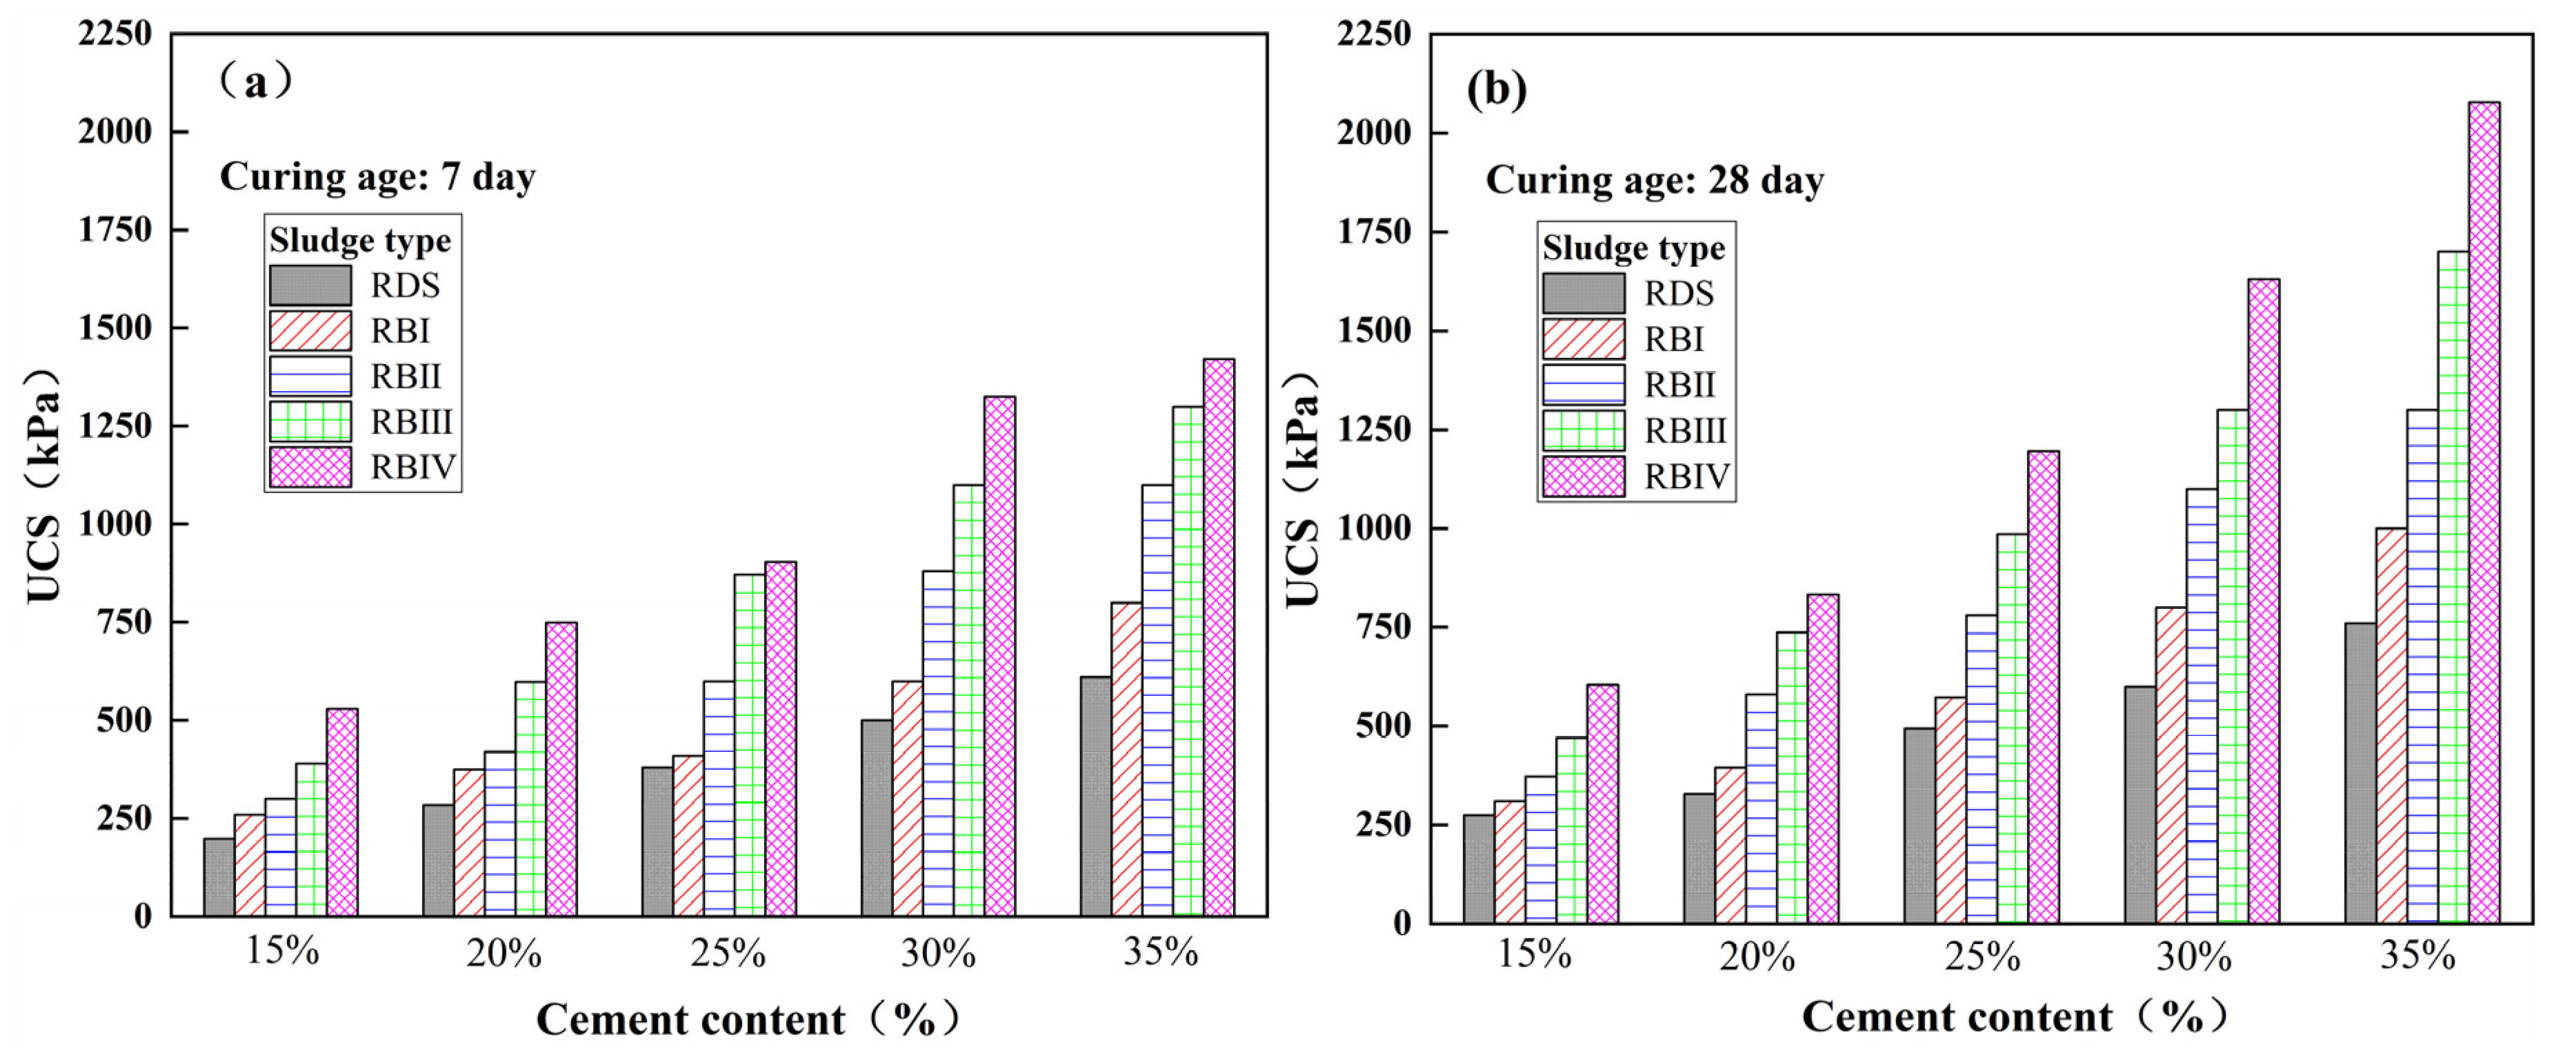
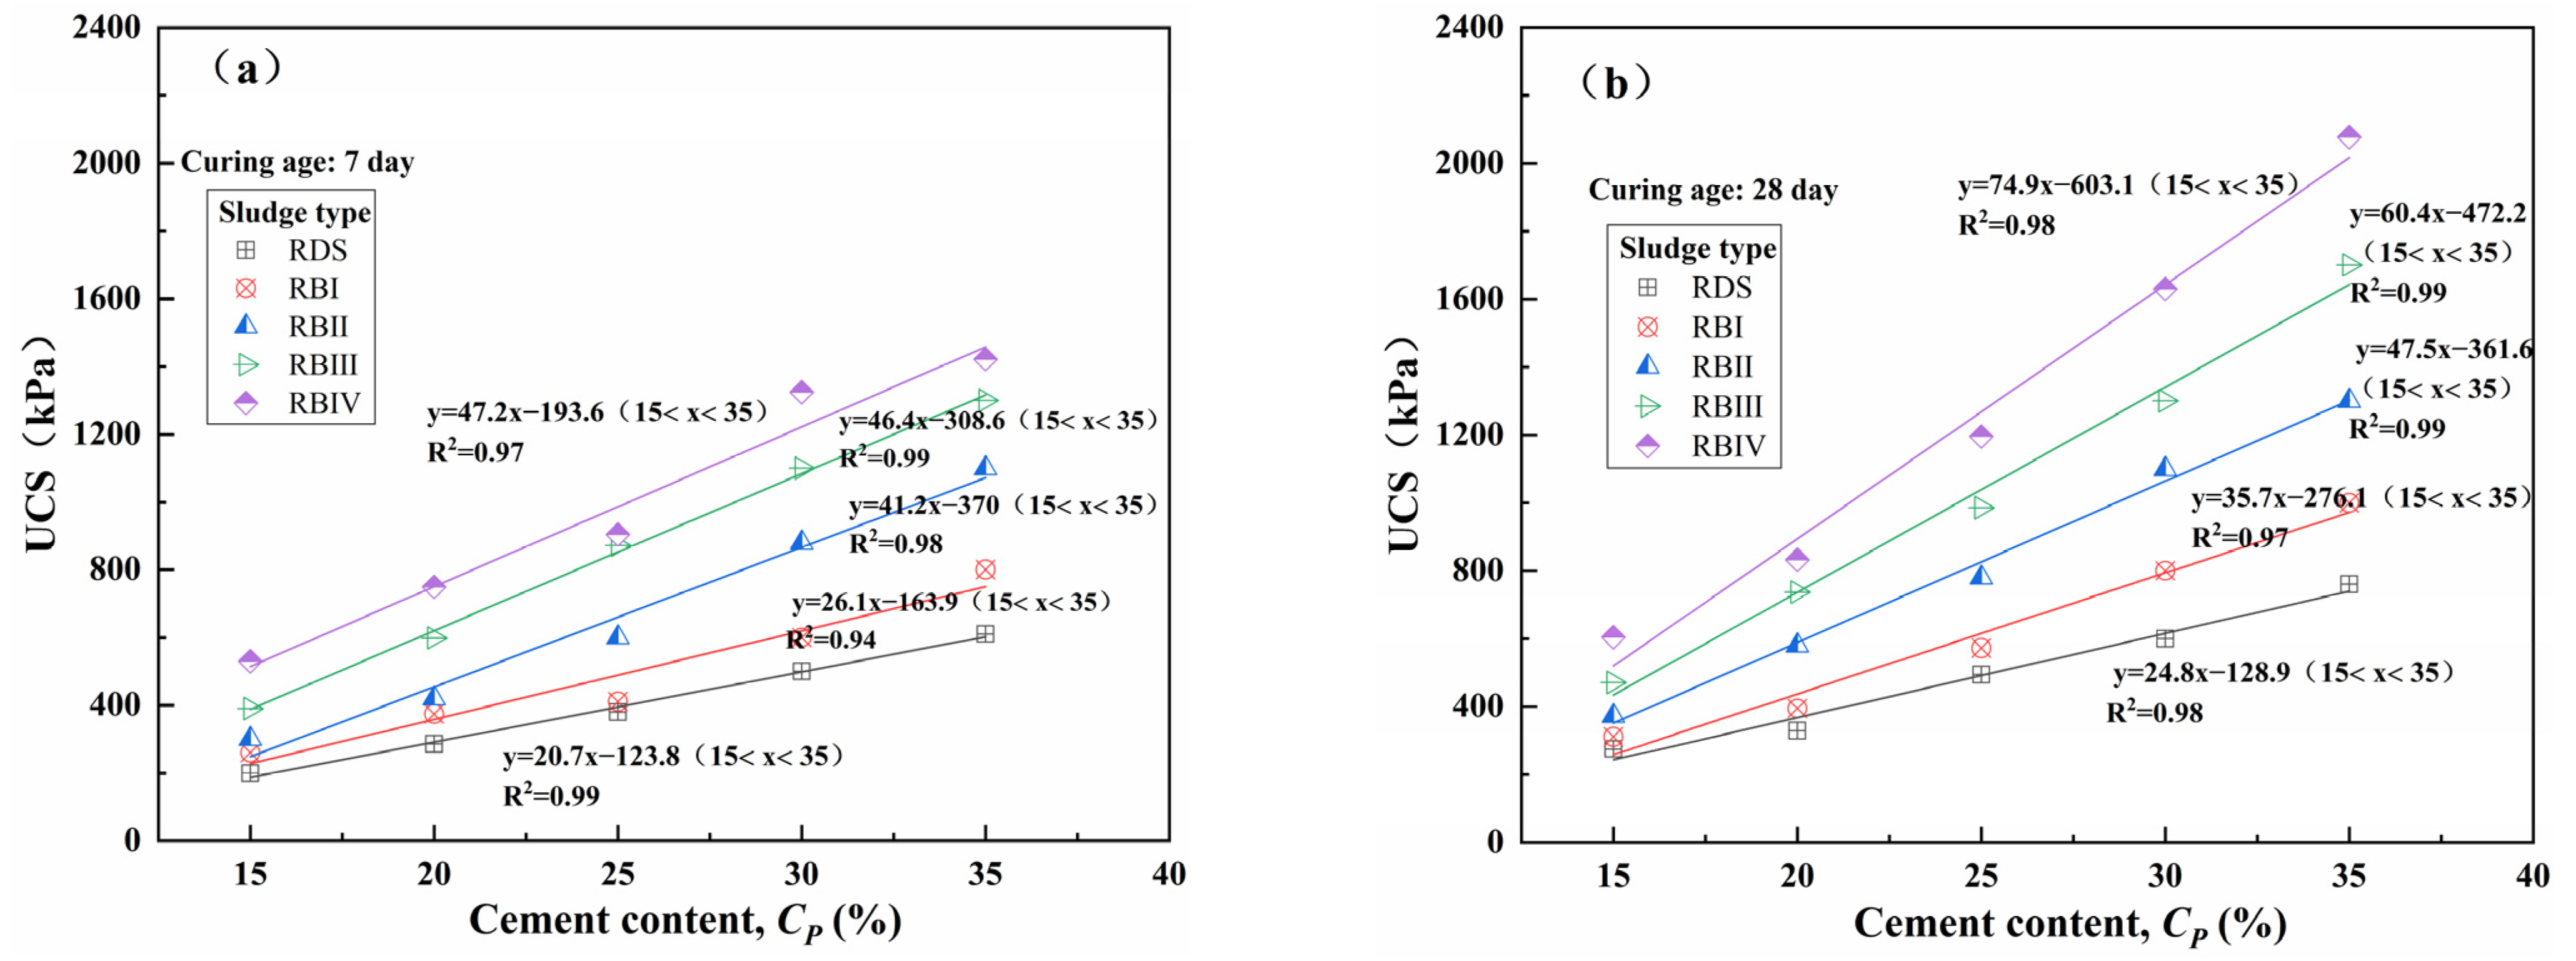
3.1. Curing Strength Development of Different Types of Sludge with Cement Content
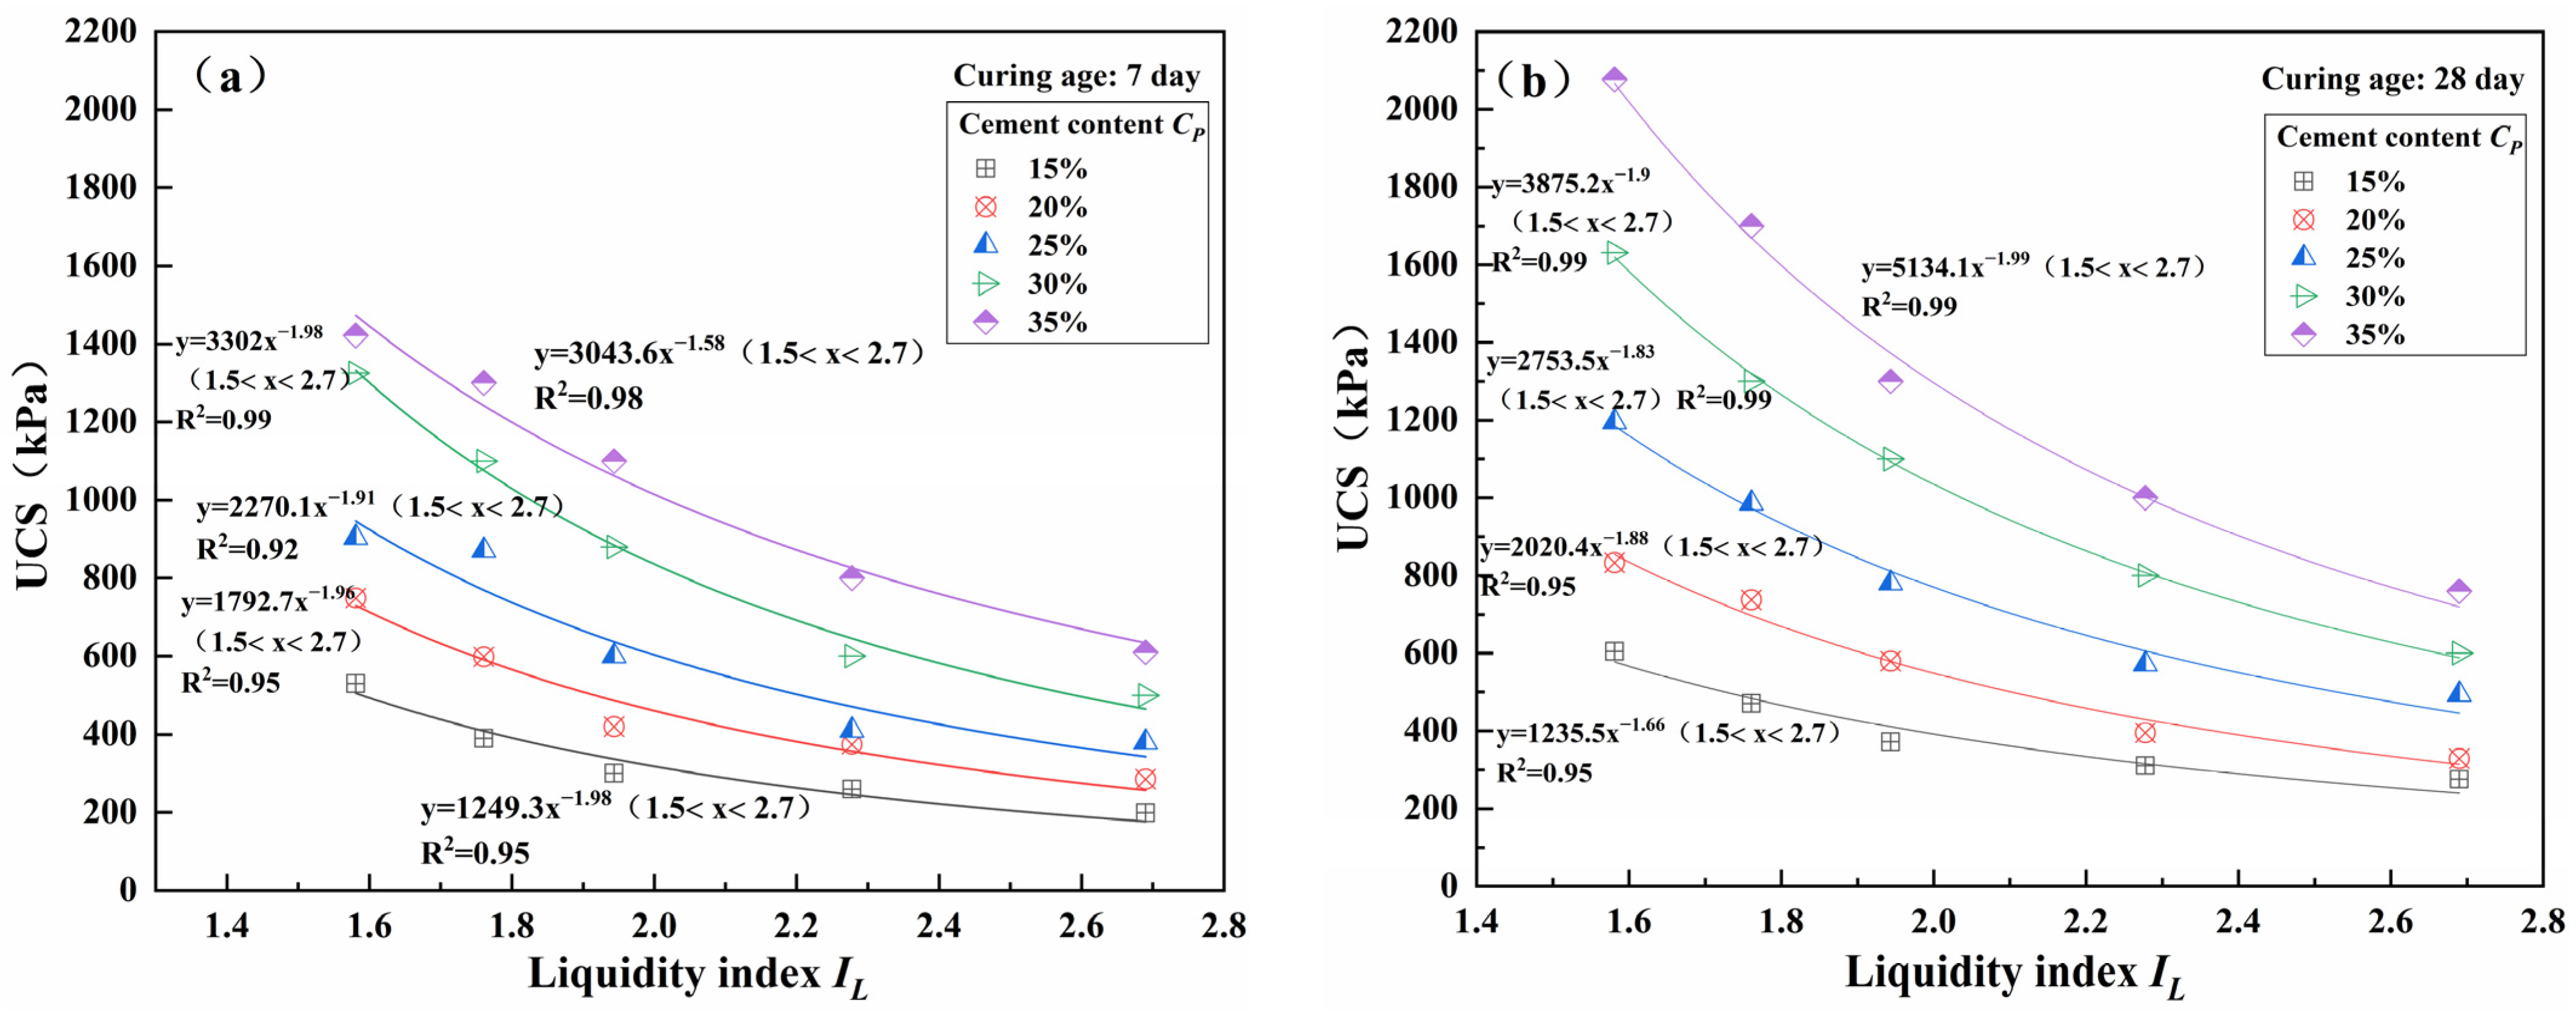
3.2. Effect of Liquid Index on the Strength Development of CDS
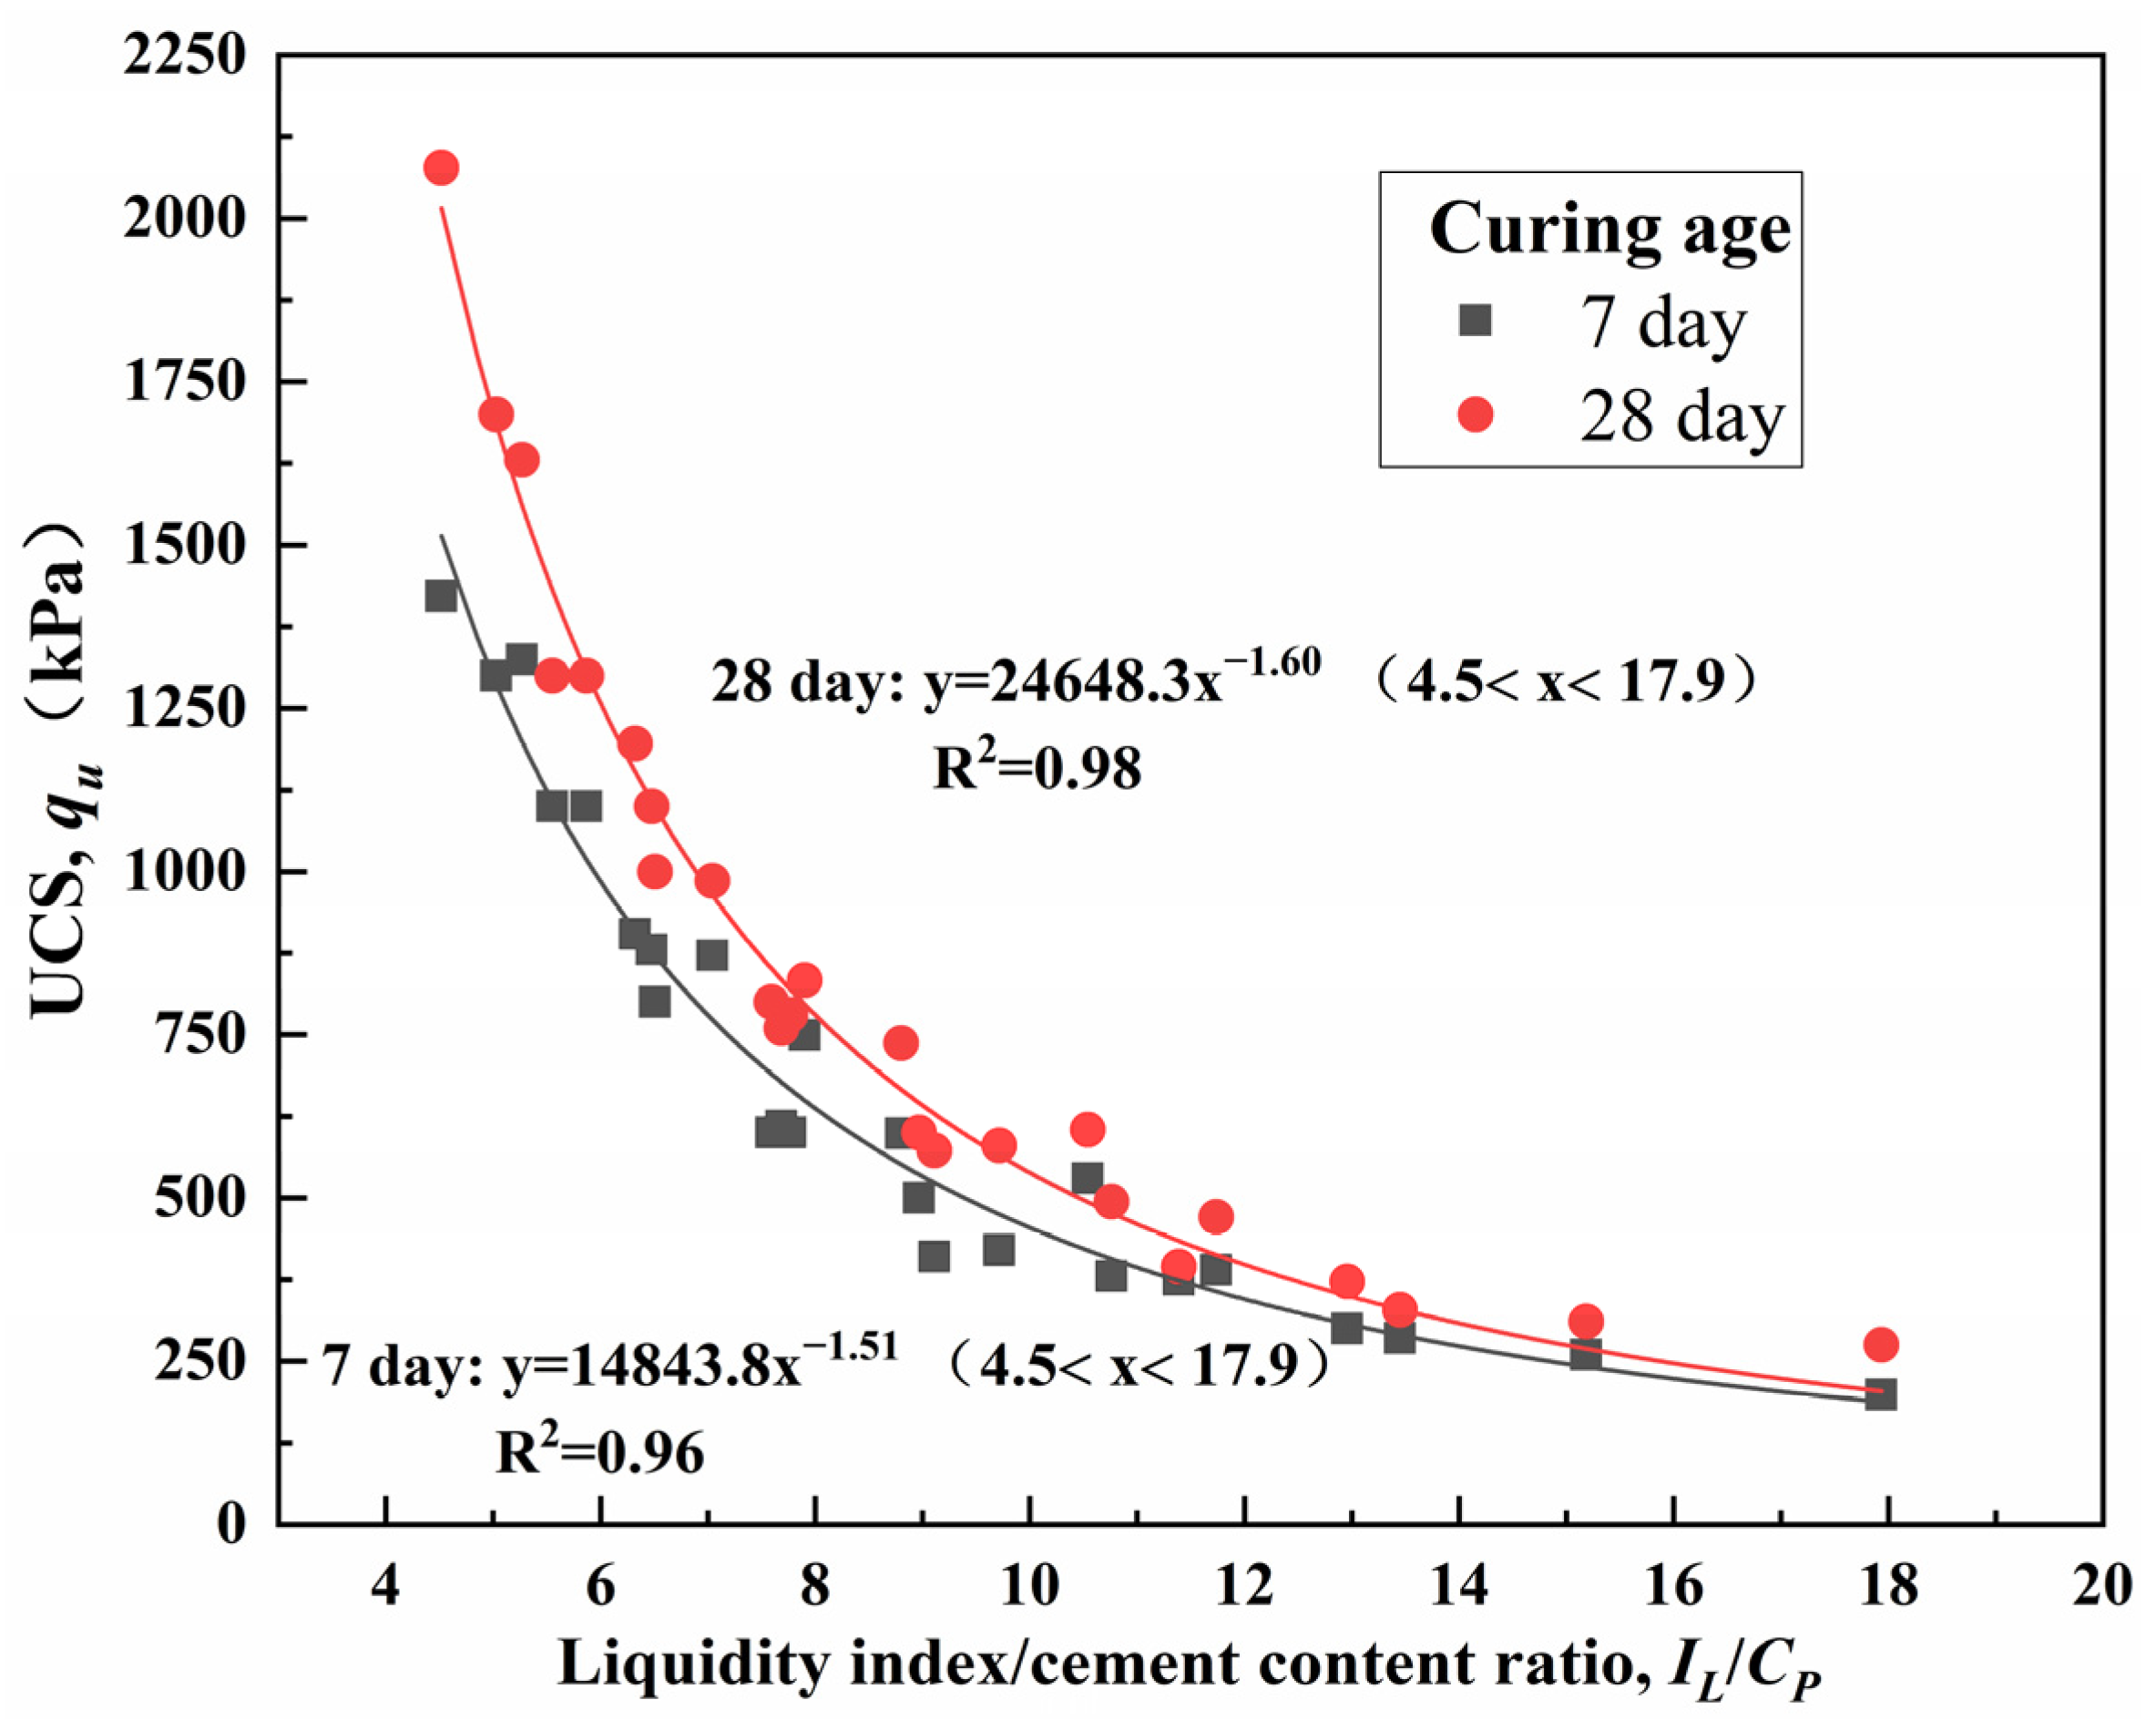
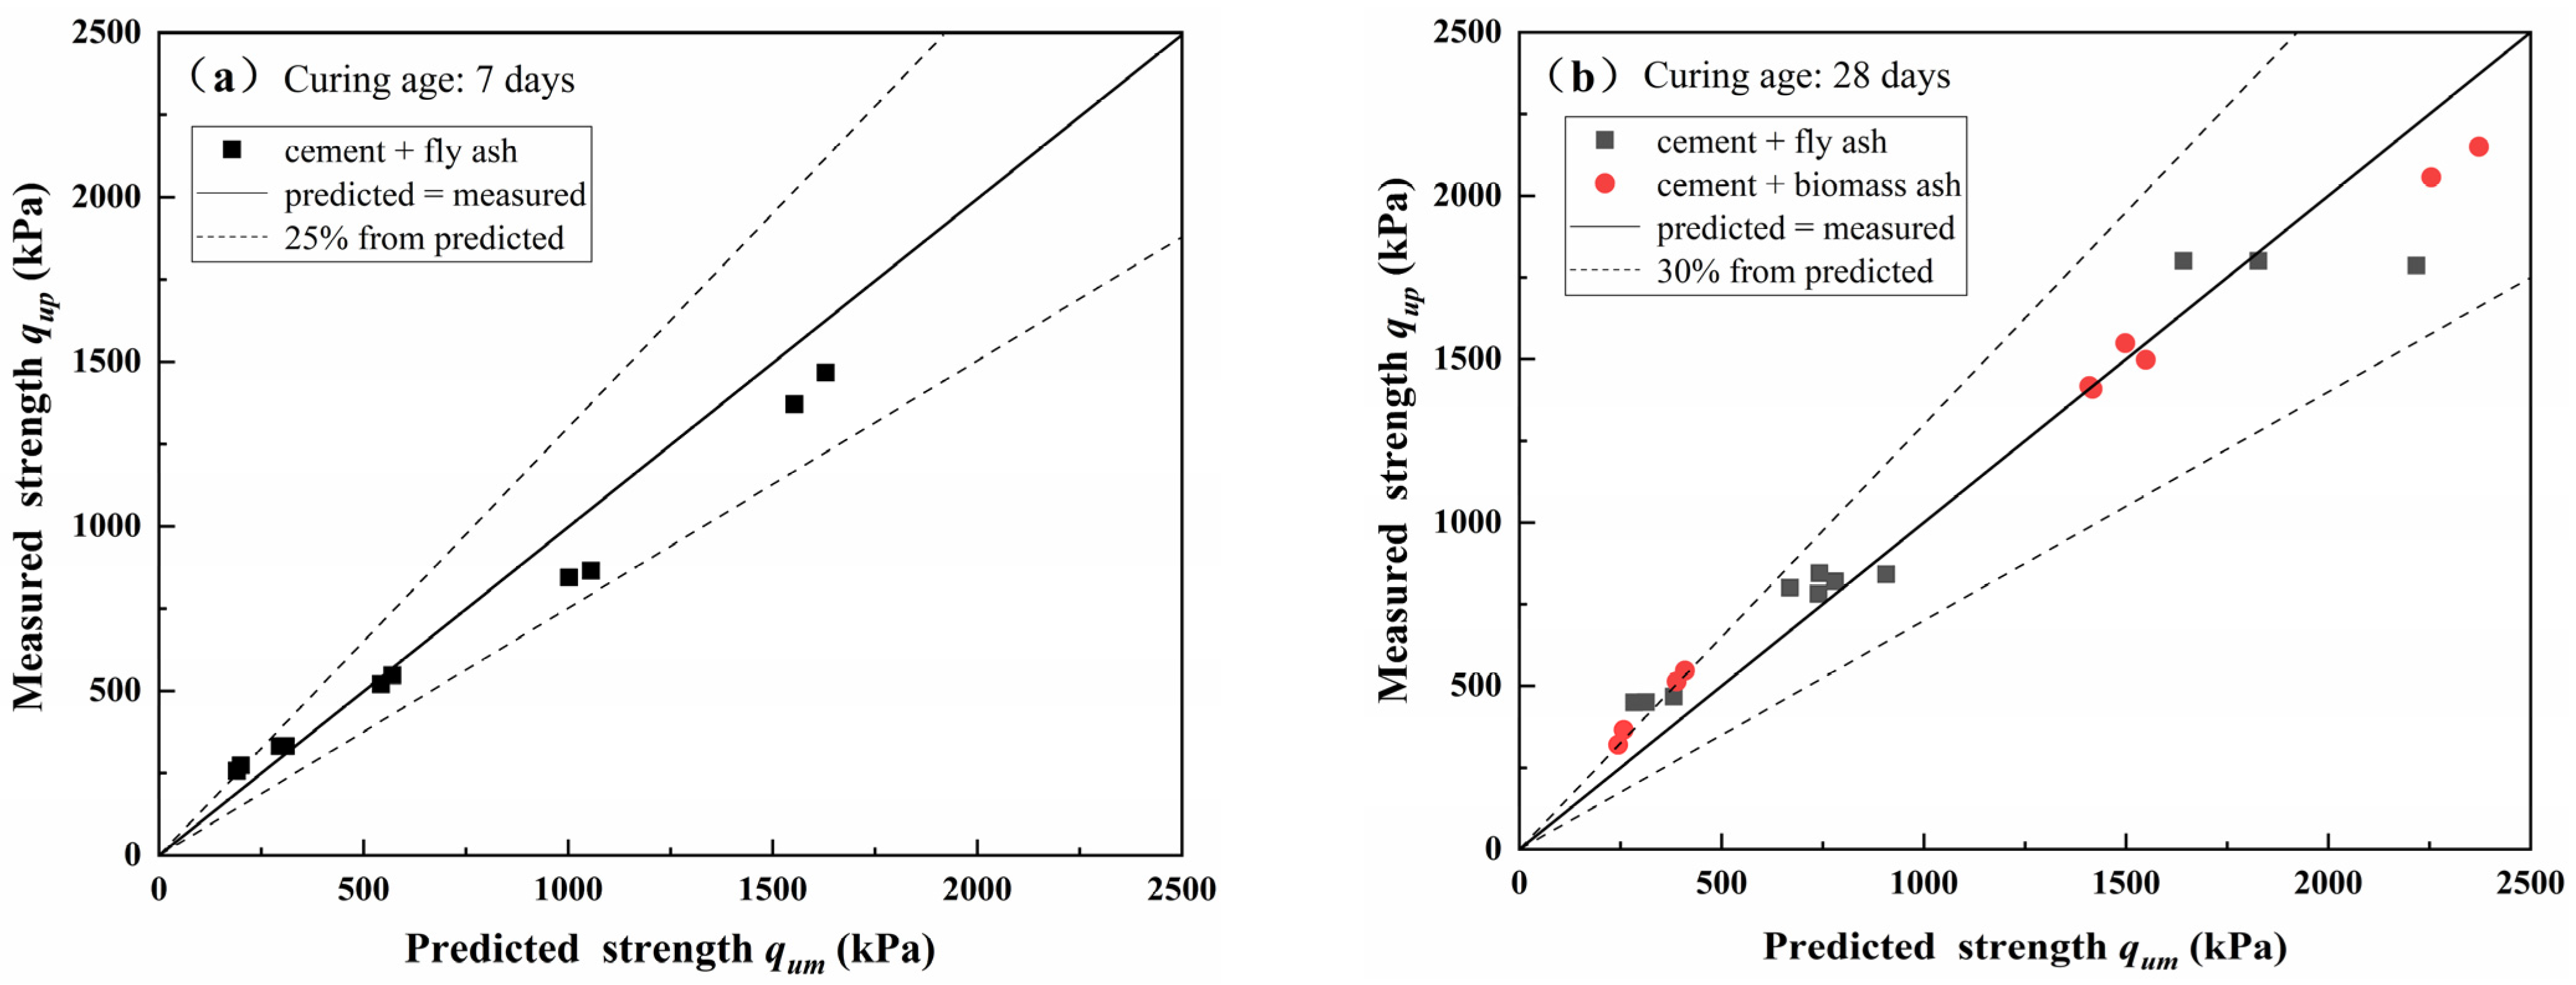
3.3. Strength Evaluation Model Based on the Ratio of Liquid Index to Cement Content
3.4. Microscopic Test Results Related to the Strength
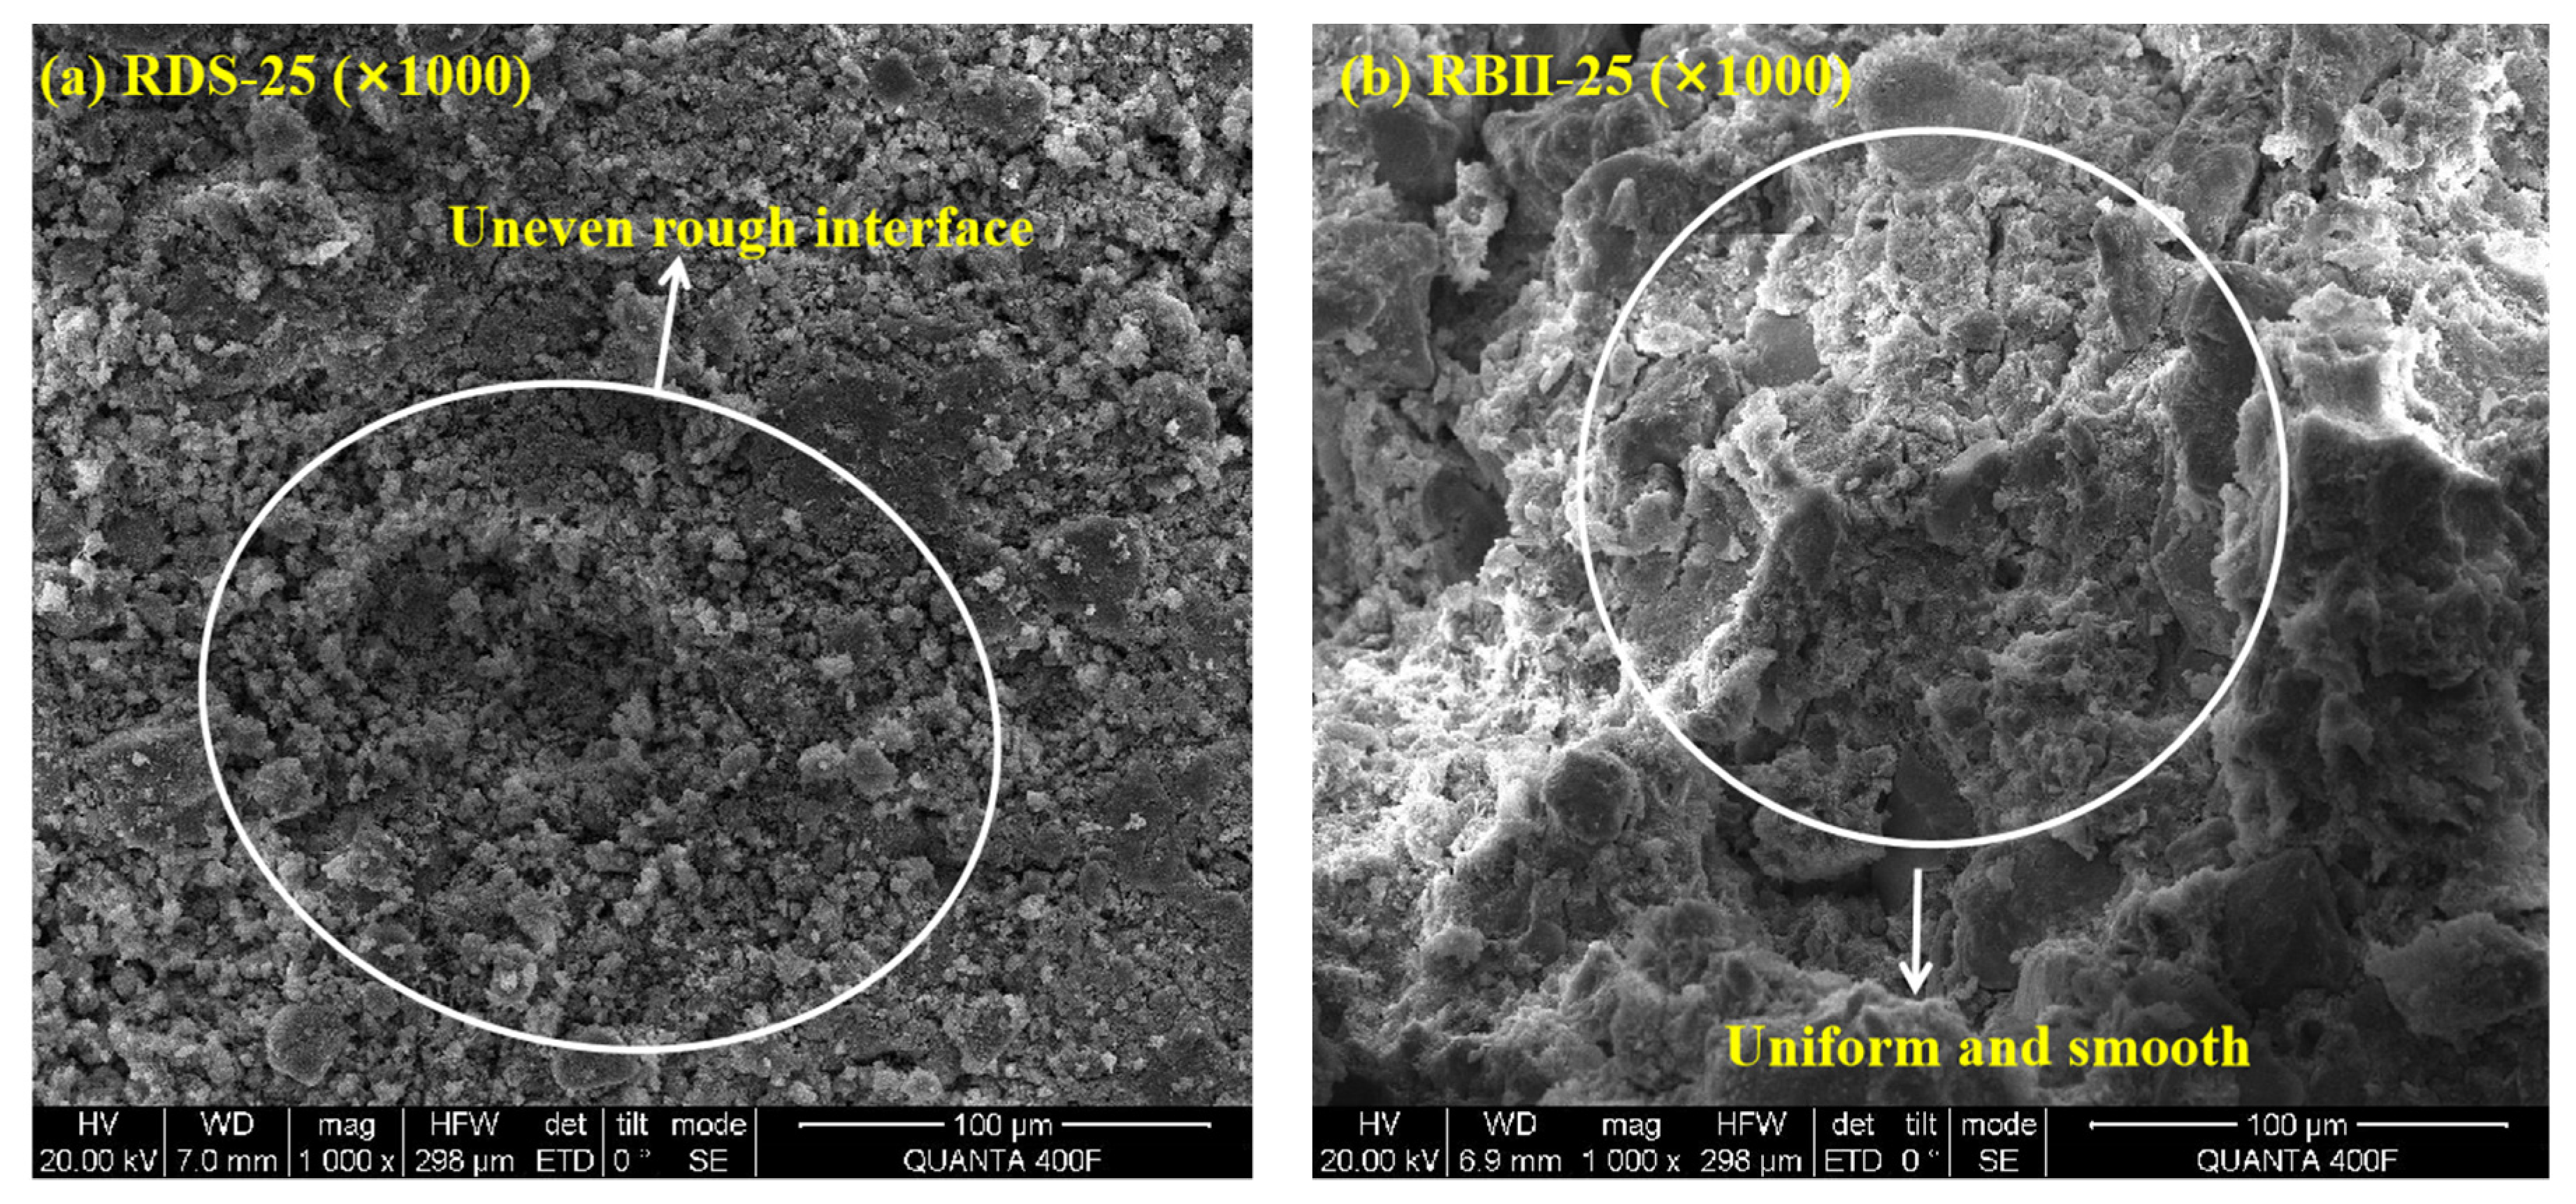
3.4.1. SEM Analysis
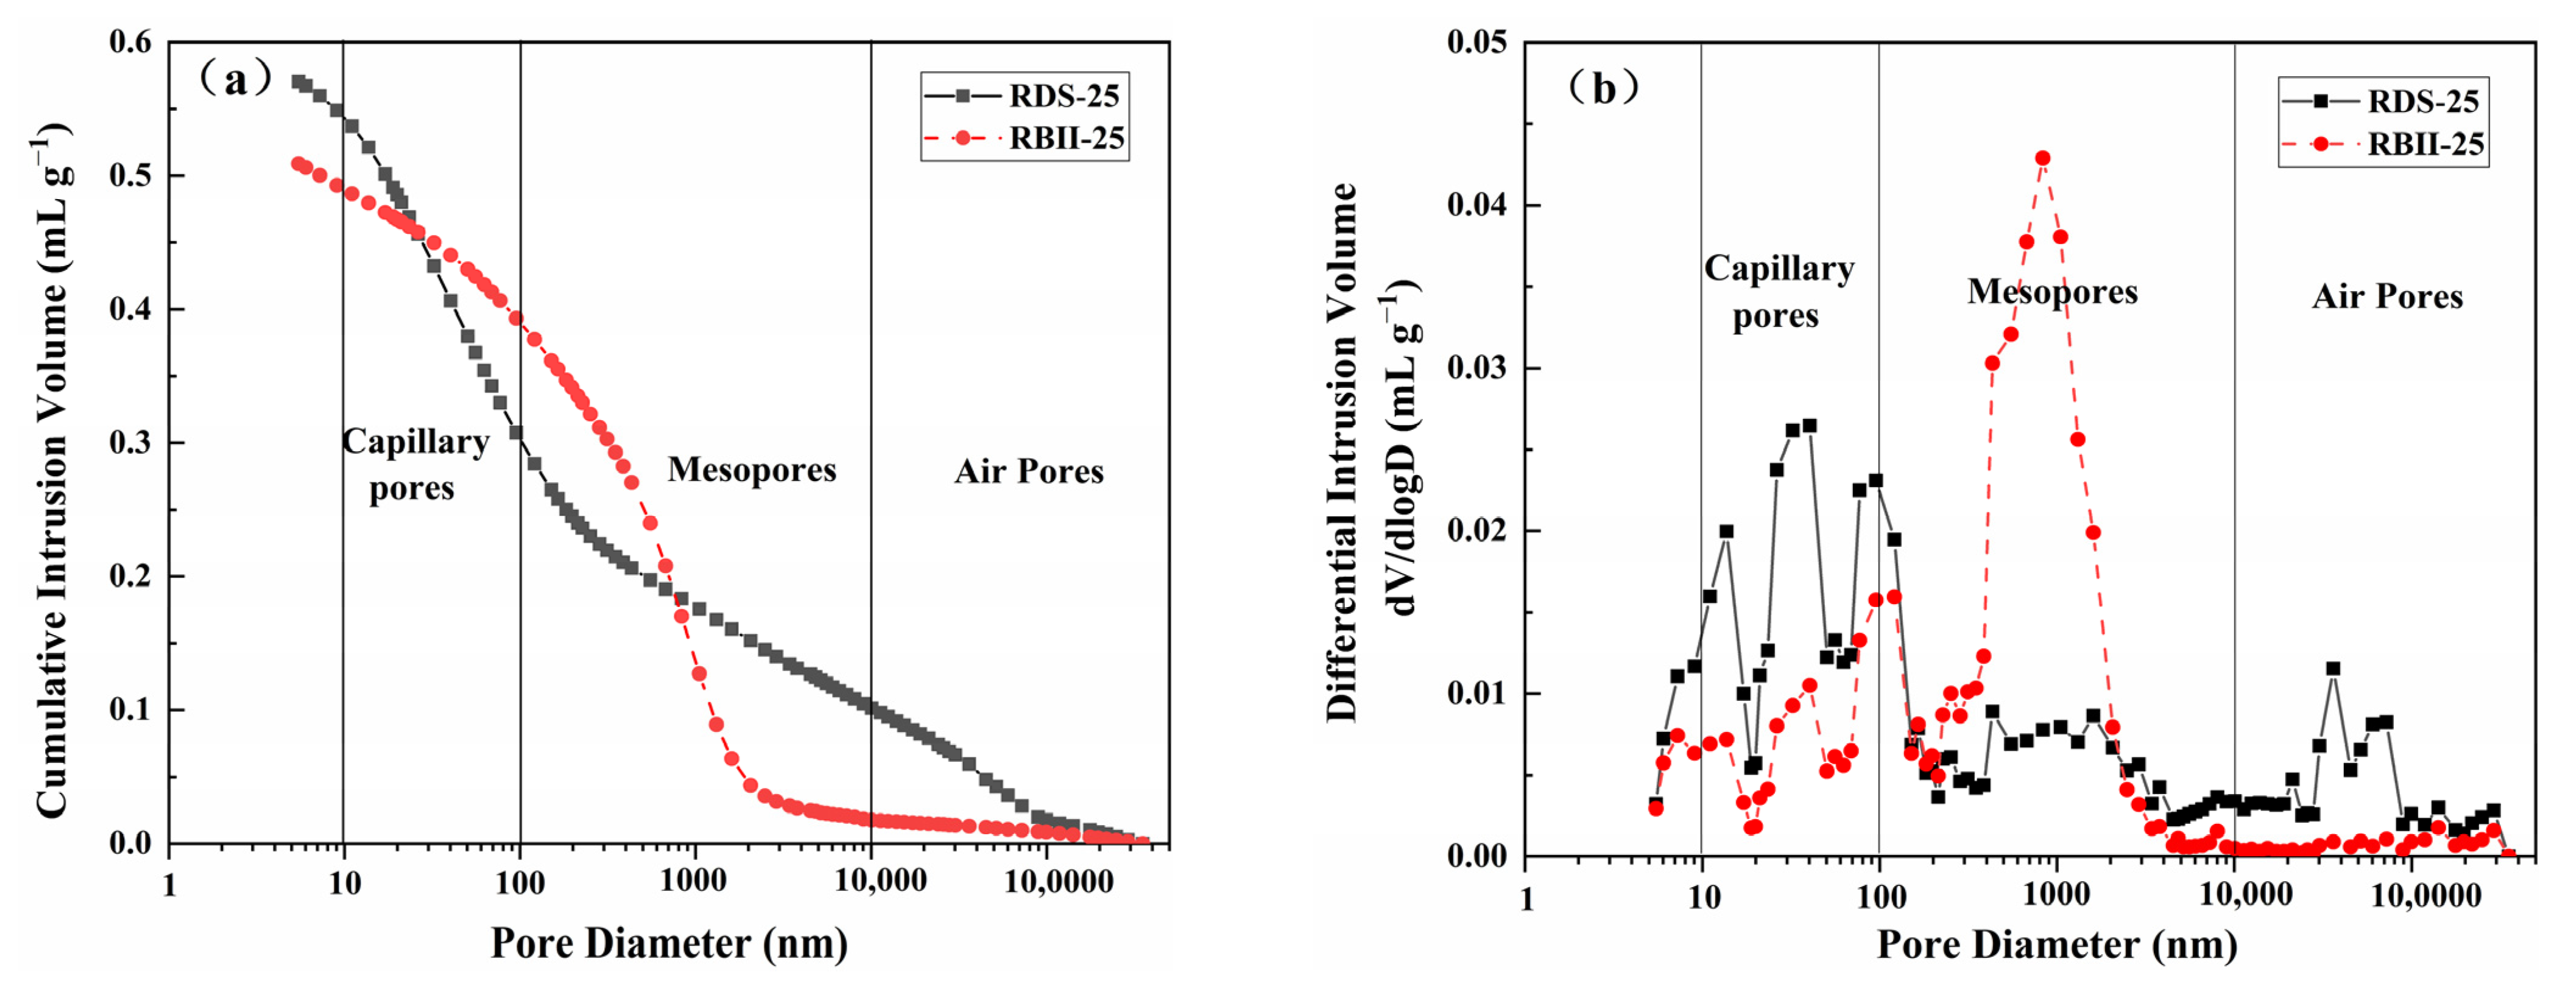
3.4.2. MIP
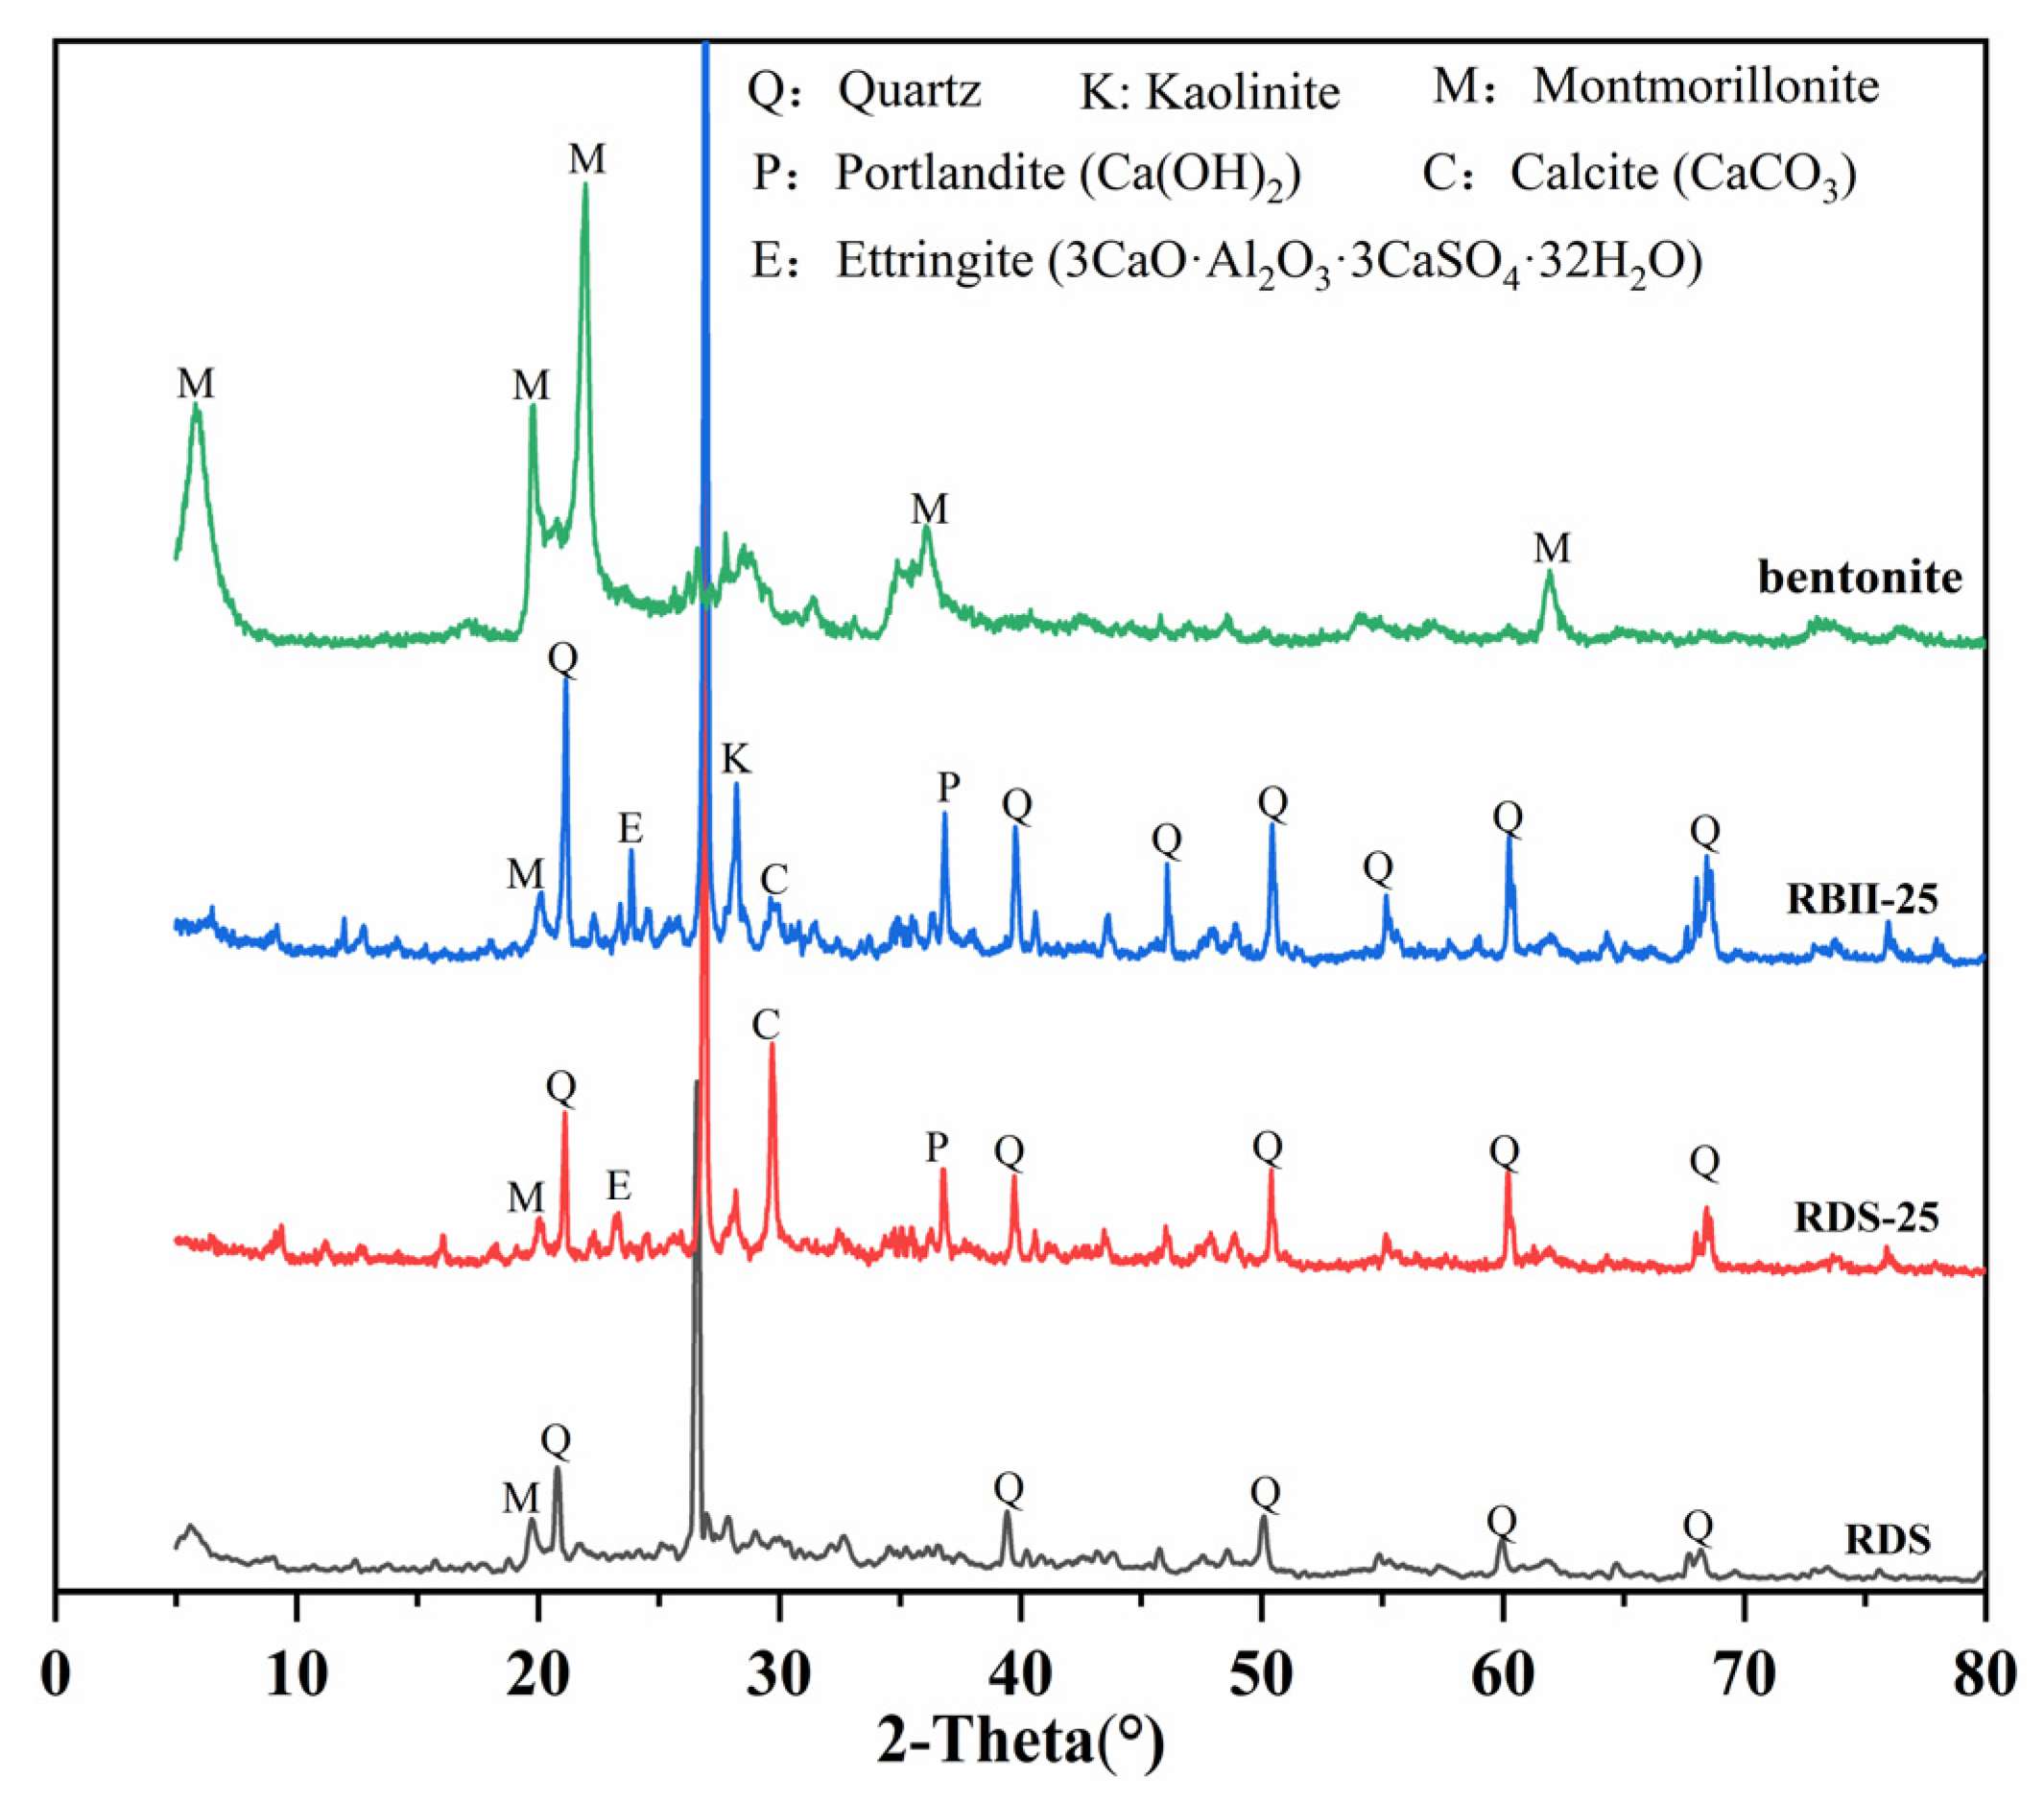
3.4.3. XRD Analysis
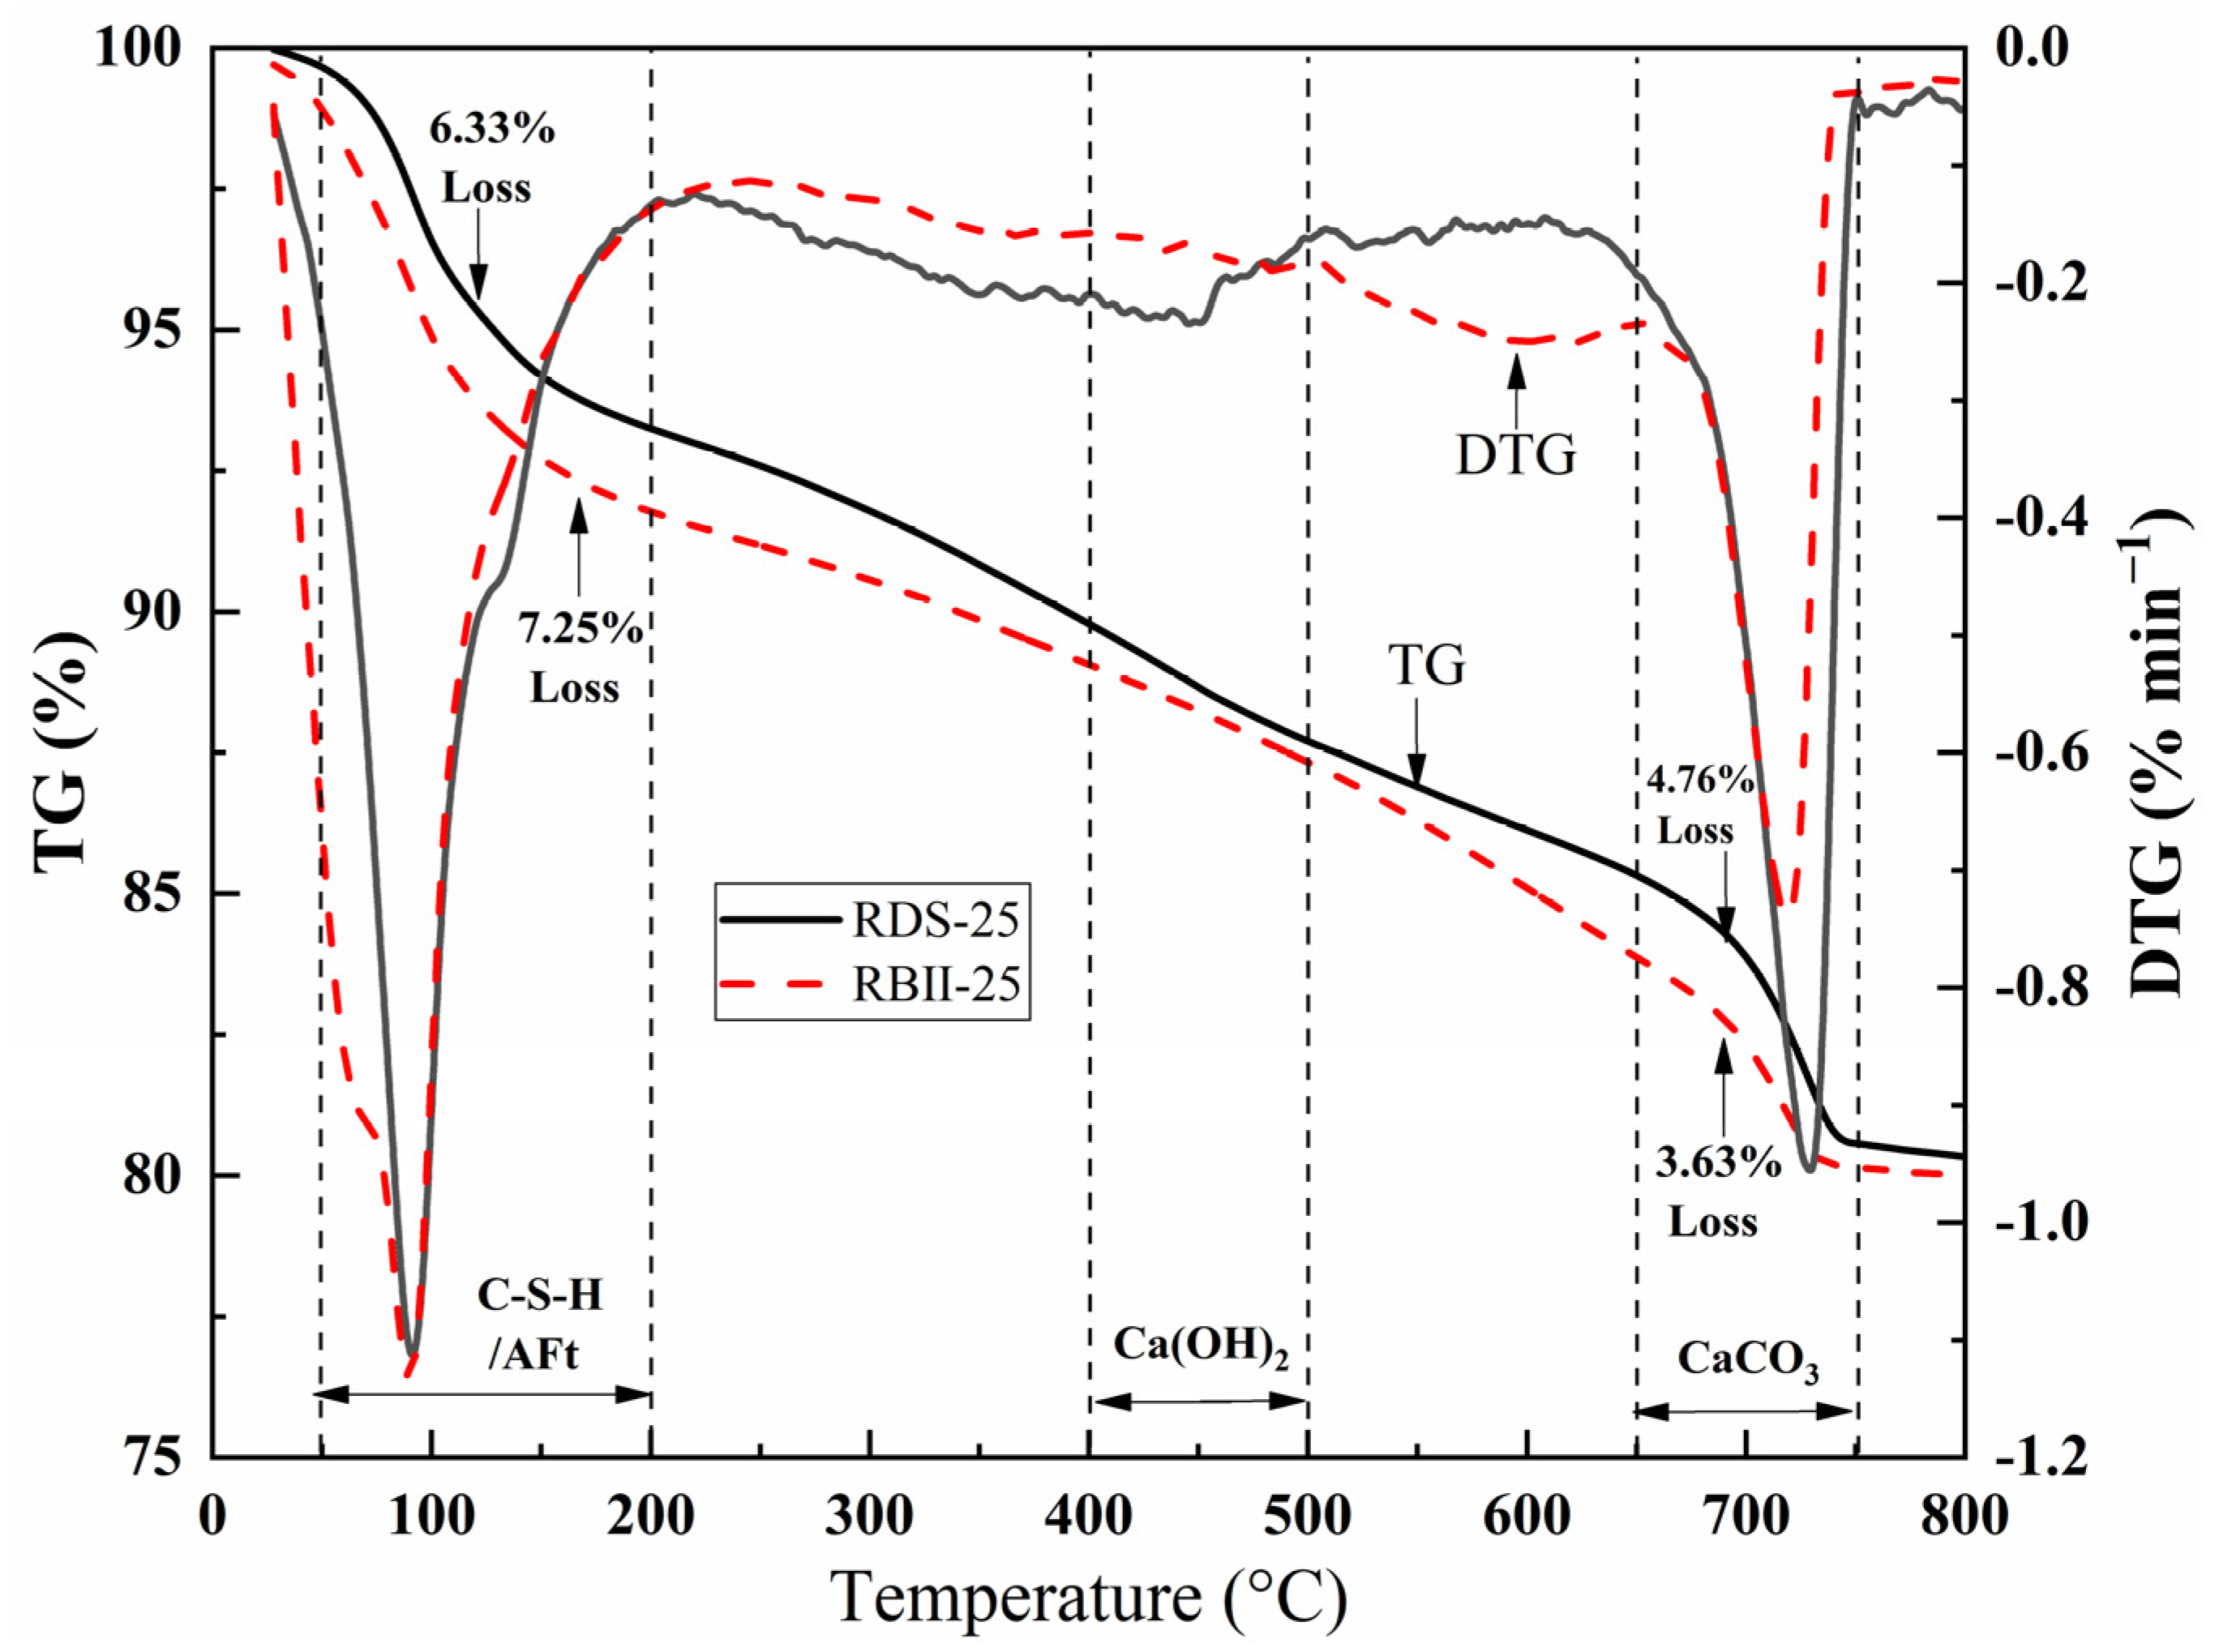
3.4.4. TGA
4. Conclusions
- (1)
- The consistency limit was a key factor affecting the strength development. The relationship between the UCS and liquid index IL can be characterized by the power function y = a∗xb. A valid empirical model, qu = A/(IL/Cp)B, was proposed based on the experiment data.
- (2)
- A large number of hydrates in the CDS with lower IL interlaced with each other, which promoted the formation of dense structure. However, for the CDS with higher IL, hydrates cannot play the role of cementing particles, resulting in the formation of the porous structure.
- (3)
- In engineering applications, under the same initial water content, if the liquid index can be reduced by adjusting the consistency limit, the strength performance of CDS can be improved.
Author Contributions
Funding
Institutional Review Board Statement
Informed Consent Statement
Data Availability Statement
Acknowledgments
Conflicts of Interest
References
- Chew, S.H.; Kamruzzaman, A.H.M.; Lee, F.H. Physicochemical and Engineering Behavior of Cement Treated Clays. J. Geotech. Geoenviron. Eng. 2004, 130, 696–706. [Google Scholar] [CrossRef]
- Chiu, C.; Zhu, W.; Zhang, C. Yielding and shear behaviour of cement-treated dredged materials. Eng. Geol. 2009, 103, 1–12. [Google Scholar] [CrossRef]
- Huang, Y.; Zhu, W.; Qian, X.; Zhang, N.; Zhou, X. Change of mechanical behavior between solidified and remolded solidified dredged materials. Eng. Geol. 2011, 119, 112–119. [Google Scholar] [CrossRef]
- He, X.; Chen, Y.; Tan, X.; Wang, S.; Liu, L. Determining the water content and void ratio of cement-treated dredged soil from the hydration degree of cement. Eng. Geol. 2020, 279, 105892. [Google Scholar] [CrossRef]
- Cai, G.; Liu, S.; Zheng, X.; Zou, H.; Shao, G.; Li, J. Freezing-thawing performance of reactive MgO-admixed silty clay subjected to forced carbonation. Cold Reg. Sci. Technol. 2021, 189, 103330. [Google Scholar] [CrossRef]
- Liu, S.-Y.; Cai, G.-H.; Du, G.-Y.; Wang, L.; Li, J.-S.; Qian, X.-C. Field investigation of shallow soft-soil highway subgrade treated by mass carbonation technology. Can. Geotech. J. 2021, 58, 97–113. [Google Scholar] [CrossRef]
- Furlan, A.P.; Razakamanantsoa, A.; Ranaivomanana, H.; Amiri, O.; Levacher, D.; Deneele, D. Effect of fly ash on microstructural and resistance characteristics of dredged sediment stabilized with lime and cement. Constr. Build. Mater. 2020, 272, 121637. [Google Scholar] [CrossRef]
- Lang, L.; Chen, B.; Chen, B. Strength evolutions of varying water content-dredged sludge stabilized with alkali-activated ground granulated blast-furnace slag. Constr. Build. Mater. 2021, 275, 122111. [Google Scholar] [CrossRef]
- Zhou, Y.; Cai, G.; Cheeseman, C.; Li, J.; Poon, C.S. Sewage sludge ash-incorporated stabilisation/solidification for recycling and remediation of marine sediments. J. Environ. Manag. 2021, 301, 113877. [Google Scholar] [CrossRef]
- Horpibulsuk, S.; Nagaraj, T.S.; Miura, N. Assessment of strength development in cement-admixed high water content clays with Abrams’ law as a basis. Geotechnique 2003, 53, 439–444. [Google Scholar] [CrossRef]
- Yao, K.; Xiao, H.; Chen, D.-H.; Liu, Y. A direct assessment for the stiffness development of artificially cemented clay. Geotechnique 2019, 69, 741–747. [Google Scholar] [CrossRef]
- Kang, G.; Tsuchida, T.; Athapaththu, A. Engineering behavior of cement-treated marine dredged clay during early and later stages of curing. Eng. Geol. 2016, 209, 163–174. [Google Scholar] [CrossRef]
- Lang, L.; Chen, B.; Duan, H. Modification of nanoparticles for the strength enhancing of cement-stabilized dredged sludge. J. Rock Mech. Geotech. Eng. 2021, 13, 694–704. [Google Scholar] [CrossRef]
- Zhang, D.; Cao, Z.; Fan, L.; Liu, S.; Liu, W. Evaluation of the influence of salt concentration on cement stabilized clay by electrical resistivity measurement method. Eng. Geol. 2014, 170, 80–88. [Google Scholar] [CrossRef]
- Horpibulsuk, S.; Miura, N.; Nagaraj, T.S. Clay-Water/Cement Ratio Identity for Cement Admixed Soft Clays. J. Geotech. Geoenviron. Eng. 2005, 131, 187–192. [Google Scholar] [CrossRef]
- Horpibulsuk, S.; Rachan, R.; Suddeepong, A. Assessment of strength development in blended cement admixed Bangkok clay. Constr. Build. Mater. 2011, 25, 1521–1531. [Google Scholar] [CrossRef]
- Lorenzo, G.A.; Bergado, D.T. Fundamental Parameters of Cement-Admixed Clay—New Approach. J. Geotech. Geoenviron. Eng. 2004, 130, 1042–1050. [Google Scholar] [CrossRef]
- Lorenzo, G.A.; Bergado, D.T. Fundamental Characteristics of Cement-Admixed Clay in Deep Mixing. J. Mater. Civ. Eng. 2006, 18, 161–174. [Google Scholar] [CrossRef]
- Zhang, R.; Zheng, J.; Bian, X. Experimental investigation on effect of curing stress on the strength of cement-stabilized clay at high water content. Acta Geotech. 2016, 12, 921–936. [Google Scholar] [CrossRef]
- Ma, C.; Chen, B.; Chen, L. Effect of organic matter on strength development of self-compacting earth-based construction stabilized with cement-based composites. Constr. Build. Mater. 2016, 123, 414–423. [Google Scholar] [CrossRef]
- Ma, C.; Chen, L.; Chen, B. Experimental Study of Effect of Fly Ash on Self-Compacting Rammed Earth Construction Stabilized with Cement-Based Composites. J. Mater. Civ. Eng. 2016, 28, 04016022. [Google Scholar] [CrossRef]
- Correia, A.A.; Venda Oliveira, P.J.; Lemos, L.J. Strength assessment of chemically stabilised soft soils. Proc. Inst. Civ. Eng. -Geotech. Eng. 2019, 172, 218–227. [Google Scholar] [CrossRef]
- Yao, K.; Pan, Y.; Jia, L.; Yi, J.T.; Hu, J.; Wu, C. Strength evaluation of marine clay stabilized by cementitious binder. Mar. Georesour. Geotechnol. 2019, 38, 730–743. [Google Scholar] [CrossRef]
- Bi, J.; Chian, S.C. Modelling of three-phase strength development of ordinary Portland cement- and Portland blast-furnace cement-stabilised clay. Geotechnique 2020, 70, 80–89. [Google Scholar] [CrossRef]
- Zhu, W.; Zhang, C.L.; Chiu, A.C.F. Soil–Water Transfer Mechanism for Solidified Dredged Materials. J. Geotech. Geoenviron. Eng. 2007, 133, 588–598. [Google Scholar] [CrossRef]
- Zhu, W.; Chiu, C.F. Role of Soil Water in Cement-Based Treatment of Dredged Materials. Adv. Environ. Geotech. 2010, 395–404. [Google Scholar] [CrossRef]
- Zentar, R.; Abriak, N.; Dubois, V. Effects of salts and organic matter on Atterberg limits of dredged marine sediments. Appl. Clay Sci. 2009, 42, 391–397. [Google Scholar] [CrossRef]
- ASTM D854-14; Standard Test Methods for Specific Gravity of Soil Solids by Water Pycnometer. ASTM International: West Conshohocken, PA, USA, 2014.
- ASTM D4318-10; Standard Test Methods for Liquid Limit, Plastic Limit, and Plasticity Index of Soils. ASTM International: West Conshohocken, PA, USA, 2010.
- ASTM D422-63; Standard Test Method for Particle-Size Analysis of Soils. ASTM International: West Conshohocken, PA, USA, 2007.
- ASTMD2216-10; Standard Test Methods for Moisture, Ash, and Organic Matter of Peat and Other Organic Soils. ASTM International: West Conshohocken, PA, USA, 2010.
- ASTM D4219-08; Standard Test Method for Unconfined Compressive Strength Index of Chemical Grouted Soils. ASTM International: West Conshohocken, PA, USA, 2008.
- Lang, L.; Liu, N.; Chen, B. Strength development of solidified dredged sludge containing humic acid with cement, lime and nano-SiO2. Constr. Build. Mater. 2019, 230, 116971. [Google Scholar] [CrossRef]
- Zhang, R.J.; Santoso, A.M.; Tan, T.S.; Phoon, K.K. Strength of High Water-Content Marine Clay Stabilized by Low Amount of Cement. J. Geotech. Geoenviron. Eng. 2013, 139, 2170–2181. [Google Scholar] [CrossRef]
- Correia, A. Applicability of Deep Mixing Technique to Portuguese Soft Soils. Ph.D. Thesis, University of Coimbra, Coimbra, Portugal, 2011. [Google Scholar]
- Consoli, N.C.; Rosa, D.A.; Cruz, R.C.; Rosa, A.D. Water content, porosity and cement content as parameters controlling strength of artificially cemented silty soil. Eng. Geol. 2011, 122, 328–333. [Google Scholar] [CrossRef]
- He, X.; Chen, Y.; Wan, Y.; Liu, L.; Xue, Q. Effect of Curing Stress on Compression Behavior of Cement-Treated Dredged Sediment. Int. J. Géoméch. 2020, 20, 04020204. [Google Scholar] [CrossRef]
- Yoobanpot, N.; Jamsawang, P.; Poorahong, H.; Jongpradist, P.; Likitlersuang, S. Multiscale laboratory investigation of the mechanical and microstructural properties of dredged sediments stabilized with cement and fly ash. Eng. Geol. 2020, 267, 105491. [Google Scholar] [CrossRef]
- Moura, M.; Ferreira, P.; Figueiredo, M.M.L. Mercury intrusion porosimetry in pulp and paper technology. Powder Technol. 2005, 160, 61–66. [Google Scholar] [CrossRef]
- Wang, L.; Chen, L.; Tsang, D.C.; Li, J.-S.; Baek, K.; Hou, D.; Ding, S.; Poon, C.-S. Recycling dredged sediment into fill materials, partition blocks, and paving blocks: Technical and economic assessment. J. Clean. Prod. 2018, 199, 69–76. [Google Scholar] [CrossRef]
- Wang, L.; Tsang, D.C.; Poon, C.-S. Green remediation and recycling of contaminated sediment by waste-incorporated stabilization/solidification. Chemosphere 2015, 122, 257–264. [Google Scholar] [CrossRef]
- Wang, D.; Gao, X.; Liu, X.; Zeng, G. Strength, durability and microstructure of granulated blast furnace slag-modified magnesium oxychloride cement solidified waste sludge. J. Clean. Prod. 2021, 292, 126072. [Google Scholar] [CrossRef]
- Wang, L.; Kwok, J.S.; Tsang, D.C.; Poon, C.-S. Mixture design and treatment methods for recycling contaminated sediment. J. Hazard. Mater. 2015, 283, 623–632. [Google Scholar] [CrossRef]
- Yi, Y.; Lu, K.; Liu, S.; Al-Tabbaa, A. Property changes of reactive magnesia–stabilized soil subjected to forced carbonation. Can. Geotech. J. 2015, 53, 314–325. [Google Scholar] [CrossRef]
- Haha, M.B.; Lothenbach, B.; Saout, G.L.; Winnefeld, F. Influence of slag chemistry on the hydration of alkali-activated blast-furnace slag—Part I: Effect of MgO. Cem. Concr. Res. 2011, 41, 955–963. [Google Scholar] [CrossRef]
- Lago, D.; Prado, M. Dehydroxilation and crystallization of glasses: A DTA study. J. Non-Cryst. Solids 2013, 381, 12–16. [Google Scholar] [CrossRef]
- Zhang, N.; Sun, H.; Liu, X.; Zhang, J. Early-age characteristics of red mud–coal gangue cementitious material. J. Hazard. Mater. 2009, 167, 927–932. [Google Scholar] [CrossRef] [PubMed]


| Reaction | Chemical Formulas |
|---|---|
| The direct hydration reaction between cement and pore water in the sludge | 2(3CaO·SiO2) + 6H2O→3CaO·SiO2·3H2O + 3Ca(OH)2 C-S-H |
| 2(2CaO·SiO2) + 4H2O→3CaO·SiO2·3H2O + Ca(OH)2 C-S-H | |
| 3CaO·Al2O3 + 6H2O + Ca(OH)2 →3CaO·Al2O3·6H2O C-A-H | |
| 4CaO·Al2O3·Fe2O3 + 7H2O→3CaO·Al2O3·6H2O + CaO·Fe2O3·H2O C-F-H | |
| 4CaO·Al2O3·13H2O + 3(CaSO4·2H2O) + 14H2O→3CaO·Al2O3·3CaSO4·32H2O + Ca(OH)2 AFt | |
| The secondary pozzolanic reaction between calcium hydroxide (cement hydration product) and active silicon aluminum in the clay minerals | OH− + SiO2 + Ca2+ + H2O→C-S-H |
| OH− + Al2O3 + Ca2+ + H2O→C-A-H |
| Property | Value | Standard |
|---|---|---|
| Specific gravity | 2.71 | ASTM D854-10 [28] |
| Liquid limit (LL), % | 49.1 | ASTM D4318-10 [29] |
| Plastic limit (PL), % | 24.9 | |
| Plastic index (IP), % | 24.2 | |
| Clay fraction (d < 0.005 mm), % | 21.0 | ASTM D422-63 [30] |
| Silt fraction (0.005 mm < d < 0.075 mm), % | 64.0 | |
| Sand fraction (d > 0.075 mm), % | 15.0 | |
| Organic content, % | 2.5 | ASTM D2974-14 [31] |
| Raw Materials | Chemical Composition, % | ||||||
|---|---|---|---|---|---|---|---|
| SiO2 | Al2O3 | CaO | Fe2O3 | MgO | Na2O | Loss | |
| RDS | 58.1 | 18.8 | 4.6 | 5.8 | 2.7 | 2.1 | 6.4 |
| PC | 22.3 | 4.2 | 64.8 | 2.3 | 2.5 | 1.2 | 1.7 |
| bentonite | 69.5 | 15.5 | 3.0 | 2.0 | 3.0 | 1.0 | 2.5 |
| Dredged Sludge Type | Initial Water Content, CW (%) | Bentonite Content, CB (%) | Liquid Limit, LL (%) | Plastic Limit, PL (%) | Plasticity Index, IP | liquid Index, IL | Curing Age, (Days) | PC Content, CP (%) | Symbol |
|---|---|---|---|---|---|---|---|---|---|
| RDS | 90 | 0% | 49.1 | 24.9 | 24.2 | 2.69 | 7, 28 | 15 | RDS-15 |
| 20 | RDS-20 | ||||||||
| 25 | RDS-25 | ||||||||
| 30 | RDS-30 | ||||||||
| 35 | RDS-35 | ||||||||
| RBI | 90 | 15% | 57.8 | 32.6 | 25.2 | 2.28 | 7, 28 | 15 | RBI-15 |
| 20 | RBI-20 | ||||||||
| 25 | RBI-25 | ||||||||
| 30 | RBI-30 | ||||||||
| 35 | RBI-35 | ||||||||
| RBII | 90 | 25% | 63.3 | 35 | 28.5 | 1.94 | 7, 28 | 15 | RBII-15 |
| 20 | RBII-20 | ||||||||
| 25 | RBII-25 | ||||||||
| 30 | RBII-30 | ||||||||
| 35 | RBII-35 | ||||||||
| RBIII | 90 | 35% | 67.1 | 37 | 30.1 | 1.76 | 7, 28 | 15 | RBIII-15 |
| 20 | RBIII-20 | ||||||||
| 25 | RBIII-25 | ||||||||
| 30 | RBIII-30 | ||||||||
| 35 | RBIII-35 | ||||||||
| RBIV | 90 | 45% | 71.0 | 38.3 | 32.7 | 1.58 | 7, 28 | 15 | RBIV-15 |
| 20 | RBIV-20 | ||||||||
| 25 | RBIV-25 | ||||||||
| 30 | RBIV-30 | ||||||||
| 35 | RBIV-35 |
| Soft Soil | Cw (%) | IL | CP (%) | IL/CP | Curing Age (Days) | Predicted Strength, qup (kPa) | Measured Strength, qum (kPa) |
|---|---|---|---|---|---|---|---|
| Bangkok clay (cement + fly ash) | 89 | 1.0 | 11.18 | 8.94 | 7 | 555 | 520 |
| 89 | 1.0 | 11.56 | 8.65 | 7 | 583 | 547 | |
| 118 | 1.5 | 11.14 | 13.38 | 7 | 303 | 332 | |
| 118 | 1.5 | 11.51 | 12.90 | 7 | 319 | 332 | |
| 118 | 1.5 | 33.42 | 4.46 | 7 | 1577 | 1371 | |
| 118 | 1.5 | 34.5 | 4.32 | 7 | 1654 | 1467 | |
| 148 | 2.0 | 11.19 | 17.87 | 7 | 196 | 257 | |
| 148 | 2.0 | 11.57 | 17.29 | 7 | 207 | 273 | |
| 148 | 2.0 | 33.56 | 5.96 | 7 | 1020 | 844 | |
| 148 | 2.0 | 34.74 | 5.76 | 7 | 1075 | 865 | |
| 89 | 1.0 | 11.18 | 8.65 | 28 | 740 | 781 | |
| 89 | 1.0 | 11.56 | 13.38 | 28 | 781 | 820 | |
| 118 | 1.5 | 11.14 | 12.90 | 28 | 389 | 514 | |
| 118 | 1.5 | 11.51 | 4.46 | 28 | 410 | 547 | |
| 118 | 1.5 | 33.42 | 4.32 | 28 | 2255 | 2056 | |
| 118 | 1.5 | 34.5 | 17.87 | 28 | 2372 | 2150 | |
| 148 | 2.0 | 11.19 | 17.29 | 28 | 244 | 320 | |
| 148 | 2.0 | 11.57 | 5.96 | 28 | 258 | 366 | |
| 148 | 2.0 | 33.56 | 5.76 | 28 | 1417 | 1409 | |
| 148 | 2.0 | 34.74 | 8.65 | 28 | 1498 | 1549 | |
| Bangkok Clay (cement + biomass ash) | 89 | 1.0 | 22.2 | 4.50 | 28 | 2218 | 1786 |
| 89 | 1.0 | 12.7 | 7.87 | 28 | 908 | 841 | |
| 89 | 1.0 | 7.4 | 13.51 | 28 | 382 | 467 | |
| 118 | 1.5 | 29.5 | 5.08 | 28 | 1827 | 1800 | |
| 118 | 1.5 | 16.8 | 8.93 | 28 | 742 | 845 | |
| 118 | 1.5 | 9.8 | 15.31 | 28 | 313 | 450 | |
| 148 | 2.0 | 36.8 | 5.43 | 28 | 1642 | 1800 | |
| 148 | 2.0 | 21 | 9.52 | 28 | 669 | 800 | |
| 148 | 2.0 | 12.3 | 16.26 | 28 | 284 | 449 |
Publisher’s Note: MDPI stays neutral with regard to jurisdictional claims in published maps and institutional affiliations. |
© 2022 by the authors. Licensee MDPI, Basel, Switzerland. This article is an open access article distributed under the terms and conditions of the Creative Commons Attribution (CC BY) license (https://creativecommons.org/licenses/by/4.0/).
Share and Cite
Wang, S.; He, X.; Li, J.; Li, S.; Qin, H.; Ma, Y.; Ma, H.; Gong, S.; Niu, Z. Effect of Consistency Limit on the Strength of Cement-Solidified Dredged Sludge: Modelling and Micro-Mechanism. Water 2022, 14, 1959. https://doi.org/10.3390/w14121959
Wang S, He X, Li J, Li S, Qin H, Ma Y, Ma H, Gong S, Niu Z. Effect of Consistency Limit on the Strength of Cement-Solidified Dredged Sludge: Modelling and Micro-Mechanism. Water. 2022; 14(12):1959. https://doi.org/10.3390/w14121959
Chicago/Turabian StyleWang, Shiquan, Xingxing He, Jiangshan Li, Shenzhen Li, Huajin Qin, Yuanyuan Ma, Hongrui Ma, Shunmei Gong, and Zhiyong Niu. 2022. "Effect of Consistency Limit on the Strength of Cement-Solidified Dredged Sludge: Modelling and Micro-Mechanism" Water 14, no. 12: 1959. https://doi.org/10.3390/w14121959