
Identification and Prediction of Crop Waterlogging Risk Areas under the Impact of Climate Change

1
MOE Key Laboratory of Tibetan Plateau Land Surface Processes and Ecological Conservation, Xining 810016, China
2
School of the Geographical Science, Qinghai Normal University, Xining 810016, China
3
Academy of Plateau Science and Sustainability, Xining 810016, China
*
Author to whom correspondence should be addressed.
Water 2022, 14(12), 1956; https://doi.org/10.3390/w14121956
Submission received: 30 May 2022
/
Revised: 14 June 2022
/
Accepted: 16 June 2022
/
Published: 18 June 2022
(This article belongs to the Special Issue Climate Change Impacts on Hydrological Processes and Water Resources of Local Watersheds)
Abstract
:Waterlogging refers to the damage to plants by water stress due to excess soil water in the crop’s root zone that exceeds the maximum water holding capacity of the field. It is one of the major disasters affecting agricultural production. This study aims to add a crop waterlogging identification module to the coupled SWAT (Soil and Water Assessment Tools)-MODFLOW (Modular Finite Difference Groundwater Flow Model) model and to accurately identify and predict crop waterlogging risk areas under the CMIP6 (Coupled Model Intercomparison Project 6) climate scenarios. The result showed that: (1) The SWAT-MODFLOW model, which coupled with a crop waterlogging identification module, had good simulation results for LAI (Leaf Area Index), ET (Evapotranspiration), spring wheat yield, and groundwater level in the middle and lower reaches of the Bayin River; (2) The precipitation showed an overall increasing trend in the Bayin River watersheds over the next 80 years under the SSP1-2.6, SSP2-4.5 and SSP5-8.5 scenarios. The temperature showed a clear increasing trend over the next 80 years under the SSP2-4.5 and SSP5-8.5 scenarios; (3) Under the SSP1-2.6 scenario, the mountain runoff from the upper reaches of the Bayin River was substantially higher than in other scenarios after 2041. The mountain runoff in the next 80 years will decrease substantially under the SSP2-4.5 scenario. The mountain runoff over the next 80 years showed an initial decrease and then an increasing trend under the SSP5-8.5 scenario; (4) During the historical period, the crop waterlogging risk area was 10.9 km2. In the next 80 years, the maximum crop waterlogging area will occur in 2055 under the SSP1-2.6 scenario. The minimum crop waterlogging area, 9.49 km2, occurred in 2042 under the SSP2-4.5 scenario. The changes in the area at risk of crop waterlogging under each scenario are mainly influenced by the mountain runoff from the upper reaches of the Bayin River.
1. Introduction
The impact of changes in precipitation and temperature on agricultural production due to climate change has become a hot research topic [1,2,3]. Changes in precipitation and temperature may alleviate or exacerbate temperature and water stress in crops, affecting the growth period, crop growth [4], and finally the yield [5]. Waterlogging refers to the damage to plants by water stress due to excess soil water in the crop’s root zone that exceeds the maximum water holding capacity of the field [6]. It is one of the major disasters affecting agricultural production [6,7]. Heavy rainfall [8], floods [9], and phreatic rise [10] caused by climatic factors can cause crop waterlogging.
Mandal et al. [1] in Sundarbans, southwest Bangladesh, showed that climate change has led to increased rainfall and severe crop waterlogging in the region and suggests that land reshaping and crop planting restructure might reduce crop waterlogging in the region. Baffour-Ata et al. [2] in the northern part of Ghana found that increased temperature due to climate change enhanced photosynthetic capacity and increased respiratory cycle duration, thereby shortening crop production time and reducing crop yield and quality. In addition, excess rainfall induces widespread waterlogging, which further reduced crop yields. Sun et al. [3] analysed the effects of temperature and precipitation on grain yield in major grain-producing areas in China based on the Coupled Model Intercomparison Project 6 (CMIP6) global model (BCC-CSM2-Mr) and showed that water stress caused by increased precipitation would reduce grain yield in some areas. All the studies above assessed and analysed crop waterlogging as a direct result of climate change. However, few studies have addressed crop waterlogging indirectly caused by changes in regional temperature and precipitation. For instance, climate change may increase groundwater recharge in inland river basins in arid regions, which in turn may raise the regional groundwater level and eventually cause crop waterlogging in mid- and downstream (high groundwater level) areas [11].
Groundwater is an important link in the water cycle in inland river basins in arid regions, and its recharge and discharge determine the changes in regional groundwater levels [12]. Accurate characterization of groundwater level dynamics in arid regions is a prerequisite for waterlogging risk assessment and prediction [12]. As one of the most important tools and means for simulating large regional scale water cycle processes, hydrological models can reproduce and predict the groundwater recharge and discharge processes [13]. As a typical, semi-distributed hydrological model, SWAT (Soil and Water Assessment Tool) has a strong physical basis. Suitable for complex watersheds with different soil types, surface cover conditions, slopes, and management conditions, it can be used to simulate crop growth processes and mechanisms of their interaction with the water cycle [14]. To date, SWAT models have produced good results for predicting disasters such as floods [15], hydrological droughts [16], and soil erosion [17]. However, their application in crop waterlogging risk assessment and prediction needs to be expanded.
This study focuses on crop waterlogging caused by rising groundwater levels in inland river basins in arid regions where groundwater dominates and SWAT has little capability in simulating groundwater [18]. Currently, researchers have coupled the SWAT model with a specialized groundwater model, MODFLOW (Modular Finite Difference Groundwater Flow Model), which combines the former’s advantages in crop growth and surface water simulation with the latter’s strengths in groundwater simulation [19,20,21]. The coupled SWAT-MODFLOW model has been applied to the groundwater-surface water conversion relationship, groundwater recharge, and groundwater level prediction in the South Platte River Basin region in Colorado, USA [19], Limpopo River Basin area in Africa [20], and Shiraz Basin in Southwest Iran [21], outperforming the SWAT model.
The large area of land in the middle and lower reaches of the Bayin River is an important food production base in the Qaidam Basin (Delingha Irrigation District and Gahai Irrigation District), where spring wheat and goji (wolfberry) are widely cultivated [19,22]. In recent years, under climate warming and humidification, the groundwater level in this area has risen significantly and this has caused waterlogging [12]. This study aims to add a crop waterlogging identification module to the coupled SWAT-MODFLOW model. Based on an accurate simulation of crop growth and water cycle processes in the middle and lower reaches of the Bayin River, combining the SSP1-2.6, SSP2-4.5, and SSP5-8.5 climate change scenarios simulated by the BCC-CSM2-MR model under the CMIP6, the paper aims to accurately identify and predict changes in groundwater levels, crop growth and crop waterlogging risk areas under the different scenarios. This methodology will provide an important decision support tool for regional waterlogging prevention and management.
2. Materials and Methods
2.1. Research Area Overview
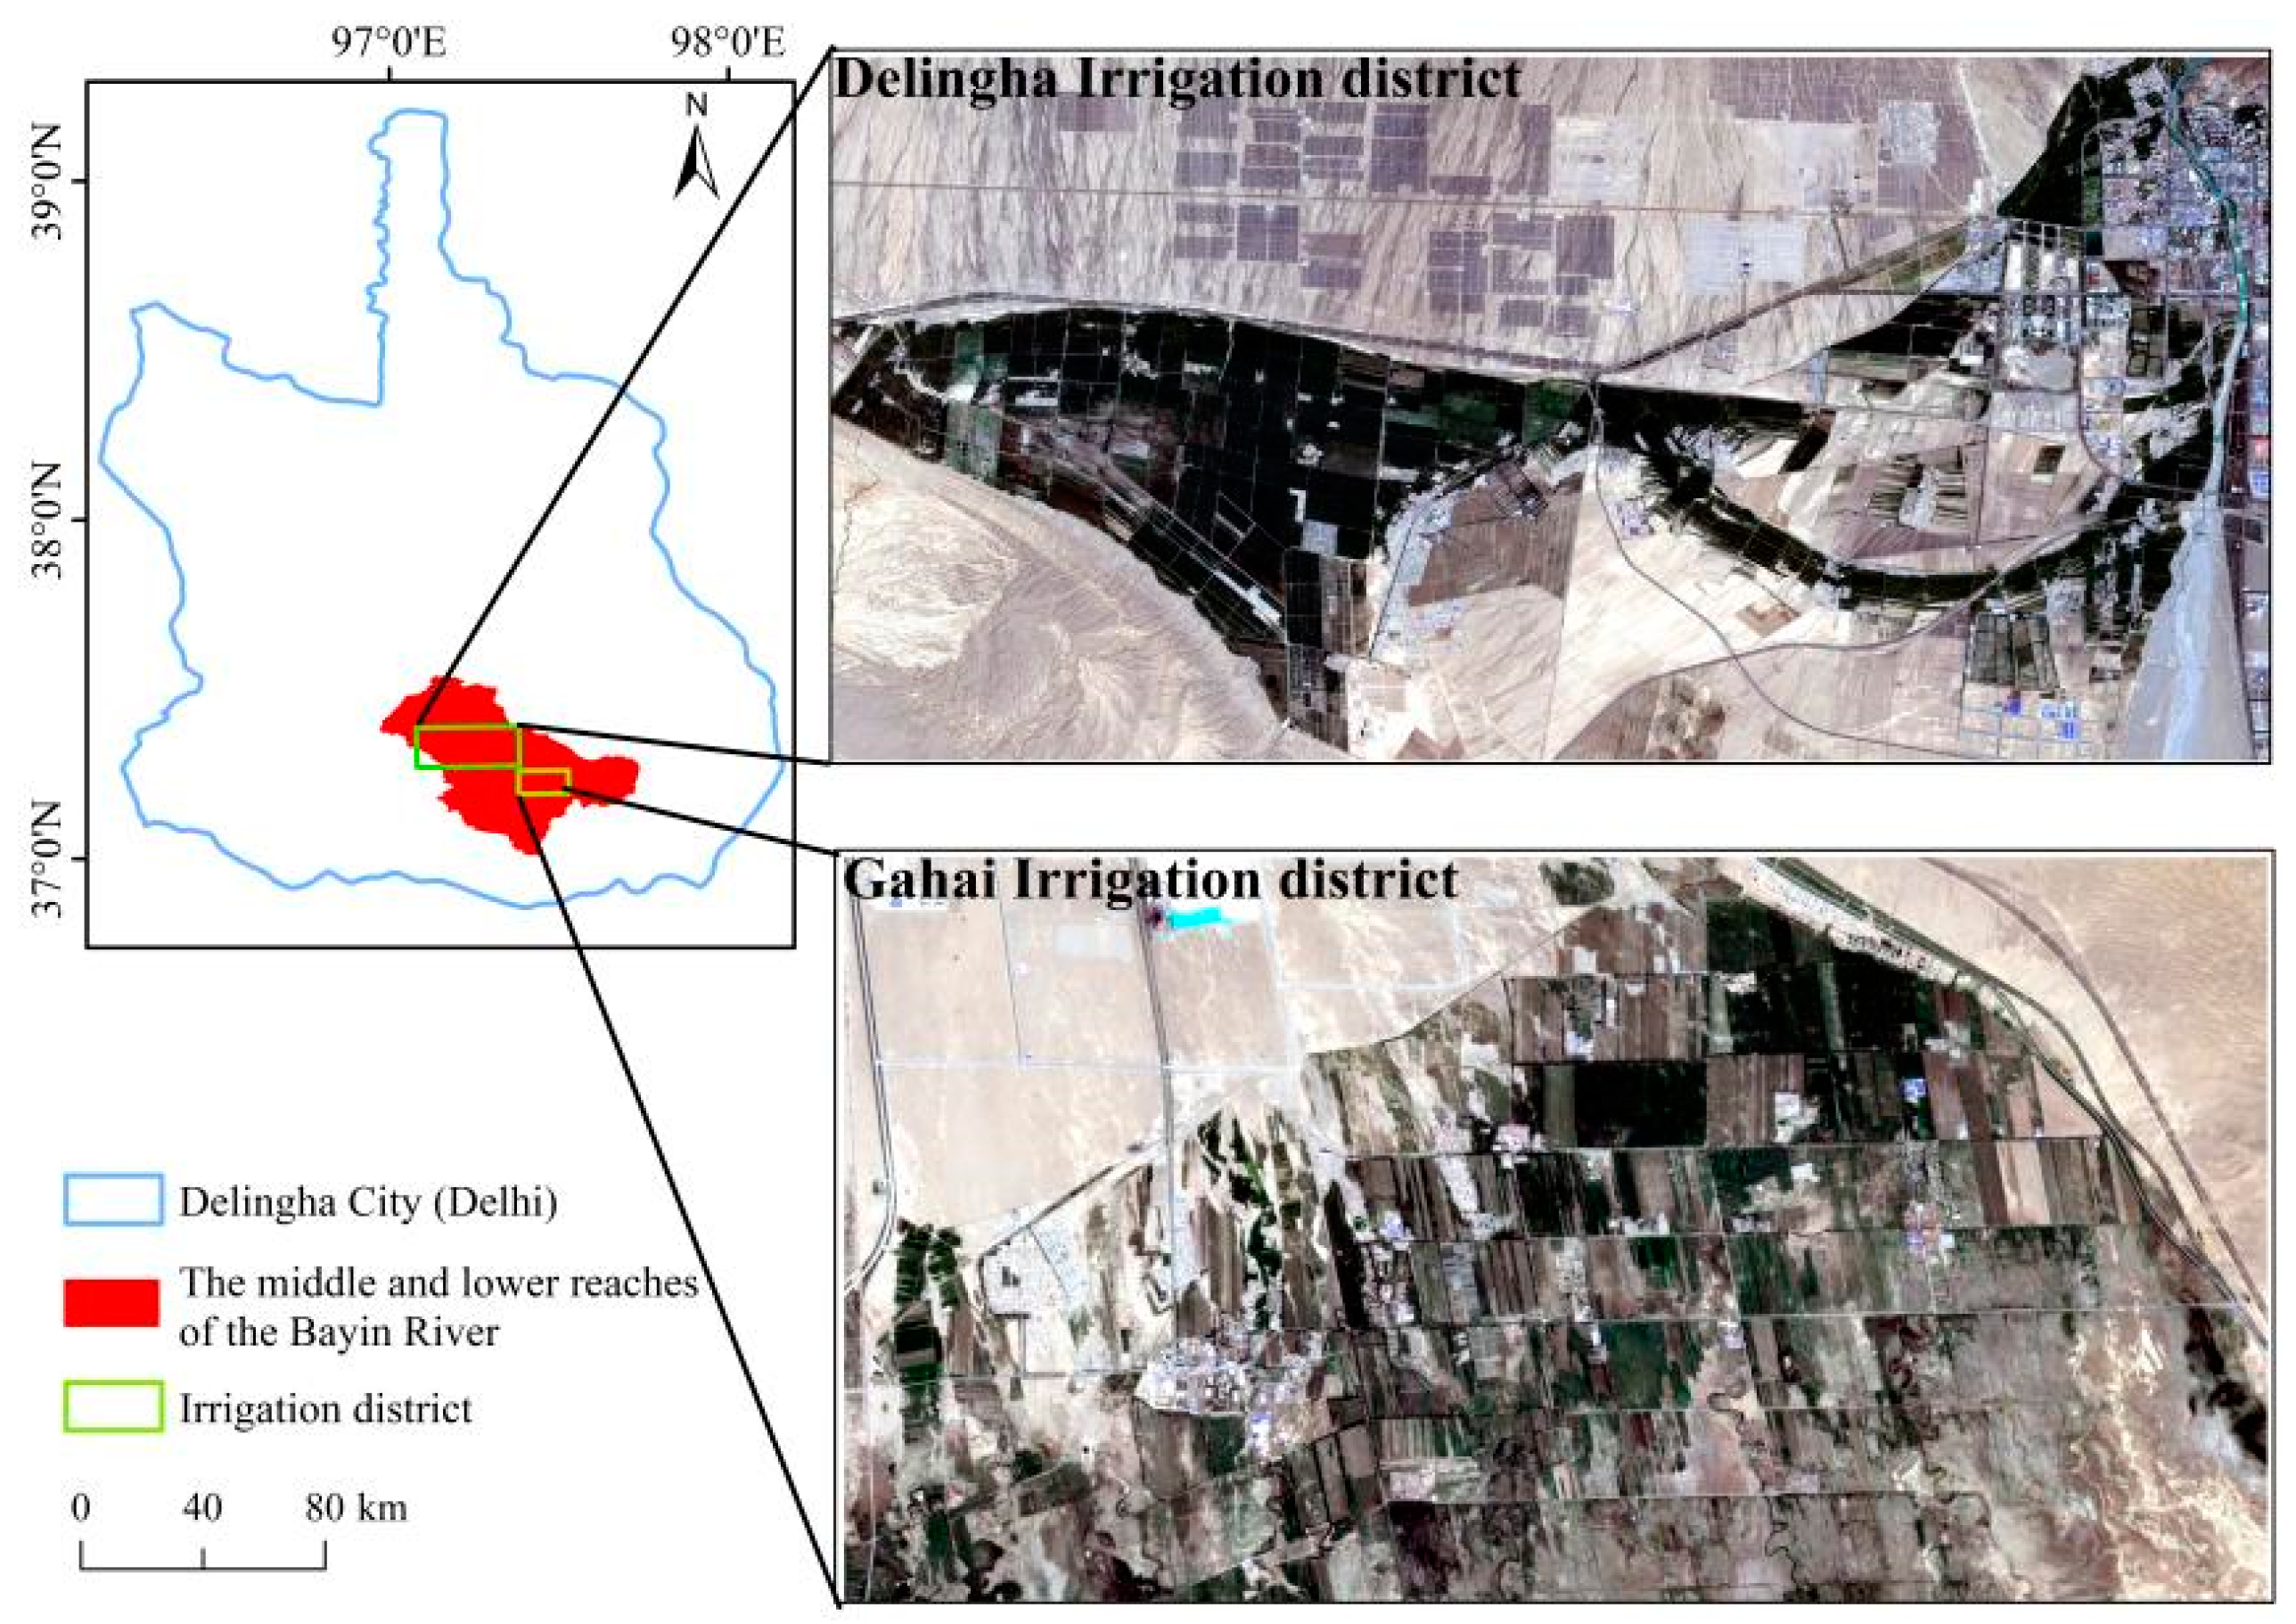
The city of Delingha (Delhi) is situated on the northeastern edge of the Qaidam Basin, at 96°15′–98°15′ E and 36°55′–38°22′ N (geographical system used: WGS84). It is connected to the Zongwulong Mountains in the north, the Denan Hills in the south, the Buhete Mountain in the east, and the Huaitou Tara in the west, with an average altitude of 2980 m and an area of approximately 27,700 km2 [23]. The area has a typical plateau-continental climate, with an average annual temperature of approximately 3 °C, annual precipitation of ~100 mm, evaporation of ~2400 mm, strong solar radiation, sufficient sunshine duration, and a large diurnal temperature fluctuation [12,23]. As an important agricultural oasis and food production base in the Qaidam Basin, the region has an arable land area of ~8529 hm2, the special geographical and climatic conditions which nurture crops, primarily spring wheat and goji berries. Spring wheat is the largest crop type in the sown area, followed by goji, which is a pioneer tree species and a featured cash crop for ecological restoration and conservation in the region [12,19,22]. The present study focused on the middle and lower reaches of the Bayin River (including the Delingha Irrigation District and Gahai Irrigation District) in the southern part of Delingha City (Figure 1). In recent years, climate change has led to increased precipitation, increased streamflow, and rising groundwater levels in the area, causing severe crop waterlogging [12].
2.2. Model and Validation
2.2.1. The SWAT-MODFLOW Model
SWAT is a physically-based, semi-distributed hydrological model consisting of modules for hydrology, climate, sediment transport, soil temperature, crop growth, nutrients, and agricultural management [24]. SWAT divides subwatersheds into hydrological response units (HRUs) with the same soil type, land use/land cover, and slope uniformity [25]. For each HRU, surface runoff, sediment content, and sediment transport were calculated independently for individual subwatersheds, and the yield of hydrological units of all subwatersheds was aggregated to obtain the total sum of runoff, sediment content, and sediment transport at the outlet of the basin [26]. The agricultural management module of the SWAT model can realistically represent the agricultural flood irrigation mode on soil slopes [26]; nevertheless, the SWAT model is largely incapable of simulating groundwater movement processes [27].
MODFLOW is a physically-based, distributional, three-dimensional (3D) groundwater model that uses the finite difference method to solve the differential equation of groundwater flow, aiming to simulate and predict the complex groundwater flow system [28]. However, the limitations of the MODFLOW model are manifested in its dependent operations on the input of some specific conditions (such as recharge and evapotranspiration) [29,30]. MODFLOW usually presents these specific conditions in terms of parameters, the values of which are determined during the model calibration process. These parameters are calibrated to match realistic conditions in order to improve the accuracy of the final groundwater simulation, which is very challenging [29,30].
The SWAT-MODFLOW coupled model takes advantage of the respective strengths of the above two models by feeding an input of HRU-based groundwater recharge calculated by the SWAT model to the MODFLOW model, and MODFLOW calculates the groundwater flow between the aquifer and the river channel and returns it back to SWAT [31,32]. In this way, the spatiotemporal characteristics of the groundwater-dominated watersheds can be reasonably displayed, and the water cycle processes can be more accurately modelled.
2.2.2. The SWAT Crop Growth Module
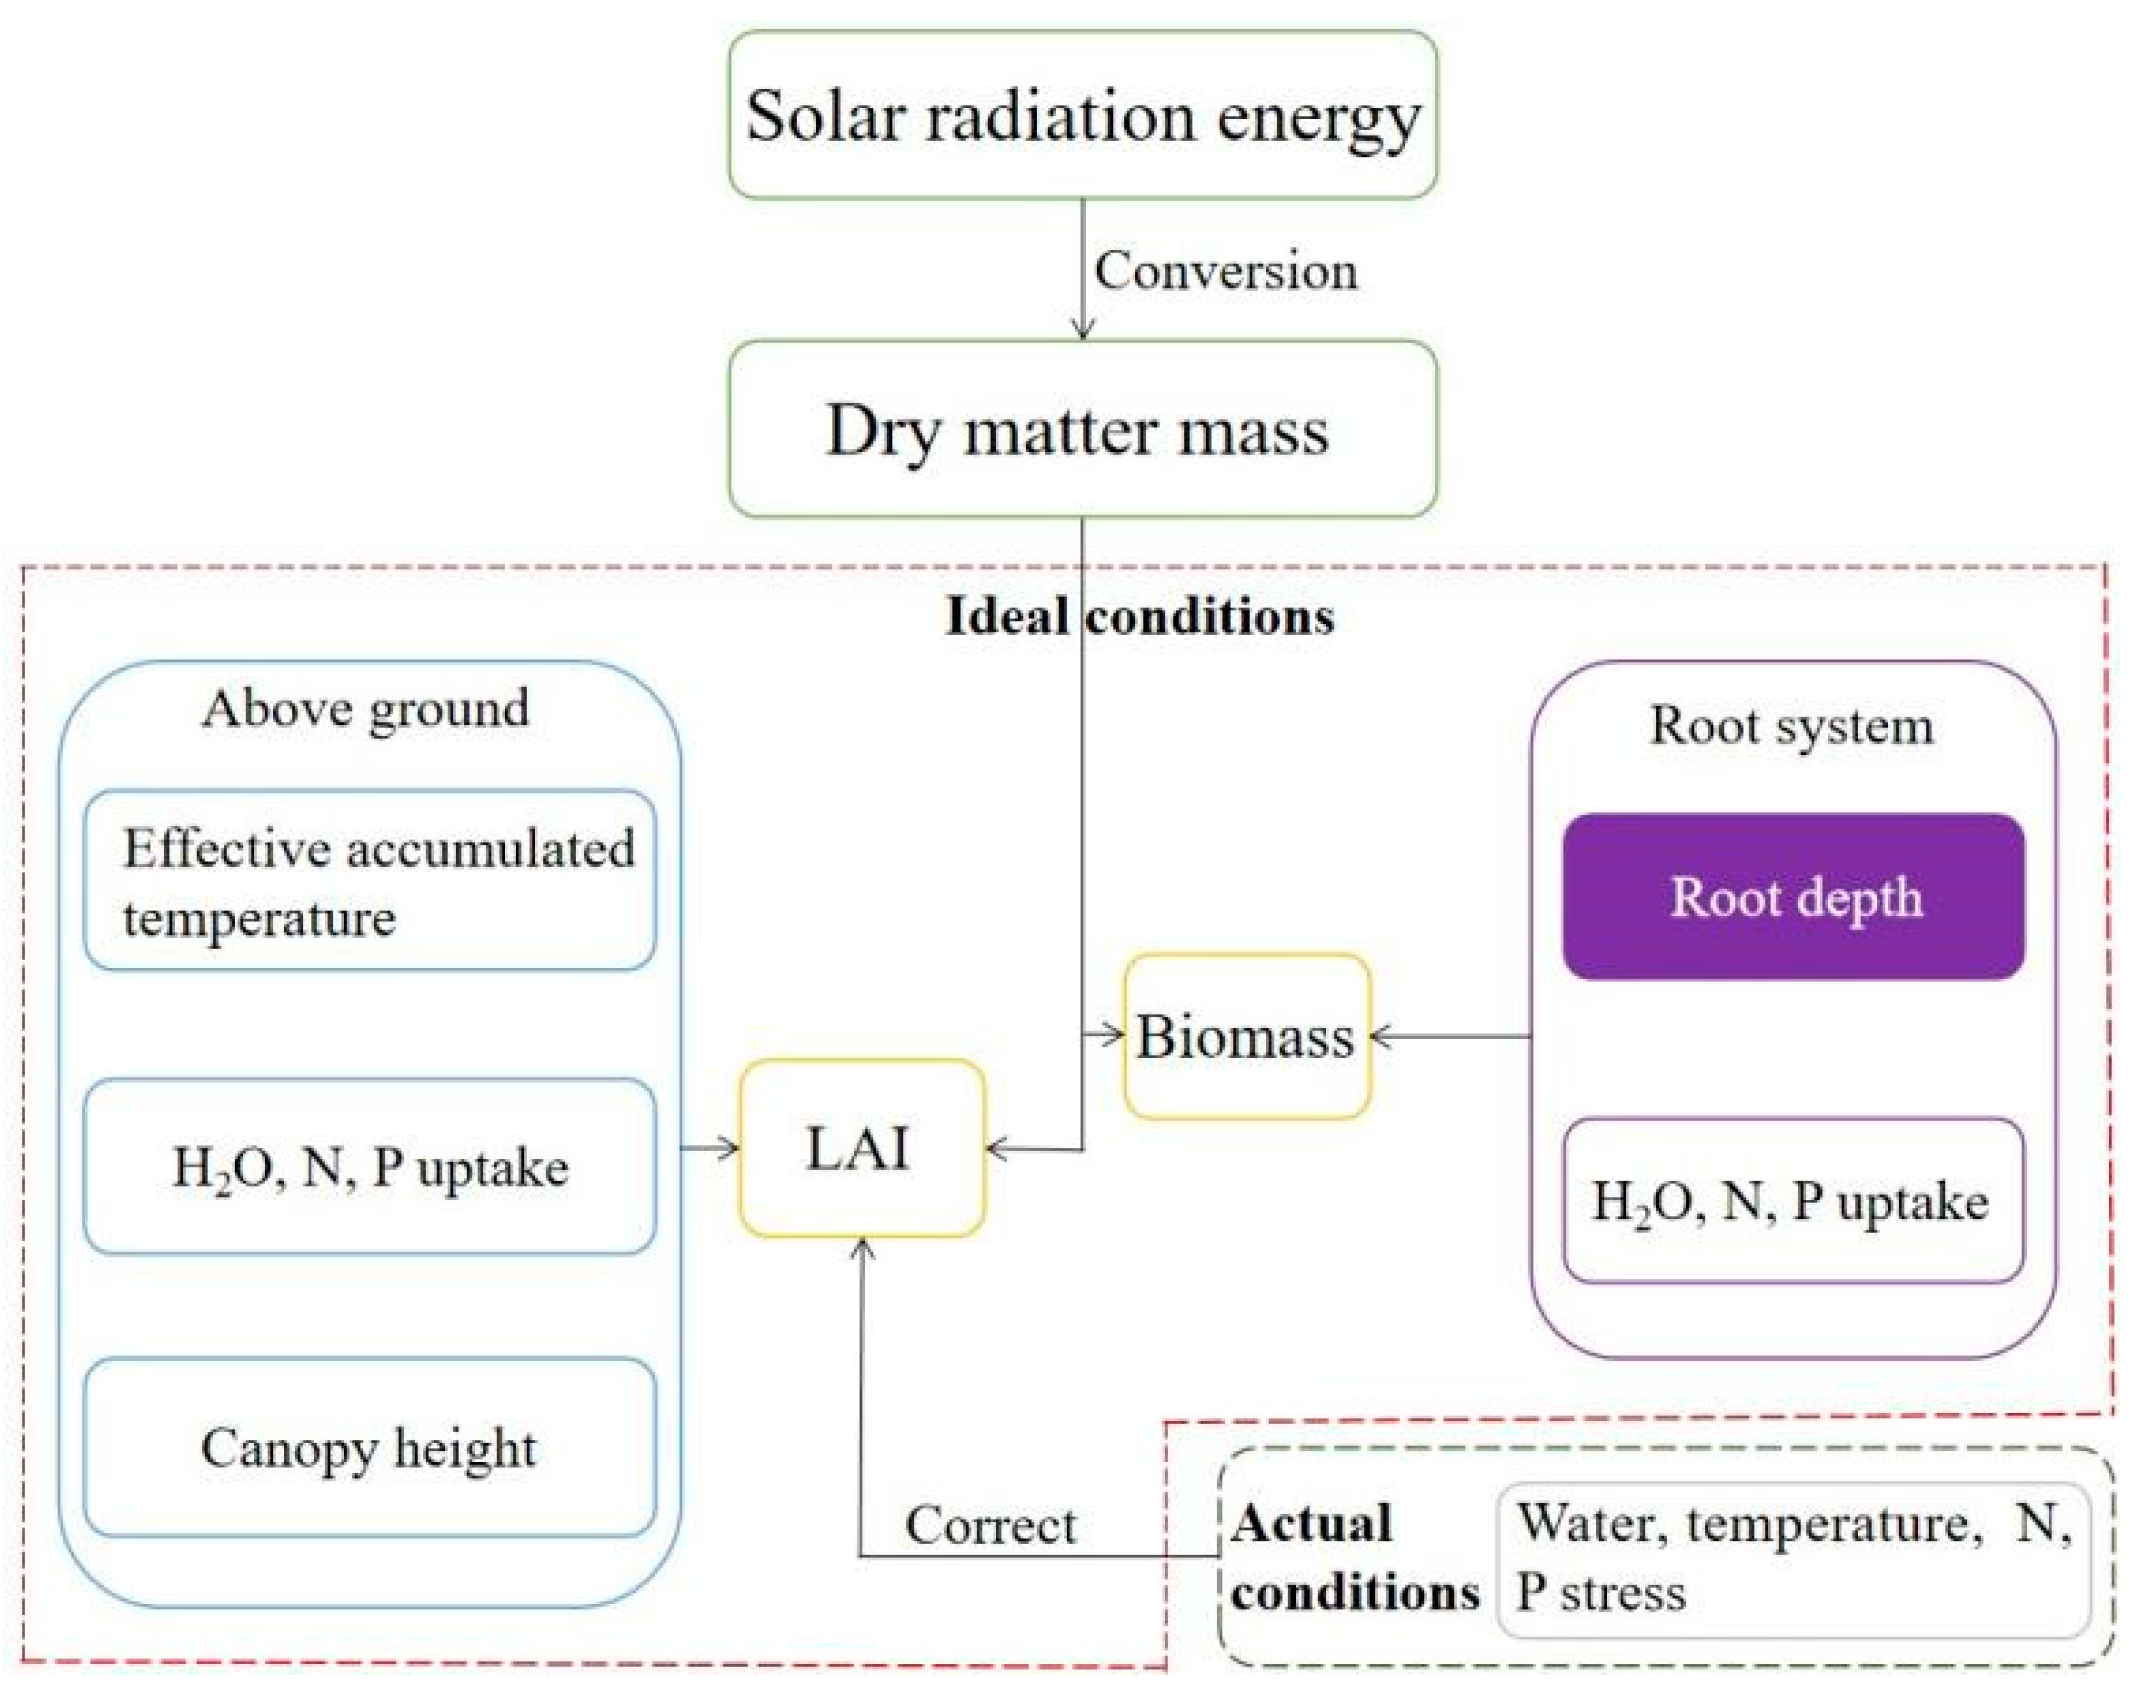
The SWAT crop growth module simulates the growth and yield formation of various crops [26]. The module mainly converts solar radiation energy into dry matter mass, which is estimated by observing the dynamics of leaf area change under potential and ideal conditions, involving parameters such as radiation utilization, maximum leaf area index (LAI), canopy height, root depth, and nitrogen and phosphorus uptake, and biomass [26]. The simulation process is shown in Figure 2. The crop growth module distinguishes between annual and perennial crops to determine root water and nutrient uptake, transpiration, and crop yield [26].
SWAT assumes a perennial crop with roots that penetrate to the maximum rooting depth of the soil throughout the growing season [26].
Root depth simulations for annual crops showed a linear change from 10.0 mm at the beginning of the growing season to the maximum root depth at frPHU = 0.40 [26].
In Equations (1)–(3), zroot refers to the depth at which roots develop in the soil (mm), zroot,mx refers to the maximum depth at which roots develop in the soil (mm), and frPHU is the proportion of potential accumulated heat units of the plant on a certain day of the growing season [26].
2.2.3. The SWAT Crop Irrigation Module
Irrigation in the HRU can be scheduled by the user (manual irrigation) or performed automatically by SWAT in response to soil water deficit (automatic irrigation) [26]. The manual irrigation module triggers its operation by schedule or thermal unit [26]. The automatic irrigation module triggers the irrigation event via a water stress threshold or a soil water deficit threshold [26]. When water stress causes actual crop growth to be lower than the growth corresponding to the threshold, automatic irrigation will be triggered until the amount of water used equals the maximum amount input by the user [26]. When based on the soil water deficit threshold, automatic irrigation will be triggered if the profile soil water content is below the field water holding capacity but greater than the soil water deficit threshold [26].
2.2.4. Crop Waterlogging Identification Module
Crop waterlogging stress is mainly caused by excess water in the root zone, which inhibits gaseous exchange with the atmosphere, resulting in an oxygen-deficient (anaerobic) environment for the root system [33]. The SWAT model’s crop growth module considers only the water stress by soil water deficit, not the water stress by excess soil water. Therefore, the SWAT-MODFLOW model cannot be used to directly simulate and predict crop waterlogging due to rising groundwater levels.
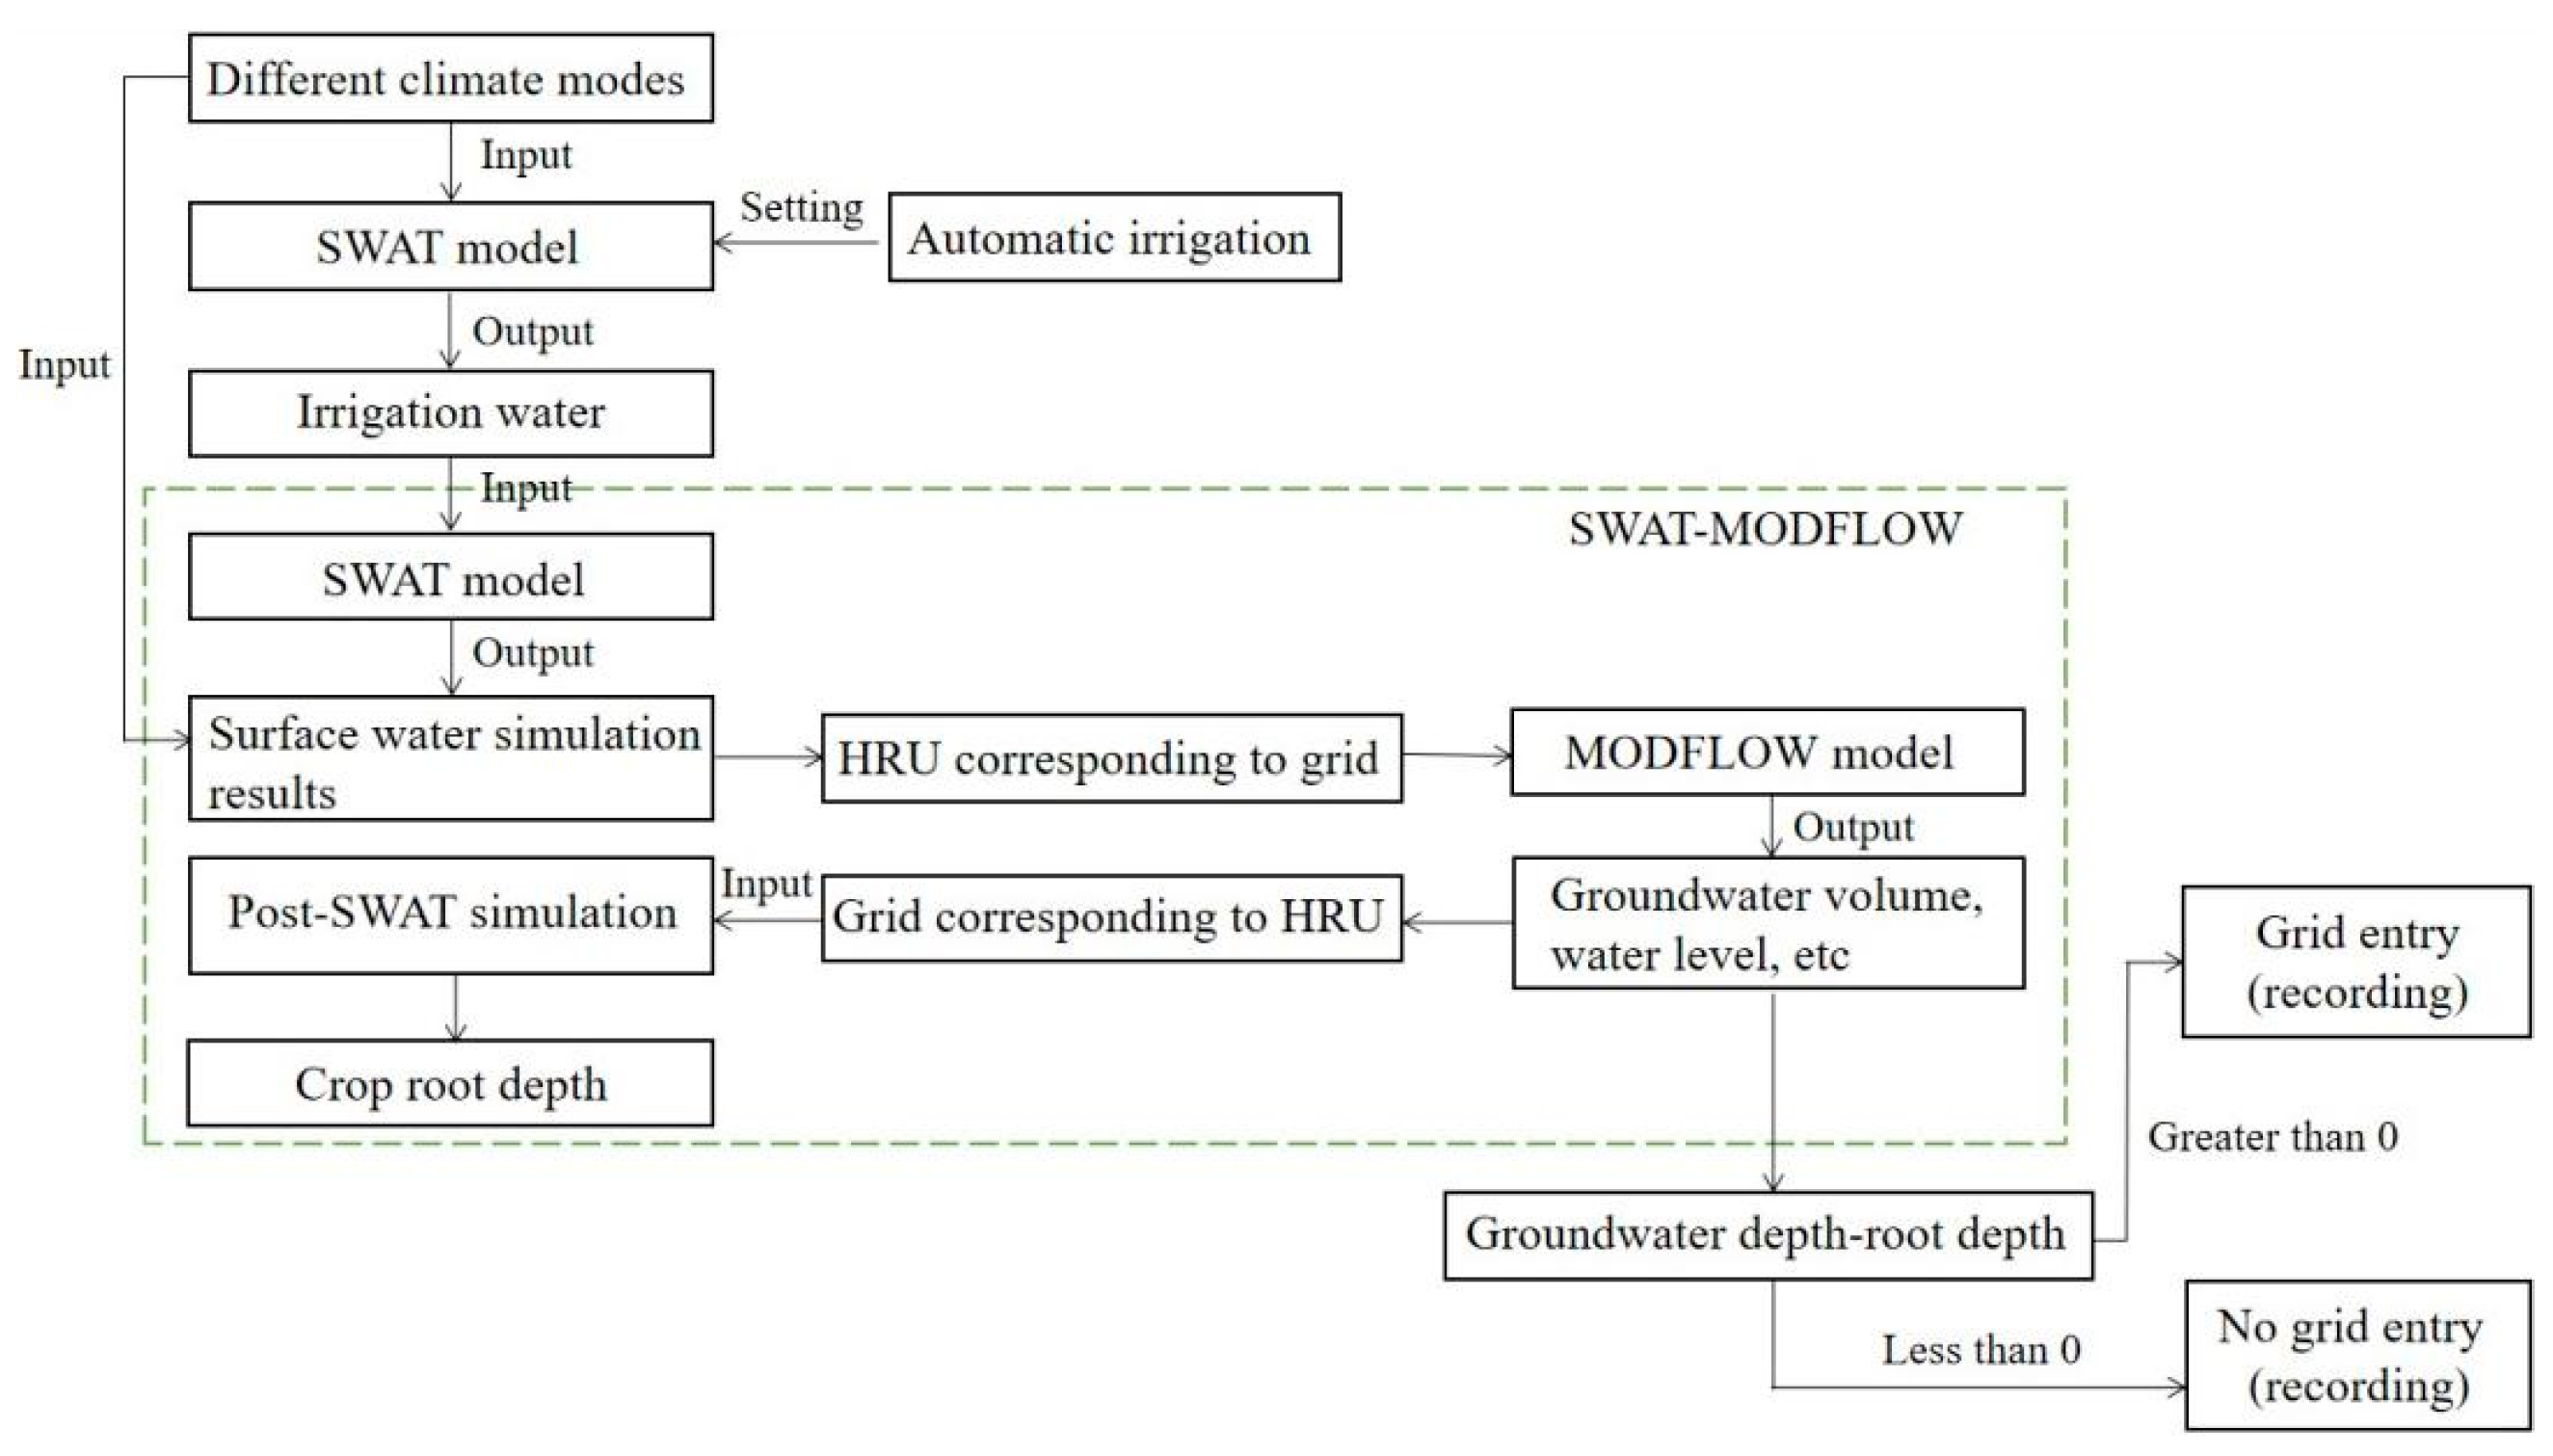
In this study, we added a crop waterlogging identification module to the existing SWAT-MODFLOW model (Figure 3). The process of identifying and predicting crop waterlogging risk areas under different climate scenarios was: (1) The SWAT model’s crop growth module was first used to simulate the growth of wheat and goji under different climatic conditions in an automatic irrigation mode, and the irrigation water consumption was recorded, which was used as the assumed optimal irrigation amount for crop growth. (2) We assumed in addition to precipitation and optimal irrigation water, groundwater recharge of soil water in the crop root zone was defined as “excess” water. Under this assumption, the SWAT-MODFLOW model was applied to simulate the water cycle and crop growth process based on optimal irrigation in the research area under different climatic conditions and to determine the risk of crop waterlogging according to the difference between daily groundwater depth and crop root depth. A positive difference represents a waterlogging risk unit and the corresponding grid was recorded. Negative differences were not recorded. (3) Geographic information system (GIS) technology was used to gather all waterlogging risk units and outlined their boundaries to confirm waterlogging risk areas.
2.2.5. SWAT-MODFLOW Modelling and Validation
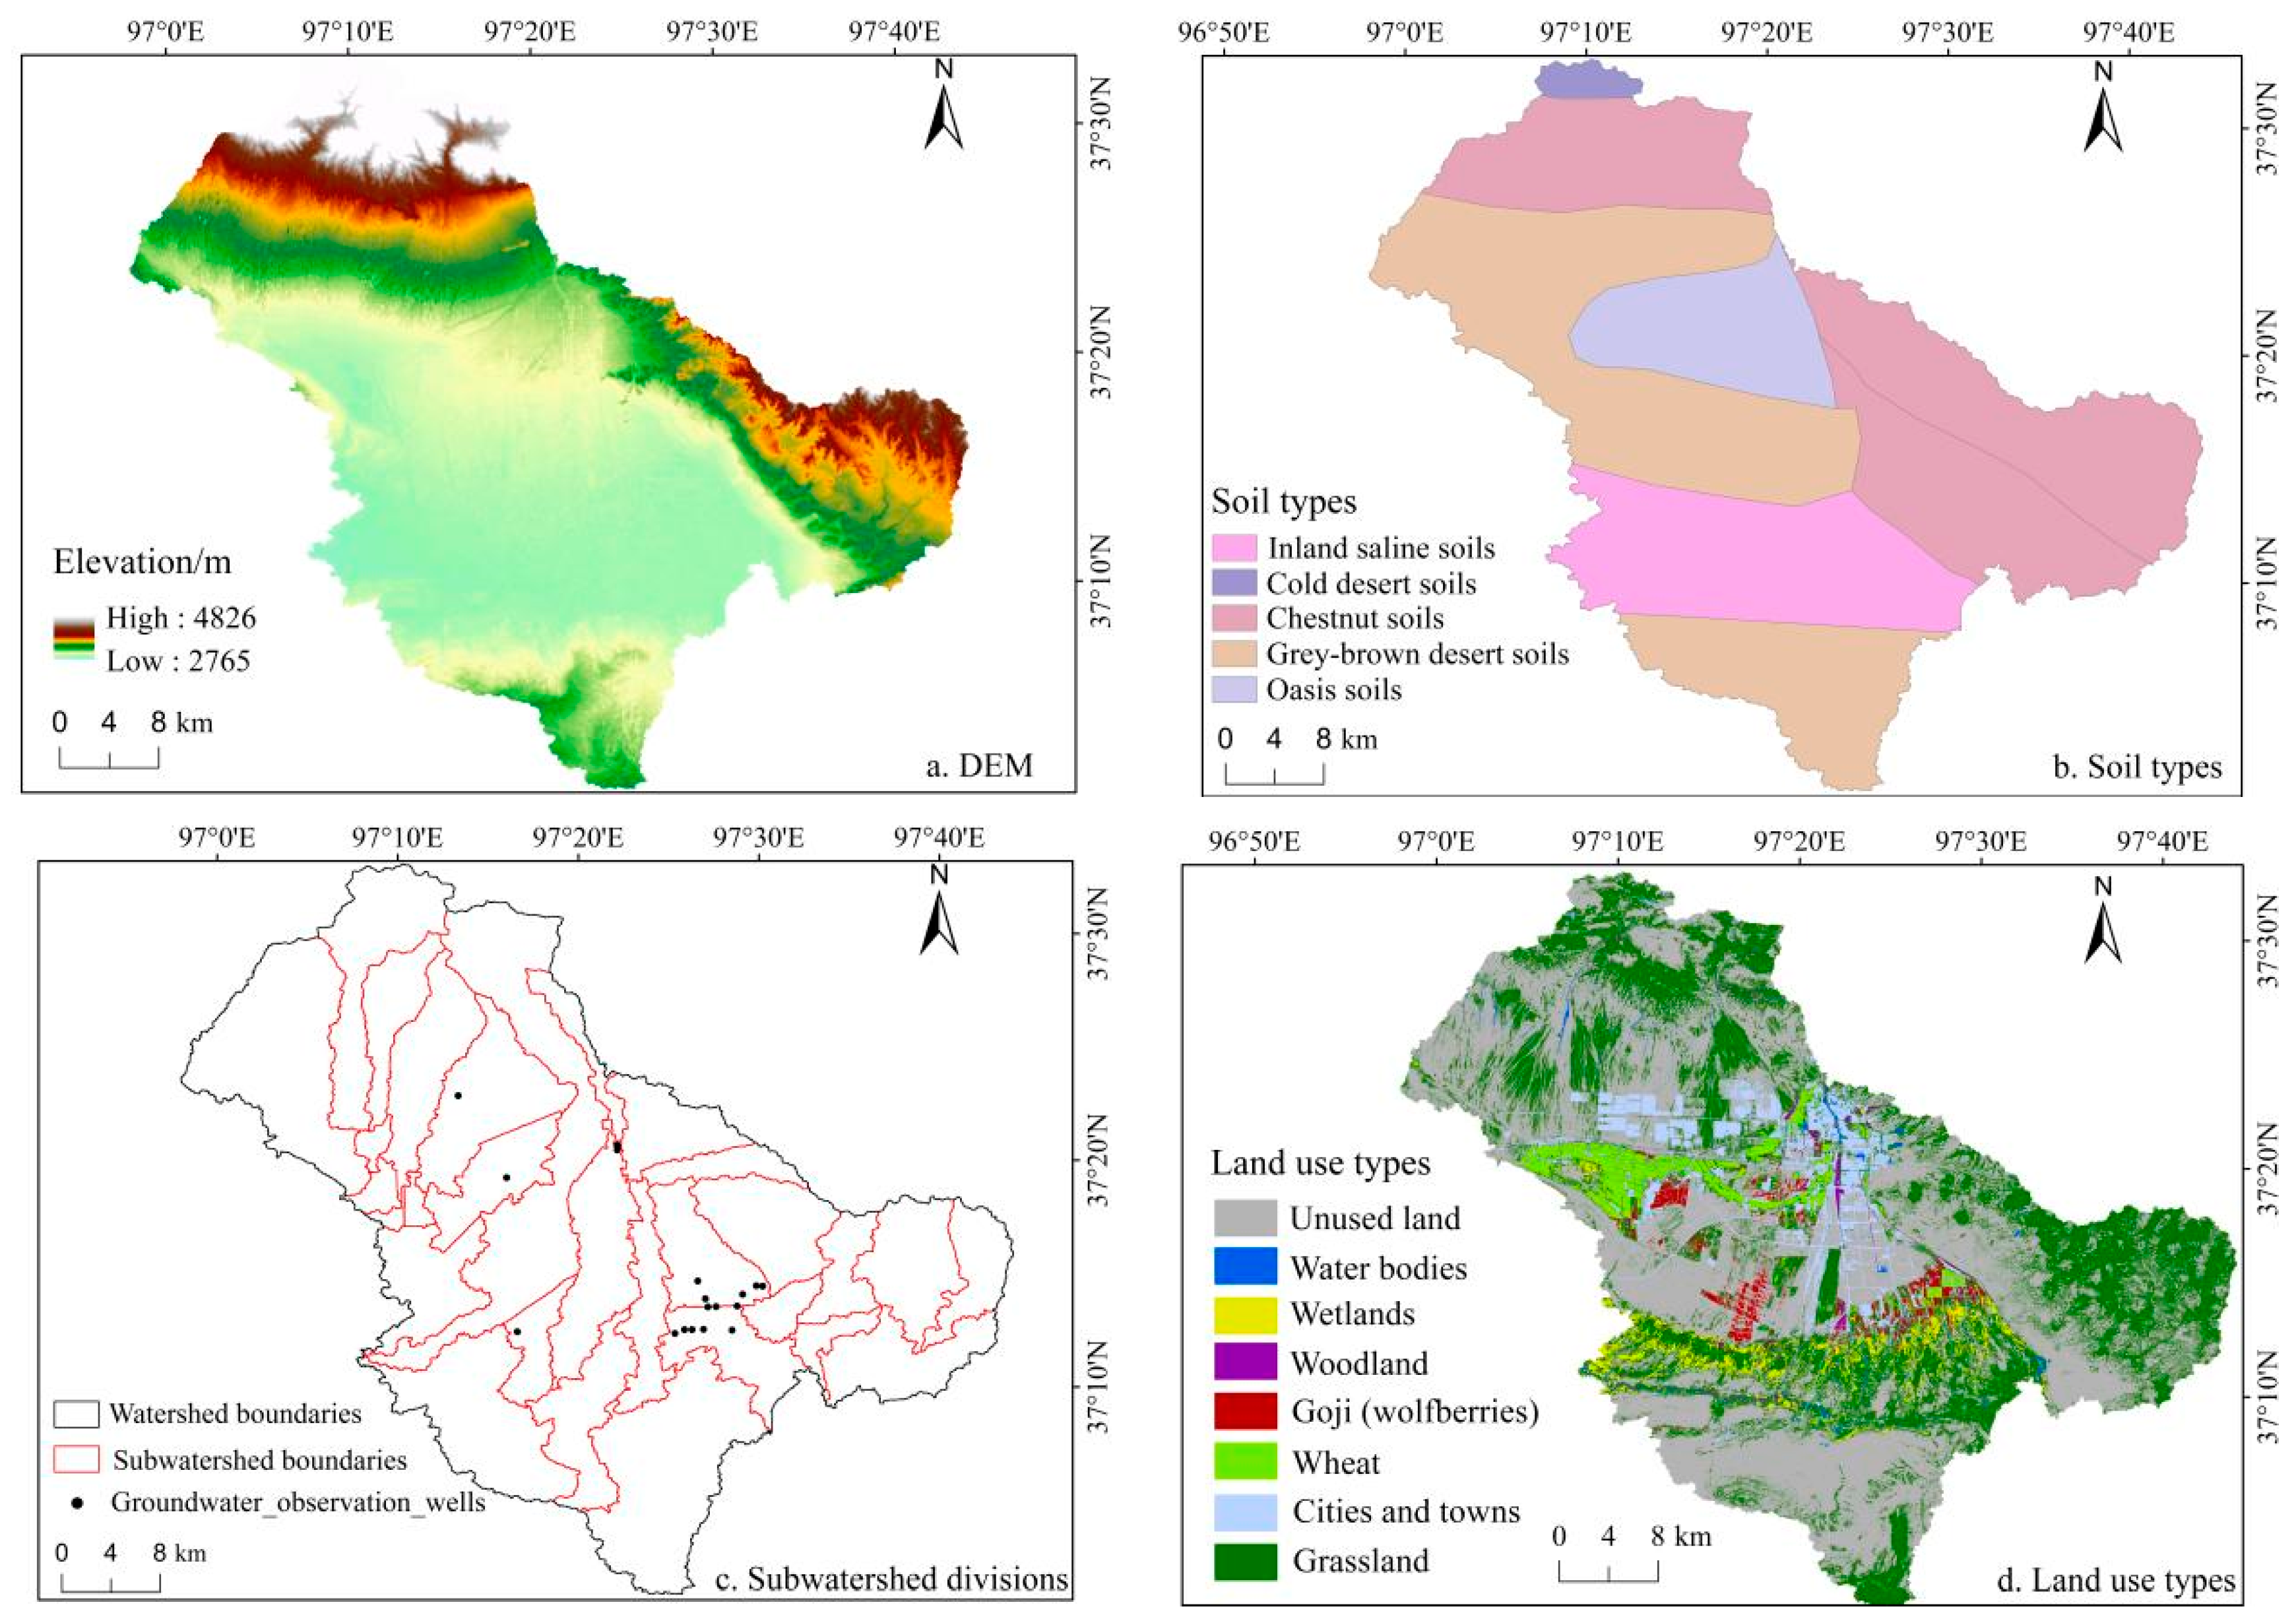
In this paper, we built a SWAT model using selected input data such as daily precipitation, temperature, relative humidity, wind speed, and solar radiation data from the Delingha station, combining other data, including the 30 m resolution digital elevation model (DEM) data (http://gdex.cr.usgs.gov/gdex/) (accessed on 15 September 2021) (Figure 4a), national 1:4 million soil type data (Figure 4b), and land use type data based on the Landsat 30 m Remote Sens. image, with a classification accuracy of >90% (Figure 4d). Soil attribute data were acquired from the Soils of Qinghai [34] and the Delingha City Journal [35].
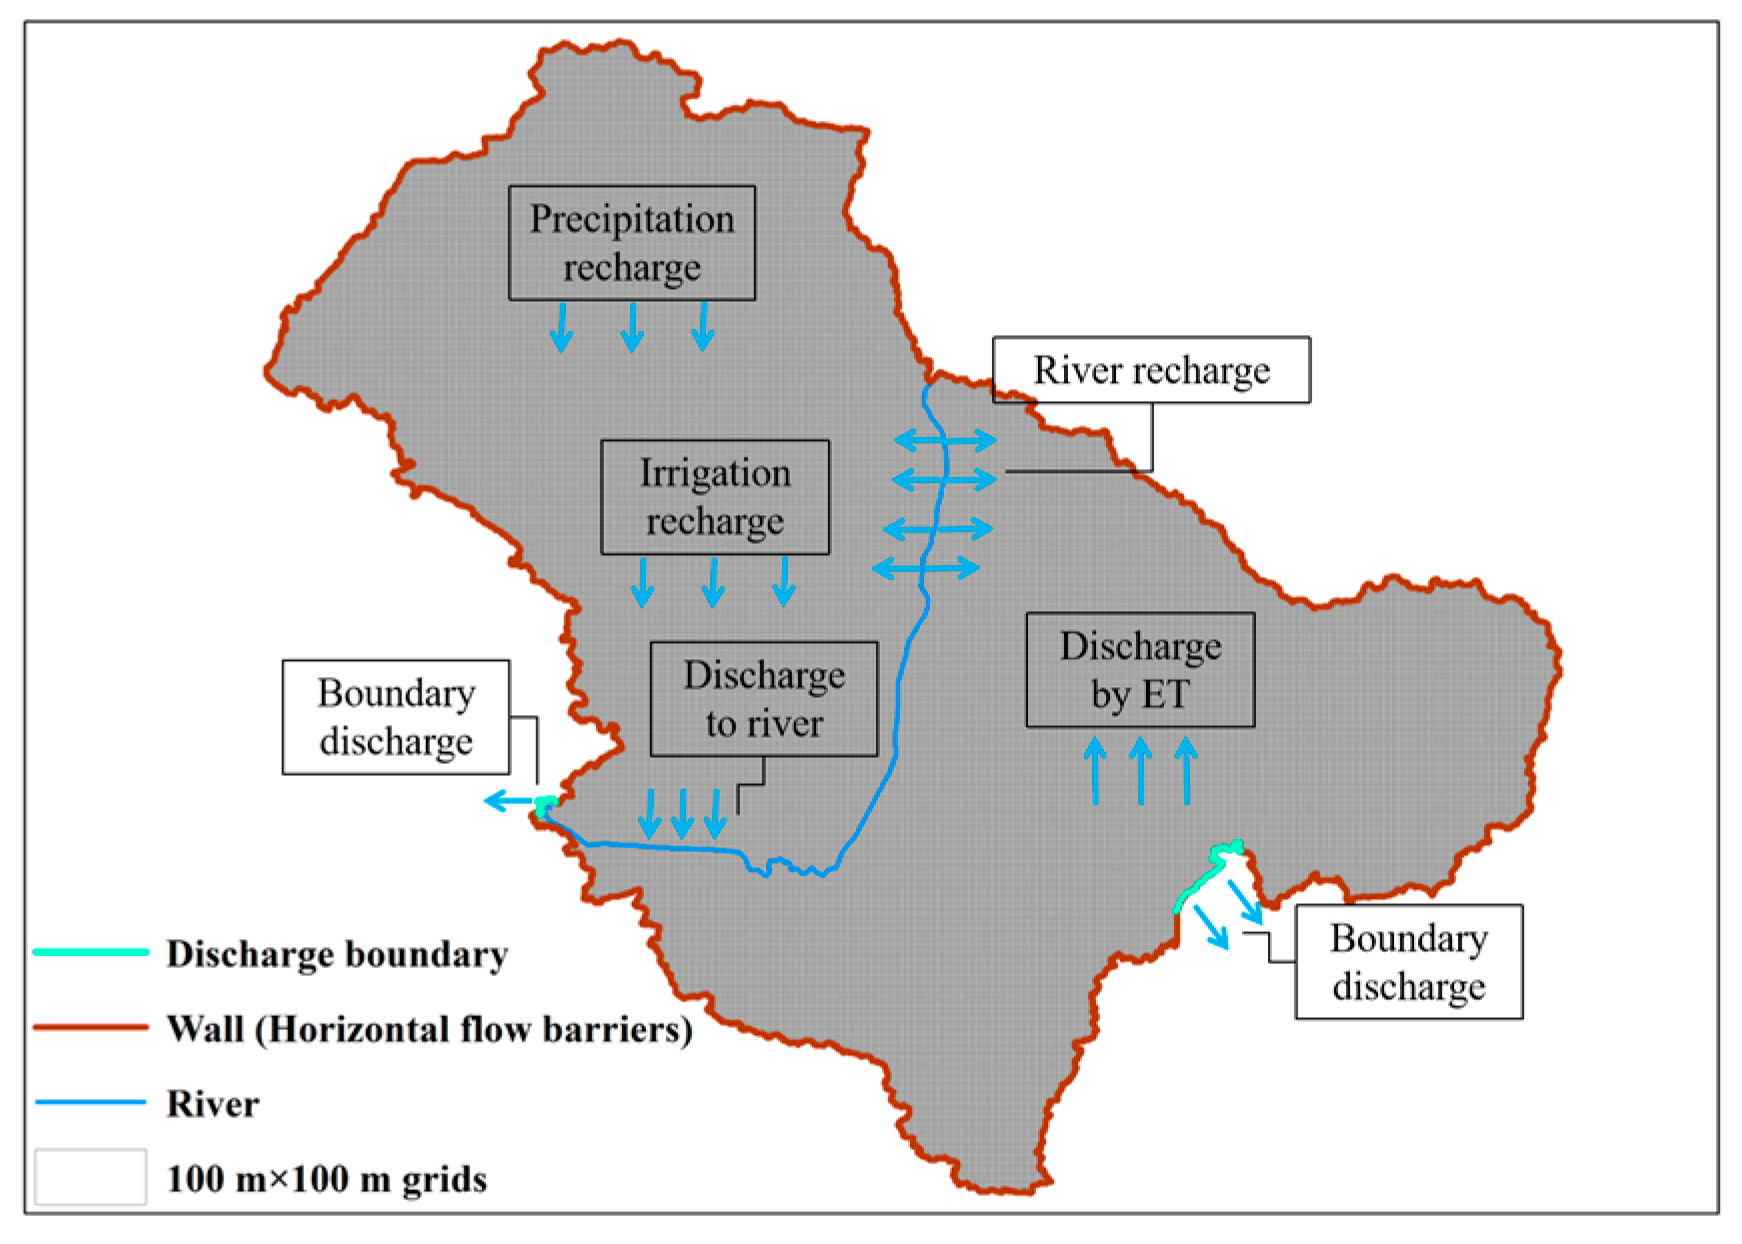
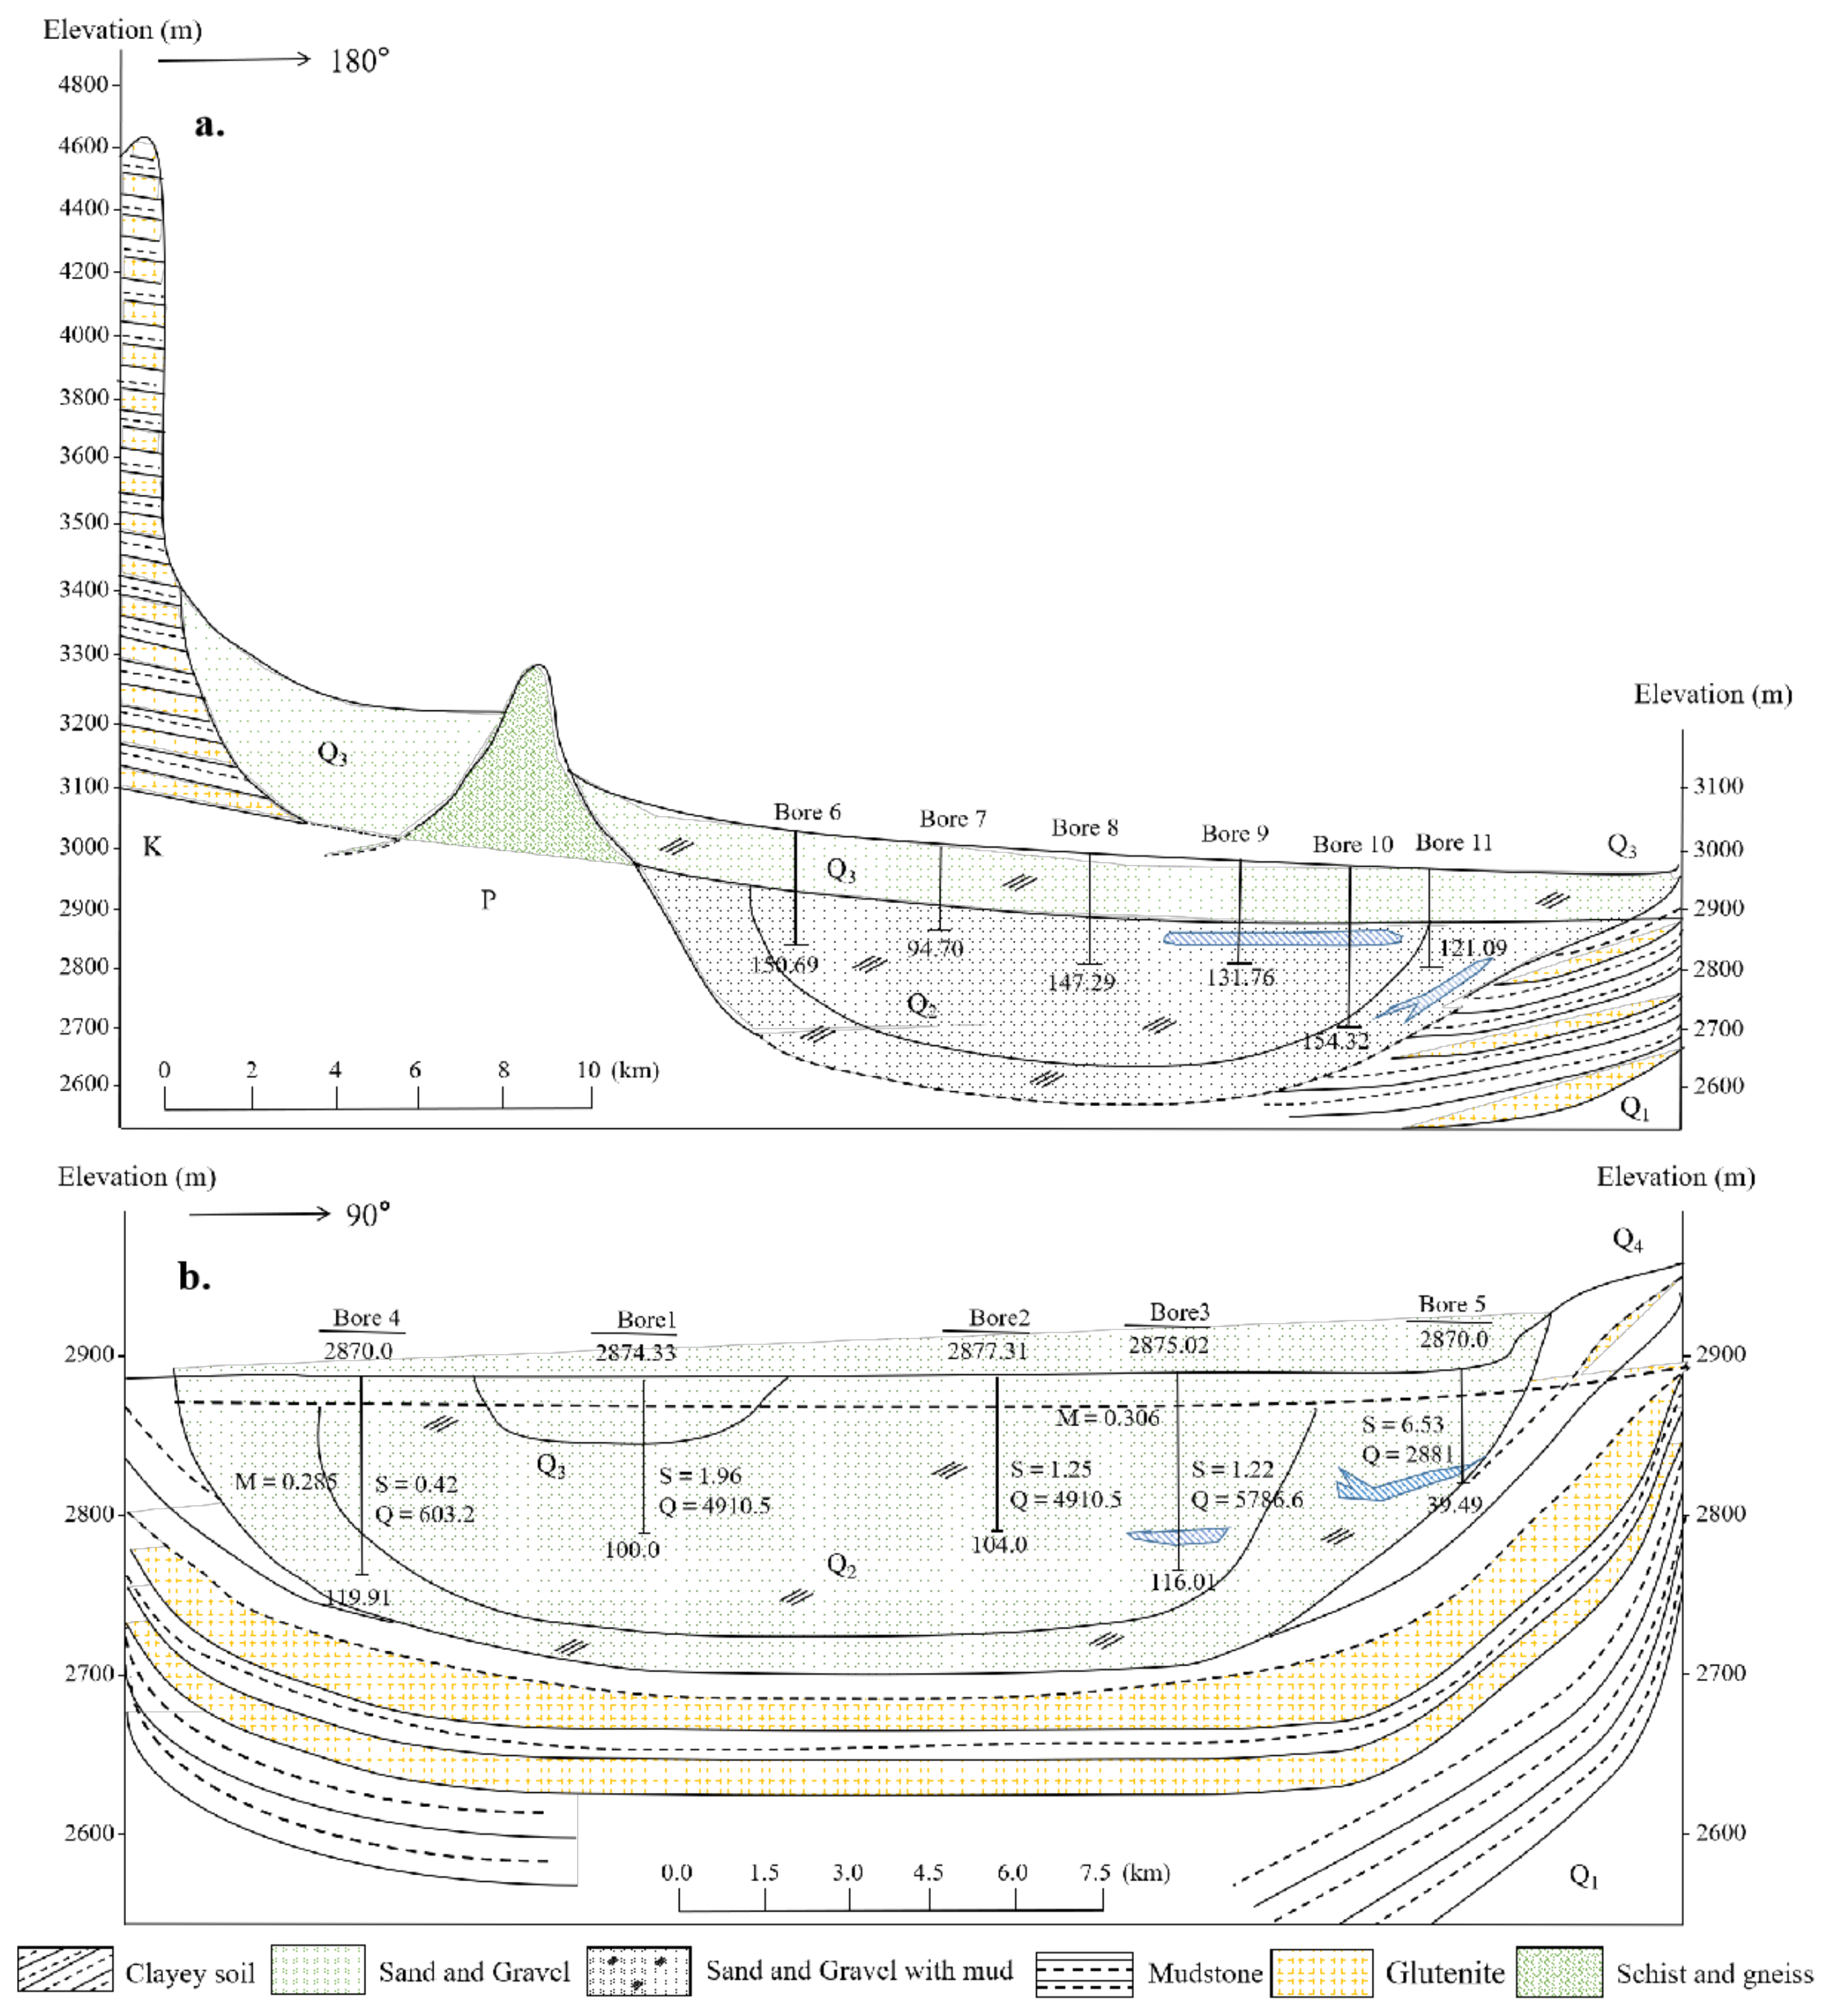
We used groundwater level observation data, river network data, DEM data, and related hydrogeologic parameters, etc., reported in [36] to build the original MODFLOW model. Sources and sinks for the model include time-dependent and spatially variable recharge reported in [36], evapotranspiration from shallow groundwater, groundwater flow to adjacent basins, and groundwater interaction with the stream network employing the Stream package (Figure 5). The original MODFLOW model encompasses the entire study area. The region was discretized into finite different grid cells with a lateral dimension of 100 m by 100 m, aligned in a grid consisting of 628 rows and 680 columns (Figure 5). Figure 6 shows the hydrogeological cross-section of the study area. The aquifer of the study area is mainly upper and middle Pleistocene of Quaternary with sand and gravel. While the lower Pleistocene of Quaternary and its lower bedrock could be set as aquifuge because of the poor water storage. Thus, the aquifer discretized vertically into one layer [36]. The simulation period of the model is from 2001 to 2020.
The original MODFLOW was calibrated by the following steps:
- (1)
- Distribute the study to different areas based on observed hydrogeologic conditions and sediment characteristics of the Quaternary System. Then, define the initial values for the specific yield (μ) and transmissibility (T) for each area.
- (2)
- Calibrate the transmissibility (T) for each area based on observed annual average river water leakage, spring spillage in lower reaches, and groundwater level counter.
- (3)
- Calibrate the specific yield (μ) for each area based on the observed annual groundwater variation.
- (4)
- Repeat steps 2 and 3 until the simulated groundwater level better matches the observed groundwater level.
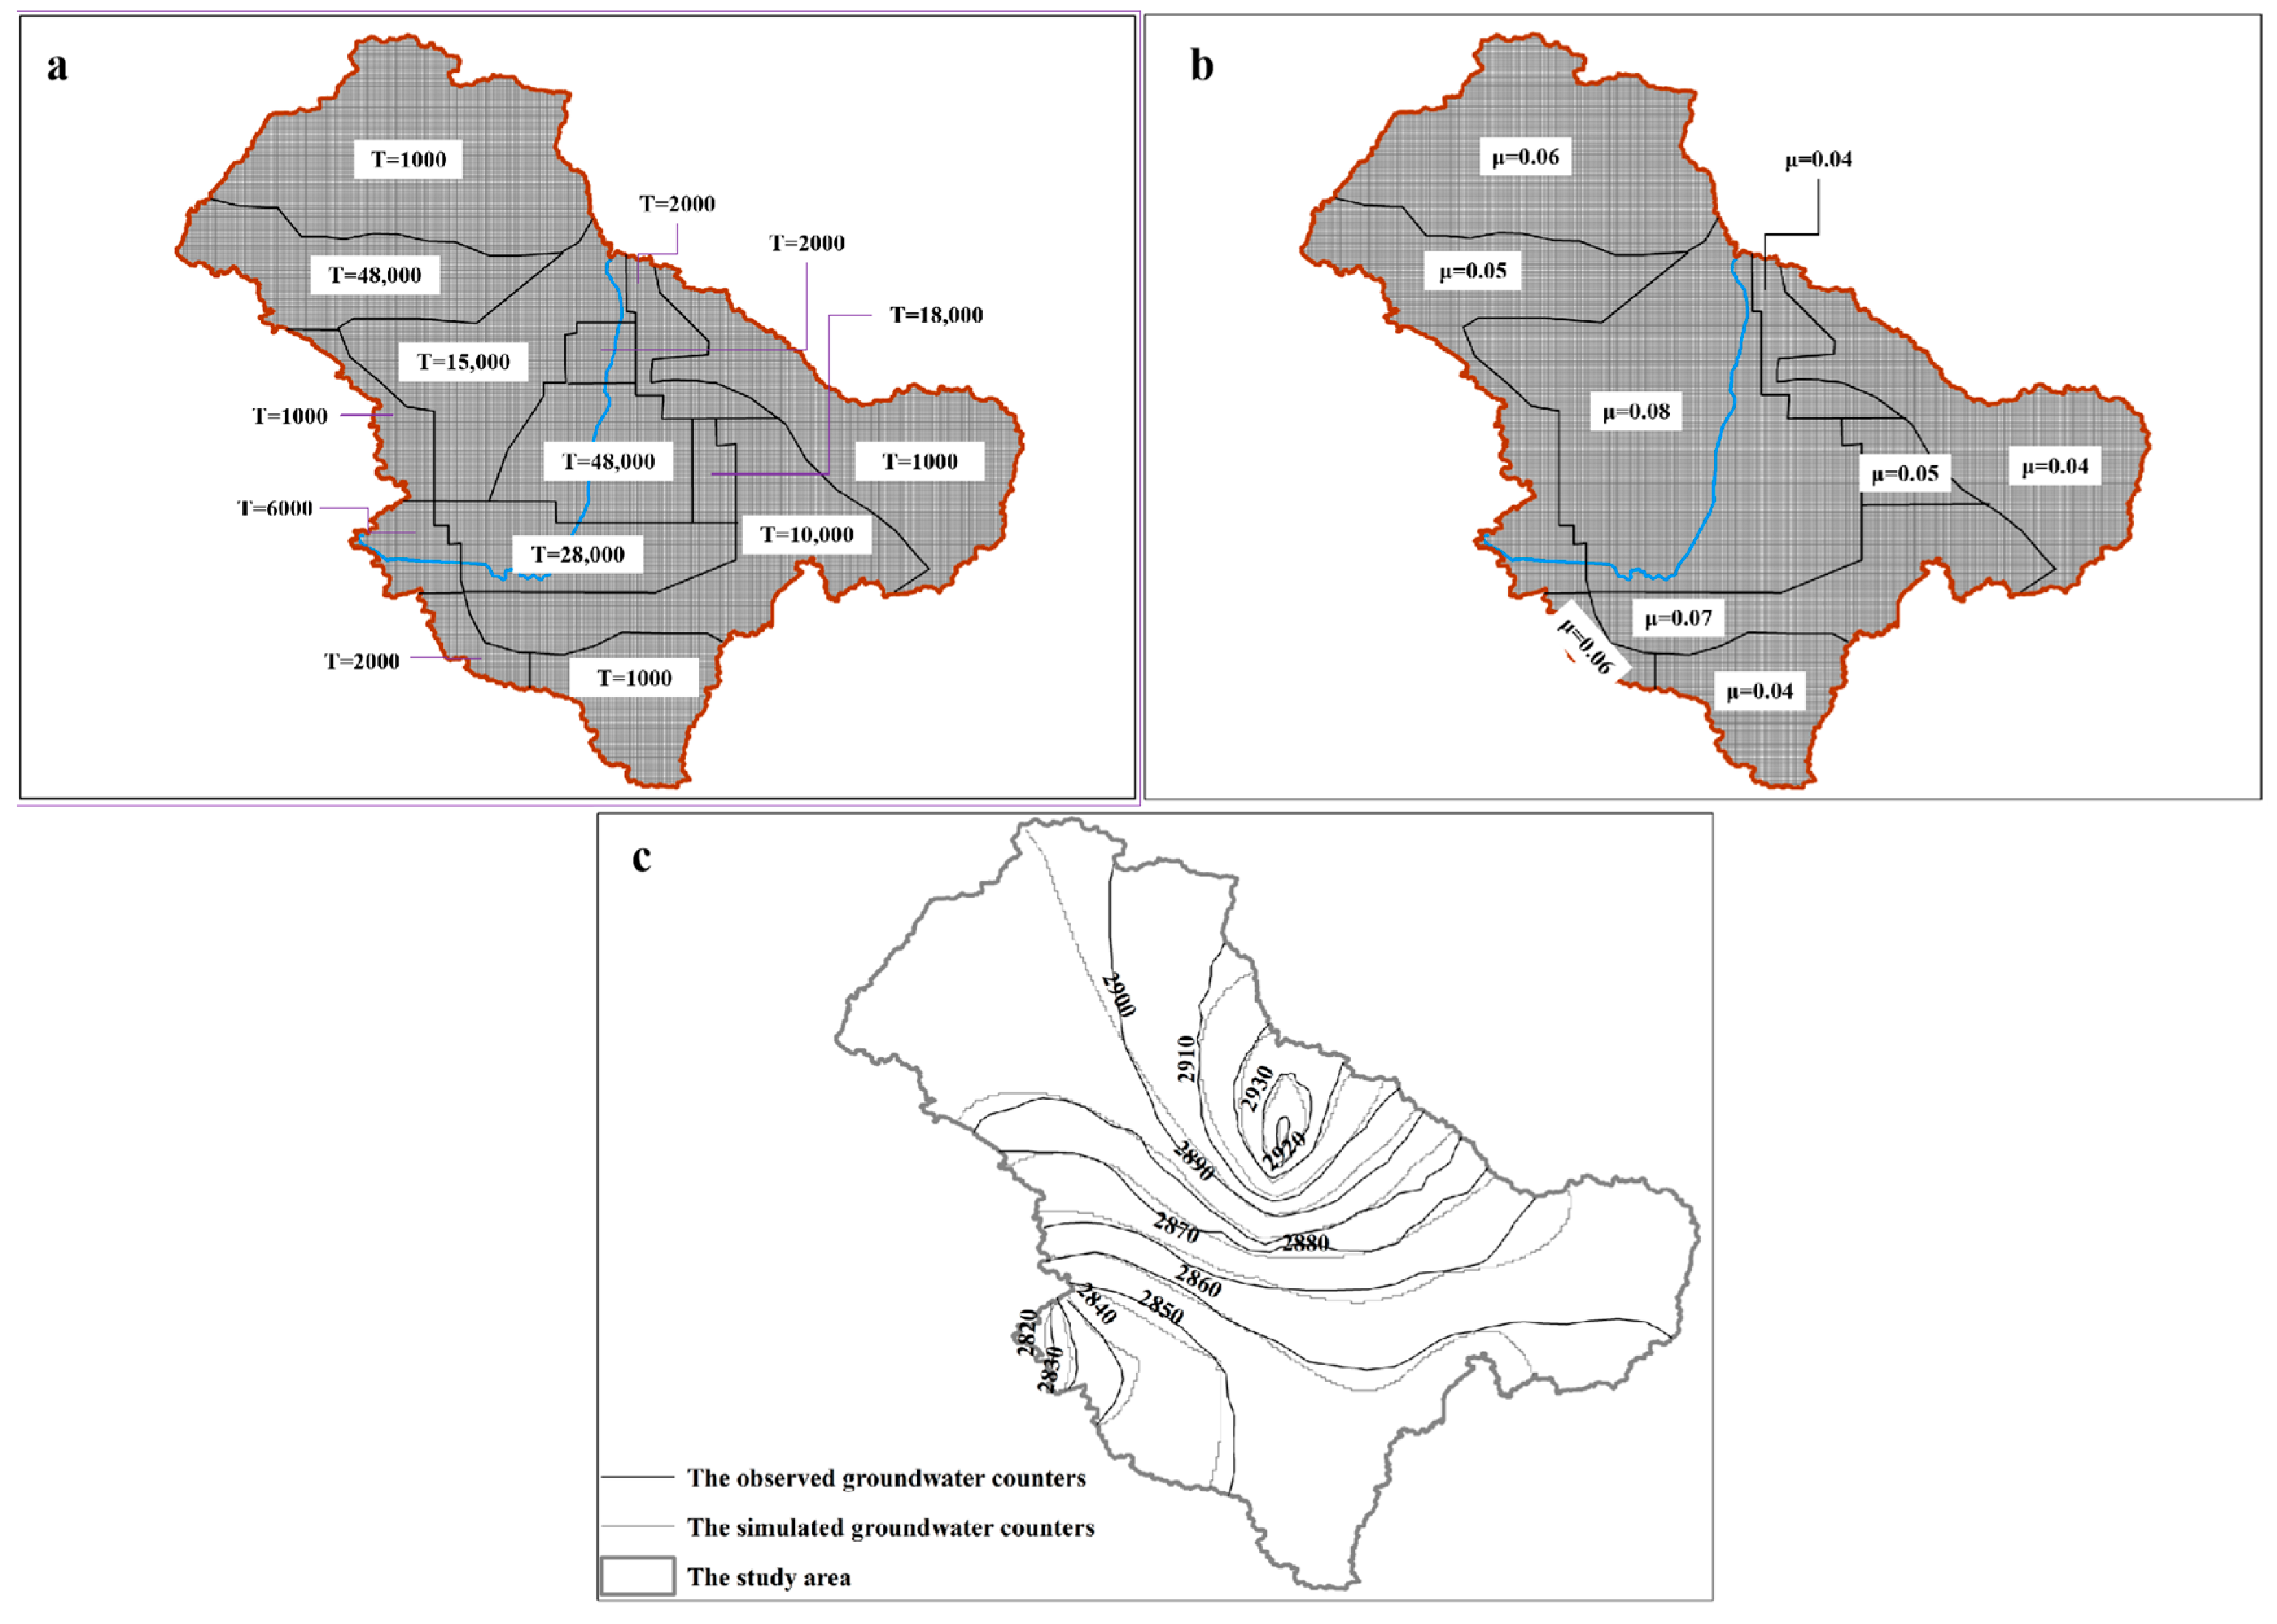
The calibrated transmissibility (T) and specific yield (μ) in different areas can be seen in Figure 7a,b, respectively. In addition, the observed and simulated groundwater counter can be seen in Figure 7c.
The average annual recharge of the groundwater is 2.865 × 10⁸ m3/a, that includes recharges from streams (2.367 × 10⁸ m3/a), irrigation (0.161 × 10⁸ m3/a), mountain (0.279 × 10⁸ m3/a) and precipitation (0.058 × 10⁸ m3/a). The average discharge of the groundwater is 2.796 × 10⁸ m3/a, which includes discharges by streams (1.851 × 10⁸ m3/a), ET (0.594 × 10⁸ m3/a), and groundwater flow (0.351 × 10⁸ m3/a). While the section runoff of the entire area is 2.837 × 10⁸ m3/a. The three values are almost equal, and the relative error is within 5%. That means the hydrology, meteorology and the related parameters are reliable.
A combination of data was used to calibrate the SWAT-MODFLOW model, including the evapotranspiration data (https://www.usgs.gov/) (accessed on 15 September 2021) based on remote sensing SSEBop (the Operational Simplified Surface Energy Balance), the leaf area index from 30 m on the Qinghai-Tibet Plateau (https://data.tpdc.ac.cn)(accessed on 20 September 2021), groundwater level observation data, and spring wheat yields in the research area in the last five years. We also used the coefficient of determination (R2), Nash–Sutcliffe efficiency (NSE), and percentage of bias (PBIAS) to evaluate the applicability of the model [37,38].
We adopted SSP126 (SSP1 + RCP2.6, green development pathway), SSP245 (SSP2 + RCP4.5, intermediate development pathway), and SSP585 (SSP5 + RCP8.5, advanced development pathway) under the BCC-CSM2-MR mode in CMIP6 (https://esgf-node.llnl.gov/search/cmip6) (accessed on 20 October 2021) as future climate change scenarios in this study. The BCC-CSM2-MR model provides sound simulation effects in arid and semi-arid regions [39,40,41]. In addition, we also used measured precipitation and temperature data from 2015–2020 in this study to calibrate the data under each climate scenario.
3. Results
3.1. Simulation of Runoff from the Upper Bayin River
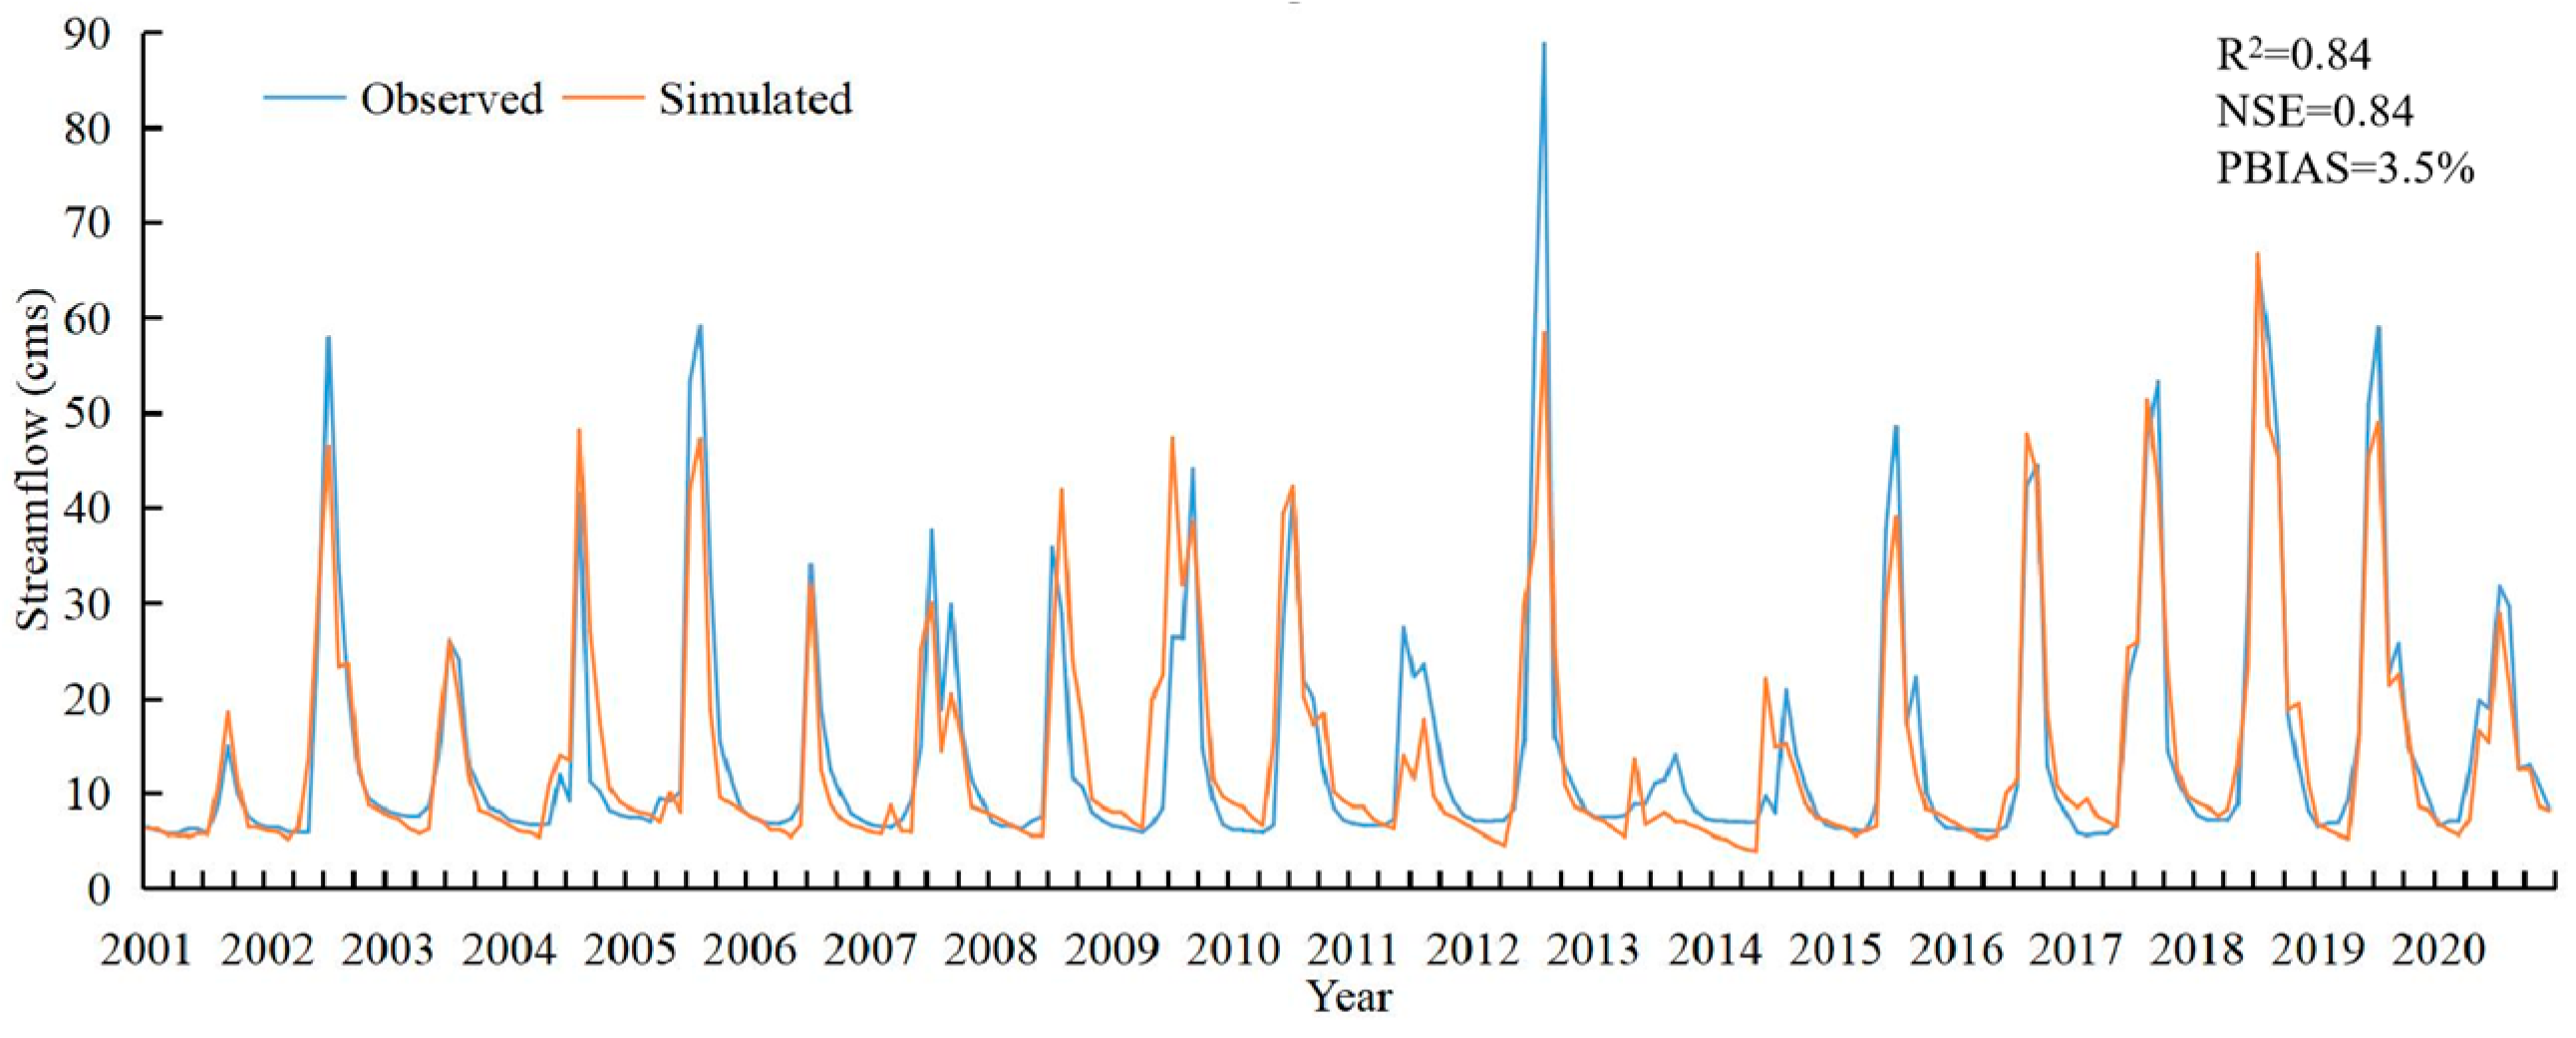
The upstream runoff of the Bayin River is the main source of water in the middle and lower reaches of the river. In order to accurately predict the changes in runoff from the upper reaches of the Bayin River in the next 80 years under different climate scenarios, we applied the measured runoff rate from the upper exit pass of the Bayin River from 2001 to 2020 to determine the runoff-related parameters of the SWAT model [42]. Figure 8 shows the mountain runoff simulation effect of the SWAT model after the parameter rate calibration. The R2 and NSE values reached 0.84 and the PBIAS value was 3.5%, indicating that the SWAT model provided sound outflow simulation results.
3.2. Evaluation of LAI Simulation Results
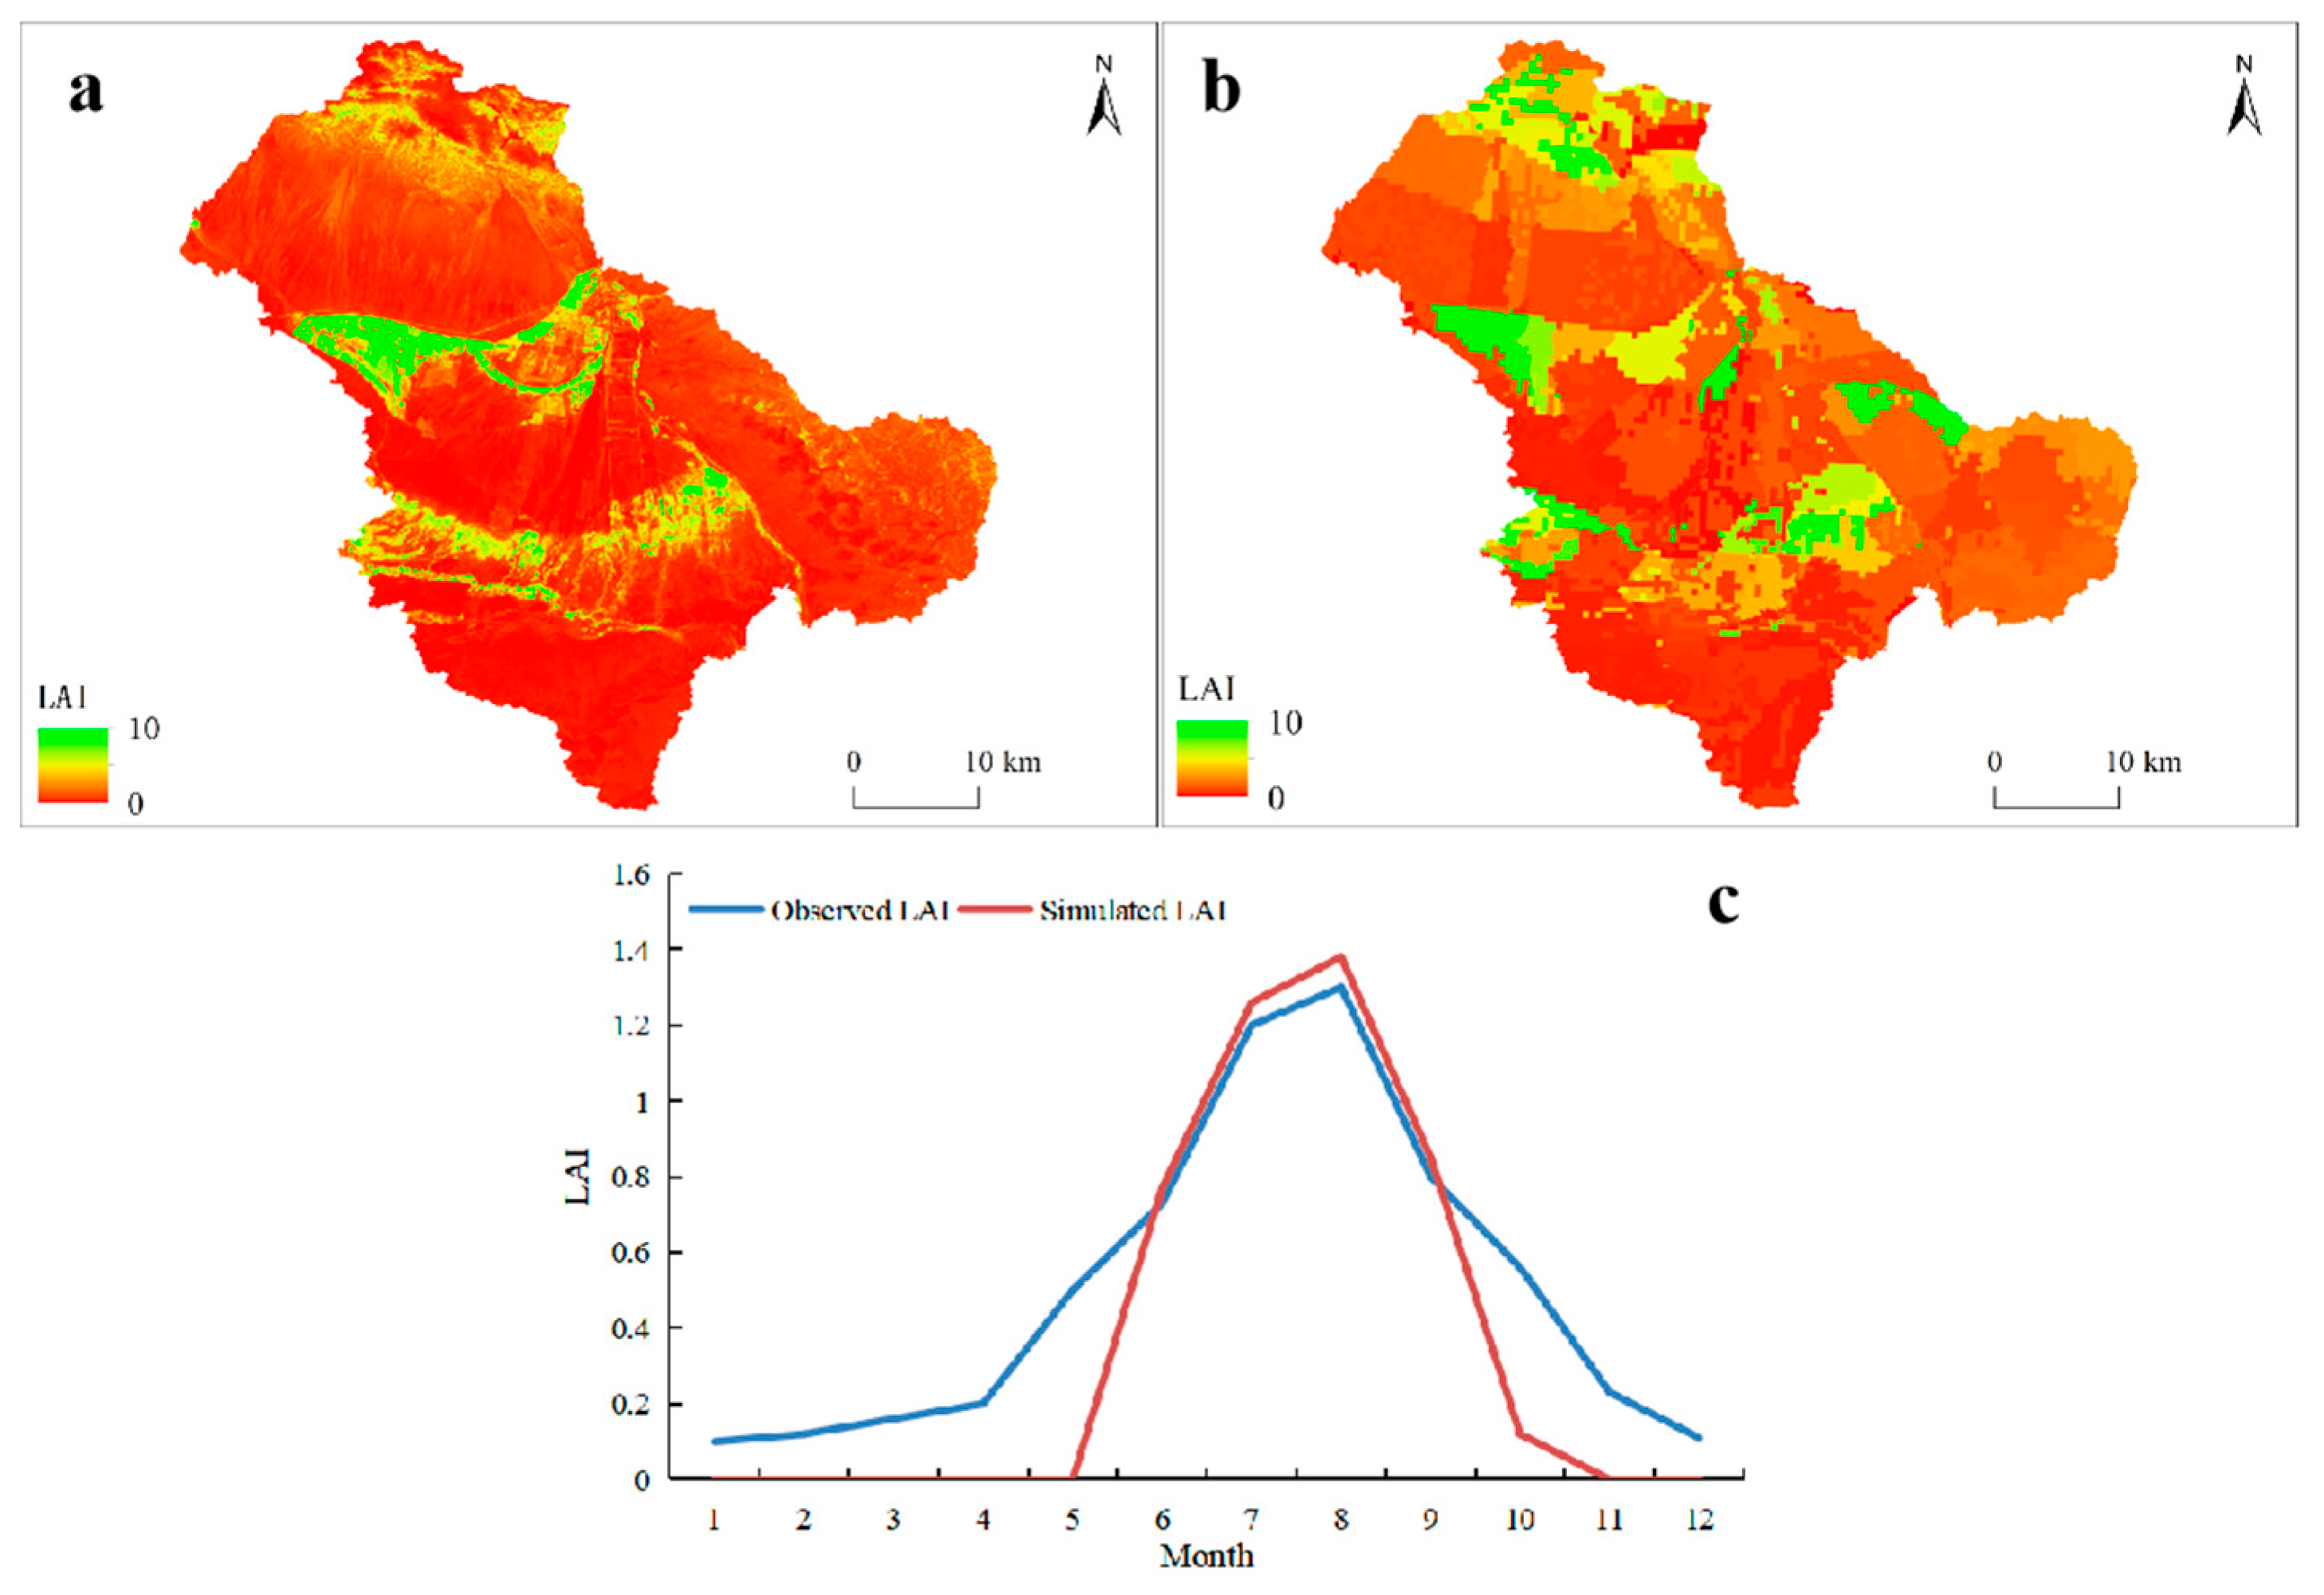
LAI characterizes crop growth status and is an important factor in modelling the crop growth process [15]. The accuracy of the LAI calculated by the SWAT model hinges on a large number of parameters. In general, the LAI that is calculated based on default parameter values has poor applicability in different regions. In this study, we used the remote sensing-based, high-resolution LAI dataset from 2001 to 2020 to calibrate LAI-related parameters for the SWAT model (Table 1). Figure 9a shows the spatial distribution of the July average LAI as reflected by the remote sensing data, and Figure 9b shows the HRU-scale July average LAI simulated by the SWAT model. Good agreement was obtained between the two measurements. Good agreement occurred between the basin-wide average LAI for January through December (Figure 9c), especially from June to September, i.e., after the crop began growing and before harvest.
3.3. Spring Wheat Yield Simulation Effects
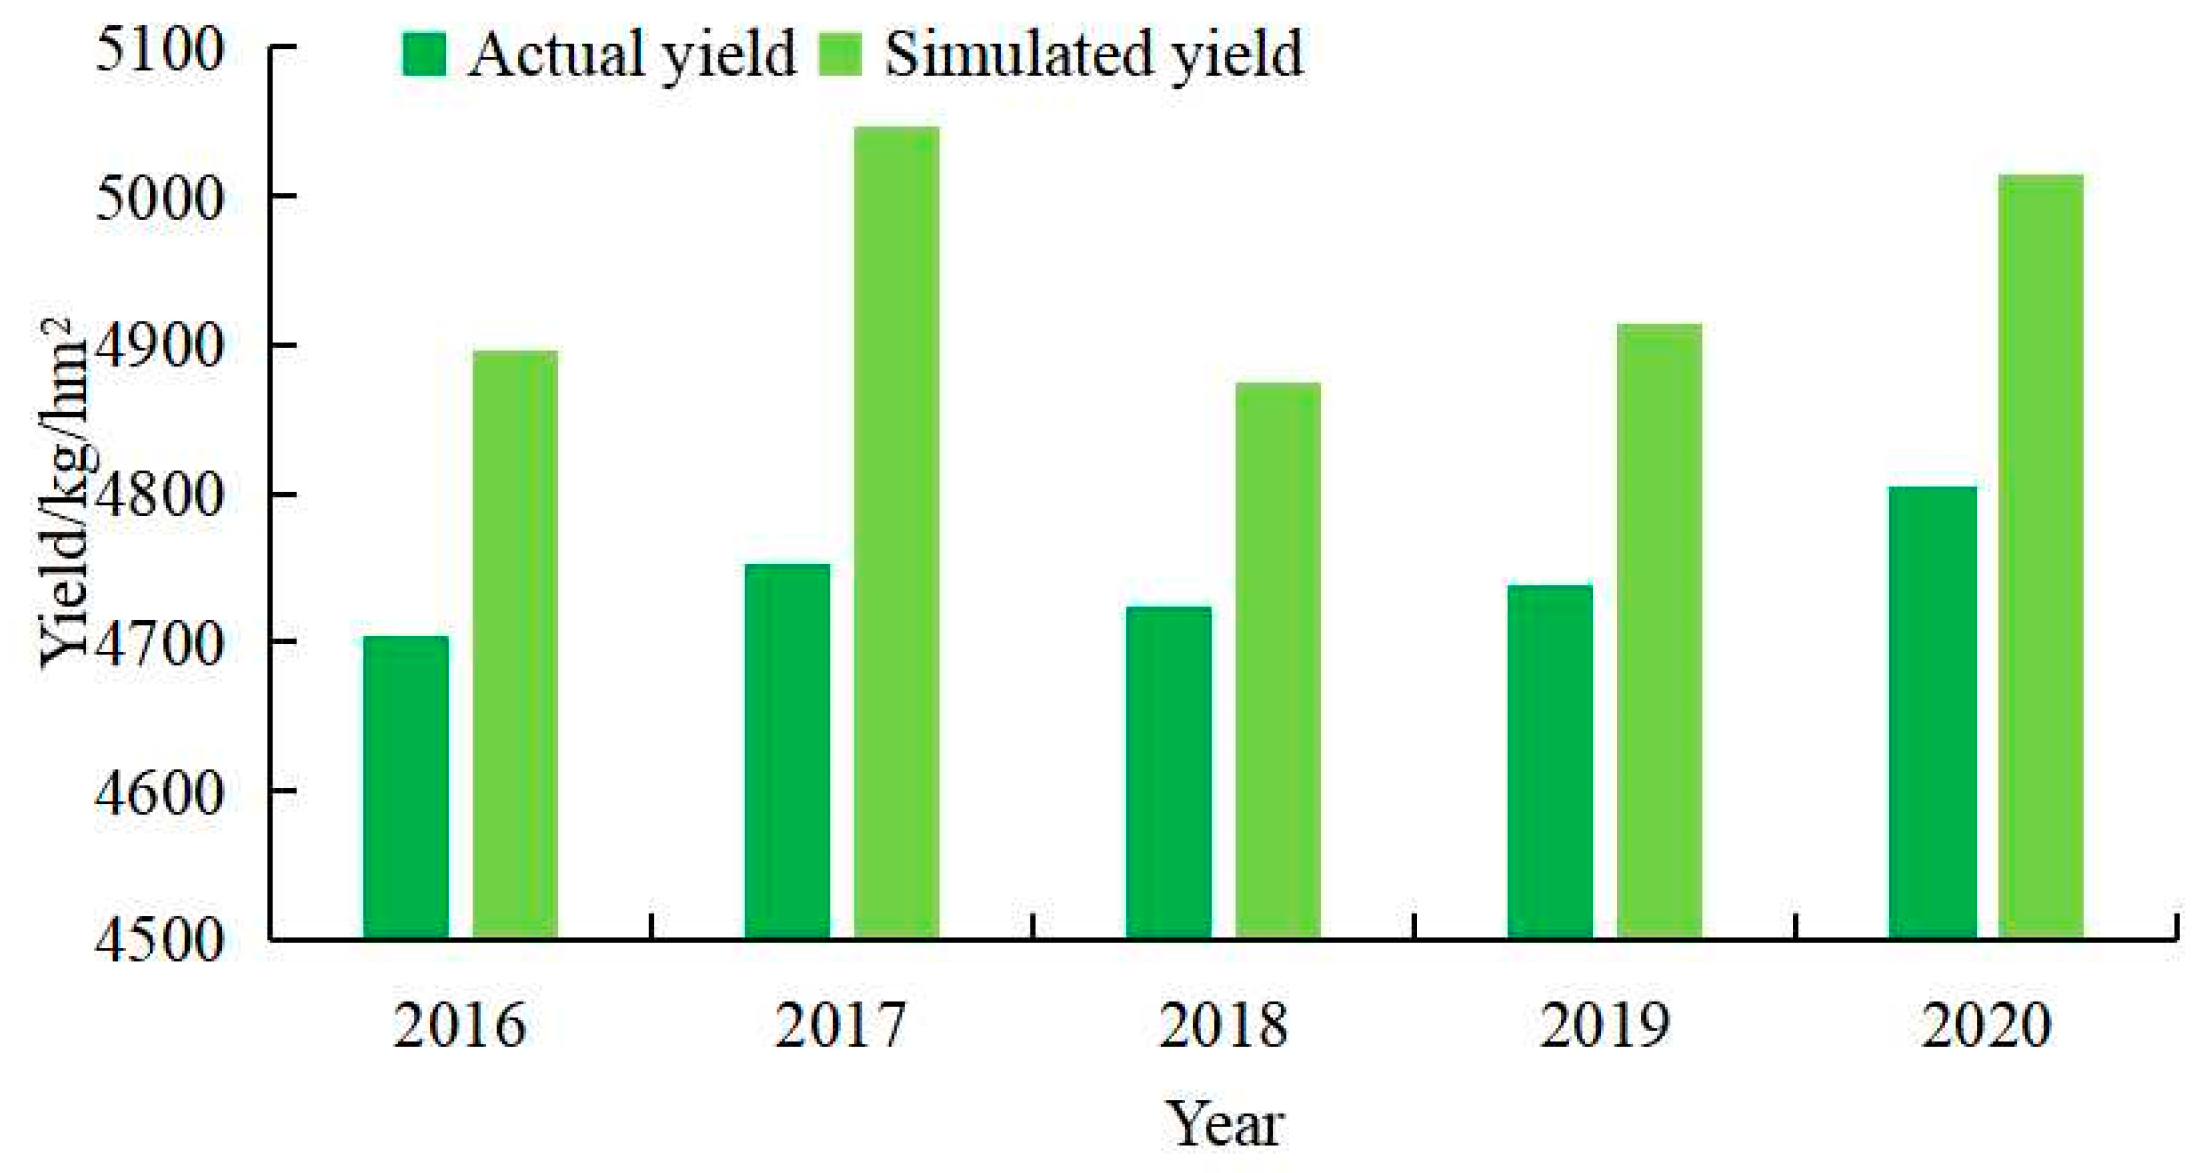
Spring wheat is the major crop in the middle and lower reaches of the Bayin River. In reference to similar studies [15,43], the crop growth parameters (Table 2) of HRU were calibrated with the field trial data in the research area and the spring wheat yield data in Delingha Irrigation District and Gahai Irrigation District in the middle and lower reaches of Bayin River from 2016–2020, so as to accurately simulate the growth process of spring wheat in the present study (Figure 10). The actual spring wheat yield averaged 4745.19 kg/hm2 in the research area and the simulated spring wheat yield averaged 4949.21 kg/hm2, with a mean error of 204.02 kg/hm2. The simulated spring wheat yields were higher than actual yields.
3.4. Evaluation of Evapotranspiration (ET) Simulation Results
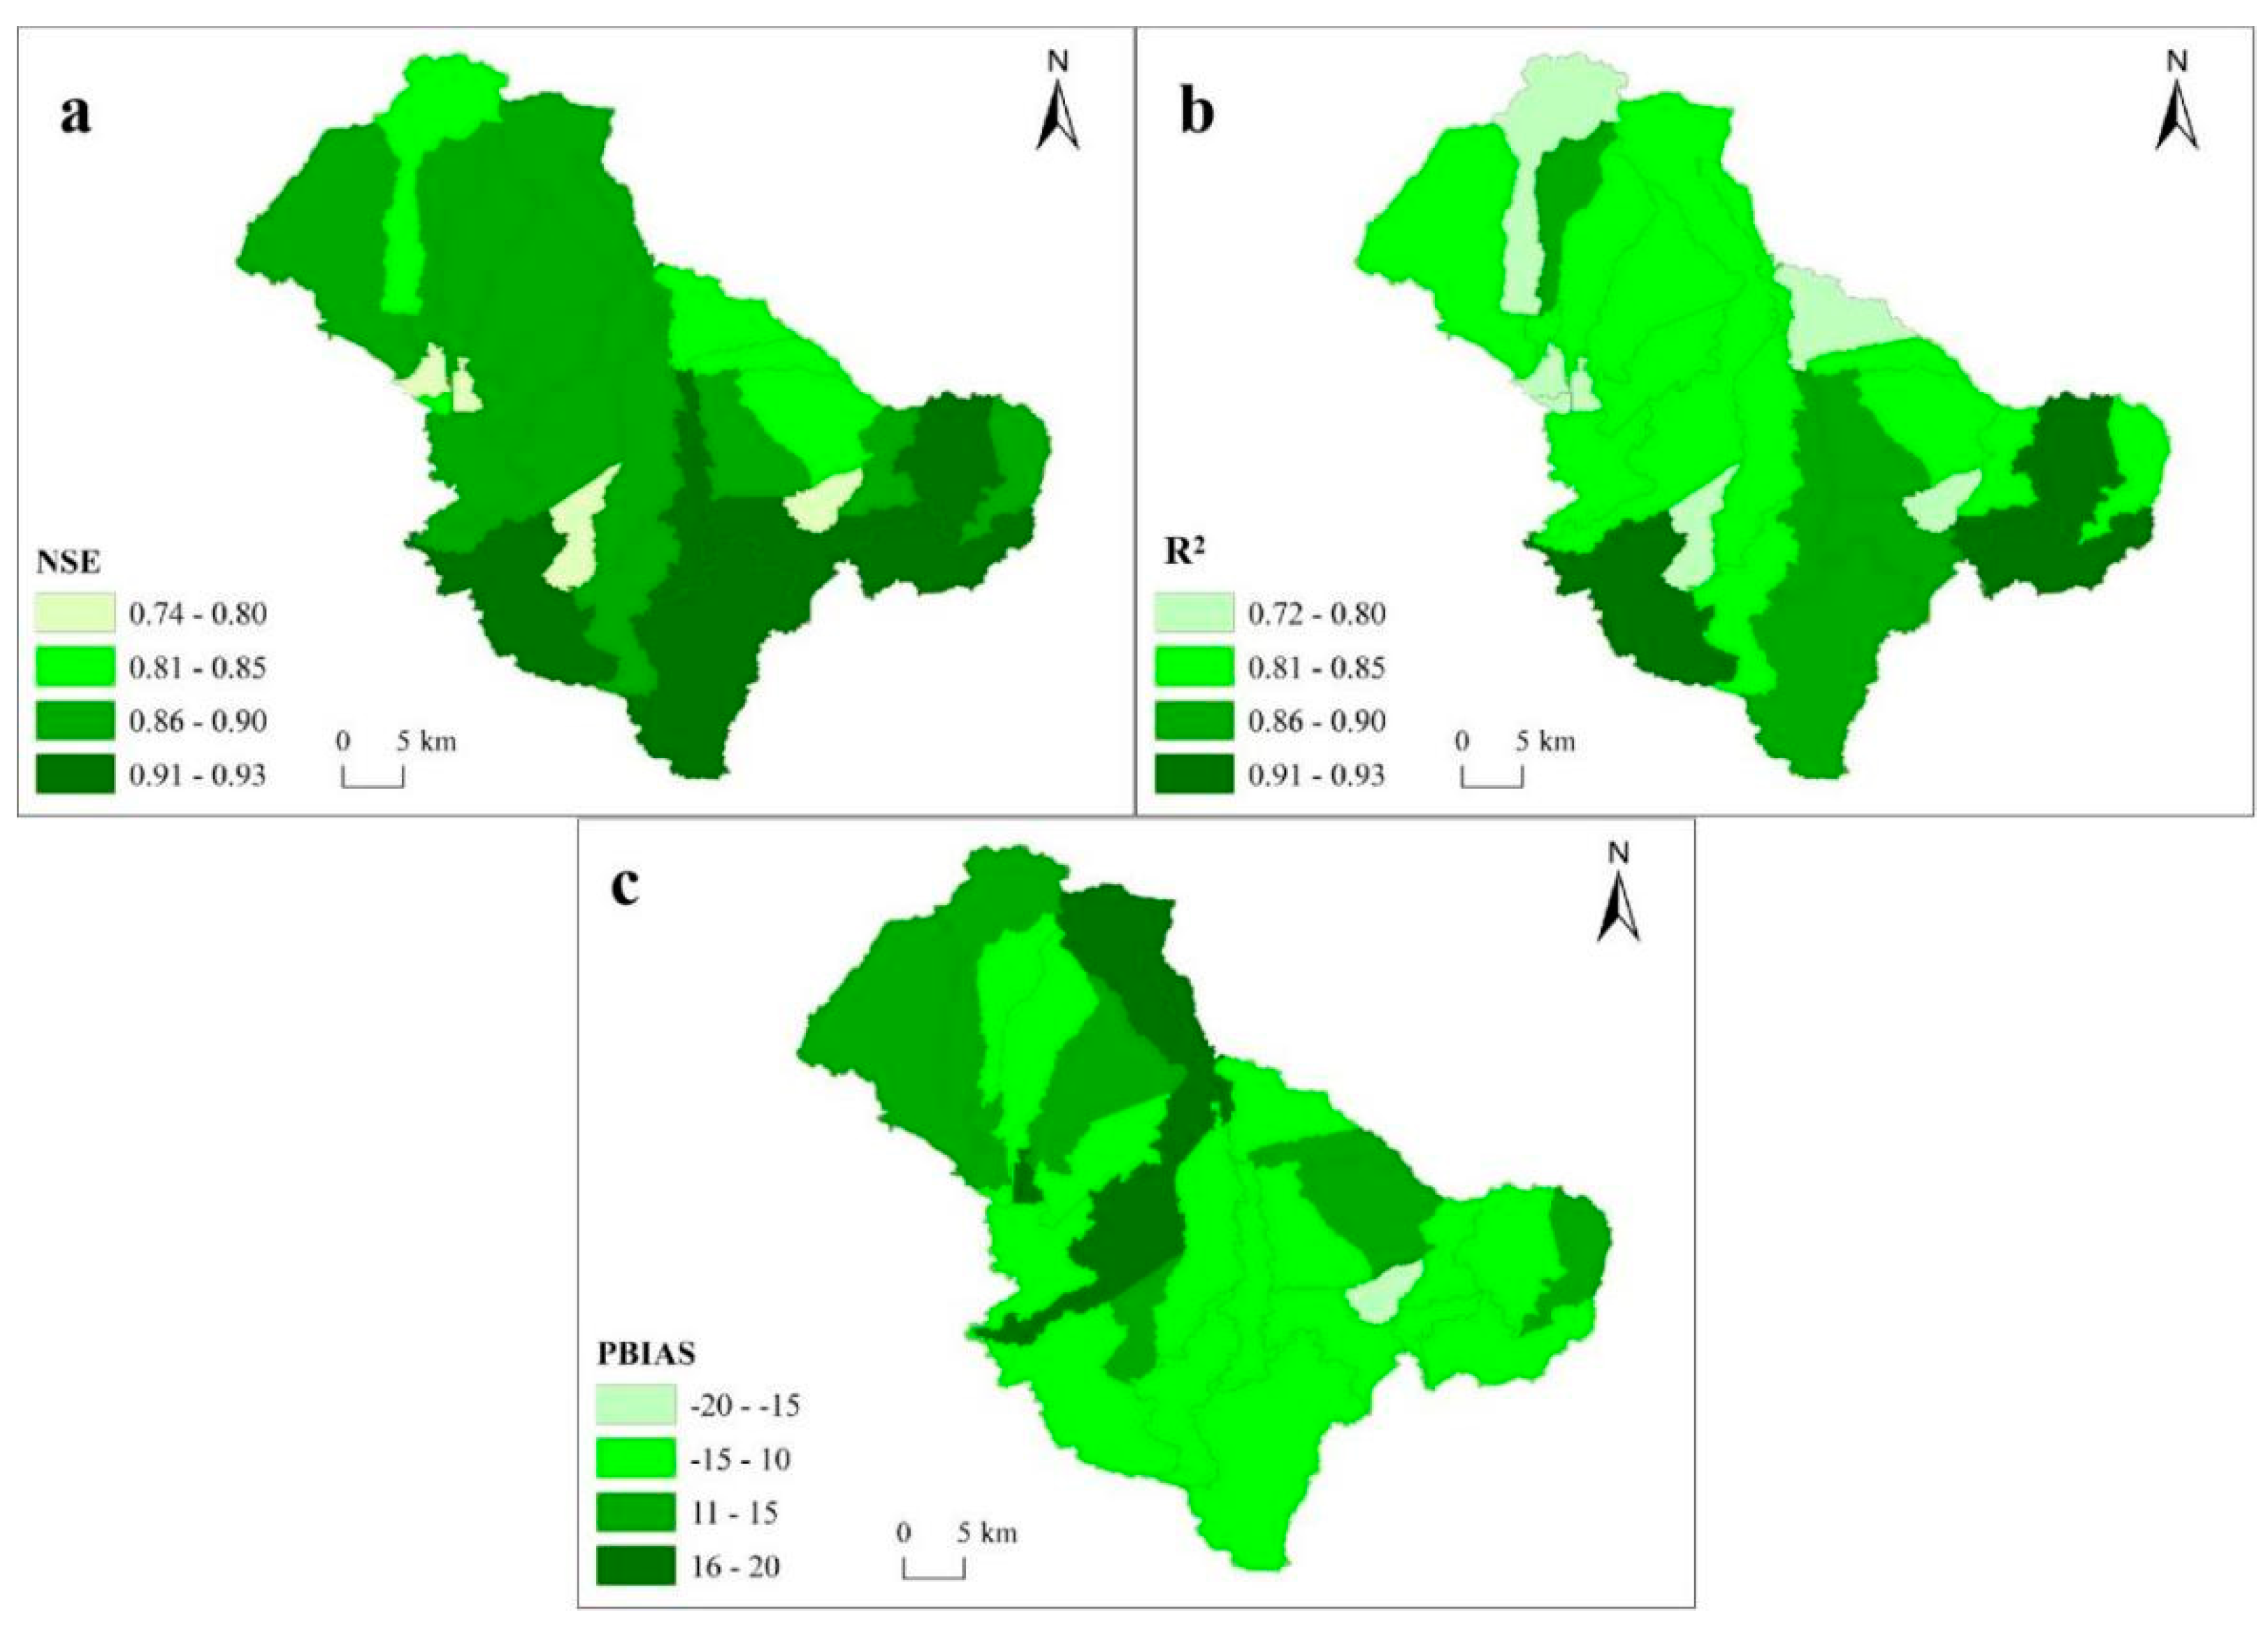
Evapotranspiration plays an important role in the water cycle of inland river basins in arid regions. In this study, we first conducted a sensitivity analysis of parameters related to evapotranspiration in the middle and lower reaches of the Bayin River, followed by calibration of the top 10 sensitive parameters (Table 3) with the remote sensing-based SSEBop evapotranspiration data from 2001 to 2020. Figure 11 shows the results of the subwatershed-scale evapotranspiration simulations. All subwatersheds have NSE values above 0.74, with some subwatersheds in the southern part of the basin above 0.91 (Figure 11a). The R2 values were above 0.72 in all subwatersheds, with high values occurring in the south part of the watershed (Figure 11b). The PBIAS values were between -15% and 15% in all but a few subwatersheds (Figure 11c). Overall, our results indicate that the SWAT-MODFLOW model is more effective in simulating ET, especially in the southern part of the watershed. The simulated annual average ET is 240.5 mm, and the remotely sensed annual average ET is 233.4 mm.
3.5. Evaluation of Groundwater Level Simulation
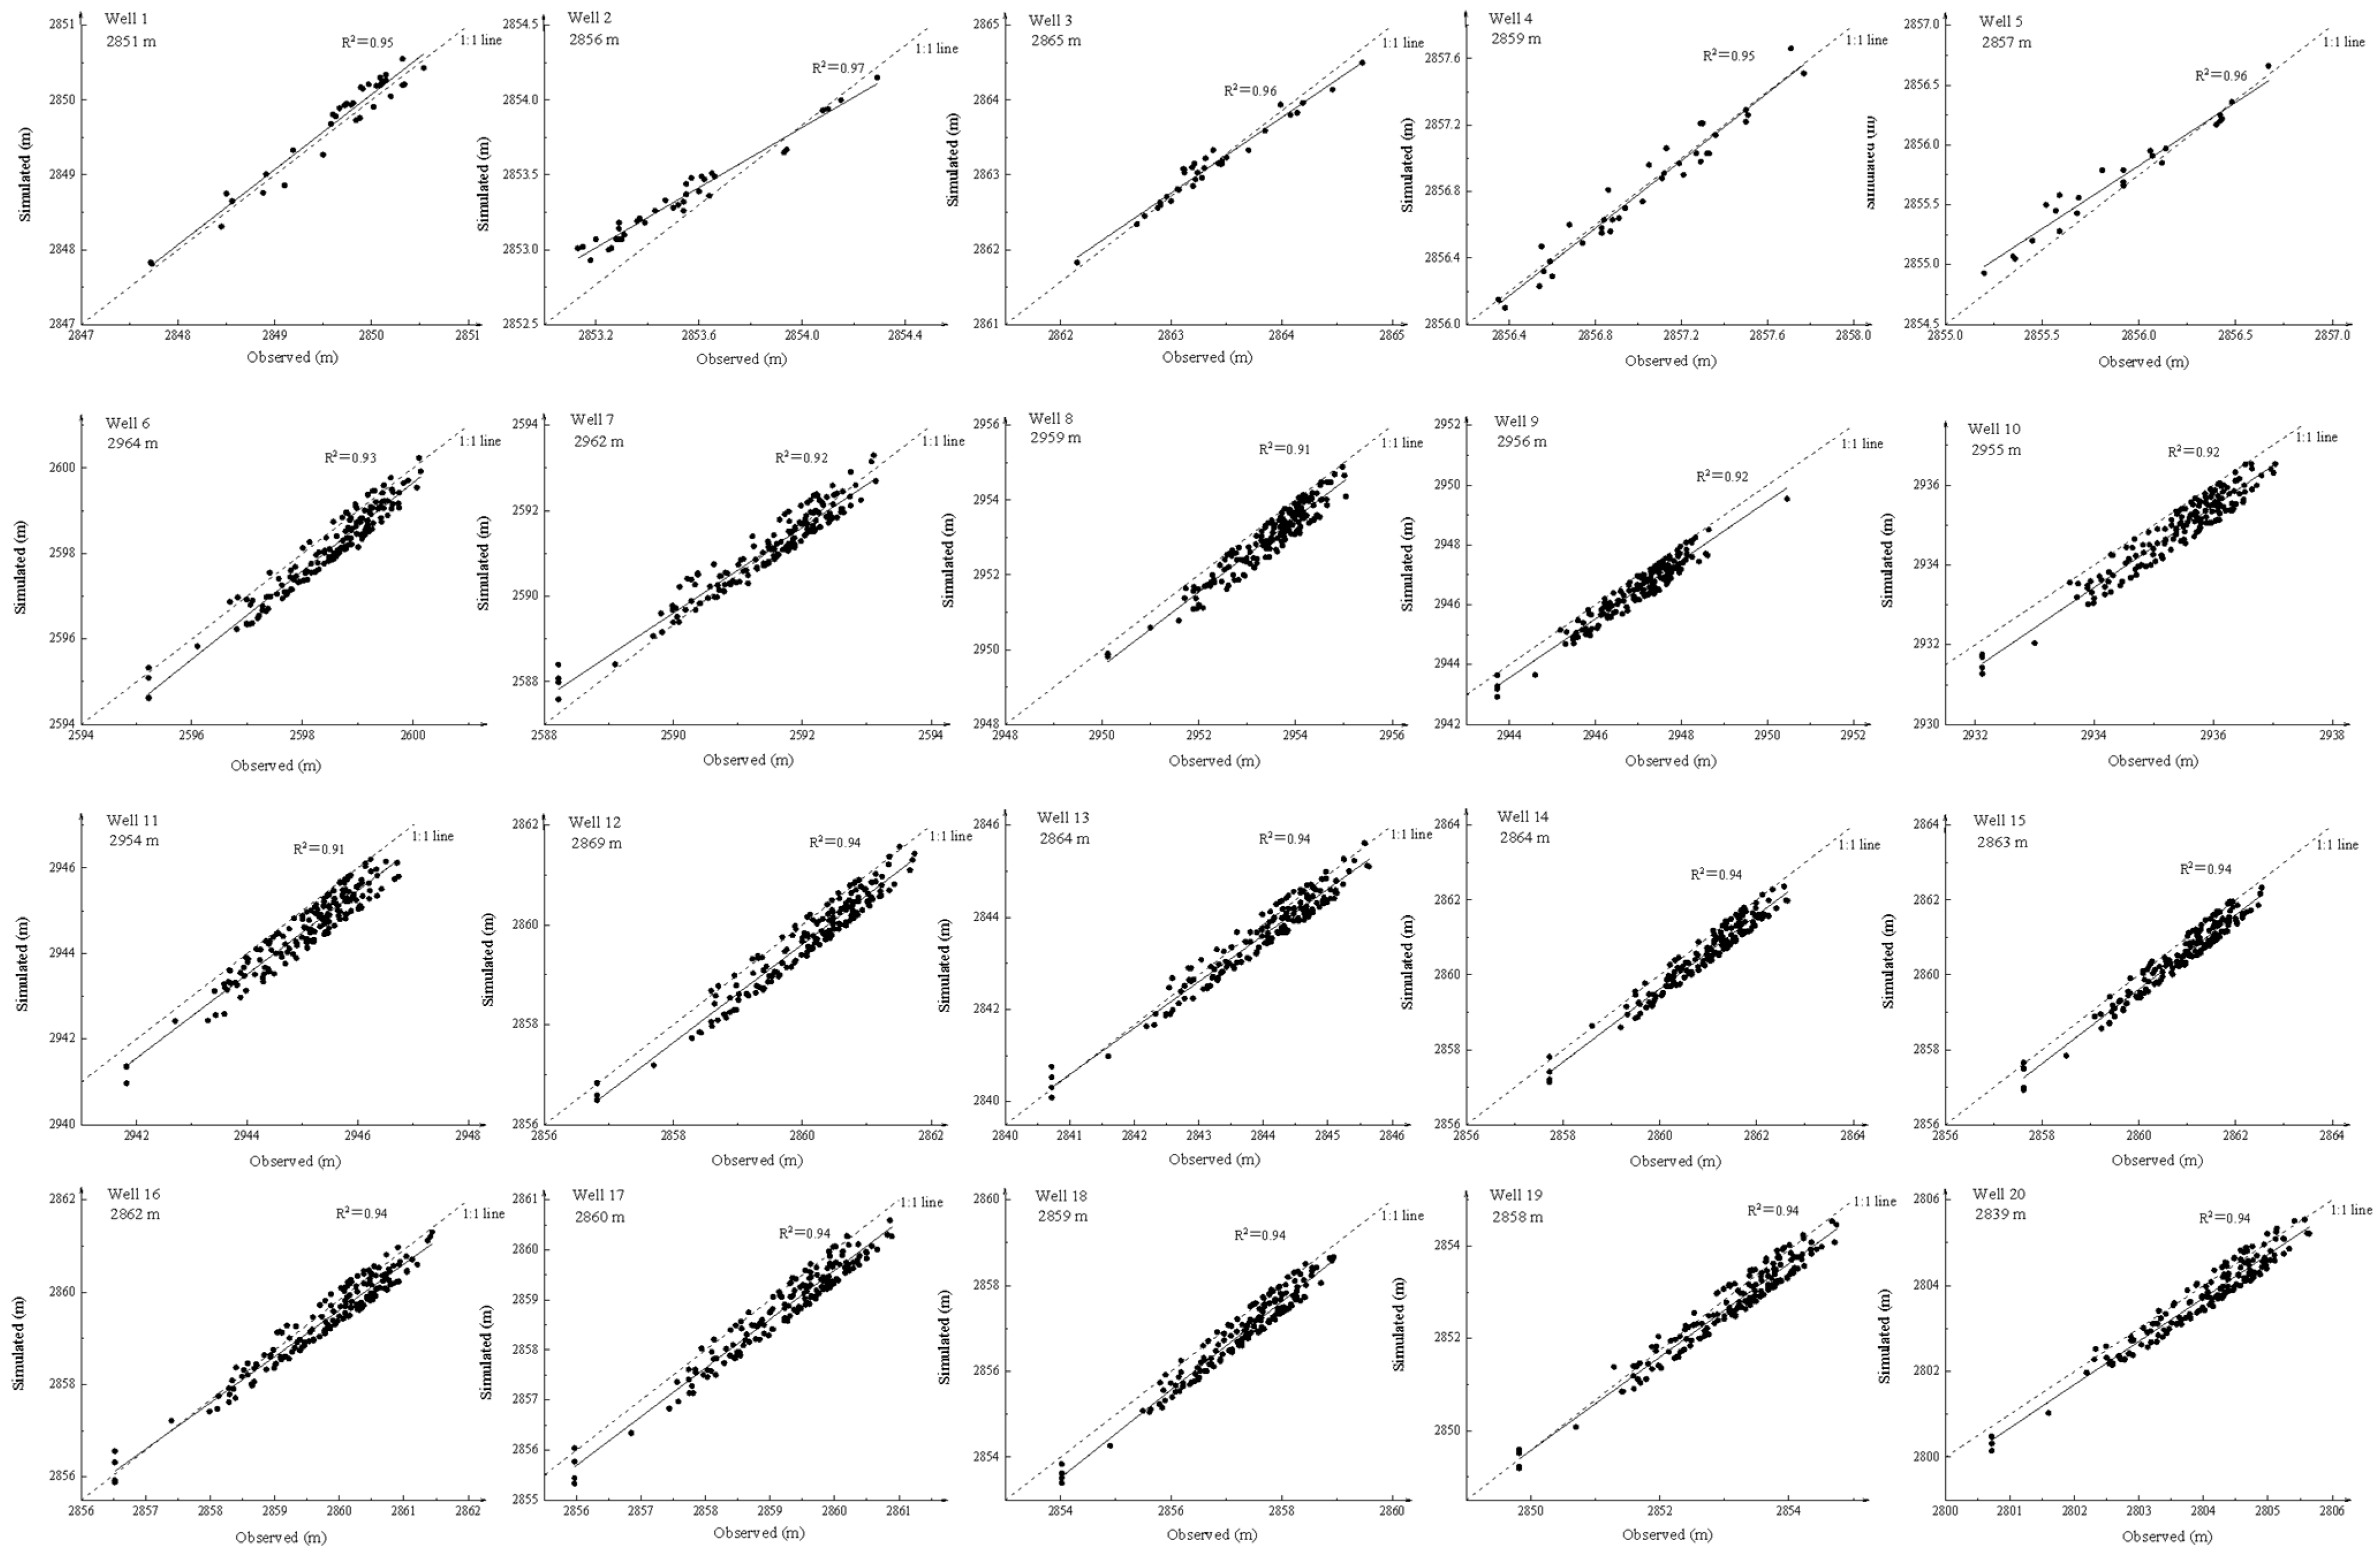
The groundwater level data in the research area did not cover the whole simulation period because observation well 1 only had year-round observation data from 2009–2011; for observation wells 2, 3, and 4, only monthly data from 2013–2015 were available; and for observation well 5, only monthly observation data from 2004–2005 were available. For well 6 to well 20, monthly data from 2001–2014 were available. The spatial distribution of the 20 wells can be found in Figure 4c. The groundwater-related parameters of the SWAT-MODFLOW model were adjusted (Table 4) based on the above observation data. For parameters duplicated from Table 3, fine adjustments were made to ensure that ET simulation results remained unchanged. The results of the groundwater level simulations are shown in Figure 12. The R2 value of each observation well was > 0.90 with an error of less than 1 m.
3.6. Assessment and Prediction of Crop Waterlogging Risk under Different Climate Scenarios
3.6.1. Variation in Precipitation and Temperature under Different Climate Scenarios
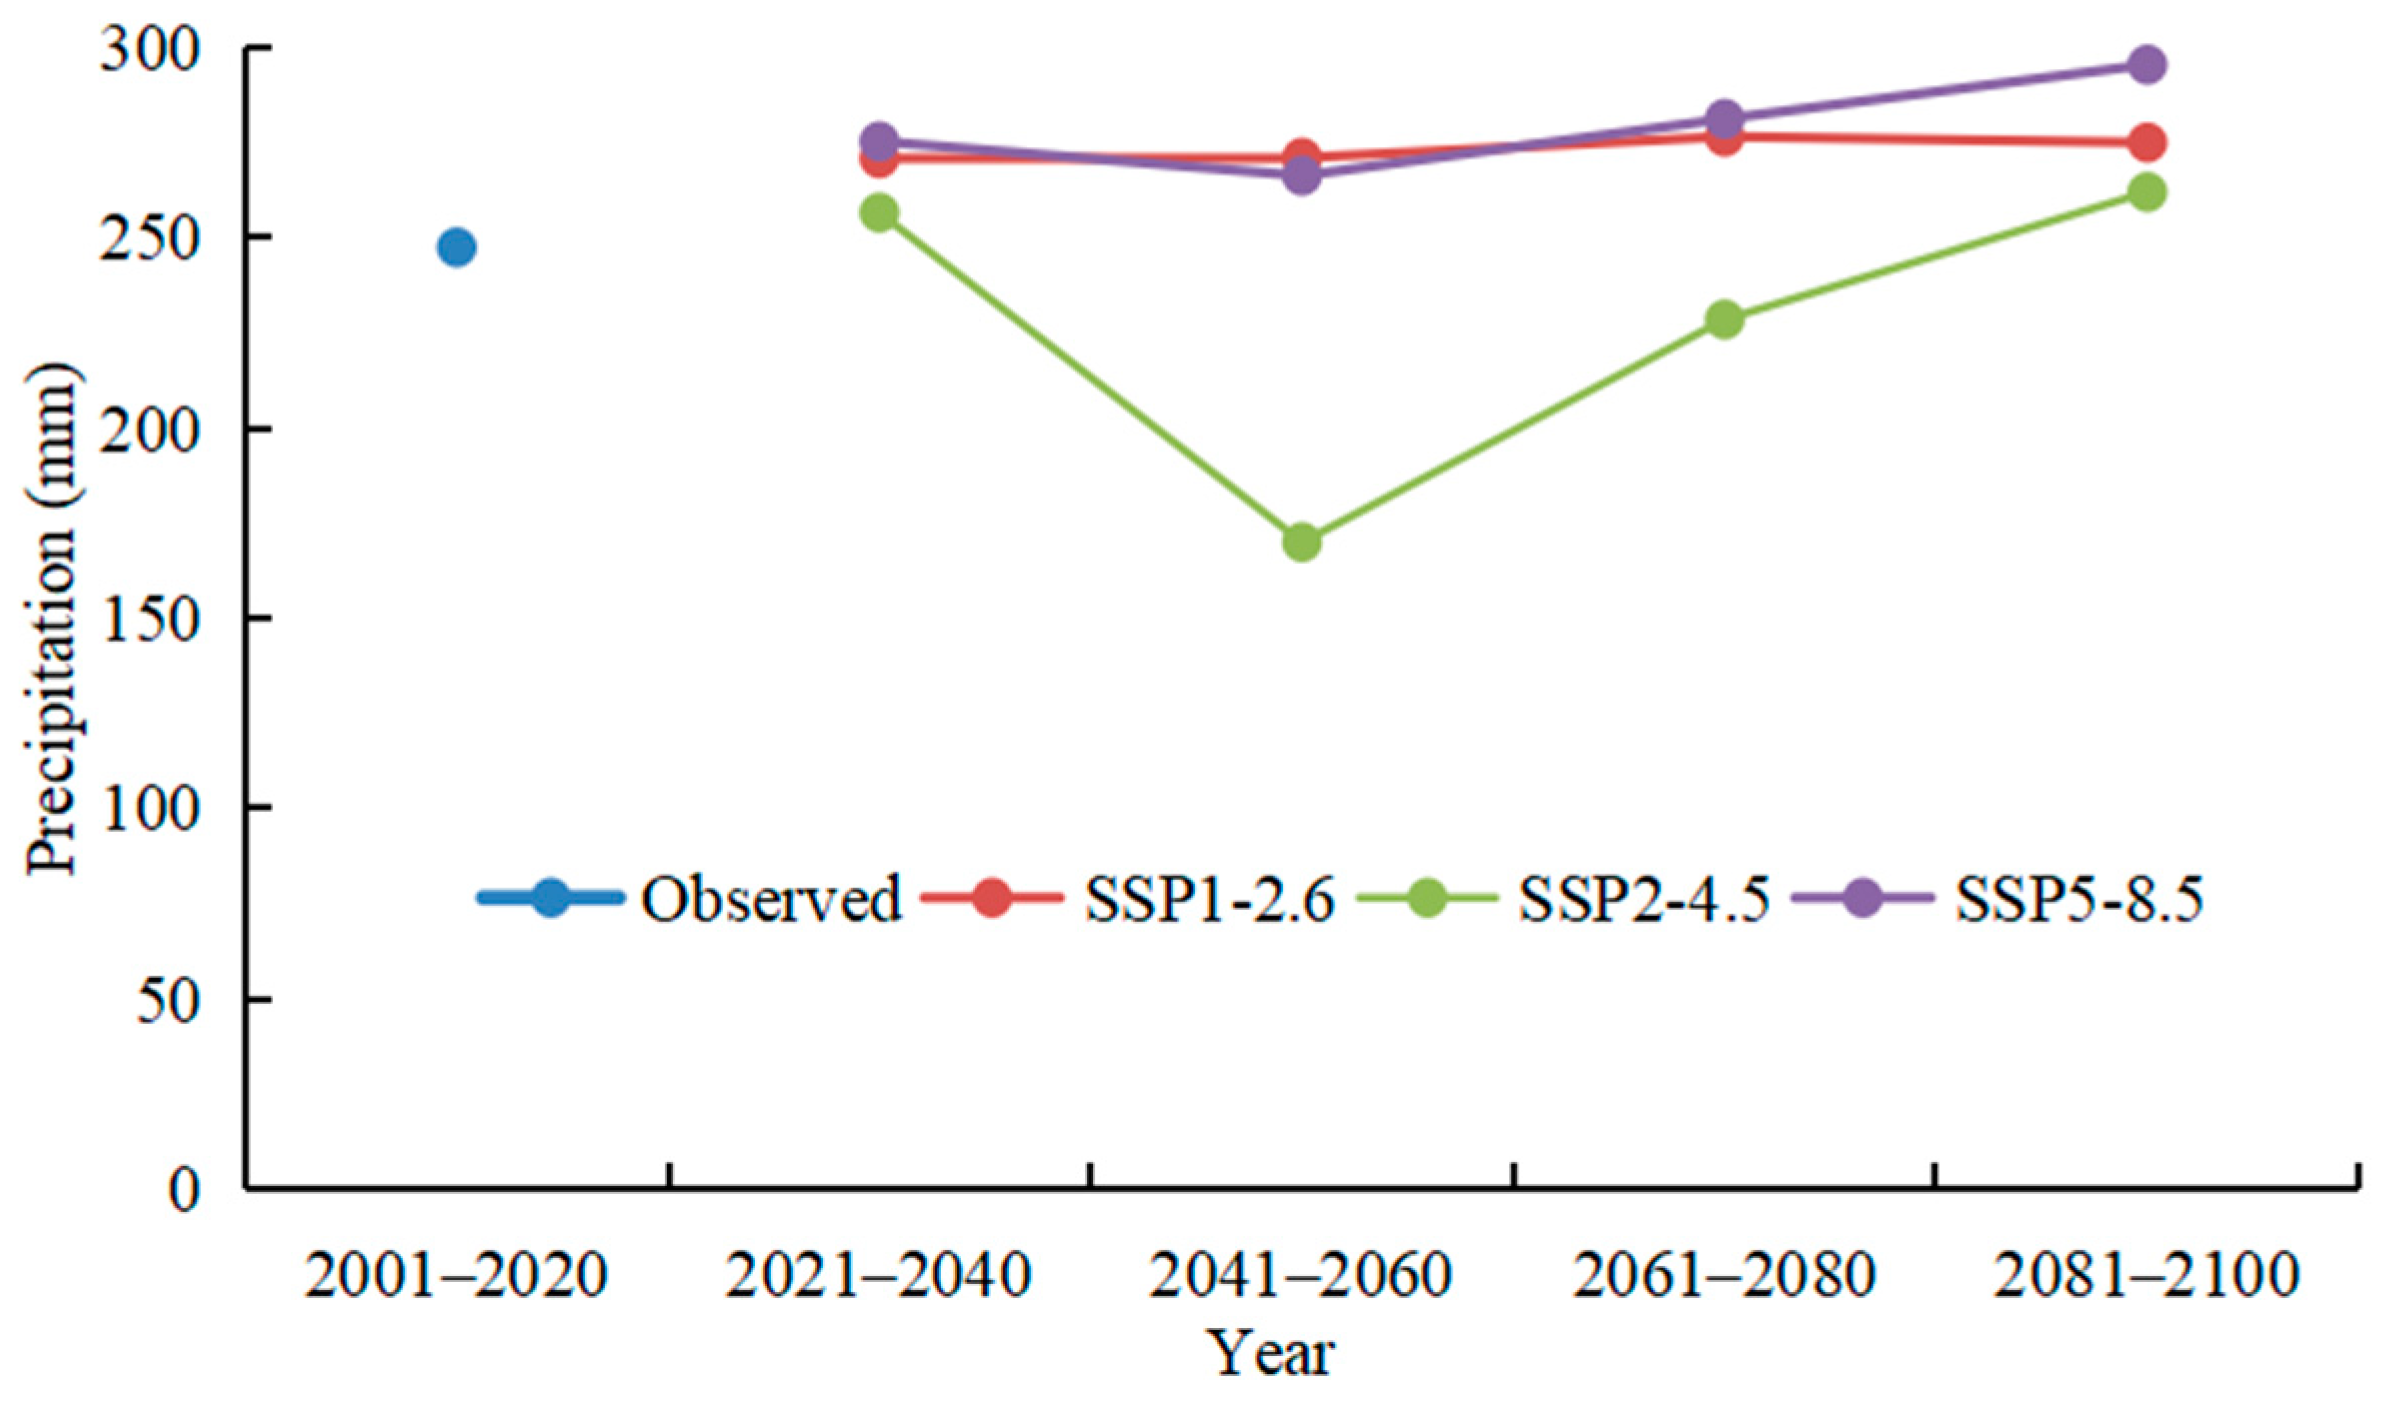
Based on the historical period (2001–2020), we divided the next 80 years (2021–2100) into cycles of 20 years and analysed the trends in multi-year average precipitation and multi-year average temperature. Figure 13 shows the average precipitation in the middle and lower reaches of the Bayin River over the past 20 years and the anticipated changes in multi-year average precipitation over the next 80 years (2021–2040, 2041–2060, 2061–2080, and 2081–2100) under the SSP1-2.6, SSP2-4.5 and SSP5-8.5 scenarios simulated by the BCC-CSM2-MR model. The future 80-year average precipitation in the Bayin River basin under all scenarios showed a decreasing trend followed by an increasing trend, with an overall increasing trend. The multi-year average precipitation for 2041–2060 decreased more significantly under the SSP2-4.5 scenario. The future multi-year average precipitation under the SSP1-2.6 and SSP5-8.5 scenarios was higher than the values under the SSP2-4.5 scenario and the historical observed value.
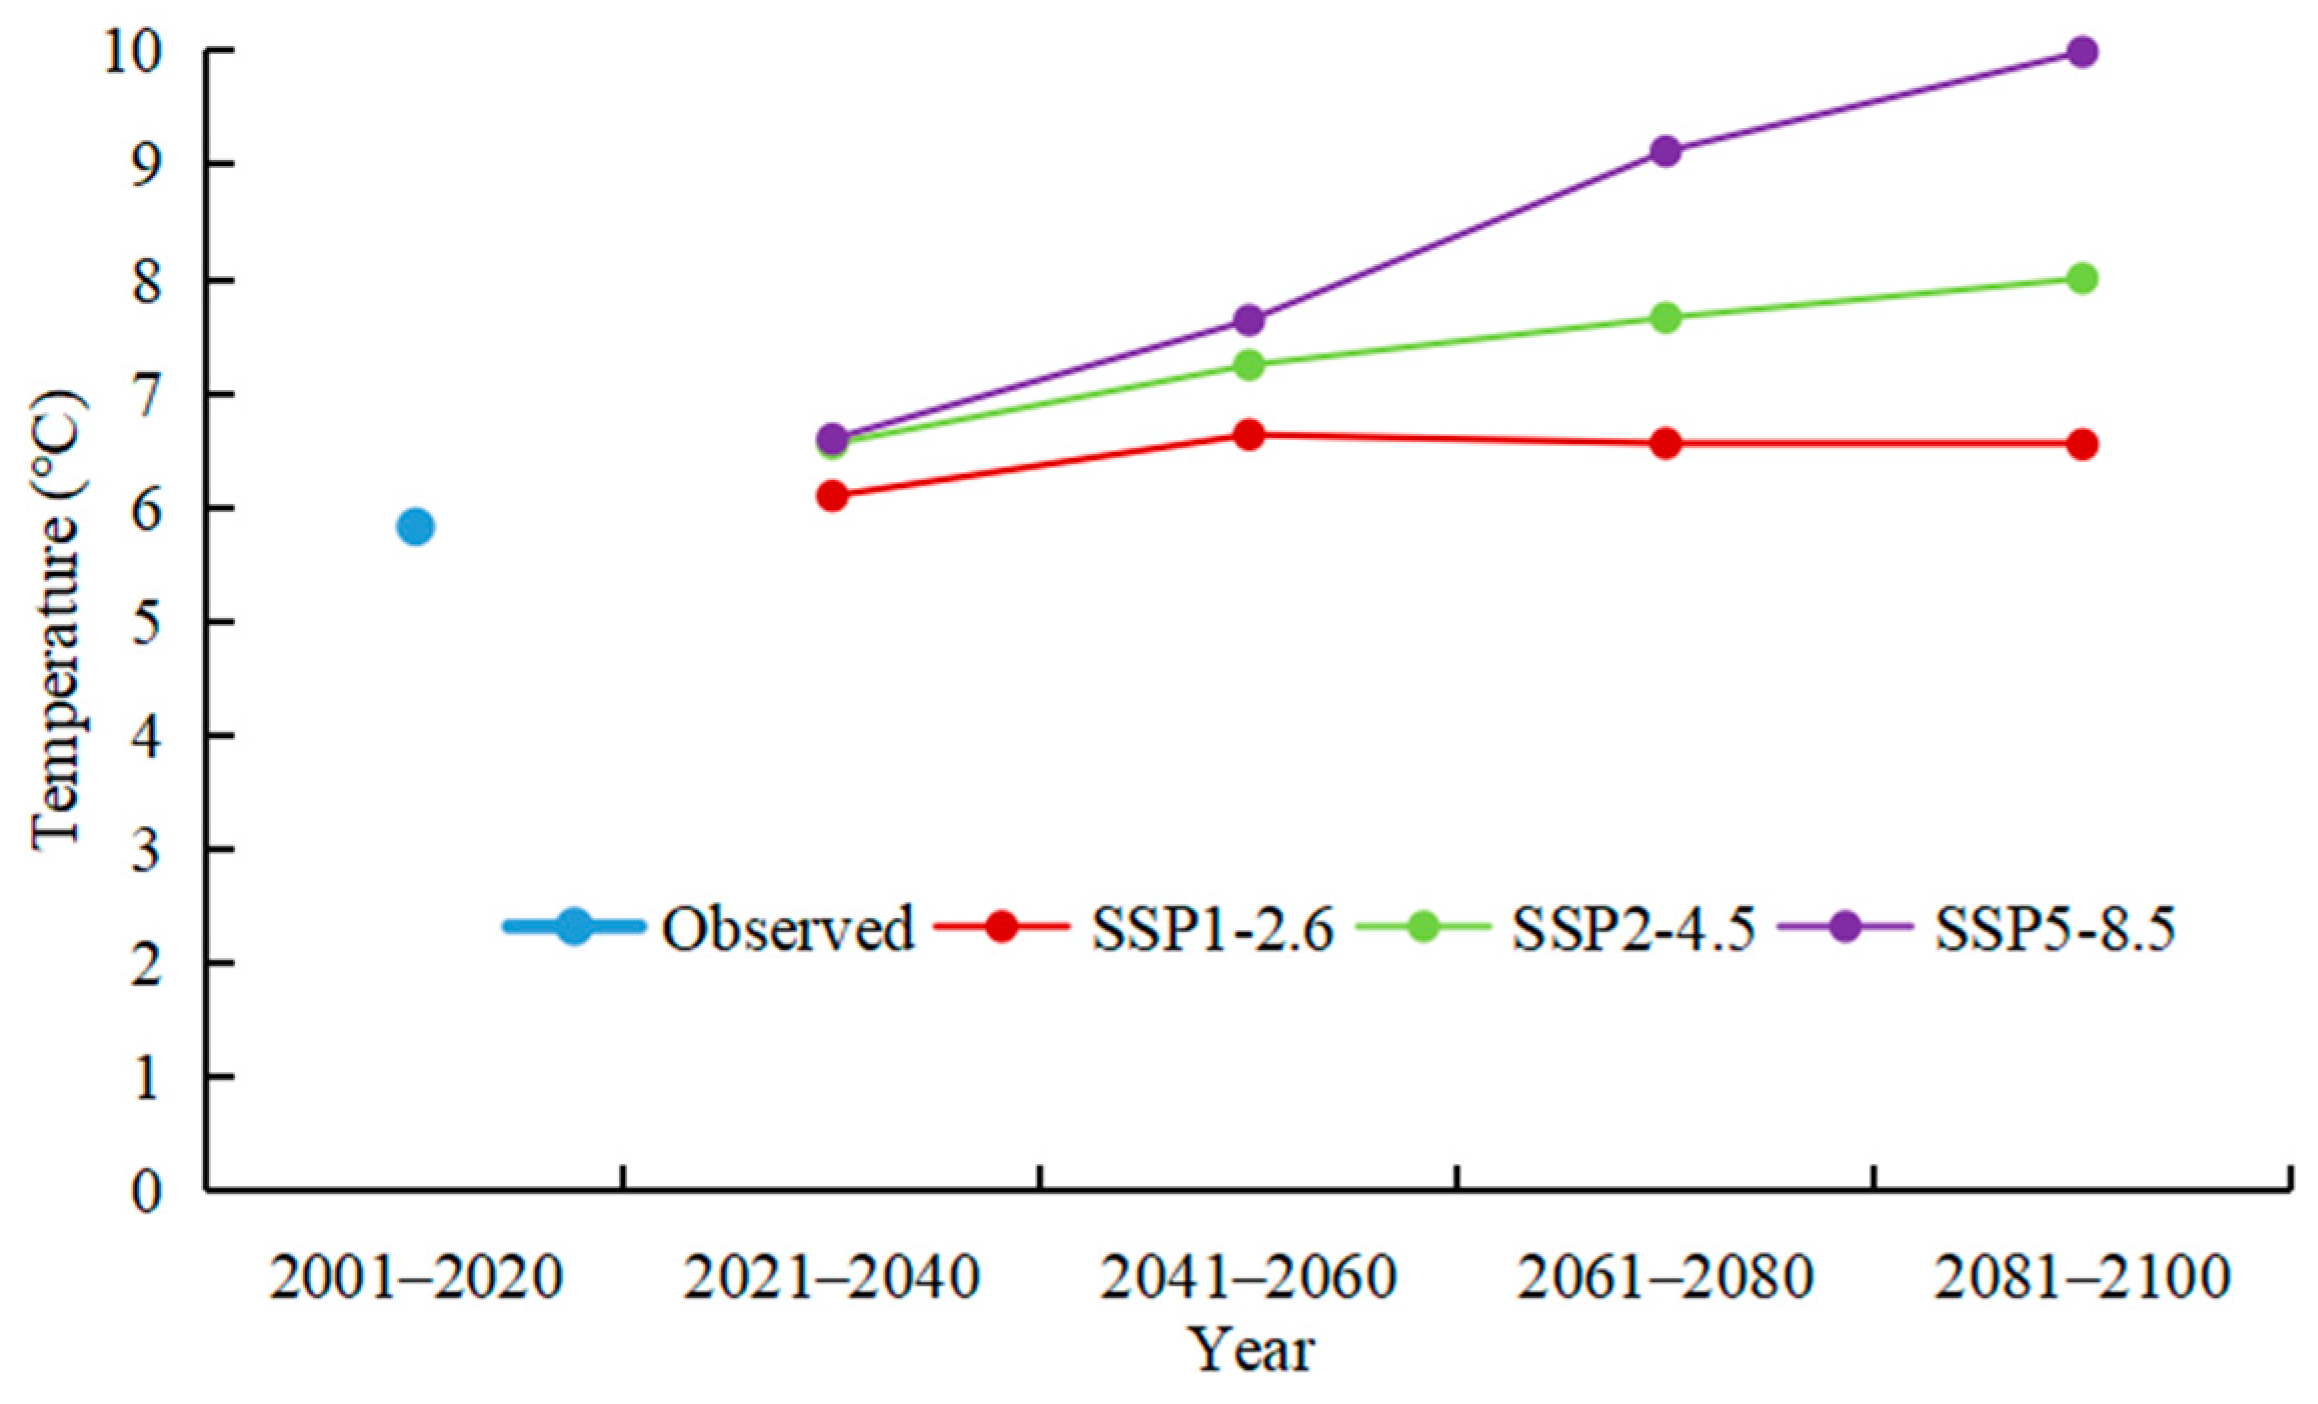
Figure 14 shows the annual average temperature in the middle and lower reaches of the Bayin River over the past 20 years and the changes in the multi-year average temperature over the next 80 years under the SSP1-2.6, SSP2-4.5 and SSP5-8.5 scenarios simulated by the BCC-CSM2-MR model. The temperature shows a clear increasing trend over the next 80 years under the SSP2-4.5 and SSP5-8.5 scenarios, with the temperature displaying the fastest and most pronounced increase under the SSP5-8.5 scenario. The temperature showed an increasing and then decreasing trend under the SSP1-2.6 scenario, with an overall increasing trend. The future 80-year average temperatures under each scenario were higher than the historical value.
3.6.2. Changes in Upstream Mountain Runoff under Different Climate Scenarios
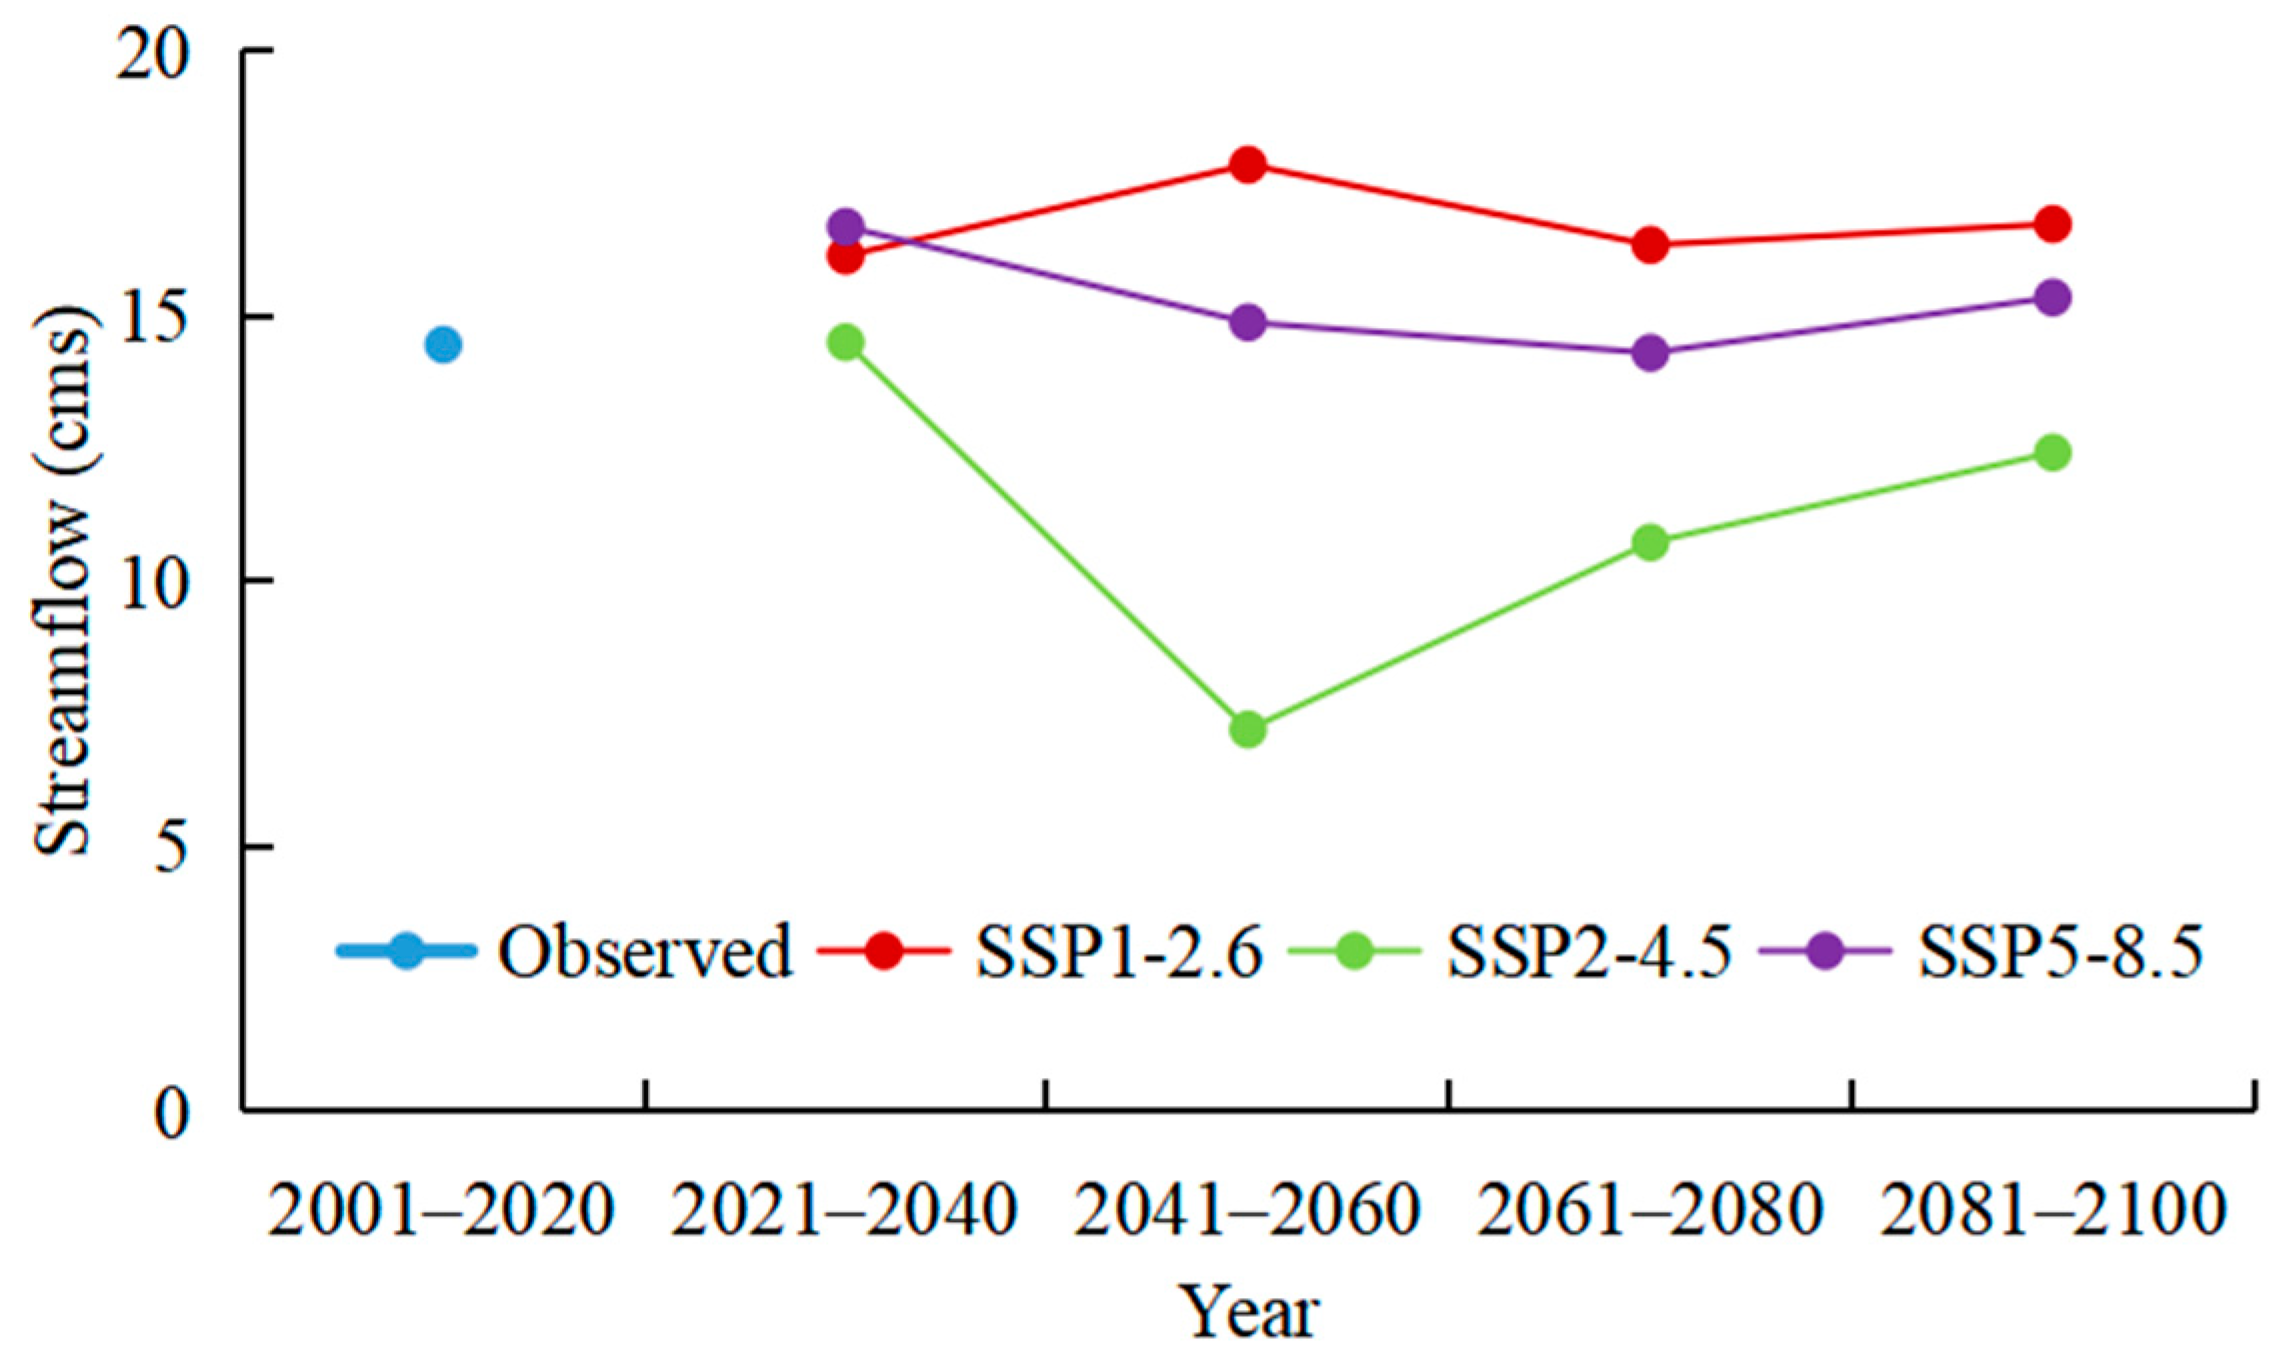
River seepage is the main source of groundwater recharge in the middle and lower reaches of the Bayin River. The middle and lower reaches of the Bayin River are flat and thus do not produce much runoff. Water in the river channel is mainly derived from upstream mountain runoff. Therefore, upstream mountain runoff of the Bayin River over the next 80 years was simulated in this study based on the SWAT model. Compared to the average mountain runoff over the past 20 years, the outflow over the next 80 years was significantly reduced under the SSP2-4.5 scenario (Figure 15). The mountain runoff over the next 80 years showed an increasing and then decreasing trend, followed by a slight increase under the SSP1-2.6 scenario, and was substantially higher than the other scenarios after 2041. The mountain runoff over the next 80 years showed an increasing and then decreasing trend under the SSP5-8.5 scenario.
3.6.3. Changes in Groundwater Recharges under Different Climate Scenarios
3.6.4. Identification and Prediction of Crop Waterlogging Risk Areas in the Middle and Lower Reaches of the Bayin River under Different Climate Scenarios
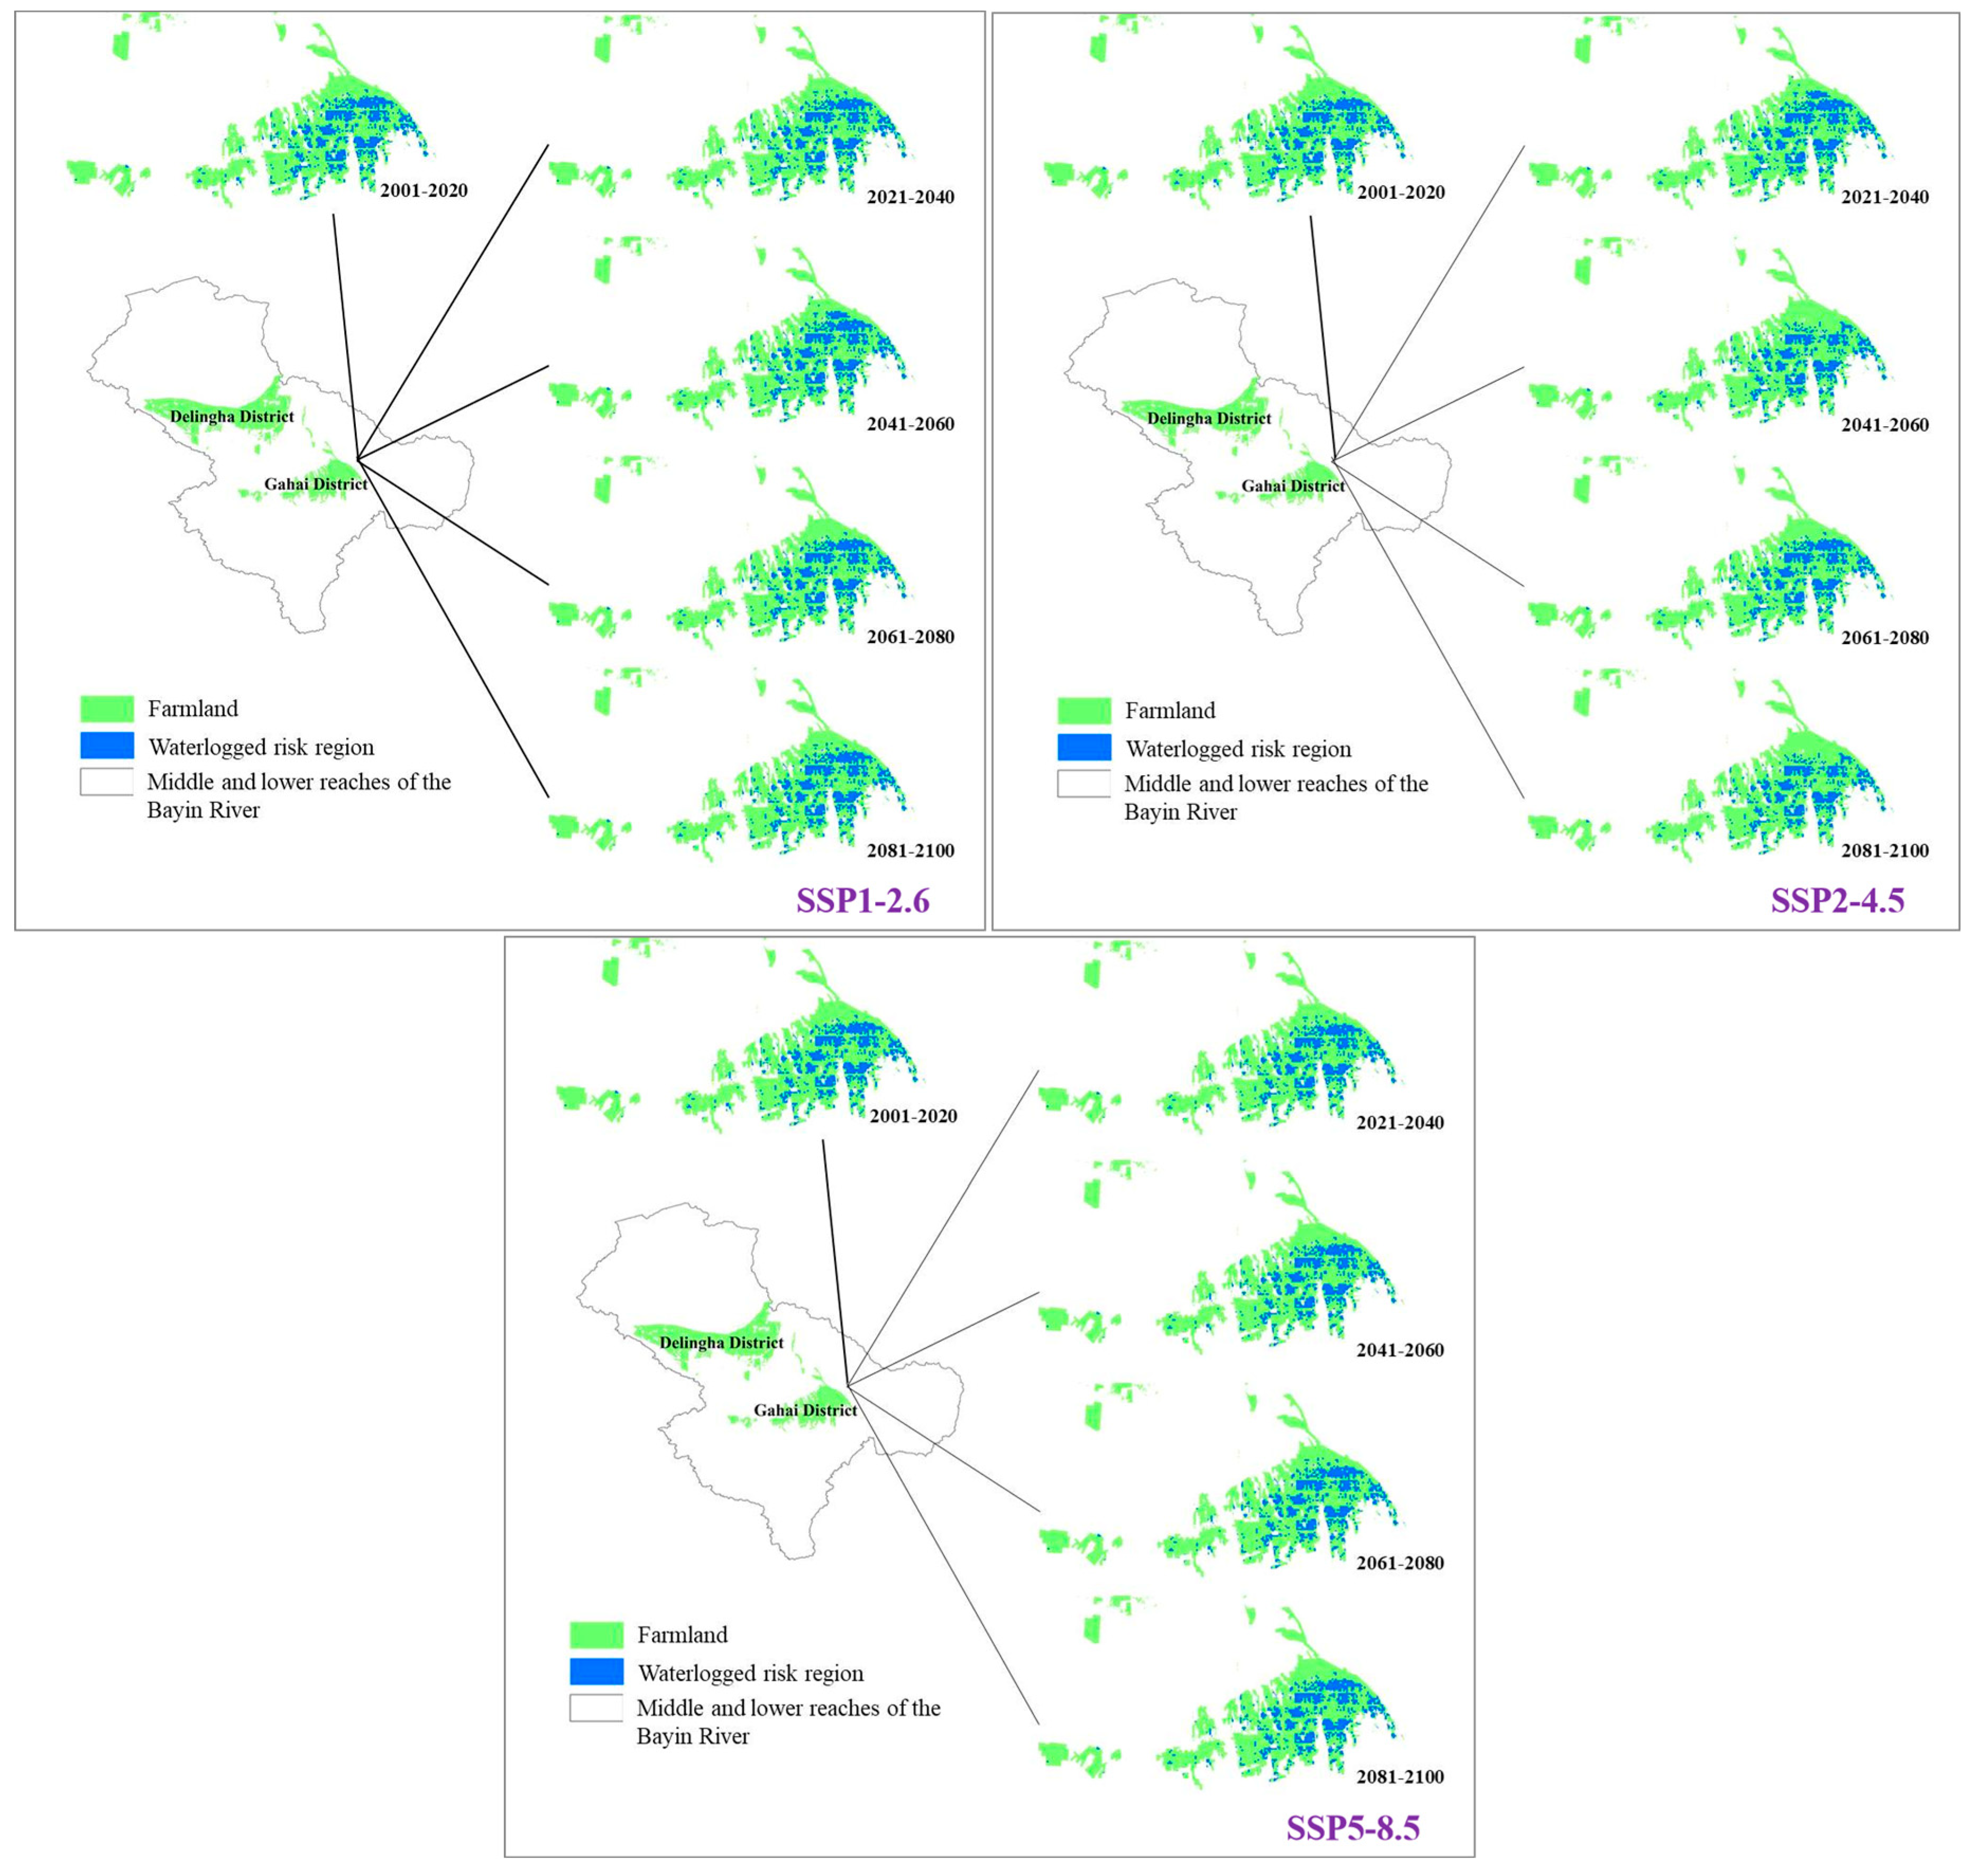
Figure 17 shows the risk areas for crop waterlogging in the middle and lower reaches of the Bayin River for the historical period, i.e., 2001–2020, and over the next 80 years under the SSP1-2.6, SSP2-4.5, and SSP5-8.5 scenarios. Crop waterlogging under all climate scenarios occurred in the Gahai irrigation district. Among those, the maximum area of crop waterlogging for the historical period (2001–2020) was 10.9 km2. The observed maximum water logging area of the farmland for the historical period is 10.17 km2, a little lower than the simulated one. The maximum area of crop waterlogging under the SSP1-2.6 scenario was 11.52 km2, which occurred in 2055 in the 2041–2060 period and the minimum area was 10.9 km2 which occurred in 2073 in the 2061–2080 period. The maximum area of crop waterlogging was 11.48 km2 under the SSP2-4.5 scenario, which occurred in 2035 in the 2021–2040 period and the minimum area of crop waterlogging was 9.49 km2, which occurred in 2042 in the 2041–2060 period. The maximum area of crop waterlogging under the SSP2-8.5 scenario was 11.5 km2, which occurred in 2028 in the 2021–2040 period and the minimum area was 10.87 km2, which occurred in 2090. Overall, the maximum crop waterlogging area occurred in 2055 under the SSP1-2.6 scenario, whereas the minimum crop waterlogging area occurred in 2042 under the SSP2-4.5 scenario.
4. Discussion
The SWAT model has been successfully implemented in many surface runoff dominated areas [15,16,17]. In this research, it also performed well in out-of-mountain streamflow simulation in the upper reaches of the Bayin River, which is a surface runoff dominated area. The middle and lower reaches of the Bayin River are in a radial flow dissipation zone, with low river runoff volumes. It is difficult to apply the traditional parameter calibration method based on river channel runoff [44]. In this study, we deployed remote sensing-based LAI data [44], evapotranspiration (ET) data [45], spring wheat yield data [46], and point-scale groundwater level data [47] to calibrate relevant parameters of the middle and lower reaches of the Bayin River at the HRU-scale, subwatershed-scale, and point-scale, respectively, in order to accurately simulate the crop growth process and the watershed hydrological process. This multi-scale and multi-process model calibration approach provides a reference for the simulation of ecological-hydrological processes in regions where information is deficient.
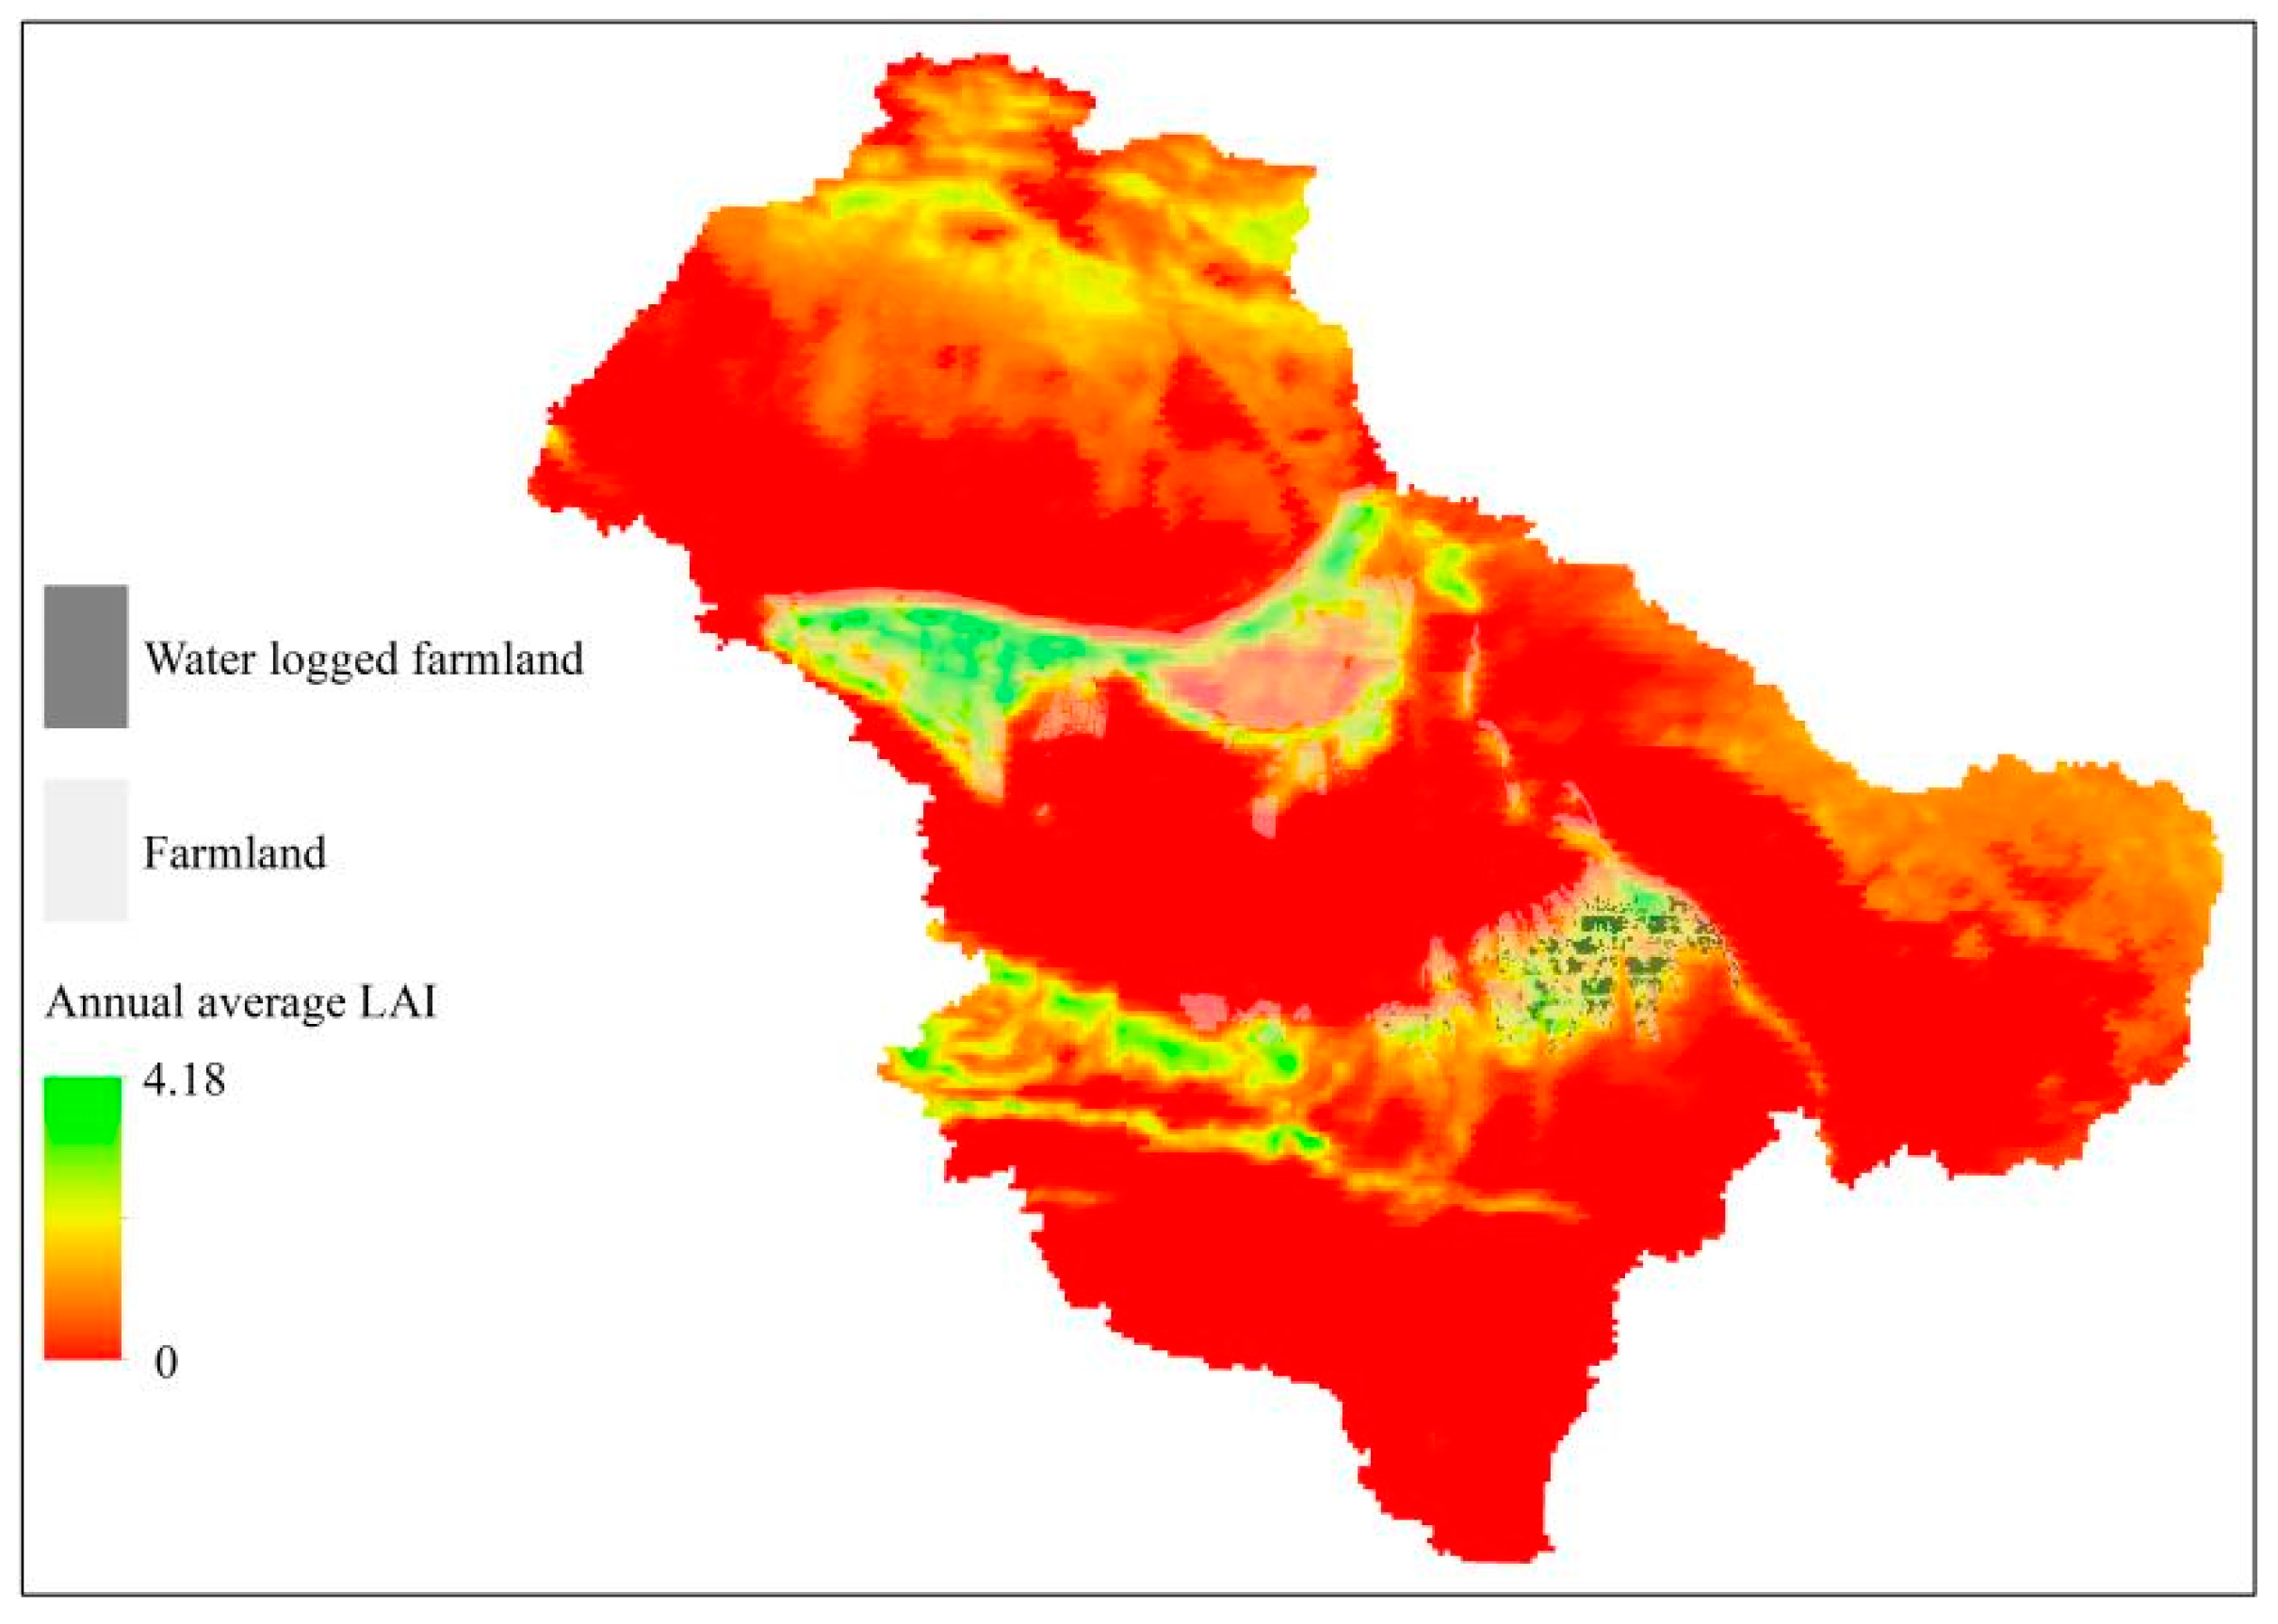
The LAI is a key parameter that connects plant growth to hydrological processes [44]. However, the default LAI calculation results of the SWAT model are inaccurate in both the temporal and spatial scales [44]. It will further impact the water budget. This research used remotely sensed LAI to calibrate the LAI-related parameters and the result showed that the SWAT performed well in LAI simulation from June to September, and this period is our concern. The rest months are dormancy periods for the plants in SWAT and the LAI value is zero. The simulated spring wheat yields were higher than the actual yields in this research. The SWAT model incorporated the EPIC (Erosion Productivity Impact Calculator) model to calculate the crop yield. Several studies have reported poor yield prediction using the SWAT model [43]. In this research, SWAT appears to have similar problems in crop yield prediction as well. The calibration of crop yield-related parameters is still needed because this process would make the crop growth prediction more reliable than the uncalibrated model [43]. ET is one of the most important components of the water balance; approximately 60–70% of precipitation returns to the atmosphere from the land surface [46]. Many studies concluded that the catchment water balance would be better reproduced when satellite-based ET served as the calibration target in watersheds with a lack of hydrological and meteorological data [46]. In this research, remote sensing-based SSEBop evapotranspiration data was used to calibrate the SWAT-MODFLOW model and the model performance was pretty good in ET simulation. Further, the water budget would be more efficient. The original MODFLOW model was built based on an existing study [36]. After being coupled with the SWAT model, the groundwater-related parameters were further calibrated based on observed groundwater level data from 20 wells. All of the above calibrations could make the SWAT-MODFLOW more efficient in surface and groundwater budget and crop growth. Finally, the simulated waterlogged farmland area is 10.9 km2, and the value is close to the measured one. In addition, the annual average LAI of the waterlogged farmland is 1.58 and for the non-waterlogged farmland, the value is 2.61 (Figure 18). That may be because the crop health in waterlogged farmland was damaged. All of the above means our model is reliable.
The simulation result of the SWAT-MODFLOW model shows in the historical period and all of the climate scenarios, changes in groundwater levels in the middle and lower reaches of the Bayin River were mainly influenced by the streamflow from the upper reaches. The water budget study based on hydrochemistry and stable isotopes shows the same result [48]. That means, the SWAT-MODFLOW built in this study is reliable in groundwater generation mechanism modelling. Furthermore, we could reduce the risk of crop waterlogging by controlling the streamflow in the upper reaches of the Bayin River and other similar inland river watersheds.
As aforementioned, waterlogging refers to the damage to plants by water stress due to excess soil water in the crop’s root zone that exceeds the maximum water holding capacity of the field [6]. Thus, wheat and goji (wolfberry) root depth is one of the main factors influencing the identification of waterlogging risk areas in the middle and lower reaches of the Bayin River. The maximum root depth in the SWAT model, in addition to some hydrothermal parameters, is an important parameter that affects the simulation of the root growth process [45]. Spring wheat is an annual crop, and its performance variation is seasonal. A maximum root depth of 1600 mm was obtained for spring wheat in the middle and lower reaches of the Bayin River based on preliminary field observations. The default plant database of the SWAT model does not include goji berry (wolfberry), a perennial shrub. We applied shrub-related parameters from the SWAT plant database for goji berry. Based on preliminary field observations, most of the goji berry trees planted in the Gahai irrigation area were four years old or older and the roots would have reached the deepest level. We set the root depth to 4000 mm, which only varied with the thickness of each HRU soil layer. The reliable modelling of the groundwater generation mechanism and the crop’s root depth would make the assessment and prediction of the crop waterlogging risk more efficient.
To our knowledge, this is the first study to assess the crop waterlogging risk caused by rising groundwater levels in inland river basins in groundwater dominate arid regions. We expanded the application of the hydrological model in crop waterlogging risk assessment and prediction and provided a comprehensive view of the impact of climate change on water cycle processes and crop growth in the watersheds, including the changes in irrigation water volume in the middle and lower reaches of the Bayin River. However, in practice, due to the lagging irrigation system and facilities, the middle and lower reaches of the Bayin River adopt a relatively crude approach of “heavy flood irrigation”. This irrigation approach may have a non-negligible impact on the groundwater level in the watersheds [49]. However, the amount of irrigation water under this irrigation method is also challenging to obtain accurately. The amount of irrigation water automatically determined based on the amount of water held in the field used in this study may differ significantly from the actual amount of irrigation water.
The SWAT model only takes into consideration the water deficit on crop growth inhibition but not the effect of excess water on crop growth [50]. The crop waterlogging risk identification module developed in this study first set aside groundwater recharge of soil water in the root zone to obtain the optimal amount of irrigation water volume for a crop without the influence of groundwater and assumed that the crop is neither water-deficient nor water-surplus under this irrigation model. This irrigation volume was then fed into the SWAT-MODFLOW model to simulate changes in the groundwater level. In fact, the effect of “excess water” was categorized as crop waterlogging in this module and the mechanisms involved were neglected. For future research, the mechanism of the crop waterlogging risk identification module will be improved based on field trial data. In addition, salinization caused by groundwater levels increasing also should be considered in future research.
5. Conclusions
In this study, we have developed a crop waterlogging identification module based on the SWAT-MODFLOW coupled model. Based on the accurate simulation of crop growth and the water cycle process in the middle and lower reaches of the Bayin River, the SSP1-2.6, SSP2-4.5, and SSP5-8.5 climate change scenarios simulated by the BCC-CSM2-MR model under CMIP6 were combined to accurately identify and predict the risk areas for crop waterlogging in the study area under different scenarios. We have concluded:
- (1)
- The SWAT-MODFLOW model had satisfied simulation results for LAI, ET, spring wheat yield, and groundwater level in the middle and lower reaches of the Bayin River. Furthermore, the groundwater generation mechanism and the crop’s root depth were reliable modelling and would make the assessment and prediction of the crop waterlogging risk more efficient.
- (2)
- The precipitation showed an overall increasing trend in the Bayin River watersheds over the next 80 years under the SSP1-2.6, SSP2-4.5, and SSP5-8.5 scenarios. The temperature showed a clear increasing trend over the next 80 years under the SSP2-4.5 and SSP5-8.5 scenarios.
- (3)
- Under the SSP1-2.6 scenario, the mountain runoff from the upper reaches of the Bayin River was substantially higher than in other scenarios after 2041. The mountain runoff in the next 80 years will decrease substantially under the SSP2-4.5 scenario. The mountain runoff over the next 80 years showed an initial decrease and then an increasing trend under the SSP5-8.5 scenario.
- (4)
- During the historical period, the crop waterlogging risk area was 10.9 km2. In the next 80 years, the maximum crop waterlogging area will occur in 2055 under the SSP1-2.6 scenario. The minimum crop waterlogging area, 9.49 km2, occurred in 2042 under the SSP2-4.5 scenario. The changes in the area at risk of crop waterlogging under each scenario are mainly influenced by the mountain runoff from the upper reaches of the Bayin River.
Author Contributions
Conceptualization, X.J. and X.M.; methodology, X.J.; formal analysis, X.J.; investigation, X.J.; resources, Y.J.; data curation J.Z. and D.F.; writing—original draft preparation, X.J.; writing—review and editing, Y.J.; project administration, X.J.; funding acquisition, X.J. and X.M. All authors have read and agreed to the published version of the manuscript.
Funding
This research was supported by the National Natural Science Foundation of China, No. 42161020, and grants from the Natural Science Foundation of Qinghai Province, China, grant number 2021-ZJ-705.
Data Availability Statement
The processed data required to reproduce these findings cannot be shared at this time as the data also form part of an ongoing study.
Conflicts of Interest
The authors declare no conflict of interest.
References
- Nyarobi, H.A.; Ngondya, I.B.; Munishi, L.K. The effects of extreme climate on the invasive plant, Gutenbergia cordifolia: Implications for its future management in savannah ecosystems. Heliyon 2022, 8, e09172. [Google Scholar] [CrossRef] [PubMed]
- Zhang, Y. Influence of frequent flood disaster on agricultural productivity of rice planting and structural optimization strategy. Microprocess. Microsyst. 2021, 82, 103863. [Google Scholar] [CrossRef]
- Essam, D.; Ahmed, M.; Abouelmagd, A.; Farouk, S. Monitoring temporal variations in groundwater levels in urban areas using ground penetrating radar. Sci. Total Environ. 2020, 703, 134986. [Google Scholar] [CrossRef] [PubMed]
- Perrino, E.V.; Ladisa, G.; Calabrese, G. Flora and plant genetic resources of ancient olive groves of Apulia (southern Italy). Genet. Resour. Crop Evol. 2014, 61, 23–53. [Google Scholar] [CrossRef]
- Perrino, E.V.; Wagensommer, R.P. Crop Wild Relatives (CWRs) Threatened and Endemic to Italy: Urgent Actions for Protection and Use. Biology 2022, 11, 193. [Google Scholar] [CrossRef]
- Zhou, W.; Chen, F.; Meng, Y.; Chandrasekaran, U.; Luo, X.; Yang, W.; Shu, K. Plant waterlogging/flooding stress responses: From seed germination to maturation. Plant Physiol. Biochem. 2020, 148, 228–236. [Google Scholar] [CrossRef]
- Santhi, C.; Muttiah, R.S.; Arnold, J.G.; Srinivasan, R. A GIS-based regional planning tool for irrigation demand assessment and savings using SWAT. Trans. ASABE 2005, 48, 137–147. [Google Scholar] [CrossRef]
- Huang, C.; Gao, Y.; Qin, A.; Liu, Z.; Zhao, B.; Ning, D.; Ma, S.; Duan, A.; Liu, Z. Effects of waterlogging at different stages and durations on maize growth and grain yields. Agric. Water Manag. 2022, 261, 107334. [Google Scholar] [CrossRef]
- Mandal, U.K.; Burman, D.; Bhardwaj, A.K.; Nayak, D.B.; Raut, S. Waterlogging and coastal salinity management through land shaping and cropping intensification in climatically vulnerable Indian Sundarbans. Agric. Water Manag. 2019, 216, 12–26. [Google Scholar] [CrossRef]
- Baffour-Ata, F.; Antwi-Agyei, P.; Nkiaka, E.; Dougill, A.J.; Anning, A.K.; Kwakye, S.O. Effect of climate variability on yields of selected staple food crops in northern Ghana. J. Agric. Food Res. 2021, 6, 100205. [Google Scholar] [CrossRef]
- Sun, M.; Chou, J.; Xu, Y.; Yang, F.; Li, J. Study on the thresholds of grain production risk from climate change in China’s main grain-producing areas. Phys. Chem. Earth Parts A/B/C 2020, 116, 102837. [Google Scholar] [CrossRef]
- Cochand, F.; Brunner, P.; Hunkeler, D.; Rösslerb, O.; Holzkämpercd, A. Cross-sphere modelling to evaluate impacts of climate and land management changes on groundwater resources. Sci. Total Environ. 2021, 798, 148759. [Google Scholar] [CrossRef] [PubMed]
- Zhao, W.; Lin, Y.; Zhou, P.; Wang, G.; Dang, X.; Gu, X. Characteristics of groundwater in Northeast Qinghai-Tibet Plateau and its response to climate change and human activities: A case study of Delingha, Qaidam Basin. China Geol. 2021, 4, 377–388. [Google Scholar] [CrossRef]
- Frederiksen, R.R.; Molina-Navarro, E. The importance of subsurface drainage on model performance and water balance in an agricultural catchment using SWAT and SWAT-MODFLOW. Agric. Water Manag. 2021, 255, 107058. [Google Scholar] [CrossRef]
- Lai, G.; Luo, J.; Li, Q.; Qiu, L.; Yi, F. Modification and validation of the SWAT model based on multi-plant growth mode: A case study of the Meijiang River Basin, China. J. Hydrol. 2020, 585, 124778. [Google Scholar] [CrossRef]
- Rajib, A.; Liu, Z.; Merwade, V.; Tavakolyde, A.A.; Follume, M.L. Towards a large-scale locally relevant flood inundation modeling framework using SWAT and LISFLOOD-FP. J. Hydrol. 2020, 581, 124406. [Google Scholar] [CrossRef]
- Wu, J.; Chen, X.; Yu, Z.; Yao, H.; Li, W.; Zhang, D. Assessing the impact of human regulations on hydrological drought development and recovery based on a ‘simulated-observed’ comparison of the SWAT model. J. Hydrol. 2019, 577, 123990. [Google Scholar] [CrossRef]
- Wang, H.; Xie, T.; Yu, X.; Zhang, C. Simulation of soil loss under different climatic conditions and farming economic benefits: The example of Yulin City on Loess Plateau. Agric. Water Manag. 2021, 244, 106462. [Google Scholar] [CrossRef]
- Jafari, T.; Kiem, A.S.; Javadi, S.; Nakamura, N.; Nishida, K. Fully integrated numerical simulation of surface water-groundwater interactions using SWAT-MODFLOW with an improved calibration tool. J. Hydrol. Reg. Stud. 2021, 35, 100822. [Google Scholar] [CrossRef]
- Aliyari, F.; Bailey, R.T.; Tasdighi, A.; Doziera, A.; Arabia, M.; Zeilerb, K. Coupled SWAT-MODFLOW model for large-scale mixed agro-urban river basins. Environ. Model. Softw. 2019, 115, 200–210. [Google Scholar] [CrossRef]
- Mosase, E.; Ahiablame, L.; Park, S.; Baily, R. Modelling potential groundwater recharge in the Limpopo River Basin with SWAT-MODFLOW. Groundw. Sustain. Dev. 2019, 9, 100260. [Google Scholar] [CrossRef]
- Zhou, Y.; Gao, X.; Wang, J.; Robinson, B.H.; Zhao, X. Water-use patterns of Chinese wolfberry (Lycium barbarum L.) on the Tibetan Plateau. Agric. Water Manag. 2021, 255, 107010. [Google Scholar] [CrossRef]
- Zhang, H.; Huang, Y.; An, S.; Li, H.; Deng, X.; Wang, P.; Fan, M. Land-use patterns determine the distribution of soil microplastics in typical agricultural areas on the eastern Qinghai-Tibetan Plateau. J. Hazard. Mater. 2022, 426, 127806. [Google Scholar] [CrossRef] [PubMed]
- Yang, N.; Zhou, P.; Wang, G.; Zhang, B.; Gu, X. Hydrochemical and isotopic interpretation of interactions between surface water and groundwater in Delingha, Northwest China. J. Hydrol. 2021, 598, 126243. [Google Scholar] [CrossRef]
- Malik, W.; Jiménez-Aguirre, M.T.; Dechmi, F. Coupled DSSAT-SWAT models to reduce off-site N pollution in Mediterranean irrigated watershed. Sci. Total Environ. 2020, 745, 141000. [Google Scholar] [CrossRef] [PubMed]
- Eini, M.R.; Javadi, S.; Delavar, M.; Gassman, P.W.; Jarihani, B. Development of alternative SWAT-based models for simulating water budget components and streamflow for a karstic-influenced watershed. Catena 2020, 195, 104801. [Google Scholar] [CrossRef]
- Li, S.; Wallington, K.; Niroula, S.; Cai, X. A modified response matrix method to approximate SWAT for computationally intense applications. Environ. Model. Softw. 2021, 148, 105269. [Google Scholar] [CrossRef]
- Zhang, L.; Nan, Z.; Yu, W.; Ge, Y. Modeling land-use and land-cover change and hydrological responses under consistent climate change scenarios in the Heihe River Basin, China. Water Resour. Manag. 2015, 29, 4701–4717. [Google Scholar] [CrossRef]
- Patil, N.S.; Chetan, N.L.; Nataraja, M.; Suthar, S. Climate change scenarios and its effect on groundwater level in the Hiranyakeshi watershed. Groundw. Sustain. Dev. 2020, 10, 100323. [Google Scholar] [CrossRef]
- Hughes, J.D.; Langevin, C.D.; White, J.T. MODFLOW-based coupled surface water routing and groundwater-flow simulation. Ground Water 2015, 53, 452. [Google Scholar] [CrossRef] [PubMed]
- Ou, G.; Li, R.; Pun, M.; Osborn, C.; Bradley, J.; Schneider, J.; Chen, X. A MODFLOW package to linearize stream depletion analysis. J. Hydrol. 2016, 532, 9–15. [Google Scholar] [CrossRef]
- Bailey, R.T.; Wible, T.C.; Arabi, M.; Records, R.M.; Ditty, J. Assessing regional-scale spatio-temporal patterns of groundwater–surface water interactions using a coupled SWAT-MODFLOW model. Hydrol. Process. 2016, 30, 4420–4433. [Google Scholar] [CrossRef]
- Jafari, T.; Kiem, A.S.; Javadi, S.; Nakamura, T.; Nishida, K. Using insights from water isotopes to improve simulation of surface water-groundwater interactions. Sci. Total Environ. 2021, 798, 149253. [Google Scholar] [CrossRef] [PubMed]
- Pandey, A.K.; Singh, A.G.; Gadhiya, A.R.; Kumar, S.; Mehta, R. Current approaches in horticultural crops to mitigate waterlogging stress. In Stress Tolerance in Horticultural Crops; Woodhead Publishing: Sawston, UK, 2021; pp. 289–299. [Google Scholar]
- Agricultural Resources Division Office of Qinghai Province. Qinghai Soil; China Agricultural Press: Beijing, China, 1997. [Google Scholar]
- Feng, L. Study on Groundwater Resource Development of Piedmont Alluvial Plain in Bayin River[D]; Changan University: Xi’an, China, 2011; (In Chinese with English abstract). [Google Scholar]
- Delingha Local Chronicles Compilation Committee. Delingha City Chronicle; Local Chronicles Publishing House: Beijing, China, 2004. [Google Scholar]
- Ouyang, W.; Wei, P.; Gao, X.; Srinivasan, R.; Yen, H.; Xie, X.; Liu, L.; Liu, H. Optimization of SWAT-Paddy for modeling hydrology and diffuse pollution of large rice paddy fields. Environ. Model. Softw. 2020, 130, 104736. [Google Scholar] [CrossRef]
- Mengistu, A.G.; van Rensburg, L.D.; Woyessa, Y.E. Techniques for calibration and validation of SWAT model in data scarce arid and semi-arid catchments in South Africa. J. Hydrol. Reg. Stud. 2019, 25, 100621. [Google Scholar] [CrossRef]
- Wang, T.; Tu, X.; Singh, V.P.; Chen, X.; Lin, K. Global data assessment and analysis of drought characteristics based on CMIP6. J. Hydrol. 2021, 596, 126091. [Google Scholar] [CrossRef]
- Yazdandoost, F.; Moradian, S.; Izadi, A.; Aghakouchak, A. Evaluation of CMIP6 precipitation simulations across different climatic zones: Uncertainty and model intercomparison. Atmos. Res. 2021, 250, 105369. [Google Scholar] [CrossRef]
- Prodhan, F.A.; Zhang, J.; Sharma, T.P.P.; Nanzad, L.; Zhang, D.; Seka, A.M.; Ahmed, N.; Hasan, S.S.; Hoque, M.M.; Mohana, H.P. Projection of future drought and its impact on simulated crop yield over South Asia using ensemble machine learning approach. Sci. Total Environ. 2021, 807, 151029. [Google Scholar] [CrossRef]
- Luo, Y.; He, C.; Sophocleous, M.; Yin, Z.; Ren, H.; Ouyang, Z. Assessment of crop growth and soil water modules in SWAT2000 using extensive field experiment data in an irrigation district of the Yellow River Basin. J. Hydrol. 2008, 352, 139–156. [Google Scholar] [CrossRef]
- Jin, X.; Jin, Y.; Mao, X.; Zhai, J.; Fu, D. Modelling the impact of vegetation change on hydrological processes in Bayin River Basin, Northwest China. Water 2021, 12, 897. [Google Scholar] [CrossRef] [Green Version]
- Jepsen, S.; Harmon, T.; Guan, B. Analyzing the suitability of remotely sensed ET for calibrating a watershed model of a Mediterranean montane forest. Remote Sens. 2021, 13, 1258. [Google Scholar] [CrossRef]
- Jin, X.; Jin, Y. Calibration of a distributed hydrological model in a data-scarce basin based on GLEAM datasets. Water 2020, 12, 897. [Google Scholar] [CrossRef] [Green Version]
- Liu, W.; Park, S.; Bailey, R.T.; Molina-Navarro, E.; Andersen, H.E.; Thodsen, H.; Nielsen, A.; Jeppesen, E.; Jensen, J.S.; Jensen, J.B.; et al. Comparing SWAT with SWAT-MODFLOW hydrological simulations when assessing the impacts of groundwater abstractions for irrigation and drinking water. Hydrol. Earth Syst. Sci. Discuss. 2019, 232, 1–51. [Google Scholar]
- Wen, G.; Wang, W.; Duan, L.; Gu, X.; Li, Y.; Zhao, J. Quantitatively evaluating exchanging relationship between river water and groundwater in Bayin River Basin of northwest China using hydrochemistry and stable isotope. Arid. Land Geogr. 2018, 41, 734–743, (In Chinese with English abstract). [Google Scholar]
- Doble, R.; Simmons, C.; Jolly, I.; Walker, G. Spatial relationships between vegetation cover and irrigation-induced groundwater discharge on a semi-arid floodplain, Australia. J. Hydrol. 2006, 329, 75–97. [Google Scholar] [CrossRef]
- Arnold, J.; Moriasi, D.; Gassman, P.; Abbaspour, K.C.; White, M.J.; Srinivasan, R.; Santhi, C.; Harmel, R.D.; Van Griensven, A.; Van Liew, M.W.; et al. SWAT: Model use, calibration, and validation. Trans. ASABE 2012, 55, 1491–1508. [Google Scholar] [CrossRef]
Figure 1.
Overview map of the research area.

Figure 2.
Flow chart of SWAT crop growth simulation.

Figure 3.
Identification scheme for crop waterlogging risk areas caused by groundwater level change under different climatic conditions.
Figure 3.
Identification scheme for crop waterlogging risk areas caused by groundwater level change under different climatic conditions.

Figure 4.
SWAT modelling data.

Figure 5.
Sources and sinks for the MODFLOW.

Figure 6.
Hydrogeological portrait (a) and transverse (b) cross-section of the study area [36].
Figure 6.
Hydrogeological portrait (a) and transverse (b) cross-section of the study area [36].

Figure 7.
The calibrated transmissibility (a) and specific yield (b), the observed and simulated groundwater counter (c).
Figure 7.
The calibrated transmissibility (a) and specific yield (b), the observed and simulated groundwater counter (c).

Figure 8.
Simulation effect of the Soil and Water Assessment Tool (SWAT) model for out-of-mountain runoff.
Figure 8.
Simulation effect of the Soil and Water Assessment Tool (SWAT) model for out-of-mountain runoff.

Figure 9.
LAI simulation results. Remotely sensed LAI (a), SWAT simulated LAI (b) and comparision of remotely sensed and SWAT simulated monthly average LAI (c).
Figure 9.
LAI simulation results. Remotely sensed LAI (a), SWAT simulated LAI (b) and comparision of remotely sensed and SWAT simulated monthly average LAI (c).

Figure 10.
Spring wheat simulation results.

Figure 11.
Evapotranspiration (ET) simulation results. NSE value (a), R2 value (b) and PBIAS value (c).
Figure 11.
Evapotranspiration (ET) simulation results. NSE value (a), R2 value (b) and PBIAS value (c).

Figure 12.
Groundwater level simulation results.

Figure 13.
Changes in average multi-year precipitation over historical time and future years under the SSP1-2.6, SSP2-4.5 and SSP5-8.5 scenarios simulated by the BCC-CSM2-MR model.
Figure 13.
Changes in average multi-year precipitation over historical time and future years under the SSP1-2.6, SSP2-4.5 and SSP5-8.5 scenarios simulated by the BCC-CSM2-MR model.

Figure 14.
Changes in average temperature over historical time and future years under the SSP1-2.6, SSP2-4.5 and SSP5-8.5 scenarios simulated by the BCC-CSM2-MR model.
Figure 14.
Changes in average temperature over historical time and future years under the SSP1-2.6, SSP2-4.5 and SSP5-8.5 scenarios simulated by the BCC-CSM2-MR model.

Figure 15.
Simulated changes in multi-year average mountain runoff from the Bayin River in history and in future years, based on the SWAT model.
Figure 15.
Simulated changes in multi-year average mountain runoff from the Bayin River in history and in future years, based on the SWAT model.

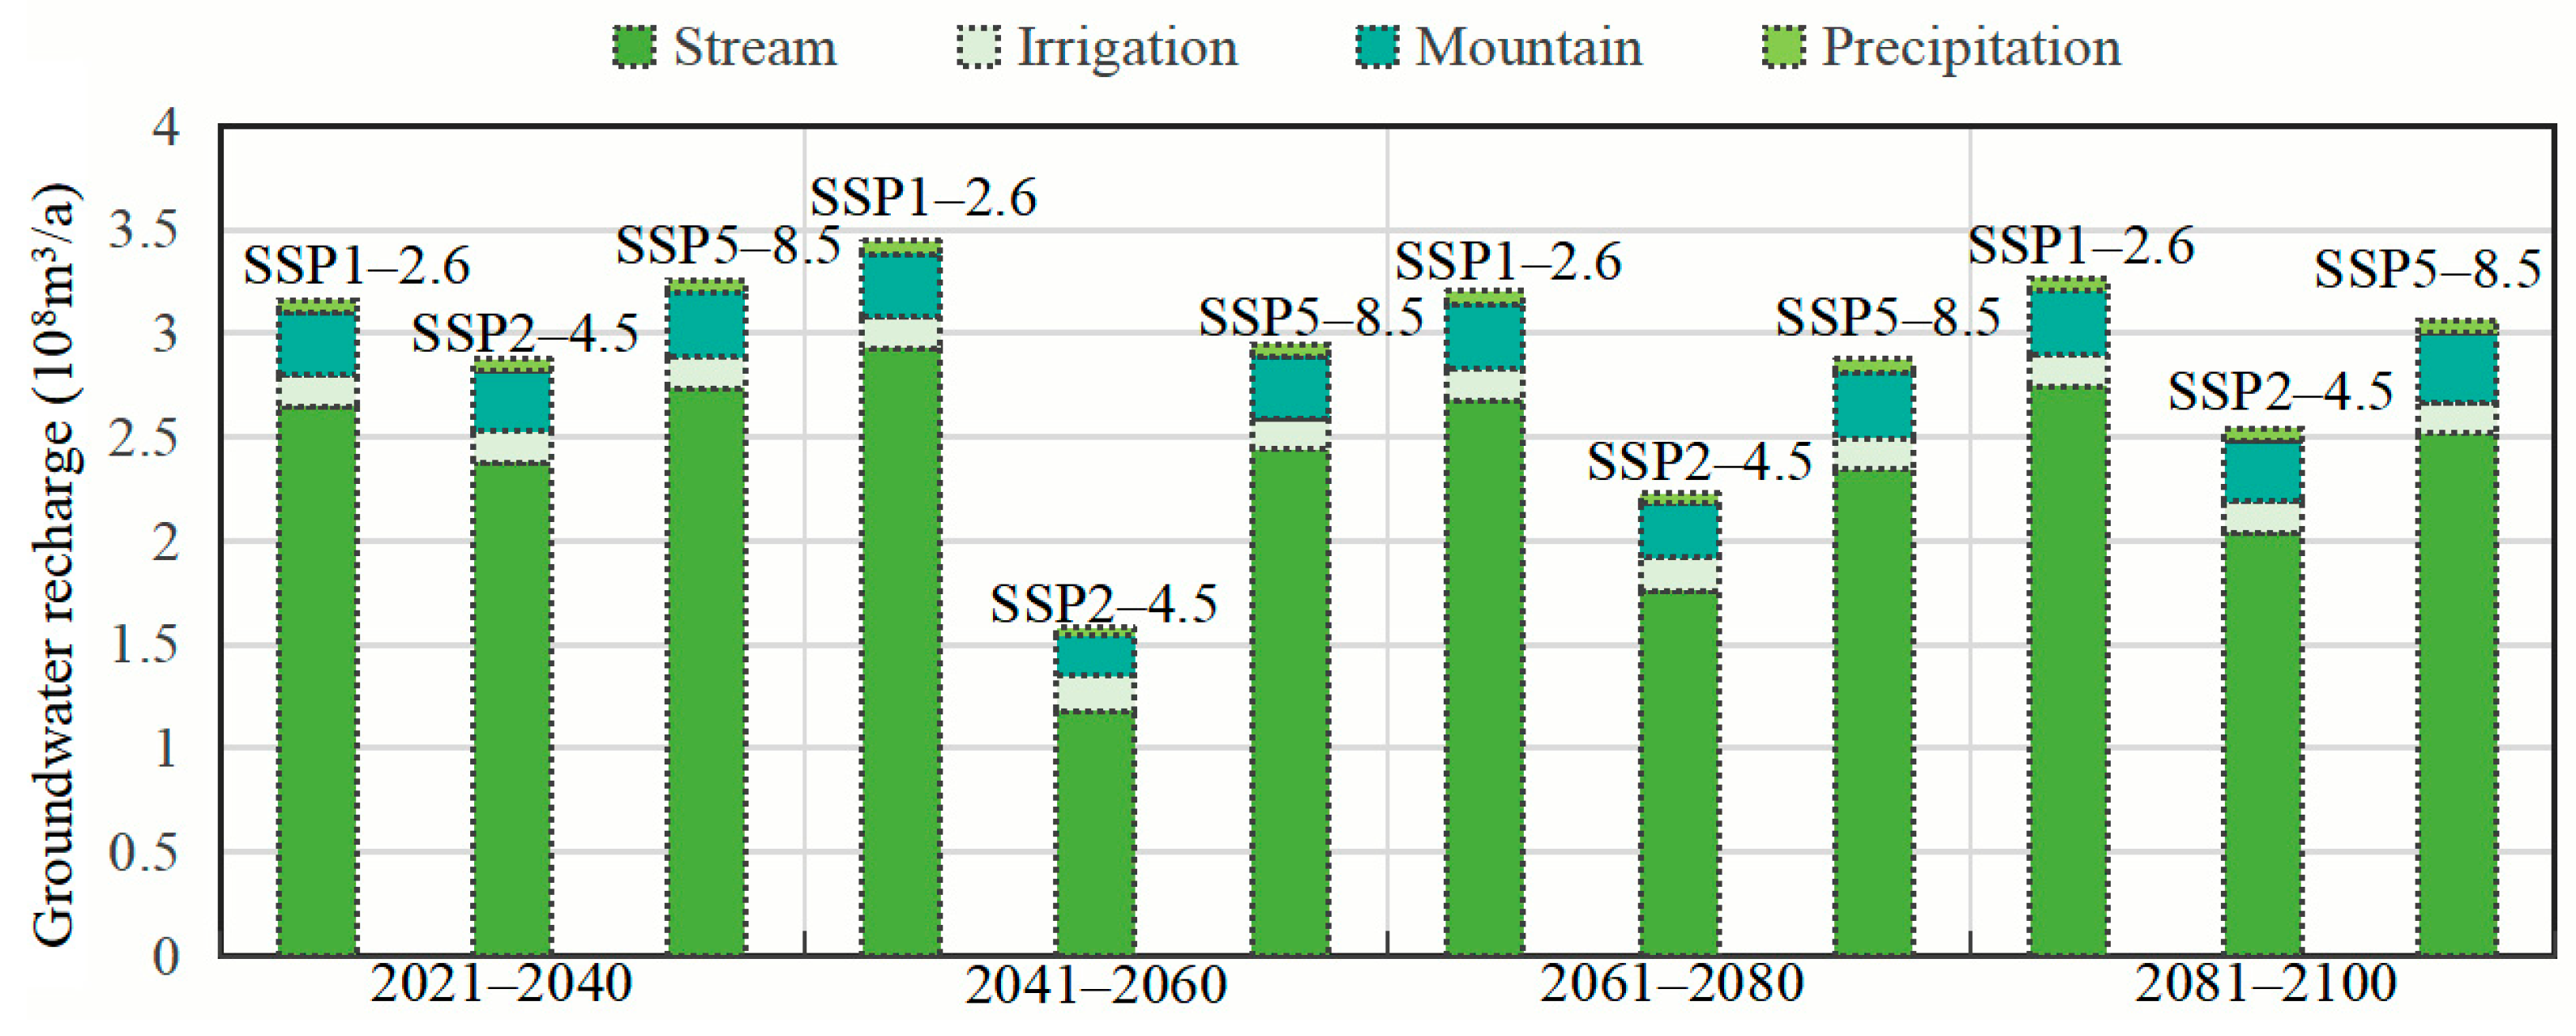
Figure 16.
Simulated changes in groundwater recharges under different climate scenarios.

Figure 17.
Historical (2001–2020) and future crop waterlogging risk areas in the middle and lower reaches of the Bayin River, under the SSP1-2.6, SSP2-4.5, and SSP5-8.5 scenarios.
Figure 17.
Historical (2001–2020) and future crop waterlogging risk areas in the middle and lower reaches of the Bayin River, under the SSP1-2.6, SSP2-4.5, and SSP5-8.5 scenarios.

Figure 18.
Annual average LAI of the study area.


Table 1.
Leaf area index (LAI)-related parameters.
| Parameter Name | Parameter Description |
|---|---|
| BLAI | Potential maximum LAI |
| LAIMX_1 | The ratio of LAI corresponding to the first point on the LAI curve |
| FRGRW1 | The ratio of accumulated temperature corresponding to the first point on the LAI curve |
| LAIMX_2 | The ratio of LAI corresponding to the second point on the LAI curve |
| FRGRW2 | Proportion of accumulated temperature corresponding to the second point on the LAI curve |
| DLAI | The ratio of accumulated temperature at which the LAI begins to decay |
| BIO_E | Photosynthetic radiation utilization rate |
| EXT_COEF | Extinction coefficient |
| GSI | Maximum stomatal conductance |
| HVSTI | Harvest index (HI) |
| T-BASE | Crop basal temperature |
Table 2.
Crop growth-related parameters.
| Parameter Name | Parameter Description |
|---|---|
| BIO_E | Photosynthetic radiation utilization rate |
| EXT_COEF | Extinction coefficient |
| GSI | Maximum stomatal conductance |
| HVSTI | Harvest index (HI) |
| T-BASE | Crop basal temperature |
| IRR_EFM | Irrigation efficiency |
Table 3.
Parameters related to evapotranspiration.
| Parameter Name | Parameter Description |
|---|---|
| SOL_BD | Soil wet bulk density |
| SLSUBBSN | Mean slope length |
| SOL_K | Soil saturation permeability coefficient |
| ESCO | Soil evaporation compensation factor |
| CH_K2 | Effective permeability coefficient of the main river channel |
| SOL_AWC | Effective soil water content |
| SNOCOVMX | Minimum snow water content at 100% snow cover |
| ALPHA_BF | Baseflow factor |
| CH_N2 | Manning’s coefficient for the main channel |
| CN2 | Number of initial SCS runoff curves at moisture condition II |
Table 4.
Groundwater-related parameters.
| Parameter Name | Parameter Description |
|---|---|
| ALPHA_BF | Baseflow factor |
| GW_DELAY | Groundwater time delay |
| GWQMN | Shallow water level threshold required for return flow to occur |
| GW_REVAP | Groundwater revap factor |
| CH_K2 | Effective permeability coefficient of the main river channel |
Publisher’s Note: MDPI stays neutral with regard to jurisdictional claims in published maps and institutional affiliations. |
© 2022 by the authors. Licensee MDPI, Basel, Switzerland. This article is an open access article distributed under the terms and conditions of the Creative Commons Attribution (CC BY) license (https://creativecommons.org/licenses/by/4.0/).
Share and Cite
MDPI and ACS Style
Jin, X.; Jin, Y.; Zhai, J.; Fu, D.; Mao, X. Identification and Prediction of Crop Waterlogging Risk Areas under the Impact of Climate Change. Water 2022, 14, 1956. https://doi.org/10.3390/w14121956
AMA Style
Jin X, Jin Y, Zhai J, Fu D, Mao X. Identification and Prediction of Crop Waterlogging Risk Areas under the Impact of Climate Change. Water. 2022; 14(12):1956. https://doi.org/10.3390/w14121956
Chicago/Turabian StyleJin, Xin, Yanxiang Jin, Jingya Zhai, Di Fu, and Xufeng Mao. 2022. "Identification and Prediction of Crop Waterlogging Risk Areas under the Impact of Climate Change" Water 14, no. 12: 1956. https://doi.org/10.3390/w14121956
Note that from the first issue of 2016, this journal uses article numbers instead of page numbers. See further details here.