Effects of Water and Fertilizer Flow Rates on the Mixing Process and Fertilization Uniformity of Cotton under Mulch Drip Irrigation

College of Mechanical and Electrical Engineering, Shihezi University, Shihezi 832003, China
*
Author to whom correspondence should be addressed.
Water 2022, 14(12), 1952; https://doi.org/10.3390/w14121952
Submission received: 5 May 2022
/
Revised: 10 June 2022
/
Accepted: 15 June 2022
/
Published: 17 June 2022
(This article belongs to the Section Water, Agriculture and Aquaculture)
Abstract
:Water and fertilizer flow rates are the most convenient variable to control in the process of drip irrigation under mulch. Suitable water and fertilizer flow rates are beneficial to improve water and fertilizer uniformity. Nine groups of water and fertilizer rate combinations were set in the common water and fertilizer rate range to study the influence of the water and fertilizer rate on fertilization uniformity. The numerical simulation of the mixing process in the main pipe was first carried out based on the multiphase flow theory, and then the field experiment for the different water and fertilizer rate combinations in the machine-picked cotton-planting pattern (one film, three tubes and six rows) was conducted. Through the numerical simulation of the mixing process in the pipeline and the analysis of water and fertilizer uniformity field experiment results, it was found that the uniform mixing length is related to the water and fertilizer flow rate, and the water and fertilizer flow rate had some effect on fertilizer uniformity. In the irrigation system with a main pipe diameter of 100 mm and a fertilizer injection pipe diameter of 20 mm, the water fertilizer flow rate ratio should be between 3–8 to ensure the effect of the mixing process and fertilization uniformity. A water flow rate of 2 m s−1 and fertilizer flow rate of 0.35 m s−1 is recommended during the fertilizer process in northern Xinjiang. This paper shows the feasibility of numerical simulation in the study of cotton water and fertilizer mixing processes, and the results can provide some reference for cotton planting.
1. Introduction
Drip irrigation under mulch with water and fertilizer integration is widely used in cotton cultivation in northwest China [1,2]. Drip irrigation under mulch has been highly effective in saving water, reducing crop evapotranspiration and improving soil salinization [3,4]. Xinxin Li [5] conducted a continuous field experiment to study the effects of water–nitrogen coupling on cotton growth, water use efficiency (WUE), nitrogen use efficiency (NUE), nitrogen partial factor productivity, yield, quality and economic benefits of under-drip irrigation in northern Xinjiang, and proposed an efficient and reasonable water and nitrogen management model. Ping Wang [6] compared the efficiency-enhanced management and conventional management of irrigation and nitrogen fertilization in the cotton fields at the Junggar Basin (Shihezi) and Tarim Basin (Cele) of northwestern China, and found that efficiency-enhanced management reduced the amount of N fertilizer by 41 percent in Cele and 44 percent in Shihezi, and the irrigation quantity by 35 percent in Cele and 24 percent in Shihezi. Haidong Wang [7] conducted field experiments to investigate the coupling effects of different amounts of water and fertilizers on the seed cotton yield, water and fertilizer use efficiency, as well as the economic benefits in northern Xinjiang, and obtained the optimum combination of water and fertilizer. Jiusheng Li [8] conducted field experiments to evaluate the effects of injector types and emitters on fertigation uniformity by simultaneously measuring the distributions of water application, solution concentration and fertilizer application within a subunit of the micro-irrigation system. Pan Tang [9] studied the effects of the pipeline layout and fertilizer concentration on the number and uniformity of the fertilizer application in the drip irrigation system, and found that the manifold layout and fertilizer concentration had significant effects on the fertilizer uniformity. Zhiyang Zhang [10] established a computational fluid dynamics model, and built an indoor test platform to experimentally study the mixing law of water and fertilizer in irrigation pipes after fertilizer injection into the pipes, and investigated the effects of pipe structure parameters, hydraulic parameters and physical properties of fertilizer on mixing uniformity, with an average deviation of 5.71% between experimental and simulation results.
Notably, researchers have conducted some research on cotton water and fertilizer management and water and fertilizer uniformity, but the effect of water and fertilizer flow rates on drip irrigation under mulch in cotton needs to be studied further. The liquid fertilizer enters the main pipe of the irrigation system through the fertilizer application equipment, and is transported to the field with the water. To ensure the uniformity of fertilizer application, the fertilizer and water should be mixed well before the fertilizer is discharged from the main pipe. If the irrigation system and fertilizer application equipment are determined, the water and fertilizer flow rate is the most convenient variable to control, to ensure uniformity of application. Therefore, it is of great interest to study the effect of water and fertilizer mixing rate on Drip Irrigation under Mulch in Cotton. Due to the complexity of the flow of water and fertilizer mixing process in the pipeline and the difficulty of direct observation, this paper intends to establish a water and fertilizer mixing model based on the multiphase flow theory, study the effects of fertilizer and water flow on the mixing process through numerical simulation, and conduct field fertilizer uniformity experiments under different water and fertilizer conditions to provide a certain reference for fertilization control in the cotton-planting process in northern Xinjiang.
2. Methods
2.1. Numerical Simulation
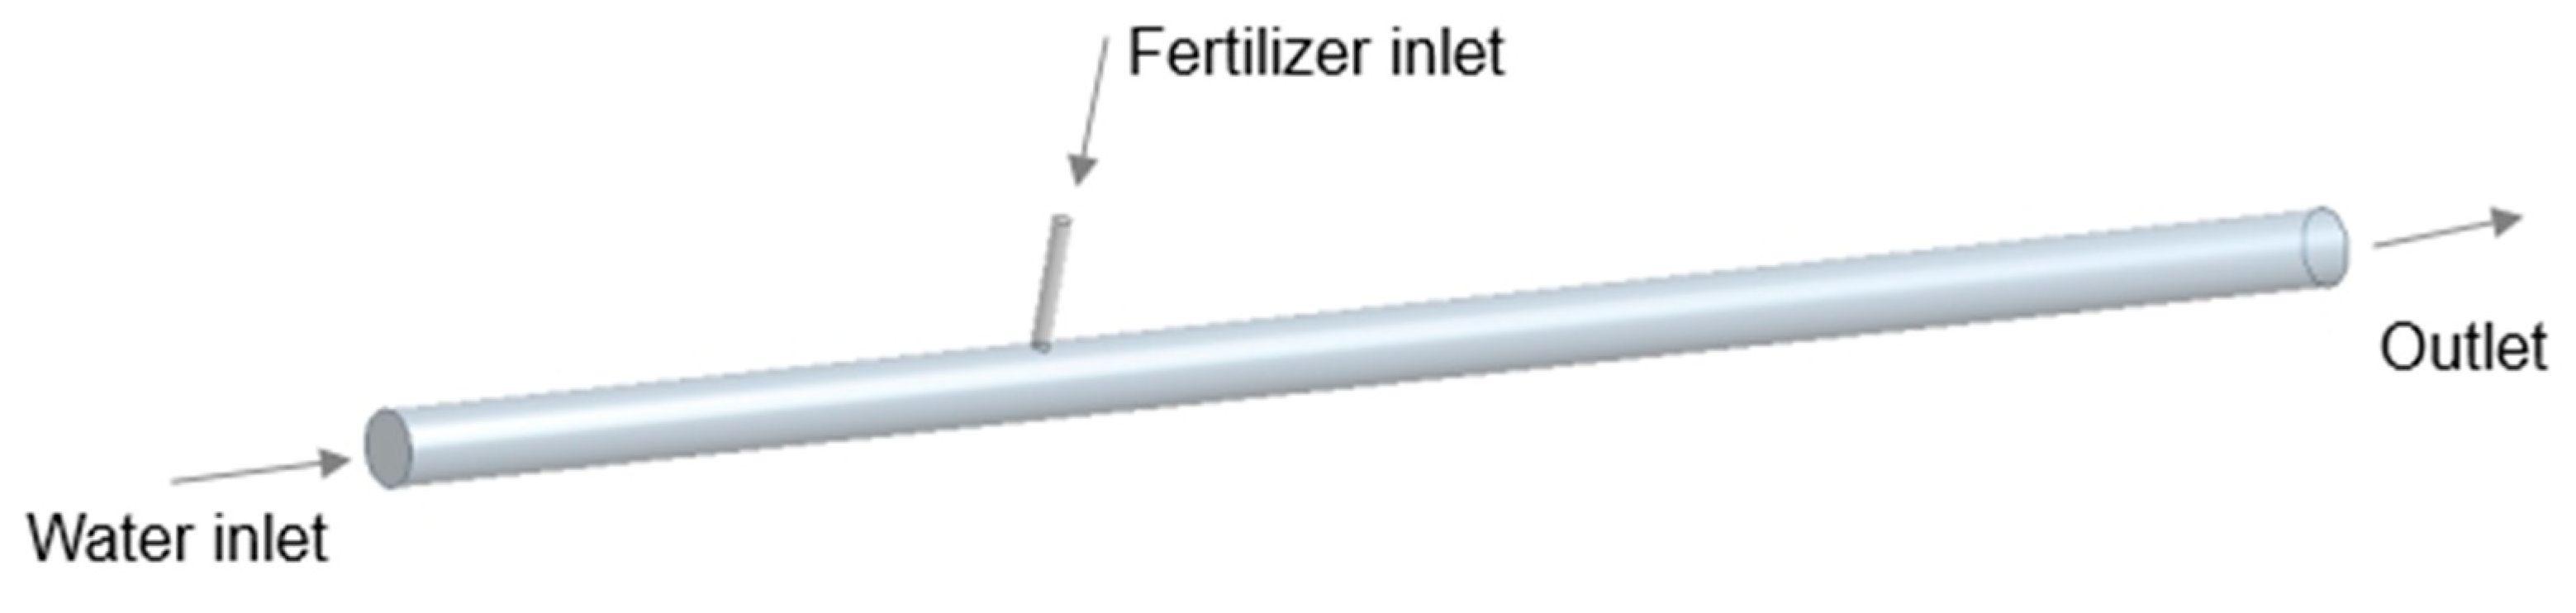
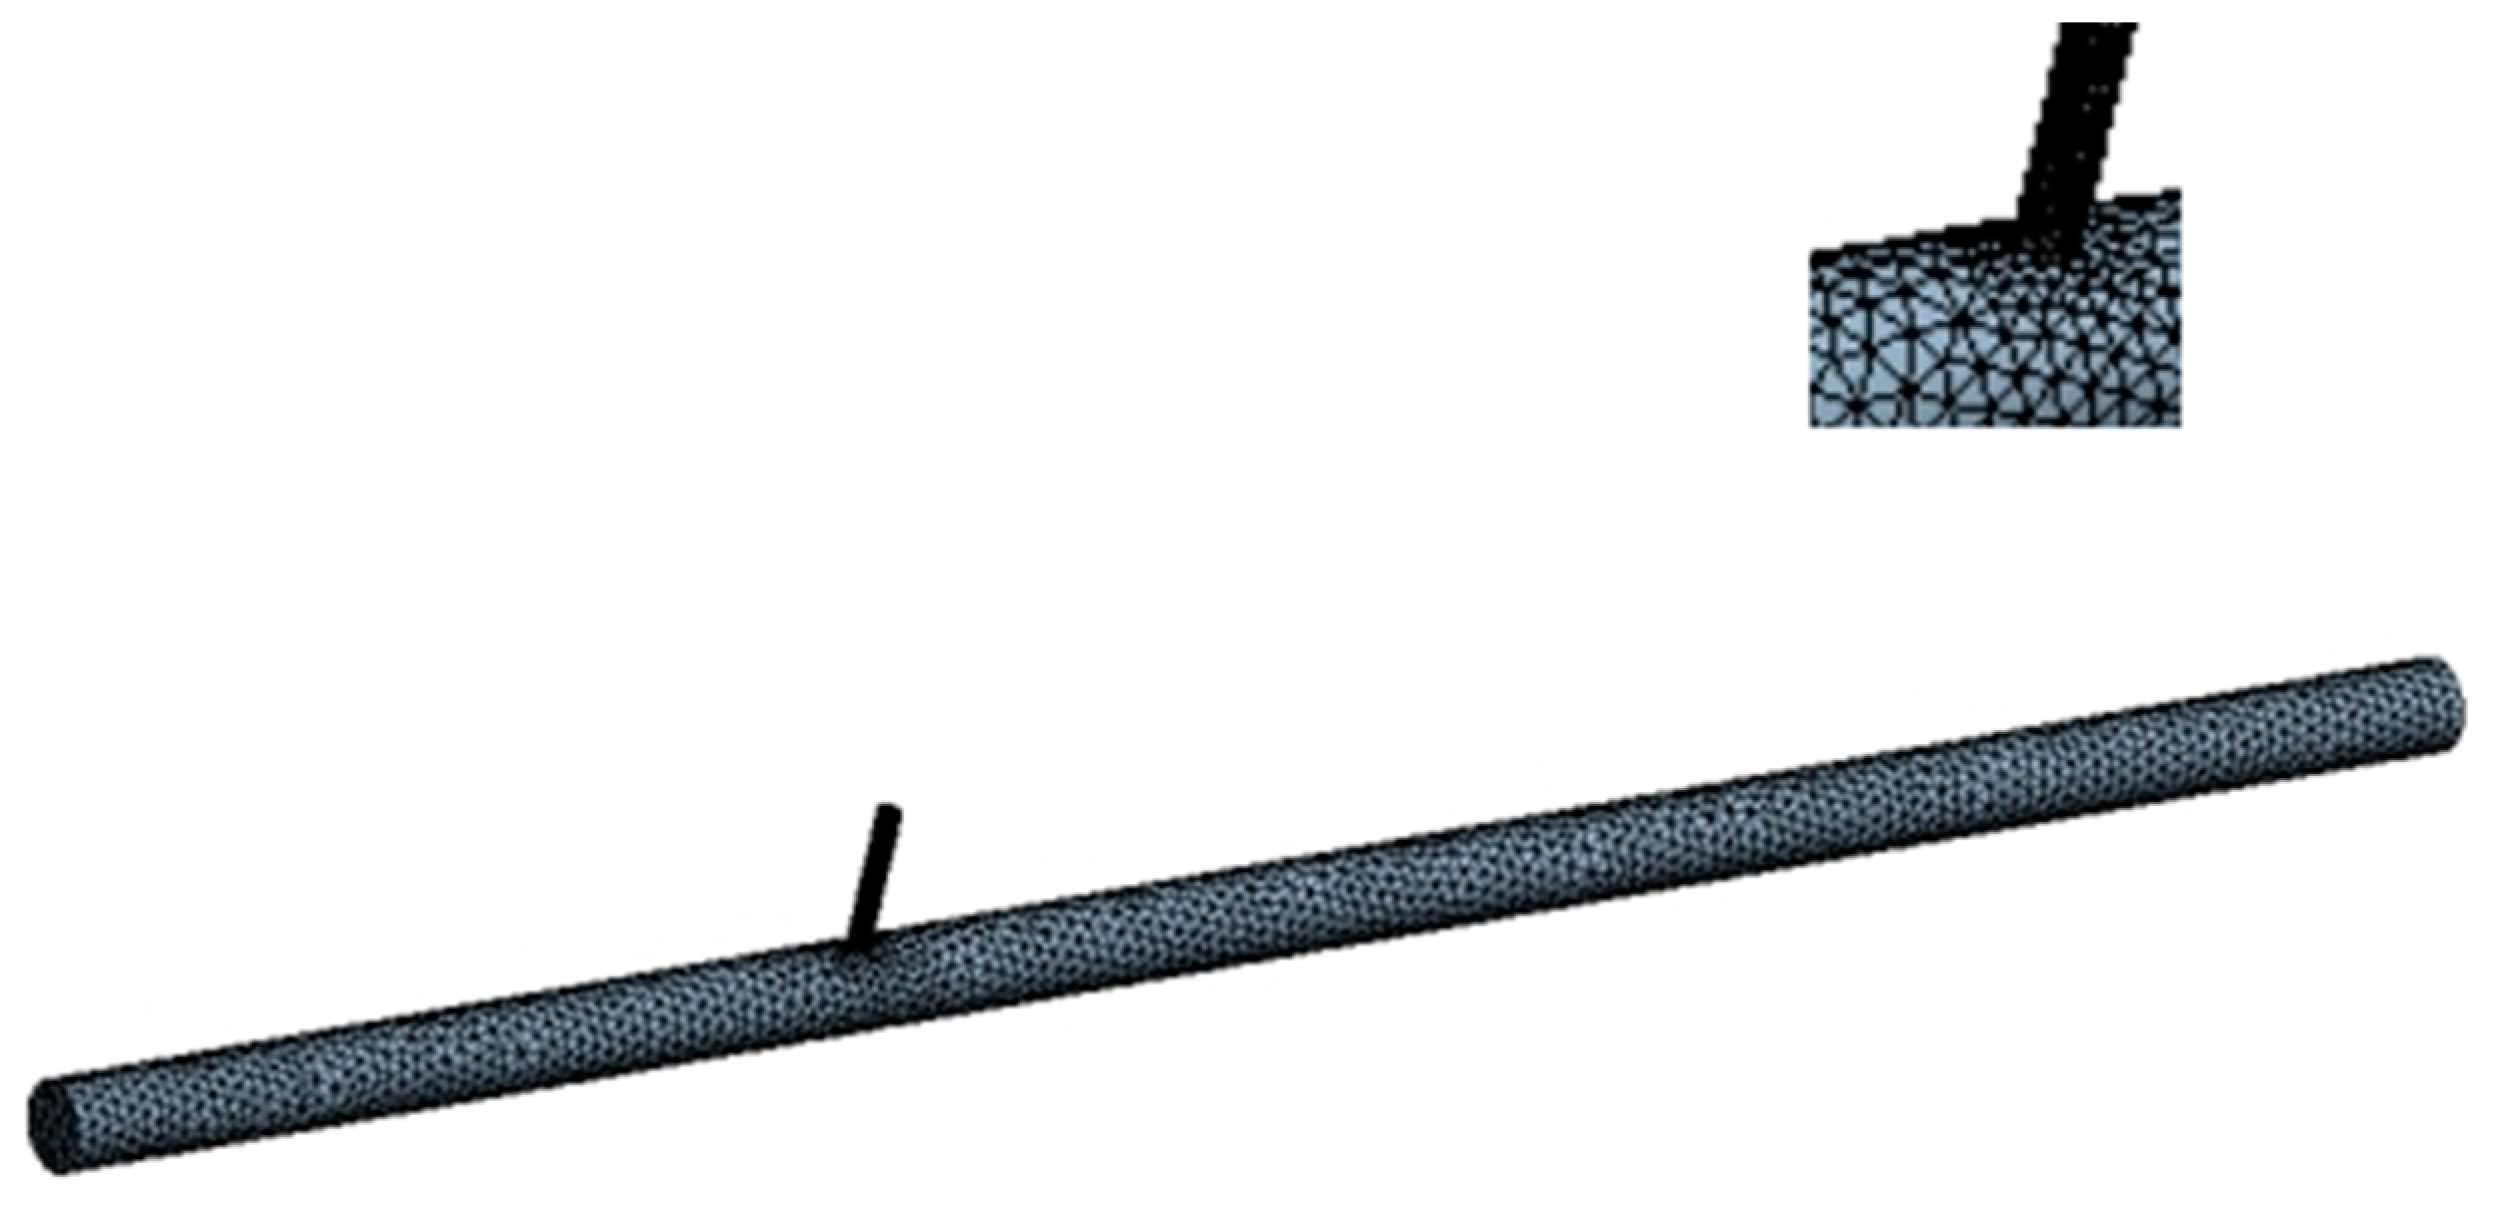
A physical model of the water and fertilizer mixing is established with regards to the water and fertilizer mixing pipeline for drip irrigation under mulch in the cotton fields, which includes the irrigation main pipe and the fertilizer injection pipe, as shown in Figure 1. The irrigation main pipe is a cylindrical pipe of 6 m length and 100 mm diameter. The fertilizer injection pipe is cylindrical, and is 0.4 m long and 25 mm in diameter. The longitudinal distance between the fertilizer inlet and water inlet is 2 m. The inlet on the left side of the main pipe is the irrigation water inlet, and the inlet of the pipe above the main pipe is the fertilizer inlet. As shown in Figure 2, the model was meshed by Ansys ICEM. The model was segmented using the tetrahedron method with encryption at the connections, and the number of static elements after partitioning is 32,615. It is vital to carry out a grid independence test on the generated meshes. We conducted grid independence tests with grid numbers of 28,493, 32,615 and 37,467. It is found that when the grid number was greater than 32,615, the difference in flow was very small. Therefore, it is considered that the grid independence has been achieved when the grid number is 32,615. The models grid meets the requirements of calculation accuracy and speed.
The water and fertilizer mixing process studied in this paper is considered a liquid–liquid mixing process, accompanied by turbulence. The turbulent liquid–liquid two-phase flow in pipelines has non-linear flow characteristics, and is complex [11,12]. The physical quantities of this turbulent flow are pulsating in time and space, and cannot be described by simple functions. In this paper, the multiphase (mixture) model is chosen as the multiphase flow model, and the standard model is chosen as the turbulence model [13,14,15]. The turbulence model has the following mathematical expressions
where and are user-defined terms for the turbulent energy term of the velocity gradient, is the turbulent energy term for the velocity gradients, and are the Prandtl constant term, is turbulent energy generated by the presence of buoyancy in the multiphase flow, is turbulent energy from the pulsation of a variable volume fluid during the flow and , and are constants that can be obtained experimentally.
In the study, we made the following assumptions: (1) The temperature change in the water–fertilizer mixing process is ignored, and the temperature inside the pipe remains constant at room temperature during the whole process; (2) the mixing process will be pure water and the liquid fertilizer is an incompressible and isotropic liquid; and (3) the calculation of the pure water phase is as a continuous phase, while the liquid fertilizer solution is regarded as a dispersed phase. Owing to the conservation of mass, the water–fertilizer mixing process satisfies the continuity equation [16,17]. The continuity equation is then expressed as follows:
where and are, respectively, the density of water, fertilizer and the mixture; and are the volume fraction of water and fertilizer; and and are, respectively, the flow rate of water, fertilizer and mixture. The momentum Equation in the Navier-Stokes [18,19] set of equations was developed as follows
where P is the pressure of the mixed-phase, is the viscosity coefficient of the mixture, g denotes gravitational acceleration and f signifies the volume force. Neglecting the effects of gravity and other bulk forces, the fertilizer volume fraction can be described as [20,21]
where is the drift velocity of the fertilizer.
The general water flow rate is greater than the flow rate of the fertilizer. The boundary condition at the inlet is set to velocity-inlet in Ansys Fluent. The boundary condition for the outlet is set as pressure-outlet. The fluid properties and simulation parameters in the model are shown in Table 1.
The semi-implicit method for the system of pressure coupled equations (SIMPLE algorithm) is a widely used numerical method for solving flow fields in computational fluid dynamics, proposed by Suhas V. Patanka and Brian Spalding. The solution is solved using the SIMPLE algorithm to couple the velocity and pressure fields, and a second-order windward discrete format is used to obtain higher accuracy. The initialization method is a hybrid initialization. The time step was chosen as a rough estimate based on the Equation.
where is the Courant number, is the grid size, is the local velocity. Bringing the grid size and maximum velocity of this model into the Equation, the calculation is 0.0019 for a courant number of 1, so the step size is set to 0.002 s. The number of solution steps is 500, 1000, 1500 and 2000 four times after the test, to compare the end cross-section fertilizer volume fraction, and finally determine the number of solution steps as 2000, which can ensure both the accuracy and the efficiency of the calculation. The post-processing is performed in CFD-post.
Combined with the agronomic requirements of cotton planting, the percentage of fertilizer volume after mixing does not generally exceed 1 percent, so the fertilizer flow rate is generally 0.2–0.5 m s−1, and the water flow rate is generally between 1–2 m s−1 during the fertilization process of cotton planting. To study the effect of water and fertilizer flow rates on the mixing process, a two-factor, three-level test was conducted with a total of nine combinations of different water and fertilizer flow rates. The working conditions of the experiment were designed as shown in Table 2. The transient kinetic simulations of the water–fertilizer mixing process were conducted.
2.2. Field Experiment
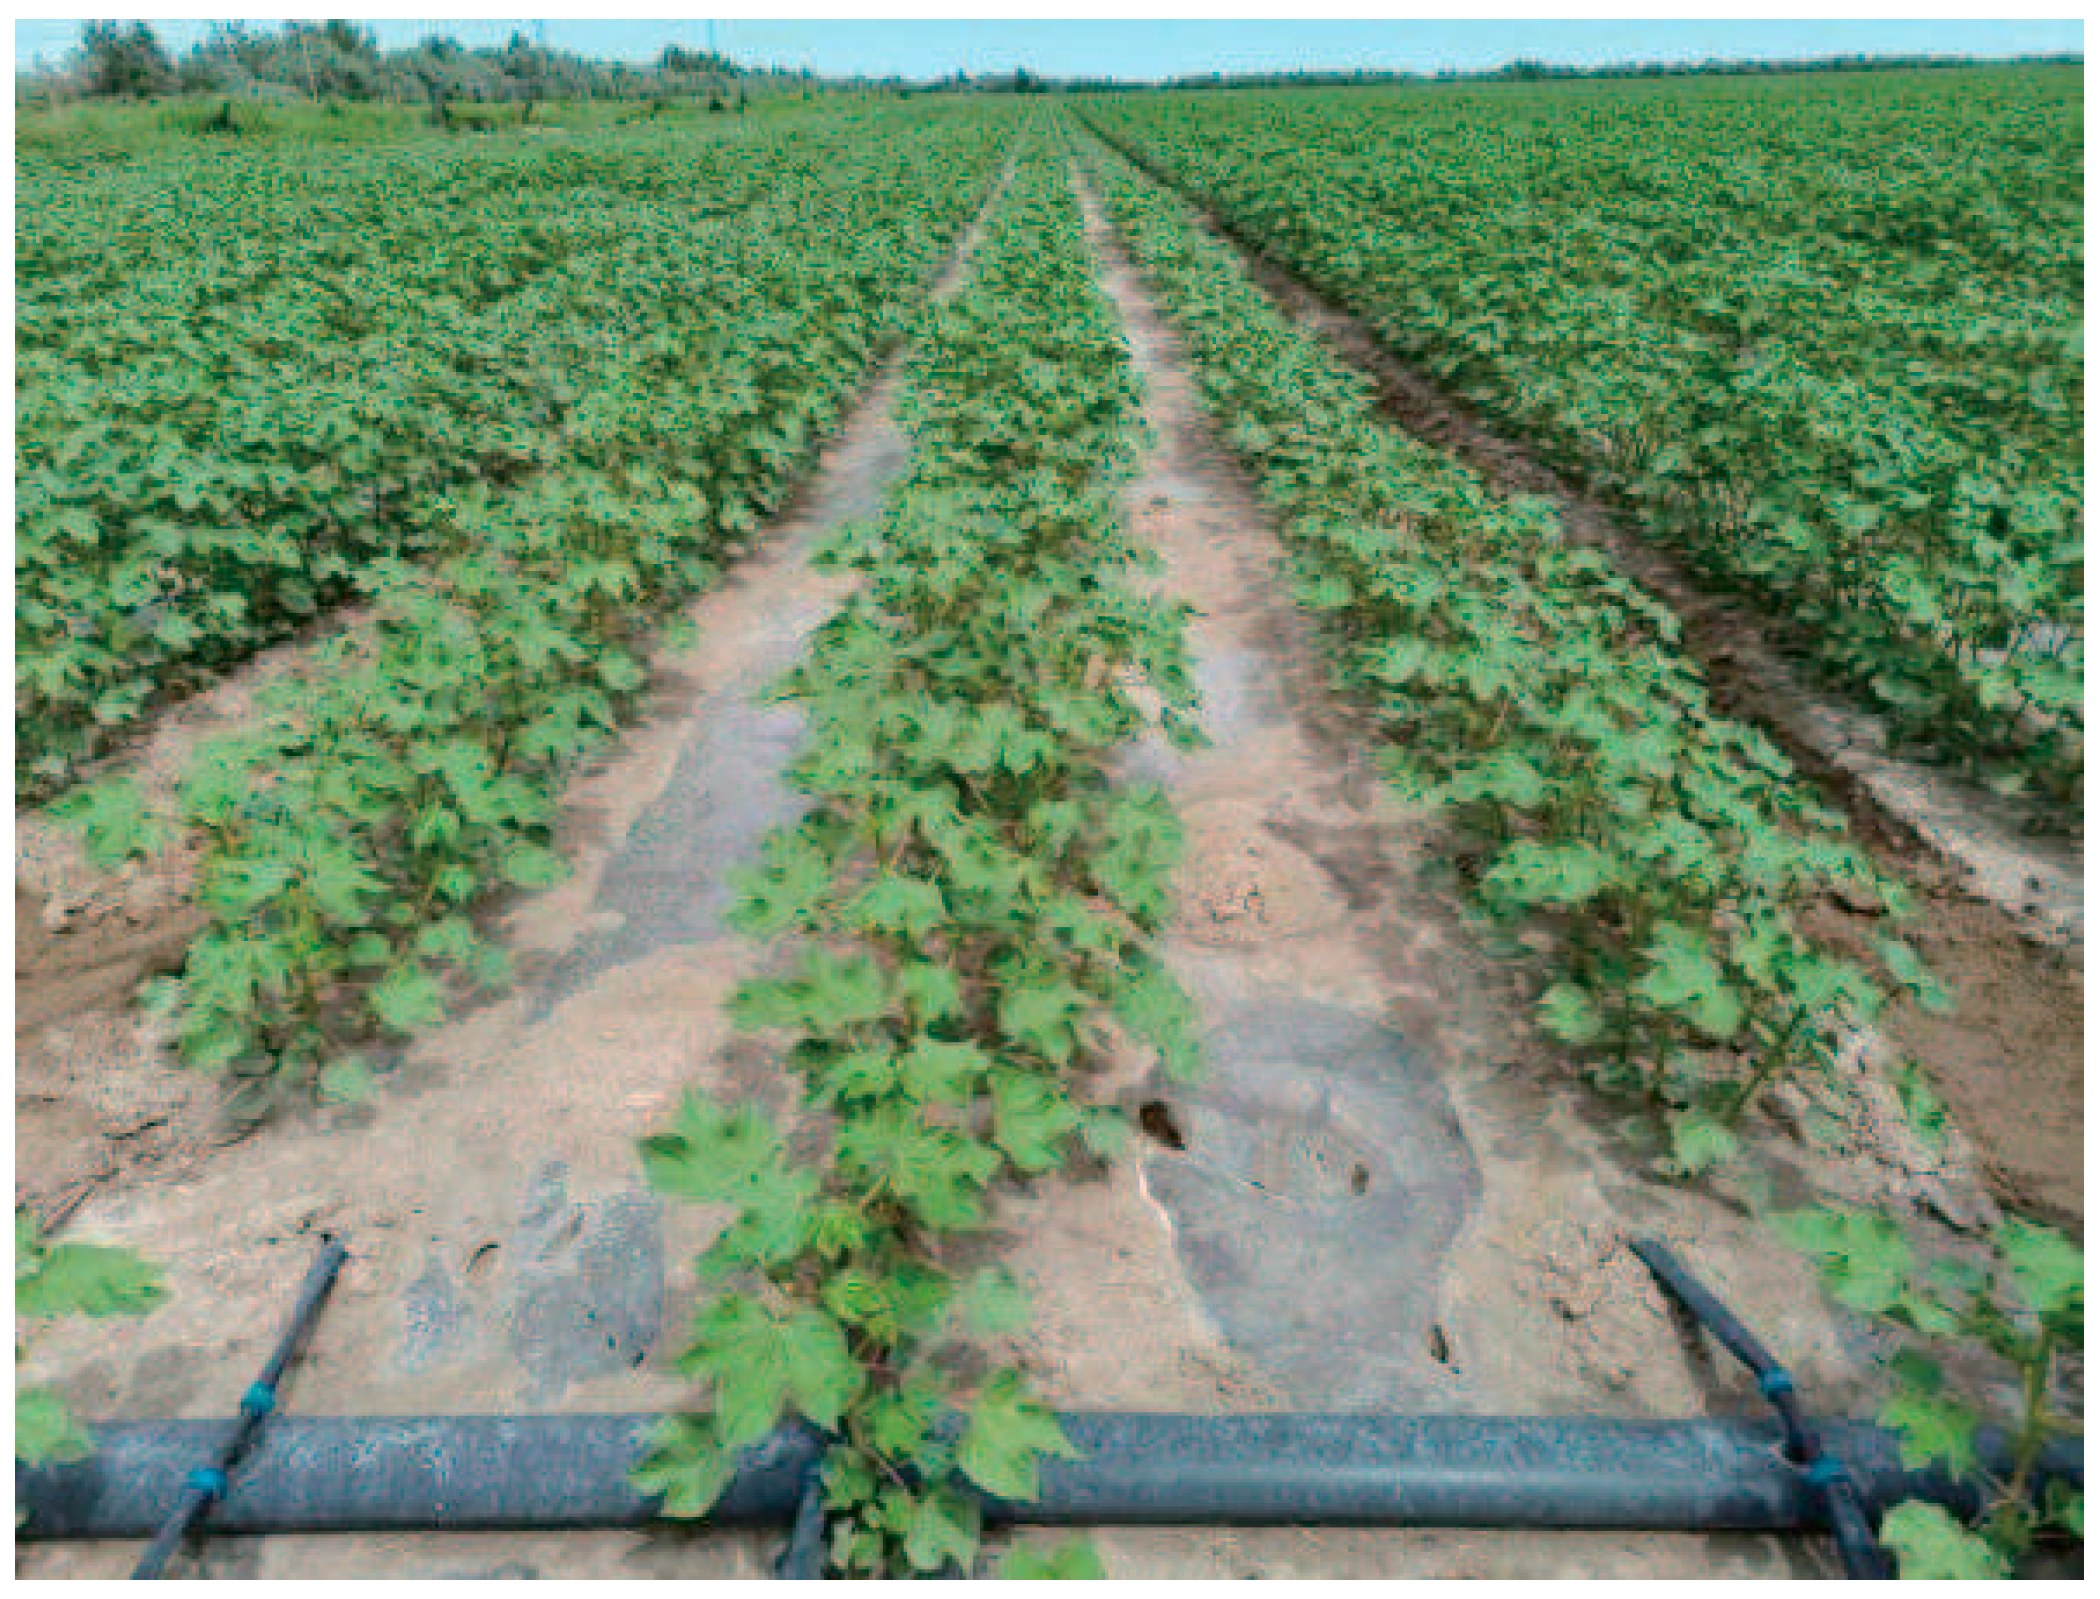
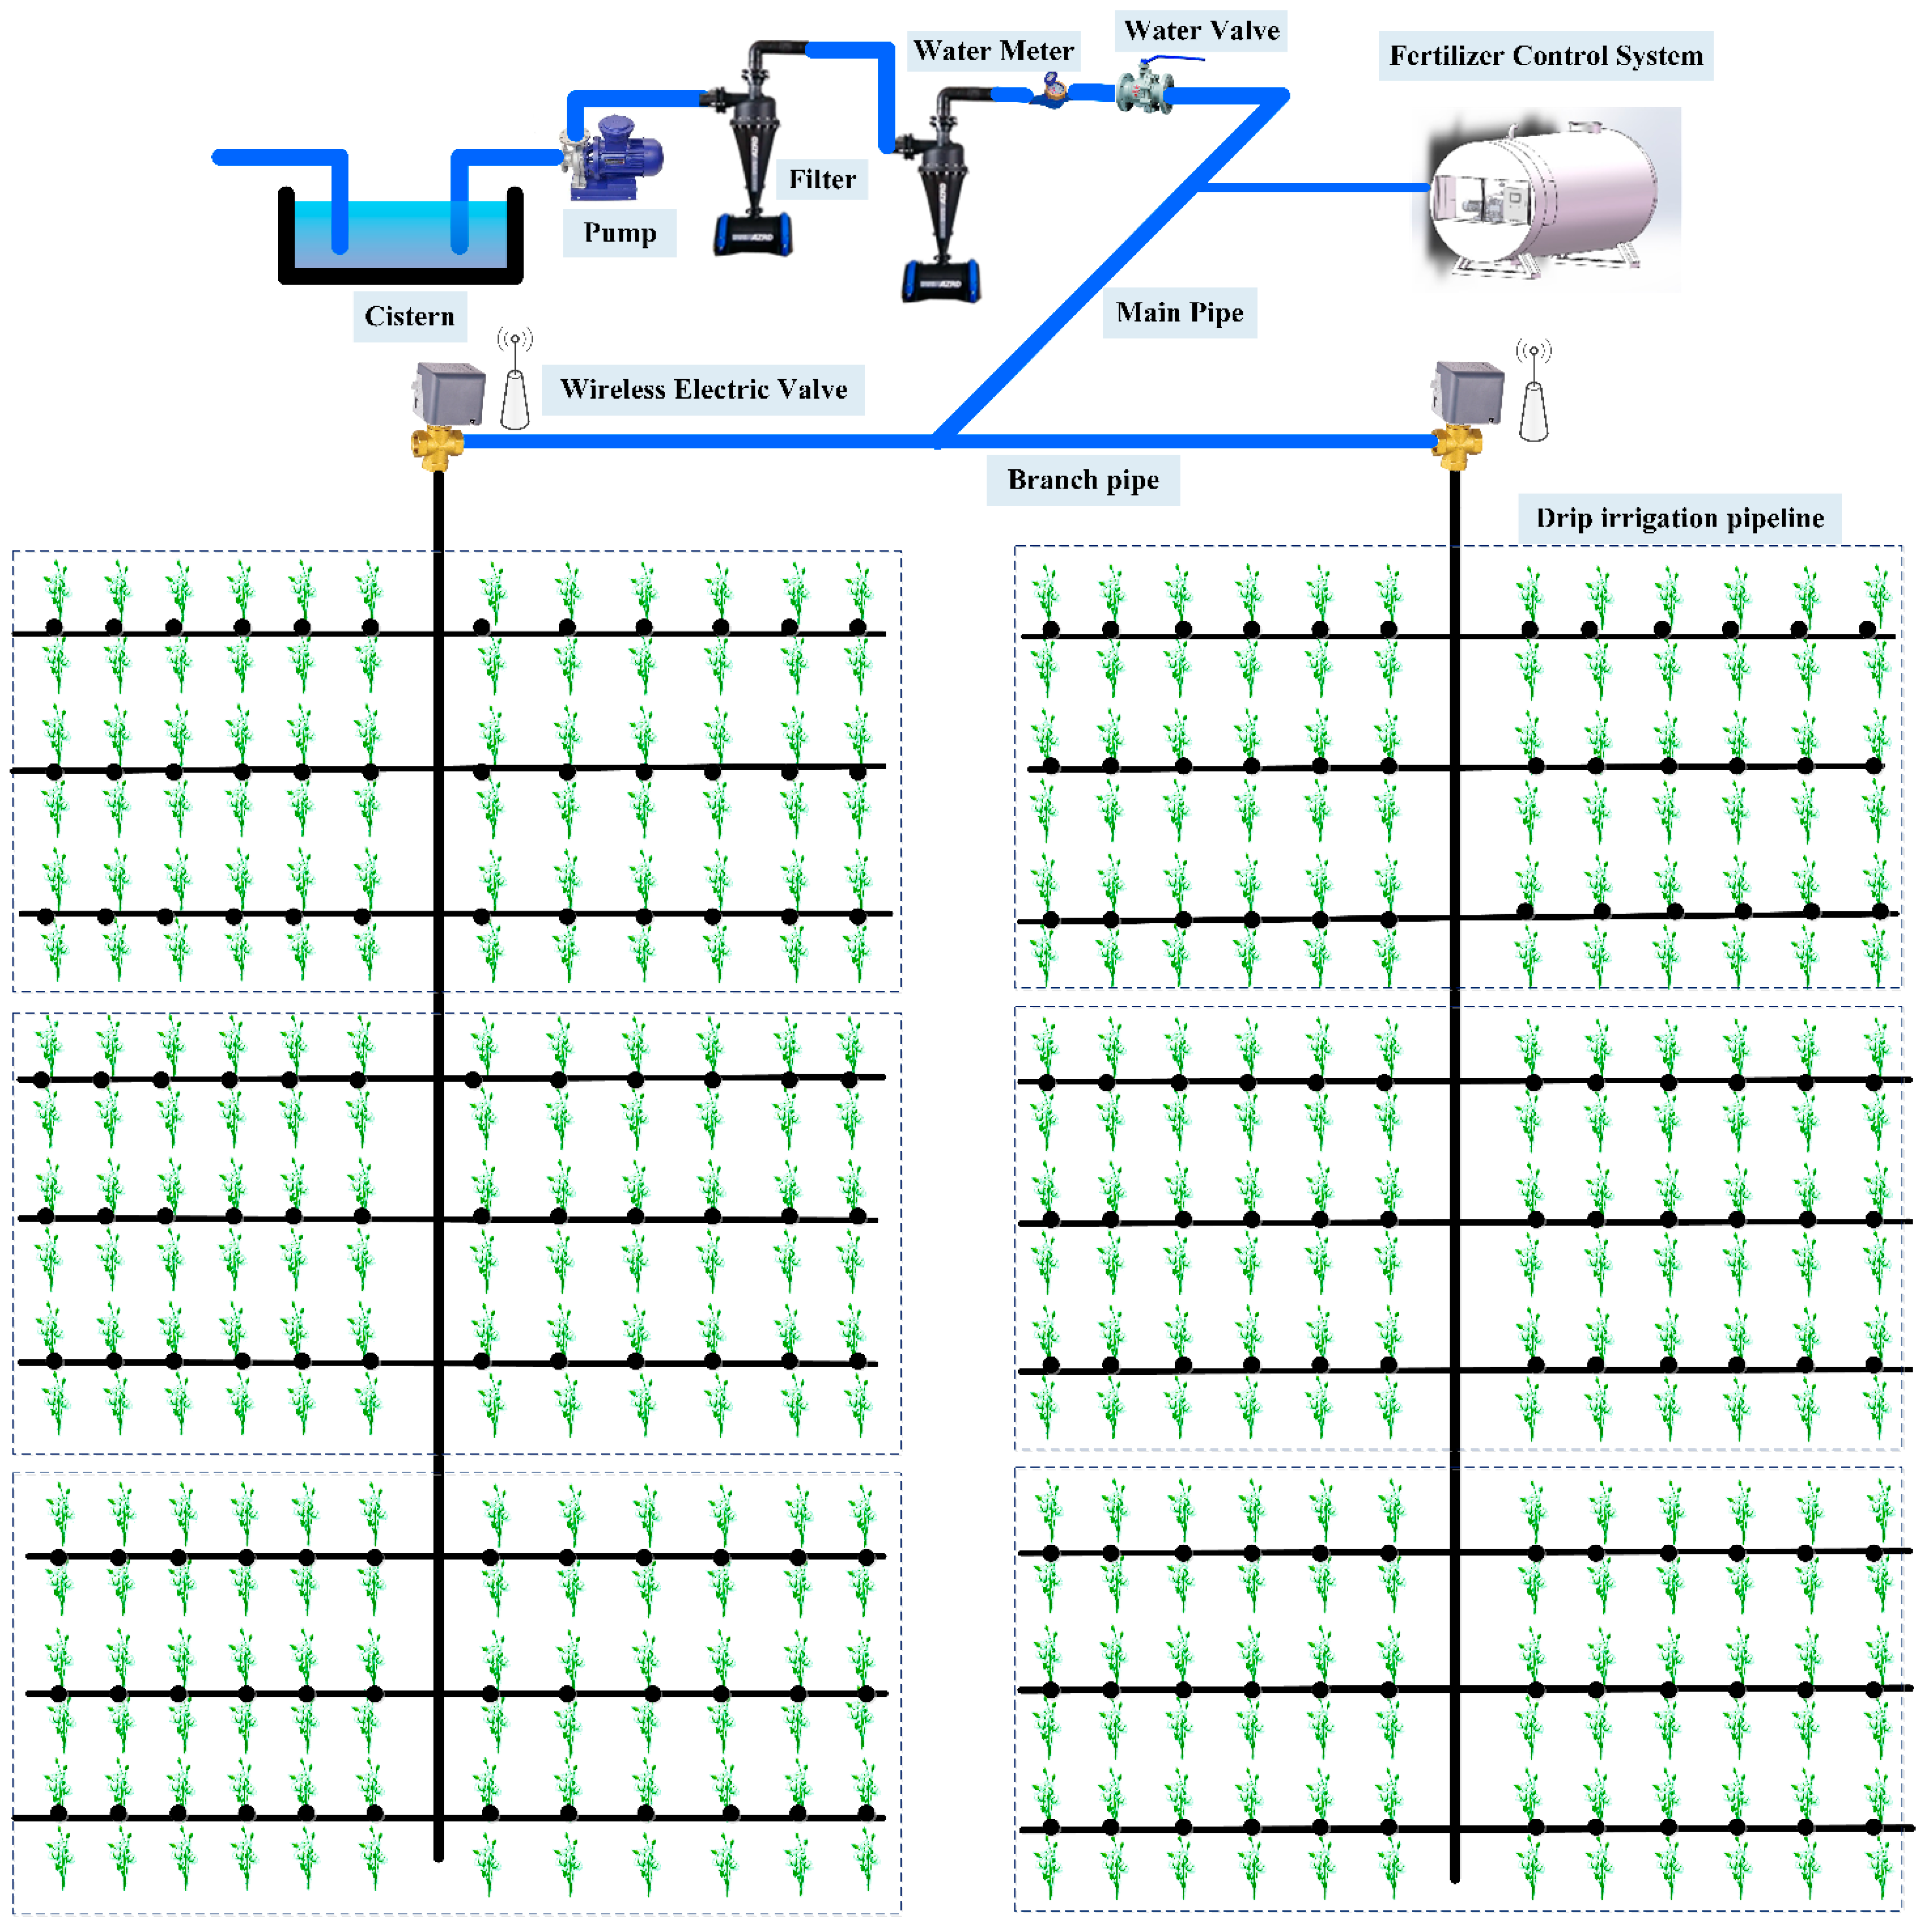
Field experiments were conducted in June 2021, in Xinjiang Mission 136 (86.090° E, 43.380° N), which has an average altitude of 337 m and a typical temperate continental climate with little rainfall, average annual rainfall of 194 mm, evaporation of 1642 mm and an average annual temperature of 7.6 °C. The experimental field (shown in Figure 3) was 10 hectares, the soil was sandy loam and the cotton-planting pattern was machine-picked cotton (one film, three tubes and six rows). The experiments were conducted by different water and fertilizer speed combinations. The test working conditions were consistent with the simulation test design (shown in Table 2), and each combination was repeated three times.
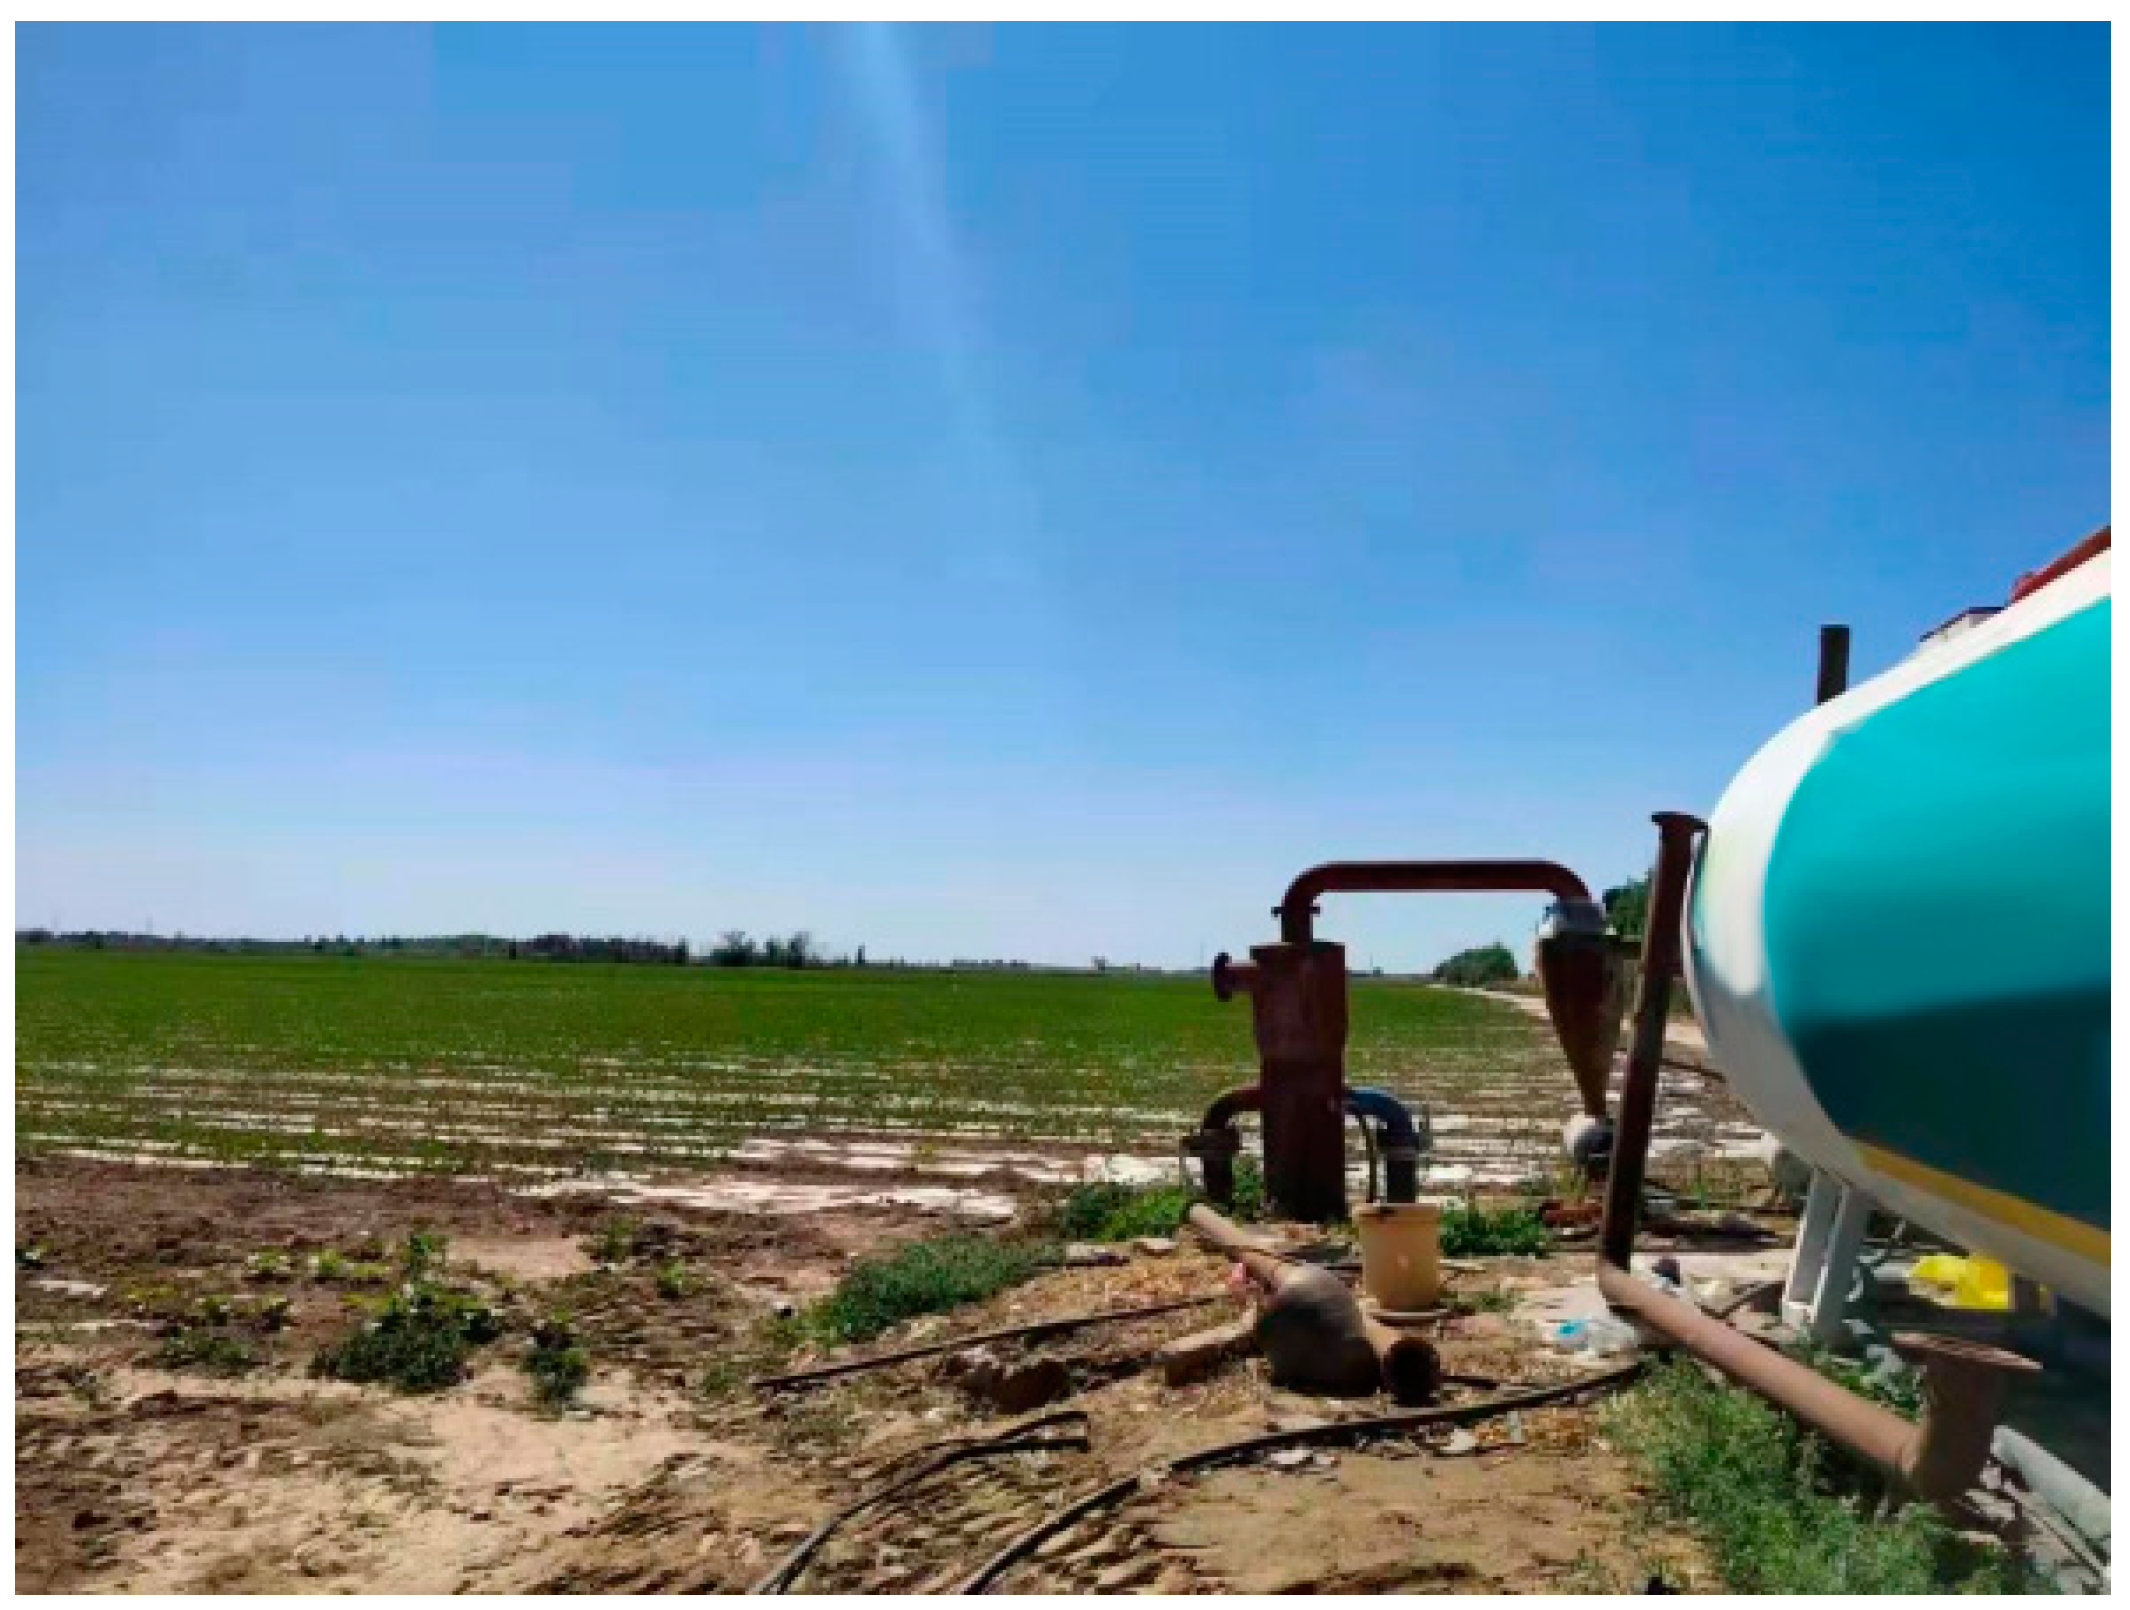
The experiments were conducted using a pump-pressurized subsurface drip irrigation system and a hose pump for fertilizer injection (shown in Figure 4). The same amount of irrigation and fertilizer was applied in each trial. The fertilizer was stirred thoroughly to dissolve and mix before the start of the trial. The experimental field was divided into six blocks (shown in Figure 5). According to the American Society of Agricultural Engineers (ASAE) field evaluation of the micro-irrigation systems EP 458 [22,23], the confidence level was 90% ± (2.4~3.5%), and twenty-four sampling points were taken from each plot. For good representativeness and consistency, the sampling points were set on the drip irrigation belt according to the principle of uniform distribution. A 2 L cup of water was placed under the irrigator at the corresponding sampling point to collect the water and fertilizer solution.
After the test, the volume of water and fertilizer solution in each water cup was measured with a measuring cylinder, and the conductivity of the solution was also measured with a conductivity meter. The concentration of the solution was then calculated according to the relationship between the concentration of the fertilizer solution and conductivity. The product of the solution concentration and volume is the fertilizer weight. The following indicators were used to evaluate the uniformity of the irrigation and fertilization in the under-mulch drip irrigation system.
- (1)
- The Christensen uniformity coefficient (%)where -the number (water cup flow, fertilizer concentration and fertilizer application) is the observation; -the mean value; and -the number of observation points.
- (2)
- Distribution uniformity factor DUwhere is the mean of the smaller 25 percent of the N observations.
- (3)
- Statistical uniformity (%) iswithwhere -Standard deviation of the observed values.
3. Results and Discussion
3.1. Analysis of the Mixing Process of Water and Fertilizer in the Pipe
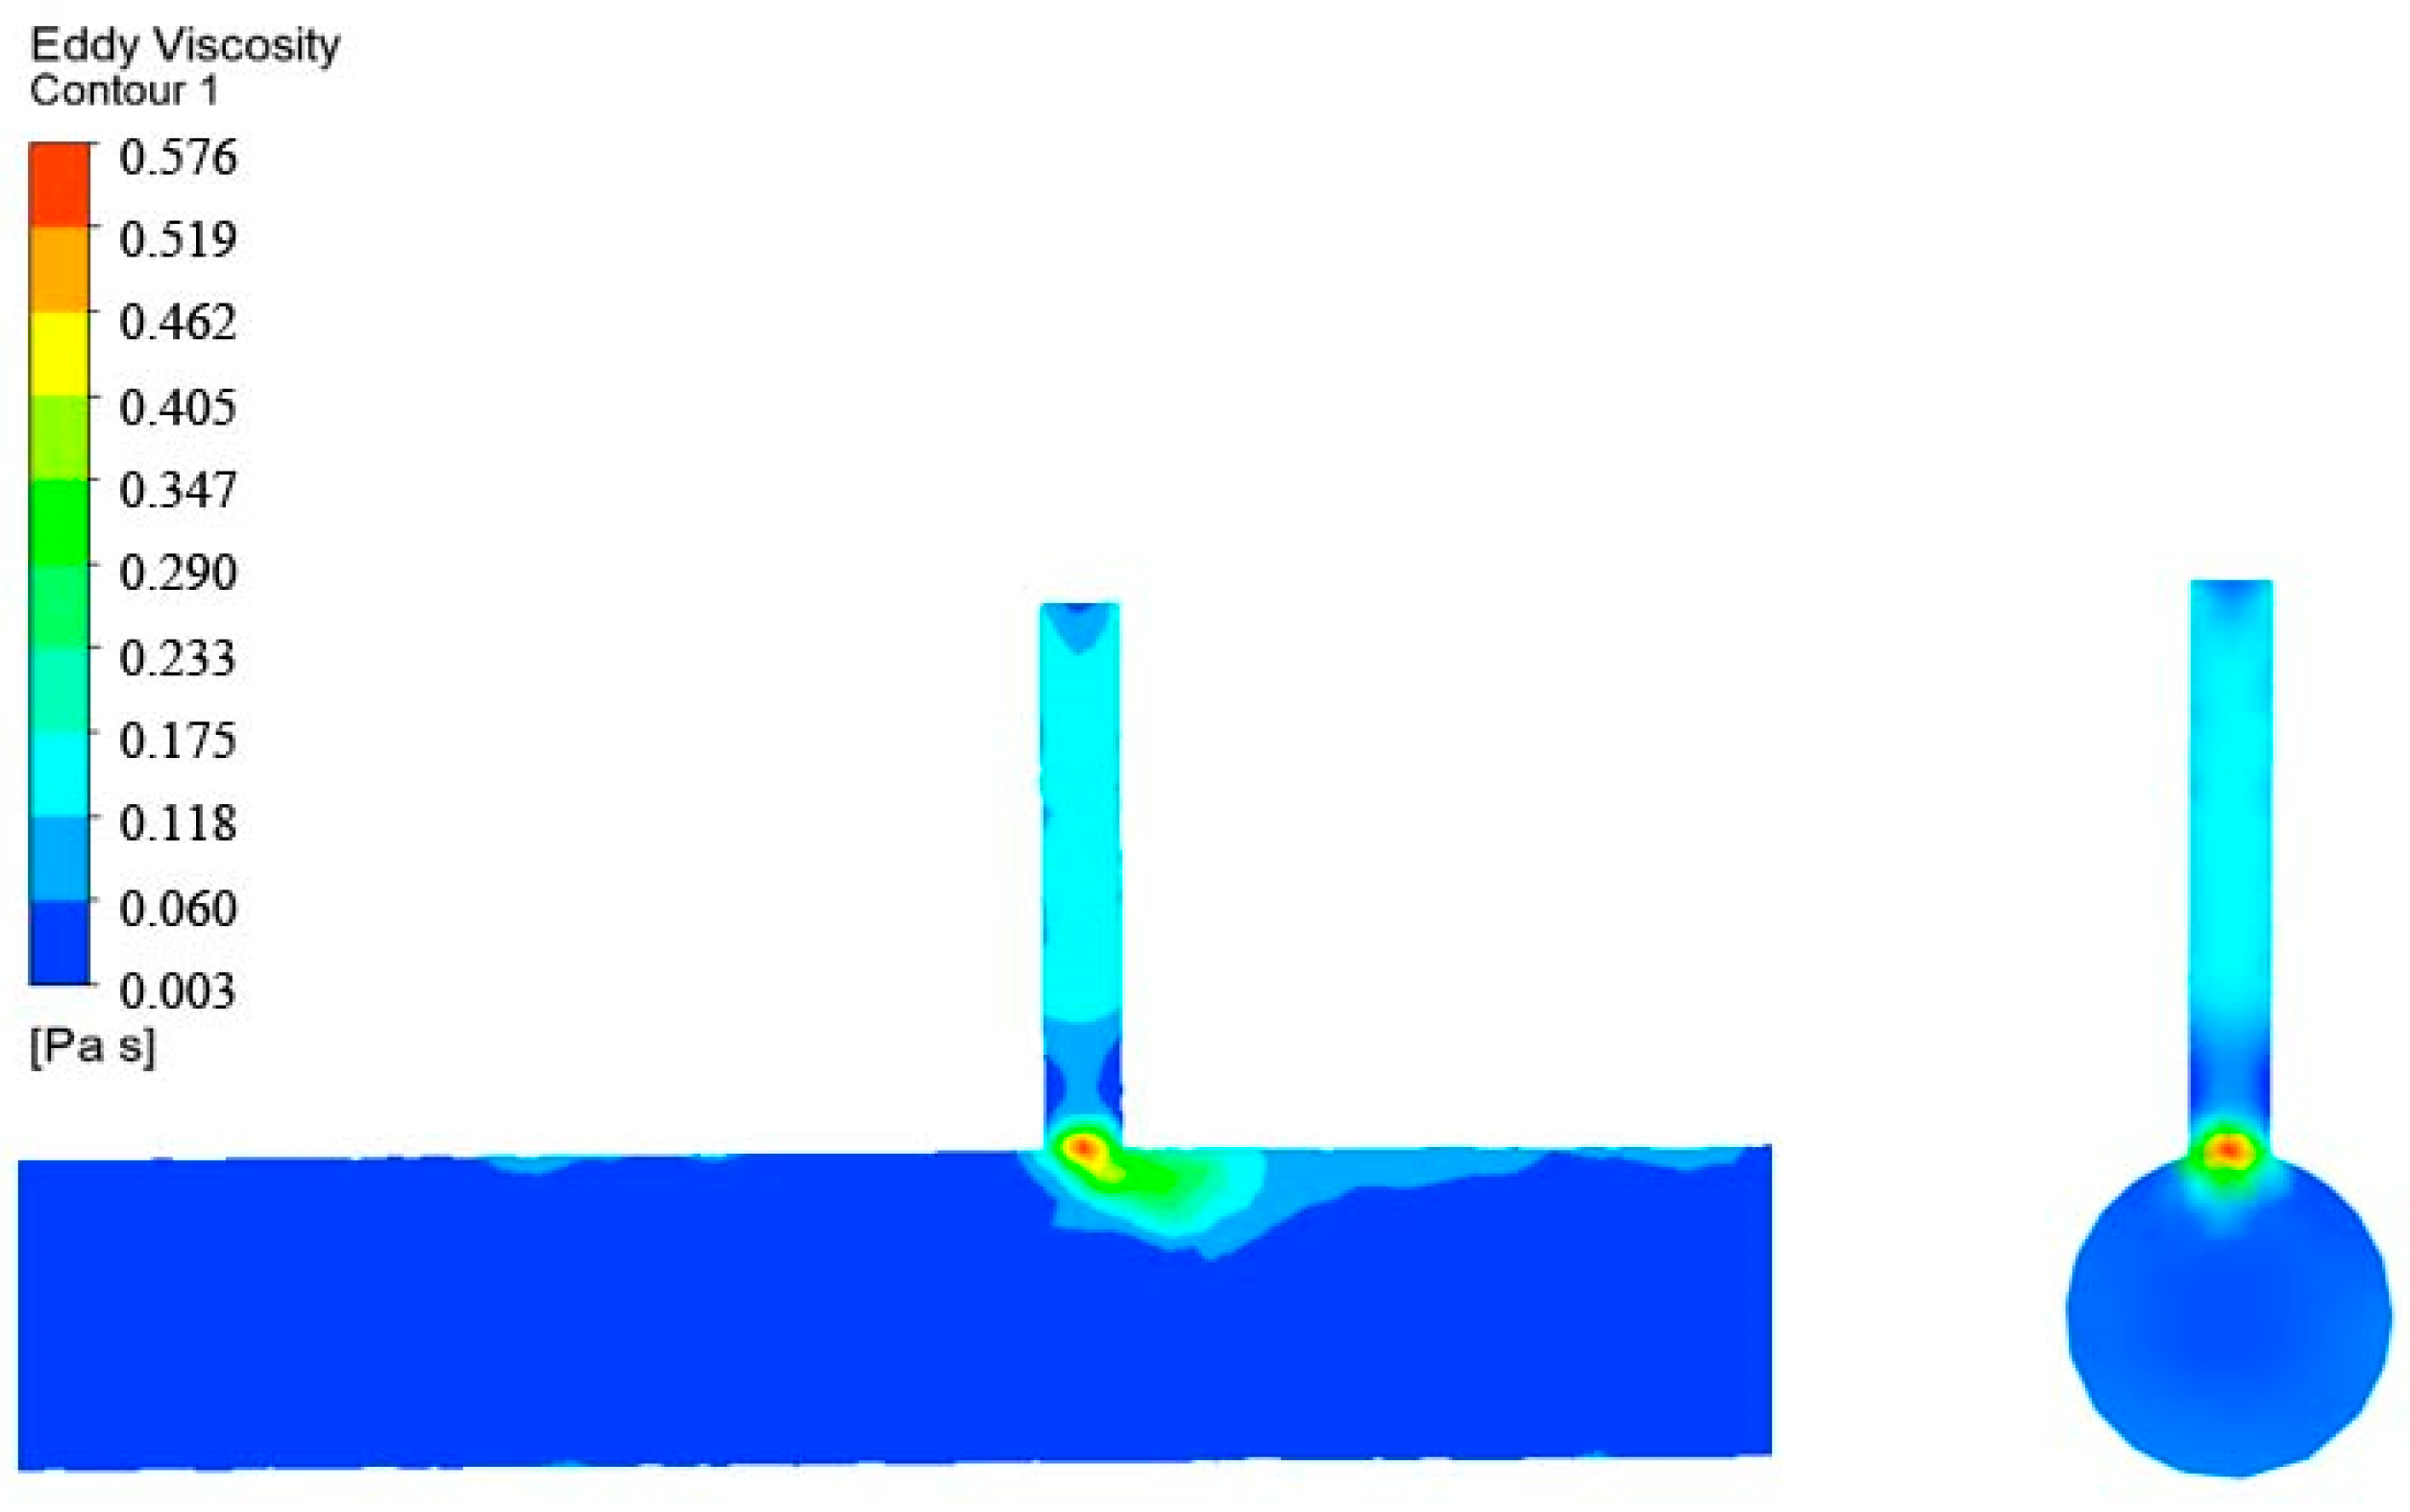
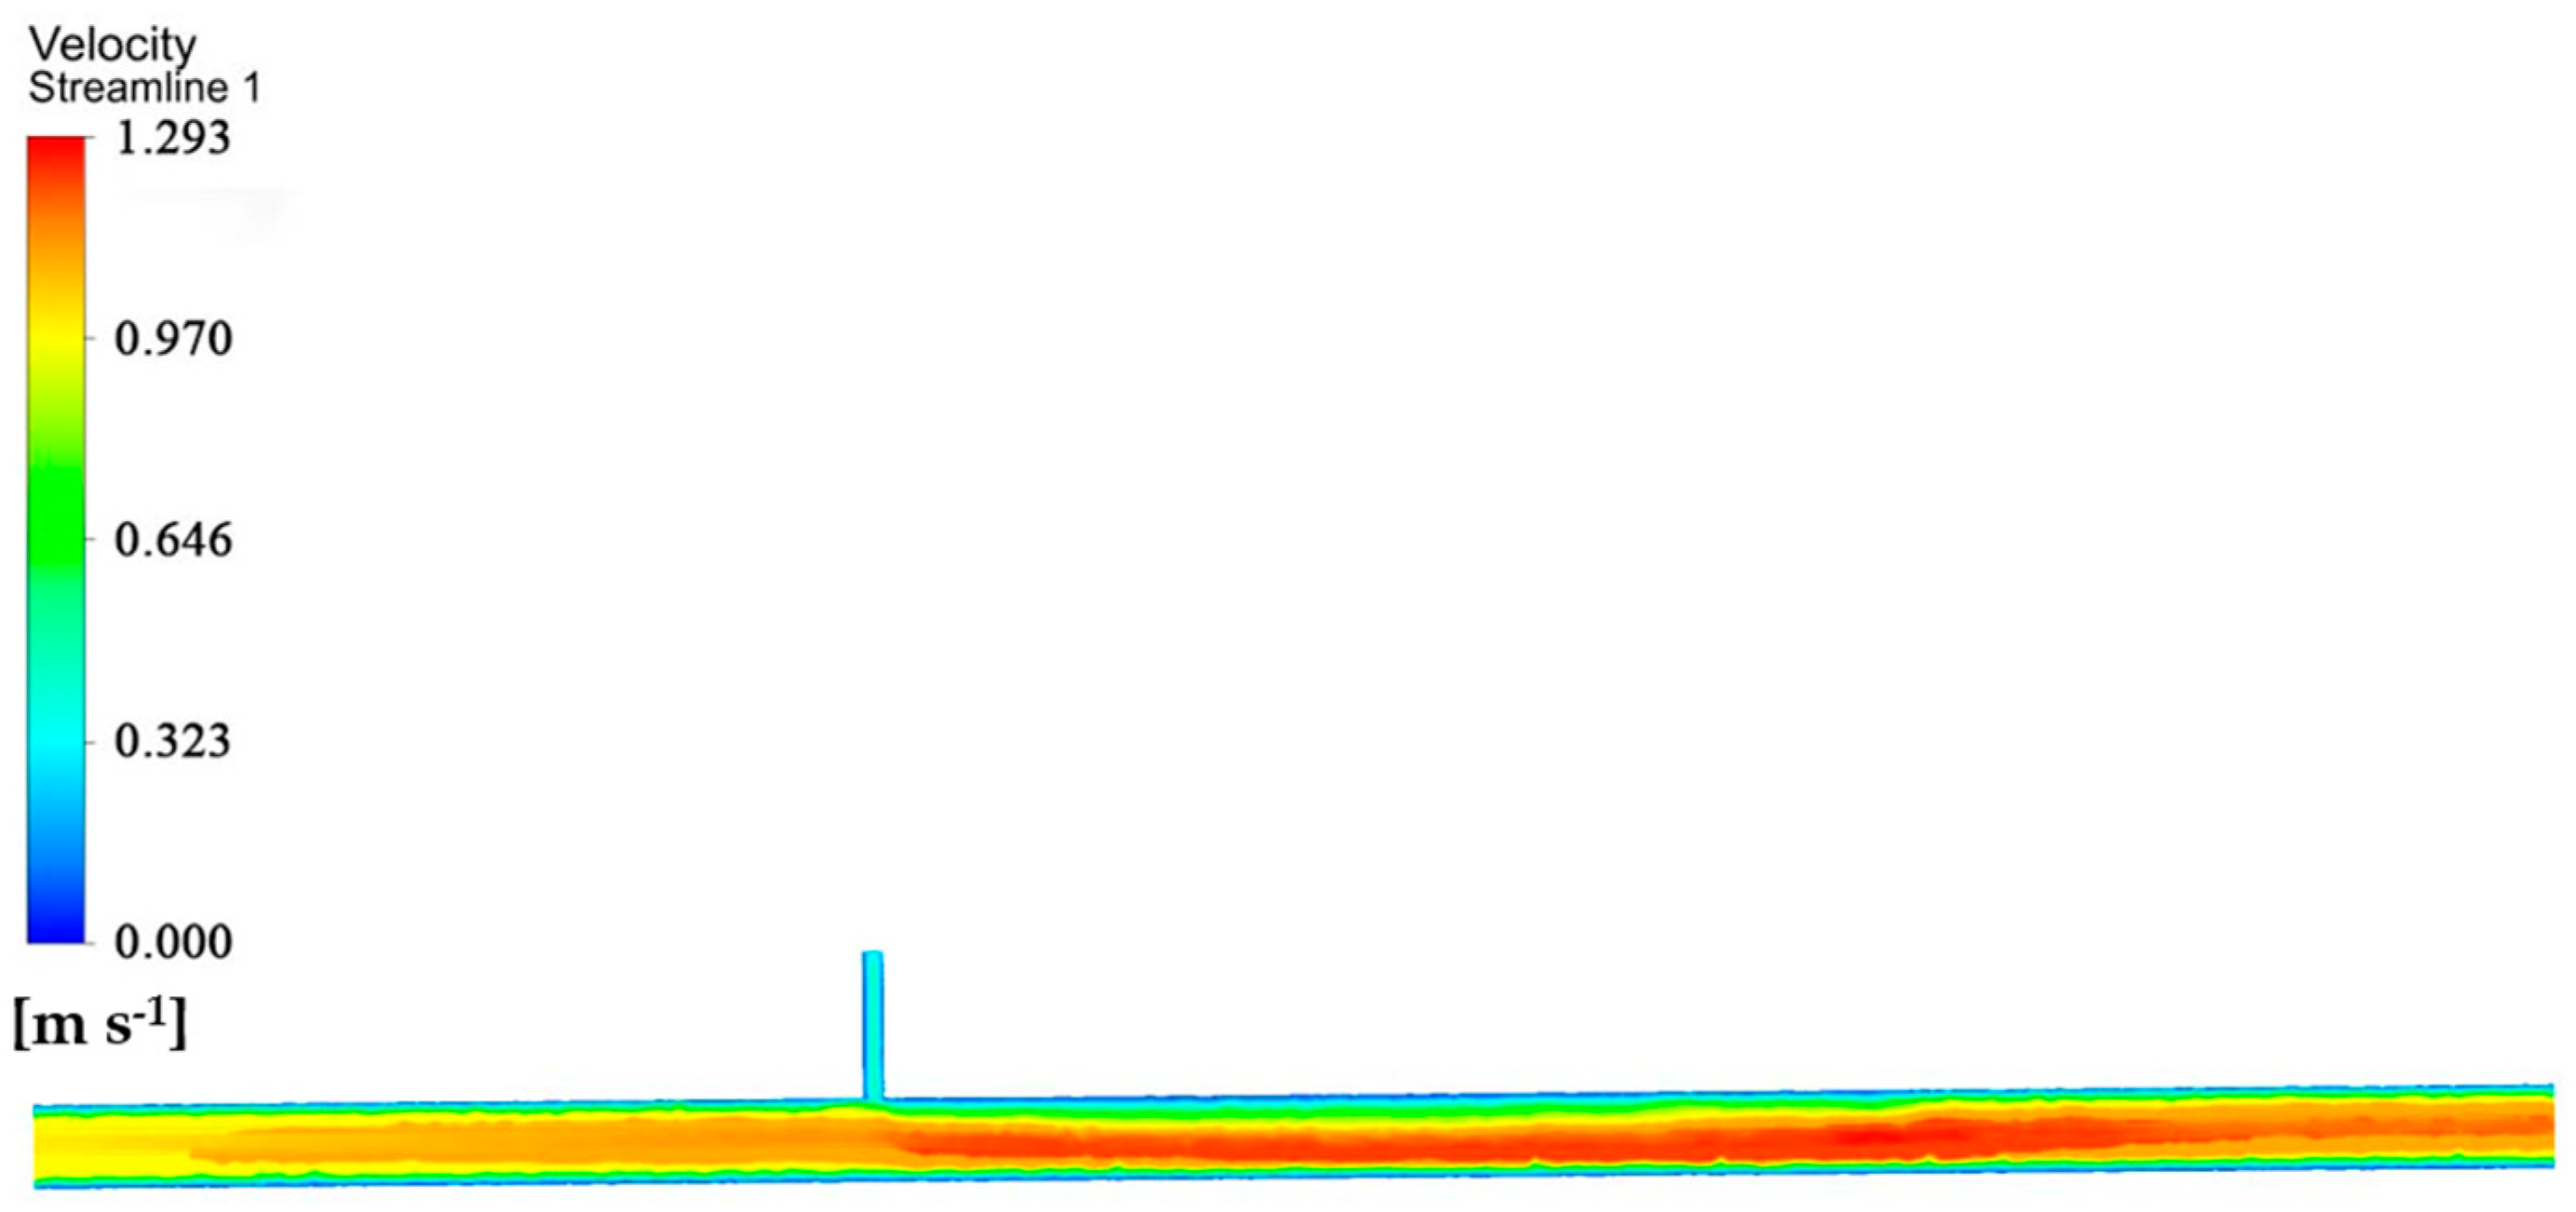
Simulation No. 1 is used as an example to illustrate the process of mixing water and fertilizer in the pipe. At 0.6 s, the fertilizer enters the main pipe and forms a vortex. As shown in Figure 6, the vortex is most intense in the center of the water–fertilizer junction, and diffuses in all directions. As shown in Figure 7, the prevailing velocity direction is streamlined, whereas the flow field near the water and fertilizer inlet in the mixing pipe shows a turbulent flow pattern. Spanwise velocity components appear near the pipe wall, which may be related to pipe wall friction. In the simulated velocity field, friction should be considered, as friction brings friction loss and affect the mix flow rate. F. Calomino [24,25] has conducted an in-depth study on the estimation of the friction factor during fluid flow in pipes. In a turbulent flow, the friction factor depends mainly on the fluid flow characteristics and physical properties (i.e., size, shape, etc.) of wall roughness. As shown in Figure 8, as time and distance from the fertilizer inlet increases, at 3.5 s the flow field in the pipe stabilizes, and the fluid flow gradually changes from turbulent flow to laminar flow. The particles in the mixed solution move in a disorderly manner. As shown in Figure 9, fertilizer diffusion in the radial direction in a trapezoidal distribution, which keeps consistent with a finding proposed by Widiatmojo et al. [26]. With the increase in mixing time and distance, the fraction of fertilizer did not change after 4 s, the mixing of water and fertilizer gradually spread to homogenization. The process of change was similar to the fertilizer–water mixing state in the pipes at different time by Zhiyang Zhang [10]. Other groups of simulation results show that the water and fertilizer flow rate cause different mixing times and intervals, but the change process is similar.
The mixing length is important for water and fertilizer uniformity. Zhiyang Zhang [10] derived the equation in consideration of the seven physical quantities, including the uniform mixing length (, water pipe diameter (), water flow rate (), viscosity of fertilizer solution (), fertilizer pipe diameter (), fertilizer flow rate () and fertilizer concentration (). can be estimated through Equation (13):
Bin Sun [13] adopted the dimensional analysis [27,28,29] to 155 and derived the equation in consideration of the eight physical quantities, including effective mixing length (), pipe diameter (), mixing ratio (), the flow velocity of inlet 1 (), water density (), dynamic viscosity (), gravitational acceleration () and density difference of water and saline , (). Please see Equations (14) and (15).
where and are coefficients and denotes the Reynolds number and is the Archimedes number.
Additionally, Bin Sun obtained the simplified Equation after fitting the data of each set to the working condition data.
According to Equation (13), there was a strong correlation between the uniform mixing length and six variables. According to Equation (16), the mixing length () is influenced by the pipe diameter (), Reynolds number () and Archimedes number (). Equations (13) and (16) have different variables for mixing lengths, but the results have some similarities. Equations (13) and (16) both show that the uniform mixing length was directly proportional to the pipe diameter and water flow rate. However, whether the effect of fertilizer flow rate on the mixing length is as shown in Equation (13) is still to be proven by further studies.
In the actual cotton-planting process, the pipe diameter is generally determined when the drip irrigation system is designed, and the viscosity of the fertilizer is formulated by the liquid fertilizer manufacturer according to the soil and plant growth needs. Combining Equations (13) and (16) and numerical simulation results, it is found that the actual field main mixing length of 4 m met the mixing requirements.
3.2. Effect of Water and Fertilizer Flow Rates on the Mixing Process of Water and Fertilizer
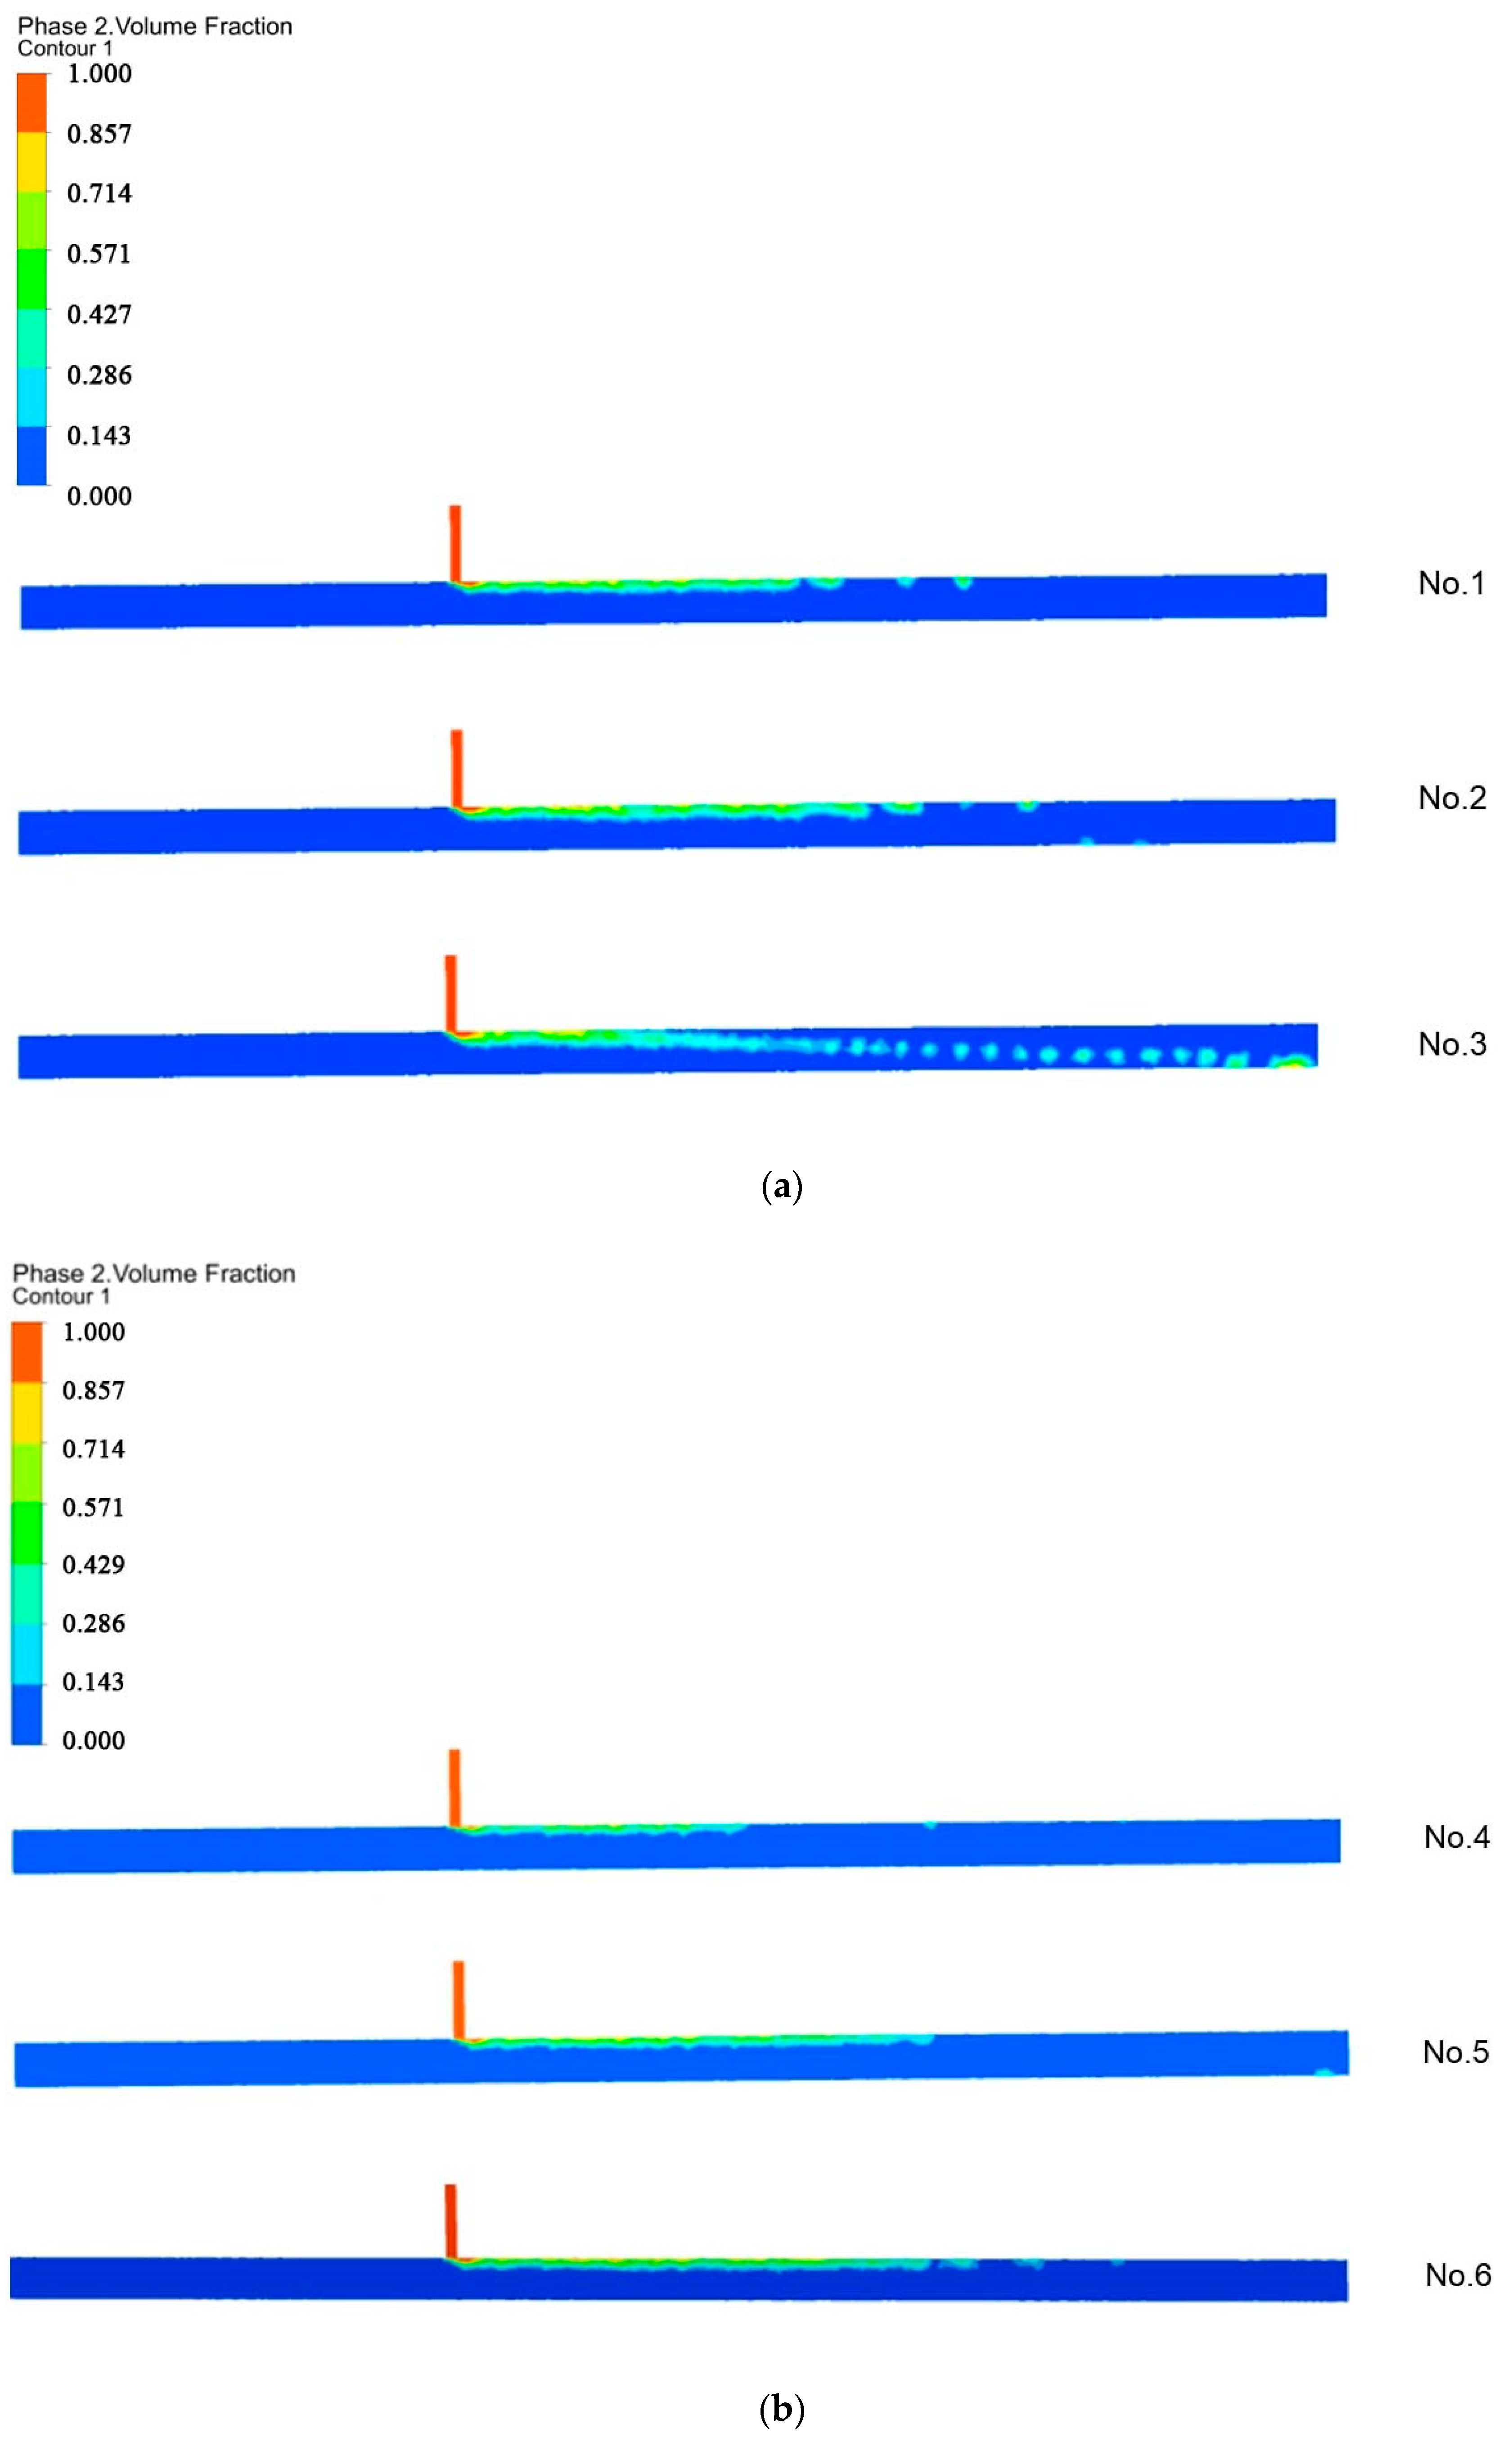
As shown in Figure 10, in the nine groups of water and fertilizer flow rate combinations, No. 3 (water 1 m s−1 and fertilizer 0.45 m s−1) is different from other water and fertilizer mixing experiments; for example, the fertilizer in the pipe occurred in the obvious bubble-like separation and settlement. Comparing the flow-field velocities after uniform mixing (shown in Table 3), except for number three (water 1 and fertilizer 0.45 ), the maximum flow velocity after mixing the water and fertilizer in all eight groups was greater than the sum of the initial water and fertilizer flow velocities. The greater maximum flow velocity is because of the fluid stratification with large central velocity and small surrounding velocity. A settling of the fertilizer occurred in number three because the viscosity and density of the fertilizer are greater than water, when the water flow rate and fertilizer flow rate ratio are less than a certain value and the water and fertilizer have not had time to mix evenly while the fertilizer has been settling. To avoid the fertilizer settling—in the irrigation main diameter of 100 mm, and the fertilizer inlet pipe diameter of 20 mm—it is recommended that the water and fertilizer flow rate ratio should be greater than three.
In the water speed of 1 and 1.5 , with the same mixing time and with the increase in fertilizer flow rate, the fertilizer longitudinal diffusion distance increases, and the water and fertilizer mixing concentration along the tube diameter direction is more uniform than before. There is still a certain degree of fluctuation, however, as the increased mobility of the mixture affects the dispersion. In addition, at the water speed of 2 , the fertilizer longitudinal diffusion distance did not increase with the increase in fertilizer speed, indicating that the water flow rate increased to 2 because the pure water flow rate is much greater than the flow rate of the fertilizer, the inflow of pure water flow and flow rate is larger, the fertilizer phase to the pure water phase diffusion mixing effect is weakened and the fertilizer flow rate and the degree of influence of water and fertilizer mixing is reduced. At the same time, when the fertilizer flow rate is lower than 0.25 , because of the obstruction of fluid flow by the pipe wall, the water and fertilizer mixing effects are not high, and the water and fertilizer mixing effect is difficult to ensure.
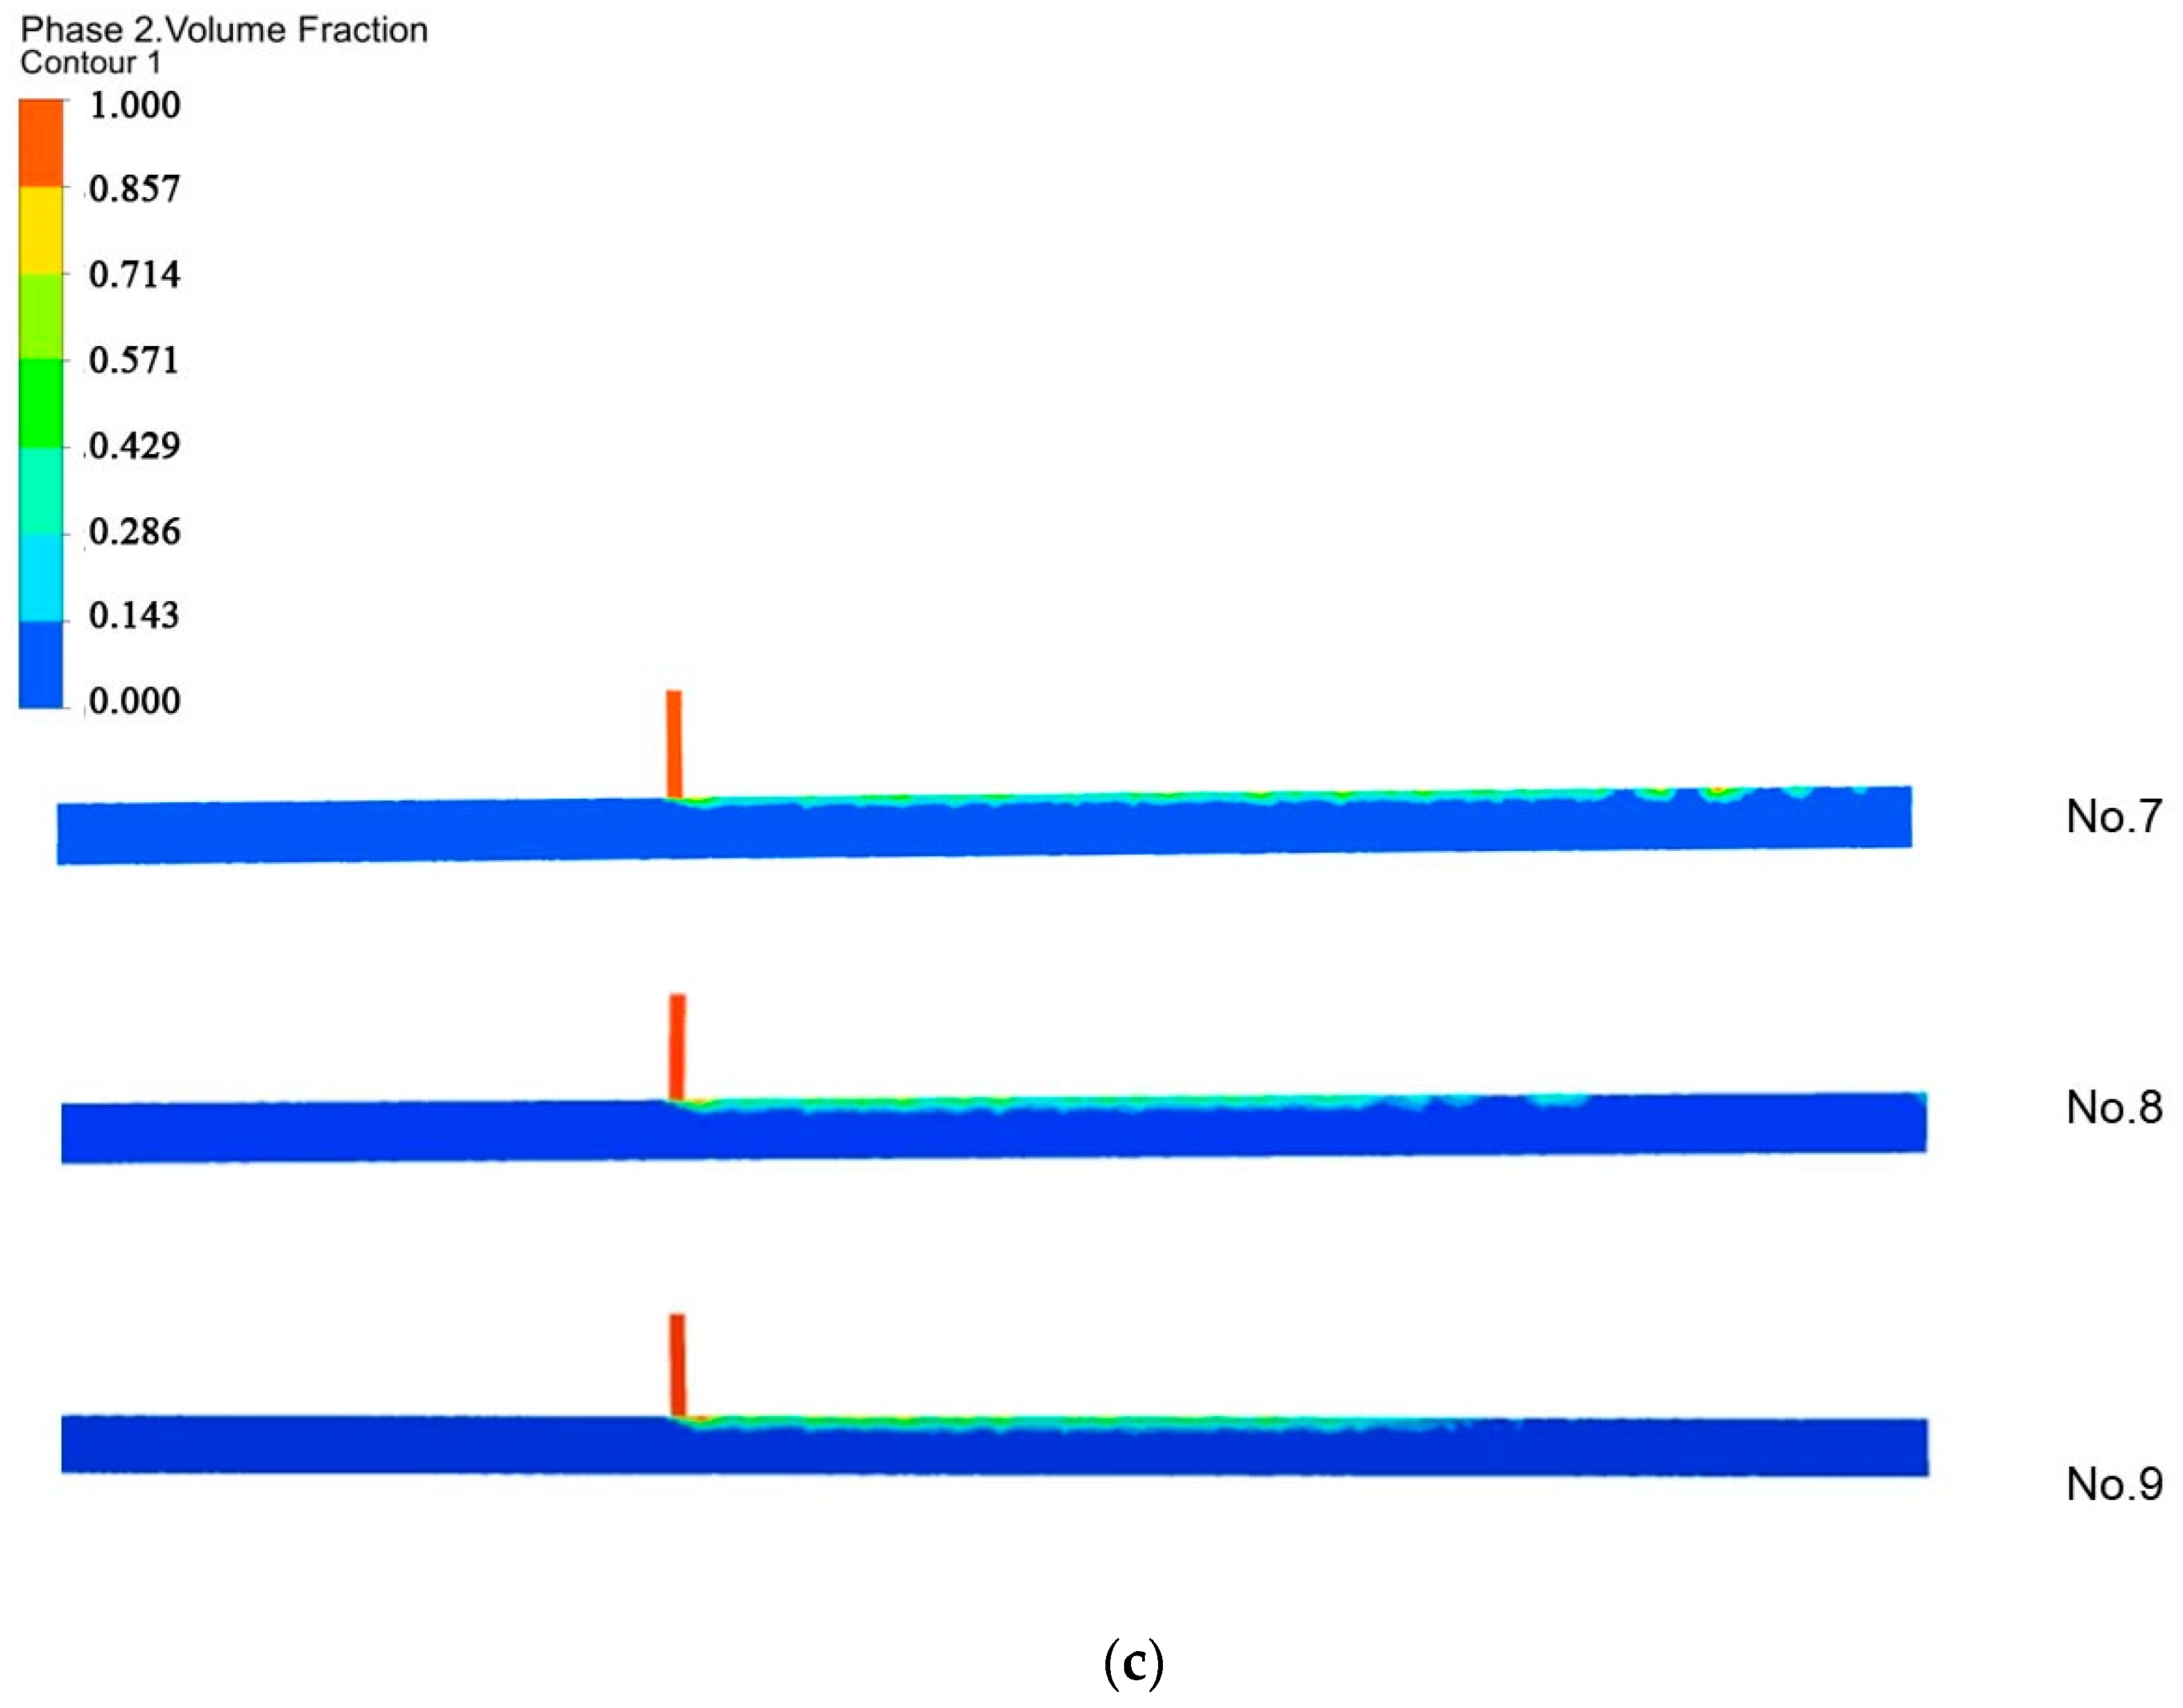
When the fertilizer flow rate is certain, with the increase in the water flow rate, the downward diffusion distance of the fertilizer decreases and the longitudinal diffusion distance increases, as the increase in the water flow rate affects the downward diffusion of the fertilizer. However, it can be seen from experiment number seven in Figure 10 that if the water flow rate is much larger than the fertilizer flow rate, it will affect the fertilizer injection. Therefore, after the data analysis, when the irrigation main diameter is 100 mm and the fertilizer inlet pipe diameter is 20 mm, it is suggested that the water–fertilizer flow rate ratio should be less than eight in order to guarantee the fertilizer injection.
In summary, in the irrigation system with a main pipe diameter of 100 mm and a fertilizer injection pipe diameter of 20 mm, to ensure the mixing effect of water and fertilizer in the fertilizer application process, the water and fertilizer flow rate ratio is greater than three, but less than eight. From the simulation results, when the fertilizer flow rate is 0.35 and the water flow rate is 2 , the mixing effect is relatively good.
3.3. Effect of Water and Fertilizer Rate on Fertilizer Uniformity
The fertilizer solution was collected in the field and then calculated and collated. The results of the field experiment are shown in Table 4. In the nine groups of experiments, the best fertilizer uniformity was achieved when the fertilizer flow rate was 0.35 and the water flow rate was 2 , which was consistent with the simulation results and proved the reliability of the simulation model. It proves that the water and fertilizer flow rate had some effect on fertilizer uniformity. Additionally, it proves that the mixing effect of water and fertilizer in the main pipeline will affect the uniform distribution of fertilizer in the irrigation pipeline. In the sandy loam soil and machine-picked cotton planting pattern (one film, three tubes and six rows), using 2 and 0.35 as the water and fertilizer flow rate during fertilizer application in the cotton field planting process in northern Xinjiang is recommended.
The uniformity of the fertilizer application was also related to the type of fertilizer application device and drip irrigation piping design [30,31]. Junliang Fan [32] evaluated the effects of various differential pressures and piping arrangements on the irrigation and fertilization uniformity through field experiments, and found the irrigation and fertilization uniformity of the fertigation system with transversal water supply was better than that with a longitudinal water supply, in which the water supply from the middle was better than that of the water supply from one end. Wenjuan Wang [33] analyzed the concentration of the fertilizer solution along the direction of the micro-sprinkler belt, as well as perpendicularly by measuring the concentration of the fertilizer solution with two belt lengths under four working pressures of the bow, and found that the laying length of the micro-sprinkler belt had little influence on the uniformity of the concentration of the fertilizer. With the decrease in pressure along the belt, however, the amount of fertilizer would decrease with the decrease in irrigation water. Fertilization uniformity is a complex problem. To achieve the best fertilization uniformity in practice, the drip irrigation pipe laying method, pipe diameter, pipe pressure, fertilization equipment and water and fertilizer flow rate should all be taken into consideration.
4. Conclusions
In this paper, to study the effects of water and fertilizer flow rate on fertilization uniformity, numerical simulations of the mixing in the main pipe were performed, the field experiments on fertilizer uniformity were conducted and the following conclusions were obtained:
- (1)
- The results of the numerical simulation agree with the experimental measurements, which indicate that using a numerical simulation to explore water and fertilizer mixing is feasible. When the fertilizer enters the main pipe and forms a vortex, the vortex is most intense in the center of the water–fertilizer junction, and diffuses in all directions. As time and distance from the fertilizer inlet increases, the flow field in the pipe finally stabilizes, and the fluid flow gradually changes from a turbulent flow to laminar flow.
- (2)
- The mixing effect in the main pipeline is positively correlated with the fertilization uniformity of the irrigation system. In the irrigation system, with a main pipe diameter of 100 mm and fertilizer injection pipe diameter of 20 mm, the water fertilizer flow rate ratio should be between 3–8 to ensure the effect of the mixing process.
- (3)
- The flow rate of water and fertilizer had an effect on the uniformity of the fertilization. In the machine-picked cotton-planting pattern (one film, three tubes and six rows) and the irrigation system with a main pipe diameter of 100 mm and fertilizer injection pipe diameter of 20 mm, using a 0.35 and water flow rate of 2 during fertilizer application in the cotton field planting process in northern Xinjiang is recommended.
Author Contributions
Conceptualization, X.M.; number simulation, X.M. and W.W.; experiment and validation, Y.Y. and X.M.; data acquisition and analysis, X.M. and C.F.; writing—original draft preparation, X.M.; writing—review and editing, C.F.; supervision, L.Z.; project administration, L.Z.; and funding acquisition, L.Z. All authors have read and agreed to the published version of the manuscript.
Funding
This research was funded by the National Natural Science Foundation of China (NSFC)—grant number 52065055.
Institutional Review Board Statement
Not applicable.
Informed Consent Statement
Not applicable.
Data Availability Statement
All relevant data presented in the article are stored according to institutional requirements and, as such, are not available on-line. However, all data used in this Manuscript can be made available upon request to the authors.
Acknowledgments
Thanks to the financial support of the National Natural Science Foundation of China.
Conflicts of Interest
The authors declare no conflict of interest.
References
- Lv, X. Management Techniques for Efficient Use of Water and Fertilizer in Cotton under Drip Irrigation; China Agricultural Press: Beijing, China, 2010; pp. 1–70. [Google Scholar]
- Zhengm, H.; Chuan, L.; Zhao, J.; Sun, S.; Zhang, J. Overview of Water and Fertilizer Integration Development. In Proceedings of the 2016 International Conference on Advances in Energy, Environment and Chemical Science, Changsha, China, 23–24 April 2016; Volume 76, pp. 273–277. [Google Scholar]
- Qin, S.; Li, S.; Kang, S.; Du, T.; Tong, L.; Ding, R. Can drip irrigation under film mulch reduce crop evapotranspiration and save water under the sufficient irrigation condition? Agric. Water Manag. 2016, 11, 128–137. [Google Scholar] [CrossRef]
- Wang, J.; Du, G.; Tian, J.; Zhang, Y.; Jiang, C.; Zhang, W. Effect of irrigation methods on root growth, root-shoot ratio and yield components of cotton by regulating the growth redundancy of root and shoot. Agric. Water Manag. 2020, 234, 106120. [Google Scholar] [CrossRef]
- Li, x.; Liu, H.; He, X.; Gong, P.; Lin, E. Water-Nitrogen Coupling and Multi-Objective Optimization of Cotton under Mulched Drip Irrigation in Arid Northwest China. Agronomy 2019, 12, 894. [Google Scholar] [CrossRef] [Green Version]
- Wang, P.; Zhao, Z.; Wang, L.; Tian, C. Comparison of Efficiency-Enhanced Management and Conventional Management of Irrigation and Nitrogen Fertilization in Cotton Fields of Northwestern China. Agriculture 2021, 11, 1134. [Google Scholar] [CrossRef]
- Wang, H.; Wu, L.; Wang, X.; Zhang, S.; Cheng, M.; Feng, H.; Fan, J.; Zhang, F.; Xiang, Y. Optimization of water and fertilizer management improves yield, water, nitrogen, phosphorus and potassium uptake and use efficiency of cotton under drip fertigation. Agric. Water Manag. 2021, 245, 106662. [Google Scholar] [CrossRef]
- Li, J.; Meng, Y.; Li, B. Field evaluation of fertigation uniformity as affected by injector type and manufacturing variability of emitters. Irrig. Sci. 2007, 2, 117–125. [Google Scholar] [CrossRef]
- Tang, P.; Li, H.; Issaka, Z.; Chen, C. Effect of manifold layout and fertilizer solution concentration on fertilization and flushing times and uniformity of drip irrigation systems. Agric. Water Manag. 2018, 200, 71–79. [Google Scholar] [CrossRef]
- Zhang, Z.; Chen, C.; Li, H.; Tang, P. Research on Mixing Law of Liquid Fertilizer Injected into Irrigation Pipe. Horticulturae 2022, 8, 200. [Google Scholar] [CrossRef]
- Kartashev, A.; Kartasheva, M.; Terekhin, A. Modeling Operating Regimes in Multiphase Flowmeter Flow Path Using CFD Methods. Int. Conf. Ind. Eng. 2017, 206, 128–133. [Google Scholar] [CrossRef]
- Lahey, R.T., Jr. On the computation of multiphase flows. Nucl. Technol. 2009, 167, 29–45. [Google Scholar] [CrossRef]
- Sun, B.; Lu, Y.; Liu, Q.; Fang, H.; Zhang, C.; Zhang, J. Experimental and Numerical Analyses on Mixing Uniformity of Water and Saline in Pipe Flow. Water 2020, 12, 2281. [Google Scholar] [CrossRef]
- Selvam, P.K.; Kulenovic, R.; Laurien, E. Experimental and numerical analyses on the effect of increasing inflow temperatures on the flow mixing behavior in a T-junction. Int. J. Heat Fluid Flow 2016, 61, 323–342. [Google Scholar] [CrossRef]
- Langhi, M.; Hosoda, T.; Dey, S. Analytical Solution of k-epsilon Model for Nonuniform Flows. J. Hydraul. Eng. 2018, 144, 04018033. [Google Scholar] [CrossRef]
- Skrypnik, I.I.; Voitovych, M.V. On the continuity of solutions of quasilinear parabolic equations with generalized Orlicz growth under non-logarithmic conditions. Ann. Di Mat. Pura Ed Appl. 2021, 201, 1381–1416. [Google Scholar] [CrossRef]
- Arbab, A.I.; Widatallah, H.M. On the Generalized Continuity Equation. Chin. Phys. Lett. 2010, 27, 084703. [Google Scholar] [CrossRef] [Green Version]
- Séro-Guillaume, O.; Calogine, D. The Navier-Stokes equation with memory, and momentum transfer in a porous medium. Comptes Rendus Mec. 2002, 6, 383–389. [Google Scholar] [CrossRef]
- Karlin Iliya, V.; Tomboulides, A.G.; Frouzakis, C.E.; Ansumali, S. Kinetically reduced local Navier-Stokes equations: An alternative approach to hydrodynamics. Phys. Rev. E 2006, 74, 035702. [Google Scholar] [CrossRef]
- Ayhan, H.; Sökmen, C.N. CFD modeling of thermal mixing in a T-junction geometry using LES model. Nucl. Eng. Des. 2012, 253, 183–191. [Google Scholar] [CrossRef]
- Alloush, M.M.; Hanimann, L.; Moukalled, F.; Mangani, L.; Darwish, M. An implicit bounding formulation for the volume fraction equation in multiphase flows. Numer. Heat Transf. Part B Fundam. 2021, 79, 235–254. [Google Scholar] [CrossRef]
- St Joseph, M. (Ed.) Field Evaluation of Micro-Irrigation Systems; ASAE: Washington, DC, USA, 1999. [Google Scholar]
- Lari, K.S.; Van Reeuwijk, M.; Maksimović, Č.; Sharifan, S. Combined bulk and wall reactions in turbulent pipe flow: Decay coefficients and concentration profiles. J. Hydroinformatics 2011, 13, 324–333. [Google Scholar] [CrossRef] [Green Version]
- Calomino, F.; Tafarojnoruz, A.; De Marchis, M.; Gaudio, R.; Napoli, E. Experimental and Numerical Study on the Flow Field and Friction Factor in a Pressurized Corrugated Pipe. J. Hydraul. Eng. 2015, 141, 04015027. [Google Scholar] [CrossRef]
- Calomino, F.; Alfonsi, G.; Gaudio, R.; D’Ippolito, A.; Lauria, A.; Tafarojnoruz, A.; Artese, S. Experimental and Numerical Study of Free-Surface Flows in a Corrugated Pipe. Water 2018, 10, 638. [Google Scholar] [CrossRef] [Green Version]
- Widiatmojo, A.; Sasaki, K.; Widodo, N.P.; Sugai, Y. Discrete tracer point method to evaluate turbulent diffusion in circular pipe flow. J. Flow Control. Meas. Vis. 2013, 1, 57–68. [Google Scholar] [CrossRef] [Green Version]
- Lari, K.S.; van Reeuwijk, M.; Maksimović, Č. Simplified Numerical and Analytical Approach for Solutes in Turbulent Flow Reacting with Smooth Pipe Walls. J. Hydraul. Eng. 2010, 136, 626–632. [Google Scholar] [CrossRef]
- Rabinovich, E.; Kalman, H. Generalized master curve for threshold superficial velocities in particle- fluid systems. Powder Technol. 2008, 183, 304–313. [Google Scholar] [CrossRef]
- Akbari, S.; Taghavi, S.M. Injection of a heavy fluid into a light fluid in a closed-end pipe. Phys. Fluids 2020, 32, 063302. [Google Scholar] [CrossRef]
- Townsend, J.D. Fertigation-uniformity of fertilizer application through drip irrigation systems. In Proceedings of the 4th International Microirrigation Congress, Albury-Wodonga, NSW, Australia, 23–28 October 1988. [Google Scholar]
- Bracy, R.P.; Parish, R.L.; Rosendale, R.M. Fertigation uniformity affected by injector type. HortTechnology 2003, 13, 103–105. [Google Scholar] [CrossRef]
- Fan, J.; Zhang, F.; Wu, L.; Yan, S.; Xiang, Y. Field evaluation of fertigation uniformity in drip irrigation system with pressure differential tank. Trans. Chin. Soc. Agric. Eng. 2016, 32, 96–101. [Google Scholar]
- Wang, W. Study on the fertilization uniformity of water-fertilizer integrated micro-sprinkler belt. J. Water Resour. Water Eng. 2020, 31, 124–130. [Google Scholar]
Figure 1.
The water and fertilizer mixing pipe model.

Figure 2.
Meshed water and fertilizer mixing pipe model.

Figure 3.
Experimental cotton field.

Figure 4.
Experimental fertilizing equipment.

Figure 5.
Framework of water and fertilizer integration system in an experimental cotton field.

Figure 6.
Eddy viscosity in the center of the water-fertilizer junction.

Figure 7.
Flow velocity of the longitudinal section at 0.6 s.

Figure 8.
Flow velocity of the longitudinal section at 3.5 s.

Figure 9.
Volume fraction of the fertilizer of horizontal section at 4 s.

Figure 10.
Volume fraction of fertilizer for different water and fertilizer flow rates. (a) No.1–No.3, (b) No.4–No.6, (c) No.7–No.9.
Figure 10.
Volume fraction of fertilizer for different water and fertilizer flow rates. (a) No.1–No.3, (b) No.4–No.6, (c) No.7–No.9.


Table 1.
The fluid properties and simulation parameters.
| Parameters | Value | Unit |
|---|---|---|
| Density of water | 1.0 × 10³ | |
| Density of fertilizer | 1.3 × 10³ | |
| Dynamic viscosity of water | 1.01 × 10⁻³ | |
| Dynamic viscosity of fertilizer | 0.8 | |
| Mixing temperature | 298.15 | |
| Diameter of suspended particles | 5 | |
| Pressure | 1 |
Table 2.
Working conditions for the experiment design.
| No. | Flow Velocity of Water v1/(m/s) | Flow Velocity of Fertilizer v2/(m/s) |
|---|---|---|
| 1 | 1 | 0.25 |
| 2 | 1 | 0.35 |
| 3 | 1 | 0.45 |
| 4 | 1.5 | 0.25 |
| 5 | 1.5 | 0.35 |
| 6 | 1.5 | 0.45 |
| 7 | 2 | 0.25 |
| 8 | 2 | 0.35 |
| 9 | 2 | 0.45 |
Table 3.
Flow rate variation for the numerical simulation.
| No. | Flow Velocity of Fertilizer v1/(m/s) | Flow Velocity of Water v2/(m/s) | Maximum Flow Rate after Mixing vmix−max/(m/s) |
|---|---|---|---|
| 1 | 1 | 0.25 | 1.293 |
| 2 | 1 | 0.35 | 1.352 |
| 3 | 1 | 0.45 | 1.282 |
| 4 | 2 | 0.25 | 1.876 |
| 5 | 2 | 0.35 | 1.912 |
| 6 | 2 | 0.45 | 1.974 |
| 7 | 3 | 0.25 | 2.481 |
| 8 | 3 | 0.35 | 2.505 |
| 9 | 3 | 0.45 | 2.554 |
Table 4.
Comparison of fertilization uniformity under different water and fertilizer flow rates.
| No. | Uc (%) | DU (%) | Us (%) |
|---|---|---|---|
| 1 | 90 | 85 | 82 |
| 2 | 91 | 88 | 87 |
| 3 | 89 | 86 | 81 |
| 4 | 88 | 84 | 85 |
| 5 | 92 | 90 | 86 |
| 6 | 90 | 88 | 85 |
| 7 | 95 | 92 | 88 |
| 8 | 93 | 91 | 90 |
| 9 | 94 | 91 | 88 |
Publisher’s Note: MDPI stays neutral with regard to jurisdictional claims in published maps and institutional affiliations. |
© 2022 by the authors. Licensee MDPI, Basel, Switzerland. This article is an open access article distributed under the terms and conditions of the Creative Commons Attribution (CC BY) license (https://creativecommons.org/licenses/by/4.0/).
Share and Cite
MDPI and ACS Style
Ma, X.; Zhang, L.; Fu, C.; Wang, W.; Yan, Y. Effects of Water and Fertilizer Flow Rates on the Mixing Process and Fertilization Uniformity of Cotton under Mulch Drip Irrigation. Water 2022, 14, 1952. https://doi.org/10.3390/w14121952
AMA Style
Ma X, Zhang L, Fu C, Wang W, Yan Y. Effects of Water and Fertilizer Flow Rates on the Mixing Process and Fertilization Uniformity of Cotton under Mulch Drip Irrigation. Water. 2022; 14(12):1952. https://doi.org/10.3390/w14121952
Chicago/Turabian StyleMa, Xiao, Lixin Zhang, Changxin Fu, Wendong Wang, and Yongchun Yan. 2022. "Effects of Water and Fertilizer Flow Rates on the Mixing Process and Fertilization Uniformity of Cotton under Mulch Drip Irrigation" Water 14, no. 12: 1952. https://doi.org/10.3390/w14121952
Note that from the first issue of 2016, this journal uses article numbers instead of page numbers. See further details here.