
A Multiobjective Spatial Optimization Model of LID Based on Catchment Landuse Type

1
Guangdong Provincial Engineering Technology Research Center for Urban Water Cycle and Water Environment Safety, Institute of Environment and Ecology, Tsinghua Shenzhen International Graduate School, Tsinghua University, Shenzhen 518055, China
2
State Environmental Protection Key Laboratory of Microorganism Application and Risk Control, School of Environment, Tsinghua University, Beijing 100084, China
*
Author to whom correspondence should be addressed.
Water 2022, 14(12), 1944; https://doi.org/10.3390/w14121944
Submission received: 11 May 2022
/
Revised: 6 June 2022
/
Accepted: 11 June 2022
/
Published: 17 June 2022
(This article belongs to the Section Soil and Water)
Abstract
:Aiming to solve the problem of the low efficiency and single objective of low impact development (LID) layout, the objectives of stormwater control, water quality purification, and economic cost are selected to present the performance of LID practices. A novel method of evaluating urban runoff and pollutant concentration is put forward based on the land-use type of each catchment. Shenzhen City is selected as the study area, and three LID scenarios are designed and contrasted for an ideal solution according to their land-use type. The results show that the multiobjective optimization model based on runoff evaluation, pollutant simulation, and investment calculation can be more efficient and can be applied in other areas.
1. Introduction
With rapid urbanization, a large percentage of natural land is being converted into urban infrastructure [1]. A larger impervious area leads to an infiltration decrease, thus increasing urban flood intensity and volume during storms and decreasing groundwater recharge during dry periods. Meanwhile, urbanization also significantly degrades water quality. The rainfall–runoff process can wash off roads and carry a high concentration of pollutants, which become s the source of Nonpoint Source (NPS) pollution [2].
Aiming to alleviate the negative impact of urban flooding and NPS pollution, the Sponge City Construction Plan has been implemented in China, in which low impact development (LID) practices are utilized to combat the problems of water quality and water quantity [3]. LID has been widely recognized as an effective method to minimize the hydrological impacts and mitigate NPS pollution within urban catchments [4]. The functioning mechanism of this practice is to simulate predeveloped runoff conditions while promoting the maintenance of natural processes, such as storage, infiltration, and evaporation [5]. Substantial studies have been carried out to assess the performance of LID practices using on-site investigation, laboratory experiments, and modeling analysis [6], while it remains a key issue to distribute LID practices across the broad landscapes for decision making at the large scale of a watershed. As for the heterogeneity in LID spatial characteristics (e.g., land type, permeability, roughness, and available space), evaluating its comprehensive performance could be essential.
Most of the previous research has focused on the optimal design and locations of nature-based solutions to realize a better biophysical performance of the whole system while mainly focusing on the calculation of urban runoff and water quality [7,8,9,10]. These studies involve many developed models, such as SUSTAIN [7], UrbanBEATS [8], Soil and Water Assessment Tool (SWAT) [9], and other spatially explicit models [10]. Furthermore, there remain two critical challenges to be improved; one is the scope of the multiobjective optimization method, and the other is the efficiency of decision making.
For the first key point, pertinent literature mainly focused on the efficiency of LID practices when dealing with stormwater control and water quality purification in scenarios comprising various return-period storm events [11]. With this background, Ref. [12] conducted a multicriteria decision analysis (MCDA) for three different LID types, i.e., leaky-well, soak-away, and infiltration trench, from technical, economic, and social perspectives while disregarding hydro-environmental drivers. Ref. [13] developed a model to simulate decision rules used by local municipalities to install nature-based stormwater treatment systems, supposing it as a novel approach to investigate the impact of using different decision rules to provide environmental services considering biophysical and economic factors. Ref. [14] selected 16 criteria based on three dimensions of sustainability, such as social, economic, and environmental, which were evaluated with the AHP-TOPSIS method for a comprehensive LID assessment result. The above works were mostly solely concerned with the objective of stormwater control or water quality purification while neglecting the evaluation of investment.
For the second key point, policy makers may use decision support systems to assist their decision; however, they are unlikely to systematically follow the suggestions of such technologies and conclude their decisions only with evaluation. These models [15,16] also assumed that policy makers have perfect knowledge and that they can deal with complicated situations, while most policy makers only have limited knowledge and a varying degree of commitment. Hence, they tend to work out their decisions based on accessible strategies, which gives the impetus to solve multiobjective optimization problems more efficiently.
Therefore, we have the issue of how to incorporate more objectives when improving simulation efficiency. Conventional studies always utilize software (e.g., SWMM) to simulate water quantity and water quality after rainfall, then calculate the runoff reduction rate and water quality purification rate based on different scenarios with and without LID practices. This method [17,18] is based on the mechanism of rainfall infiltration and pipeline routing, which neglects the objective of economic cost and requires substantial data on the pipeline network and underlying to generate simulation results, and thus may require a large amount of time. Since we have learned that the main influencing indicators of the rainfall–runoff process [19] are the amount of precipitation, land-use type, and LID coverage, we can construct a calculating model instead of analyzing scenario simulation results. This model can generate the above results with the sole inputs of precipitation, land-use type, and LID coverage, which is efficient in objective calculation and guaranteed simulation accuracy. Meanwhile, for solving the problem of multiobjective optimization, the nondominated sorting genetic algorithm (NSGA-II) has been widely acknowledged as an efficient method in this area [20]. What is more, in addition to the calculation of the stormwater control rate and water quality purification rate, the economic cost is another factor that should be incorporated into this research.
To improve the scope of optimization objectives, this paper contains three objective functions (two of which can be regarded as restrictive conditions), which are involved with stormwater control, runoff pollutant removal, and the economic cost. We selected Shenzhen City as the study area and separated the whole city into 555 catchments for simulation and analysis. Subsequently, without the utilization of software, three scenarios of LID layout were designed according to their land-use type, and the economic costs were contrasted among them. All in all, the purpose of this paper is to put forward an optimization system that considers many aspects of LID practice distribution, simplifies the simulation process, and improves calculation efficiency.
2. Materials and Methods
2.1. Study Area
Shenzhen City, a well-known Special Economic Zone, is located in Guangdong Province, south China (as shown in Figure 1). The regional urban watershed covers an area of 1997.47 km2, with more than 20 million people and a 927.96 km2 constructed area, which accounts for 46.44% of this city. Such a scale of urbanization clearly alters the underlying conditions and increases the impervious area; thus, urban flooding can be a severe problem after heavy rainfall. Large amounts of urban runoff can wash off roads and carry a high concentration of pollutants, making NPS pollution the other key issue. Therefore, it is urgent to implement sponge city construction.
Located at the seaside of South China, Shenzhen is in a Subtropical Monsoon Climate with warm weather, ample sunshine, and substantial rainfall throughout the year. The average annual temperature is 22.4 °C, with an annual rainfall of 1933.3 mm. The terrain consists of several hills and plains, and nearly 160 rivers flow over this area, including the Shenzhen River, Maozhou River, etc. Without the implementation of Sponge City Construction, Shenzhen is especially vulnerable to urban flooding; even common heavy rain (30–50 mm/d) under typhoons may lead to frequent ponding around the city. Thus, this city is suitable for studying the multiobjective optimization problem of sponge city construction practices.
With a highly developed economic level, Shenzhen was incorporated into the second list of the National Sponge City Construction Pilot City of China. Since then, Shenzhen has obtained great achievements in this field, combining Sponge City Construction model with sewerage treatment and urban planning, purifying nearly all the black and odorous water bodies, and mitigating urban floods effectively. With the realistic demand for implementing LID practices on a large scale, it is necessary to develop a multiobjective optimization model.
2.2. Objective Functions
The relationships among runoff generation, pollutant concentration, and rainfall has been widely studied with developed models (e.g., SWMM, Info Works, and MIKE URBAN), while the effect of land-use type on the surface runoff and rainwater quality has not been researched to the same extent. The mechanism of rainfall, wash-off, infiltration, runoff generation, and routing can be conceptualized and simulated with input variables of rainfall and underlying type, which are presented below.
During rainfall–runoff, many factors may affect the result of urban flood quantity and runoff quality, such as precipitation, land-use type, coverage of the previous area, etc. In conventional LID modeling operations, we set various scenarios in software, such as the underlying parameters, LID type, and the mechanism of pollutant build-up and wash-off, although too complex for an optimal solution. Therefore, we constructed a novel model to calculate the runoff generation and water quality considering the influence of the above factors based on the research of [19]. With the calibration and validation of model parameters in a block-scale area, we can apply this model to a larger area that contains this block to calculate simulation results with much higher efficiency. The model can be demonstrated as follows:
where Q is the surface runoff (mm), C is the pollutant concentration (kg/m3), P is the amount of rainfall (mm), L is the coverage of LID, a1 is the runoff generation parameter, b1 is the rainfall parameter of runoff, d1 is the coverage parameter of runoff, a2 is the pollutant generation parameter, b2 is the rainfall parameter of pollutant, and d2 is the coverage parameter of pollutant.
Based on the demonstration of Equation (1), we set different parameters to match various land-use types for calculating runoff generation and pollutant concentrations. The parameters selection is quite important for the simulation result; thus, it is widely researched and validated, and the process can be presented as follows:
- (1)
- The objective function for calculating the water quantity of bare soil is based on the research of the relationships among surface runoff, precipitation, and coverage rate [19]. Among parameters a, b, and d, parameter a has the major effect on the simulation result because it directly decides the order of magnitude of the result, so it is estimated according to land-use type on the basis of the related study;
- (2)
- For water quantity, Tu [21] studied surface runoff depth under various types of grassland and bare soil, and the ratio between the two land-use types varies roughly from 0.5 to 0.8, so parameter a1 of grassland is estimated from 1400 to 2200. Wang [22], Kim [23], and Leach [24] studied the variation of imperviousness from bare soil to impervious texture, and the ratio between the above two land-use types nearly ranges from 1.1 to 1.5, so parameter a1 of gray infrastructure area is estimated from 2900 to 4000;
- (3)
- For water quality, Solakian [25] studied the relationships among precipitation, runoff, and pollutant concentration in a natural watershed, and the ratio between pollutant concentration (kg/m3) and runoff generation (mm) roughly ranges from 0.015 to 0.025, so a2 of bare soil is estimated from 40 to 68. Accordingly, the ratio between grassland and bare soil of a2 varies from 0.5 to 0.8, and the ratio between gray infrastructure area and bare soil of a2 varies from 1.1 to 1.5. Therefore, a2 of grassland is estimated from 28 to 45, and that of gray infrastructure area is estimated from 62 to 84;
- (4)
- Parameters b1, b2, d1, and d2 are estimated in certain ranges according to [19]: b1 and b2 vary from 0.005 to 0.015, d1 vary from 8.0 to 40.0, and d2 vary from 3.0 to 15.0.
With the process of parameter selection and validation [19,21,22,23,24,25], all parameters have been calibrated and compared with the aforementioned research; thus, it is supposed to be the ideal range for our work. Based on the above demonstration of parameter calibration and comparison, these results are reasonable and may support our further work. The land-use type of study area was classified into three types: bare soil, grassland, and gray infrastructure. The parameters selected and the computing formulas obtained are listed in Table 1.
After obtaining the surface runoff and pollutant concentration of each catchment, we can use Equation (2) to calculate their stormwater control rate (Restrictive condition 1) and water quality purification rate (Restrictive condition 2); then, we can use Equation (3) to set the objective functions of stormwater control rate (f1) and water quality purification rate (f2) within a certain range by incorporating the area of each catchment. Considering the evaluation standard of Sponge City Construction in China, the stormwater controlling rate (f1) is set at nearly 70%, and the water quality purification rate (f2) is set at nearly 40% [26].
Commonly, the economic cost of LID practices consists of two parts: land cost and LID construction cost. For some practices (e.g., bioretention or porous pavement in parking lots), they are assumed to be incorporated into existing or mandatory infrastructures, which will not cause land cost; for other practices, certain land cost is supposed to be considered. Meanwhile, LID construction cost is a necessary factor for all types of practices; thus, it is stated and calculated in the following work.
By setting the coverage of LID within each catchment, the economic cost of each scenario (objective function f3) can be calculated with Equation (4). The economic cost consists of land cost and LID construction cost, in which land cost is set as USD 56.1/m2 [27], and LID construction cost can vary with the land-use type. For bare soil, the construction fee is considered free due to its capacity for infiltration and storage. For the grassland, grass swale (USD 5.7/m2) and rainwater garden (USD 23.6/m2) [28] are selected as simulated LID practices, and the proportion is assumed as 1:1. Thus the average construction cost is USD 14.6/m2. For the gray infrastructure area, a stormwater retention tank is selected, and the above area is supposed not to be developed; thus, the construction cost is set as USD 44.0/m2 [29].
where L1i is the stormwater control rate of catchment i, L2i is the water quality purification rate of catchment i, Qi is the runoff without LID (mm) of catchment i, Qi1 is the runoff with LID (mm) of catchment i, Ci is the pollutant concentration without LID (kg/m3) of catchment i, Ci1 is the pollutant concentration with LID (kg/m3) of catchment i, Si is the area of catchment i (km2), Ki is the proportion of LID within each catchment for simulating the actual condition; the parameter is selected randomly under certain range (as shown in Table 2) for each catchment according to its land-use type. E0 is the land cost of unit area (USD 56.1/m2), E1 is the LID construction cost of unit area (free for bare soil, USD 14.6/m2 for grassland, and USD 44.0/m2 for gray infrastructure area), f1 is the urban stormwater control rate of the whole study area, f2 is the water quality purification rate of the whole study area, and f3 is the economic cost of the whole study area.
2.3. Modelling Framework
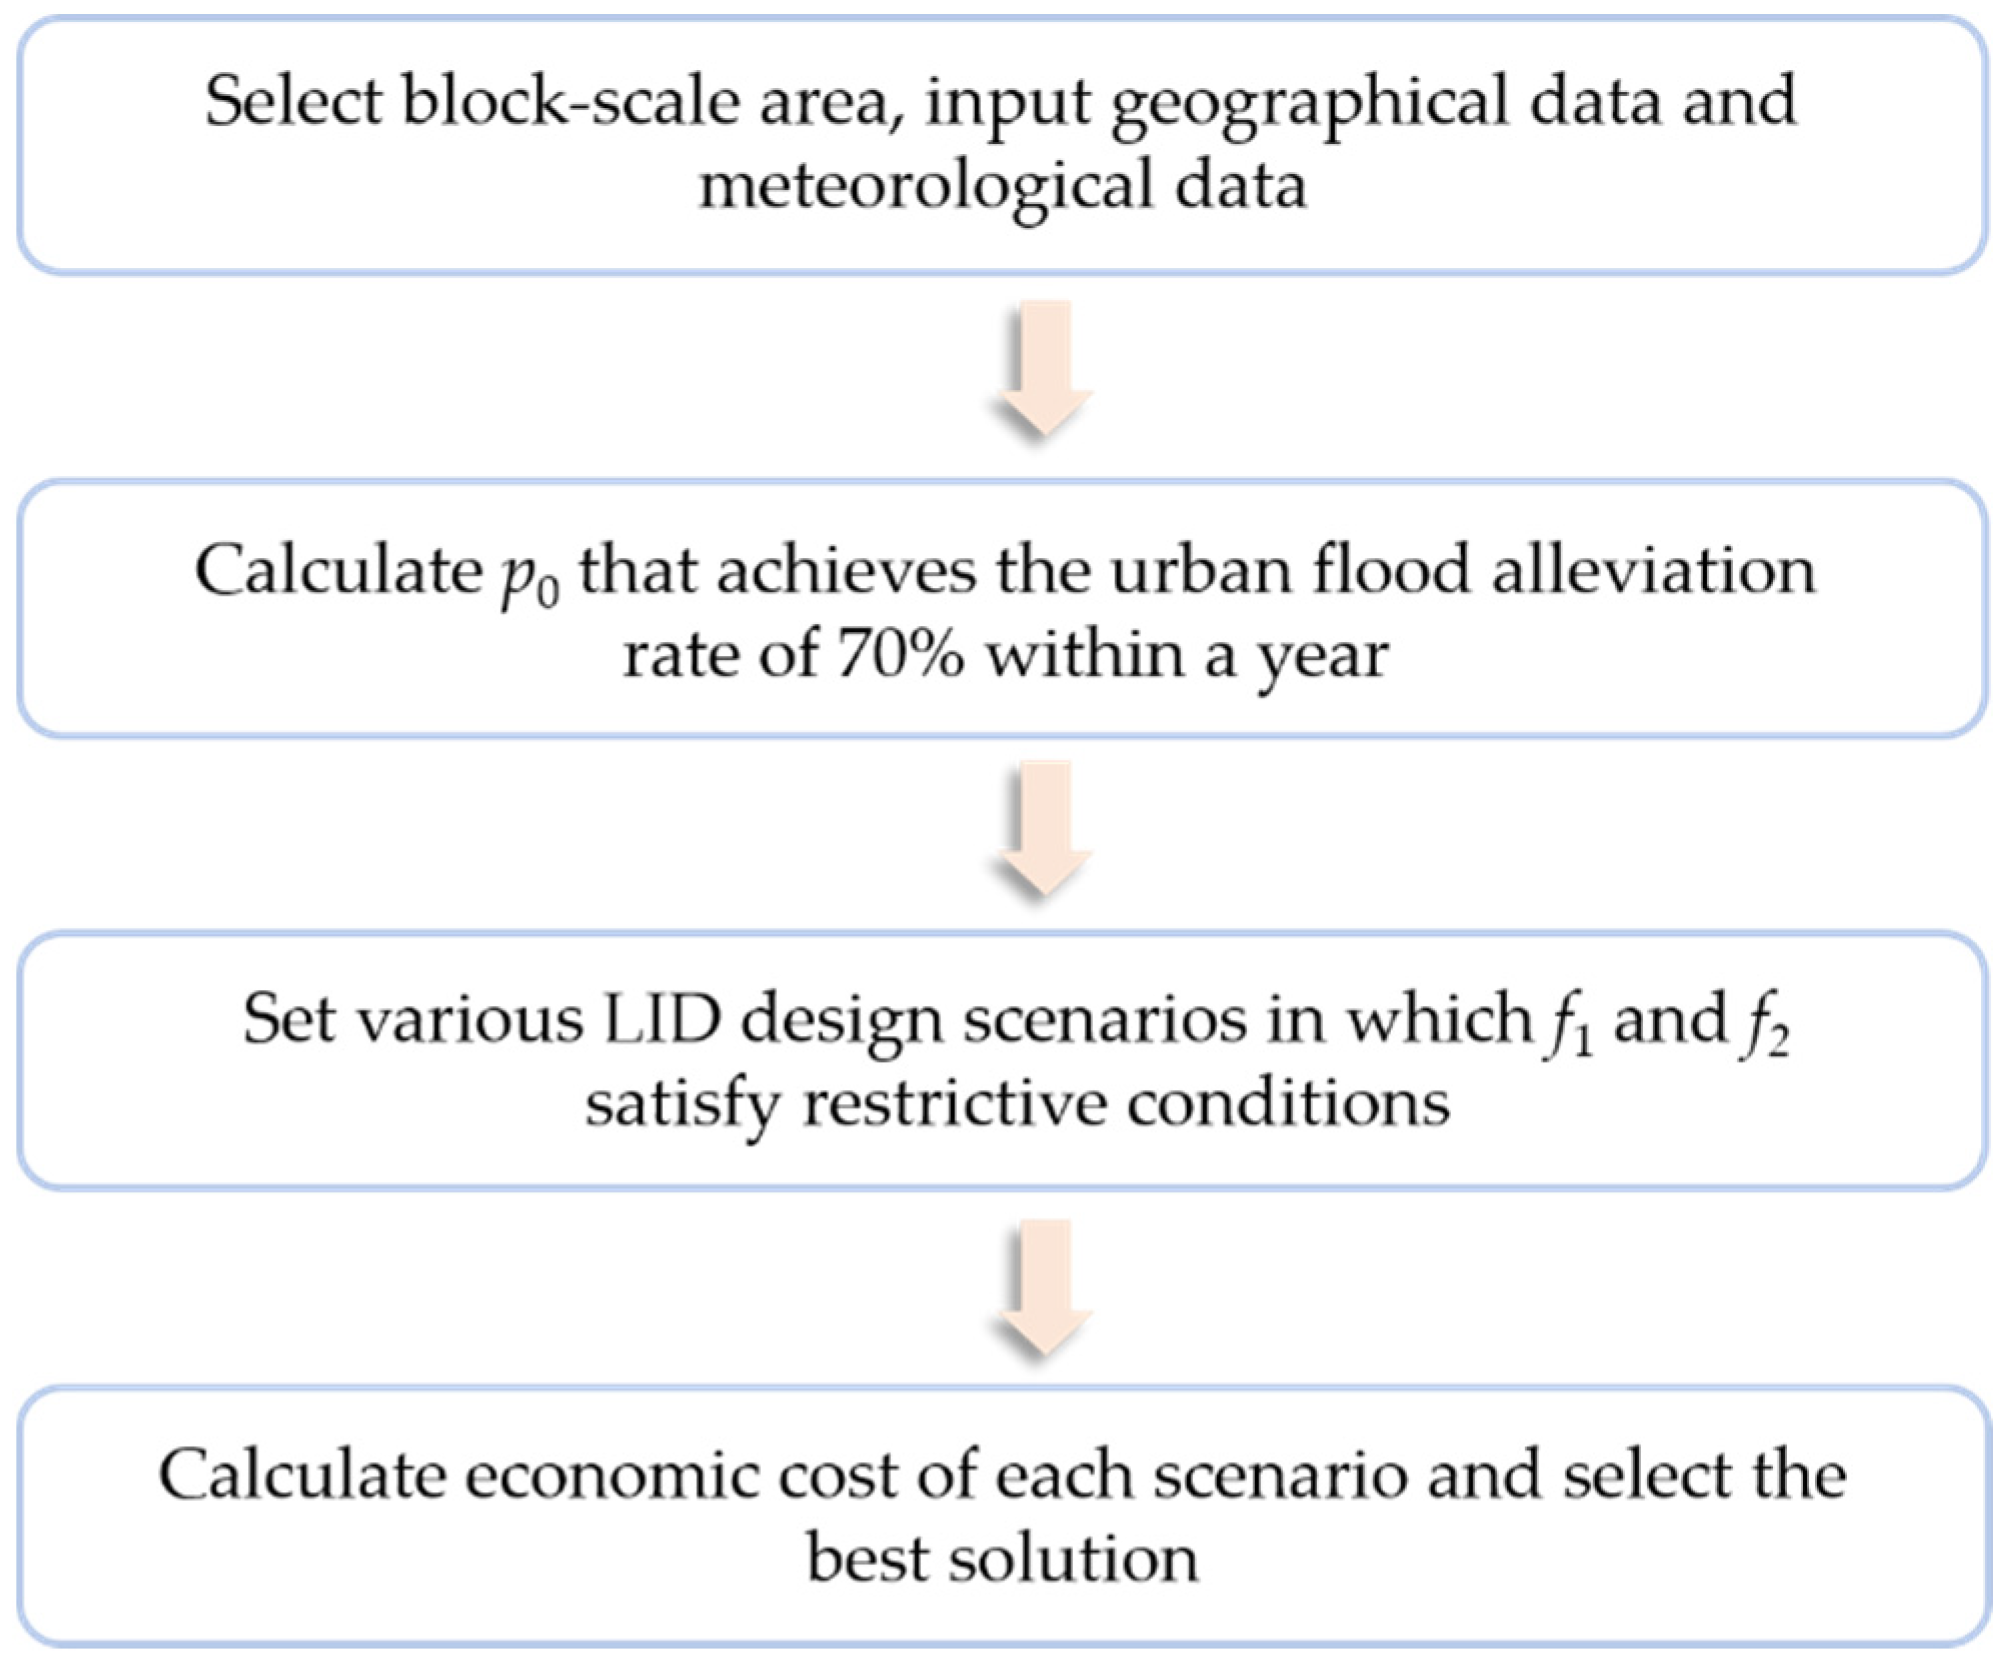
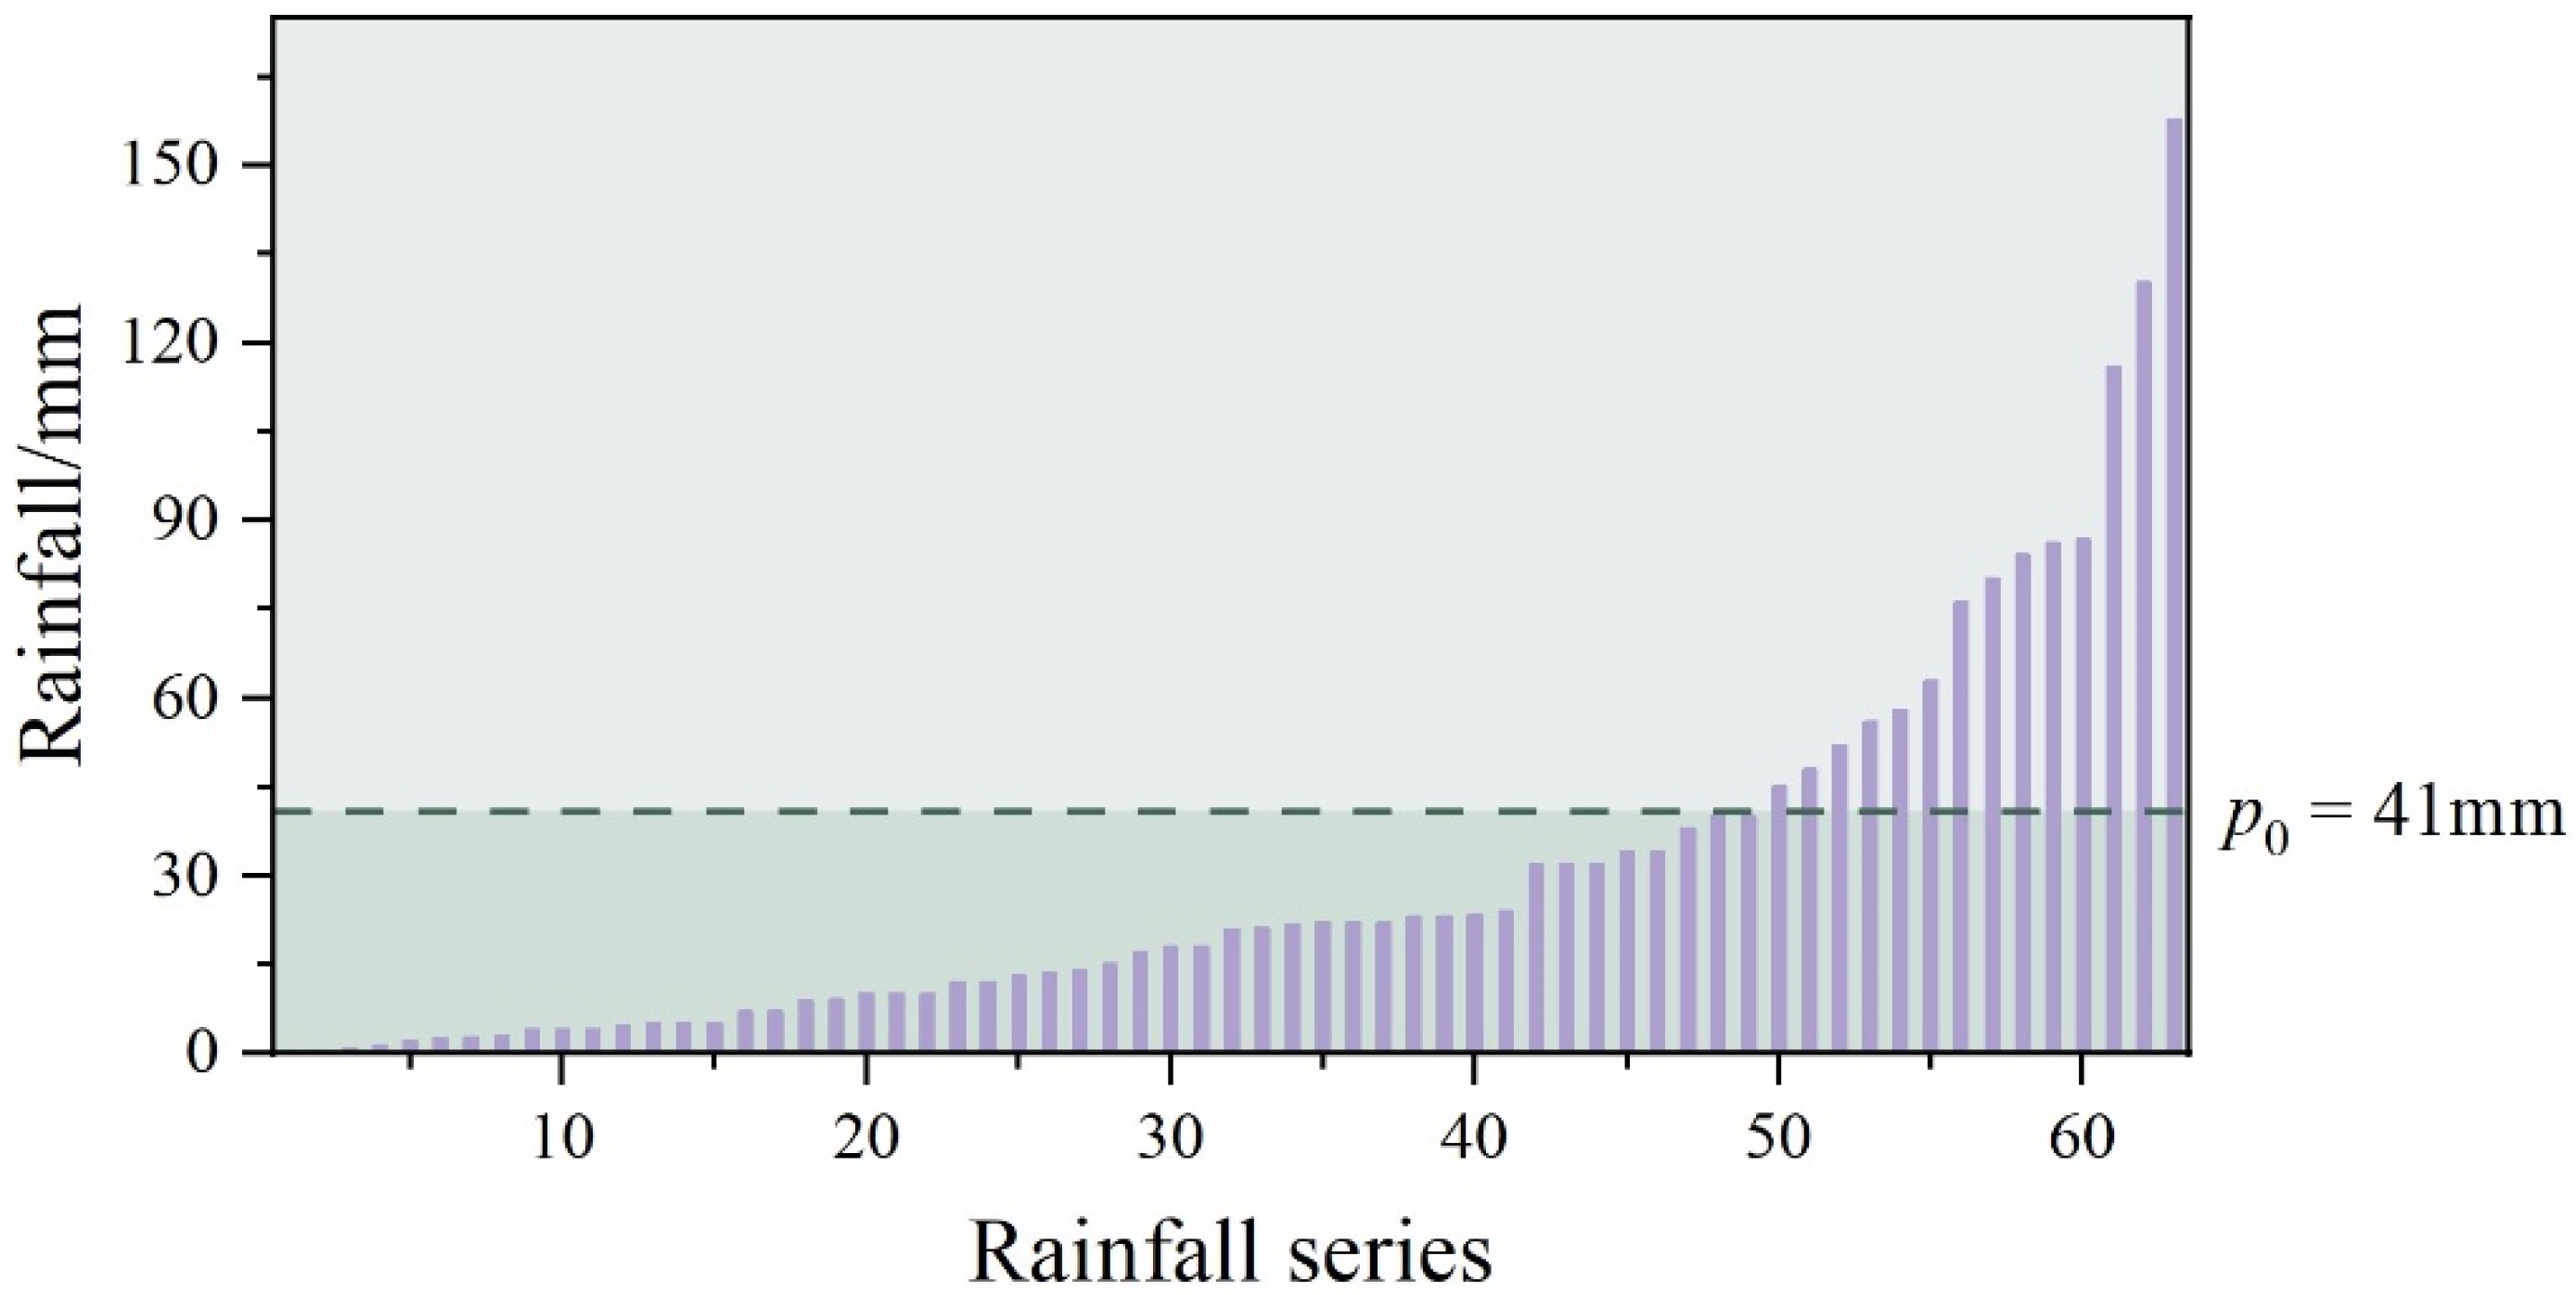
For calculating the objective function and restrictive condition, the amount of rainfall (P) can be a key input variable. Considering that many cities in China set the urban stormwater controlling rate at 70%, it is necessary to work out the rainfall (p0) that achieves this level. By collecting the rainfall data of Shenzhen in 2019 from National Oceanic and Atmospheric Administration (accessed on 7 April 2022, https://www.noaa.gov/), the rainfall series is separated into 63 times within this year. Equation (5) is used to calculate p0 with iteration: rainfall less than p0 is supposed to be controlled within a catchment, and the exceeding amount can be converted into runoff generation. If the cumulative rainfall less than a certain value accounts for 70% of the total amount, this value is regarded as p0. With the calculation of p0, it is treated as an input variable in Equation (1), and the flow chart of this model is shown in Figure 2.
where p0 is the rainfall that achieves the stormwater control rate of 70% (mm), n is the total number of rainfall within a year, m is the number of rainfall that its amount is more than p0 within a year, pj is the rainfall that its amount is more than p0 (mm), pi is the rainfall series (mm), and pt is the total amount of rainfall (mm), rc is the stormwater controlling rate.
3. Results and Discussion
3.1. Precipitation Recurrence Period
During the rainfall–runoff process, the input amount of precipitation affects numerous following variables, such as the quantity of runoff generation and the pollutant concentration; thus, it directly determines the distribution layout of LID practices. With the demonstration of p0 in Equation (5), it is calculated as 41.0 mm (as shown in Figure 3) and input into Equation (1) as an initial variable of this model.
3.2. LID Layout under Various Recurrence Periods
Considering the land-use type, surface elevation, and block classification of the study area, Shenzhen City is separated into 555 catchments, and all the catchments are separated into three types: Bare Soil catchment (BS catchment), Grassland catchment (GS catchment), and Gray Infrastructure catchment (GI catchment). The classification of catchment type is based on the major land-use type within it; thus, 94 BS catchments, 101 GS catchments, and 360 GI catchments are obtained, and each occupied the area of 9.71%, 46.94%, and 43.35% of Shenzhen (as shown in Table 3), respectively. To further calculate the actual area of bare soil, grassland, and grey infrastructure, the LID-occupied proportion within each catchment (as shown in Table 2) is supposed to be incorporated to multiply the corresponding catchment area.
Admittedly, the classification of catchments is supposed to incorporate the information of pipeline networks, while the precise data on the pipelines are hard to obtain. However, the design of block areas and streets is also related to pipeline networks, and a certain proportion of grassland is a hill. So, this process also considers surface elevation and pipeline network to some extent. Table 3 shows the total area and percentage of city area for each catchment type, in which GI catchment covers 43.35% of Shenzhen due to its high level of urbanization. Meanwhile, the high percentage of forest cover and the mountainous area also leads to a prominent proportion of GS catchment therein.
With the major land-use type of each catchment, the process of simulation within catchments is based on the objective functions from Table 1. This assumption and simplification will lead to deviation to some degree, which is regarded as acceptable under such a large scale of implementation.
Based on the modeling framework in Section 2.3, three LID scenarios (as shown in Figure 4) are designed according to their land-use type (as shown in Table 2). Each land-use type has various proportions in each scenario for working out the best scenario under the aforementioned restrictive conditions. The proportion of LID within each catchment reflects its ability to control stormwater and purify runoff quality, and the higher-ranking level means higher coverage of LID practices within a catchment.
Aiming to realize the goal of a stormwater control rate of 70%, we set different proportions of stormwater control areas within each catchment. For bare soil (BS catchment), it is estimated that all areas can deal with stormwater under natural conditions; thus, no LID practices are designed, and the proportion is set at nearly 70%. For grassland (GS catchment), grass swale and rainwater gardens are selected as LID practices, and the proportion is set from 10% to 15% for the target stormwater control rate of 70% [30]. For grey infrastructure (GI catchment), the retention tank is chosen as LID practice, and we assumed the depth from 2 m to 4 m and rainfall amount as 100 mm; thus, the coverage of the retention tank varies from 2.5% to 5%.
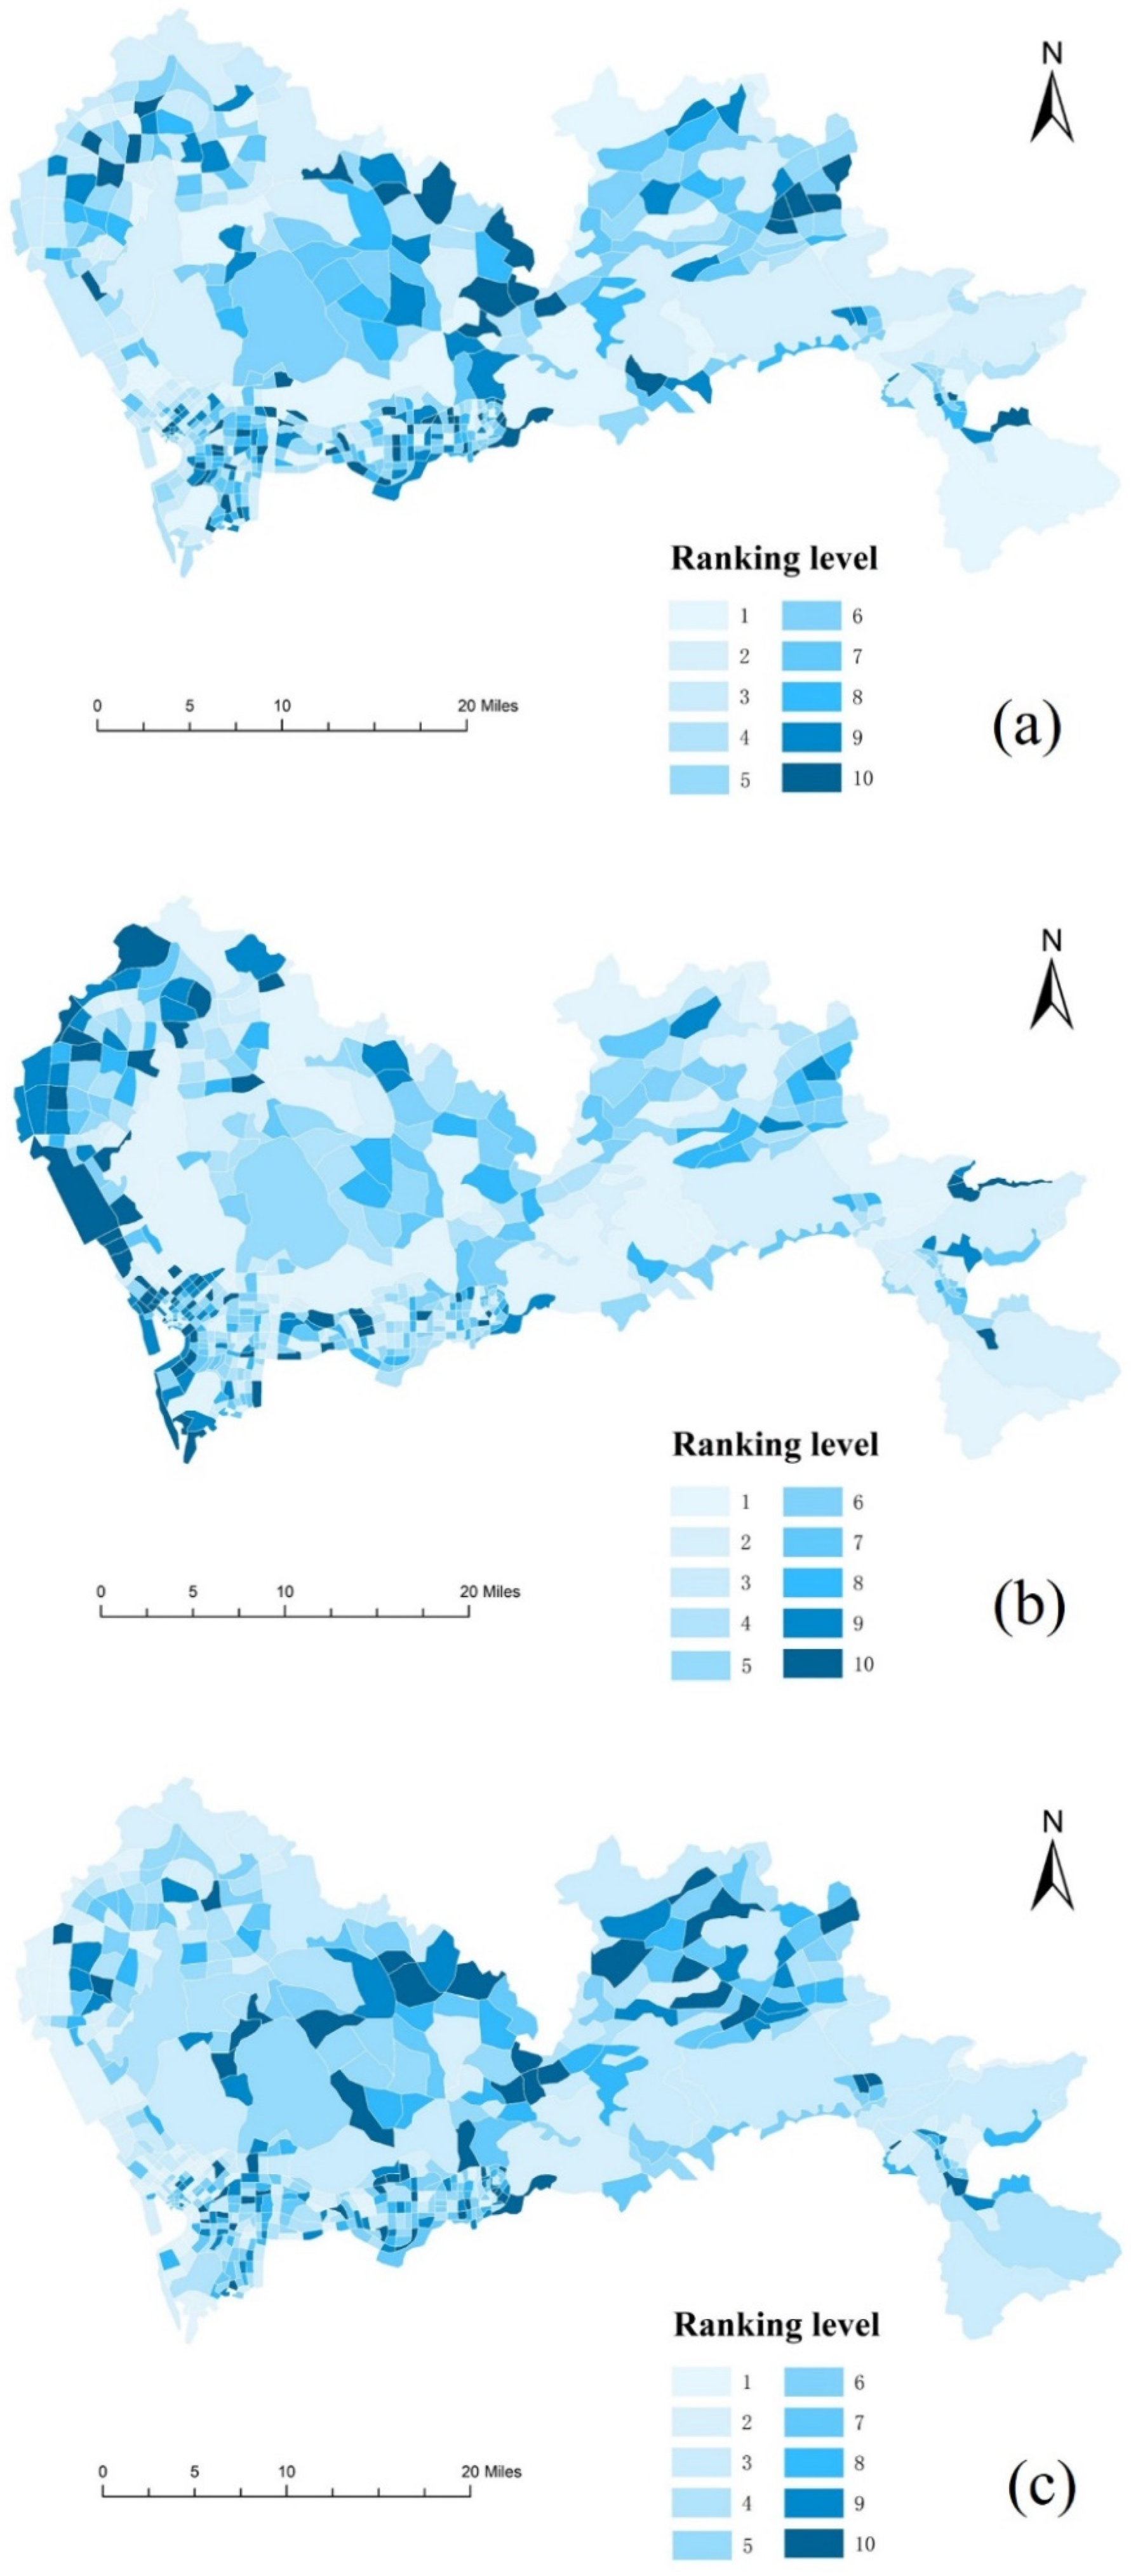
Therefore, the different proportions of stormwater control area within each catchment are designed, and the optimization model is constructed as follows: the proportion of bare soil ranges from 65% to 75% within BS catchment, grassland from 10% to 15% within GS catchment, and grey infrastructure from 2% to 5% within GI catchment among the above three scenarios (as shown in Table 2). Scenario 1 has the most grassland and least bare soil, Scenario 2 has the most bare soil and least gray infrastructure, and Scenario 3 has the most gray infrastructure and least grassland. Additionally, Scenario 2 has the least economic cost (USD 21.14 billion), and Scenario 1 has the most of that (USD 22.47 billion) for their various design. To further visualize the layout of the economic cost of each scenario, Figure 5 shows the ranking level of various catchments under three scenarios. Because of the simulated precipitation of the study area, we cannot obtain corresponding validation data for stormwater control and water quality. For the next step of this study, we will continue to improve this work.
Figure 5 presents the cost ranking level of each catchment under three scenarios, in which the construction cost is low in the southwest and northwest Shenzhen, while it is relatively higher in the southeast region for the substantial area for LID practices design and construction. Meanwhile, the land-use type also directly affects such simulation results, and some neighboring catchments have the same ranking level because of the same underlying type therein.
Because the calculation of economic cost within a catchment is affected by both LID proportion and catchment area, the larger catchments tend to rank higher under this framework. As for the total cost of each scenario, Scenario 2 has the lowest construction fee (USD 21.14 billion), with bare soil as the major land-use type. Accordingly, the actual investment of Sponge City Construction in Shenzhen is nearly USD 4.32 billion [31], which is lower than our simulation result. Because the model incorporates the whole study area and the actual construction is merely carried out in the demonstration region, the investment in the model will increase to some extent, and the data are for reference only.
4. Conclusions
Aiming to solve the problem of the low efficiency and single objective of LID layout, the objectives of stormwater control, water quality purification, and economic cost are selected to present the performance of LID practices. Shenzhen City was selected as the study area and separated into 555 catchments according to land-use type. Three LID scenarios are designed according to their land-use type and contrasted for an ideal solution. The results showed that:
- (1)
- For simulating runoff generation and pollutant concentration according to their parameters under various land-use types, the method of parameter selection and equation calculation is applied, and the process can be more efficient for the large-scale design of LID;
- (2)
- The calculation process of rainfall p0 can reflect its ability to achieve the stormwater control rate and can be inputted as an initial variable of this model. Moreover, the mechanism can be applied to other cities for similar research;
- (3)
- The case study in Shenzhen presents the relationship and optimization method combining stormwater control, NPS pollution control, economic cost, and LID design, which can help implement LID practices on a large scale to effectively improve the urban environment.
Author Contributions
Conceptualization and methodology, K.Z.; LID simulation and analysis, K.Z.; writing—original draft preparation, K.Z.; writing—review and editing, Y.G. All authors have read and agreed to the published version of the manuscript.
Funding
This study was supported by the Key-Area Research and Development Program of Guangdong Province (2019B110205003), Guangxi Key R & D Plan (2021AB25056), the Shenzhen Special Program of Fundamental Research (WDZC20200821090937001) and Special project for the construction of Taiyuan national sustainable development agenda Innovation Demonstration Zone (KCX2020-3-07).
Institutional Review Board Statement
Not applicable.
Informed Consent Statement
Not applicable.
Data Availability Statement
The data used to support the findings of this study are available from the corresponding author upon request.
Conflicts of Interest
The authors declare no conflict of interest.
References
- Ben-Daoud, A.; Ben-Daoud, M.; Moroșanu, G.A.; M’Rabet, S. The use of low impact development technologies in the attenuation of flood flows in an urban area: Settat city (Morocco) as a case. Environ. Chall. 2022, 6, 100403. [Google Scholar] [CrossRef]
- Wang, B.; Huang, G.H.; Liu, L.; Li, W.; Xie, Y.L. Integrated Planning of Urban Water Resources and Water Pollution Control Management: Case of Urumqi, China. J. Water Resour. Plan. Manag. 2016, 142, 5016001. [Google Scholar] [CrossRef]
- Shannak, S. Assessment of Low-Impact development for managing aquatic ecosystem. Ecol. Indic. 2021, 132, 108235. [Google Scholar] [CrossRef]
- Martin-Mikle, C.J.; de Beurs, K.M.; Julian, J.P.; Mayer, P.M. Identifying priority sites for low impact development (LID) in a mixed-use watershed. Landsc. Urban Plan. 2015, 140, 29–41. [Google Scholar] [CrossRef] [Green Version]
- Askarizadeh, A.; Rippy, M.A.; Fletcher, T.D.; Feldman, D.L.; Peng, J.; Bowler, P.; Mehring, A.S.; Winfrey, B.K.; Vrugt, J.A.; AghaKouchak, A.; et al. From Rain Tanks to Catchments: Use of Low-Impact Development to Address Hydrologic Symptoms of the Urban Stream Syndrome. Environ. Sci. Technol. 2015, 49, 11264–11280. [Google Scholar] [CrossRef] [Green Version]
- Lim, H.S.; Lu, X.X. Sustainable urban stormwater management in the tropics: An evaluation of Singapore’s ABC Waters Program. J. Hydrol. 2016, 538, 842–862. [Google Scholar] [CrossRef]
- Lee, J.G.; Selvakumar, A.; Alvi, K.; Riverson, J.; Zhen, J.X.; Shoemaker, L.; Lai, F.-H. A watershed-scale design optimization model for stormwater best management practices. Environ. Model. Softw. 2012, 37, 6–18. [Google Scholar] [CrossRef]
- Wang, M.; Zhang, Y.; Zhang, D.; Zheng, Y.; Li, S.; Tan, S.K. Life-cycle cost analysis and resilience consideration for coupled grey infrastructure and low-impact development practices. Sustain. Cities Soc. 2021, 75, 103358. [Google Scholar] [CrossRef]
- Mtibaa, S.; Hotta, N.; Irie, M. Analysis of the efficacy and cost-effectiveness of best management practices for controlling sediment yield: A case study of the Joumine watershed, Tunisia. Sci. Total Environ. 2018, 616–617, 1–16. [Google Scholar] [CrossRef]
- Zhang, K.; Chui, T.F.M. A comprehensive review of spatial allocation of LID-BMP-GI practices: Strategies and optimization tools. Sci. Total Environ. 2018, 621, 915–929. [Google Scholar] [CrossRef]
- Fiori, A.; Volpi, E. On the Effectiveness of LID Infrastructures for the Attenuation of Urban Flooding at the Catchment Scale. Water Resour. Res. 2020, 56, e2020WR027121. [Google Scholar] [CrossRef]
- Zhou, J.; Fu, T.; Chen, Y.; Xiao, Y.; Peng, J.; Liang, G. A mixed integer nonlinear programming model for optimal design of natural gas storage surface double-pipe network. J. Energy Storage 2021, 44, 103379. [Google Scholar] [CrossRef]
- Castonguay, A.; Iftekhar, S.; Urich, C.; Bach, P.; Deletic, A. Integrated modelling of stormwater treatment systems uptake. Water Res. 2018, 142, 301–312. [Google Scholar] [CrossRef] [PubMed]
- Koc, K.; Ekmekcioğlu, Ö.; Özger, M. An integrated framework for the comprehensive evaluation of low impact development strategies. J. Environ. Manag. 2021, 294, 113023. [Google Scholar] [CrossRef]
- Raei, E.; Alizadeh, M.R.; Nikoo, M.R.; Adamowski, J. Multi-objective decision-making for green infrastructure planning (LID-BMPs) in urban storm water management under uncertainty. J. Hydrol. 2019, 579, 124091. [Google Scholar] [CrossRef]
- Liu, Y.; Cibin, R.; Bralts, V.F.; Chaubey, I.; Bowling, L.C.; Engel, B.A. Optimal selection and placement of BMPs and LID practices with a rainfall-runoff model. Environ. Model. Softw. 2016, 80, 281–296, ISSN 1364-8152. [Google Scholar] [CrossRef] [Green Version]
- Yu, Y.; Zhou, Y.; Guo, Z.; van Duin, B.; Zhang, W. A new LID spatial allocation optimization system at neighborhood scale: Integrated SWMM with PICEA-g using MATLAB as the platform. Sci. Total Environ. 2022, 831, 154843, ISSN 0048-9697. [Google Scholar] [CrossRef]
- Taghizadeh, S.; Khani, S.; Rajaee, T. Hybrid SWMM and particle swarm optimization model for urban runoff water quality control by using green infrastructures (LID-BMPs). Urban For. Urban Green. 2021, 60, 127032, ISSN 1618-8667. [Google Scholar] [CrossRef]
- Zhang, X.; Cao, W.; Guo, Q.; Wu, S. Effects of landuse change on surface runoff and sediment yield at different watershed scales on the Loess Plateau. Int. J. Sediment Res. 2010, 25, 283–293. [Google Scholar] [CrossRef]
- Alizadeh, S.; Avami, A. Development of a framework for the sustainability evaluation of renewable and fossil fuel power plants using integrated LCA-emergy analysis: A case study in Iran. Renew. Energy 2021, 179, 1548–1564. [Google Scholar] [CrossRef]
- Tu, A.; Xie, S.; Zheng, H.; Li, H.; Li, Y.; Mo, M. Long-term effects of living grass mulching on soil and water conservation and fruit yield of citrus orchard in south China. Agric. Water Manag. 2021, 252, 106897, ISSN 0378-3774. [Google Scholar] [CrossRef]
- Wang, Y.; Zhang, X.; Xu, J.; Pan, G.; Zhao, Y.; Liu, Y.; Liu, H.; Liu, J. Accumulated impacts of imperviousness on surface and subsurface hydrology—continuous modelling at urban street block scale. J. Hydrol. 2022, 608, 127621, ISSN 0022-1694. [Google Scholar] [CrossRef]
- Kim, B.S.; Ren, D.; Park, S.W.; Kato, S. Establishing selection criteria of water repellent sandy soils for use in impervious layer of engineered slope. Constr. Build. Mater. 2021, 293, 123551, ISSN 0950-0618. [Google Scholar] [CrossRef]
- Leach, J.M.; Coulibaly, P. Soil moisture assimilation in urban watersheds: A method to identify the limiting imperviousness threshold based on watershed characteristics. J. Hydrol. 2020, 587, 124958, ISSN 0022-1694. [Google Scholar] [CrossRef]
- Solakian, J.; Maggioni, V.; Lodhi, A.; Godrej, A. Investigating the use of satellite-based precipitation products for monitoring water quality in the Occoquan Watershed. J. Hydrol. Reg. Stud. 2019, 26, 100630, ISSN 2214-5818. [Google Scholar] [CrossRef]
- Ouyang, W.; Guo, B.; Hao, F.; Huang, H.; Li, J.; Gong, Y. Modeling urban storm rainfall runoff from diverse underlying surfaces and application for control design in Beijing. J. Environ. Manag. 2012, 113, 467–473, ISSN 0301-4797. [Google Scholar] [CrossRef]
- How Much Land Cost on Shenzhen? Available online: https://www.sohu.com/a/410659730_161795 (accessed on 31 July 2020).
- Cost Analysis of Municipal Sponge City Construction. Available online: http://www.360doc.com/content/20/0926/19/32730899_937733436.shtml (accessed on 26 September 2020).
- Cost of Stormwater Retention Tank. Available online: https://b2b.baidu.com/slist/736a0a297a0e03191a2302677c3e19277a111d257512 (accessed on 11 July 2021).
- Zaqout, T.; Andradóttir, H.Ó. Hydrologic performance of grass swales in cold maritime climates: Impacts of frost, rain-on-snow and snow cover on flow and volume reduction. J. Hydrol. 2021, 597, 126159, ISSN 0022-1694. [Google Scholar] [CrossRef]
- Five-Year Infrastructure Construction Plan of Shenzhen (2016–2020). Available online: https://wenku.baidu.com/view/ca744c75c9aedd3383c4bb4cf7ec4afe05a1b15b.html (accessed on 28 January 2022).
Figure 1.
The Shenzhen City regional catchment division.

Figure 2.
Flow chart of the multiobjective optimization model.

Figure 3.
Rainfall series of Shenzhen.

Figure 4.
Proportion of LID layout under various scenarios: (a) Scenario 1; (b) Scenario 2; (c) Scenario 3.
Figure 4.
Proportion of LID layout under various scenarios: (a) Scenario 1; (b) Scenario 2; (c) Scenario 3.

Figure 5.
Economic cost ranking level under various scenarios: (a) Scenario 1; (b) Scenario 2; (c) Scenario 3.
Figure 5.
Economic cost ranking level under various scenarios: (a) Scenario 1; (b) Scenario 2; (c) Scenario 3.


Table 1.
The objective function for water quantity and quality under various land-use types.
| Landuse Type | Water Quantity | Water Quality |
|---|---|---|
| Bare soil | ||
| Grassland | ||
| Gray infrastructure area |
Table 2.
LID occupied proportion within the catchment and economic cost of three scenarios.
| Scenarios | LID occupied Proportion within Catchment | Economic Cost/USD Billion | ||
|---|---|---|---|---|
| BS Catchment | GS Catchment | GI Catchment | ||
| 1 | 64%~66% | 14%~16% | 2.5%~3.5% | 22.47 |
| 2 | 74%~76% | 11%~13% | 1.5%~2.5% | 21.14 |
| 3 | 69%~71% | 9%~11% | 4.5%~5.5% | 21.26 |
Table 3.
Total area and percentage of each catchment type.
| Catchment Type | BS Catchment | GS Catchment | GI Catchment |
|---|---|---|---|
| Total area/km2 | 221.84 | 1073.19 | 991.11 |
| Area percentage of all catchments/% | 9.71 | 46.94 | 43.35 |
| Number of catchments | 94 | 101 | 360 |
Publisher’s Note: MDPI stays neutral with regard to jurisdictional claims in published maps and institutional affiliations. |
© 2022 by the authors. Licensee MDPI, Basel, Switzerland. This article is an open access article distributed under the terms and conditions of the Creative Commons Attribution (CC BY) license (https://creativecommons.org/licenses/by/4.0/).
Share and Cite
MDPI and ACS Style
Zheng, K.; Guan, Y. A Multiobjective Spatial Optimization Model of LID Based on Catchment Landuse Type. Water 2022, 14, 1944. https://doi.org/10.3390/w14121944
AMA Style
Zheng K, Guan Y. A Multiobjective Spatial Optimization Model of LID Based on Catchment Landuse Type. Water. 2022; 14(12):1944. https://doi.org/10.3390/w14121944
Chicago/Turabian StyleZheng, Kaiyuan, and Yuntao Guan. 2022. "A Multiobjective Spatial Optimization Model of LID Based on Catchment Landuse Type" Water 14, no. 12: 1944. https://doi.org/10.3390/w14121944
Note that from the first issue of 2016, this journal uses article numbers instead of page numbers. See further details here.