
Influence of Cascade Hydropower Development on Water Quality in the Middle Jinsha River on the Upper Reach of the Yangtze River


1
Power China Kunming Engineering Co., Ltd., Kunming 650051, China
2
Institute for Ecological Research and Pollution Control of Plateau Lakes, School of Ecology and Environmental Science, Yunnan University, Kunming 650500, China
3
Environmental Monitoring Center of Middle Reaches of Jinsha River, Kunming 650034, China
4
China Institute of Water Resources and Hydropower Research, Beijing 100038, China
*
Authors to whom correspondence should be addressed.
Water 2022, 14(12), 1943; https://doi.org/10.3390/w14121943
Submission received: 15 May 2022
/
Revised: 10 June 2022
/
Accepted: 14 June 2022
/
Published: 16 June 2022
(This article belongs to the Special Issue Plateau Lake Water Quality and Eutrophication: Status and Challenges)
Abstract
:In recent decades, there has been unprecedented development of hydropower in China, especially in the Yangtze River Basin, which has changed the hydrological and hydraulic conditions of natural rivers and has an impact on water quality. However, the spatial-–temporal extent, factors, and the reasons behind the influence of cascade hydropower development are not clear. The six hydropower stations on the main course of the middle reach of the Jinsha River in Yunnan and Sichuan Provinces have been in joint operation for seven years, and the impact of cascade hydropower development on water quality has begun to appear. In this paper, in order to accurately determine the causal relationship between cascade hydropower development and water quality changes on the middle reaches of the Jinsha River and their trends using regression discontinuity analysis, we collected monitoring data on water quality from 2004 to 2019. The results show that cascade hydropower development on the middle reach of the Jinsha River led to a decrease in TP concentration in that section of the river and an increase in the concentration of CODMn and NH3-N. Furthermore, increase in sedimentation following the impoundment of cascade hydropower development is the main reason for the decrease in TP concentration, and the regional economic and social development driven by cascade hydropower development are external sources of the increase in the concentration of CODMn and NH3-N. In addition, influenced by rainfall, the concentrations of CODMn and TP are higher in the rainy season and lower in the dry season, which is directly related to the input of non-point-source pollutants in the basin during the former. This study established a model to accurately judge the causal relationship between cascade hydropower development and water quality changes in the basin, which was then used to assess the impact of cascade hydropower development on water quality. Our results provide a basis for the formulation and implementation of a water quality protection plan for the middle reach of the Jinsha River and can also provide a basis for the development of cascade hydropower in other river basins.
1. Introduction
China’s potential reserves and technically exploitable hydropower resources rank first in the world. By the end of 2019, China’s total installed hydropower capacity reached 356 million kW, accounting for 17.7% of installed power capacity, and the average annual hydropower generation capacity was 1.15 terawatt hours (TW·h), accounting for 16% of the total power generation [1]. At the basin scale, the development and construction of hydropower stations change natural river channels into cascade hydropower stations, which can change the hydrological and hydraulic conditions of natural rivers, destroy river continuity, and block material transmission and energy flow between upstream and downstream. Pollutants from river confluences are retained in the reservoir area, which has an impact on water quality, such as reduction of water self-purification capacity, increased water salinity, stratification of water temperature in the reservoir area, and water eutrophication [2,3,4,5]. After cascade hydropower development, increasing water depth and decreased flow velocity can cause reduction of the reoxygenation coefficient of the water body. Meanwhile, water quality may also be strongly influenced by agriculture activities within the catchment area, besides water quality deterioration perhaps due to contaminated sediment flux releases [6,7,8,9].
Numerous researchers have studied water quality changes since the impoundment of reservoirs. Winton, R et al. [10] sampled a large suite of biogeochemical water quality parameters in central and southern Zambia in 2018 and 2019 to characterize seasonal changes in water quality in response to large hydropower dams. Alvarez Xana et al. [11] investigated the environmental effects of four small hydropower plants in northwestern Spain. Tomczyk Pawel and Wiatkowski Miroslaw [12] studied the effects of hydropower plants on the physicochemical parameters of the Bystrzyca River in Poland. Peng Chunlan et al. [13] analyzed inter-annual and intra-annual variation characteristics of water quality indicators before and after the impoundment of the Three Gorges Reservoir. Xue Lianfang et al. [14] compared water quality of the reservoir before and after construction of the cascade hydropower system in the main course of the Hongshui River. Ba Chongzhen et al. [15] used SPSS software to analyze water quality monitoring data of the Manwan and Dachaoshan hydropower stations on the main course of the Lancang River. There are obvious differences in different watersheds because of different geographical location, climate factors, and so on. In addition to the characteristics of randomness, water quality is also affected by factors such as air and water temperature, rainfall, and sediment content [16]. Therefore, directly analyzing the results of water quality monitoring may cause the results to be inconsistent with the actual situation. To solve this problem, some scholars construct mathematical models to conduct research. Huang Yue et al. [17] used the differential autoregressive integrated moving average (ARIMA) model to predict the quality of the inflow and outflow after the Three Gorges Project began operating. Both Hu Guohua et al. [18] and Wu Jianing et al. [19] applied the seasonal Kendall method to analyze trends in water quality in the Xiaolangdi Reservoir of the Yellow River and the lower reach of the Dongjiang River. However, these mathematical models only examine water quality trends and cannot accurately analyze the causal relationship between water quality changes and hydropower development.
Regression discontinuity analysis was developed by Thistlethwaite and Campbell in 1960, which is the best tool if we care about causal effects. As a statistical method, this approach can efficiently analyze data and is widely used in effect assessment and causality relationships in many fields. Though it did not attract much attention when it was first proposed, regression discontinuity analysis has been widely applied since it was theoretically proven by Hahn et al. in 2010 [20,21,22,23]. This method is widely used not only in sociology and economics [24,25,26] but also in ecology and environment studies. By the regression discontinuity method, Ying et al. [27] investigated the spatiotemporal patterns of the global warming, and Auffhammer et al. [28] studied the effects of gasoline content regulation on air quality. Judith et al. [29] demonstrated the use of regression discontinuity as a statistical technique to model ecological thresholds. Referring to the effectiveness of the “River Chief System” policy of Wanhua Li et al. [30], we adopt the regression discontinuity method to estimate the effect of cascade hydropower development.
In addition to regression discontinuity analysis, the following methods are often used to analyze water quality: Kendall method, PCA (principal component analysis), and ANOVA (variance analysis). Among them, Kendall method has obvious advantages in water concentration prediction, PCA helps to identify the main influencing factors, and ANOVA is mainly used to analyze what factors affect water quality. Compared with the previous three methods, regression discontinuity analysis is more suitable for analyzing the impact of a policy on environment. However, the result of the regression discontinuity analysis is the average causal effect at the discontinuity point, which cannot accurately simulate the water quality.
Currently, the six hydropower stations on the main course of the middle reach of the Jinsha River have been in joint operation for seven years, and the influence of cascade hydropower development in the basin on water quality has begun to appear. Therefore, our research will achieve the following objectives: Firstly, water quality changes on the middle reach of the Jinsha River will be analyzed. Secondly, the causal relation between water quality and cascade hydropower development will be found. Thirdly, a theoretical basis for water quality protection will be provided.
2. Data and Model
2.1. Study Site
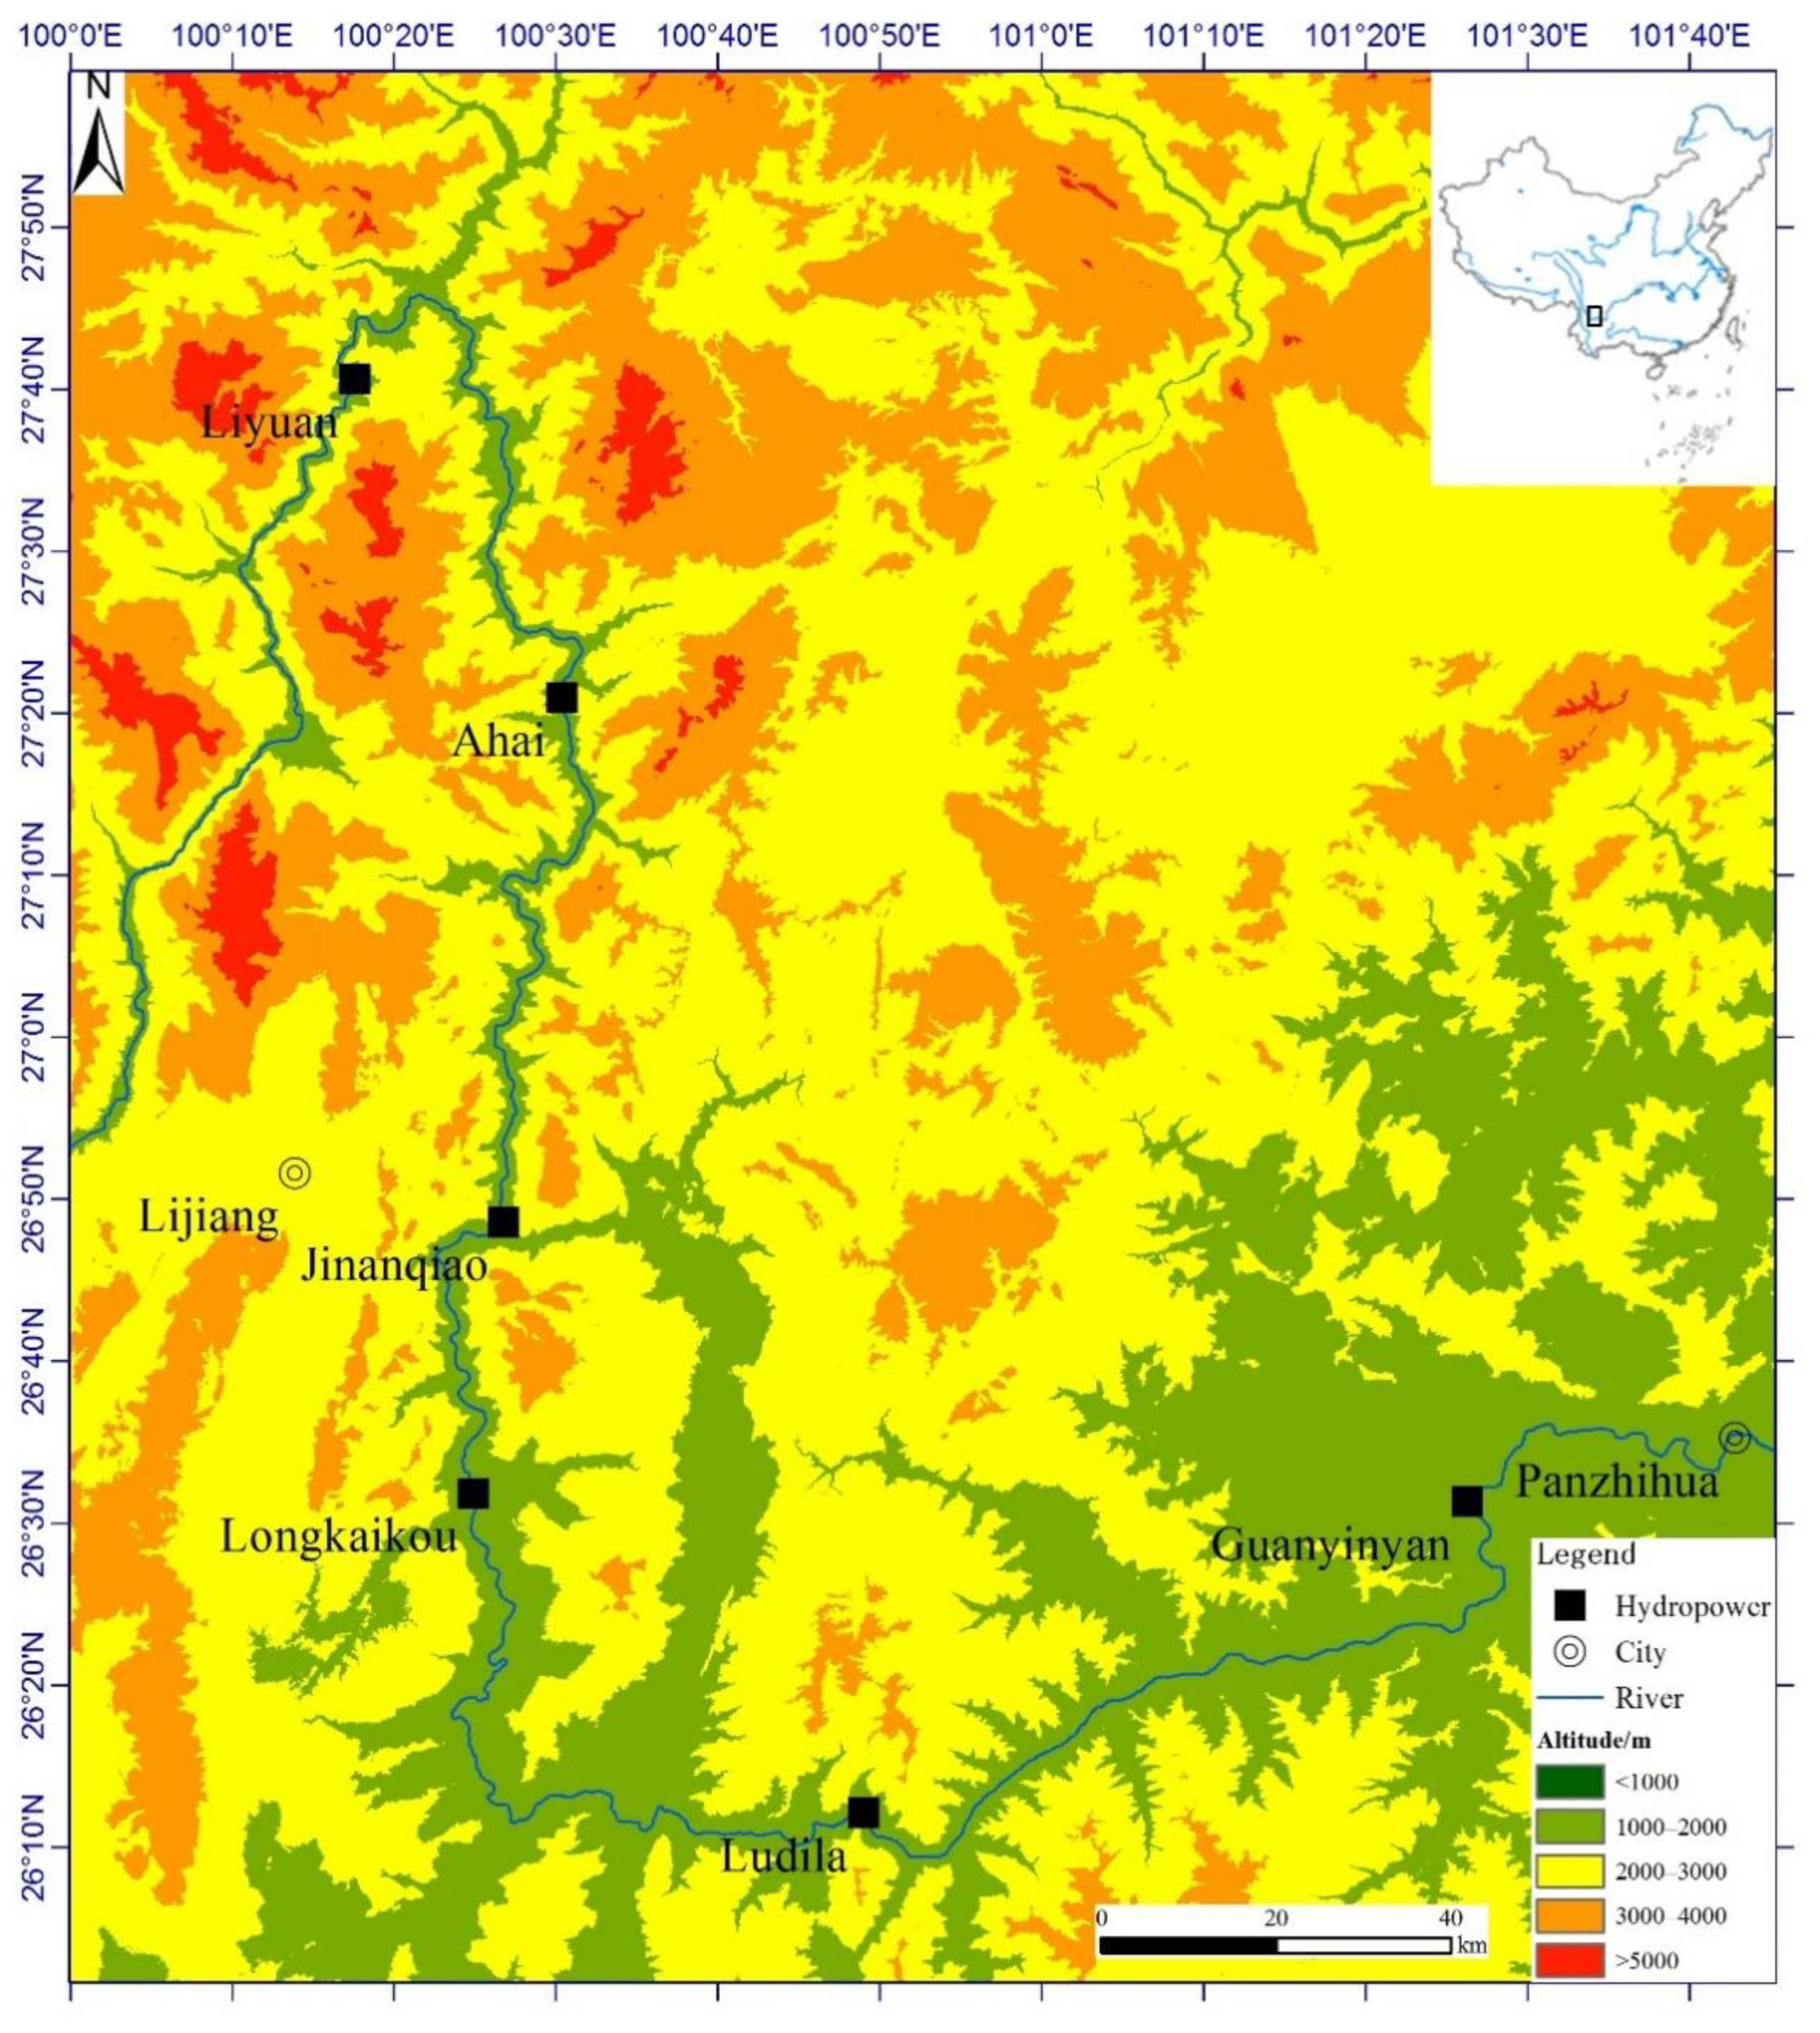
The Jinsha River, on the upper reaches of the Yangtze River, is divided into three sections: the upper reach above Shigu, the middle reach from Shigu to the junction of the Yalong River estuary, and the lower reach from the confluence of the Yalong River to Yibin. The middle reach of the Jinsha River has a total length of 563.5 km, a drop of 837.9 m, and an average gradient of 1.49‰. There are eight planned hydropower stations, including Longpan, Liangjiaren, Liyuan, Ahai, Jin’anqiao, Longkaikou, Ludila, and Guanyin [31]. At present, except for the Longpan and Liangjiaren reaches, which are still in the program comparison stage, the remaining six hydropower stations have ready been impounded and are operating (Table 1, Figure 1).
2.2. Water Quality Indicators and Data Sources
In China, chemical oxygen demand and ammonia–nitrogen, which are the most important water quality indicators, are the total control index of water pollutants. Total phosphorus is an index of eutrophication in lakes and reservoirs. In general, increase of the total phosphorus concentration means increased risk of eutrophication in lakes and reservoirs. Therefore, the three water quality indicators, CODMn, NH3-N, and TP, were selected as the representative indicators of the study reaches. The years of these monitoring data are 2004 to 2019. There are six monitoring sections: the Liyuan, Ahai, Jin’anqiao, Longkaikou, Ludila, and Guanyinyan dam sites. The monitoring data before operation of the hydropower station began derived mainly from the Environmental Impact Report of that hydropower station, which were discontinuous and were generated about three times a year. The monitoring data after operations began came mainly from the Investigation Report on Environmental Protection Acceptance of Completion of the hydropower station and routine monitoring data from the cascade hydropower station, which were generated about once a month. (Table 2)
The temperature monitoring data in 2004–2019 were from the Lijiang Meteorological Station, which were monitored daily and then averaged monthly. The Lijiang Meteorological Station is near the middle reach of the Jinsha River. The data were obtained from the U.S. National Oceanic and Atmospheric Administration (NOAA) and the National Center for Environmental Information (NCEI) (NOAA—National Centers for Environmental Information, https://www.ncei.noaa.gov accessed on 10 June 2022).
2.3. Methods and Models
The regression discontinuity method assumes that there is a treatment variable, if the running variable is greater than a certain critical value, then the treatment variable is 1, otherwise it is 0. In this study, hydropower development (Dt) was the treatment variable, and time (t) was the running variable. Since the impact of hydropower development on the hydrological and hydraulic conditions of the river starts from the impoundment of the hydropower station, the time (t0) of the impoundment of the hydropower station was used as a certain critical value to study. When t < t0, Dt is 0, indicating that the power station does not store water; when t ≥ t0, Dt equals to 1, indicating that the power station has stored water (Equation (2)). Dt is a dimensionless variable. Based on the above methods of regression discontinuity, the model constructed in this study is shown in Equation (1).
where Ct is the result variable, which refers to the concentration of pollutants such as CODMn, NH3-N, and TP of the hydropower station in month t, t is the running variable, which is time in this study, and the unit is month; t0 is the time of the impoundment of the power station; t − t0 indicates how many months the current time is from the time of the impoundment of the power station. Both βi and γi are the correlation coefficient of the running variable. Dt is the treatment variable, and the subscript t represents the time. α is the correlation coefficient of the treatment variable. Xjt is other covariate, δj is the correlation coefficient of other covariates. εt is random error, and μ is a constant term.
The regression discontinuity method focuses on the regression coefficient α of the treatment variable. When α is negative, it represents a negative correlation between hydropower development and pollutant concentration, and when α is positive, it represents a positive correlation between hydropower development and pollutant concentration.
Water quality is affected not only by hydropower development but also by other factors such as water temperature, rainfall, sediment content, etc., among which water temperature has an important impact on water quality. Therefore, at higher water temperatures, most chemical reactions and bacteriological processes progress faster, which would change the water’s self-clarification ability [32,33,34,35,36,37]. The water temperature of the research area is affected by hydropower development and air temperature. Because the effect of hydropower development is reflected in the Dt variable, air temperature was selected as a covariate in the regression discontinuity model used in this study, which also reflects seasonality.
In this study, the regression discontinuity procedure was as follows: Firstly, the data were sorted out and classified into pre-hydropower development and post-hydropower development. Secondly, a figure of the result variable with the treatment variable was plotted to help us analyze whether there was a discontinuity point. Thirdly, the data were regressed on both sides of the discontinuity point by the Stata software.
3. Results
3.1. Monitoring Results of Water Quality Indicators
In China, CODMn, NH3-N, and TP have different water quality standards. The current surface water standard in China is “Environmental Quality Standard for Surface Water” (GB3838-2002) [38], which divides water quality into five categories: Class I, Class II, Class III, Class IV, and Class V. According to the Functional Zoning of Surface Water and Water Environment in Yunnan Province (2010–2020) [39], the water environment functions in the middle reach of the Jinsha River include industrial water, agricultural water, and drinking water, and the water quality standards of Class II are implemented, in which TP adopts Lake Standards (Table 3). The Stata software (Version 15.1) was used for analysis.
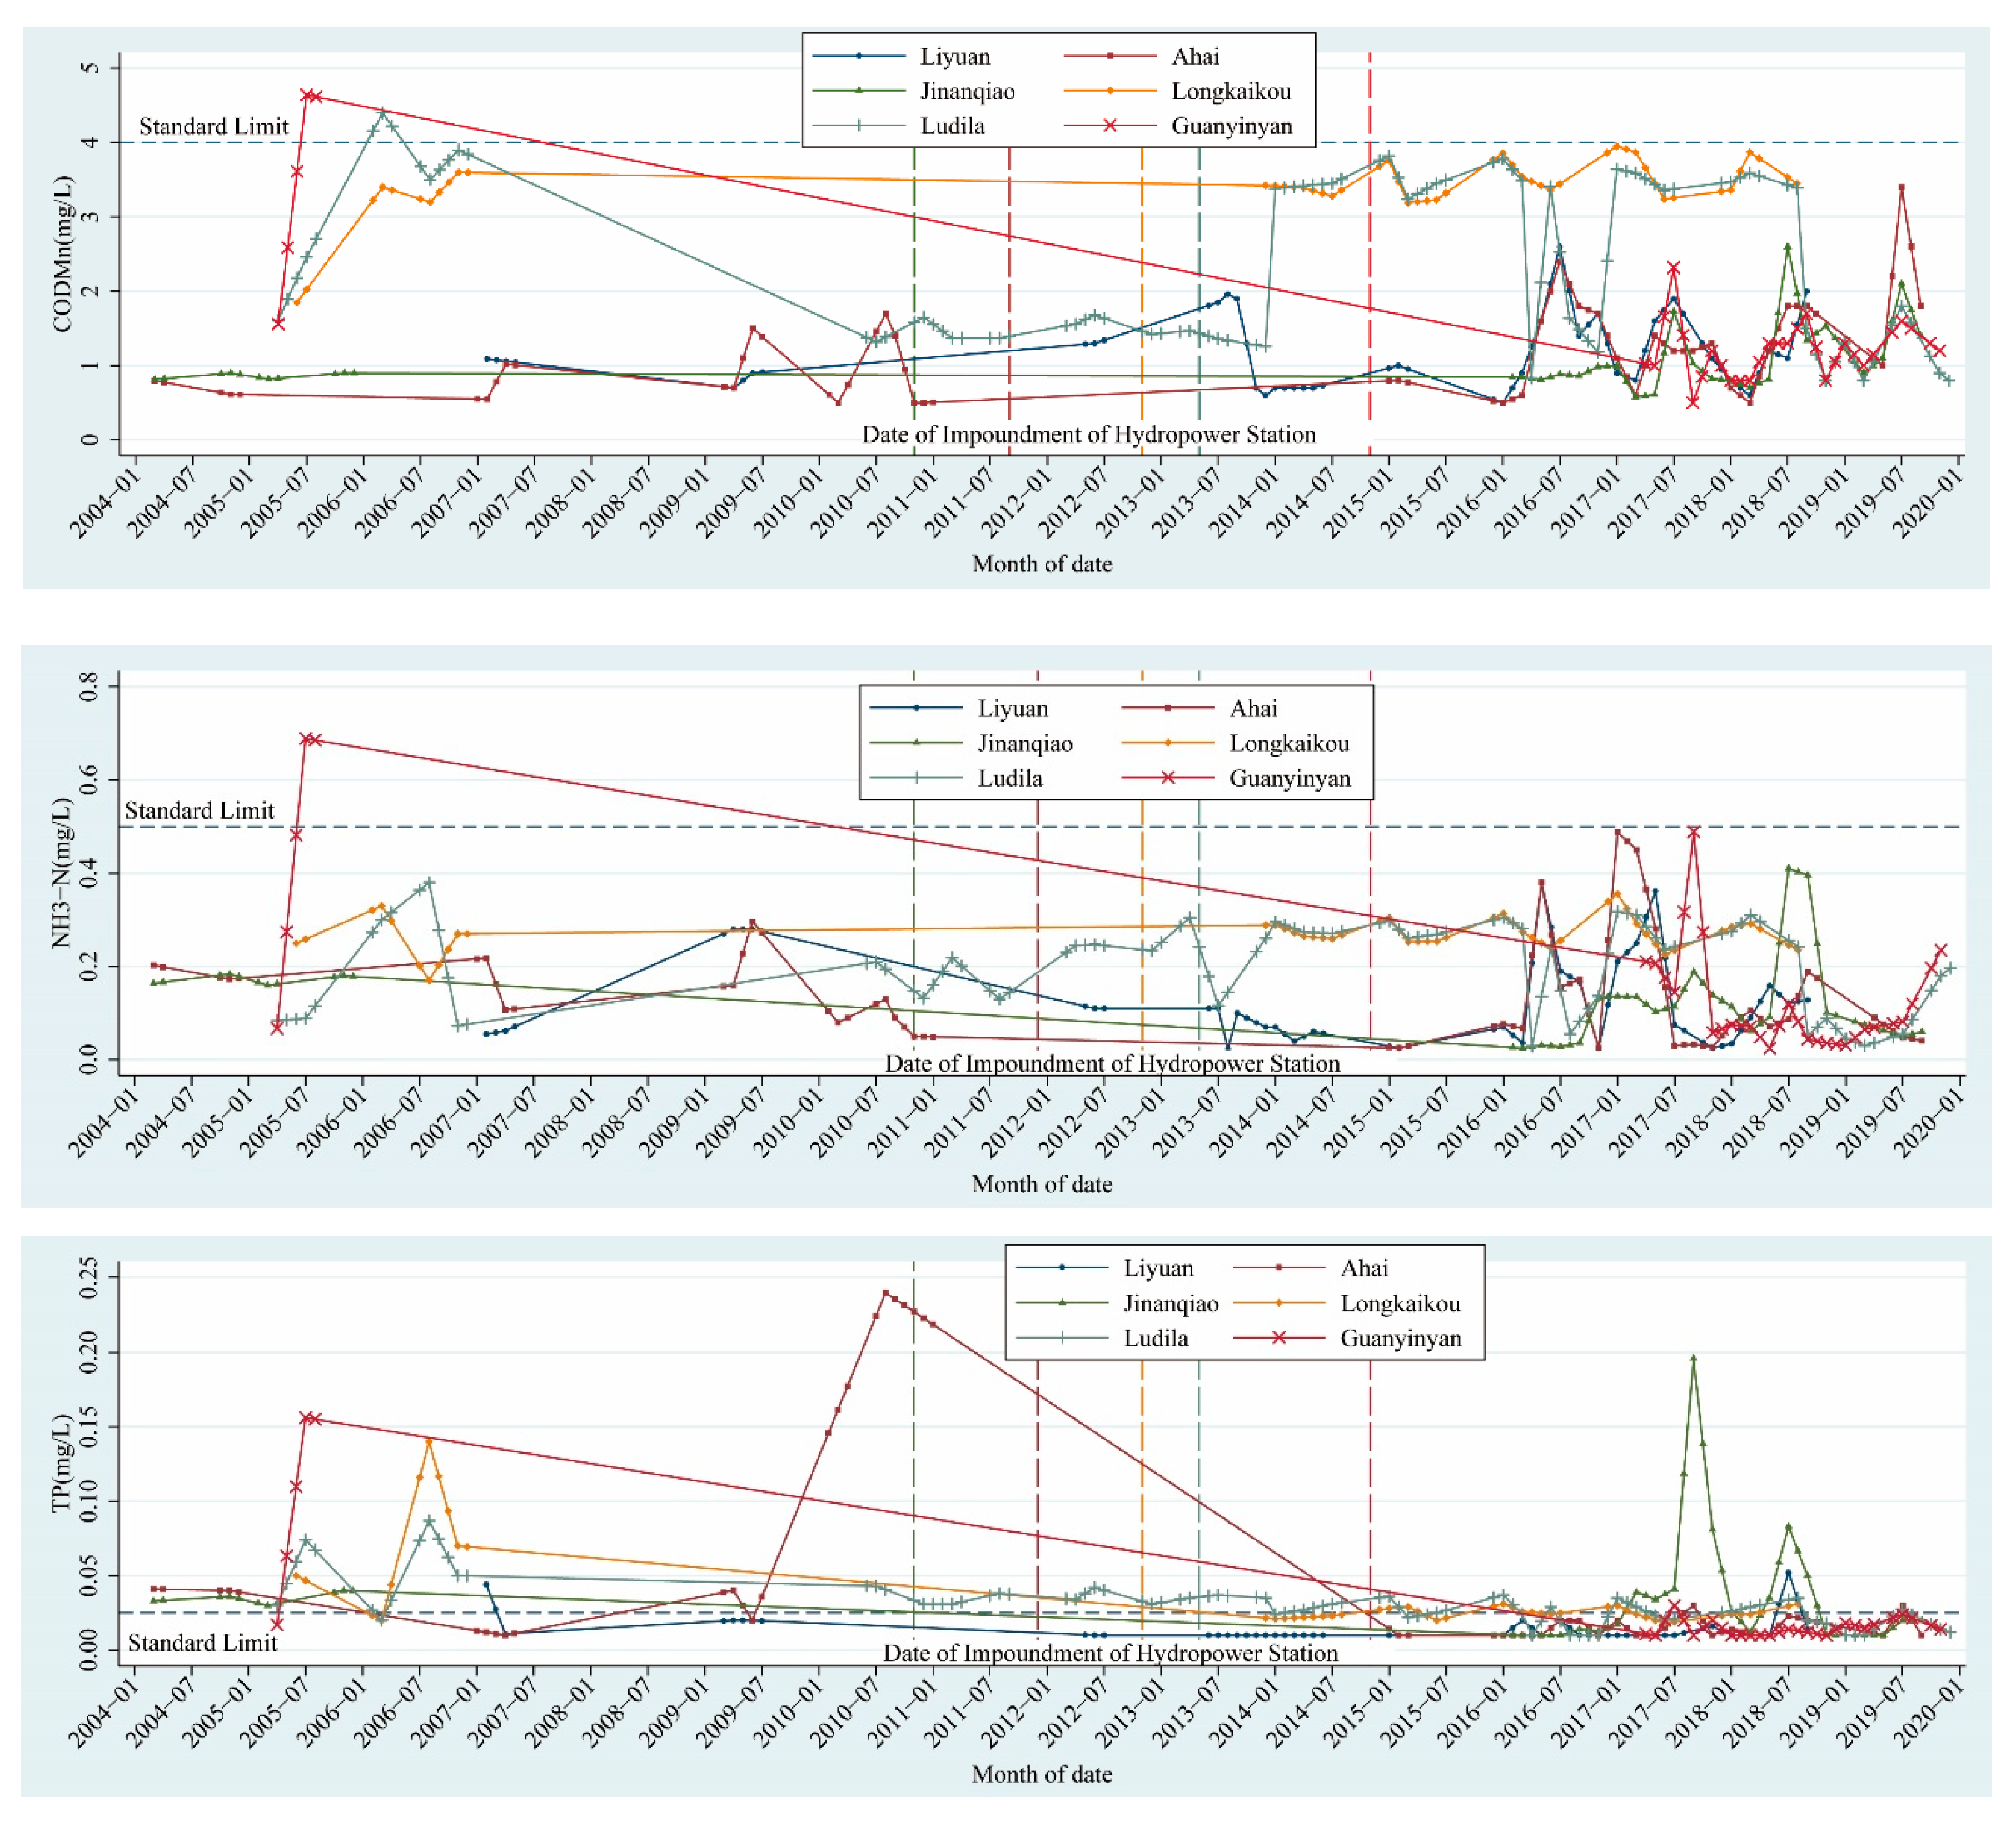
This study collected and analyzed the water quality monitoring data for six hydropower stations on the middle reach of the Jinsha River before and after impoundment. (Table 4, Figure 2). From the perspective of water quality indicators, most of the CODMn and NH3-N concentrations of the six hydropower stations met the standard, and only part of the Ludila and Guanyinyan Hydropower Stations exceeded the standard by small amounts. The TP concentration of all six hydropower stations exceeded the standard ranging from 3.3% to 100%, and the maximum exceeding multiple was 0.2–8.6 times.
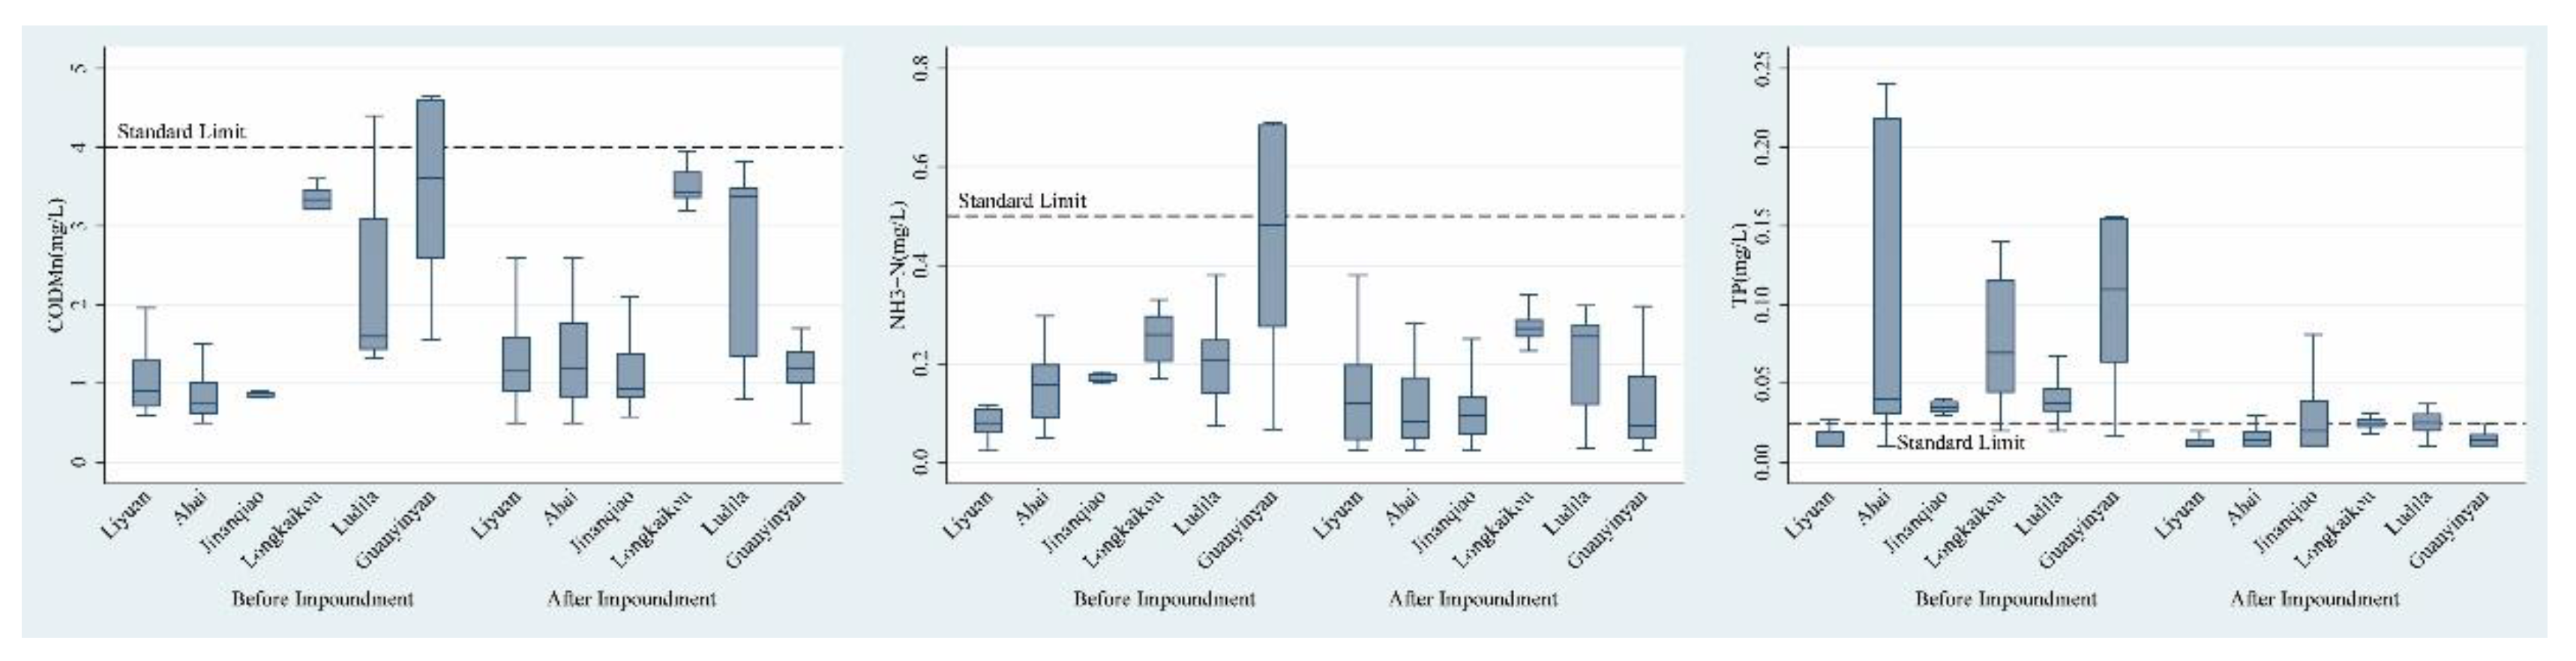
According to time distribution, the average CODMn concentration of each hydropower station before impoundment was 0.9–3.4 mg/L, and the average CODMn concentration of each hydropower station after impoundment was 1.1–3.5 mg/L; the average NH3-N concentration of each hydropower station before impoundment was 0.12–0.44 mg/L, the average NH3-N concentration of each hydropower station after impoundment was 0.12–0.27 mg/L; the average TP concentration of each hydropower station before impoundment was 0.014–0.1 mg/L, and the average TP concentration of each hydropower station was 0.014–0.035 mg/L. The average CODMn concentration at Liyuan, Ahai, Jin’anqiao, Longkoukou, and Ludila increased after impoundment; the average CODMn concentration at Guanyinyan decreased after impoundment. The average NH3-N concentration increased at Liyuan, Longkoukou, and Ludila increased after impoundment; the average NH3-N concentration decreased after impoundment at Ahai, Jin’anqiao, and Guanyinyan. The average TP concentration at Ahai, Longkaikou, Jin’anqiao, Ludila, and Guanyinyan decreased after impoundment; the average TP concentration at Liyuan and Jin’anqiao remained unchanged. Overall, after impoundment, the average concentrations of CODMn and NH3-N at different power stations increased or decreased, but the average concentration of TP remained unchanged or decreased.
Spatially, the three water quality indicators generally showed a trend of gradual deterioration from upstream to downstream. Before impoundment, the average concentration of CODMn at Liyuan Hydropower Station was 1.1 mg/L, the average concentration of NH3-N was 0.12 mg/L, and the average concentration of TP was 0.014 mg/L. The average concentration of CODMn at Guanyinyan Hydropower Station was 3.4 mg/L, the average NH3-N concentration was 0.44 mg/L, and the average TP concentration was 0.1 mg/L. After impoundment, the average concentration of CODMn at Liyuan Hydropower Station was 1.3 mg/L, the average concentration of NH3-N was 0.13 mg/L, and the average concentration of TP was 0.014 mg/L; while the average concentration of CODMn at Longkou Hydropower Station was 3.5 mg/L, the average NH3-N concentration was 0.27 mg/L, and the average TP concentration was 0.25 mg/L (Figure 3).
3.2. Seasonal Variations in Water Quality Indicators
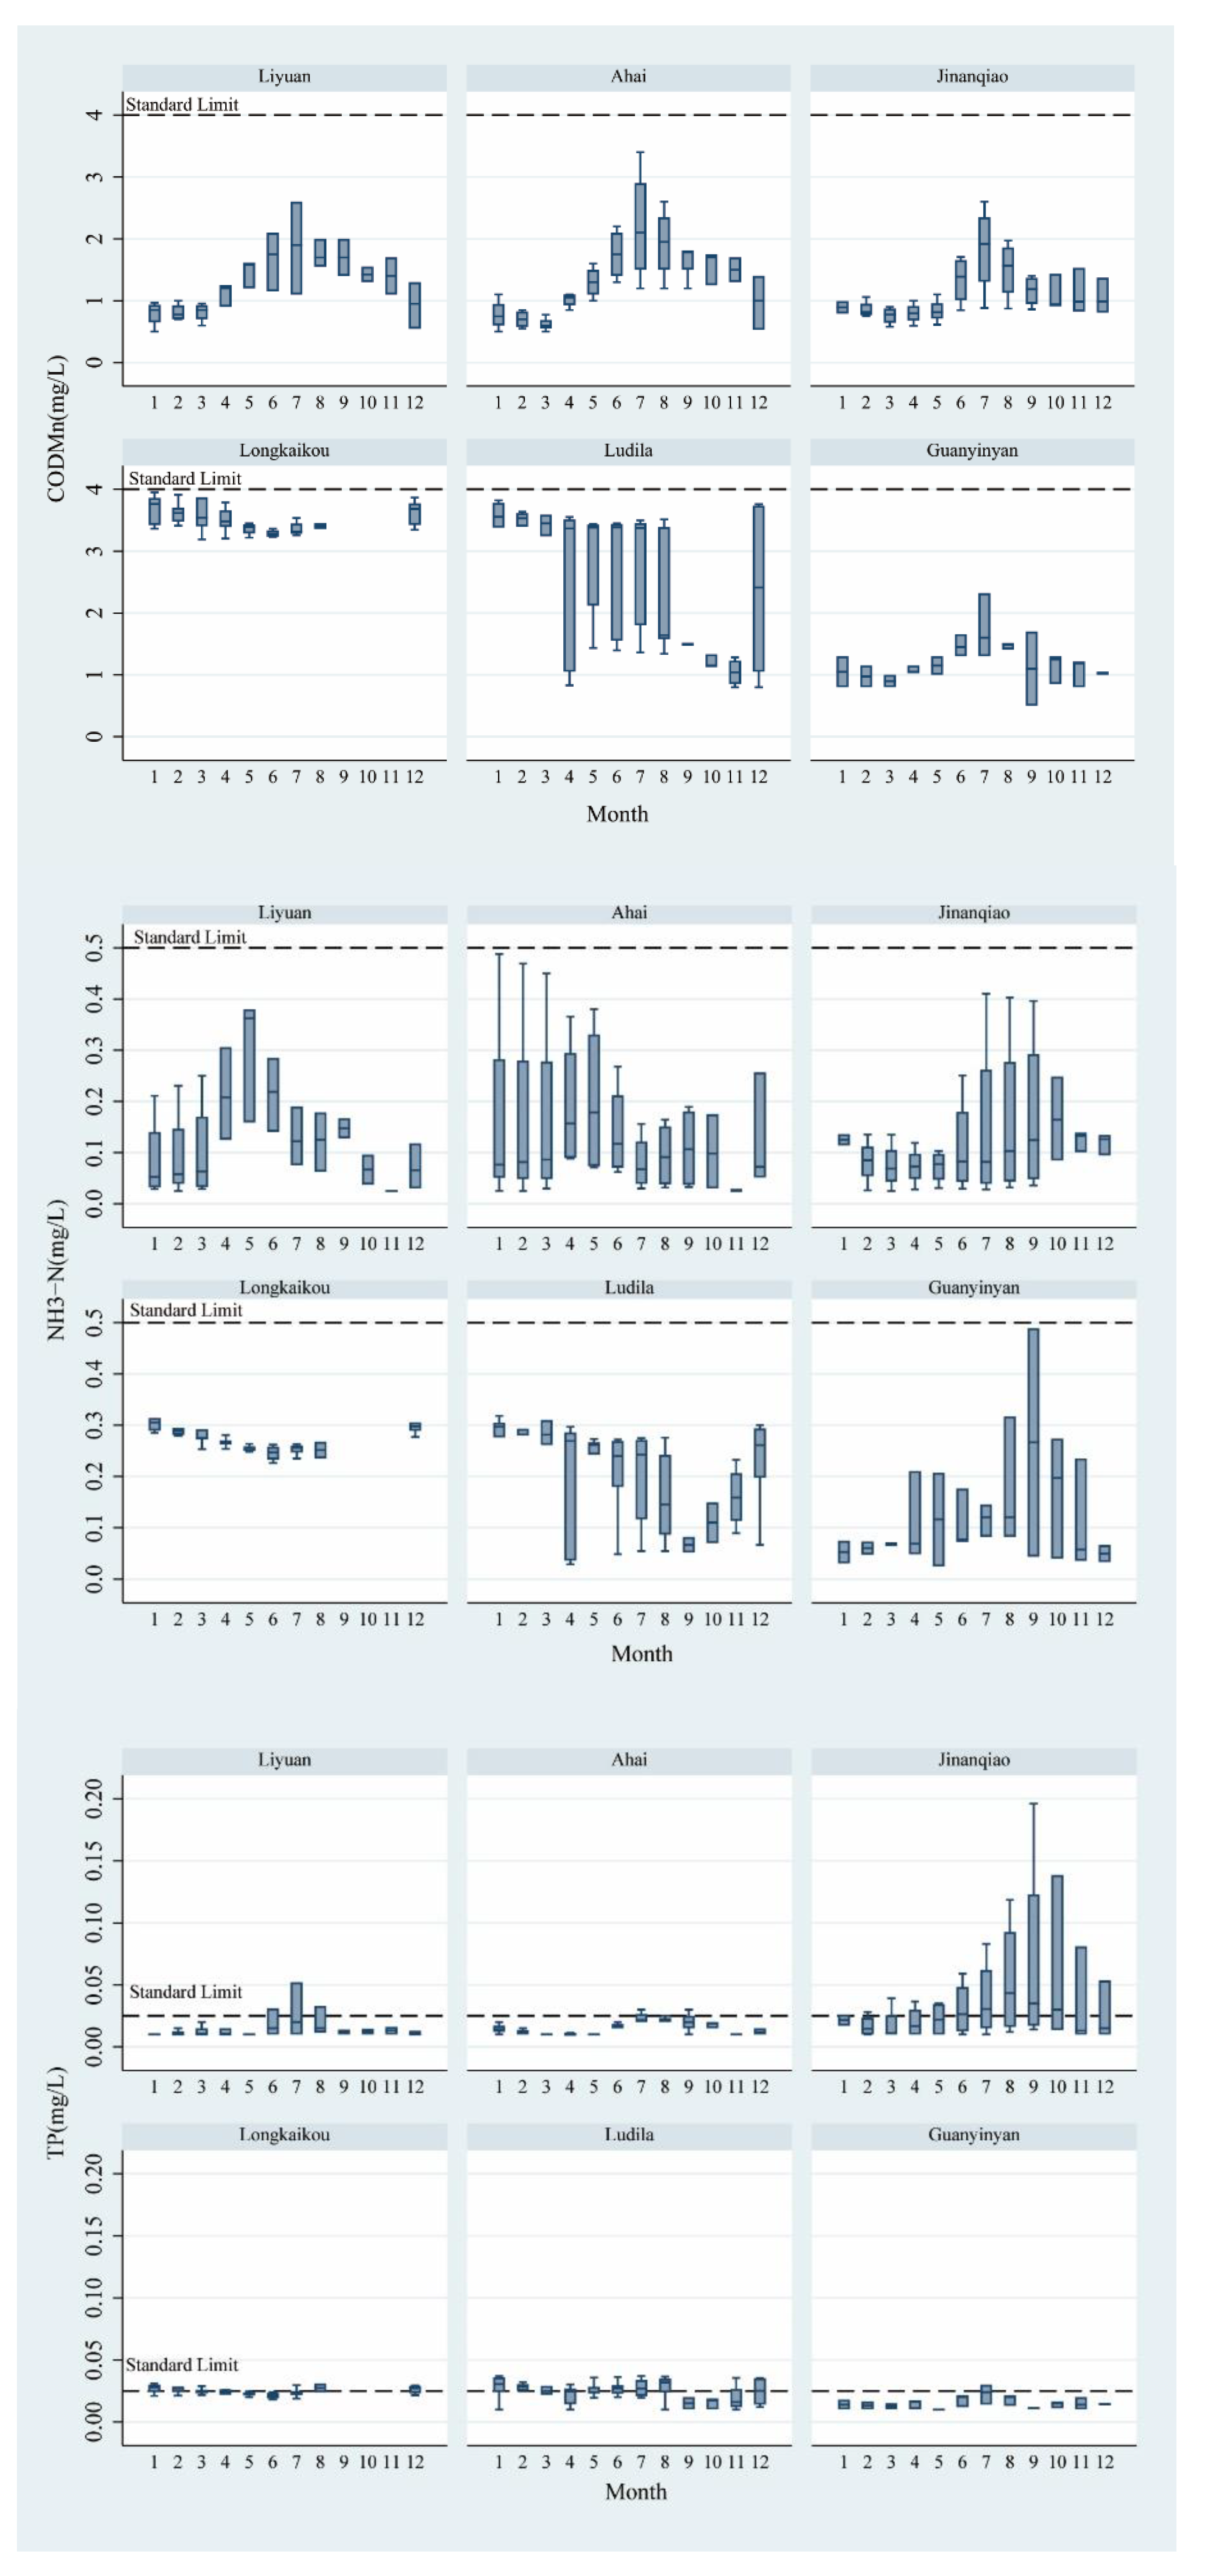
According to monthly changes in pollutant concentrations at each cascade hydropower station after the hydropower development along the main course of the Jinsha River (Figure 4), the CODMn and TP concentrations had obvious seasonal variation at Liyuan, Ahai, Jin’anqiao, and Guanyinyan. Seasonal variation of CODMn and TP concentrations was not obvious at Longkaikou and Ludila. Specifically, as for the hydropower stations at Liyuan, Ahai, Jin’anqiao, and Guanyinyan, the CODMn concentration was generally higher from May to November and lower from December to April of the following year; the TP concentration was generally higher from June to October and lower from November to May of the following year. The NH3-N concentration at Liyuan was higher from April to September and lower from October to March of the following year. The seasonal distribution characteristics of NH3-N concentrations showed no obvious trend at the other five hydropower stations.
3.3. Correlation Analysis
Statistical analysis of the correlation of variables (Table 5) showed that the correlation coefficient between the treatment variables of hydropower development and the TP index was significantly negative. We preliminarily conclude that hydropower development is negatively correlated with TP concentration. The correlation coefficient between the treatment variables of hydropower development and CODMn index was significantly positive. We tentatively conclude that hydropower development is positively correlated with CODMn concentration. The correlation coefficient between the treatment variables of hydropower development and NH3-N was negative but not significant, so it is impossible to judge directly whether hydropower development caused the apparent change in NH3-N concentration. Certainly, the direct correlation analysis here was just a preliminary study, and the final result depended on the regression discontinuity analysis.
3.4. Regression Discontinuity
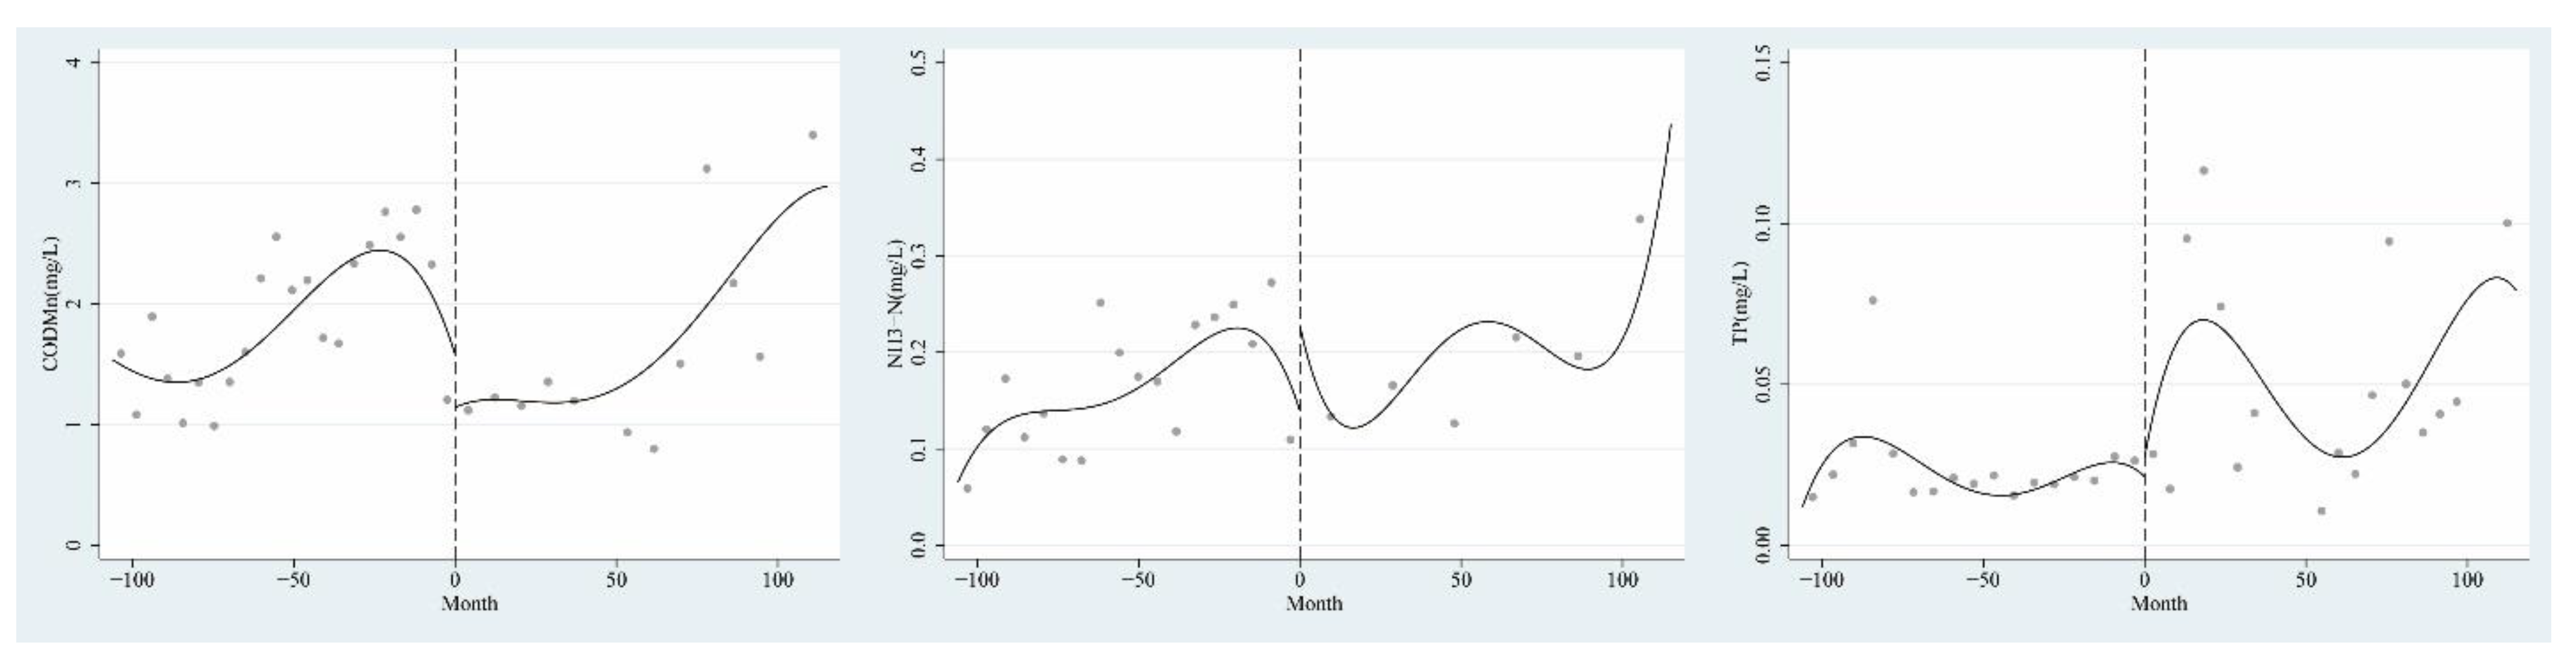
In the graph of regression discontinuity (Figure 5), the horizontal ordinate is the running variable value, which represents the value of the monitoring time subtracted from the impoundment time of the hydropower station. Therefore, the values on the left side of the 0 point on the horizontal ordinate are monitoring data obtained before hydropower development, and the values on the right side of the 0 point are monitoring data obtained after hydropower development. The ordinate of the graph is the concentration of CODMn, NH3-N, and TP. It can be seen from Figure 5 that all three indicators of CODMn, NH3-N, and TP have an obvious discontinuity point at 0 point. According to the construction assumption of the regression discontinuity model, if the running variable is continuous but the result variable jumps at the discontinuity point, it can be concluded that the treatment variable caused the result variable to jump. The running variable time in this study was itself continuous. The result variable was the concentration of CODMn, NH3-N, and TP, and the treatment variable was hydropower development. Therefore, the discontinuity point can indicate that hydropower development led to a marked increase in the concentrations of CODMn, NH3-N, and TP, proving that cascade hydropower development on the middle reach of the Jinsha River has had a significant impact on water quality.
All the estimation results were significant (Table 6), and the concentrations of CODMn, NH3-N, and TP all jumped at the discontinuity point. In order to exclude the influence of other covariates on water quality, the air temperature was chosen as a covariate to use in regression discontinuity analysis, then all the results were still significant. The concentration of the three indicators still jumped at the discontinuity points after adding covariates. It can be concluded that hydropower development has a significant impact on the concentrations of CODMn, NH3-N, and TP. Regardless of whether covariates were added or not, the correlation coefficients corresponding to TP were negative, while the correlation coefficients corresponding to CODMn and NH3-N were positive. This is consistent with the results of variable correlation analysis.
Through analysis of the monitoring date, hydropower development led to a decrease of 0.034 mg/L in the TP concentration. Although the absolute value of the influence of hydropower development on TP concentration was small, because the standard limit of TP in the research river section was only 0.025 mg/L, the impact of hydropower development on TP concentration was as high as 1.36 times the standard limit value. Therefore, we can conclude that cascade hydropower development on the middle reach of the Jinsha River has greatly influenced the concentration of TP and that it has a strong negative correlation with the concentration of TP.
Similarly, hydropower development led to an increase in the concentration of CODMn by 0.934 mg/L and of NH3-N by 0.179 mg/L. The standard limit of CODMn in the research river section was 4 mg/L, and the standard limit of NH3-N was 0.5 mg/L. The impact of hydropower development on the CODMn concentration was 0.23 times the CODMn standard limit, and the impact on the NH3-N concentration was 0.36 times the NH3-N standard limit. Therefore, it can be said that cascade hydropower development on the middle reach of the Jinsha River has a weak positive correlation with the CODMn and NH3-N concentrations. Through analysis of the absolute value of the correlation coefficient, it was determined that hydropower development on the middle reach of the Jinsha River has slightly increased the concentration of CODMn and NH3-N limit. The maximum concentrations of CODMn and NH3-N were 3.5 and 0.44 mg/L, respectively, while the standard limits of CODMn and NH3-N were 4 and 0.5 mg/L. Thus, there is a risk that the above two indicators will exceed the standard values in the future.
4. Discussion
4.1. Influence of Cascade Hydropower Development on Water Quality
This study focuses on the impact of cascade hydropower development on water quality and uses discontinuity regression to analyze water quality monitoring data before and after the construction of six hydropower stations on the middle reach of the Jinsha River. The results of regression discontinuity show that cascade hydropower development on the middle reach of the Jinsha River had different impacts on three water quality indicators, including CODMn, NH3-N, and TP. Hydropower development had a strong negative correlation with TP concentration, and a weak positive correlation with concentrations of CODMn and NH3-N.
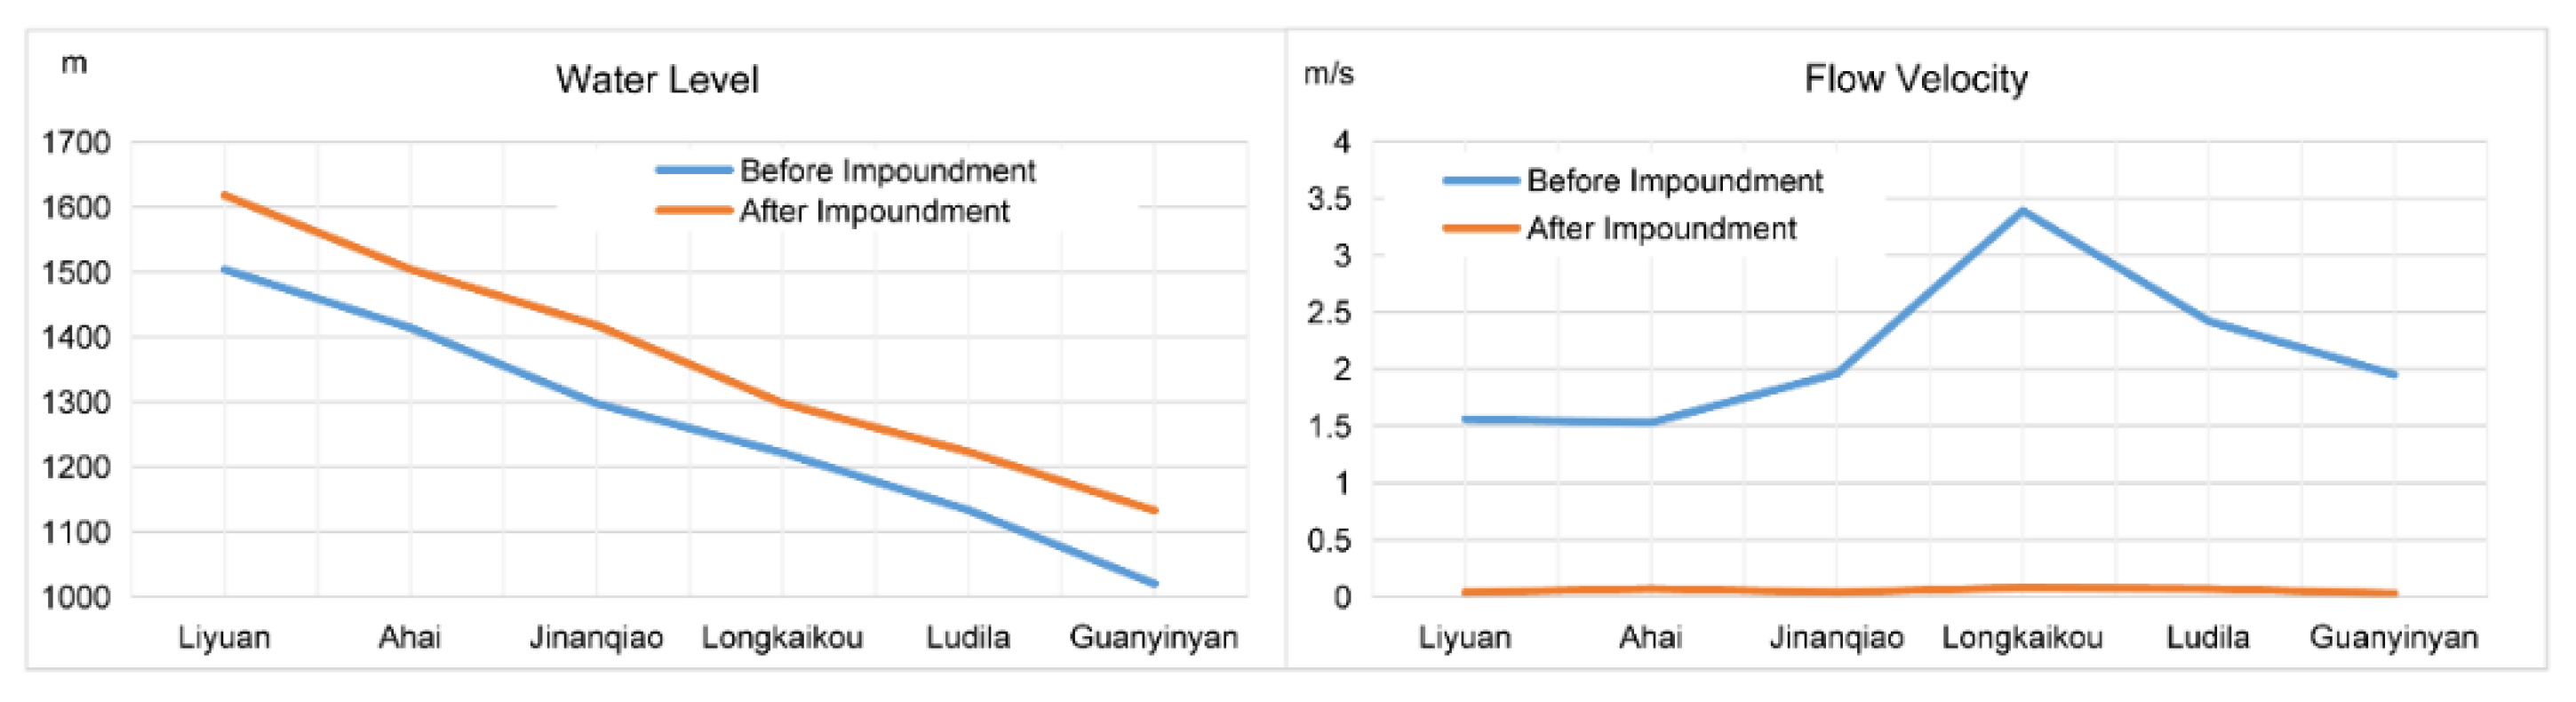
Among cascade hydropower stations located on the middle reach of the Jinsha River, four are daily adjustment hydropower stations and two are weekly adjustment stations (Table 1). Therefore, flow and water volume processes show little change, but water level and flow velocity changed greatly after cascade hydropower development on the middle reach of the Jinsha River (Figure 6). The water levels were 1020 to 1503 m before cascade hydropower development and 1132 to 1618 m after cascade hydropower development. The flow velocities were 1.53 to 3.39 m/s before cascade hydropower development and 0.03 to 0.08 m/s after cascade hydropower development. According to research conducted by Li Jinxiu et al. [40], increasing water depth and decreased flow velocity can cause reduction of the reoxygenation coefficient of the water body, which will be unfavorable for the attenuation of pollutant concentrations in the river. When sedimentation increases, pollutants settle together with the sediment, which is beneficial to the reduction of pollutant concentrations in the river. Ultimately, the concentration of pollutants increases or decreases depending on the predominant mechanism.
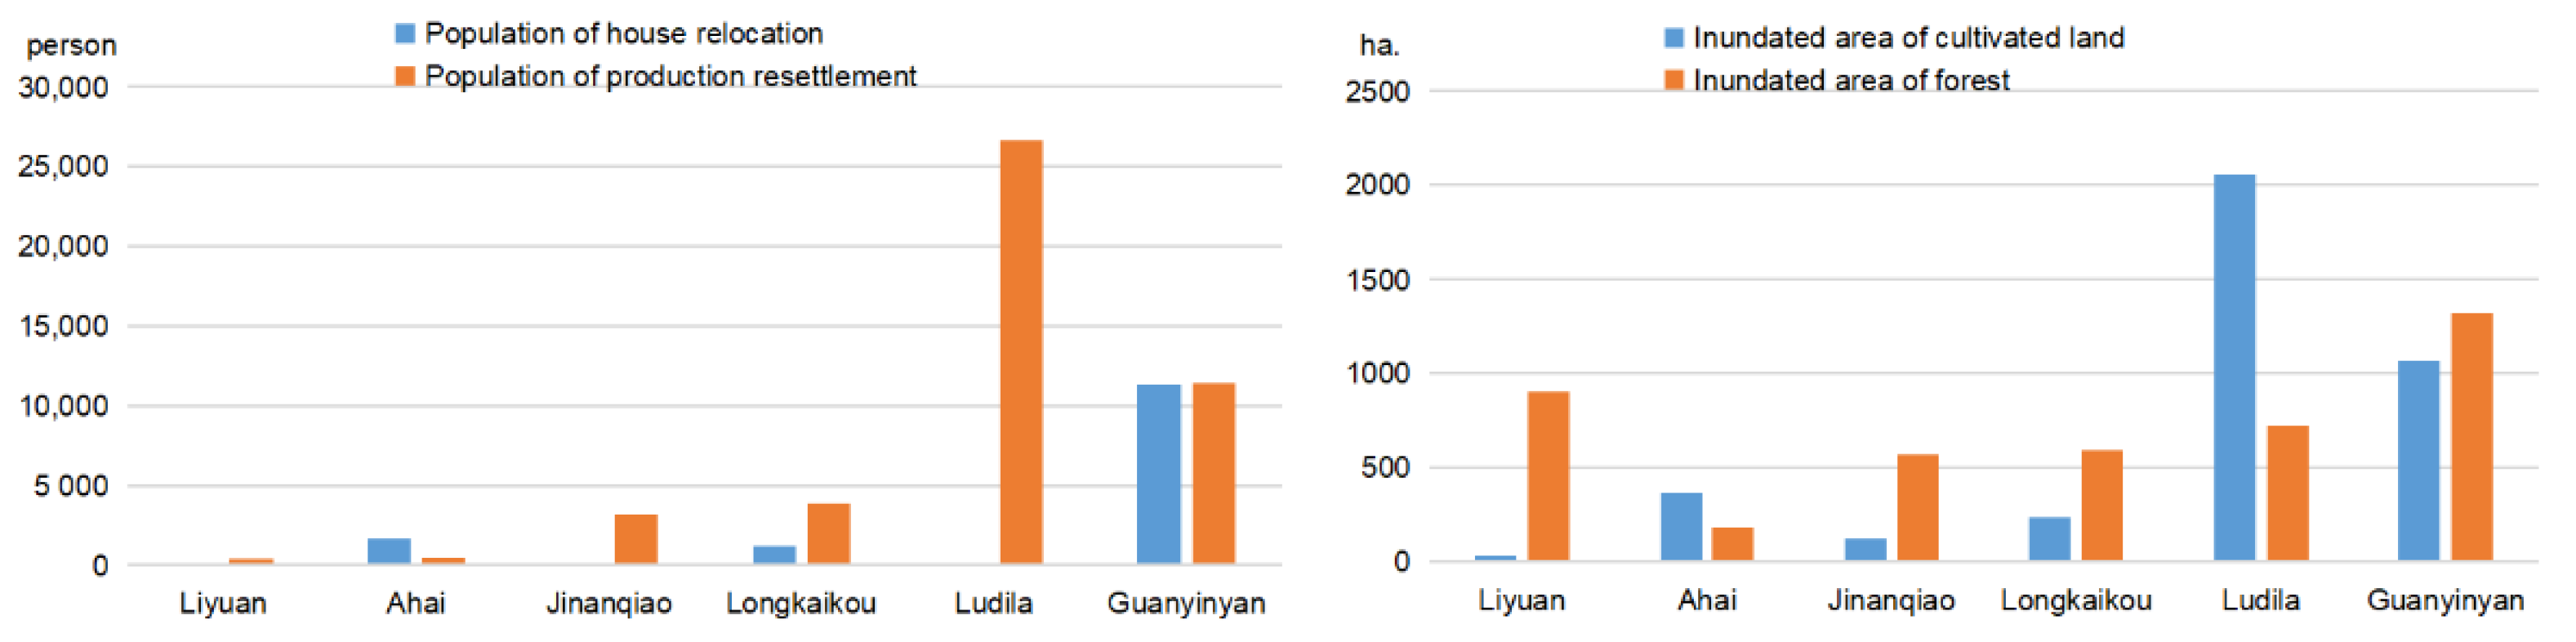
In addition to changes in water flow, hydropower development also affects pollution sources in the reservoir area, and pollution sources will also lead to changes in water pollutant concentrations. Firstly, after the cascade hydropower development of the Jinsha River, the original inhabitants of the reservoir area were relocated and resettled (Figure 7). Complete sewage treatment and water and soil conservation measures have been undertaken in the resettlement areas. Compared with the previous extensive production and lifestyle, pollutants entering the river will be reduced. Secondly, hydropower development will drive economic and social development of the reservoir area, which in turn will increase the discharge of pollutants. The middle reach of the Jinsha River includes thirteen counties in five prefectures in the Sichuan and Yunnan provinces. Before the development of hydropower, economic development in this rural area was relatively slow, and there were essentially no major industrial pollution sources except for Panzhihua City in southern Sichuan, which is downstream of the Guanyinyan Hydropower Station. Therefore, the pollution in the reservoir area mainly derived from agricultural non-point sources and domestic pollution sources before the development of hydropower. However, after the development of hydropower, the regional economy has become well developed. According to the research of He Xiaorong et al. [41], after the development of cascade hydropower on the middle reach of the Jinsha River, the main sources of pollutants in the river now are tourism, shipping, domestic sources, and agricultural non-point sources. Finally, after the cascade reservoirs were impounded on the Jinsha River, residual pollutants in submerged cultivated land and forests have been gradually released (Figure 7), also leading to increased pollutants in the water body [42]. In summary, although pollution prevention and control measures in the submerged area improved during the construction of hydropower stations, the total amount of pollutants flowing into the middle reach of the Jinsha River after cascade hydropower development is generally on the rise due to the influences of hydropower development on the regional economy and society.
According to correlation coefficient analysis of the regression discontinuity, cascade hydropower development on the middle reach of the Jinsha River has a strong negative correlation with TP concentration. On the Jinsha’s middle reach, although the total amount of TP pollutants discharged into the river increased, at the same time, the degradation capacity of the water body decreased and the TP concentration decreased, due to the deposition of TP with a large amount of sediment after the impoundment of the hydropower station. This result is consistent with the research of Lou Baofeng et al. [43] on the concentration of TP with sediment deposition before and after the impoundment of the Three Gorges Reservoir, who noted that the decrease in TP concentration can reach 61–65%. Therefore, we believe that increased sedimentation caused by cascade hydropower development on the middle reach of the Jinsha River is the principal reason for the noted decrease in TP concentration.
Furthermore, according to correlation coefficient analysis of the regression discontinuity, cascade hydropower development on the middle reach of the Jinsha River has a weak positive correlation with concentrations of CODMn and NH3-N. According to the previous analysis, the total amount of CODMn and NH3-N flowing into rivers experiencing regional economic and social development increases after hydropower development. However, different from the case of TP, the effect of CODMn and NH3-N with sediment settlement is not so obvious. From the results, we conclude that hydropower development led to increased CODMn and NH3-N concentrations. Therefore, we believe that the regional economic and social development brought by cascade hydropower development on the middle reach of the Jinsha River is the principal source of increased CODMn and NH3-N concentrations.
4.2. Seasonal Variations
According to monthly variations in water quality indicators, at four of the six hydropower stations on the middle reach of the Jinsha River, CODMn concentrations are higher from May to November and lower from December to April of the following year, and TP concentrations are higher from June to October and lower from November to May of the following year, which may be the result of rainfall. The uneven distribution of water resources on the middle reach of the Jinsha River, affected by the plateau monsoon regime with distinct rainy and dry seasons must also be borne in mind since water resources vary greatly throughout the year. During the rainy season (May to October), heavy rains are frequent, and pollutants enter water bodies with rainfall runoff and eventually sink into the main course of the Jinsha River, resulting in increased concentrations of pollutants. This result is consistent with the research of Lou Ba Chongzhen et al. on the main course of the Lancang River.
Seasonal variation of CODMn and TP concentrations is not obvious at Longkaikou and Ludila. The inundated land areas of Ludila are the largest from Figure 7, so the release of pollutants from the submerged land is the important factor affecting the water quality. The total storage of Longkaikou is the smallest from Table 1, so the water quality is easily affected by residual pollutants in the submerged land.
4.3. Water Quality Affected by Hydropower Development in Other Watersheds
In general, the water quality change is a complicated process after cascade hydropower development, and there are obvious differences between different watersheds. Peng Chunlan et al. [13] and Lou Baofeng et al. [43] all suggest that increased sedimentation after the impoundment of the Three Gorges Reservoir caused a decrease in TP concentration. Xue Lianfang et al. [14] believes the self-purification capacity of the water body was improved because of reservoir construction in the Hongshui River; Tomczyk Pawel and Wiatkowski Miroslaw’s [12] research result was that hydropower plants affect the physicochemical parameters of the water. In these studies, hydropower development had positive effects on water quality. However, there are some different results in other studies: research on water quality change of Dadu River showed that untreated domestic sewage around the watersheds was the main reason for water quality deterioration, while hydropower development played little role in water quality [44]. Alvarez Xana et al. [11] also think that the presence of the hydropower plants did not significantly influence the physical and chemical characteristics of the water. After Li Jinpeng et al. [45] analyzed water quality monitoring data before and after the construction of the Xiaowan Dam on the Lancang River, they argued that water quality in the reservoir area gradually worsened relative to that of natural rivers after impoundment. Winton, R et al. [10] anticipate that with agricultural intensification, urbanization, and future hydropower development in the Zambezi River Basin in Southern Africa, the number and extent of these hotspots of water quality degradation will grow in response.
The above research results show that there are watersheds with degraded water quality after hydropower development, and watersheds with improved water quality after hydropower development (Table 7). By comparing our research with the work of other scholars, we believe that the different causes of water quality changes should be investigated according to the characteristics of the watershed.
4.4. Suggestions on Water Quality Protection Measures
According to the main reasons cited for changes in the concentrations of CODMn, NH3-N, and TP pollutants, we propose three suggestions for water quality protection on the middle reach of the Jinsha River.
Firstly, local governments should take steps to control pollution sources. The main reasons for increases in CODMn and NH3-N concentrations is elevated pollutant emissions caused by economic and social development of the middle reach of the Jinsha River. While developing the economy of the reservoir area, local governments should also effectively control pollutants to increase production without escalating water pollution.
Secondly, the operating division of each hydropower station should carry out sediment transportation through reasonable scheduling. The main reason for decreased TP concentrations is enhanced sedimentation after the reservoir was impounded. TP on the middle reach of the Jinsha River is not degraded but deposited on the bottom of the reservoirs along with sediment. Therefore, the operating division of each hydropower station should transport more sediment downstream through reasonable dispatch of the cascade hydropower station, in order to mitigate phosphorus transport [46,47].
Thirdly, both local governments and operating divisions of hydropower stations should augment water quality monitoring on the middle reach of the Jinsha River. Due to the deposition of TP with sediment, a large quantity of TP pollutants accumulates at the bottom of each cascade hydropower station reservoir on the middle reach of the Jinsha River. Combined with the current situation of TP exceeding set standards during some periods, monitoring TP pollutants will be an important task for water quality conservation at cascade hydropower stations on the middle reach of the Jinsha River in the future. In addition, the maximum concentration of CODMn and NH3-N are 3.5 mg/L (the standard limit: 4 mg/L) and 0.44 mg/L (the standard limit: 0.5 mg/L), so there is a risk that the CODMn and NH3-N will exceed the standard limit in the future, and the monitoring of them should also be emphasized.
5. Conclusions
In this paper, we chose the main course of the middle reach of the Jinsha River as the subject of our research to analyze water quality monitoring data before and after construction of hydropower stations, using the regression discontinuity method. The results lead us to the following conclusions:
- The concentration of CODMn and NH3-N at each hydropower station meet standards most of the time, but the concentration of TP exceeds standards sometimes. From the perspective of spatial distribution, concentrations of CODMn, NH3-N, and TP generally showed a trend toward gradual worsening from upstream to downstream.
- After cascade hydropower development on the middle reach of the Jinsha River, water quality changed significantly, including decreased TP concentration and increased concentrations of CODMn and NH3-N. Mechanisms influencing the concentration of different pollutants vary. After reservoir impoundment, the intensified sedimentation effect leads to decreased TP concentrations, while the economic and social development driven by cascade hydropower development leads to increasing concentrations of CODMn and NH3-N.
- The water quality of most hydropower stations on the middle reach of the Jinsha River reflects obvious seasonal characteristics. Since the study area is characterized by marked rainy and dry seasons, rainfall affects water quality during different seasons. In the rainy season, concentrations of CODMn and TP are higher, and they are concomitantly lower during the dry season. This is directly related to non-point-source pollution in reservoir catchments. It is very important that the nutrient input of non-point source pollution is controlled for controlling the input of P in reservoirs.
Based on these research results, we suggest actions to enhance water quality protection in the middle reach of the Jinsha River, including strengthening the control of pollution sources in the reservoir area, carrying out sediment transportation through reservoir scheduling, and strengthening the water quality monitoring. Shortcomings of this study include the fact that our analyzes and interpretations are based only on water quality monitoring data from 2004 to 2019. The collection of additional, more complete, data in the future will help improve our model and potentially modify the results.
Author Contributions
Conceptualization, T.X. and F.C.; methodology, T.X.; software, T.X. and Q.Y.; validation, W.M.; formal analysis, T.X.; resources, X.H.; writing—original draft preparation, T.X.; writing—review and editing, F.C.; supervision, W.M.; project administration, T.X.; funding acquisition, Q.Y. All authors have read and agreed to the published version of the manuscript.
Funding
This study was supported by a grant from the National Natural Science Foundation of China (No. 51609263).
Data Availability Statement
Restrictions apply to the availability of these data. Data were obtained from the Environmental Monitoring Center of Middle Reaches of Jinsha River and are available from the authors with the permission of the Environmental Monitoring Center of Middle Reaches of Jinsha River.
Acknowledgments
Many thanks to Hucai Zhang for his kind invitation and careful comments and suggestions that have improved the earlier draft greatly.
Conflicts of Interest
The authors declare no conflict of interest.
Abbreviations
| CODMn | Chemical oxygen demand (potassium permanganate index) |
| NH3-N | Ammonia–nitrogen |
| TP | Total phosphorus |
| SS | Suspended solids |
| DO | Dissolved oxygen |
| pH | Pondus hydrogenii |
References
- Gang, L.; Li, P. Research on the construction of safety emergency platform for cascade hydropower stations in the basin. Water Power 2021, 47, 104–109. [Google Scholar] [CrossRef]
- Chen, K.-Q.; Chang, Z.-N.; Cao, X.-H. Thinking highly of environment and developing hydropower orderly. China Water Power Electrif. 2010, 31, 13–17. [Google Scholar] [CrossRef]
- Bao-Zhu, H.; Lei-Lei, G.; Na, W. Analysis on reservoir construction upon ecological environment. J. Zhejiang Univ. Water Resour. Electr. Power 2008, 20, 41–43. [Google Scholar] [CrossRef]
- Tianbao, X.; Jing, P.; Chong, L. Influence of Gezhouba Dam on the eco-hydrological characteristics in the middle reach of the Yangtze River. Resour. Environ. Yangtze Basin 2007, 16, 72–75. [Google Scholar] [CrossRef]
- Ran, X.B.; Yu, Z.G.; Yao, Q.Z.; Chen, H.T.; Mi, T.Z.; Yao, P. Advances in nutrient retention of dams on river. J. Lake Sci. 2009, 21, 614–622. [Google Scholar] [CrossRef]
- Kuriqi, A.; Pinheiro, A.N.; Sordo-Ward, A.; Bejarano, M.D.; Garrote, L. Ecological impacts of run-of-river hydropower plants—Current status and future prospects on the brink of energy transition. Renew. Sustain. Energy Rev. 2021, 142, 110833. [Google Scholar] [CrossRef]
- Kuriqi, A.; Pinheiro, A.N.; Sordo-Ward, A.; Garrote, L. Influence of hydrologically based environmental flow methods on flow alteration and energy production in a run-of-river hydropower plant. J. Clean. Prod. 2019, 232, 1028–1042. [Google Scholar] [CrossRef]
- Młyński, D.; Wałęga, A.; Kuriqi, A. Influence of meteorological drought on environmental flows in mountain catchments. Ecol. Indic. 2021, 133, 108460. [Google Scholar] [CrossRef]
- Kuriqi, A.; Pinheiro, A.N.; Sordo-Ward, A.; Garrote, L. Water-energy-ecosystem nexus Balancing competing interests at a run-of-river hydropower plant coupling a hydrologic–ecohydraulic approach. Energy Convers. Manag. 2020, 223, 113267. [Google Scholar] [CrossRef]
- Winton, R.S.; Teodoru, C.R.; Calamita, E.; Kleinschroth, F.; Banda, K.; Nyambe, I.; Wehrli, B. Anthropogenic influences on Zambian water quality: Hydropower and land-use change. Environ. Sci. Processes Impacts 2021, 23, 981–994. [Google Scholar] [CrossRef]
- Alvarez, X.; Valero, E.; Torre-Rodríguez, N.D.; Acuna-Alonso, C. Influence of small hydroelectric power stations on river water quality. Water 2020, 12, 312. [Google Scholar] [CrossRef] [Green Version]
- Tomczyk, P.; Wiatkowski, M. The effects of hydropower plants on the physicochemical parameters of the Bystrzyca River in Poland. Energies 2021, 14, 2075. [Google Scholar] [CrossRef]
- Peng, C.-I.; Jiang, Y.-J.; Zhang, X.-Y. Discussion on water quality changes and causes in reservoir area and downstream of Three Gorges Reservoir before and after impoundment. Express Water Resour. Hydropower Inf. 2016, 37, 35–40. [Google Scholar] [CrossRef]
- Lianfang, X.; Hongbin, G.; Bin, W. Study on cumulative effects of water quality by hydroelectric cascade development in Hongshui River. Water Power 2013, 39, 9–12. [Google Scholar] [CrossRef]
- Aijun, B.C.; Ying, P. Study on the spatiotemporal differences in the reservoir of cascade hydropower of Lancang River. Environ. Sci. Surv. 2015, 34, 35–40. [Google Scholar] [CrossRef]
- Xinyue, Z.; Peiming, M.; Qianhong, G.; Haitao, Y.; Bao, Q. Spatial-temporal variations of water quality in upstream and downstream of Three Gorges Dam. J. Lake Sci. 2019, 31, 633–645. [Google Scholar] [CrossRef] [Green Version]
- Yue, H.; Zhilin, H.; Wenfa, X.; Lixion, Z.; Liang, M. Water quality evaluation and prediction of the reservoir inflow and outflow after the Three Gorges Project operation. Environ. Pollut. Control. 2019, 41, 211–215. [Google Scholar] [CrossRef]
- Hu, G.; Wu, H.; Zhang, Z. Trend analysis on water quality of Xiaolangdi Reservoir of Yellow River. Areal Res. Dev. 2003, 22, 86–88. [Google Scholar] [CrossRef]
- Wu, J.; Chen, M.; Yuan, R.; Li, H.; Liu, L. Application of seasonal Kendall method in downstream water quality trend analysis for Dongjiang River. Guangxi Water Resour. Hydropower Eng. 2017, 3, 14–18. [Google Scholar] [CrossRef]
- Xie, Q.; Xue, X.; Fu, M. A literature review of the application of regression discontinuity design. Rev. Econ. Manag. 2019, 35, 69–79. [Google Scholar] [CrossRef]
- Thistlethwaite, D.L.; Campbell, D.T. Regression-discontinuity analysis: An alternative to the ex-post facto experiment. J. Educ. Psychol. 1960, 51, 309–317. [Google Scholar] [CrossRef] [Green Version]
- Hahn, J.; Todd, P.; Van der Klaauw, W. Identification and estimation of treatment effects with a regression-discontinuity design. Econometrica 2001, 69, 201–209. [Google Scholar] [CrossRef]
- Yu, J.; Wang, C. The Rise of a New Quasi-Random Experiment Method—Breakpoint Regression and Application in Economics. Econ. Perspect. 2011, 125–131. Available online: http://www.jjxdt.org/Admin/UploadFile/20150323002/2016-08-25/Issue/14yb0ltf.pdf (accessed on 26 February 2022).
- Card, D.; Giuliano, L. Can tracking raise the test scores of high—Ability minority students? Am. Econ. Rev. 2016, 106, 2783–2816. [Google Scholar] [CrossRef] [Green Version]
- Malamud, O.; Popeleches, C. Home computer use and the development of human capital. Q. J. Econ. 2011, 126, 987–1027. [Google Scholar] [CrossRef] [PubMed]
- Pinotti, P. Clicking on Heaven’s Door: The effect of immigrant legalization on crime. Am. Econ. Rev. 2017, 107, 138–168. [Google Scholar] [CrossRef] [Green Version]
- Ying, L.; Shen, Z.; Piao, S. The recent hiatus in global warming of the land surface: Scale-dependent breakpoint occurrences in space and time. Geophys. Res. Lett. 2015, 42, 6471–6478. [Google Scholar] [CrossRef] [Green Version]
- Auffhammer, M.; Kellogg, R. Clearing the air? The effects of gasoline content regulation on air quality. Am. Econ. Rev. 2011, 101, 2687–2722. [Google Scholar] [CrossRef] [Green Version]
- Toms, J.D.; Lesperance, M.L. Piecewise regression: A tool for identifying ecological thresholds. Ecology 2003, 84, 2034–2041. [Google Scholar] [CrossRef]
- Wanhua, L.; Yaodong, Z.; Zhijia, D. The effectiveness of “River Chief System” policy: An empirical study based on environmental monitoring samples of China. Water 2021, 13, 1988. [Google Scholar] [CrossRef]
- Hydro China Co., Ltd. Report on environmental impact Assessment and countermeasures of hydropower cascade development planning in mid-reach of Jinsha River. 2009. [Google Scholar]
- Kang, J. Climate change characteristics and its influence on hydrology and water quality in Wuliangsuhai Basin in recent 50 years. Hebei Univ. Eng. 2016, 10, 1–97. [Google Scholar] [CrossRef]
- Tianyu, L.; Lei, W.; Guohu, M.; Weihua, G. Numerical simulation for impacts of hydrodynamic conditions on algae growth in Chongqing Section of Jialing River, China. Ecol. Model. 2010, 222, 112–119. [Google Scholar] [CrossRef]
- Whitehead, P.G.; Wilby, R.L.; Battarbee, R.W.; Kernan, M.; Wade, A.J. A review of the potential impacts of climate change on surface water quality. Hydrol. Sci. J. 2009, 54, 101–123. [Google Scholar] [CrossRef]
- Hassan, H.; Hanaki, K.; Matsuo, T. A modeling approach to simulate impact of climate change in lake water quality: Phytoplankton growth rate assessment. Water Sci. Technol. 1998, 37, 177–185. [Google Scholar] [CrossRef]
- Gómez-Martínez, G.; Galiano, L.; Rubio, T.; Prado-López, C.; Redolat, D.; Paradinas Blázquez, C.; Gaitán, E.; Pedro-Monzonís, M.; Ferriz-Sánchez, S.; Añó Soto, M.; et al. Effects of climate change on water quality in the Jucar River Basin (Spain). Water 2020, 13, 2424. [Google Scholar] [CrossRef]
- Zhang, Z.; Wang, X.; Ma, W.; Zhang, J.; Pan, R.; Yang, R. The effects of global warming on purification processes of Tongzhou section of Beiyun river. China Environ. Sci. 2017, 37, 730–739. [Google Scholar] [CrossRef]
- Ministry of Ecology and Environment of the People’s Republic of China. Environmental Quality Standards for Surface Water (GB3838-2002). Available online: http://www.mee.gov.cn/ywgz/fgbz/bz/bzwb/shjbh/shjzlbz/200206/t20020601_66497.shtml (accessed on 26 February 2022).
- Department of Ecology and Environment of Yunnan Province. Surface Water Environmental Functional Zoning of Yunnan Province (2010–2020). Available online: http://sthjt.yn.gov.cn/zwxx/zfwj/gsgg/201804/t20180417_178523.html (accessed on 26 February 2022).
- Li, J.X.; Liao, W.G.; Huang, Z. Numerical simulation of water quality for the Three Gorges Project Reservoir. J. Hydraul. Eng. 2002, 12, 7–10. [Google Scholar] [CrossRef]
- He, X.R.; Wang, X.Y.; He, W. Study on comprehensive water pollution control measures for reservoir areas along mid-reach of Jinshajiang River. Water Resour. Hydropower Eng. 2015, 46, 71–76. [Google Scholar] [CrossRef]
- Wei, W.E.; Tao, L.I.; Lu, H.A. Analysis of influence of water environment on development of hydropower cascade downstream of the Hanjiang River. J. Environ. Eng. Technol. 2016, 6, 259–265. [Google Scholar] [CrossRef]
- Lou, B.; Yin, S.; Mu, H.; Zhang, X. Comparison of total phosphorus concentration of Yangtze River within the Three Gorges Reservoir before and after impoundment. J. Lake Sci. 2011, 23, 863–867. [Google Scholar] [CrossRef] [Green Version]
- Gao, J.; Yao, F.; Lei, X. Study on water quality evaluation and water quality distribution characteristics of main stream of Daduhe River under background of cascade hydropower development. Water Resour. Hydropower Eng. 2021, 52, 133–145. [Google Scholar] [CrossRef]
- Li, J.; Peng, M.; Dong, S.; Li, C.; Wang, L. Assessment of benthic macro invertebrate assemblages and water quality in Xiaowan Reservoir before and after dam operation, Lancang River. Res. Environ. Sci. 2018, 31, 1900–1908. [Google Scholar] [CrossRef]
- Han, C.; Zheng, B.; Qin, Y.; Ma, Y.; Yang, C.; Liu, Z.; Cao, W.; Chi, M. Impact of upstream river inputs and reservoir operation on phosphorus fractions in water-particulate phases in the Three Gorges Reservoir. Sci. Total Environ. 2018, 610, 1546–1556. [Google Scholar] [CrossRef] [PubMed]
- Wang, D.; Wu, X. Analysis of phosphorus transport in the Three Gorges Reservoir. J. Hydraul. Eng. 2021, 52, 885–895. [Google Scholar] [CrossRef]
Figure 1.
Distribution map of hydropower stations on the main course of the middle reach of the Jinsha River (DEM data from the website https://www.gscloud.cn/ and accessed on 8 November 2021).
Figure 1.
Distribution map of hydropower stations on the main course of the middle reach of the Jinsha River (DEM data from the website https://www.gscloud.cn/ and accessed on 8 November 2021).

Figure 2.
Water quality monitoring results at six hydropower stations on the middle reach of the Jinsha River.
Figure 2.
Water quality monitoring results at six hydropower stations on the middle reach of the Jinsha River.

Figure 3.
Boxplot of water quality indicators before and after water impoundment at six hydropower stations on the Jinsha River.
Figure 3.
Boxplot of water quality indicators before and after water impoundment at six hydropower stations on the Jinsha River.

Figure 4.
Boxplot of monthly changes in pollutant concentrations at each cascade hydropower station after hydropower development on the middle reach of the Jinsha River.
Figure 4.
Boxplot of monthly changes in pollutant concentrations at each cascade hydropower station after hydropower development on the middle reach of the Jinsha River.

Figure 5.
Regression discontinuity analysis on the discontinuity point. Note: the points are the monitoring data, and the lines are modeled using regression discontinuity.
Figure 5.
Regression discontinuity analysis on the discontinuity point. Note: the points are the monitoring data, and the lines are modeled using regression discontinuity.

Figure 6.
Changes in water level in front of dams and velocity in reservoirs after cascade hydropower development on the middle reaches of the Jinsha River.
Figure 6.
Changes in water level in front of dams and velocity in reservoirs after cascade hydropower development on the middle reaches of the Jinsha River.

Figure 7.
Number of resettled populations and inundated land areas for cascade hydropower development on the middle reach of Jinsha River.
Figure 7.
Number of resettled populations and inundated land areas for cascade hydropower development on the middle reach of Jinsha River.


Table 1.
Constructed hydropower stations on the main course of the middle reach of the Jinsha River.
Table 1.
Constructed hydropower stations on the main course of the middle reach of the Jinsha River.
| Name | Date of Impoundment | Total Storage (108 m3) | Regulation Capacity | Watershed Area (km2) | Generation Capacity (MW) | Normal Water Level (m) |
|---|---|---|---|---|---|---|
| Liyuan | November 2014 | 7.3 | Daily | 1533 | 2400 | 1618 |
| Ahai | December 2011 | 8.1 | Daily | 15,328 | 2000 | 1504 |
| Jin’anqiao | November 2010 | 8.5 | Weekly | 1977 | 2400 | 1418 |
| Longkaikou | November 2012 | 5.1 | Daily | 2637 | 1800 | 1298 |
| Ludila | May 2013 | 15.5 | Daily | 7351 | 2160 | 1223 |
| Guanyinyan | November 2014 | 20.7 | Weekly | 9172 | 3000 | 1134 |
Table 2.
Overview of water quality monitoring data.
| Name | Before Impoundment | After Impoundment | ||
|---|---|---|---|---|
| Years of the Data | Quantities of the Data | Years of the Data | Quantities of the Data | |
| Liyuan | 2007–2014 | 25 | 2015–2018 | 36 |
| Ahai | 2004–2011 | 25 | 2015–2019 | 44 |
| Jin’anqiao | 2004–2005 | 11 | 2016–2019 | 43 |
| Longkaikou | 2005–2006 | 11 | 2013–2018 | 40 |
| Ludila | 2005–2013 | 36 | 2013–2019 | 63 |
| Guanyinyan | 2005 | 5 | 2017–2019 | 30 |
Table 3.
Limit value of water quality standard for Class II.
| Variable | CODMn | NH3-N | TP |
|---|---|---|---|
| Water quality standard limit (mg/L) | ≤4 | ≤0.5 | ≤0.025 |
Table 4.
Water quality monitoring results before and after water impoundment at hydropower stations.
Table 4.
Water quality monitoring results before and after water impoundment at hydropower stations.
| Hydropower Station | Variable | Before Impoundment | After Impoundment | ||||
|---|---|---|---|---|---|---|---|
| Ave. (mg/L) | Exceeding Ratio | Max. Exceeding Multiple | Ave. (mg/L) | Exceeding Ratio | Max. Exceeding Multiple | ||
| Liyuan | CODMn | 1.1 | 0.0% | 0 | 1.3 | 0.0% | 0 |
| NH3-N | 0.12 | 0.0% | 0 | 0.13 | 0.0% | 0 | |
| TP | 0.014 | 8.0% | 0.8 | 0.014 | 8.3% | 1.1 | |
| Ahai | CODMn | 0.9 | 0.0% | 0 | 1.3 | 0.0% | 0 |
| NH3-N | 0.15 | 0.0% | 0 | 0.14 | 0.0% | 0 | |
| TP | 0.1 | 76.0% | 8.6 | 0.015 | 4.5% | 0.2 | |
| Jin’anqiao | CODMn | 0.9 | 0.0% | 0 | 1.1 | 0.0% | 0 |
| NH3-N | 0.17 | 0.0% | 0 | 0.12 | 0.0% | 0 | |
| TP | 0.035 | 100.0% | 0.6 | 0.035 | 41.9% | 6.8 | |
| Longkaikou | CODMn | 3.1 | 0.0% | 0 | 3.5 | 0.0% | 0 |
| NH3-N | 0.26 | 0.0% | 0 | 0.27 | 0.0% | 0 | |
| TP | 0.072 | 81.8% | 4.6 | 0.025 | 35.0% | 0.2 | |
| Ludila | CODMn | 2.2 | 8.3% | 0.1 | 2.5 | 0.0% | 0 |
| NH3-N | 0.2 | 0.0% | 0 | 0.21 | 0.0% | 0 | |
| TP | 0.043 | 97.2% | 2.5 | 0.025 | 49.2% | 0.5 | |
| Guanyinyan | CODMn | 3.4 | 40.0% | 0.2 | 1.2 | 0.0% | 0 |
| NH3-N | 0.44 | 40.0% | 0.4 | 0.12 | 0.0% | 0 | |
| TP | 0.1 | 80.0% | 5.2 | 0.015 | 3.3% | 0.2 | |
Table 5.
Analysis of the correlation coefficient between treatment variables of hydropower development and water quality indexes.
Table 5.
Analysis of the correlation coefficient between treatment variables of hydropower development and water quality indexes.
| Variable | Concentration | Air Temperature | Hydropower Development | ||
|---|---|---|---|---|---|
| CODMn | NH3-N | TP | |||
| CODMn | 1 | ||||
| NH3-N | 0.5944 *** | 1 | |||
| TP | 0.0891 | 0.1267 * | 1 | ||
| Air temperature | 0.1175 * | 0.0386 | 0.064 | 1 | |
| Hydropower development | 0.1026 * | −0.0598 | −0.3855 *** | −0.0164 | 1 |
Note: *** and * are significant at the level of 0.1% and 5%, respectively.
Table 6.
Regression discontinuity estimation results.
| Estimate | CODMn | NH3-N | TP |
|---|---|---|---|
| No covariates added | 0.883 *** | 0.172 ** | −0.033 * |
| (0.233) | (0.062) | (0.016) | |
| Covariates added | 0.934 *** | 0.179 ** | −0.034 * |
| (0.218) | (0.062) | (0.016) |
Note: ***, **, and * are significant at the level of 0.1%, 1%, and 5%, respectively. The standard error in brackets passed the robustness test and independence test.
Table 7.
Overview of water quality affected by hydropower development in other watersheds.
| Study Area | Water Quality Indicators | Change of Water Quality | Authors | Publication Year |
|---|---|---|---|---|
| Yangtze River in China | TP | Improved | Lou Baofeng et al. [43] | 2011 |
| Hongshui River in China | TN, BOD5, TP | Improved | Xue Lianfang et al. [14] | 2013 |
| Yangtze River in China | TP, DO, SS, heavy metal | Improved | Peng Chunlan et al. [13] | 2016 |
| Lancang River in China | Goodnight–Whitley index | Degraded | Li Jinpeng et al. [45] | 2018 |
| Lerez, Umia, Ulla and Mandeo rivers in northwestern Spain | pH, DO, conductivity, water temperature | Unchanged | Alvarez Xana et al. [11] | 2020 |
| Dadu River in China | pH, CODMn, NH3-N, DO, BOD5, heavy metal | Unchanged | Gao Jian et al. [44] | 2021 |
| Zambezi River Basin in southern Africa | pH, TP, DO, TN, SS, chlorophyll, and so on | Degraded | Winton, R et al. [10] | 2021 |
| Bystrzyca River in Poland | DO, conductivity, TP | Improved | Tomczyk Pawel and Wiatkowski Miroslaw [12] | 2021 |
Publisher’s Note: MDPI stays neutral with regard to jurisdictional claims in published maps and institutional affiliations. |
© 2022 by the authors. Licensee MDPI, Basel, Switzerland. This article is an open access article distributed under the terms and conditions of the Creative Commons Attribution (CC BY) license (https://creativecommons.org/licenses/by/4.0/).
Share and Cite
MDPI and ACS Style
Xu, T.; Chang, F.; He, X.; Yang, Q.; Ma, W. Influence of Cascade Hydropower Development on Water Quality in the Middle Jinsha River on the Upper Reach of the Yangtze River. Water 2022, 14, 1943. https://doi.org/10.3390/w14121943
AMA Style
Xu T, Chang F, He X, Yang Q, Ma W. Influence of Cascade Hydropower Development on Water Quality in the Middle Jinsha River on the Upper Reach of the Yangtze River. Water. 2022; 14(12):1943. https://doi.org/10.3390/w14121943
Chicago/Turabian StyleXu, Tianbao, Fengqin Chang, Xiaorong He, Qingrui Yang, and Wei Ma. 2022. "Influence of Cascade Hydropower Development on Water Quality in the Middle Jinsha River on the Upper Reach of the Yangtze River" Water 14, no. 12: 1943. https://doi.org/10.3390/w14121943
Note that from the first issue of 2016, this journal uses article numbers instead of page numbers. See further details here.