
A Water Resilience Evaluation Model for Urban Cities


1
Evergrande School of Management, Wuhan University of Science and Technology, Wuhan 430065, China
2
Center for Service Science and Engineering, Wuhan University of Science and Technology, Wuhan 430065, China
3
Faculty of Science and Engineering, University of Wolverhampton, Wolverhampton WV1 1NA, UK
*
Author to whom correspondence should be addressed.
Water 2022, 14(12), 1942; https://doi.org/10.3390/w14121942
Submission received: 10 May 2022
/
Revised: 13 June 2022
/
Accepted: 15 June 2022
/
Published: 16 June 2022
(This article belongs to the Special Issue Natural Flood Management as an Adaptive Pathway to Climate-Resilient Communities)
Abstract
:Cities around the world are having to become more resilient to the effects of climate change and ongoing development pressures and consequently are seeking to improve urban water resource management. In order to analyze the key factors affecting a city’s water resilience, this research establishes an urban water resilience evaluation model. The DEMATEL method is used to calculate the intensity of the interaction among the water resilience indicators and to establish their causal relationships. Then, an ANP structured diagram is established and the weighting of the water resilience evaluation index for the city of Wuhan is obtained using the Super Decisions software. The key water resilience factors for Wuhan are shown to have significant mutual influences, with the main factors found to be the utilization of rainwater resources, the utilization of reclaimed water, and the total annual runoff control of the city. This method provides a sound basis for the evaluation of urban water resilience with scope to extend this to other cities. The results provide useful guidance for policy makers and other key stakeholders in supporting more sustainable urban development.
1. Introduction
In recent years, urban flooding events have occurred more frequently, not only causing the paralysis of urban transportation, communication networks, and other systems [1], but also reducing the water resilience of cities, seriously affecting the normal life of urban residents, and directly or indirectly causing casualties and huge economic losses [2]. Previous researchers have found interdependent correlations between water resilience indicators in the aftermath of urban flooding [3]. At present, China is actively taking corresponding measures to cope with urban surface water inundation and improve urban water resource management [4]. However, in the context of a changing environment due to issues such as climate change and urbanization, urban flooding will inevitably become a more serious problem plaguing urban development in the coming period [5]. As large cities continue to grow through development and regeneration pressures leading to population growth and the expansion of agricultural and industrial sectors, more innovative strategies and approaches to the management of water resources will inevitably be needed. These new methods will need to take into account climate variability, uncertainty, and climate change trends [6]. In responding to these challenges, this study presents a model to the analysis of water resilience that recognizes the needs of different stakeholders.
In urban areas, the population is more densely distributed, so there is a greater demand for water resources both in production processes and to support healthy living. Human beings not only consume a large amount of water resources, but also arbitrarily can cause deforestation and pollution to the environment, resulting in a significant deterioration of the water resources environment. Globally, the availability of fresh water is decreasing, and the contradiction between supply and demand is intensifying. According to statistics, the Earth’s freshwater resources account for only 2.5% of the total water volume, and less than 1% of the freshwater can be directly used by humans [7]. On World Water Day 2020, UN-water launched the World Water Development Report. The report showed that global water consumption has increased sixfold over the past 100 years, and the demand for water resources is growing at a rate of 1% per year [8].
The water resources challenges faced by China include:
- Per capita, water resources are scarce, and the contradiction between supply and demand has intensified. According to relevant statistics, China’s per capita water re-sources share is 2200 cubic meters, while the average share of water resources in the world population is about 9000 cubic meters, making it one of the most water-scarce countries in the world. With the continuous development of society, China’s industrial water use and urban water consumption continues to increase while supplies decrease, thus representing a major obstacle to both industrial and social development.
- The utilization rate of water resources is low and the management of water resources in some cities and regions is poor. Rapid urbanization and overdevelopment represent a serious challenge, resulting in an unreasonable distribution of water re-sources both upstream and downstream, affecting the normal life of surrounding residents. In areas with abundant water resources, the phenomenon of water waste is a serious concern, and the utilization rate of water resources is low. Intermittent interruptions in water-scarce areas, leading to water shortages, is such that this cannot guarantee the basic livelihoods of communities as well as support the ecological environment.
- There exists an uneven distribution of water resources due to the uneven spatial distribution of rainwater. Cities located in the southeast are abundant with water re-sources, and the average annual precipitation generally reaches more than 1000 mm, while the northwest region has less precipitation, with an average annual precipitation of less than 400 mm, bringing about serious water shortages.
- Serious pollution problems caused by the rapid economic development of cities, has brought with it the major pollution of water resources. A summary of China’s water consumption in 2015–2020 is shown in Figure 1. From the figure, we can see that China’s annual consumption of water resources generally shows a downward trend, which has a lot to do with the water-saving policies introduced by the state and the improvement of people’s awareness of water conservation, the sharp reduction in water consumption in 2020 is mainly due to the emergence of the new crown epidemic, many industries are in a state of stagnation, reducing the consumption of water resources.
The current state of water resources highlights the need to improve urban water management and enhance urban water resilience. As one of the largest cities in China, Wuhan’s urban development process is accelerating, and effective water resource management is of great significance to the development of the city. This research adopts Wuhan as the target of study. In order to analyze the key factors affecting a city’s water resilience, this research establishes an urban water resilience evaluation model. This model can provide a reference for the improvement of water resilience in other cities.
2. Literature Review
Some cities in China have already begun the transition towards becoming what is known as ‘sponge cities’, which is similar to the low impact development (LID) approach in the United States [9], sustainable urban drainage systems (SuDs) [10] and blue–green cities (BGC) approaches in the UK [11], water-sensitive urban design (WSUD) in Australia [12], and low impact development urban design (LIDUD) in New Zealand [13]. Coombes elaborated on the concept of a sponge city and its development and discussed the impact of urban land use planning and the transformation of urban water resource management practices [14]. Qiu (2015) discussed the four basic connotations of a sponge city being essence, goals, thinking, and practice. That is, to achieve the effective coordination and harmony between urbanization and resource environment, to adopt “urban flexibility” to environmental changes, requires a change in thinking around drainage and flood prevention [15].
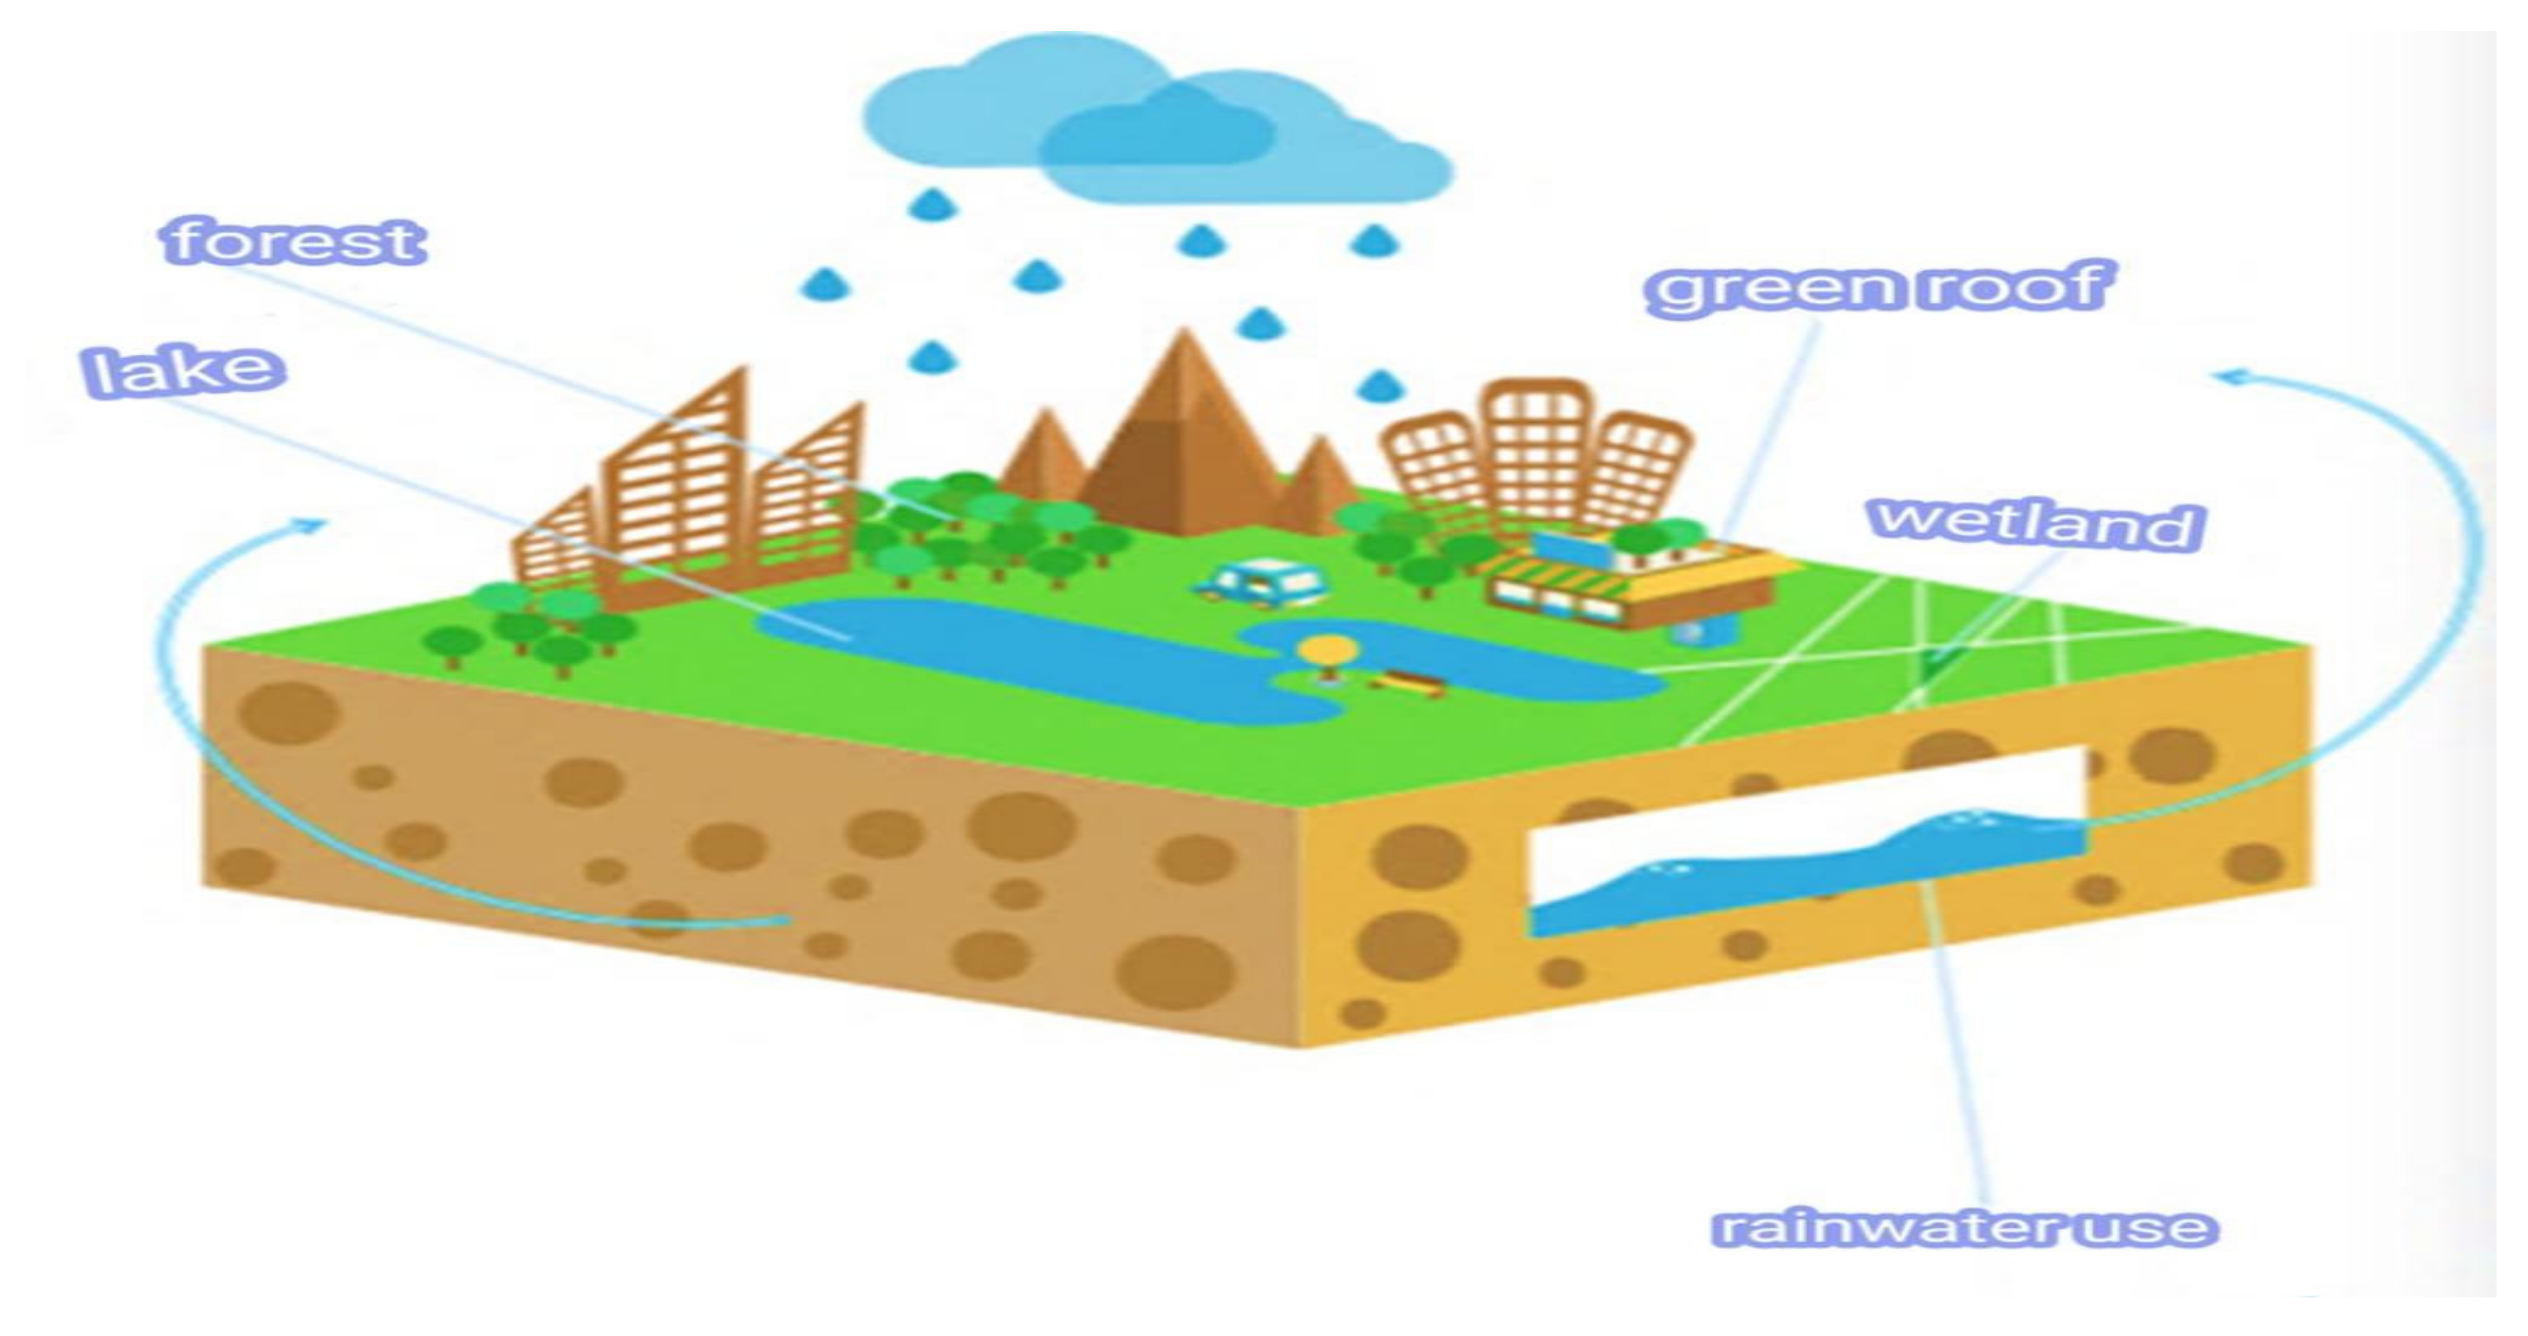
The water resilience of a city refers to the ability of the city to behave like a sponge (see Figure 2). The concept of resiliency is defined as the ability of (ecosystem) systems to absorb disturbances, restore, and restart activities after major outages [16]. In the context of urban flooding, flood resilience refers to the ability of a city to resist the impacts of flooding and return to its original state after the flood subsides [17]. Cities should be flexible to adapt to changing ecosystems that help respond effectively to natural events such as floods [18]. For example, when a city is faced with prolonged rainstorms, the infrastructure should be able to effectively regulate and purify the rainwater [19]. Furthermore, in the event of a prolonged drought, stored rainwater should be able to be released and utilized. This involves the scientific planning, construction, and management of cities, making full use of urban artificial ecosystems [20]. The optimal utilization of rainwater resources is represented by an urban development model that conforms to nature, protects nature, perfectly combines the city and the water ecological environment, and realizes the harmonious coexistence of humans and nature. This represents an effective way to alleviate urban flooding and water shortages and simultaneously improve water security. Therefore, it is important to promote sustainable rainwater management (SSM) as this provides many ecosystem services through the use of green infrastructure aimed at managing stormwater runoff and purifying rainwater [21].
In recent years, many methods have been used to study urban water resilience. Based on the perspective of environmental change, He (2019) analyzed the challenges brought by climate change and urbanization to urban flooding risk management [22]. Wang (2021) developed an evaluation framework based on cellular automata to assess the performance of mitigation strategies in sponge cities [23]. Tao et al. (2021) modeled flood responses under different sponge measurement combinations and rainfall scenarios, and identified synergies between different sponge city measures [24]. Shun et al. (2018) considered the shifts affecting urban land use planning and urban water management practices in China. To achieve the twin goals of sustainable water use and better flood control, more effective development and implementation of land-use guidance and assessment tools were proposed [25]. Using a survey-based approach, Wang et al. (2018) reviewed research and policies on urban water management in China, discussing challenges relating to sponge cities [26]. Palazzo (2019) outlined the foundations of urban design for rainwater management [27]. Mo et al. (2012) integrated the latest ecological stormwater management concepts in China and internationally and proposed to build urban “green sponges” with green areas and water systems as the main body, changing the traditional thinking of relying on large-scale engineering facilities and drainage networks, and explored new landscape channels for rainwater resources [28]. Huang (2018) discussed the relationship between urban flood prevention and control and sponge city construction, and proposed that only by successfully constructing four subsystems of urban rainwater management, such as a source runoff control system, urban rainwater drainage, an excess rainwater runoff drainage system, and an urban water conservancy flood control system, can it be expected to solve urban flooding issues [29]. Wu et al. (2018) sorted out and analyzed the development and evolution process of the sponge city concept and its theoretical connotations. They discussed the evolutionary trends and development prospects of the stormwater management theory based on the sponge city concept in China in the new era and put forward the development ideas of a comprehensive improvement in China’s modern rainwater management system from the four aspects of understanding the concept, scale construction, professional cooperation, and strengthening management [30]. Chen et al. (2016) conducted an evaluation of the performance of sponge city construction based on group evaluation [31]. Huang et al. (2016) used the analytic hierarchy method to calculate the weights of key indicators, including the order of the indicators. At the same time, they proposed that when building a performance evaluation system, it is necessary to consider the city’s water ecological environment and the fundamental problems it faces [32].
Zhu et al. (2018) developed a technical guide for sponge city construction, including a sponge city index system, and took Wuxi City as an example to study the practical feasibility of the indicators [33]. Huang et al. (2018) analyzed the geological factors affecting the construction of sponge cities [34]. Lin et al. (2021) proposed a multi-objective optimization method incorporating rainfall runoff, pollutant emissions, cost minimization, and maximization of environmental benefits in order to realize the planning and construction of sponge cities [35]. On the basis of in-depth analyses of the concept and connotations of a sponge city, Chao (2017) identified 20 evaluation indicators, and used a questionnaire survey to evaluate the preliminary screening indicators [36]. Babaei (2018) used SWMM to estimate surface runoff in urban surfaces and assessed the accuracy of drainage systems in urban areas [37]. Qian et al. (2019) used SWMM models to simulate the effects of three typical LID facilities in Xixian New District, Shaanxi Province, showing that LID (low impact development) facilities play an important role in alleviating urban flooding and reducing non-point source pollution [38]. Yang et al. (2020) found that the sponge cities initiative can only be an effective approach if China commits to appropriate technical, governance, fiscal, and organizational measures to effectively address the challenges of policy implementation [39].
At present, China’s sponge city initiative has been widely considered and the subject of extensive research [40]. While the initiative is well-intentioned and builds on modern advances in stormwater management, there is a lack of a holistic and systematic approach to a guiding program that adapts to local conditions to organize the further development of sponge cities, thereby reducing the gap between engineering design and policy [41]. Therefore, in the process of constructing an urban water resilience evaluation model, the logical relationships between the indicators need to be fully considered. An evaluation model of the urban water resilience index based on the DEMATEL–ANP method is proposed and drawing on field data from the city of Wuhan, the ranking of each factor affecting water resilience is obtained. This provides for a more scientific and robust basis for the development of guidance and recommendations towards the improvement of water resilience in Wuhan.
3. Construction of DEMATEL–ANP Evaluation Model
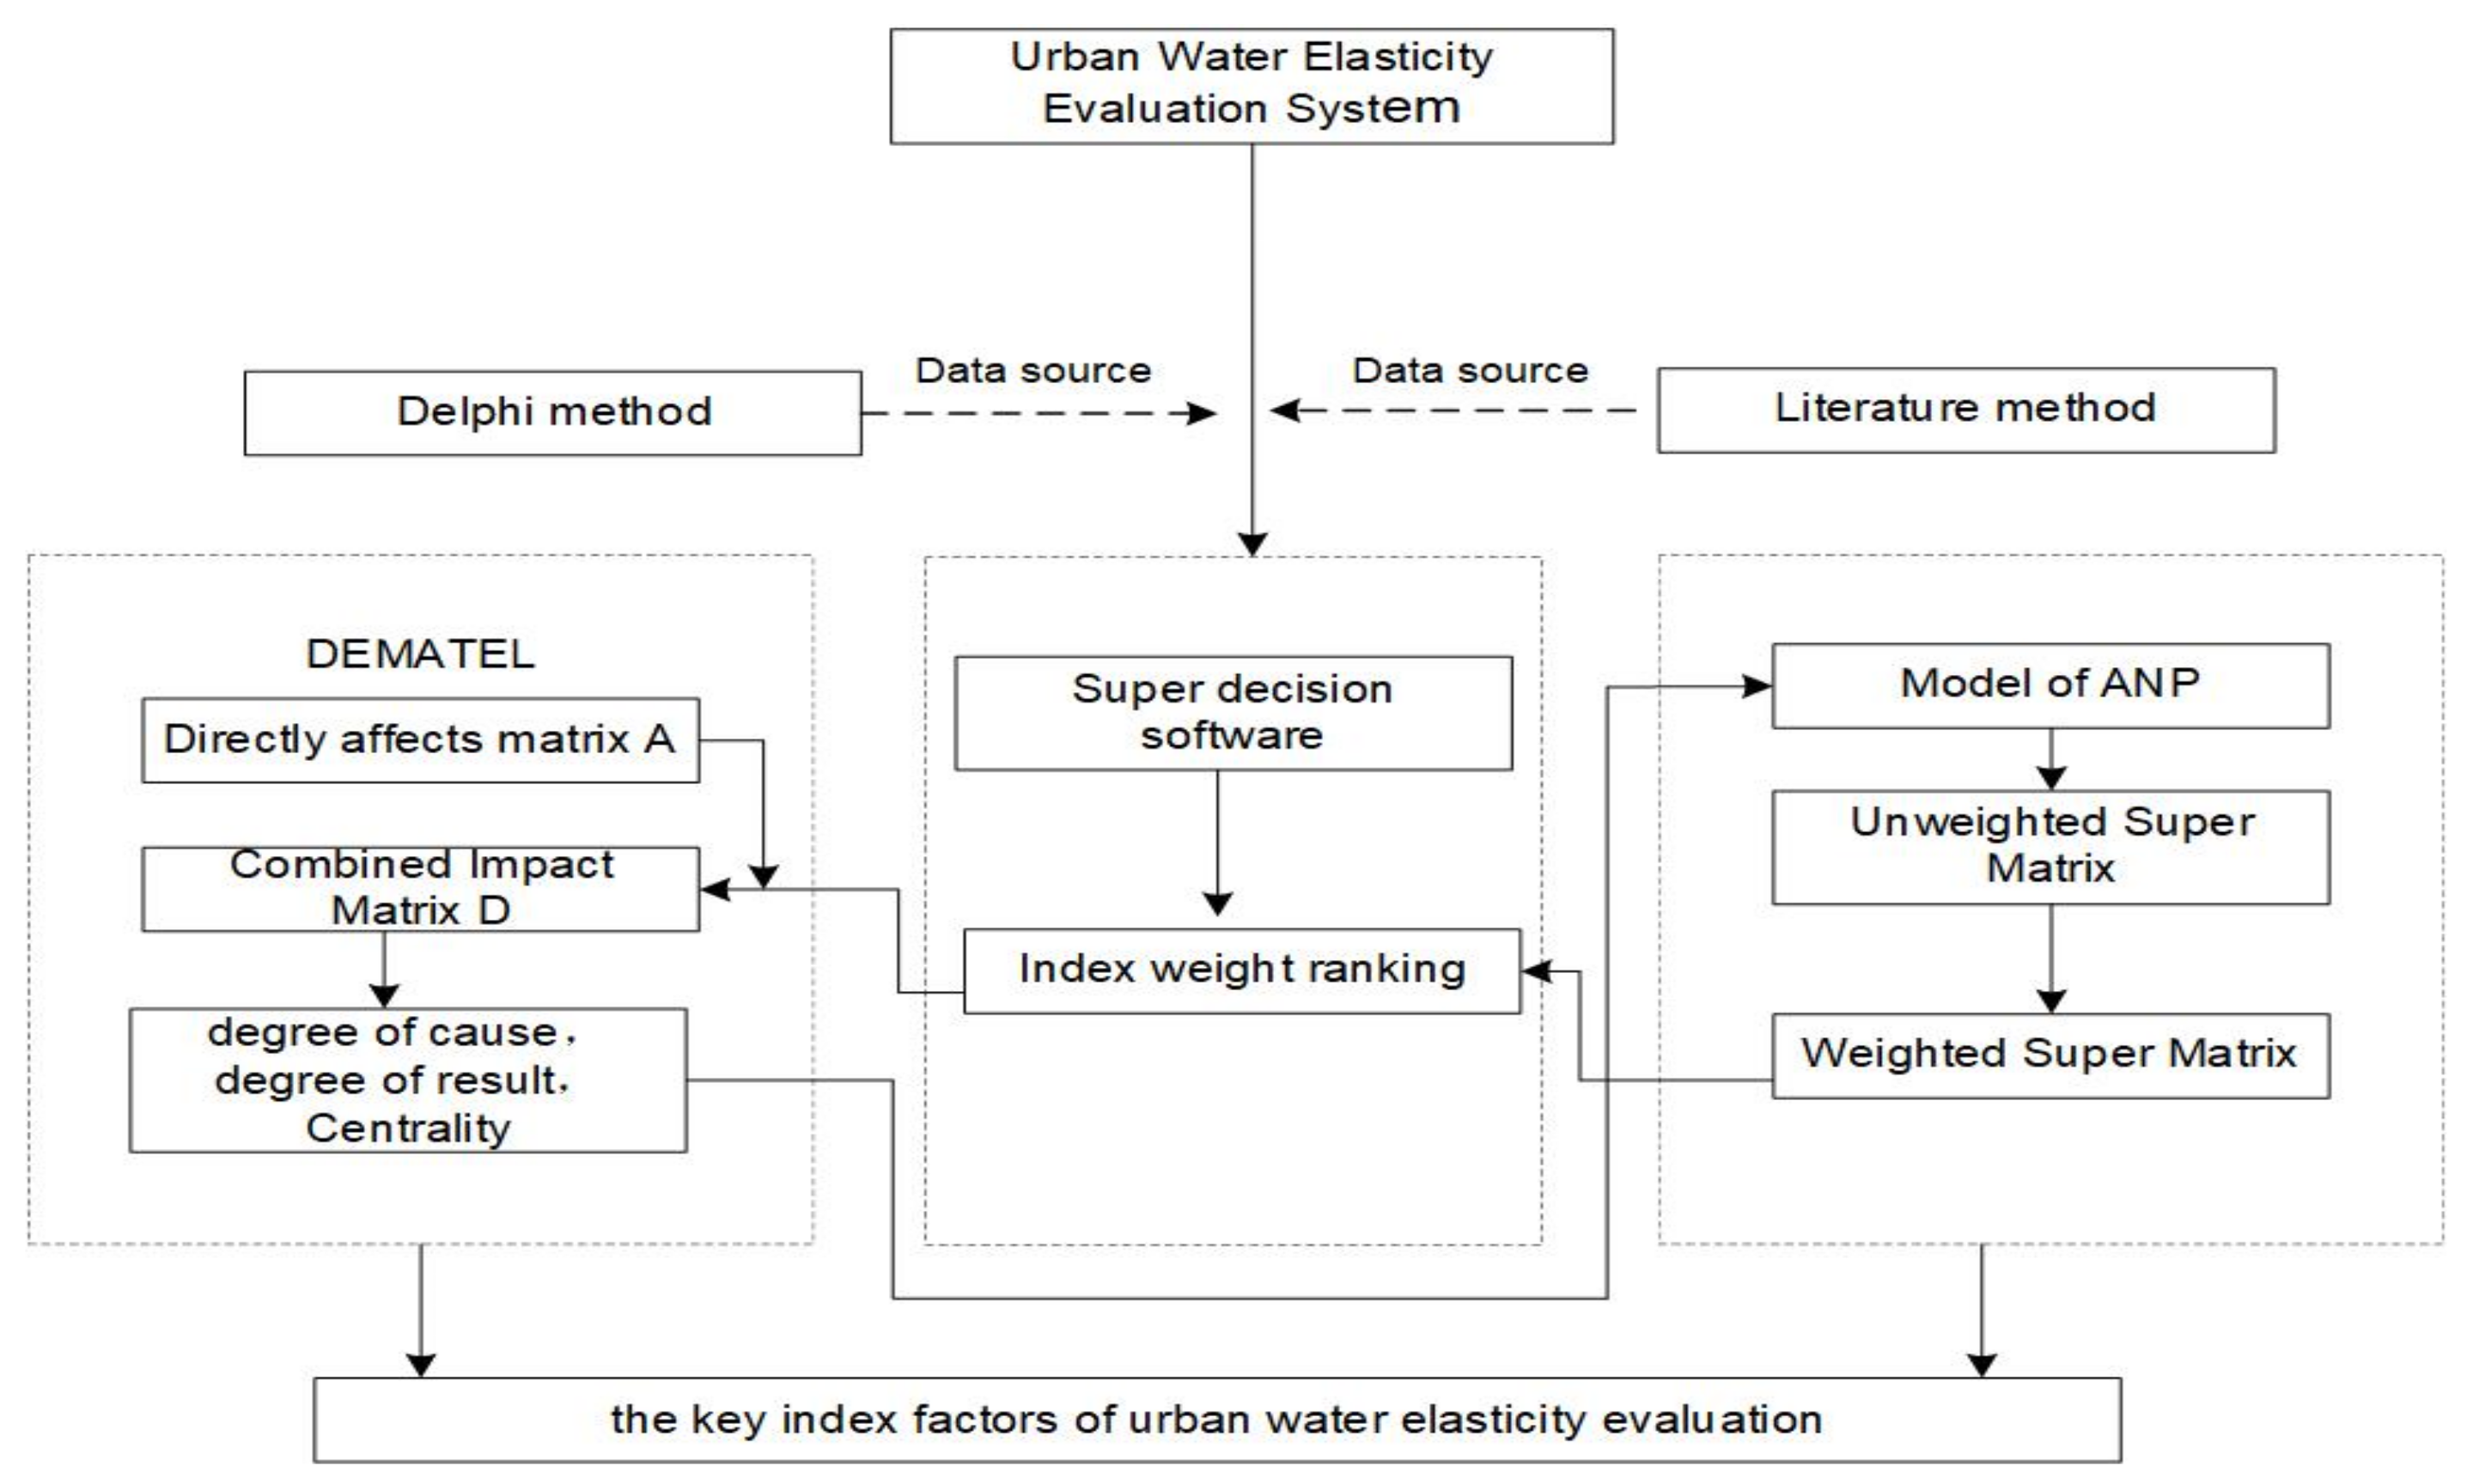
The decision lab method (DEMATEL) is an analytical method developed by the Battle Research Center in the United States in the 1970s. Through the analysis of the internal factors of the system, the complex influence relationship between the indicator factors is transformed into an easy-to-understand structural relationship, and then the factors are classified into cause-and-effect classes, and the degree of influence between the factors is calculated [42]. Analytical network analysis (ANP) is an extension of analytic hierarchy (AHP) for decision-making problems with feedback and dependency structures [43]. ANP divides the system elements into two parts: the first part is the control element layer, including the problem objectives and decision criteria. The second part is the network layer, which consists of all the elements governed by the control layer, and the elements interact with each other. In this research, the urban water resilience evaluation index is first selected, and the degree of influence of the water resilience evaluation index is calculated by DEMATEL [44]. Then the ANP structure chart is established based on the causal diagram between the indicators obtained by DEMATEL, and the relative weight between the evaluation indicators is obtained by super decision software. The importance of the evaluation indicators is found to guide the improvements in water resilience within the city more scientifically and reasonably. Based on the above analysis, this research constructs an urban water resilience evaluation model based on DEMATEL–ANP, as shown in Figure 3, and the specific principles are as follows:
3.1. Determining the Evaluation Indicators of Urban Water Resilience
Considering the theoretical basis for the establishment of urban water resilience evaluation indicators and the basic principles of index selection, combined with the findings from the literature review, 14 indicators were selected across four aspects: water ecology [45], water resources [46], water environment [47], and water safety [48], to finally construct urban water resilience city evaluation indicators. This is shown in Table 1.
3.2. Impact Analysis of Evaluation Indicators Based on DEMATEL Method
- (1)
- To calculate the direct relationship matrix, invitations were sent to five relevant organizations involved in urban construction, and each organization was invited to send five experts to form an expert group. An expert survey method was used to compare the factors and score the degree of influence between each factor. Then, using a numerical value between 0–4 to judge the influence relationship between the indicator sets, the direct relationship matrix A was constructed.
- (2)
- Compute normalizes the direct relation matrix B. The normalization of matrix A can obtain a direct impact on matrix x.
- (3)
- Calculate the synthesis impact matrix D. The comprehensive impact matrix reflects the influence structure relationship between the indicators after continuous influence action.
- (4)
- Calculate the degree of influence between factors, the degree of influence, and the degree of centrality and cause and construct a causal map.
3.3. Calculate the Relevant Weights for Each Level of Metrics
After using the DEMATEL method to determine the influence relationship between the indicators, the ANP method was used to calculate the relative weights of each indicator. There are many methods for evaluation at this stage, such as AHP, which is only valid for internal independent hierarchical steps, and will no longer be applicable if there is an interdependence between the hierarchical factors. In the actual decision-making problem, the various factors in the system often affect each other or can be interdependent, resulting in a complex and interleaved network structure. In a network, nodes represent an element or set of elements that interact with each other, each with the potential to be dominated and influenced by other elements. The ANP method constructs both a hierarchical hierarchy and an internal cycle and a mutually dominating network structure, so in the course of this study, considering that there is a relationship between the influencing factors within the urban water elasticity model, we selected the ANP model in the research composition and the specific steps are as follows:
- (1)
- (2)
- Delphi method
On the basis of evaluating the model, the Delphi expert scores were comprehensively considered. Two rounds of consultation with experts were conducted using email correspondence. The experts responded enthusiastically, leading to recycling rates of the two rounds of 83.3%and 85.2%, respectively. These are greater than the 75% minimum, providing statistically significant results and indicating that the consultation results are desirable. The characteristics of the experts are shown in Table 2:
- (3)
- Construct a judgment matrix and a consistency test
Constructing the judgment matrix, the weights were calculated, and the consistency test carried out according to the following formula. The consistency test is passed if the CR is less than 0.1, and the relative weights of the indicators of urban water resilience are determined.
CR = CI/RI < 0.1
- (4)
- Calculation of super matrices, weighted matrices, and limit matrices
There are P1, P2,…,Pm in the ANP control layer guidelines, and element groups C1, C2,...,CN in the network layer, where Ci has elements Ci1, Ci2,...,Cin, I = 1,2,...,N. The super matrix is to construct the degree of influence between the elements of the network layer (such as Cij and Cks), take the control layer element Pi as the criterion, the network layer element Cij as the secondary criterion, compare and analyze the importance of other elements in the element group relative to it, construct the judgment matrix, and obtain the normalized eigenvector , which is the network layer element sort vector. Similarly, to obtain a sort vector relative to other elements, construct the super matrix Wij as follows:
Using the control layer Pi as the criterion, the weighted matrix A is obtained by comparing the importance of the groups of elements under the Pi to the criterion Pij (j = 1,2,.., n):
Multiplying a weighted matrix with a super massed normalizes the super massed columns and results in a weighted super massed.
4. Evaluation Model of Water Resilience in Wuhan
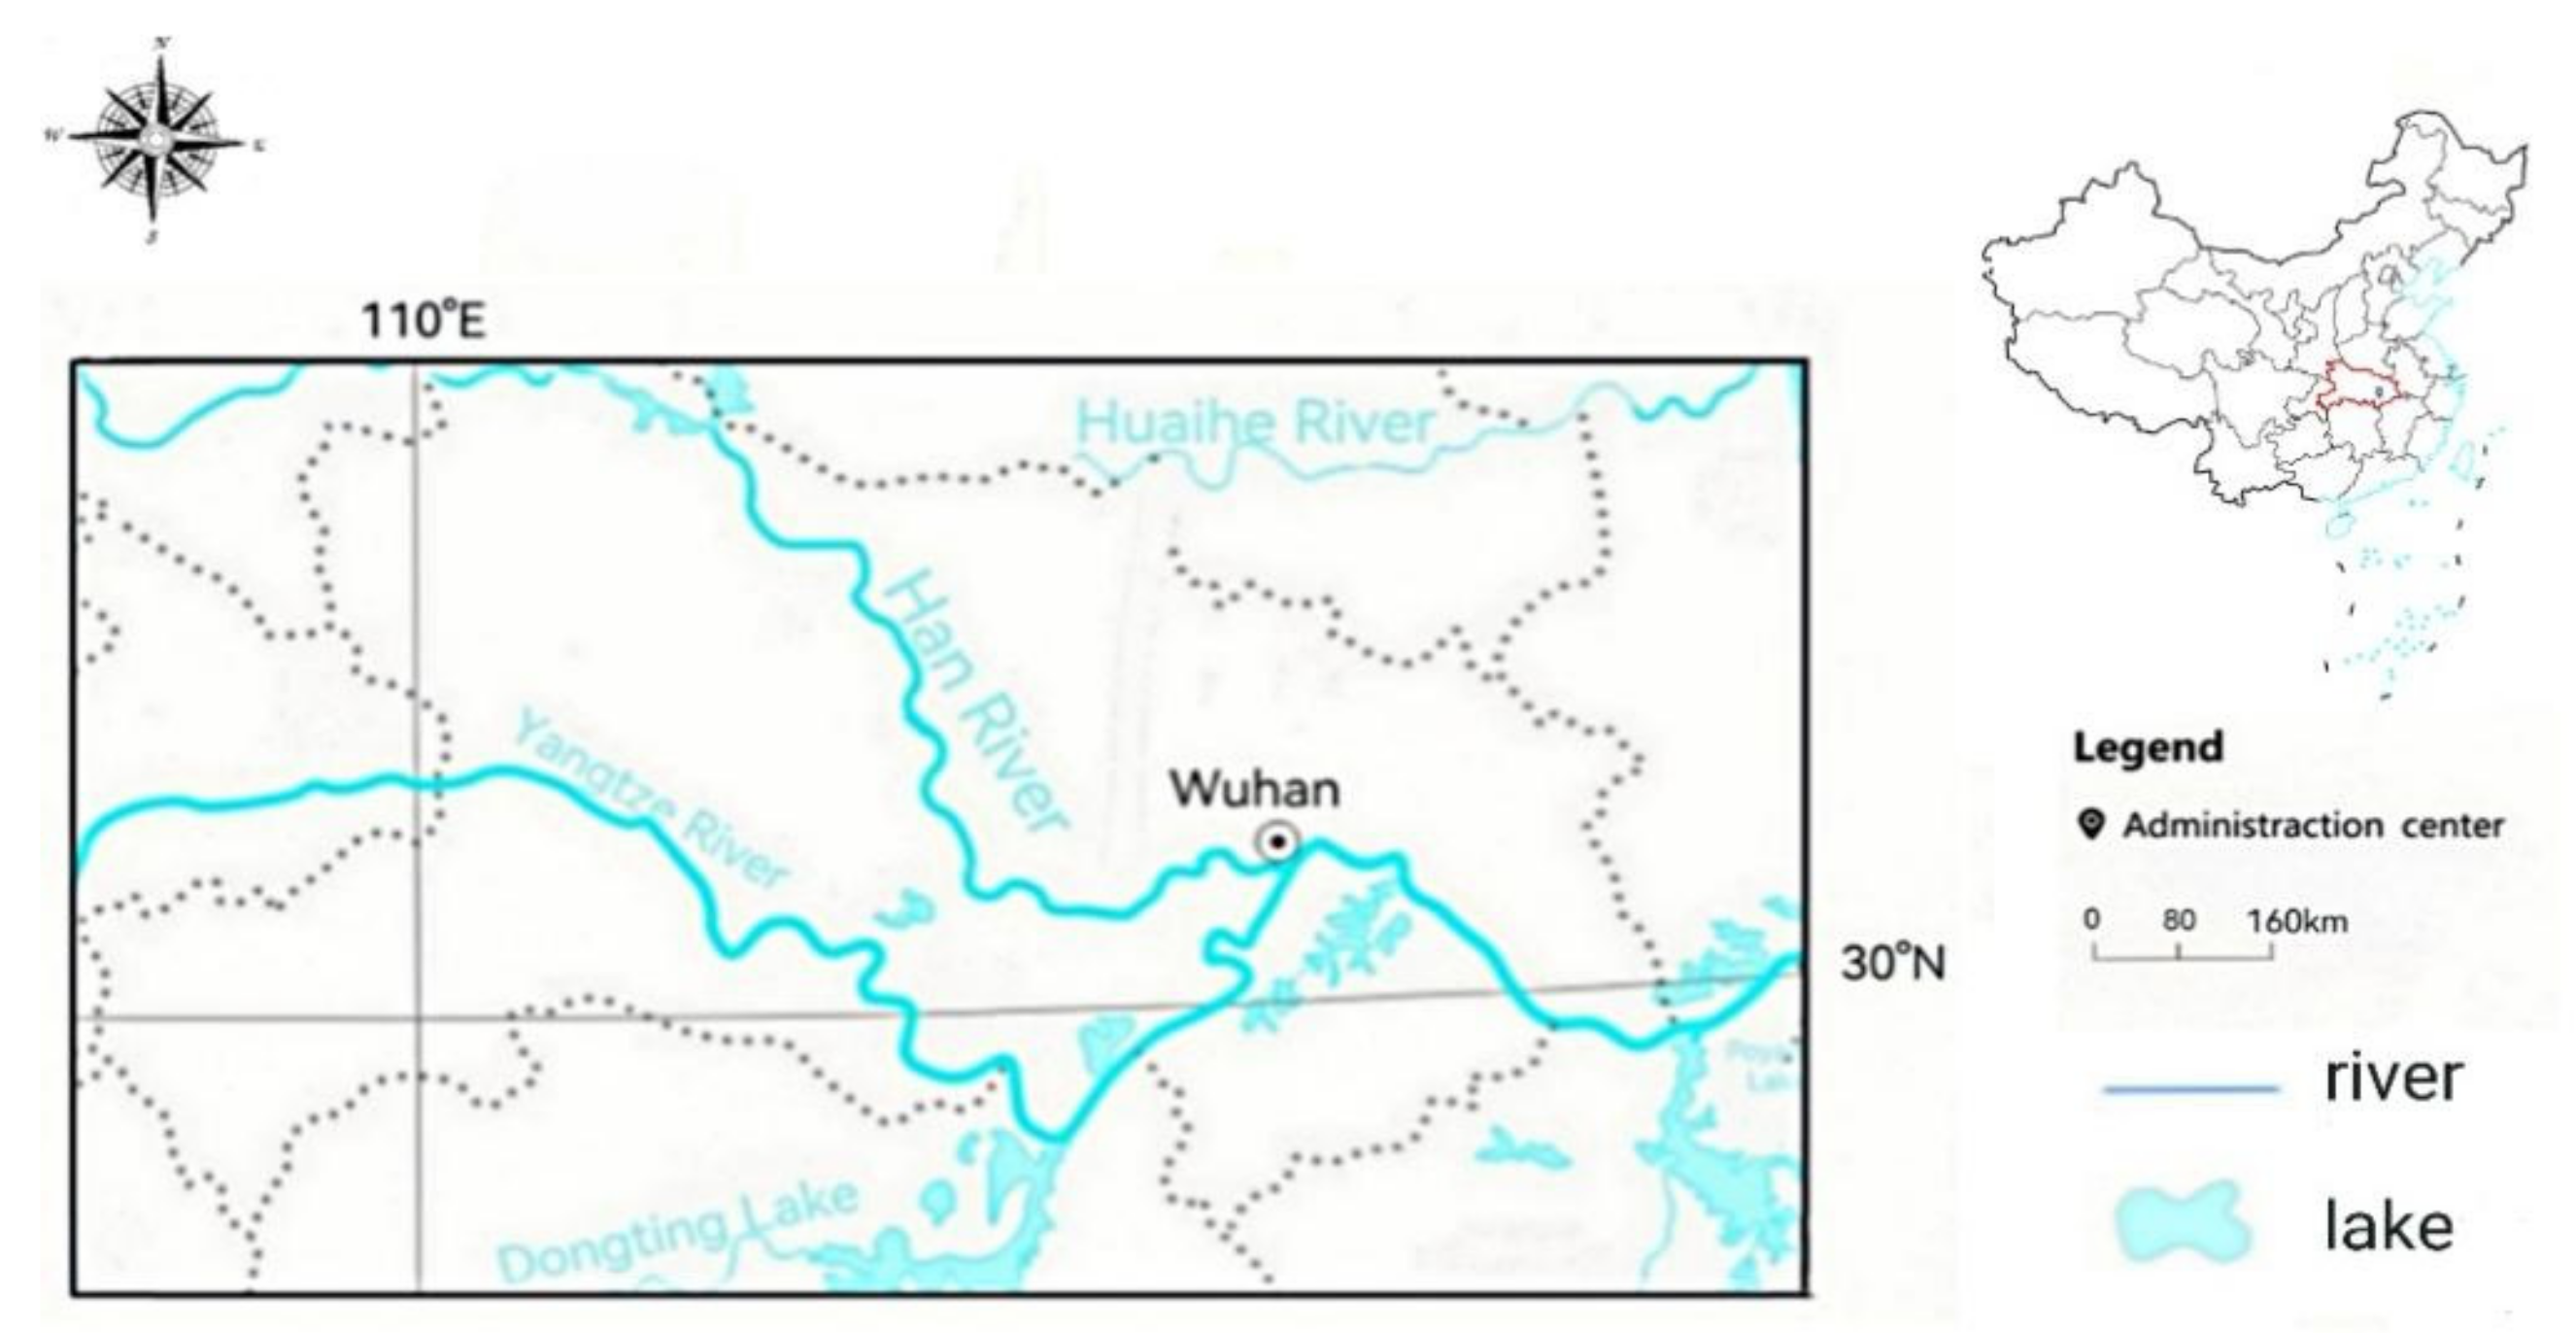
Wuhan is the capital city of Hubei Province, the central city of Central China, geographically located at the confluence of the Yangtze and Han rivers, with 166 large and small lakes. As of the end of 2021, the city has jurisdiction over 13 districts, with a total area of 8569.15 square kilometers and a permanent population of 13.6489 million. Wuhan has a large number of rivers and lakes, as shown in the Figure 5.
Overall, the water resources are relatively abundant, however, these resources are also facing some crises, mainly due to the uneven distribution of seasonal rainfall, with precipitation mostly distributed in April and September, and relatively little precipitation in the remaining months. Secondly, the rivers and lakes in Wuhan are seriously polluted, and the discharge of domestic sewage is increasing year by year.
From Table 3, we can see that the total consumption of water resources is mainly in Wuchang District, Jiangxia District, Huangpi District. These three areas have more water consumption due to the demands for domestic water and agricultural water. The main factors influencing per capita water consumption are the total water supply and the population of the region. In the table, it can be seen that the areas with more water consumption per capita are in Caidian and Xinzhou districts. These two districts have a larger supply of water resources but a smaller distribution of the population.
- (1)
- Calculate the combined impact matrix
Using the DEMATEL method, the comprehensive influence matrix is calculated on the basis of obtaining the initial influence matrix according to the 2.2 equation. As shown in Table 4:
- (2)
- DEMATEL model calculation results
According to the comprehensive impact relationship matrix, the correlation between the evaluation indicators is obtained, the degree of influence, the degree of being affected, the degree of influence, the degree of centrality, and the degree of cause of the indicator are calculated, and the centrality is sorted, as shown in Table 5:
From Table 5, the centrality of the rainwater resource utilization rate is the largest, followed by the reclaimed water utilization rate. This indicates that in the evaluation of water resilience in Wuhan, the utilization rate of rainwater resources is the main factor affecting water resilience. The factors affecting water resilience in Wuhan are, in order of greater to smallest: the total annual runoff control rate of the city X1, the water quality compliance rate of drinking water sources X12, the extent of the green area X4, the urban heat island value X3, the built-up area water surface rate X2, the pipeline network leakage rate X14, the groundwater overexploitation rate X11, the groundwater three types and above water body ratio X9, the per capita pipe network base X13, and the non-point source pollution control rate X10. These factors have a greater impact on other influencing factors, and they are also relatively difficult to change. The key factors, from largest to smallest, were the rainwater resource utilization rate X6, the reclaimed water utilization rate X5, the surface water three and above water body ratio X8, and the water resource satisfaction X7, which were greatly affected by other factors.
- (3)
- Indicator causality analysis.
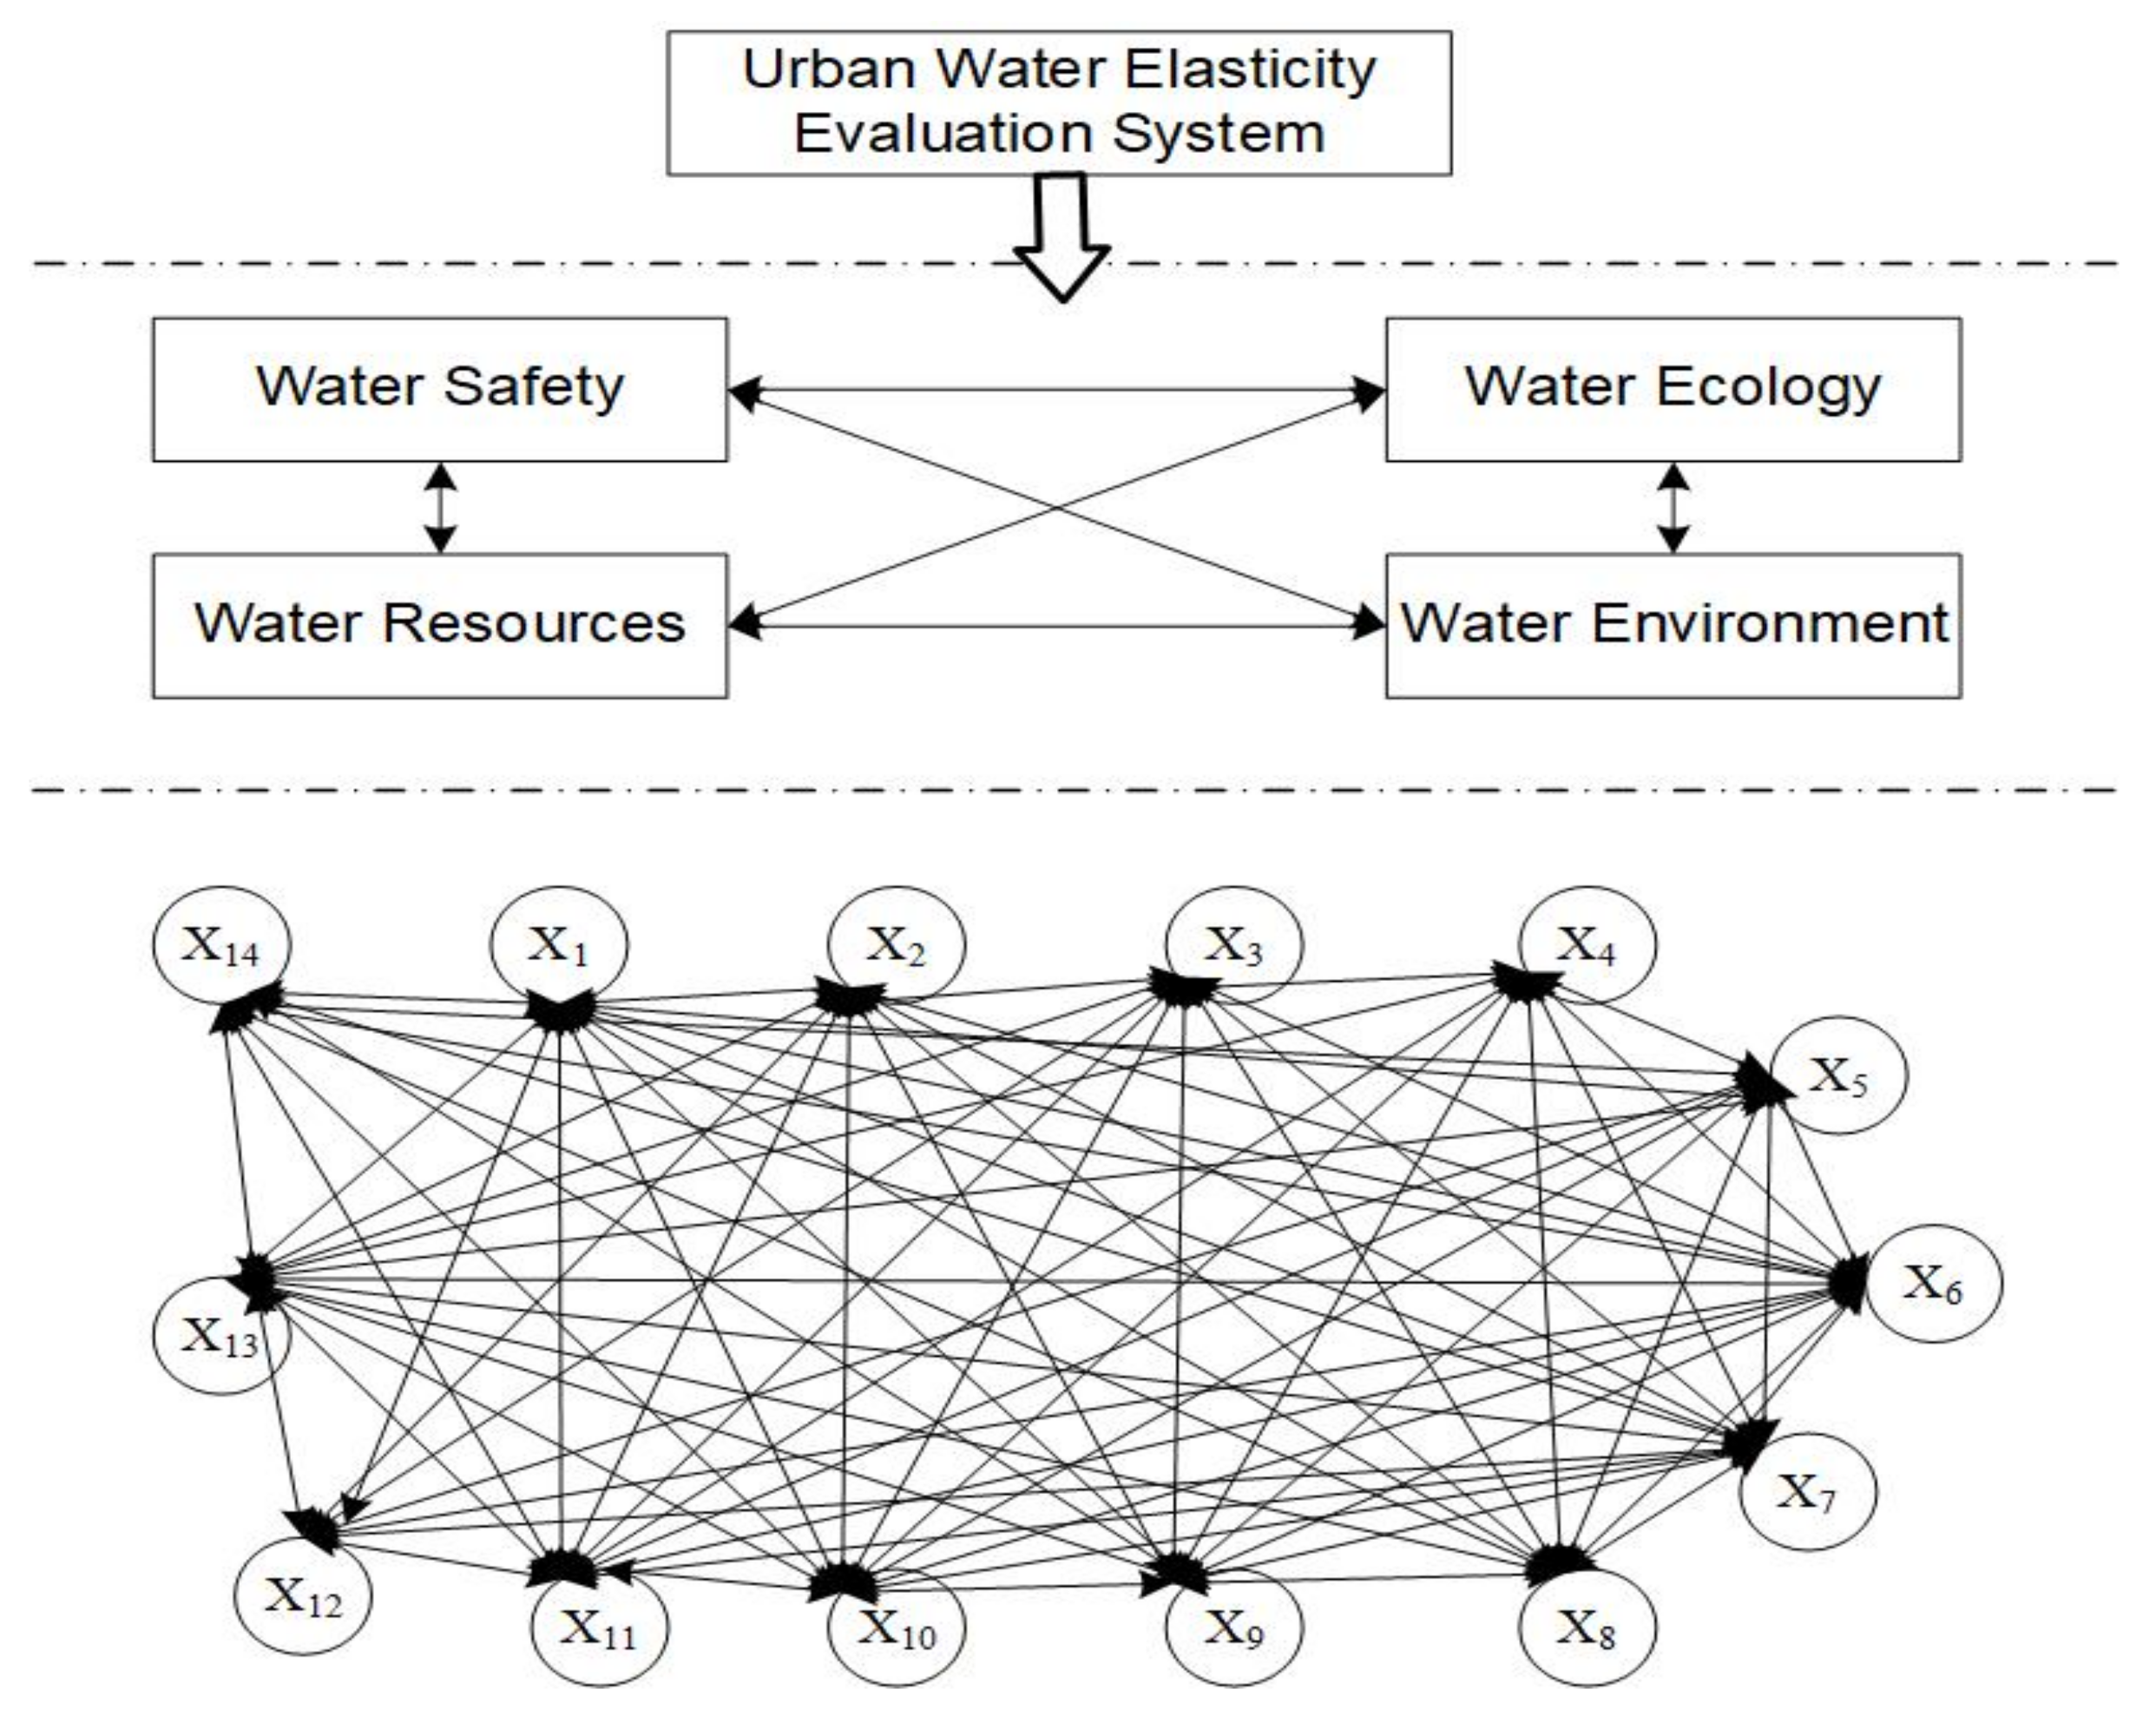
Taking the centrality as the horizontal axis and the cause degree as the vertical axis, the causal relationship diagram of the water elastic toughness index in Wuhan was drawn (Figure 6), revealing the network relationship structure characteristics between the indicators. Since DEMATEL is a directed model, the graph uses directed arrows to identify the causal relationship between the indicators, and the arrow is the impact indicator where it is emitted, and the affected indicator is pointed out. Due to space limitations, only first-level indicators are analyzed (Figure 6).
Water ecology is an important indicator of urban water resilience. Through (a) of Figure 6, it can be found that the total annual runoff control of the city (X1) is ranked the highest among the indexes, and the total amount of urban annual runoff control has a significant direct impact on the urban water resilience of Wuhan. This can also have a positive impact on other indicators, becoming an important driving factor for improving urban water resilience.
Water resources are the key dimensions that determine the improvement of water resilience. From (b) of Figure 6 can be found that the centrality value of water resources indicators is relatively high, which shows that water resources have the strongest relationship of urban water resilience and are the key indicators for improving urban water resilience. While water resources indicators are closely related to water ecological indicators, water environment indicators, and water security indicators, and when the water ecology and water environment are improved, the water security is improved to a certain extent, and the direct effect is that the water resources are replenished and will become more abundant.
Water environment and water security indicators occupy a relatively secondary position in the urban water resilience indicator system. From (c) and (d) of Figure 6, it can be found that the groundwater over-recovery rate has a direct negative impact on the evaluation of urban water resilience. The leakage rate of the pipe network also has a greater impact on other factors, second only to the influence of groundwater overextraction. In general, in the urban water resilience evaluation index system, the centrality value and the total impact of the water environment and water security are relatively weak, because under the development goal of improving urban water resilience, the integration of the water environment, water security, and water resilience still needs to be further improved.
- (4)
- Index Weight
Based on the network structure of the Wuhan water resilience evaluation model, before calculating the weightless super matrix, a judgment matrix was constructed. After consulting with experts, the judgment matrix for the pairwise comparison of each indicator was developed, and these judgments were entered into the Super Decisions software to calculate the weightless super-matrix. A column is a sorting weight based on the element. If there is no effect, the value is 0. The super decision software was used to compare the importance of all indicators in the network layer. This was then used to establish a judgment matrix and test its consistency, calculate, and generate an unweighted super-matrix, a weighted super-matrix, as shown in see Appendix A Table A1 and Table A2, and obtain the global weights and local weights of each index. This is shown in Table 6.
From Table 6, it can be seen that under the target layer, the weights of the four criterion layers of water ecology, water resources, water environment, and water security are 0.229, 0.526, 0.186, and 0.059, respectively. Thus, the water resources layer occupies the largest weight, indicating that it is particularly important for the development of water resilience in Wuhan, followed by the water ecology, the water environment, and the water security. The largest weight in the water ecological criterion layer is the total annual runoff control rate of the city. It is 0.121, and the weight of the rainwater resource utilization rate in the water resources criterion layer is up to 0.323, indicating that the utilization of rainwater resources is crucial to the evaluation of water resilience in Wuhan; the ratio of surface water class III and above-water bodies in the aquatic environment is equally important and the ratio of groundwater class III and above-water bodies is equally important, and the weight accounts for 0.077. Under the water safety criterion layer, the weight of the water quality compliance rate of drinking water sources is a maximum of 0.032, because it directly reflects the degree of safety and security of drinking water for urban residents in Wuhan and plays an important role in the construction of urban water resilience in Wuhan.
- (5)
5. Discussion
From Figure 7, it can be seen that the four indicators of rainwater resource utilization, the reclaimed water utilization, the rate of urban total annual runoff, and the degree of water resource satisfaction, account for a large proportion of water resilience, with the utilization of rainwater resources accounting for the most.
Water elasticity is based on the ability to cope with the problems of urban water deficiency, rainstorms, and flood events, and early runoff pollution in the rainwater as the core function. An evaluation of urban water elasticity is conducive to finding key indicators that affect the elasticity of urban water. From Figure 7, we can see that the utilization of rainwater resources (X6) is the key factor in the ranking of the water elastic evaluation index system. The utilization of rainwater resources can alleviate the shortage of water resources and reduce urban waterlogging and control pollution, which is of great significance to the development of socio-economic development [49]. It is believed that rainwater resources are an important part of the city, and the pollution control and resource recovery of rainwater in urban areas should be prioritized. These include the adoption of effective measures for rainwater resources, such as rainwater interception and penetration, roof rainwater and storage, etc., and a large amount of rainwater storage ponds have been built to store rainwater. The problem of insufficient resources can also reduce the rainwater entering the drainage pipe network, alleviate the drainage pressure of the pipeline, and effectively alleviate the problems of urban waterlogging. This also fully illustrates that the primary task of urban water elasticity is to increase the utilization rate of rainwater resources.
The weight of recycled water conservancy (X5) was ranked second in all indicators. Regenerative water mainly refers to the proper treatment of recycled rainwater, industrial drainage, and drainage from sewage treatment plants to achieve the prescribed water quality standards so that it can be used again. The calculation of the recycled water conservancy rate in the treatment is generally the ratio of recycled water utilization to sewage emissions [50]. It is believed that the recycled water plays an important role in maintaining the sustainable use of urban water resources. A system dynamic urban regeneration water model (SDURWM) that considers the current status of the northwest of China ((SDURWM). RWB) and the utilization efficiency index (RWUE) as evaluation indicators has provided some effective solutions for government planning and the development of regenerative water [51]. As a potential water source with a stable and reliable volume, regeneration utilization is one of the effective ways to realize open source, reduce water pollution, and solve the current status of urban water shortages. The entire process of sewage regeneration, including purification, reuse, and water circulation, can effectively alleviate urban waterlogging and control sewage problems. This effectively ensures the living environment of urban residents. Therefore, the recycling water conservancy rate is also an important indicator of urban water elasticity.
The total annual runoff control rate (X1) is the third indicator of weight ranking. Urban runoff source control facilities are an important part of a sponge city [52]. Formula pollutants play an important role in alleviating urban floods [53]. During the construction of a water elastic city, “source reduction, process control, and end governance” are key considerations. The benefits of the penetration, storage, stagnation, net, and use of rainwater mainly rely on the volume control of rainfall. This is reflected in the core indicators of the total runoff control rate. The larger the total annual runoff control rate, the smaller the urban rainwater crisis facing the city. This suggests that an increase in the total runoff control rate of the annual runoff plays an important role in promoting the elasticity of urban water.
The degree of water satisfaction (X7) is the fourth indicator of weight ranking. Urban water elastic evaluations should include measures such as the improvement of the water supply capacity of the city, the restoration of vegetation, and the maintenance of water. The degree of satisfaction of water resources is the basis for the measurement of urban water conservation capabilities, including the power supply for water resources [54]. This is an important evaluation indicator for water elastic urban construction [55]. When water resources are not satisfied, it will bring a sense of crisis [56]. During the study, most respondents were found to be willing to adopt response strategies through their daily activities. Although the water resources crisis affects people’s work and daily activities, the positive impact of the crisis is that the attitude of residents’ value to water has changed, and they now pay more attention to the saving and protection of water resources.
These research results are based on the evaluation of water elasticity in the city of Wuhan, but these approaches can also be applied to other provinces and cities. Although there will be some differences in the water resources of each city, the model encompasses versatility to allow for this. Therefore, through this evaluation model, the research results of water elasticity in other cities can be obtained to get specific analysis results. This study proposes four primary indicators of water resource elasticity, namely rainwater resource utilization, regenerative water conservancy rate, total annual runoff control rate, and water resource satisfaction. Policy makers and practitioners responsible for water resource management can use these findings to inform decision making towards the optimization of measures based on the relationship between these indicators.
6. Conclusions
With the rapid growth of the population, rapid urbanization, economic development, and climate change, the importance of water resources management is increasingly prominent. The evaluation of urban water elasticity can help to reduce and manage natural hazards, improve urban water supply services, and promote new methods for water resource management. When evaluating the elasticity of urban water, 14 indicators were considered; namely: the total annual runoff control rate (X1), the surface water surface rate (X2), the green space rate (X3) of the construction area (X4), the recycled water conservancy rate (X5), the rainwater resource utilization rate (X6), the water resource satisfaction (X7), the surface water III and above-water body ratio (X8), the groundwater III and above-water body ratio (X9), the point source pollution control rate (X10), the groundwater over-exploitation rate (X11), the drinking water source water quality compliance rate (X12), the per capita pipe network base (X13), and the pipe network leakage rate (X14). This research focused on the rapid development of China and the larger city scale. First, the impact of each evaluation indicator was determined based on the DEMATEL method. Then, combined with the network level analysis method, the weighting of the various indicators of water elasticity for Wuhan were calculated. Based on the findings from this analysis, we can draw the following conclusions:
- First of all, through the literature review and the Delphi method, an urban water elasticity evaluation system was established, with a total of 14 indicators. According to the DEMATEL method, the numerical values and rankings of the degree of influence, the degree of influence, the degree of cause, and the degree of centrality are obtained, and the degree of influence between them is determined. We conclude that the total amount of urban runoff control has a significant direct impact on the urban water elasticity of Wuhan, affecting the exertion of water elasticity, and can also have a positive impact on other indicators, which has become an important driving factor for improving urban water resilience. Water resources have the strongest influence among the influencing factors of urban water resilience and are the key indicators towards improving urban water resilience.
- The innovation of this research lies in the research perspective, combined with the background of the sponge city development currently proposed in China. Further, the study of the elasticity of urban water resources is carried out by selecting Wuhan City as the research goal. In the process of this research, two currently popular evaluation methods were combined, namely DEMATEL and ANP. After determining the degree of influence between the evaluation indicators through DEMATEL, the weight of each evaluation index was obtained by combining the ANP method with the Super Decision software. Four key indicators of the fourteen evaluation indicators were extracted, namely the rainwater resource utilization rate (X6), the reclaimed water utilization rate (X5), the total annual runoff control rate (X1), and the water resources satisfaction degree (X7). These are in line with the actual construction of a water elastic city in Wuhan, and the model can effectively reflect the actual situation of water elastic development in Wuhan. This represents a sound scientific and reasonable basis towards increasing the elasticity of urban water and can help focus efforts towards considering some of the key factors that affect the elasticity of water elasticity.
- The key research results are that combining the DEMATEL method and the ANP method provides a more comprehensive account of the interaction between the evaluation indicators of water elasticity in Wuhan. This has determined the importance of each index based on the causal relationship between the indicators, with the four indicators of rainwater resource utilization, reclaimed water utilization rate, urban annual runoff total control rate, and water resource satisfaction degree being the key indicators of the urban water resilience evaluation system. This provides a more scientific and robust analysis basis for the urban development of Wuhan, especially in the process of improving urban water elasticity. This will enable developers and government departments to focus on some of the key factors affecting water resilience that rank high in the weights extracted through this research process.
It is acknowledged that there are still some deficiencies in this research. The use of the DEMATEL and ANP method mainly depends on the personal ideas, experiences, and knowledge levels of relevant decision makers. Therefore, there may be a situation where the evaluation model changes based on the views of a different group of experts. To a certain extent, this will affect the final evaluation results. Second, it should be acknowledged that there are differences in the beliefs of the experts involved in decision-making, which should be considered in the study, and would require more attention in future studies. We can select a city abroad as the research object, invite experts with different beliefs in different regions and countries to participate, continue to use the DECENTL–ANP model to evaluate the water resilience of other cities, and compare the results with this research. Finally, in the process of determining the weight of the ANP indicators, the Delphi method was used and is in part dependent on the scores from the experts involved. This represents a level of subjectivity in the research, which while mitigated through the careful selection of appropriately experienced experts, has to be acknowledged.
Author Contributions
All authors were involved in the production and writing of the manuscript. Conceptualization, W.X.; methodology, W.X. and Y.K.; software, Y.Z. (Yuan Zhang); validation, W.X., Y.K., D.P. and J.X.; investigation, W.X. and Y.K.; data curation, Y.Z. (Yuwan Zhang) and Y.K.; writing—original draft preparation, W.X. and Y.K.; writing—review and editing, W.X., Y.K., D.P. and Y.Z. (Yuwan Zhang); visualization, J.X.; supervision, D.P. and Y.Z. (Yuan Zhang). All authors have read and agreed to the published version of the manuscript.
Funding
This research was funded by the National Natural Science Foundation of China [grant no.71503194], the Foundation of Education Department of Hubei Province [grant no. B2020312].
Institutional Review Board Statement
Not applicable.
Informed Consent Statement
Informed consent was obtained from all subjects involved in the study.
Data Availability Statement
Some or all data, models, or code that support the findings of this study are available from the corresponding author upon reasonable request.
Conflicts of Interest
The authors declare no conflict of interest.
Appendix A

Table A1.
Unweighted Supermatrix.
| X1 | X2 | X3 | X4 | X5 | X6 | X7 | X8 | X9 | X10 | X11 | X12 | X13 | X14 | |
|---|---|---|---|---|---|---|---|---|---|---|---|---|---|---|
| X1 | 0.52572 | 0.45725 | 0.46488 | 0.50579 | 0.46380 | 0.55923 | 0.54755 | 0.55580 | 0.54912 | 0.52275 | 0.54990 | 0.44369 | 0.55360 | 0.43861 |
| X2 | 0.24532 | 0.25237 | 0.24395 | 0.23491 | 0.25005 | 0.18921 | 0.20846 | 0.25891 | 0.20520 | 0.24806 | 0.22964 | 0.26454 | 0.21289 | 0.26827 |
| X3 | 0.18278 | 0.19982 | 0.23616 | 0.21280 | 0.23149 | 0.18223 | 0.23485 | 0.13639 | 0.20686 | 0.17755 | 0.16734 | 0.19165 | 0.23540 | 0.4031 |
| X4 | 0.04617 | 0.09056 | 0.05502 | 0.04650 | 0.05467 | 0.06933 | 0.05495 | 0.04890 | 0.03882 | 0.05164 | 0.05312 | 0.05693 | 0.04185 | 0.05772 |
| X5 | 0.24985 | 0.21025 | 0.28571 | 0.38853 | 0.25000 | 0.25000 | 0.25000 | 0.31326 | 0.14286 | 0.25000 | 0.25000 | 0.25000 | 0.25000 | 0.25000 |
| X6 | 0.65481 | 0.69424 | 0.57143 | 0.28811 | 0.25000 | 0.25000 | 0.25000 | 0.38741 | 0.42857 | 0.25000 | 0.25000 | 0.25000 | 0.25000 | 0.25000 |
| X7 | 0.09534 | 0.09551 | 0.14286 | 0.08324 | 0.25000 | 0.25000 | 0.25000 | 0.09519 | 0.21429 | 0.25000 | 0.25000 | 0.25000 | 0.25000 | 0.25000 |
| X8 | 0.52915 | 0.31112 | 0.42879 | 0.24012 | 0.25000 | 0.25000 | 0.25000 | 0.20414 | 0.21429 | 0.25000 | 0.25000 | 0.25000 | 0.25000 | 0.25000 |
| X9 | 0.21851 | 0.43172 | 0.33623 | 0.33252 | 0.30000 | 0.28571 | 0.27928 | 0.22965 | 0.27969 | 0.17443 | 0.28720 | 0.31962 | 0.25828 | 0.26837 |
| X10 | 0.15747 | 0.06970 | 0.06677 | 0.52784 | 0.60000 | 0.57143 | 0.63939 | 0.64833 | 0.62670 | 0.69406 | 0.63484 | 0.55842 | 0.63699 | 0.61441 |
| X11 | 0.09488 | 0.18746 | 0.16822 | 0.13965 | 0.10000 | 0.14286 | 0.08132 | 0.12202 | 0.09362 | 0.13151 | 0.07796 | 0.12196 | 0.10473 | 0.11722 |
| X12 | 0.31962 | 0.24021 | 0.26837 | 0.31081 | 0.13111 | 0.29696 | 0.21584 | 0.42857 | 0.17437 | 0.27969 | 0.31081 | 0.23115 | 0.31081 | 0.36806 |
| X13 | 0.55842 | 0.54995 | 0.61441 | 0.49339 | 0.66076 | 0.53961 | 0.68165 | 0.42857 | 0.63371 | 0.62670 | 0.49339 | 0.70852 | 0.49339 | 0.54981 |
| X14 | 0.12196 | 0.20984 | 0.11722 | 0.14286 | 0.20813 | 0.16342 | 0.10251 | 0.14286 | 0.19192 | 0.09362 | 0.19580 | 0.06033 | 0.19580 | 0.08213 |
Table A2.
Limit Supermatrix.
| X1 | X2 | X3 | X4 | X5 | X6 | X7 | X8 | X9 | X10 | X11 | X12 | X13 | X14 | |
|---|---|---|---|---|---|---|---|---|---|---|---|---|---|---|
| X1 | 0.12125 | 0.12125 | 0.12125 | 0.12125 | 0.12125 | 0.12125 | 0.12125 | 0.12125 | 0.12125 | 0.12125 | 0.12125 | 0.12125 | 0.12125 | 0.12125 |
| X2 | 0.05076 | 0.05076 | 0.05076 | 0.05076 | 0.05076 | 0.05076 | 0.05076 | 0.05076 | 0.05076 | 0.05076 | 0.05076 | 0.05076 | 0.05076 | 0.05076 |
| X3 | 0.04448 | 0.04448 | 0.04448 | 0.04448 | 0.04448 | 0.04448 | 0.04448 | 0.04448 | 0.04448 | 0.04448 | 0.04448 | 0.04448 | 0.04448 | 0.04448 |
| X4 | 0.01355 | 0.01355 | 0.01355 | 0.01355 | 0.01355 | 0.01355 | 0.01355 | 0.01355 | 0.01355 | 0.01355 | 0.01355 | 0.01355 | 0.01355 | 0.01355 |
| X5 | 0.14326 | 0.14326 | 0.14326 | 0.14326 | 0.14326 | 0.14326 | 0.14326 | 0.14326 | 0.14326 | 0.14326 | 0.14326 | 0.14326 | 0.14326 | 0.14326 |
| X6 | 0.32284 | 0.32284 | 0.32284 | 0.32284 | 0.32284 | 0.32284 | 0.32284 | 0.32284 | 0.32284 | 0.32284 | 0.32284 | 0.32284 | 0.32284 | 0.32284 |
| X7 | 0.06080 | 0.06080 | 0.06080 | 0.06080 | 0.06080 | 0.06080 | 0.06080 | 0.06080 | 0.06080 | 0.06080 | 0.06080 | 0.06080 | 0.06080 | 0.06080 |
| X8 | 0.07683 | 0.07683 | 0.07683 | 0.07683 | 0.07683 | 0.07683 | 0.07683 | 0.07683 | 0.07683 | 0.07683 | 0.07683 | 0.07683 | 0.07683 | 0.07683 |
| X9 | 0.07622 | 0.07622 | 0.07622 | 0.07622 | 0.07622 | 0.07622 | 0.07622 | 0.07622 | 0.07622 | 0.07622 | 0.07622 | 0.07622 | 0.07622 | 0.07622 |
| X10 | 0.01160 | 0.01160 | 0.01160 | 0.01160 | 0.01160 | 0.01160 | 0.01160 | 0.01160 | 0.01160 | 0.01160 | 0.01160 | 0.01160 | 0.01160 | 0.01160 |
| X11 | 0.02123 | 0.02123 | 0.02123 | 0.02123 | 0.02123 | 0.02123 | 0.02123 | 0.02123 | 0.02123 | 0.02123 | 0.02123 | 0.02123 | 0.02123 | 0.02123 |
| X12 | 0.01551 | 0.01551 | 0.01551 | 0.01551 | 0.01551 | 0.01551 | 0.01551 | 0.01551 | 0.01551 | 0.01551 | 0.01551 | 0.01551 | 0.01551 | 0.01551 |
| X13 | 0.03253 | 0.03253 | 0.03253 | 0.03253 | 0.03253 | 0.03253 | 0.03253 | 0.03253 | 0.03253 | 0.03253 | 0.03253 | 0.03253 | 0.03253 | 0.03253 |
| X14 | 0.00915 | 0.00915 | 0.00915 | 0.00915 | 0.00915 | 0.00915 | 0.00915 | 0.00915 | 0.00915 | 0.00915 | 0.00915 | 0.00915 | 0.00915 | 0.00915 |
References
- Li, C.; Liu, M.; Hu, Y.; Wang, H.; Zhou, R.; Wu, W.; Wang, Y. Spatial distribution patterns and potential exposure risks of urban floods in Chinese megacities. J. Hydrol. 2022, 610, 127838. [Google Scholar] [CrossRef]
- Herslund, L.; Mguni, P. Examining urban water management practices—Challenges and possibilities for transitions to sustainable urban water management in Sub-Saharan cities. Sustain. Cities Soc. 2019, 48, 101573. [Google Scholar] [CrossRef]
- Xu, W.; Zhong, M.; Hong, Y.; Lin, K. Enhancing community resilience to urban floods with a network structuring model. Saf. Sci. 2020, 127, 104699. [Google Scholar] [CrossRef]
- Sun, M.; Kato, T. Spatial-temporal analysis of urban water resource vulnerability in china. Ecol. Indic. 2021, 133, 108436. [Google Scholar] [CrossRef]
- Zölch, T.; Henze, L.; Keilholz, P.; Pauleit, S. Regulating urban surface runoff through nature-based solutions—An assessment at the micro-scale. Environ. Res. 2017, 157, 135–144. [Google Scholar] [CrossRef]
- Muñoz, E.; Guzmán, C.; Medina, Y.; Boll, J.; Parra, V.; Arumí, J.L. An Adaptive Basin Management Rule to Improve Water Allocation Resilience under Climate Variability and Change—A Case Study in the Laja Lake Basin in Southern Chile. Water 2019, 11, 1733. [Google Scholar] [CrossRef] [Green Version]
- Song, C. Application of nature-based measures in China’s sponge city initiative: Current trends and perspectives. Nat.-Based Solut. 2022, 2, 100010. [Google Scholar] [CrossRef]
- World Water Development Report. Available online: https://www.h2o-china.com/news/322579.html (accessed on 22 March 2021).
- Darnthamrongkul, W.; Mozingo, L.A. Toward sustainable stormwater management: Understanding public appreciation and recognition of urban Low Impact Development (LID) in the San Francisco Bay Area. J. Environ. Manag. 2021, 300, 113716. [Google Scholar] [CrossRef]
- Amirzadeh, M.; Sobhaninia, S.; Sharifi, A. Urban resilience: A vague or an evolutionary concept. Sustain. Cities Soc. 2022, 81, 103853. [Google Scholar] [CrossRef]
- Pyke, C.; Warren, M.P.; Johnson, T.; LaGro, J.; Scharfenberg, J.; Groth, P.; Freed, R.; Schroeer, W.; Main, E. Assessment of low impact development for managing stormwater with changing precipitation due to climate change. Landsc. Urban Plan. 2011, 103, 166–173. [Google Scholar] [CrossRef]
- Andrés-Doménech, I.; Hernández-Crespo, C.; Martín, M.; Andrés-Valeri, V.C. Characterization of wash-off from urban impervious surfaces and SuDS design criteria for source control under semi-arid conditions. Sci. Total Environ. 2018, 612, 1320–1328. [Google Scholar] [CrossRef]
- Din Dar, M.U.; Shah, A.I.; Bhat, S.A.; Kumar, R.; Huisingh, D.; Kaur, R. Blue Green infrastructure as a tool for sustainable urban development. J. Clean. Prod. 2021, 318, 128474. [Google Scholar] [CrossRef]
- Coombes, P.J.; Argue, J.R.; Kuczera, G. Figtree Place: A case study in water sensitive urban development (WSUD). Urban Water 2000, 1, 335–343. [Google Scholar] [CrossRef]
- Qiu, B. The connotation, approach and prospect of sponge city (uD). Water Supply Drain. 2015, 1, 1–7. [Google Scholar]
- Voyde, E.; Fassman, E.; Simcock, R. Hydrology of an extensive living roof under sub-tropical climate conditions in Auckland. J. Hydrol. 2010, 394, 384–395. [Google Scholar] [CrossRef]
- Tingsanchali, T. Urban flood disaster management. Procedia Eng. 2012, 32, 25–37. [Google Scholar] [CrossRef] [Green Version]
- Adedeji, T.; Proverbs, D.; Xiao, H.; Cobbing, P.; Oladokun, V. Making Birmingham a Flood Resilient City: Challenges and Opportunities. Water 2019, 11, 1699. [Google Scholar] [CrossRef] [Green Version]
- Nguyen, T.T.; Ngo, H.H.; Guo, W.; Xiaochang, C.W.; Ren, N.; Li, G.; Ding, J.; Liang, H. Implementation of a specific urban water management—Sponge City. Sci. Total Environ. 2019, 652, 147–162. [Google Scholar] [CrossRef]
- Hou, J.; Mao, H.; Li, J.; Sun, S. Spatial simulation of the ecological processes of stormwater for sponge cities. J. Environ. Manag. 2019, 232, 574–583. [Google Scholar] [CrossRef]
- Qiao, X.; Kristoffersson, A.; Thomas, B.R. Challenges to implementing urban sustainable stormwater management from a governance perspective: A literature review. J. Clean. Prod. 2018, 196, 943–952. [Google Scholar] [CrossRef]
- Shanfeng, H.E.; Xin, W. Urban waterlogging disaster risk management under changing environment: Challenges and responses. J. Henan Polytech. Univ. 2019, 20, 48–53. [Google Scholar]
- Wang, Y.; Liu, Z.; Wang, G.; Xue, W. Cellular automatabased framework for evaluating mitigation strategies of sponge city. Sci. Total Environ. 2021, 796, 148991. [Google Scholar] [CrossRef] [PubMed]
- Cheng, T.; Huang, B.; Yang, Z.; Qiu, J.; Zhao, B.; Xu, Z. On the effects of flood reduction for green and grey sponge city measures and their synergistic relationship—Case study in Jinan sponge city pilot area. Urban Clim. 2022, 42, 101058. [Google Scholar] [CrossRef]
- Chan, F.K.S.; James, A.G.; Higgitt, D.; Xu, S.; Zhu, F.; Tang, Y.; Xu, Y.; Thorne, C.R. “Sponge City” in China—A breakthrough of planning and flood risk management in the urban context. Land Use Policy 2018, 76, 772–778. [Google Scholar] [CrossRef]
- Hao, W.; Chao, M.; Liu, J.; Shao, W. A new strategy for integrated urban water management in China: Sponge city. Sci. China Technol. Sci. 2018, 61, 317–329. [Google Scholar]
- Palazzo, E. From water sensitive to floodable: Defining adaptive urban design for water resilient cities. J. Urban Des. 2019, 24, 137–157. [Google Scholar] [CrossRef]
- Maureen. Threshold Space. Reynt Prannin ben Urban Greenspunger-Ekoloji Carrent Water Regulatiang Anderstadim. Urbande Flomen Tresecchi 2012, 5, 130–134. [Google Scholar]
- Guoru, H. Analysis of urban rainstorm waterlogging prevention and control and sponge city construction. China Flood Control. Drought Control 2018, 28, 8–14. [Google Scholar]
- Wu, J.; Guan, J. A Review of the Research Progress of Sponge City Concept and Its Theory. South. Archit. 2018, 3, 34–39. [Google Scholar]
- Hongqun, C.; Jiaxue, S.; Rui, J.; Huiling, Q. Research on Performance Evaluation of Sponge City Construction Based on Group Evaluation. Sci. Technol. Manag. Res. 2016, 36, 42–47. [Google Scholar]
- Huang, L.; Zhang, P. Index Weight Setting Analysis for Sponge City Performance Evaluation. Green Technol. 2016, 22, 117–122. [Google Scholar]
- Zhu, L.; Xu, X.; Zhu, L.; Hua, Y. Construction and practice of sponge city evaluation index system in Wuxi. Water Conserv. Plan. Des. 2018, 6, 17–18. [Google Scholar]
- Huang, J.; Wu, X.; Jiang, S. Geological impact and suitability evaluation of sponge city construction: A case study of Xuzhou. Geol. Rev. 2018, 64, 1472–1480. [Google Scholar]
- She, L.; Wei, M.; You, X. Multi-objective layout optimization for sponge city by annealing algorithm and its environmental benefits analysis. Sustain. Cities Soc. 2021, 66, 102706. [Google Scholar] [CrossRef]
- Chaocheng, C.J. Construction and Application of Sponge City Evaluation System; Southeast University: Nanjing, China, 2017. [Google Scholar]
- Babaei, S.; Ghazavi, R.; Erfanian, M. Urban flood simulation and prioritization of critical urban sub-catchments using SWMM model and PROMETHEE II approach. Phys. Chem. Earth Parts A B C 2018, 105, 3–11. [Google Scholar] [CrossRef]
- Li, Q.; Wang, F.; Yu, Y.; Huang, Z.; Li, M.; Guan, Y. Comprehensive performance evaluation of LID practices for the sponge city construction: A case study in Guangxi, China. J. Environ. Manag. 2019, 231, 10–20. [Google Scholar] [CrossRef]
- Yang, L.; Li, J.; Kang, A. The Effect of Nonstationarity in Rainfall on Urban Flooding Based on Coupling SWMM and MIKE21. Water. Resour. Manag. 2020, 34, 1535–1551. [Google Scholar] [CrossRef]
- Zawilski, M.; Sakson, G.; Brzezińska, A. Opportunities for sustainable management of rainwater: Case study of Łódź, Poland. Ecohydrol. Hydrobiol. 2014, 14, 220–228. [Google Scholar] [CrossRef]
- Irina, F.B.B.; Ferreira, F.A.F.; Ferreira, J.J.M.; Correia, R.J.C.; Pereira, L.F.; Falcão, P.F. A DEMATEL analysis of smart city determinants. Technol. Soc. 2021, 66, 101687. [Google Scholar]
- Ma, Y.; Jiang, Y.; Swallow, S. China’s sponge city development for urban water resilience and sustainability: A policy discussion. Sci. Total Environ. 2020, 729, 139078. [Google Scholar] [CrossRef]
- Ekmekcioğlu, Ö.; Koc, K.; Özger, M. Towards flood risk mapping based on multi-tiered decision making in a densely urbanized metropolitan city Istanbul. Sustain. Cities Soc. 2022, 80, 103759. [Google Scholar] [CrossRef]
- Wang, L.; Zhao, G.; Wang, C. Identification and Countermeasures of Sponge City Development Constraints Based on DEMATEL Method. Green Gases. 2021, 23, 237–241. [Google Scholar]
- Chai, N.; Zhou, W.; Wan, B. Research on performance evaluation and obstacle diagnosis or urban water ecological civilization construction based on GFAHP-cloud-FSE model: The case of Shizuishan, China. Stoch. Environ. Res. Risk Assess. 2022, 13, 1–27. [Google Scholar] [CrossRef]
- Chang, I.-S.; Zhao, M.; Chen, Y.; Guo, X.; Zhu, Y.; Wu, J.; Yuan, T. Evaluation on the integrated water resources management in China’s major cities—Based on City Blueprint Approach. J. Clean. Prod. 2020, 262, 121410. [Google Scholar] [CrossRef]
- Kiriscioglu, T.; David, M.H.; Turan, B. Urban and rural perceptions of ecological risks to water environments in southern and eastern Nevada. J. Environ. Psychol. 2013, 33, 86–95. [Google Scholar] [CrossRef]
- Veettil, A.V.; Ashok, K.M.; Green, T.R. Explaining water security indicators using hydrologic and agricultural systems models. J. Hydrol. 2022, 607, 127463. [Google Scholar] [CrossRef]
- Xue, B.; Kang, X. Study on the Pollution Control and Resource Recovery of Urban Street Rainwater. Energy Procedia 2012, 16, 2–7. [Google Scholar] [CrossRef] [Green Version]
- Zhang, T.; Guna, A.; Yu, W.; Shen, D. The recycled water use policy in China: Evidence from 114 cities. J. Clean. Prod. 2022, 344, 131038. [Google Scholar] [CrossRef]
- Li, Q.; Wang, W.; Jiang, X.; Lu, D.; Zhang, Y.; Li, J. Analysis of the potential of reclaimed water utilization in typical inland cities in northwest China via system dynamics. J. Environ. Manag. 2020, 270, 110878. [Google Scholar] [CrossRef]
- Xu, C.; Shi, X.; Jia, M.; Han, Y.; Zhang, R.; Ahmad, S.; Jia, H. China Sponge City database development and urban runoff source control facility configuration comparison between China and the US. J. Environ. Manag. 2022, 304, 114241. [Google Scholar] [CrossRef] [PubMed]
- Jia, H.; Wang, Z.; Zhen, X. China’s sponge city construction: A discussion on technical approaches. Front. Environ. Sci. Eng. 2017, 11, 1–11. [Google Scholar] [CrossRef]
- Pietrucha-Urbanik, K.; Rak, J.R. Consumers’ Perceptions of the Supply of Tap Water in Crisis Situations. Energies 2020, 13, 3617. [Google Scholar] [CrossRef]
- Al-Ghuraiz, Y.; Enshassi, A. Customers’ satisfaction with water supply service in the Gaza Strip. Build. Environ. 2006, 41, 1243–1250. [Google Scholar] [CrossRef]
- Aini, M.S.; Fakhru’l-Razi, A.; Siew Suan, K. Water crisis management: Satisfaction level, effect and coping of the consumers. Water. Resour. Manag. 2001, 15, 31–39. [Google Scholar] [CrossRef]
Figure 1.
China’s water consumption in 2015–2020 (100 million cubic meters).

Figure 2.
Schematic diagram of urban water resilience.

Figure 3.
Evaluation model of urban water resilience based on DECENTL-ANP.

Figure 4.
Evaluation model of urban water resilience.

Figure 5.
Map of study area.

Figure 6.
Evaluation index of urban water resilience.

Figure 7.
Water resilience evaluation model of Wuhan City.

Table 1.
Evaluation indicators of urban water resilience.
| Target Layer | Criterion Layer (Level 1 Indicator) | Indicator Layer (Secondary Indicator) | Description |
|---|---|---|---|
| Urban water resilience urban evaluation index system W. | Water ecological indicators A1. | Total annual runoff control rate of the city X1. | The total annual runoff control rate index refers to the proportion of the total annual rainfall in the site through natural and artificial intensified infiltration, storage, utilization, evaporation, transpiration, etc. Total annual runoff control rate = 100% − (annual outflow rainfall/annual total rainfall) ×100%. |
| Water surface rate of built-up areas X2. | The ratio of the water surface area of the urban administrative district to the total area of the area. | ||
| Green area rate in built-up areas X3. | Refers to the ratio of various types of green space in urban built-up areas to built-up areas. | ||
| Urban heat island value X4. | Refers to the increase in urban temperature due to the density of urban buildings, asphalt roads, and cement pavements that have a greater heat absorption rate and a smaller specific heat capacity than the soil and vegetation in the suburbs. | ||
| Water resource indicators A2. | Reclaimed water utilization X5. | Reclaimed water mainly refers to the water that has been or not treated by sewage treatment plants for the appropriate treatment of collected rainwater, industrial drainage, and domestic drainage, and can be reused to meet the specified water quality standards. Reclaimed water utilization rate = reclaimed water utilization/sewage discharge. | |
| Rainwater resource utilization X6. | The ratio of the total amount of rainwater collected for road watering, garden and green land irrigation, municipal miscellaneous uses, industrial and agricultural production, cooling, etc., to the average annual rainfall (converted into millimeters). | ||
| The degree of water satisfaction X7. | The ratio between demand and supply of water resources. | ||
| Water environment indicators A3. | Surface water class III and above water body ratio X8. | The ratio of the number of state-controlled surface water environmental quality monitoring sections to the total number of sections of state-controlled surface water with water quality of Class III. | |
| Groundwater class III and above water body ratio X9. | The ratio between the amount of state-controlled groundwater and the total amount of groundwater in Class III. | ||
| Non-point source pollution control rate X10. | Non-point source pollution, is mainly composed of soil sediment particles, nitrogen and phosphorus and other nutrients, pesticides, various atmospheric particles, etc., and enters the water, soil, or atmospheric environment through surface runoff, soil erosion, farmland drainage, and other ways. | ||
| Groundwater overexertion rate X11. | The ratio between groundwater over-recovery and groundwater recover ability. | ||
| Water safety indicators A4. | Drinking water source water quality compliance rate X12. | The water quality compliance rate of urban drinking water sources is calculated as a percentage of the sum of the amount of water and the total amount of water withdrawn from the water source. | |
| Network base per capita X13. | Ratio of the total number of regional water pipe networks to the total population. | ||
| Leakage rate of the pipe network X14. | The leakage rate of the pipe network refers to the ratio of the amount of water leakage in the pipe network to the total amount of water supply. This is an indicator of the efficiency of the water supply in water supply systems. Leakage rate = (annual water supply − annual effective water supply)/annual water supply × 100%. |
Table 2.
Expert panel characteristics.
| Characteristics | Number | |
|---|---|---|
| Age | 30–39 | 6 |
| 40–49 | 10 | |
| 9 | ||
| Job position | Company representative | 6 |
| Academic | 4 | |
| Government official | 7 | |
| Volunteer | 8 | |
| Expertise or research | Water resources management | 7 |
| Sponge city research | 5 | |
| Water resource reuse | 6 | |
| Water ecology | 7 | |
Table 3.
Water consumption in Wuhan (100 million cubic meters).
| Administrative Divisions | Total Water Supply | Water Consumption for Agriculture | Industrial Water Consumption | Domestic Water Consumption | Ecological and Environmental Water Consumption | Total Water Consumption | Population | Per Capita Water Consumption |
|---|---|---|---|---|---|---|---|---|
| Jiang’an | 1.047 | / | 0.062 | 0.943 | 0.042 | 1.047 | 96.530 | 108.464 |
| Jianghan | 0.693 | / | 0.010 | 0.653 | 0.030 | 0.693 | 64.790 | 107.023 |
| Qiaokou | 0.883 | / | 0.041 | 0.803 | 0.038 | 0.883 | 66.670 | 132.368 |
| Hanyang | 1.377 | / | 0.602 | 0.744 | 0.031 | 1.377 | 83.000 | 165.928 |
| Wuchang | 2.392 | / | 0.829 | 1.517 | 0.046 | 2.392 | 109.000 | 219.459 |
| Qingshan | 1.806 | / | 0.879 | 0.883 | 0.044 | 1.806 | 46.000 | 392.500 |
| Hongshan | 1.525 | 0.002 | 0.058 | 1.429 | 0.039 | 1.525 | 172.880 | 88.223 |
| Hannan | 1.472 | 0.039 | 0.525 | 0.871 | 0.038 | 1.472 | 48.000 | 306.729 |
| Dongxihu | 1.646 | 0.590 | 0.407 | 0.607 | 0.041 | 1.646 | 84.000 | 195.905 |
| Caidian | 1.585 | 1.083 | 0.165 | 0.315 | 0.022 | 1.585 | 12.120 | 1307.838 |
| Jiangxia | 2.570 | 1.465 | 0.387 | 0.672 | 0.047 | 2.570 | 97.470 | 263.681 |
Table 4.
Synthesis impact matrix.
| X1 | X2 | X3 | X4 | X5 | X6 | X7 | X8 | X9 | X10 | X11 | X12 | X13 | X14 | |
|---|---|---|---|---|---|---|---|---|---|---|---|---|---|---|
| X1 | 0.1167 | 0.0694 | 0.1696 | 0.1162 | 0.3677 | 0.4448 | 0.1661 | 0.1741 | 0.1695 | 0.0684 | 0.0786 | 0.0873 | 0.1327 | 0.0780 |
| X2 | 0.0383 | 0.1069 | 0.1516 | 0.0995 | 0.2603 | 0.2680 | 0.1384 | 0.0807 | 0.0390 | 0.1102 | 0.0476 | 0.0175 | 0.1025 | 0.0547 |
| X3 | 0.0531 | 0.1077 | 0.0551 | 0.1025 | 0.2167 | 0.3159 | 0.1397 | 0.1956 | 0.0940 | 0.0519 | 0.1055 | 0.0158 | 0.1072 | 0.11564 |
| X4 | 0.1538 | 0.1013 | 0.0707 | 0.0955 | 0.1091 | 0.2565 | 0.2427 | 0.1385 | 0.0587 | 0.1061 | 0.0295 | 0.0154 | 0.1056 | 0.0506 |
| X5 | 0.0487 | 0.0438 | 0.0432 | 0.0855 | 0.0860 | 0.2960 | 0.1666 | 0.1298 | 0.0421 | 0.0987 | 0.1443 | 0.0667 | 0.0353 | 0.1027 |
| X6 | 0.0176 | 0.0794 | 0.0238 | 0.0195 | 0.1024 | 0.1195 | 0.0335 | 0.0842 | 0.0132 | 0.0796 | 0.0196 | 0.0070 | 0.0756 | 0.0254 |
| X7 | 0.0313 | 0.0392 | 0.1509 | 0.0350 | 0.0865 | 0.1652 | 0.1076 | 0.1799 | 0.1501 | 0.0843 | 0.0388 | 0.0069 | 0.0424 | 0.1082 |
| X8 | 0.0354 | 0.0285 | 0.1430 | 0.0869 | 0.0622 | 0.0921 | 0.1075 | 0.1159 | 0.0314 | 0.0222 | 0.0835 | 0.0057 | 0.0264 | 0.0936 |
| X9 | 0.0465 | 0.0969 | 0.0282 | 0.0311 | 0.2047 | 0.2268 | 0.0576 | 0.0527 | 0.0803 | 0.0363 | 0.0932 | 0.0147 | 0.1523 | 0.1003 |
| X10 | 0.0239 | 0.0892 | 0.0213 | 0.0227 | 0.1255 | 0.2538 | 0.0361 | 0.0423 | 0.0738 | 0.0898 | 0.0233 | 0.0087 | 0.0328 | 0.0850 |
| X11 | 0.0906 | 0.0980 | 0.0326 | 0.0307 | 0.1531 | 0.3459 | 0.0478 | 0.0575 | 0.0845 | 0.0397 | 0.0879 | 0.0143 | 0.0451 | 0.0911 |
| X12 | 0.1455 | 0.0254 | 0.0367 | 0.03185 | 0.1897 | 0.1787 | 0.0502 | 0.1097 | 0.0325 | 0.0280 | 0.0962 | 0.0785 | 0.0284 | 0.0336 |
| X13 | 0.1541 | 0.0826 | 0.0468 | 0.0382 | 0.2076 | 0.1224 | 0.1213 | 0.0631 | 0.0391 | 0.0336 | 0.0344 | 0.0212 | 0.0895 | 0.0962 |
| X14 | 0.2207 | 0.0316 | 0.0674 | 0.1123 | 0.2753 | 0.1664 | 0.1508 | 0.2036 | 0.0533 | 0.0433 | 0.0532 | 0.0291 | 0.0414 | 0.1111 |
Table 5.
DEMATEL model calculation results.
| Index | Degree of Impact | Ranking | Degree of Influence | Ranking | Centrality | Ranking | Degree of Cause | Ranking |
|---|---|---|---|---|---|---|---|---|
| X1 | 2.239 | 1 | 1.177 | 5 | 3.416 | 3 | 1.062 | 1 |
| X2 | 1.516 | 5 | 1.001 | 9 | 2.517 | 8 | 0.515 | 5 |
| X3 | 1.677 | 2 | 1.041 | 7 | 2.718 | 5 | 0.636 | 3 |
| X4 | 1.535 | 4 | 0.908 | 12 | 2.443 | 9 | 0.627 | 4 |
| X5 | 1.39 | 6 | 2.447 | 2 | 3.837 | 2 | −1.057 | 13 |
| X6 | 0.701 | 14 | 3.253 | 1 | 3.954 | 1 | −2.552 | 14 |
| X7 | 1.227 | 7 | 1.567 | 4 | 2.794 | 4 | −20.34 | 11 |
| X8 | 0.935 | 12 | 1.628 | 3 | 2.563 | 7 | −20.693 | 12 |
| X9 | 1.222 | 8 | 0.962 | 10 | 2.184 | 10 | 0.26 | 8 |
| X10 | 0.928 | 13 | 0.893 | 13 | 1.821 | 13 | 0.035 | 10 |
| X11 | 1.219 | 9 | 0.936 | 11 | 2.155 | 12 | 0.283 | 7 |
| X12 | 1.066 | 11 | 0.389 | 14 | 1.455 | 14 | 0.677 | 2 |
| X13 | 1.151 | 10 | 1.018 | 8 | 2.169 | 11 | 0.133 | 9 |
| X14 | 1.56 | 3 | 1.147 | 6 | 2.707 | 6 | 0.413 | 6 |
Table 6.
Weights of water resilience evaluation model in Wuhan.
| Wuhan urban water resilience evaluation index system. | Level 1 Indicators | Weight | Secondary Indicators | Weight |
| Water ecological evaluation indicators A1. | 0.229 | Total annual runoff control rate of the city X1. | 0.121 | |
| Water surface rate of built-up areas X2. | 0.051 | |||
| Green area rate in built-up areas X3. | 0.044 | |||
| Urban heat island value X4. | 0.013 | |||
| Water resources evaluation indicators A2. | 0.526 | Reclaimed water utilization X5. | 0.143 | |
| Rainwater resource utilization X6. | 0.323 | |||
| The degree of water satisfaction X7. | 0.060 | |||
| Water environment assessment indicators A3. | 0.186 | Surface water class III and above-water body ratio X8. | 0.077 | |
| Groundwater class III and above-water body ratio X9. | 0.077 | |||
| Non-point source pollution control rate X10. | 0.011 | |||
| Groundwater overexertion rate X11. | 0.021 | |||
| Water safety evaluation indicators A4. | 0.059 | Leakage rate of the pipe network X12. | 0.018 | |
| Drinking water source water quality compliance rate X13. | 0.032 | |||
| Network base per capita X14. | 0.009 |
Publisher’s Note: MDPI stays neutral with regard to jurisdictional claims in published maps and institutional affiliations. |
© 2022 by the authors. Licensee MDPI, Basel, Switzerland. This article is an open access article distributed under the terms and conditions of the Creative Commons Attribution (CC BY) license (https://creativecommons.org/licenses/by/4.0/).
Share and Cite
MDPI and ACS Style
Xu, W.; Kong, Y.; Proverbs, D.; Zhang, Y.; Zhang, Y.; Xu, J. A Water Resilience Evaluation Model for Urban Cities. Water 2022, 14, 1942. https://doi.org/10.3390/w14121942
AMA Style
Xu W, Kong Y, Proverbs D, Zhang Y, Zhang Y, Xu J. A Water Resilience Evaluation Model for Urban Cities. Water. 2022; 14(12):1942. https://doi.org/10.3390/w14121942
Chicago/Turabian StyleXu, Wenping, Yuli Kong, David Proverbs, Yuwan Zhang, Yuan Zhang, and Jitao Xu. 2022. "A Water Resilience Evaluation Model for Urban Cities" Water 14, no. 12: 1942. https://doi.org/10.3390/w14121942
Note that from the first issue of 2016, this journal uses article numbers instead of page numbers. See further details here.