Article

Effects of Protein Level on the Production and Growth Performance of Juvenile Chinese Mitten Crab (Eriocheir sinensis) and Environmental Parameters in Paddy Fields

1
College of Animal Science and Veterinary Medicine, Shenyang Agricultural University, Shenyang 110866, China
2
Jilin Fisheries Technology Promotion Station, Changchun 130012, China
3
College of Fisheries and Life Sciences, Dalian Ocean University, Dalian 116023, China
4
Panjin Guanghe Crab Industry Co., Ltd., Panjin 124200, China
*
Author to whom correspondence should be addressed.
Water 2022, 14(12), 1941; https://doi.org/10.3390/w14121941
Submission received: 2 April 2022 / Revised: 1 June 2022 / Accepted: 14 June 2022 / Published: 16 June 2022
(This article belongs to the Special Issue Advances in Aquaculture Ecology Research)

Abstract

:
Rice–crab co-culture systems represent integrated agriculture–aquaculture systems developed in China over the last 30 years. The rice–crab co-culture area comprised approximately 1.386 × 10⁵ hm2 in 2019. However, there is no specific feed designed for Chinese mitten crab (Eriocheir sinensis) cultured in this system until now. In this study, we investigated feed formulae for the nutritional requirements of Chinese mitten crab in this mode. The control group was not fed with any artificial feed (Co), and the experimental groups were fed with three different feeds of 15% (T15), 30% (T30), or 45% (T45) protein content, respectively. Growth performance variations in E. sinensis were investigated along with water quality, phytoplankton, zooplankton, aquatic vascular plants, and benthic animals in the paddy fields to determine the effect of crabs and their diet on the paddy ecosystem. Dietary protein levels had no significant effect on water quality. The biomass and species of phytoplankton, zooplankton, aquatic vascular plants, and zoobenthos in the paddy field were affected by crabs and their diet. Morphological parameters of crabs were significantly more pronounced in the high-protein group than in the other groups. However, the T45 diet negatively affected production by increasing feed costs, causing precocious puberty and inducing water eutrophication. In conclusion, adding a 15% protein compound feed can meet the nutritional needs of crabs, reduce culture costs, and improve water quality. The discharged water had low ammonia nitrogen and nitrite content and no eutrophication occurred, so the water could be recycled. These findings provide a scientific reference for supporting rice and fish co-cultivation.

1. Introduction

The Chinese mitten crab (Eriocheir sinensis) is the most commonly farmed crab species in China. In 2020, the General Office of the Ministry of Agriculture and Rural Affairs proposed the implementation of “five major actions,” including the promotion of ecological and healthy farming modes. The new rice–crab co-culture mode integrates the culturing of rice and crabs with ecological, economical, and social benefits [1]. The food chain in the ecosystem of this mode is quite complex, creating a more stable ecosystem than that in single-species aquaculture. Crabs are at the top of this food chain and feed on plankton, weeds, and benthic animals in rice fields, ensuring an efficient matter circulation and a smooth energy flow through the whole system [2]. Furthermore, this mode produces a double harvest of rice and crabs [3].
The ecological environment in rice–crab co-culture may be affected by several factors. For instance, high-density culture adversely affects phytoplankton and benthic animals [4]. Zhang et al. [5] demonstrated that the phytoplankton biomass in crab culture was significantly higher than that in rice culture or rice co-culture. The daily activities of crabs change the physical and chemical environment of water bodies, which indirectly affects the plankton community structure [6]. These studies showed that the feeding behavior of crabs on plankton and benthic animals influenced the rice–crab co-culture ecosystem.
The quality and output of the mode are not the only important factors; it is also necessary to minimize expenses. Feed costs are the main expense in aquaculture. Almost all crab artificial feeds use fish meal (FM) as the main protein source [2]. However, there is a limited supply of FM, and it is costly [7], necessitating the use of expensive compound feeds. The optimum crude protein for the growth of juvenile crabs is 347.8 g/kg under the indoor individual Chinese mitten crab system [8]. Xu et al. found that a certain amount of fish meal replaced by soybean meal effectively reduced the cost of feed and had no effect on the growth performance, related enzyme activities and genes expression of Chinese mitten crabs [9]. These experiments showed that the protein in the feed played a key role in the growth performance of crabs and cost of feed.
After more than 30 years of development, China’s rice–crab co-culture area comprised approximately 1.386 × 10⁵ hm2 in 2019, which accounted for 5.94% of the national rice and fishery planting area and produced a yield of 6.18 × 10⁴ tons [10]. However, although paddy fields are rich in natural nutrients in rice–crab co-culture systems, there is a lack of details on the nutritional requirements, feed costs, and environmental response mechanisms of crabs, especially regarding the interaction between crabs and the ecosystem in paddy fields. In this study, we investigated the effect of three different protein levels in compound feeds on crabs, plankton, aquatic vascular plants, and benthic animals in a rice–crab co-culture system. We aimed to comprehensively analyze the protein requirements of juvenile Chinese mitten crabs under a rice–crab co-culture system. The findings from this research will provide a reference for the optimization of the feeding strategy in the rice–crab co-culture system.

2. Materials and Methods

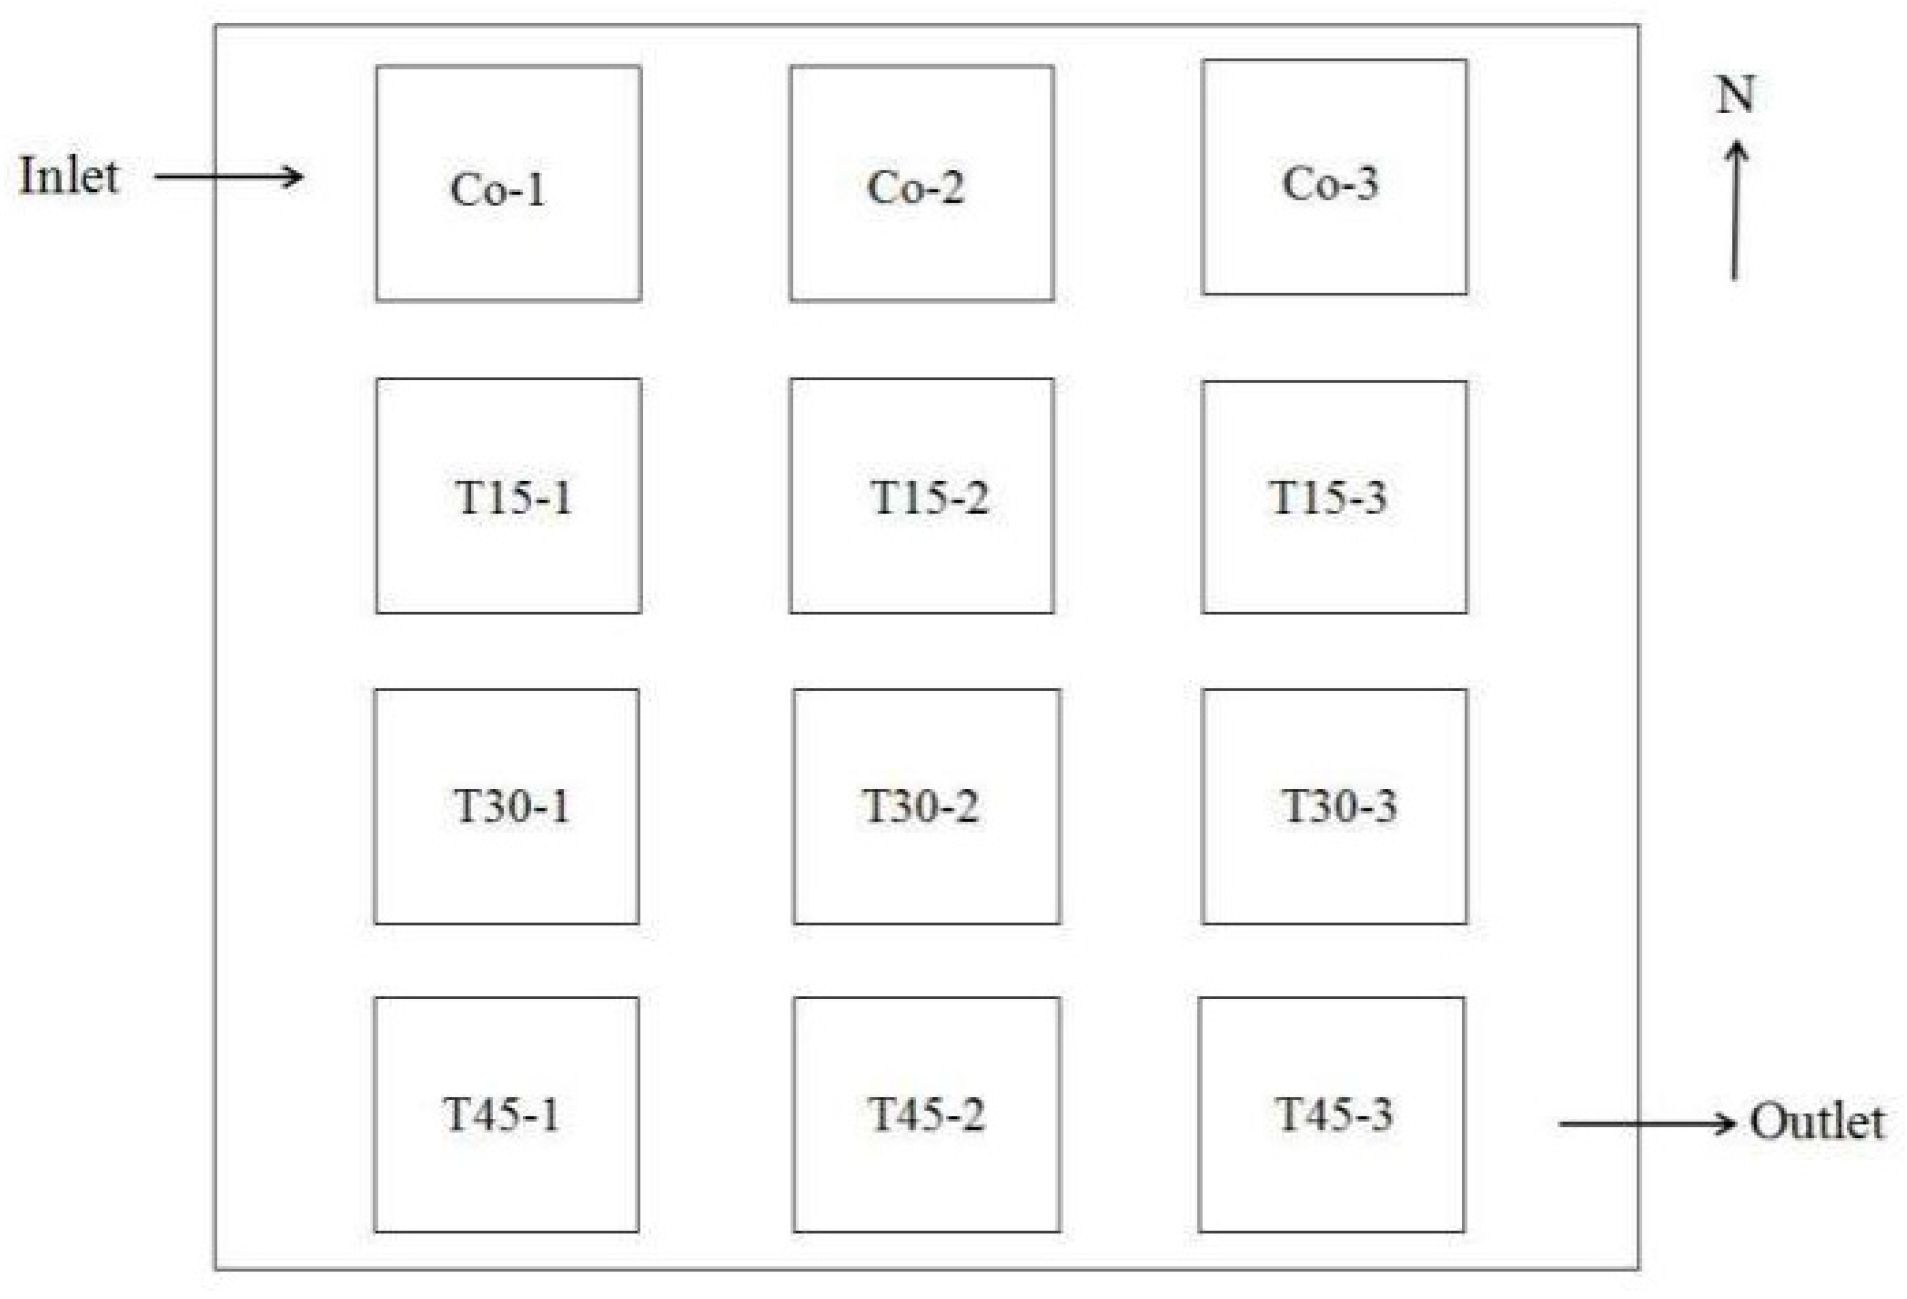
2.1. Experimental Animals and Experimental Paddy Field Management

The experimental animals were obtained from Panjin Photosynthetic Crab Co., Ltd. (Panjin, China) and raised in the nursery pond at their facility. Crabs with complete appendages and of uniform size were randomly selected for our experiment. The experimental paddy field was routinely managed, and a base fertilizer was applied once, prior to rice planting.

2.2. Experimental Design

The paddy-field crab–culture experiment was conducted in the paddy field at Panjin Photosynthetic Crab Industry Co., Ltd. from 25 May to 8 October 2020 (Figure 1; E 121°50′38.73″–121°50′41.85″, N 40°54′1.07″). Water samples were collected nine times, including a sample in May prior to the initiation of the experiment and to any rice field being stocked with crabs. Subsequently, samples were collected twice a month throughout the experiment. The experimental design involved a total of 12 enclosures (6 m × 6.7 m). The enclosures were divided into three experimental groups and a control group, with three repetitions for each group. Crabs were stocked in each enclosure (the macrophthalmia size was 160/g at 30,000/hm2), including the control group, which was not supplied with any artificial food.
The feed used in the experimental group was designed by the research group with FM and soybean meal as the main protein sources, and fish oil was used as the main fat source (Table 1). Three types of isolipid feeds with different protein contents were formulated by simultaneously increasing the FM and soybean meal content (FM: soybean meal = 2). The feed protein levels were 15%, 30%, and 45%. The various solid raw materials were accurately weighed according to the required formula ratio and, then, were fully mixed according to the principle of step-by-step enlargement. Subsequently, the artificial feed was pulverized through a 100-mesh sieve, the oil was added, and all ingredients were stirred to an even consistency. Finally, water was added (30%), and the feed was mixed again. A double helix A pellet mill (DES-TS1280, Jinan Dingrun Machinery Equipment Co., Ltd., Jinan, China) was used to press the feed into 3 mm diameter pellets. The pellets were naturally air-dried and packaged and sealed in plastic bags. The bags were stored in a refrigerator at −20 °C. Crabs were fed at a rate of 10% of their body weight. A detailed list of contents of each experimental feed is shown in Table 1, and the feed costs are presented in Table A1.

2.3. Test Methods

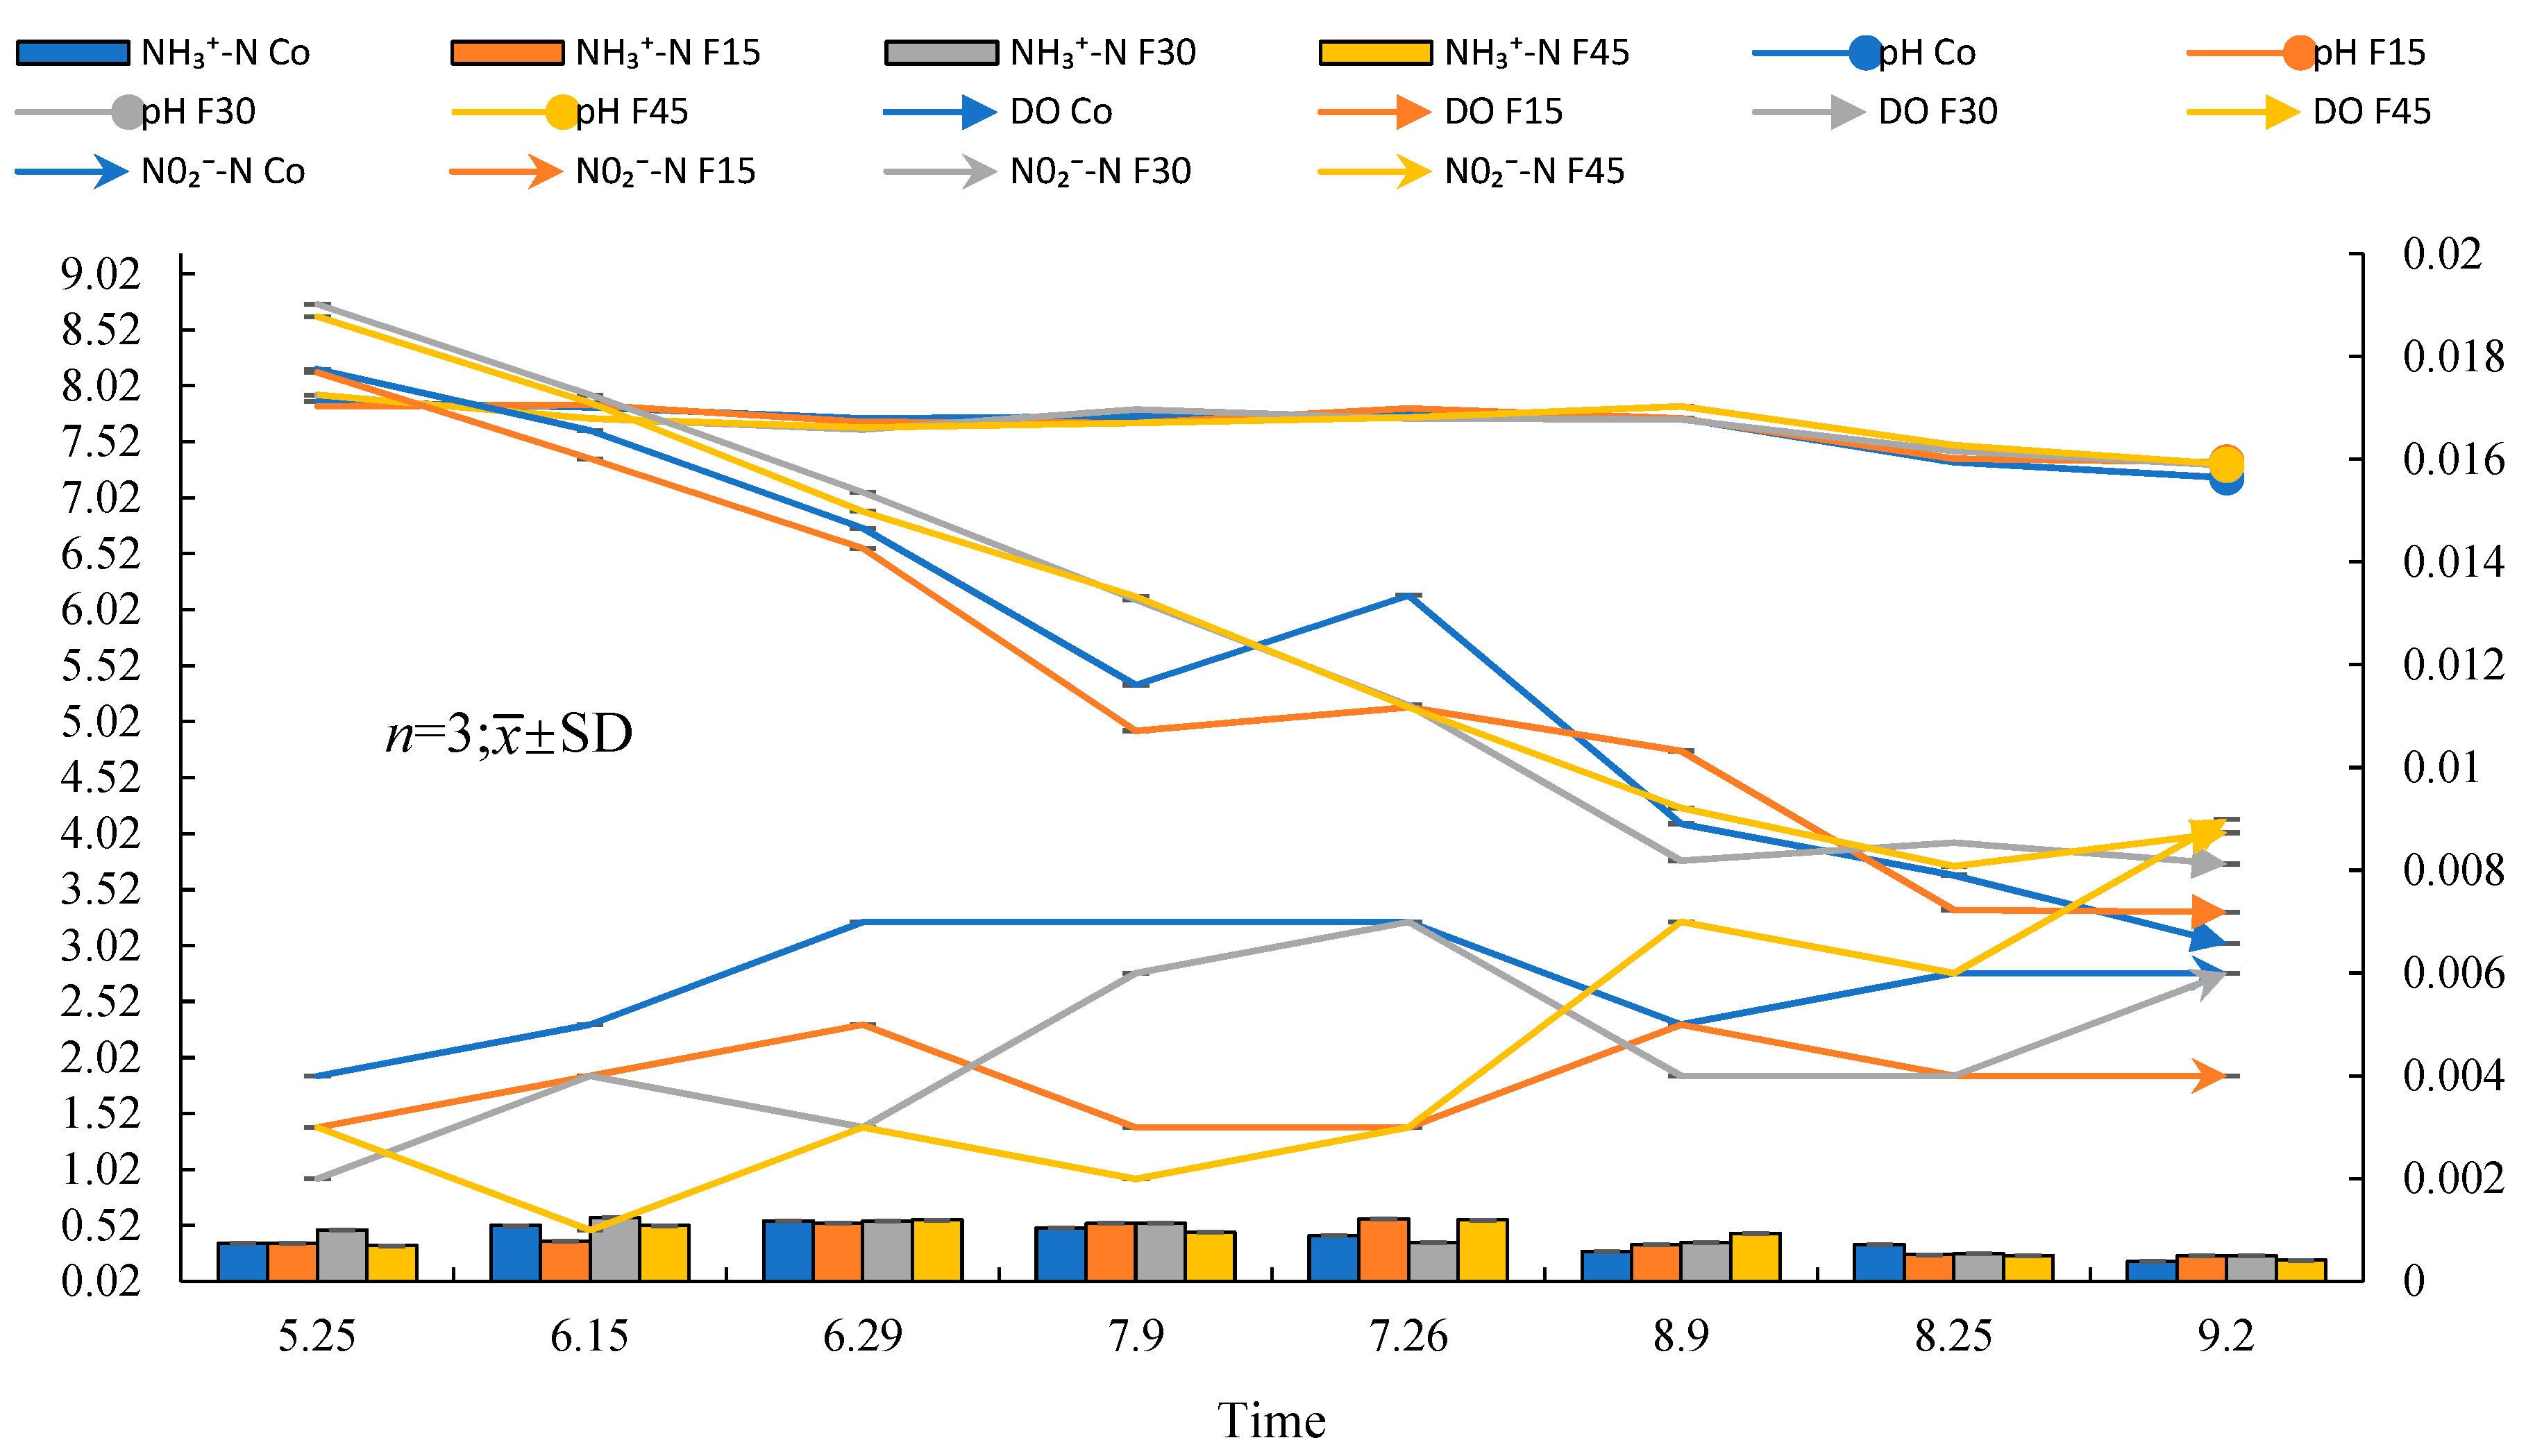
2.3.1. Monitoring Water Quality in the Paddy Fields

During the experiment, physical and chemical water quality indicators were recorded and monitored in each enclosure. The indicators included temperature (oxygen dissolving instrument, YSI550-A, Vasey Instrument Company, Exton, PA, USA), pH (pH meter, PHB-1, Shanghai Thunder Magnetic, Shanghai, China), salinity (Pen salinity meter, AR-8012, Xima Instrument Co., Ltd., Dongguan, China), dissolved oxygen (oxygen dissolving instrument, YSI550-A, Vasey Instrument Company), ammonium nitrogen (visible spectrophotometer, V-1100, Shanghai Meitong Instrument Co., Ltd., Shanghai, China), and nitrite nitrogen [11].

2.3.2. Growth Performance and Yield of Crabs

The megalopae of crabs were collected and weighed to ensure all enclosures contained the same number of crabs (160/g) on 25 May. The megalopae were cultured in the enclosures for 46 days until they reached the feeding phase. The experiment was initiated after the crabs were measured. The average body length, width and height was 1.08 ± 0.08, 1.16 ± 0.09 and 0.53 ± 0.05 cm, respectively, and average body weight was 0.63 ± 0.13 g. During the experiment, the body length, width, height, and weight of the crabs were measured on 10 July, 28 July, 17 August, 8 September, and 8 October. All crabs were humanely harvested at the end of the experiment. Crabs were caught using a plastic bucket inserted into a hole dug in the bottom of the enclosure. The frequency of collection depended on the number of crabs. All specimens were counted, measured, and weighed. Precocious puberty was assessed by comparing the abdomen, junction, villi, gonad, color, and crab patterns with those of the representative crab specimens [12]. Growth performance indicators were calculated using the following formulae:
Survival rate/% = nt/n0 × 100%,
Weight gain rate/% = (mt − m0)/m0 × 100%,
Specific growth rate/%/d = (ln mt − ln m0)/t × 100%,
Total output/g·m−2 = W/S,
Net output/g·m−2 = (W − W0)/S,
where n0 represents the initial number of crabs, nt represents the final number of crabs, mt represents the final average body weight, m0 represents the initial average body weight, t represents the total number of days of the experiment, W represents the final total weight of crabs in an enclosure, W0 represents the initial total weight of crabs in an enclosure, and S represents the area of the enclosure (6 m × 6.7 m = 40.2 m2).

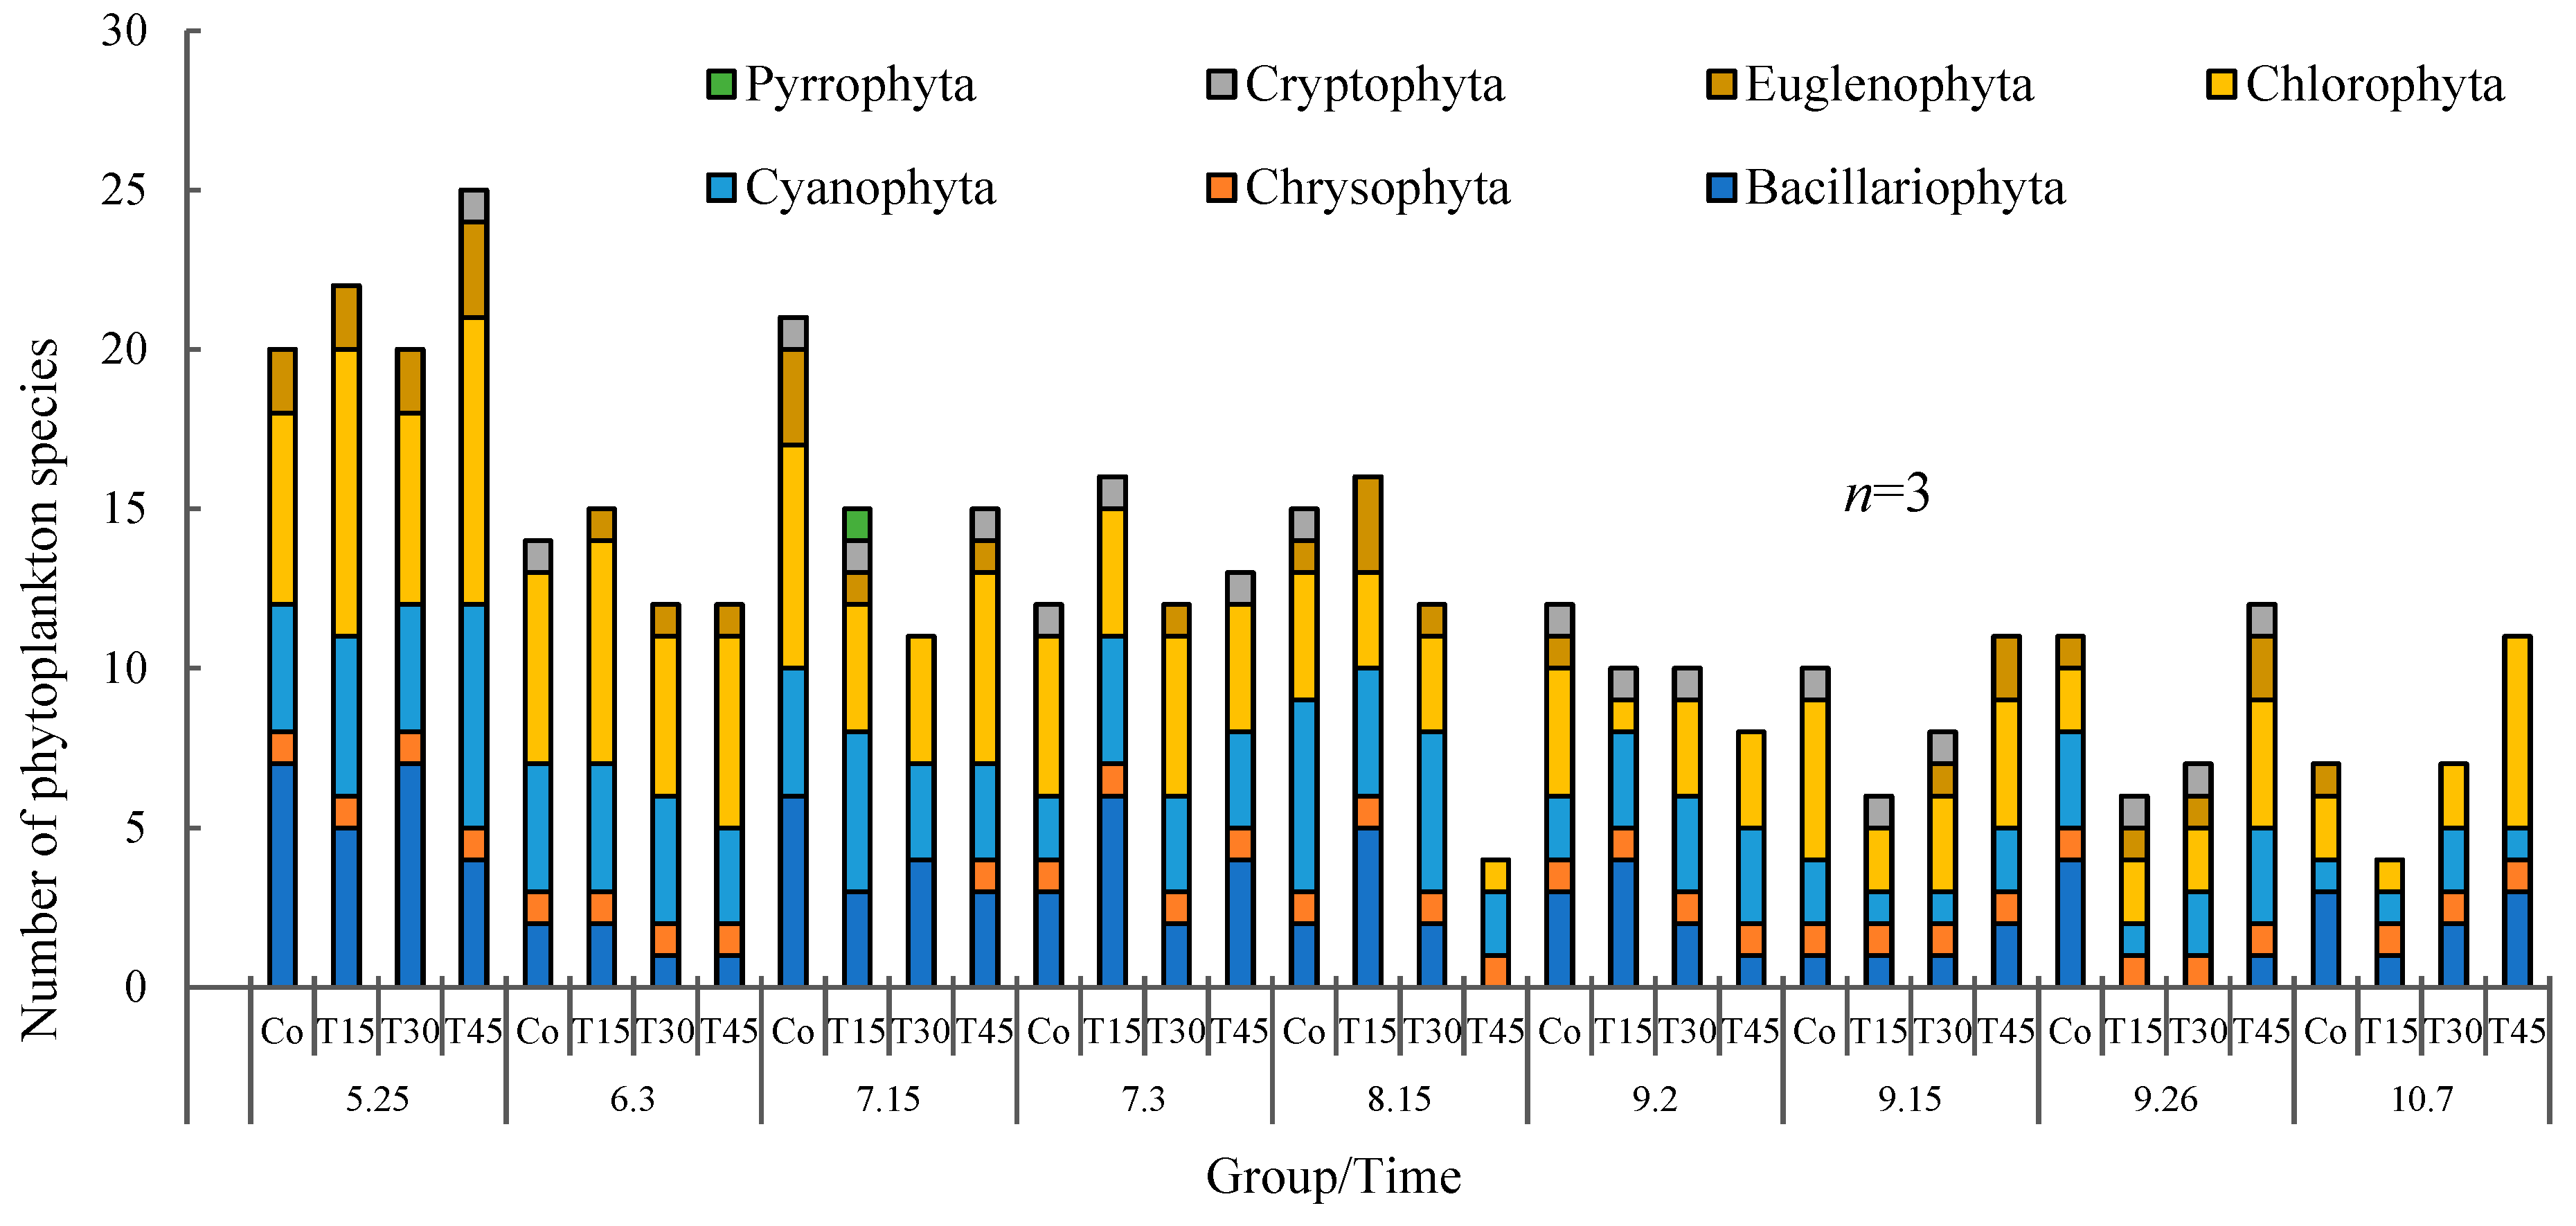
2.3.3. Qualitative and Quantitative Analysis of Phytoplankton

The sampling and measurement methods used to assess the phytoplankton were based on those of Zhang [6]. Briefly, 1 L of water was collected by five-point sampling at each point and mixed in a bucket. A lugol solution (10–15 mL) was then evenly mixed into the water. After 48 h, the sample was concentrated by siphonage, fixed at 100 mL volume, and then put into an iodometric bottle for qualitative analysis. The qualitative and quantitative analyses followed Li et al. [13], and Zhao [14], respectively. The specific gravity of phytoplankton is approximately 1. Therefore, the volume was directly converted into wet weight, and the phytoplankton biomass was calculated (Table A2).

2.3.4. Qualitative and Quantitative Analyses of Zooplankton

The sampling and measurement of the zooplankton were based on methods of Zhang [6]. The qualitative and quantitative methods followed those described in Section 2.3.3, and the zooplankton biomass was calculated (Table A3).

2.3.5. Qualitative and Quantitative Analyses of Aquatic Vascular Plants

The aquatic vascular plants were sampled by selecting two points that were consistent for each enclosure. A 30 cm × 30 cm iron frame was used to divide the sampling area. The plants (except rice) were uprooted, species were identified, and plant wet weight was determined.

2.3.6. Qualitative and Quantitative Analysis of Benthic Animals

The quantification of the benthic animals was conducted at the same sampling points as those mentioned in Section 2.3.5 at a depth of approximately 10 cm using a self-made barrel dredger [15]. The benthic animals were screened using a sieve with an aperture of 0.2–2 mm and then wet-weighed, identified, and counted with precision.

2.4. Statistical Analysis

The experimental data were collated using Excel. The homogeneity of variance test and one-way ANOVA were performed using SPSS 24.0. Any significant differences between groups were further analyzed using Duncan’s multiple comparison tests. The results were expressed as the mean ± standard deviation. In all analyses, a probability value less than 0.05 was considered significant (p < 0.05).
Dominance (Y) was calculated according to the formula:
Y = n i / N × f i
where Y is the degree of dominance, ni is the number of individuals of species i, N is the total number of individuals, and fi is the frequency of occurrence of species i at five sampling points within an enclosure.
The Shannon–Wiener diversity index (H′) was calculated using the formula:
H = [ ( n i / N ) × ln ( n i / N ) ] ,
where ni is the number of individuals of species i, and N is the total number of individuals of the species.

3. Results

3.1. Growth Performance and Yield of Crabs

The morphological parameters of the crabs in the high- and low-protein diet groups varied significantly at each measurement (Figure 2). At the end of the experiment, the carapace length, width, and height of both T30 and T45 groups were significantly higher than those of the Co group (p < 0.05), and the carapace length and width were significantly higher than those in the T15 group (p < 0.05). The final body weight and weight gain rate of the crabs in the T45 group were significantly higher than those of the Co group (p < 0.05). The growth rate of the crabs in the Co group was significantly lower than that of the T30 and T45 groups (p < 0.05).
The final body weight of the crabs ranged from 8.30 g to 17.28 g (Table 2). The final body weight of the crabs that were fed diets increased significantly with the increase of protein content (p < 0.05). The body weight increase rate varied from 9641.86% to 20,181.73% and significantly increased with the increase in dietary protein content (p < 0.05). The specific growth rate of the crabs varied from 3.30%/d to 3.85%/d and significantly increased as the dietary protein content increased (p < 0.05).
The total and net yields of crabs varied from 43.86 g/m2 to 60.41 g/m2 and 38.10 g/m2 to 54.64 g/m2, respectively. The highest total and net yields were for crabs in the T45 group, followed by those of the T15 and Co groups; the lowest was for those of the T30 group. There was no significant variation in the total and net yield of crabs in the different experimental groups (p > 0.05). Towards the end of the experiment, approximately 10% of crabs in the T45 group experienced precocious puberty.

3.2. Water Quality

The physical and chemical parameters of water quality in each enclosure during the experimental period was assessed (Figure 3). Generally, the parameters of water quality in each enclosure were consistent with the fishery water quality standard of the People’s Republic of China (GB 11607-89). During the experiment, the water temperature ranged from 24.5 °C to 28.2 °C, and the salinity from 0.493‰ to 1.743‰. No significant difference was found in dissolved oxygen, ammonia, and nitrate levels in all enclosures (Figure 3).

3.3. Phytoplankton in the Paddy Fields and Variations with Time

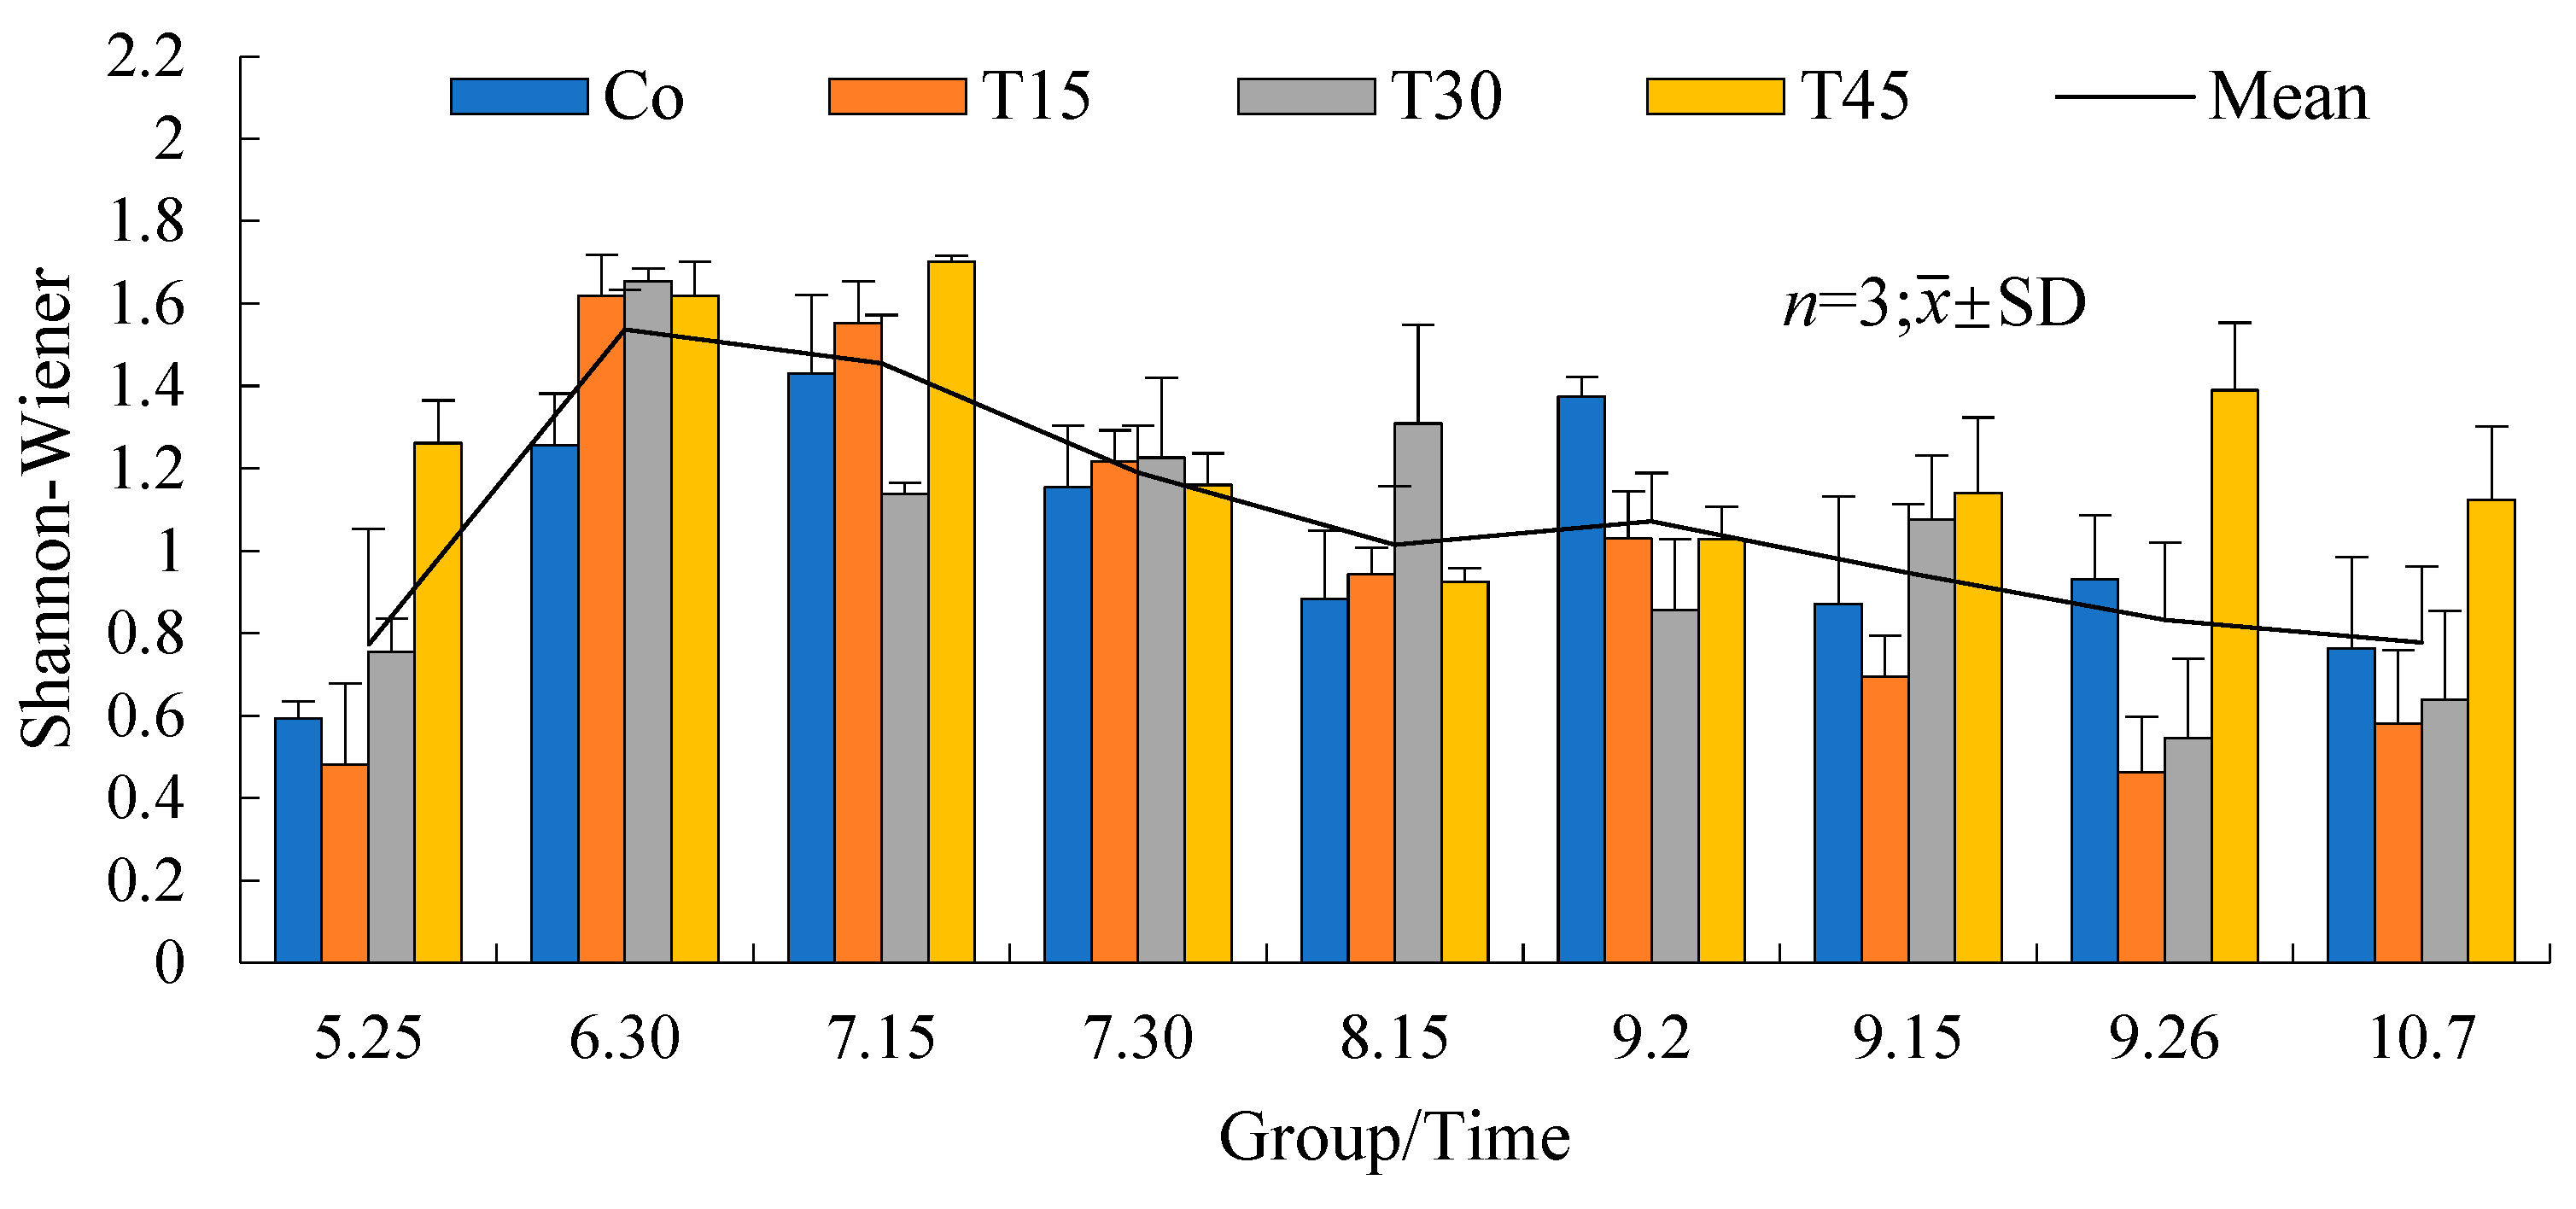
3.3.1. Phytoplankton Biodiversity

A total of 54 species of phytoplankton from seven phyla were detected in four treatments during the experiment (Table A4). Seven phyla were present in all treatments (Figure 4). Bacillariophyta was the dominant group, with 19 species present, and accounted for 35.19% of the phytoplankton species observed. Chlorophyta was the phylum with the second highest number of species (18 species) and accounted for 33.33% of the total number of species. Other groups included Cyanophyta (9 species; 16.67%) and Euglenophyta (5 species; 9.26%). The phyla Cryptophyta, Chrysophyta, and Pyrrophyta were represented by one species each and accounted for 1.85% of the total species.
The rank of phytoplankton biomass of each group, from nine sampling events, was: Chlorophyta (32.48 mg/L, accounting for 26.96% of the total biomass), Eugelenophyta (29.19 mg/L; 24.23%), Chrysophyta (26.85 mg/L; 22.29%), Cyanobacteria (0.26 mg/L; 15.15%), Bacillariophyta (13.68 mg/L; 11.36%), and Cryptophyta (3.06 mg/L; 2.54%). Pyrrophyta was detected only once at a very low proportion.
The phytoplankton diversity in each group was analyzed using the Shannon–Wiener diversity index (Figure 5), with an overall average of 1.07. The diversity index of the Co group was 0.59 to 1.43, with an average of 1.03. The diversity index of the T15 group was 0.46 to 1.62, with an average of 0.95. The diversity index of the T30 group was 0.54 to 1.65, with an average of 1.02. The diversity index of the T45 group was 0.93 to 1.62, with an average of 1.26.

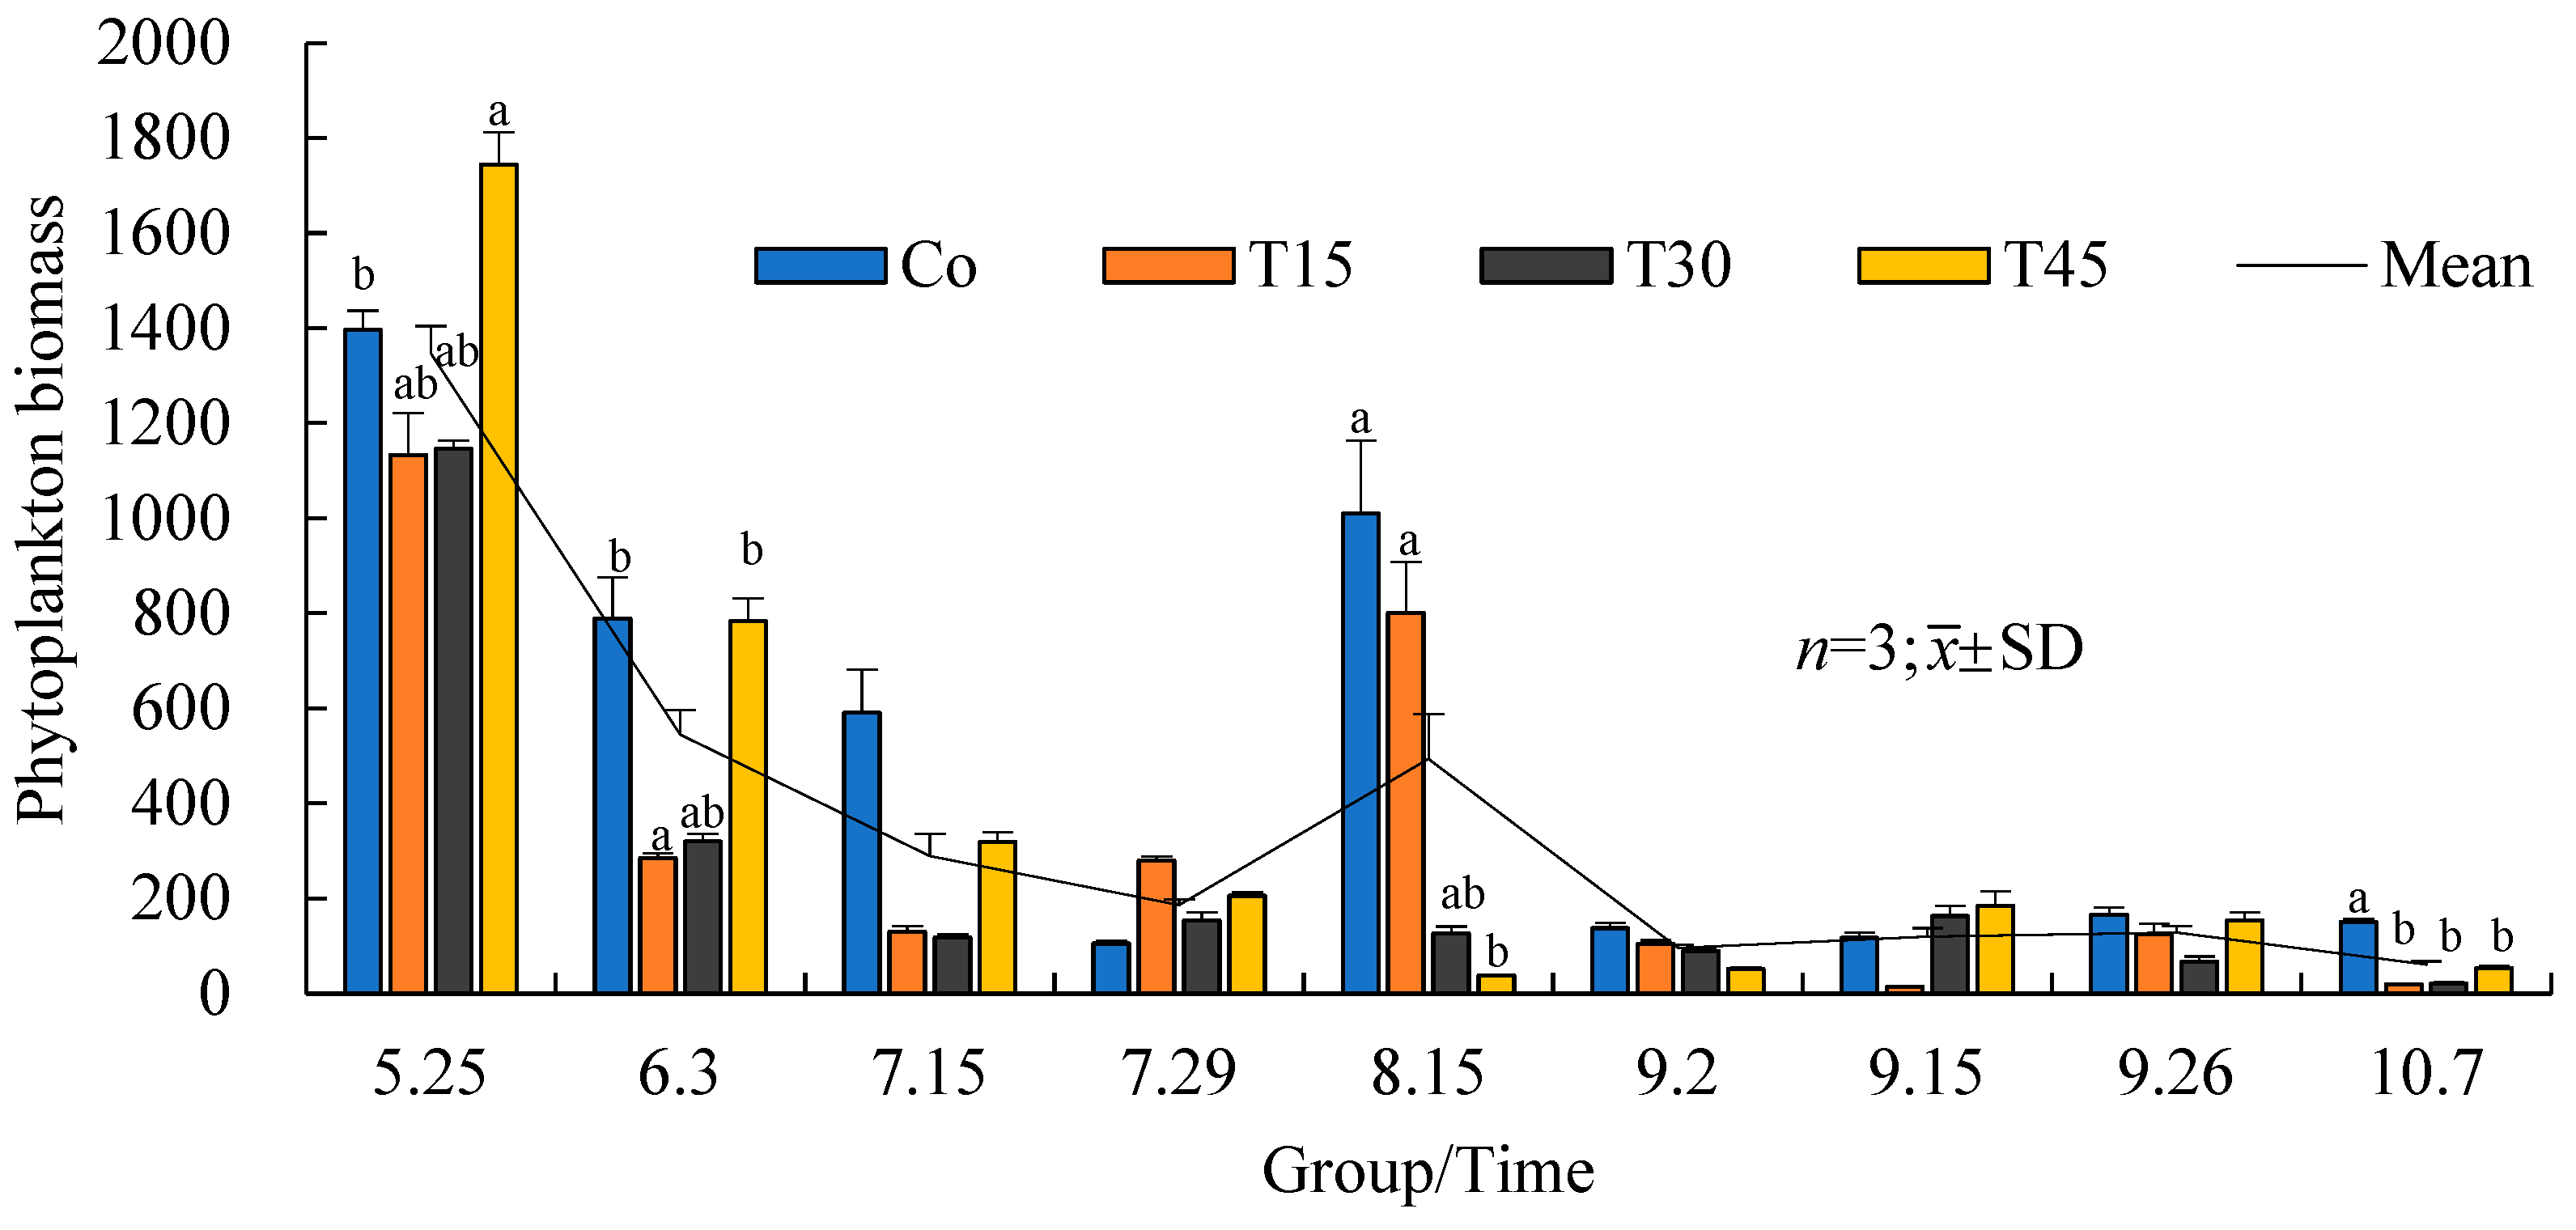
3.3.2. Variation Trends in Phytoplankton Biomass over Time

The phytoplankton biomass of different treatment groups over times was analyzed statistically. The overall average biomass of each experimental group showed a downward trend with time. However, an abnormal increase occurred for those in Co group on 15 August (Figure 6). On 25 May, the biomass in T45 was significantly higher than that in Co (p < 0.05). On 30 June, the biomass in T15 was significantly lower than that in Co and T45, while those in Co and T15 was significantly higher than that in T45 on 15 August (p < 0.05). The phytoplankton biomass in Co group was the lowest among all groups on 15 October (p < 0.05).

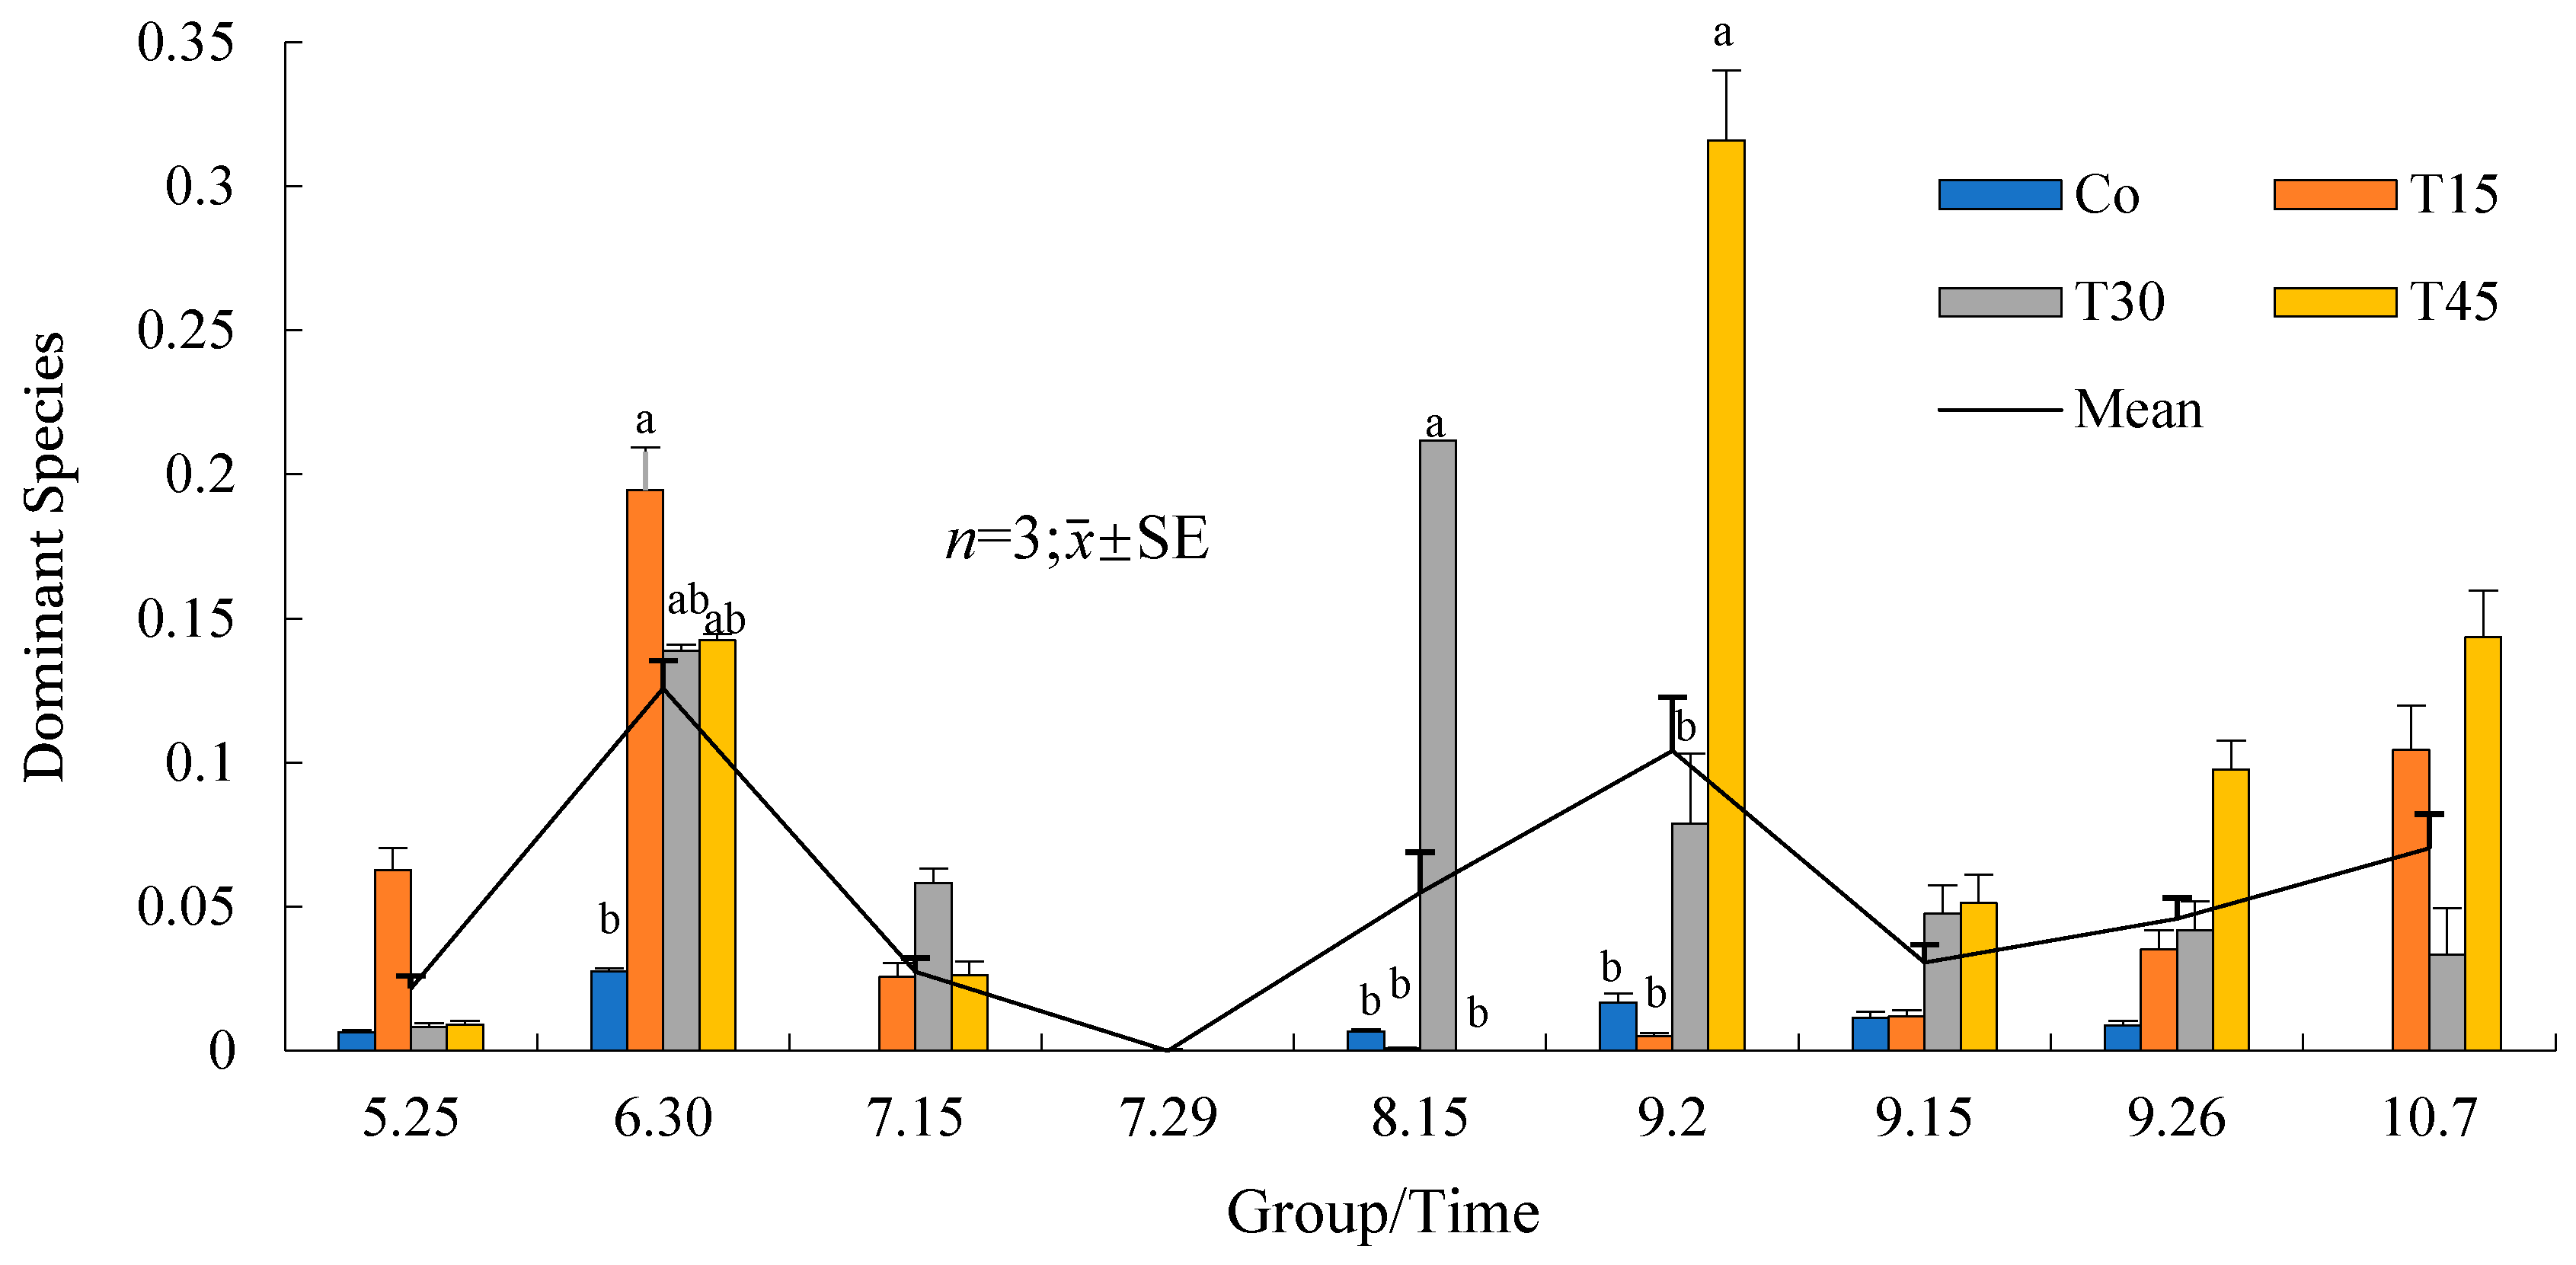
3.3.3. Succession and Population Changes in the Dominant Phytoplankton Species

The dominant phytoplankton species were calculated, and the results are presented in Figure 7. If Y > 0.02, then the species was considered dominant. After the quantification and calculation analysis, there were five phyla of dominant zooplankton. The species composition and dominance of each phytoplankton species varied within different sampling time intervals in each treatment group (Table A5).
Chromulina pygmaea and Chlorella pyrenoidosa were highly dominant species in different treatment groups during the experiment. The diversity of dominant phytoplankton species in the Co group increased over time. Comparatively, the dominant species of each feeding group were relatively simple. In the later stage of the experiment, the degree of dominance of Chroococcus in the T30 and T45 groups was higher than that in the Co and T15 groups (Figure 8). On 2 September, the degree of dominance of Chroococcus in T45 was significantly higher than in the other groups (p < 0.05).

3.4. Species, Quantities, and Changes in Zooplankton

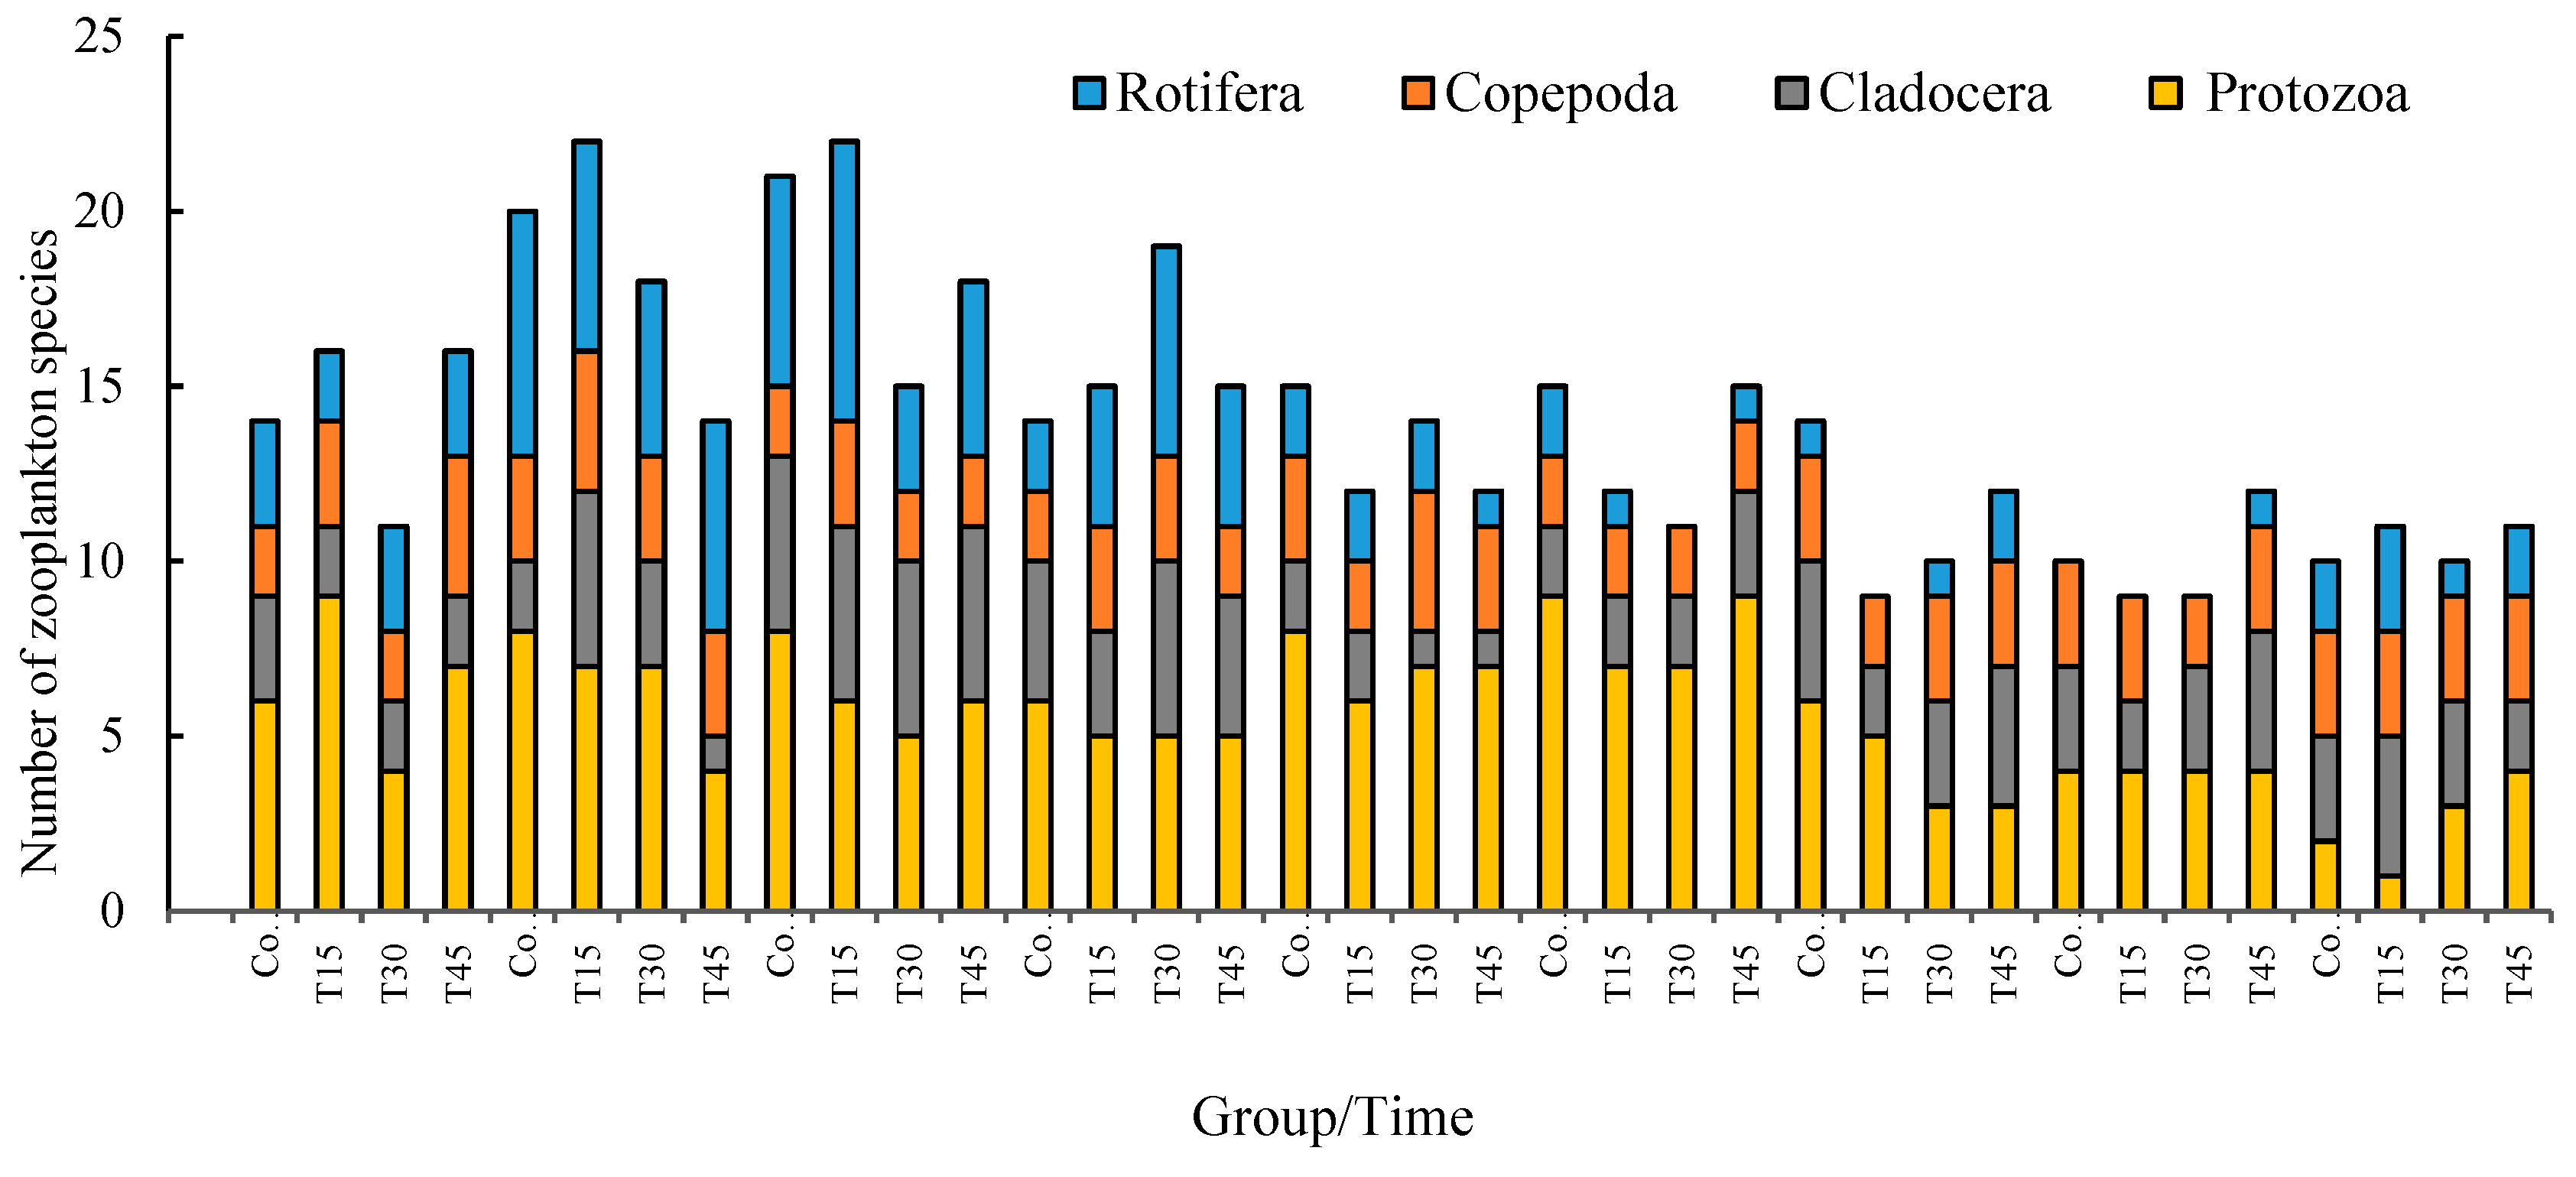
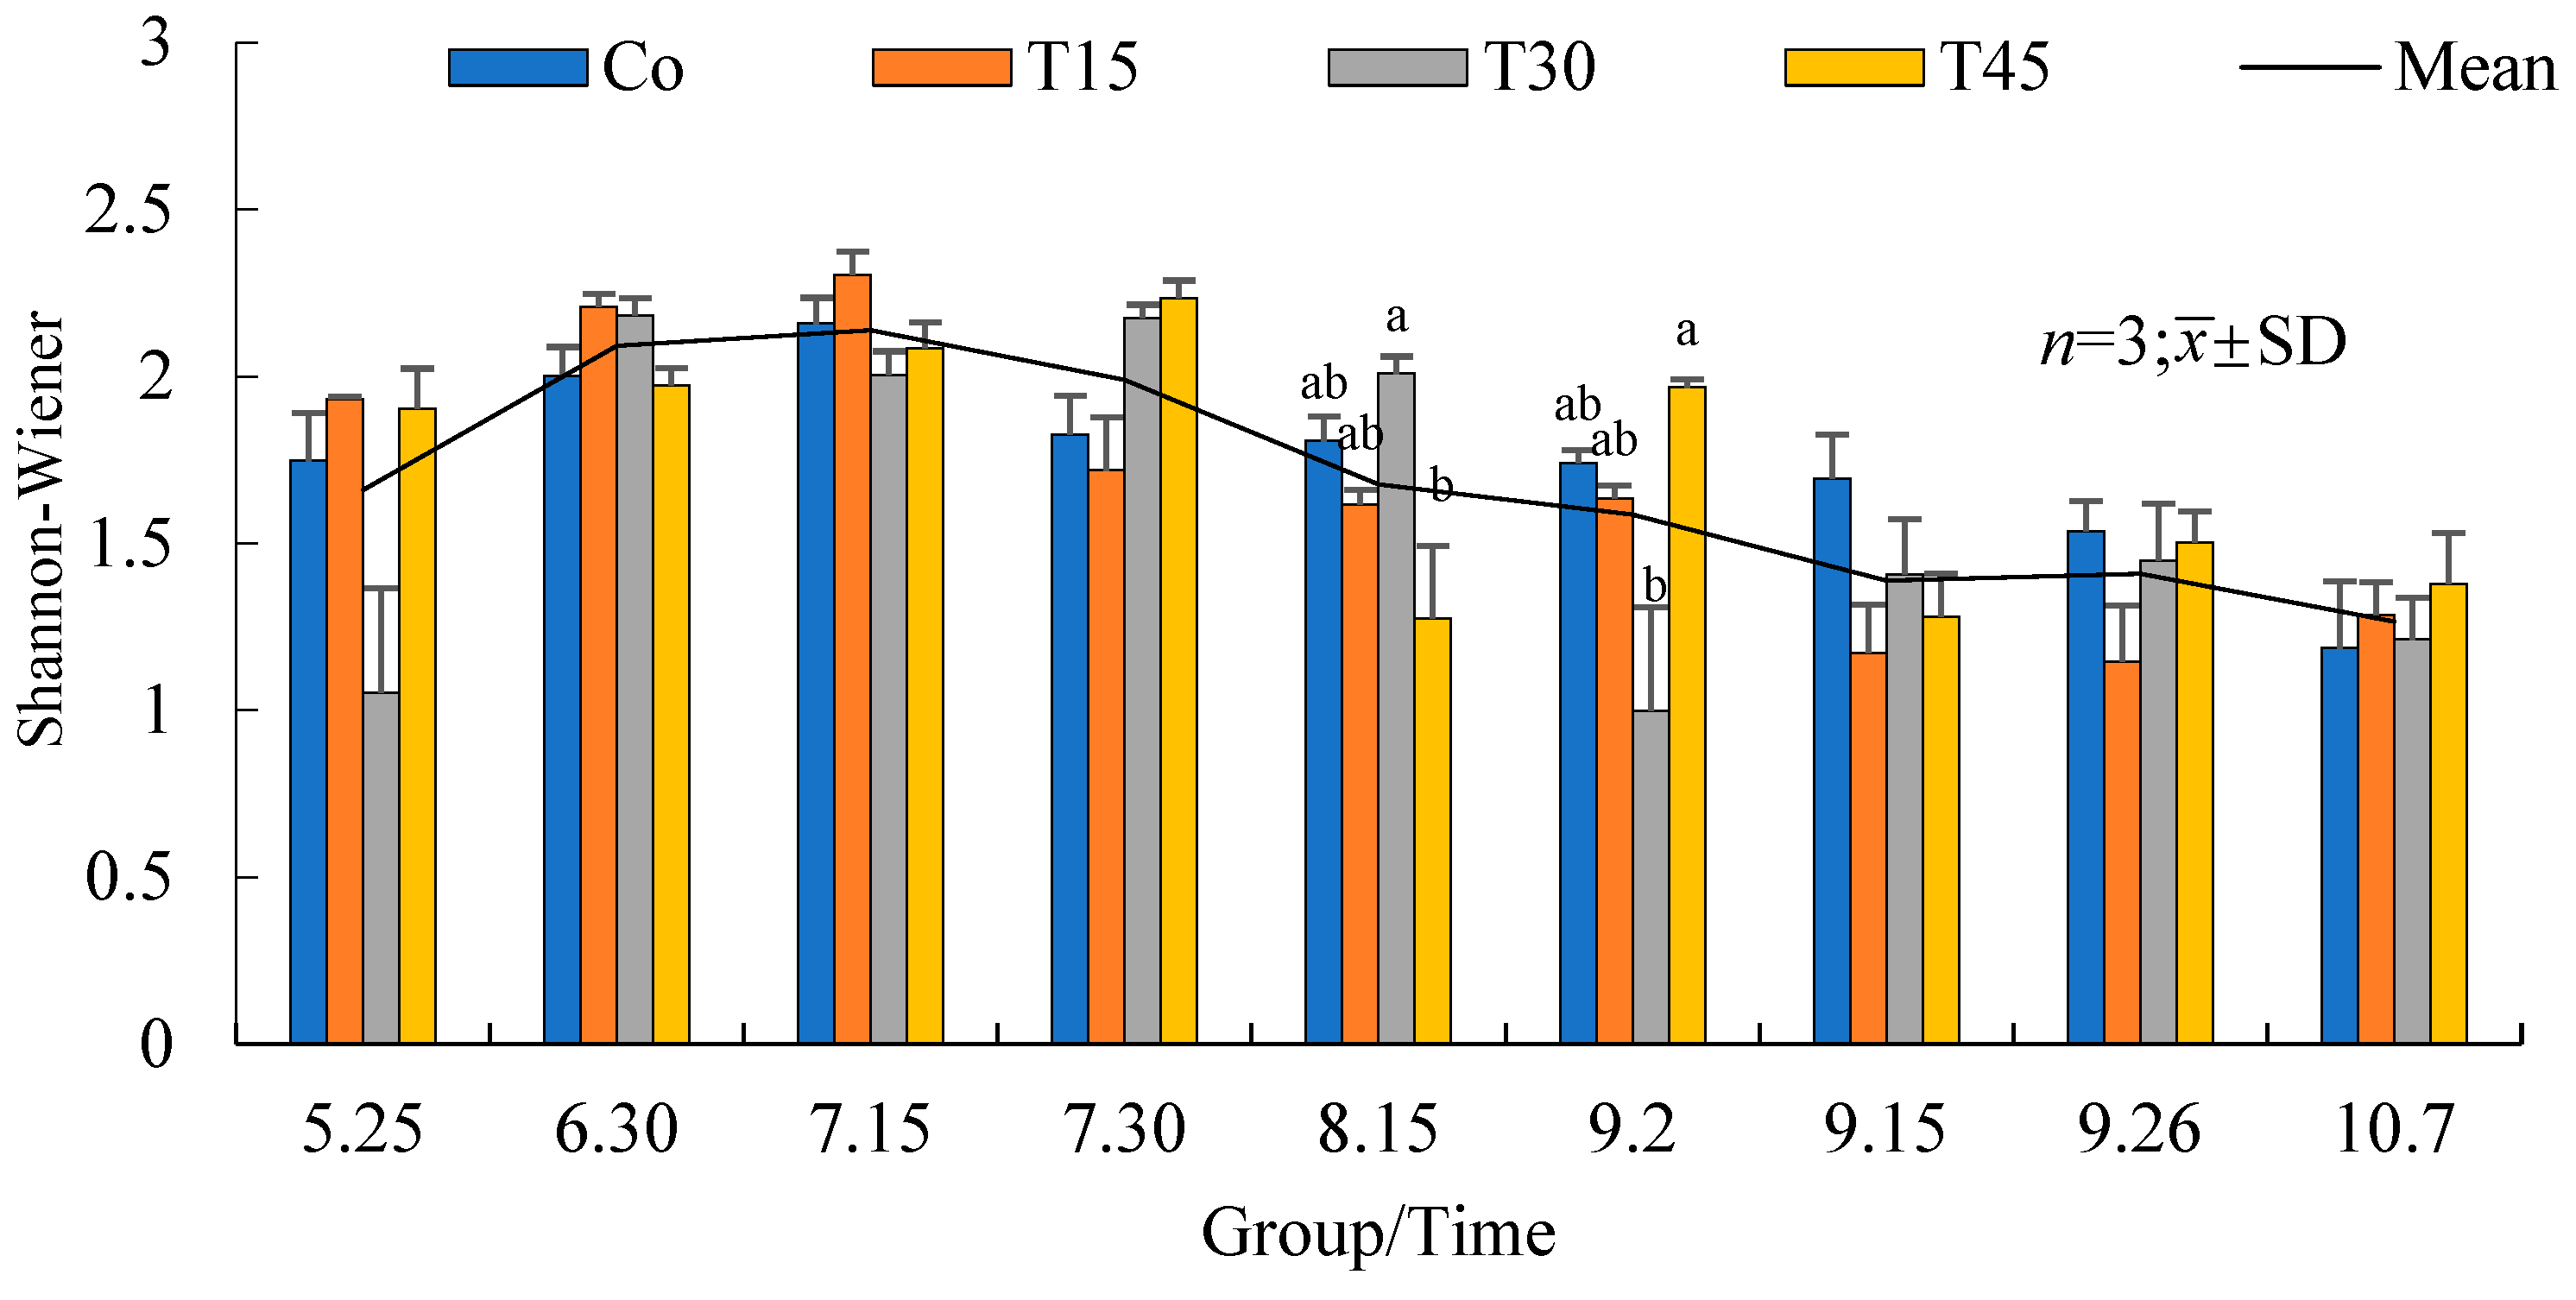
3.4.1. Zooplankton Species Diversity

A total of 50 species of zooplankton were detected during the experiment (Figure 9). Protozoa had the highest number of species, with 23 species detected, and accounted for 46% of the total number of species. Rotifera had 15 species detected, accounting for 30% of the total species. Cladocera had eight species, accounting for 16% of the total species. Copepoda had four species, accounting for 8% of the total species.
The zooplankton species in different treatment groups during the experiment are listed in Table A6. The average biomass of Copepoda was the largest at 31.61 mg/L and accounted for 50.00% of the overall zooplankton biomass. That of Cladocera was 29.29 mg/L and accounted for 46.33% of the total biomass. These two groups accounted for 96.32% of the total average biomass. The average biomass of Protozoa was 1.76 mg/L, accounting for 2.79% of the total. The zooplankton group with the lowest average biomass was the rotifers, with only 0.56 mg/L, accounting for 0.89% of the total average biomass.
The zooplankton diversity in each group was analyzed using the Shannon–Wiener diversity index (Figure 10). The overall average value was 1.69. The diversity index was from 1.19 to 2.16 for the Co group (1.74 average), 1.15 to 2.31 for the T15 group (1.67 average), 1.00 to 2.18 for the T30 group (1.61 average), and 1.27 to 2.08 for the T45 group (1.73 average), respectively.

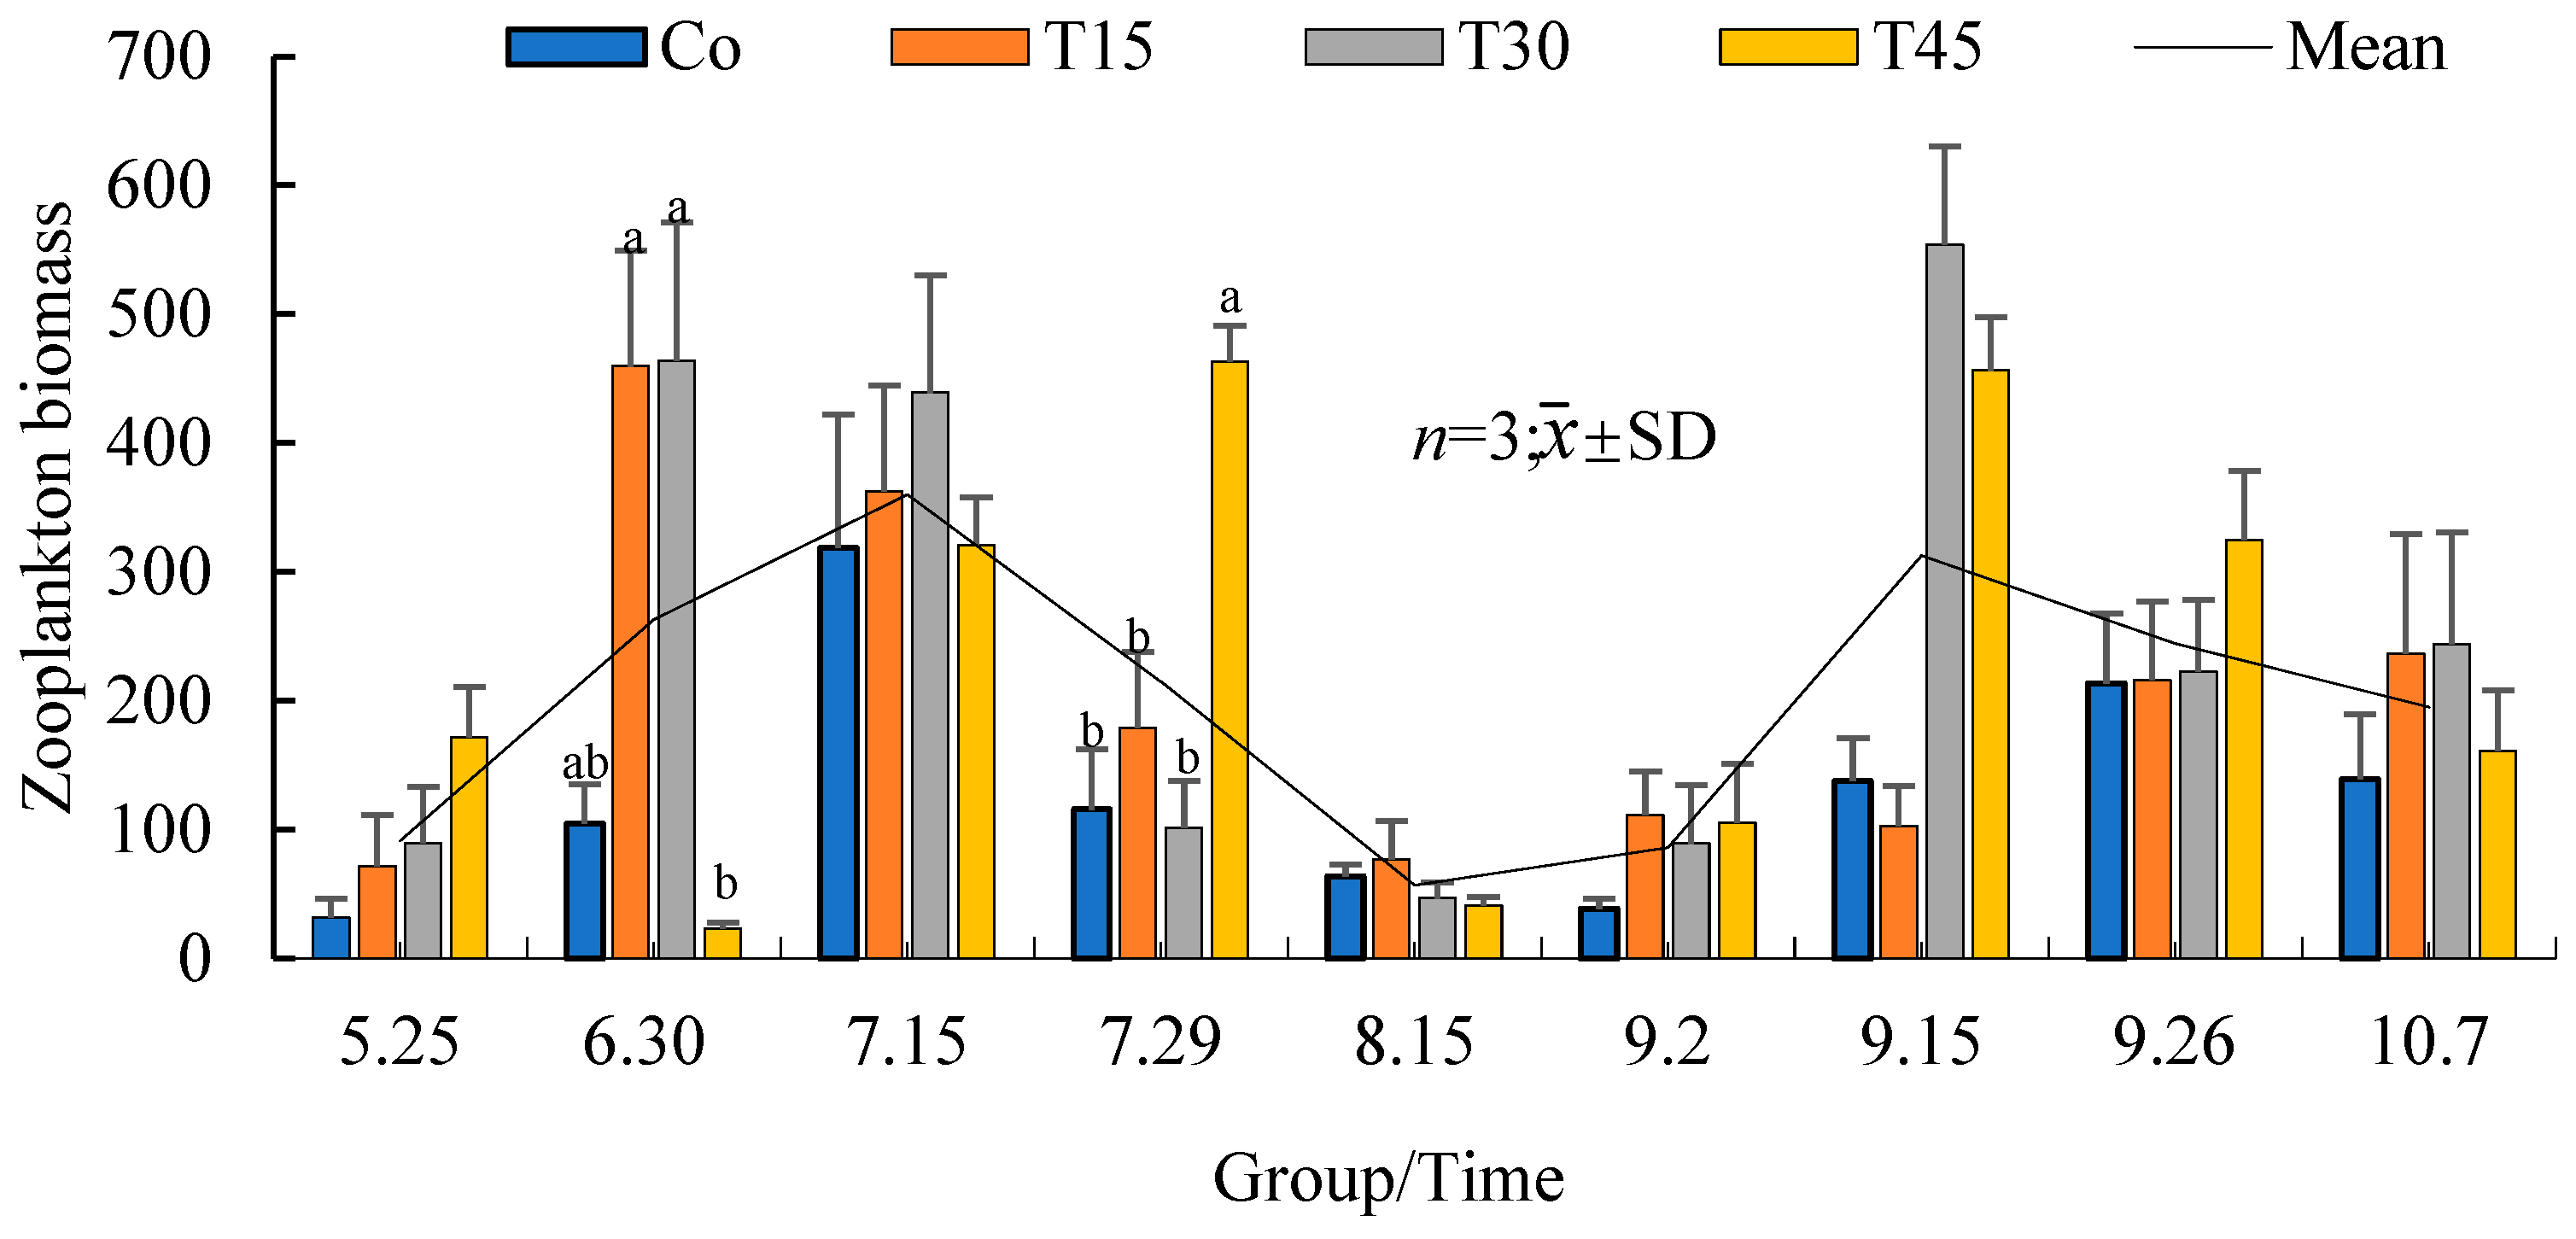
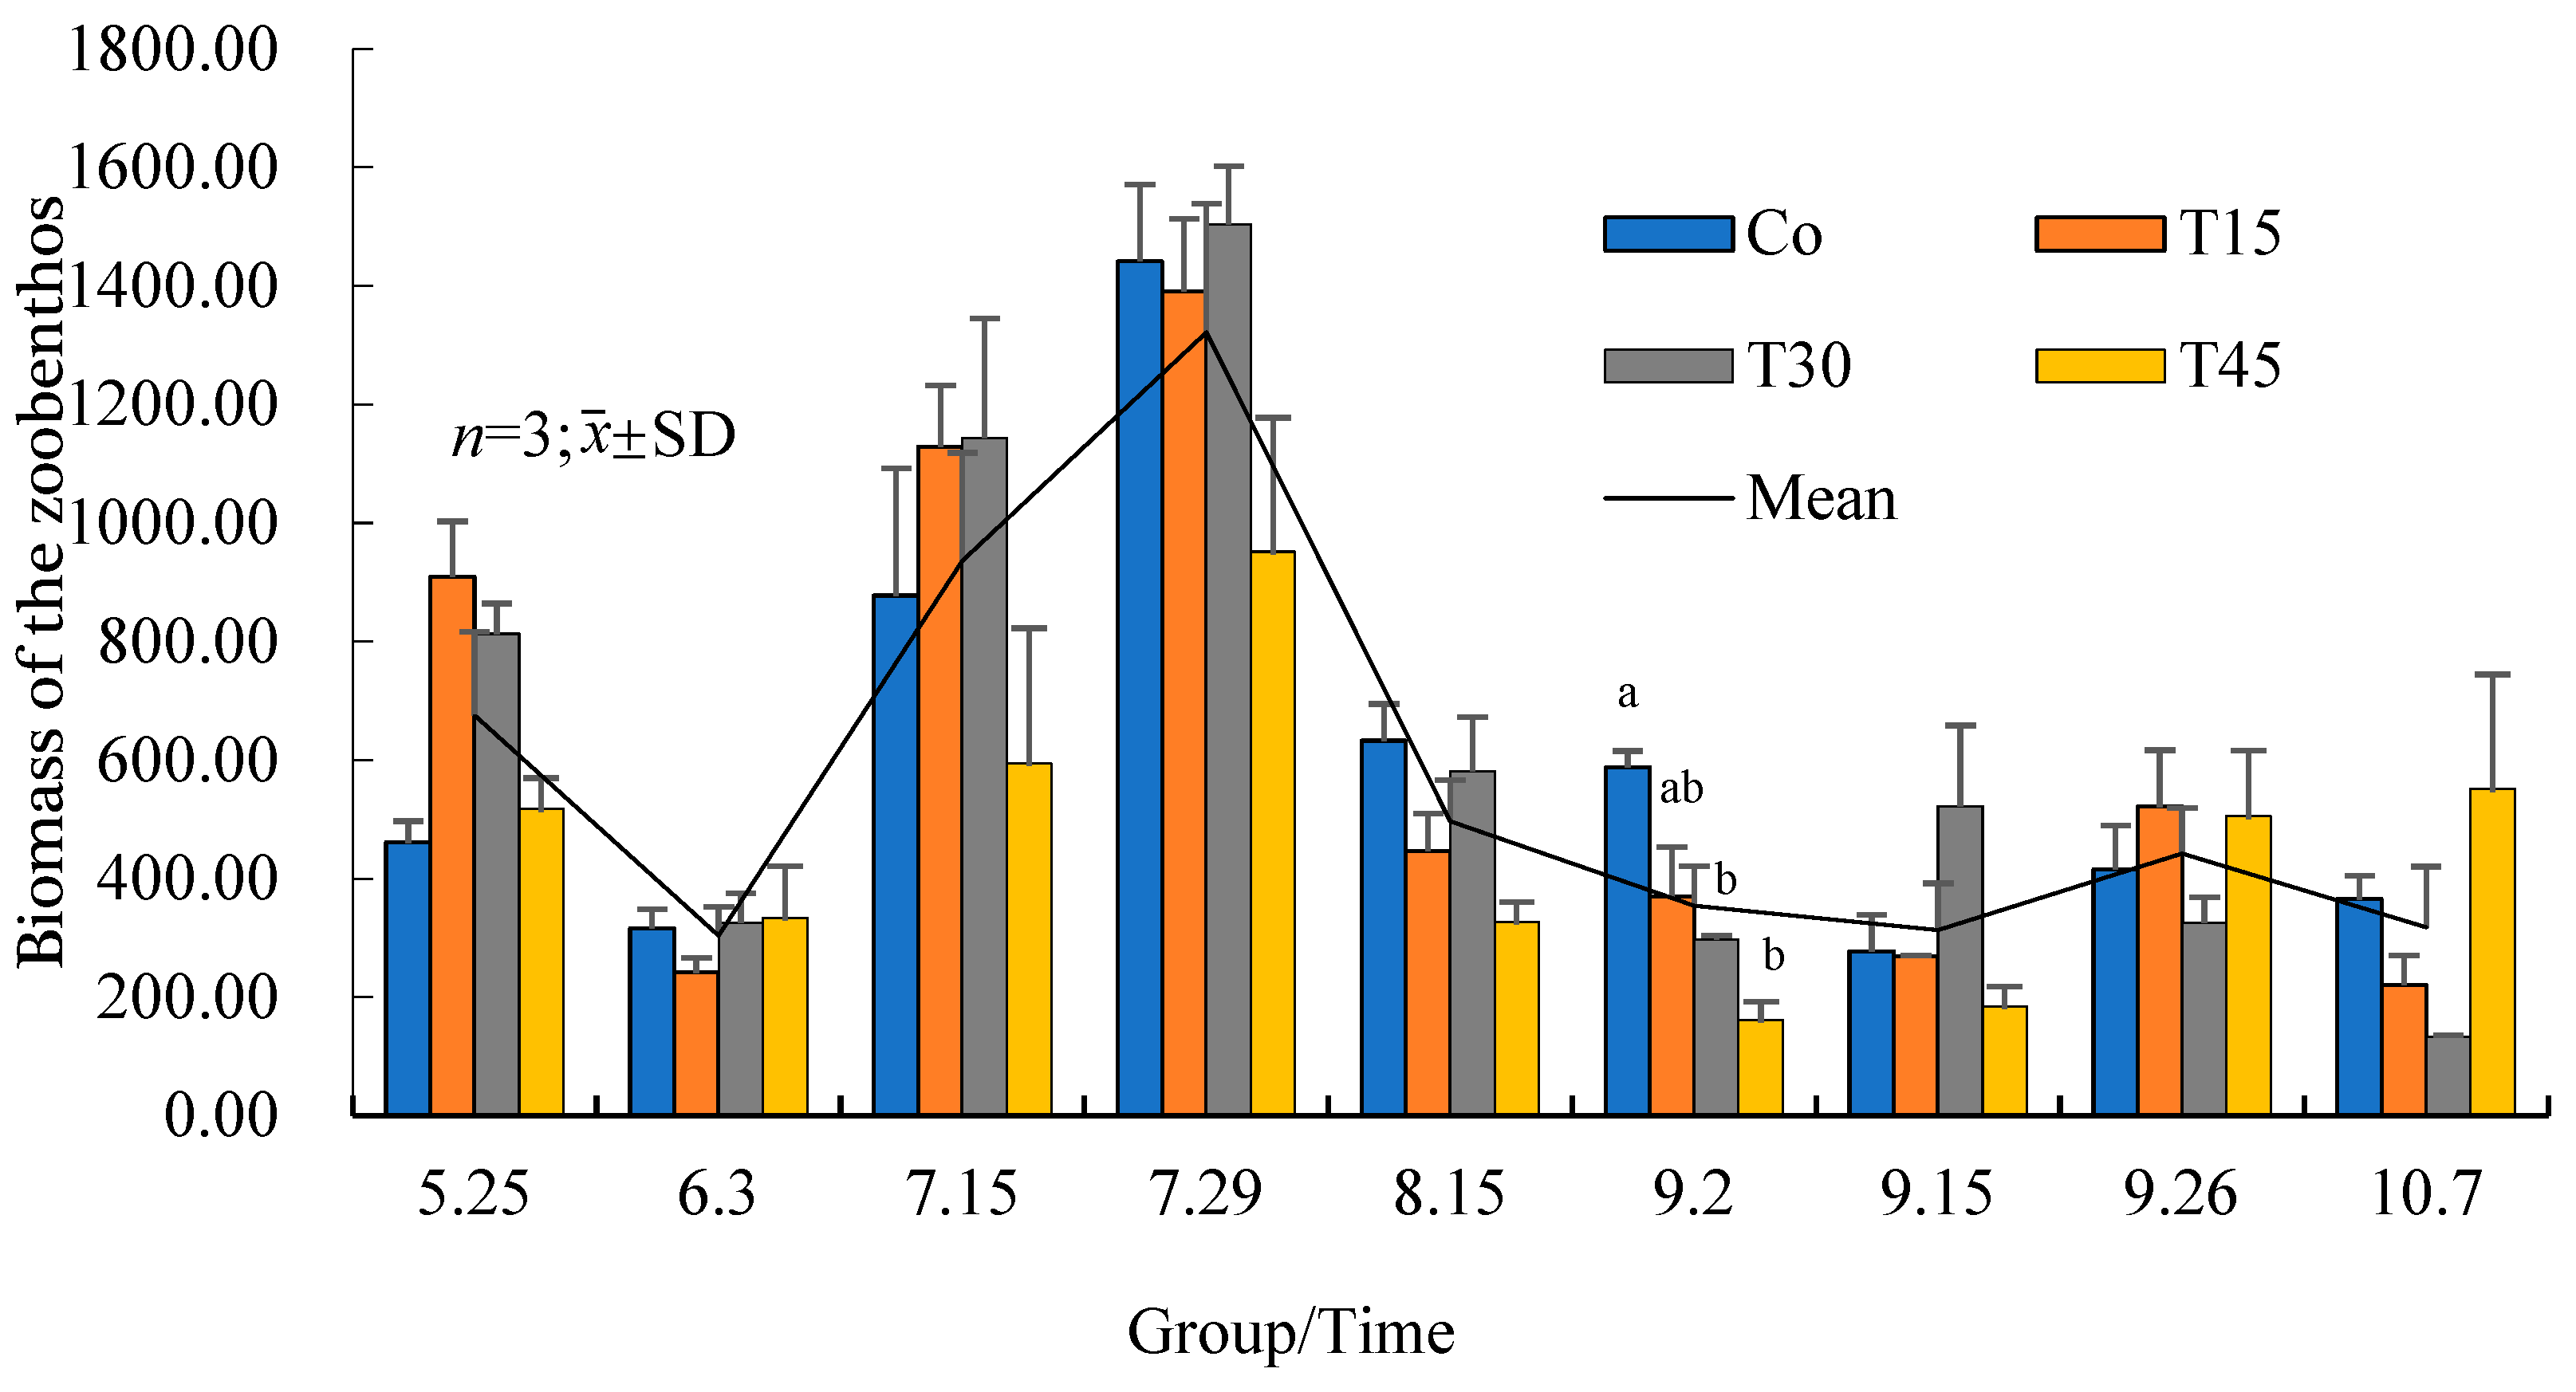
3.4.2. Variation Trends of the Zooplankton Biomass over Time

The total average zooplankton biomass in the paddy field fluctuated over time. There was an upward trend from the beginning of the experiment to 15 July, which then decreased to 15 August and increased to September 15 before decreasing again (Figure 11). The biomass of zooplankton in T45 was significantly lower than those in T15 and T30 on 30 June (p < 0.05), while the biomass in T45 was significantly higher than those in other groups on 29 July (p < 0.05).

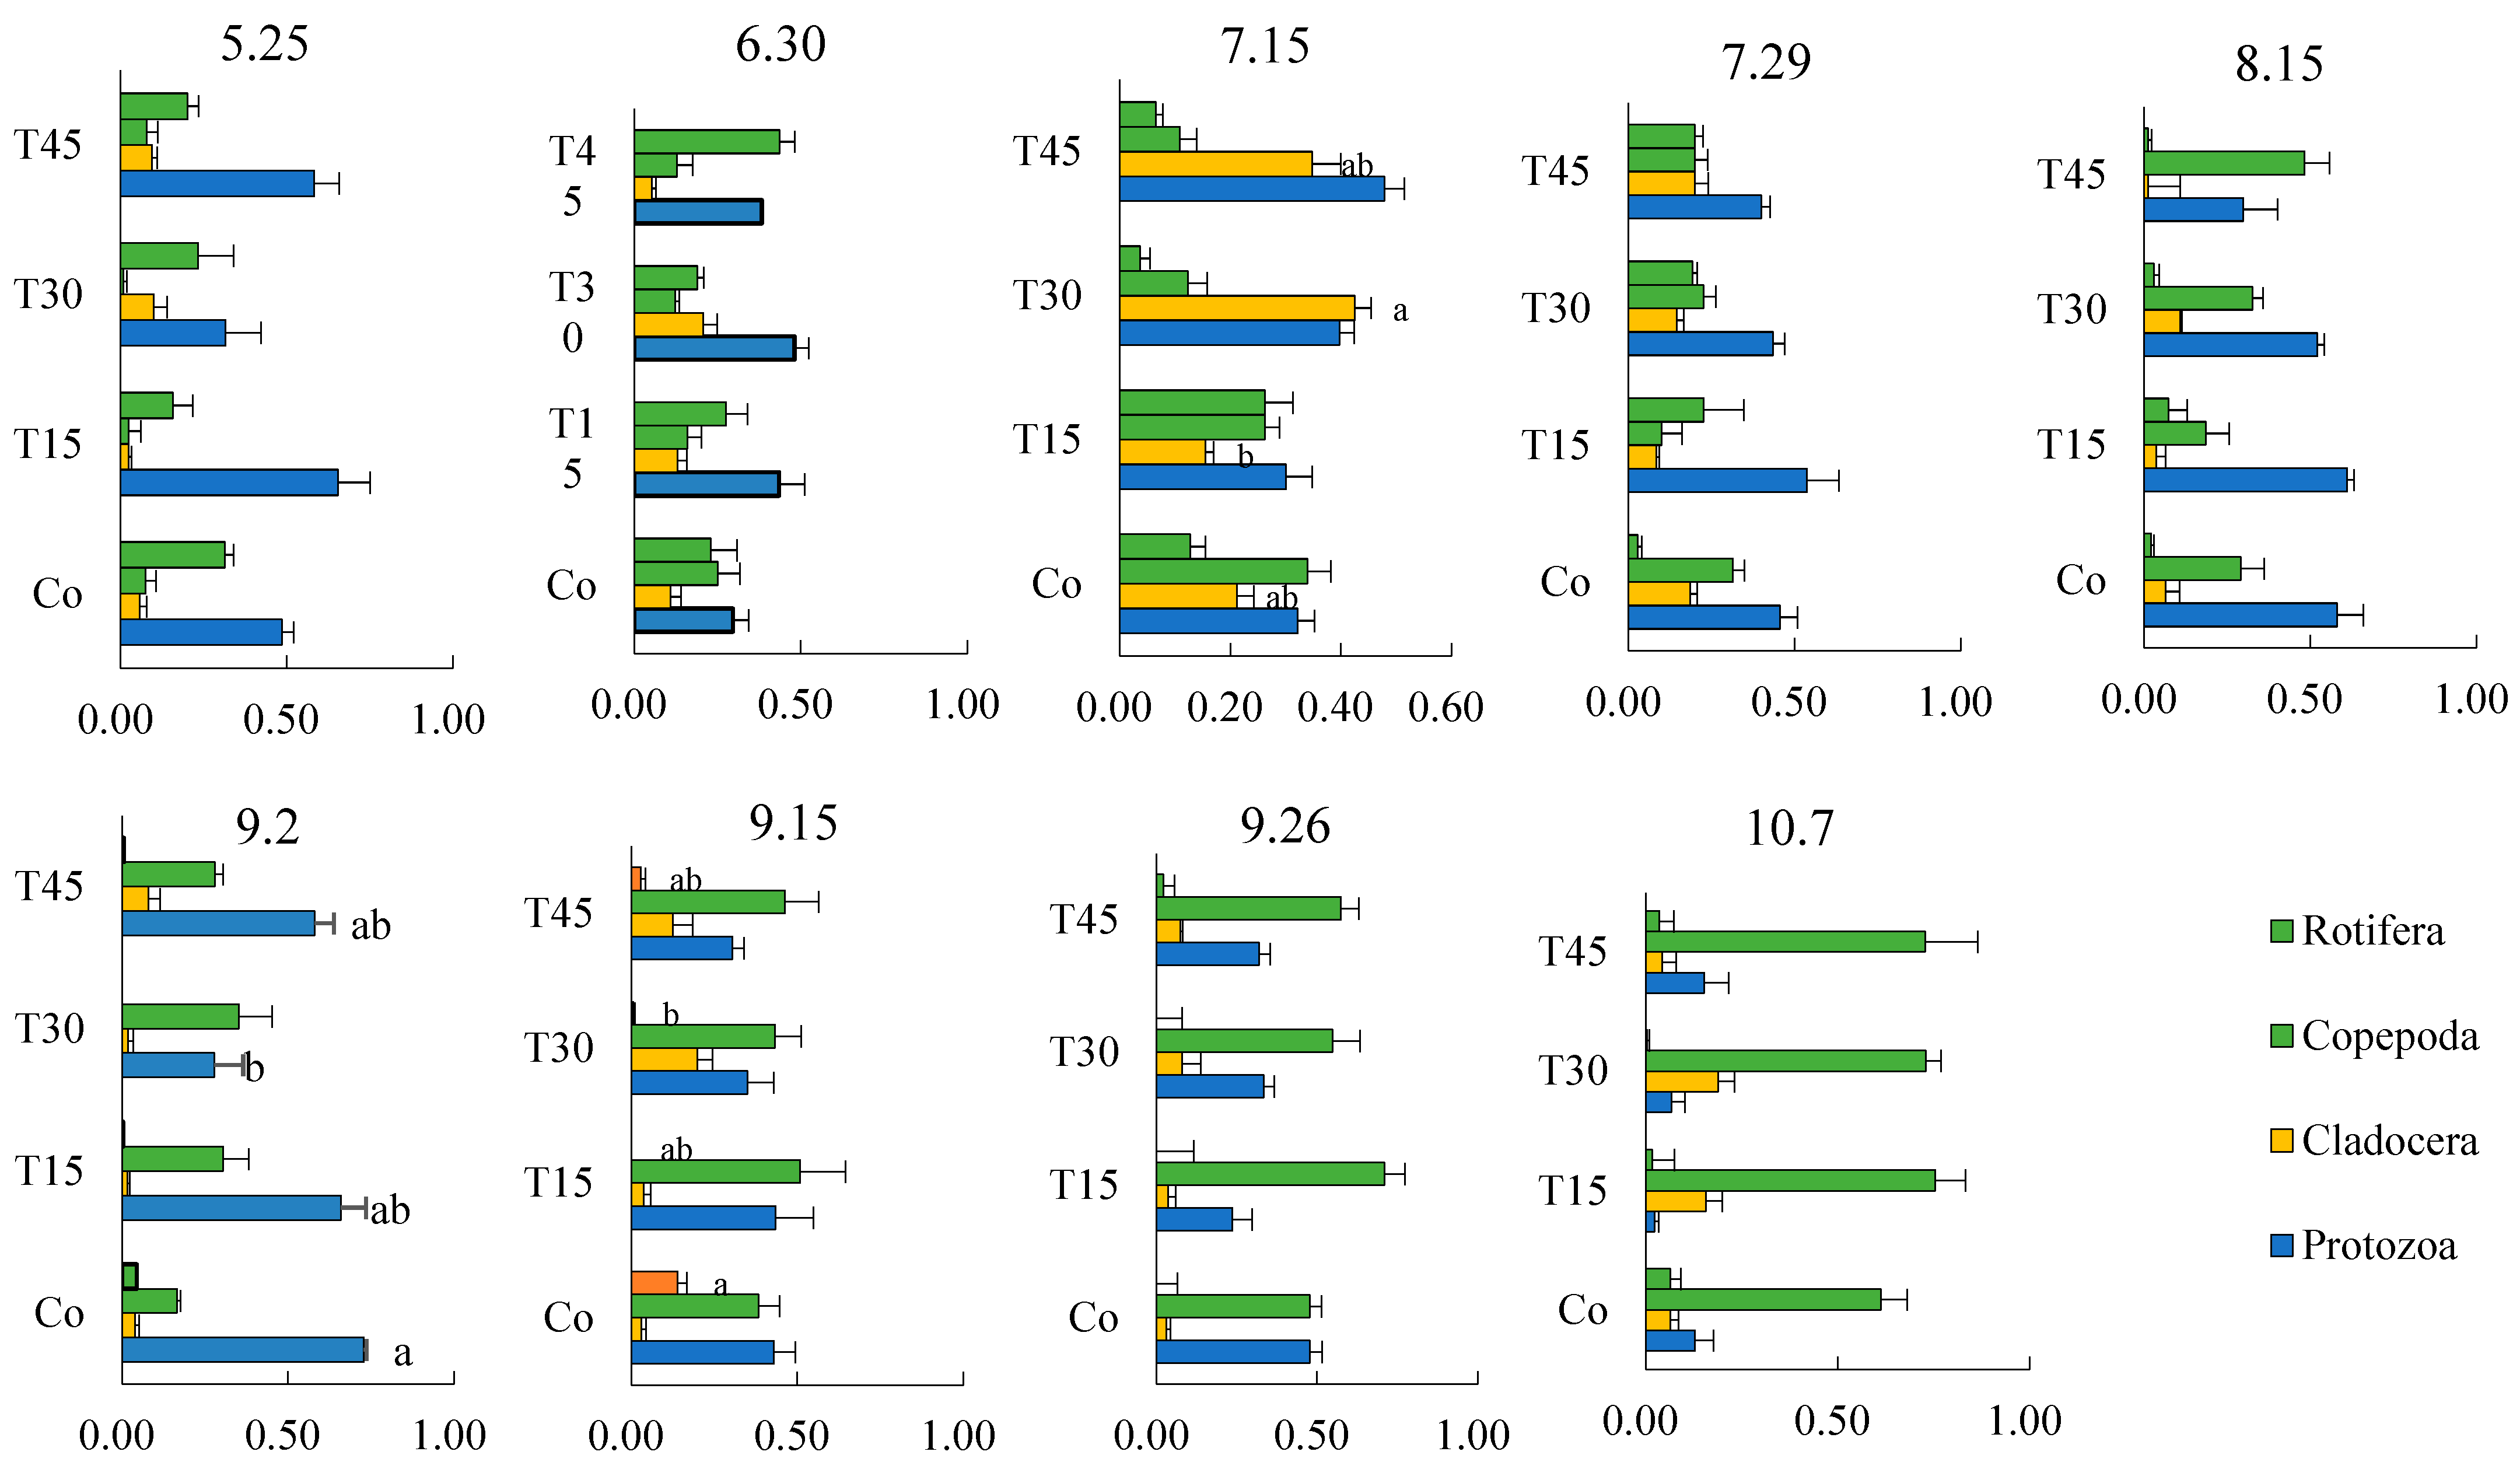
3.4.3. Succession of Dominant Zooplankton Species and Community Changes

The dominant zooplankton species in the paddy fields during the experiment are shown in Table A7 and Figure 12. When dominance value (Y) > 0.02, the species was considered dominant. The dominant species in different treatment groups consisted of 32 species belonging to 4 zooplankton groups (i.e., Rotifera, Copepoda, Cladocera and Protozoa), respectively. The biomasses of the dominant zooplankton species were relatively low in the four treatment groups on 25 May and 7 October. The number of dominant species in T15 was the lowest on 15 August. The numbers of dominant species were 6 to 10 in Co group, 4 to 11 in T15 group, 4 to 9 in T30 group, and 6 to 9 in T45 group, respectively, from 30 June to 26 September.

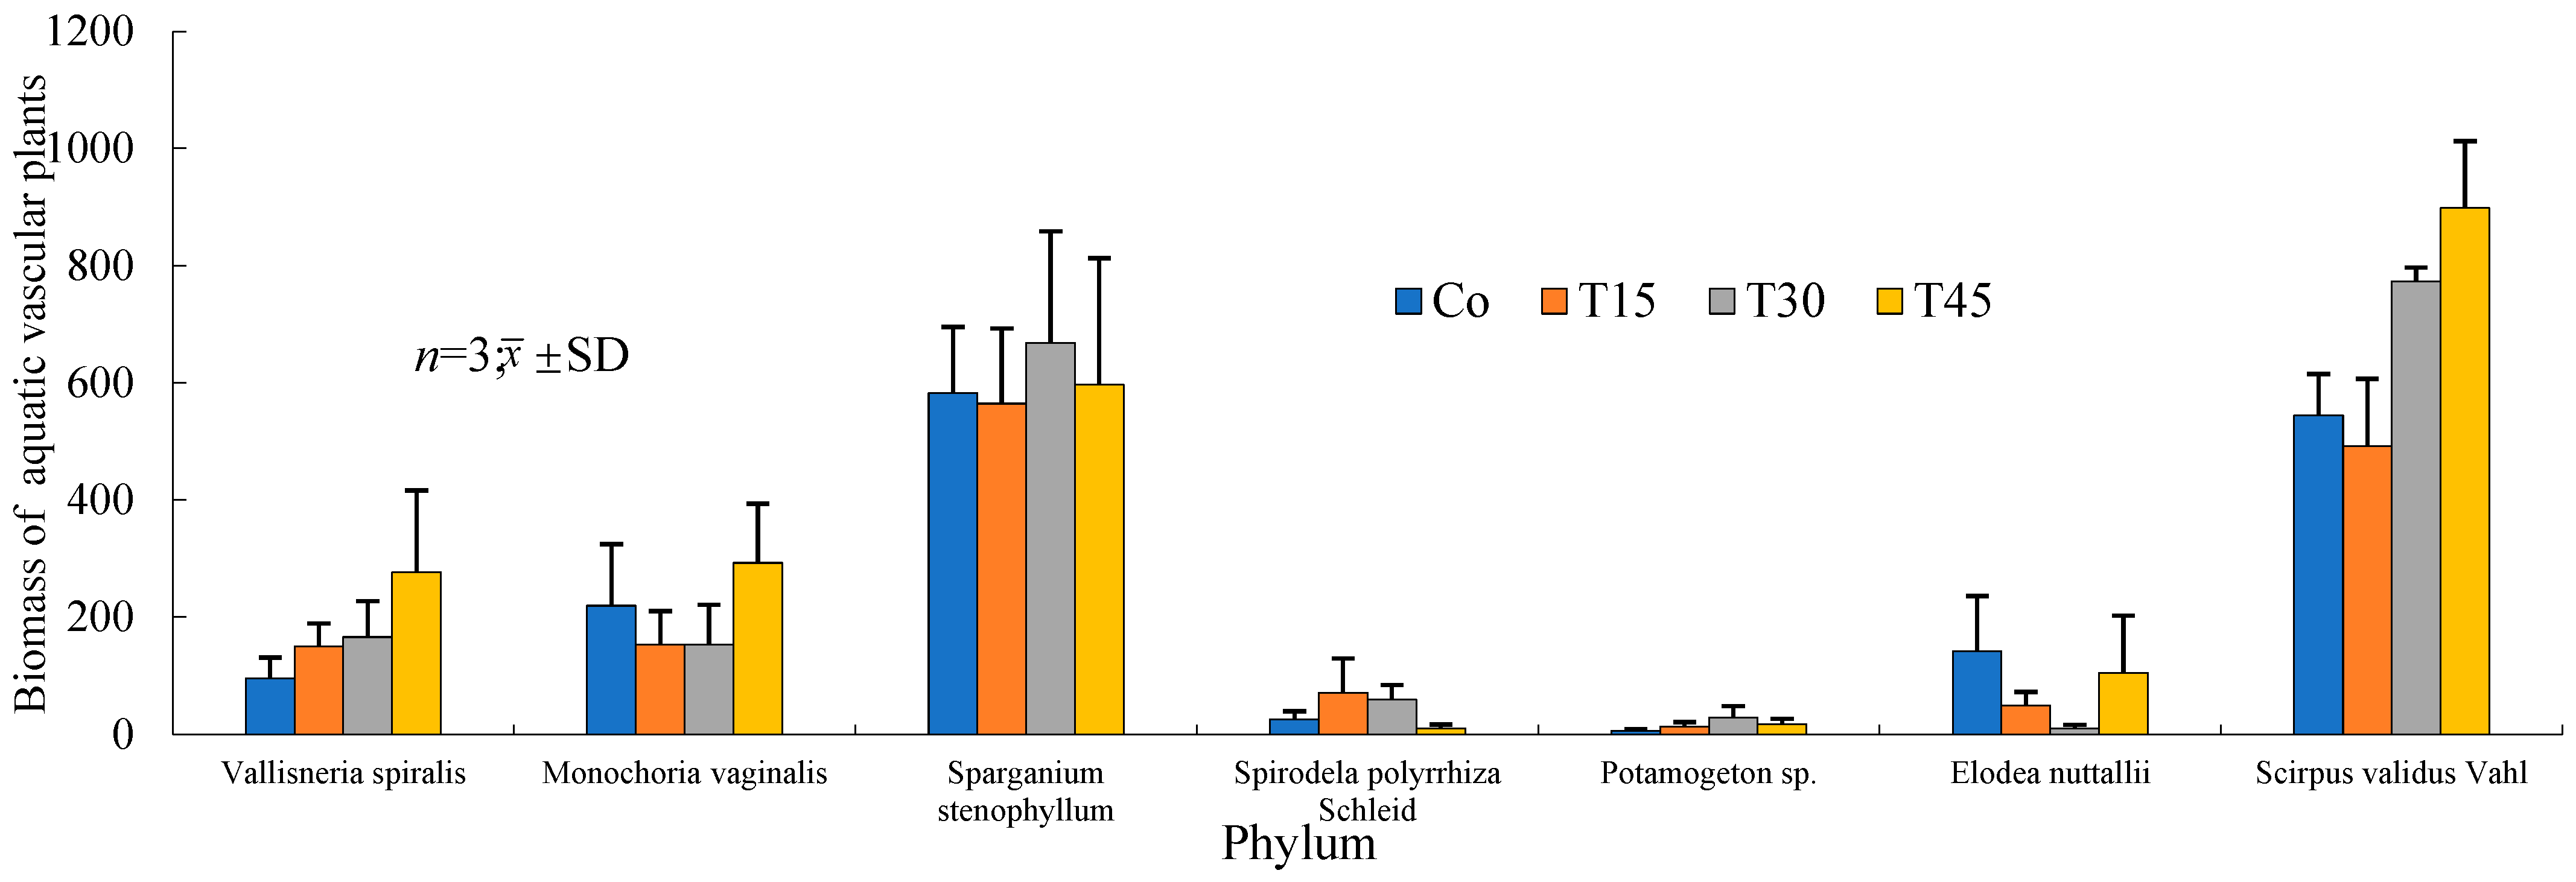
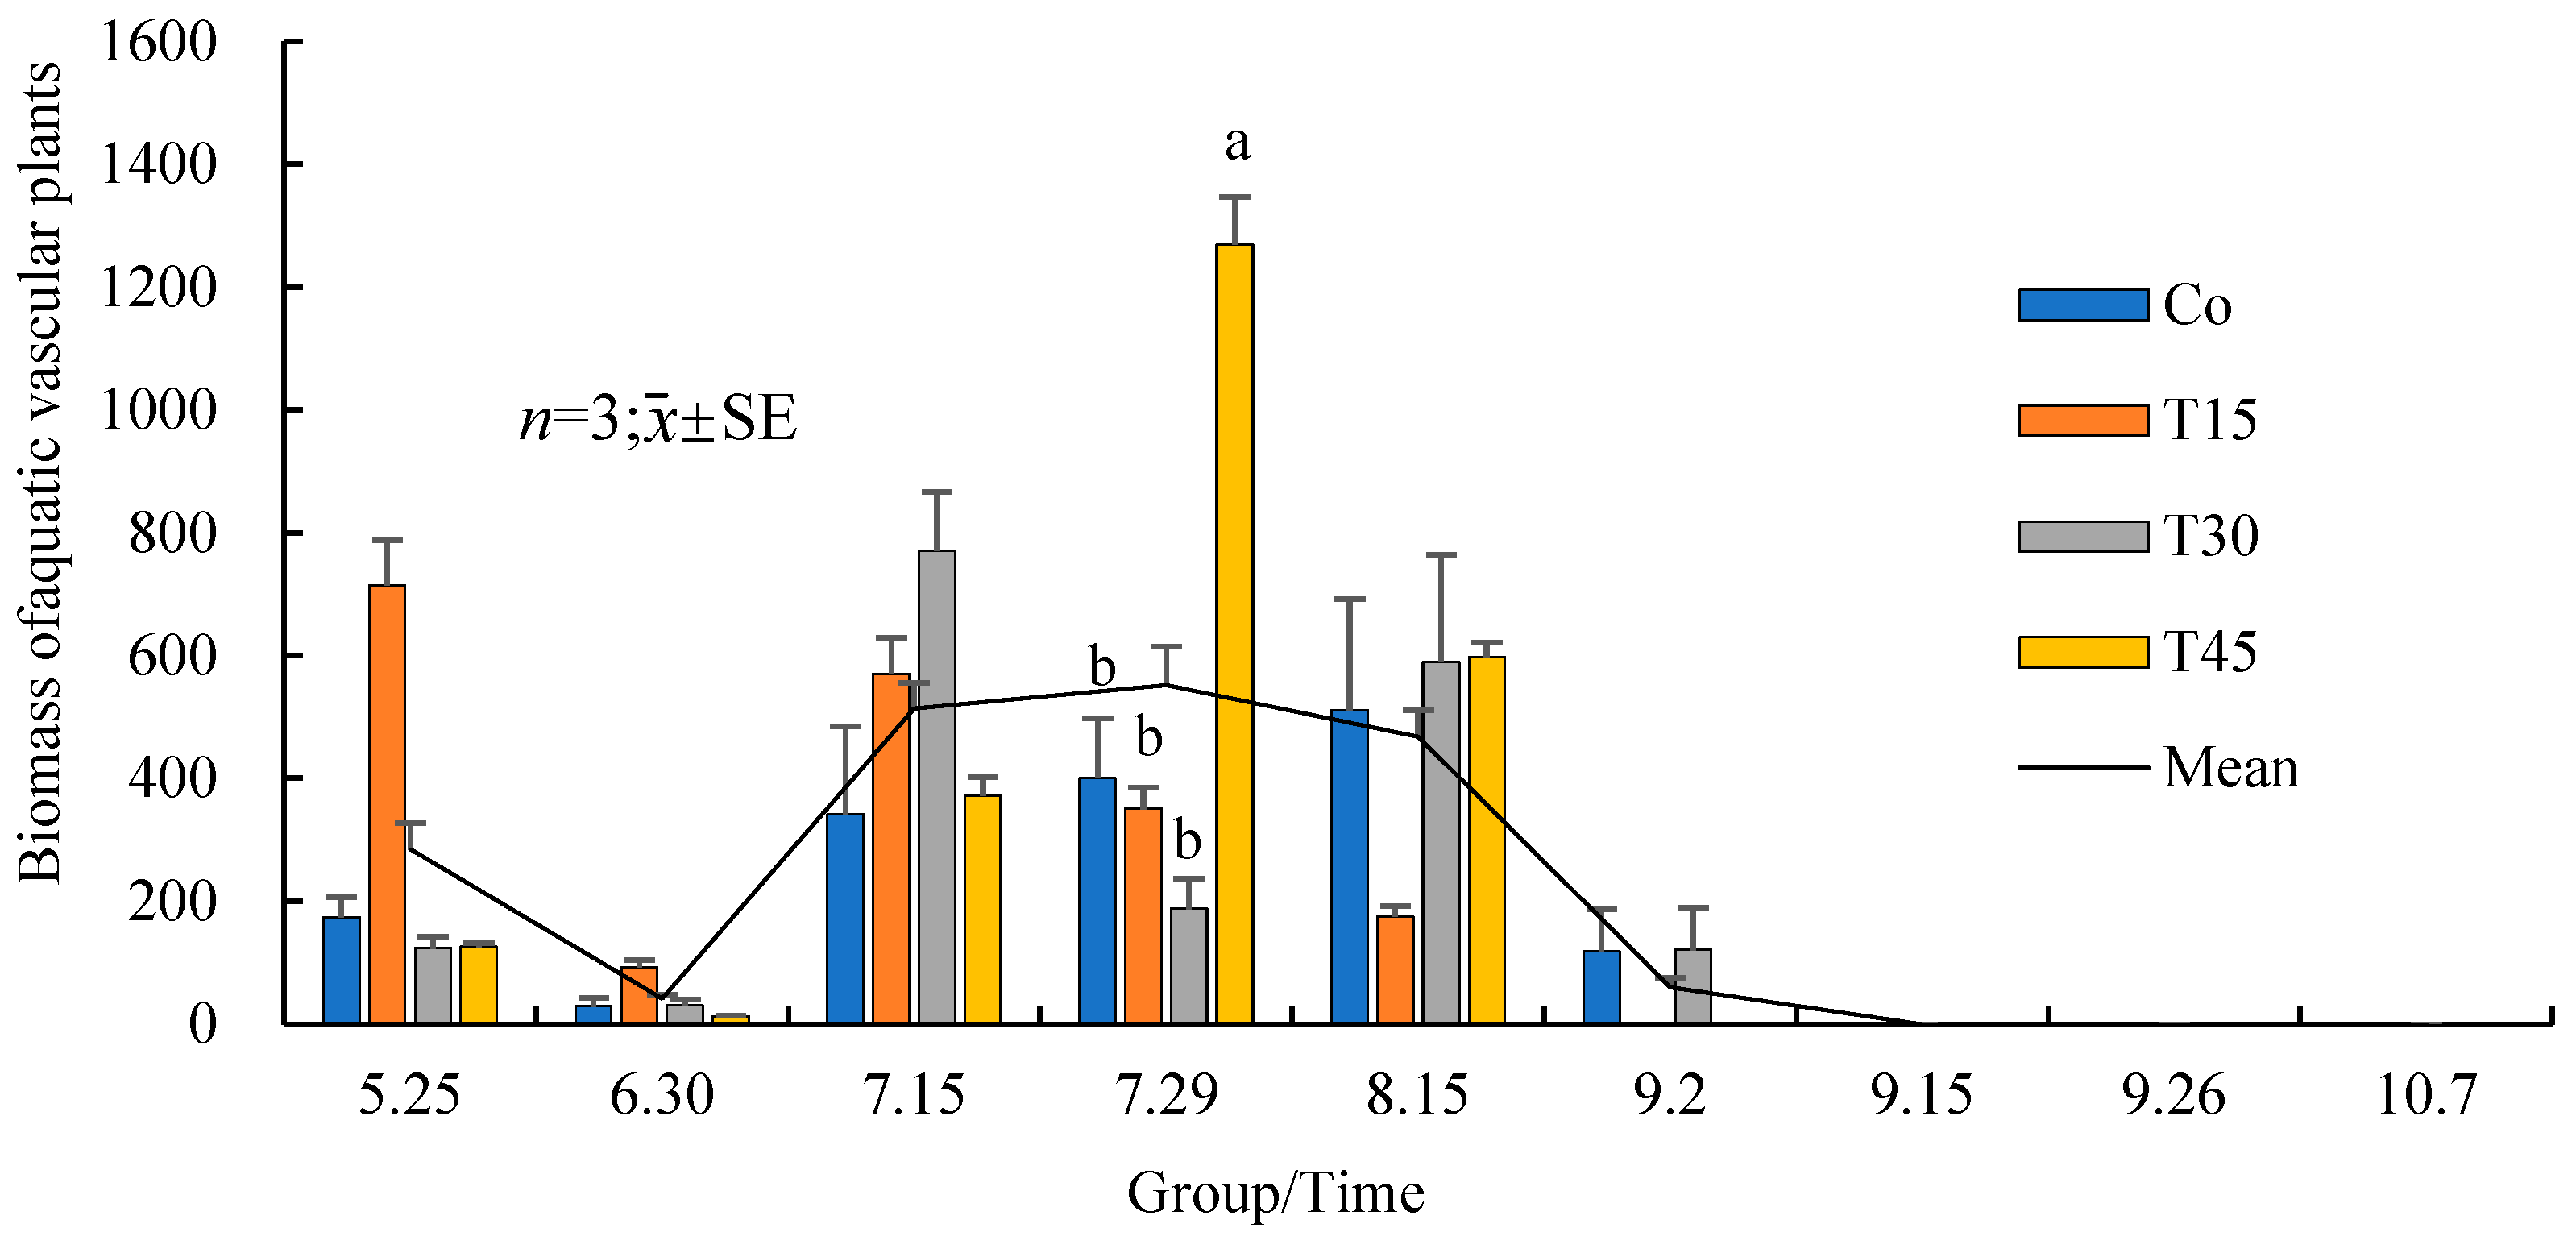
3.5. Species, Quantities, and Changes in Aquatic Vascular Plants

The species diversity and biomass of the aquatic vascular plants in the enclosures of each treatment group are shown in Figure 13. Seven aquatic vascular plants were detected in the four treatment groups, i.e., Vallisneria spiralis, Monochoria vaginalis, Sparganium stenophyllum, Spirodela polyrhiza, Potamogeton sp., Elodea nuttallii, and Scirpus validus.
Sparganiumstenophyllum was the most dominant species, with an average biomass of 535.71 g/m2, accounting for 52.02% of the total aquatic vascular plant biomass. The following dominant species was S. validus with 287.12 g/m2, accounting for 27.88% of the total biomass. Meanwhile, the biomasses for M. vaginalis, V. spiralis, E. nuttallii, S. polyrhiza and Potamogeton sp. were 82.79, 79.55, 24.09, 15.41 and 5.12 g/m2, and accounted for 8.04%, 7.72%, 2.34%, 1.50% and 0.50% of the total biomass, respectively.
The changes of the submerged-plant biomass in different treatment groups over time are shown in Figure 14. The statistical analysis revealed significant variations in the biomass of submerged plants in each treatment group with different times. The overall submerged-plant biomass rapidly decreased to 30 June before rapidly increasing to 25 July and then increased gradually to 29 July and 15 August. The biomass in the T45 group was significantly higher than the other groups (p < 0.05). Afterwards, submerged-plant biomass rapidly decreased again. No submerged plant was found in all treatment groups from 15 September to 7 October.
The biomass of the emergent plants in different treatment groups over time are shown in Figure 15. The statistical analysis revealed significant variations in the biomass of emerged plants at different times. Generally, the biomass increased throughout the experiment and only decreased in the last sample collection. The emergent plants biomass in the Co group was significantly higher than that in the T45 group on July 15 and July 29, while the biomass in the T15 and T30 groups was significantly higher than that in the T45 group on July 29 (p < 0.05).

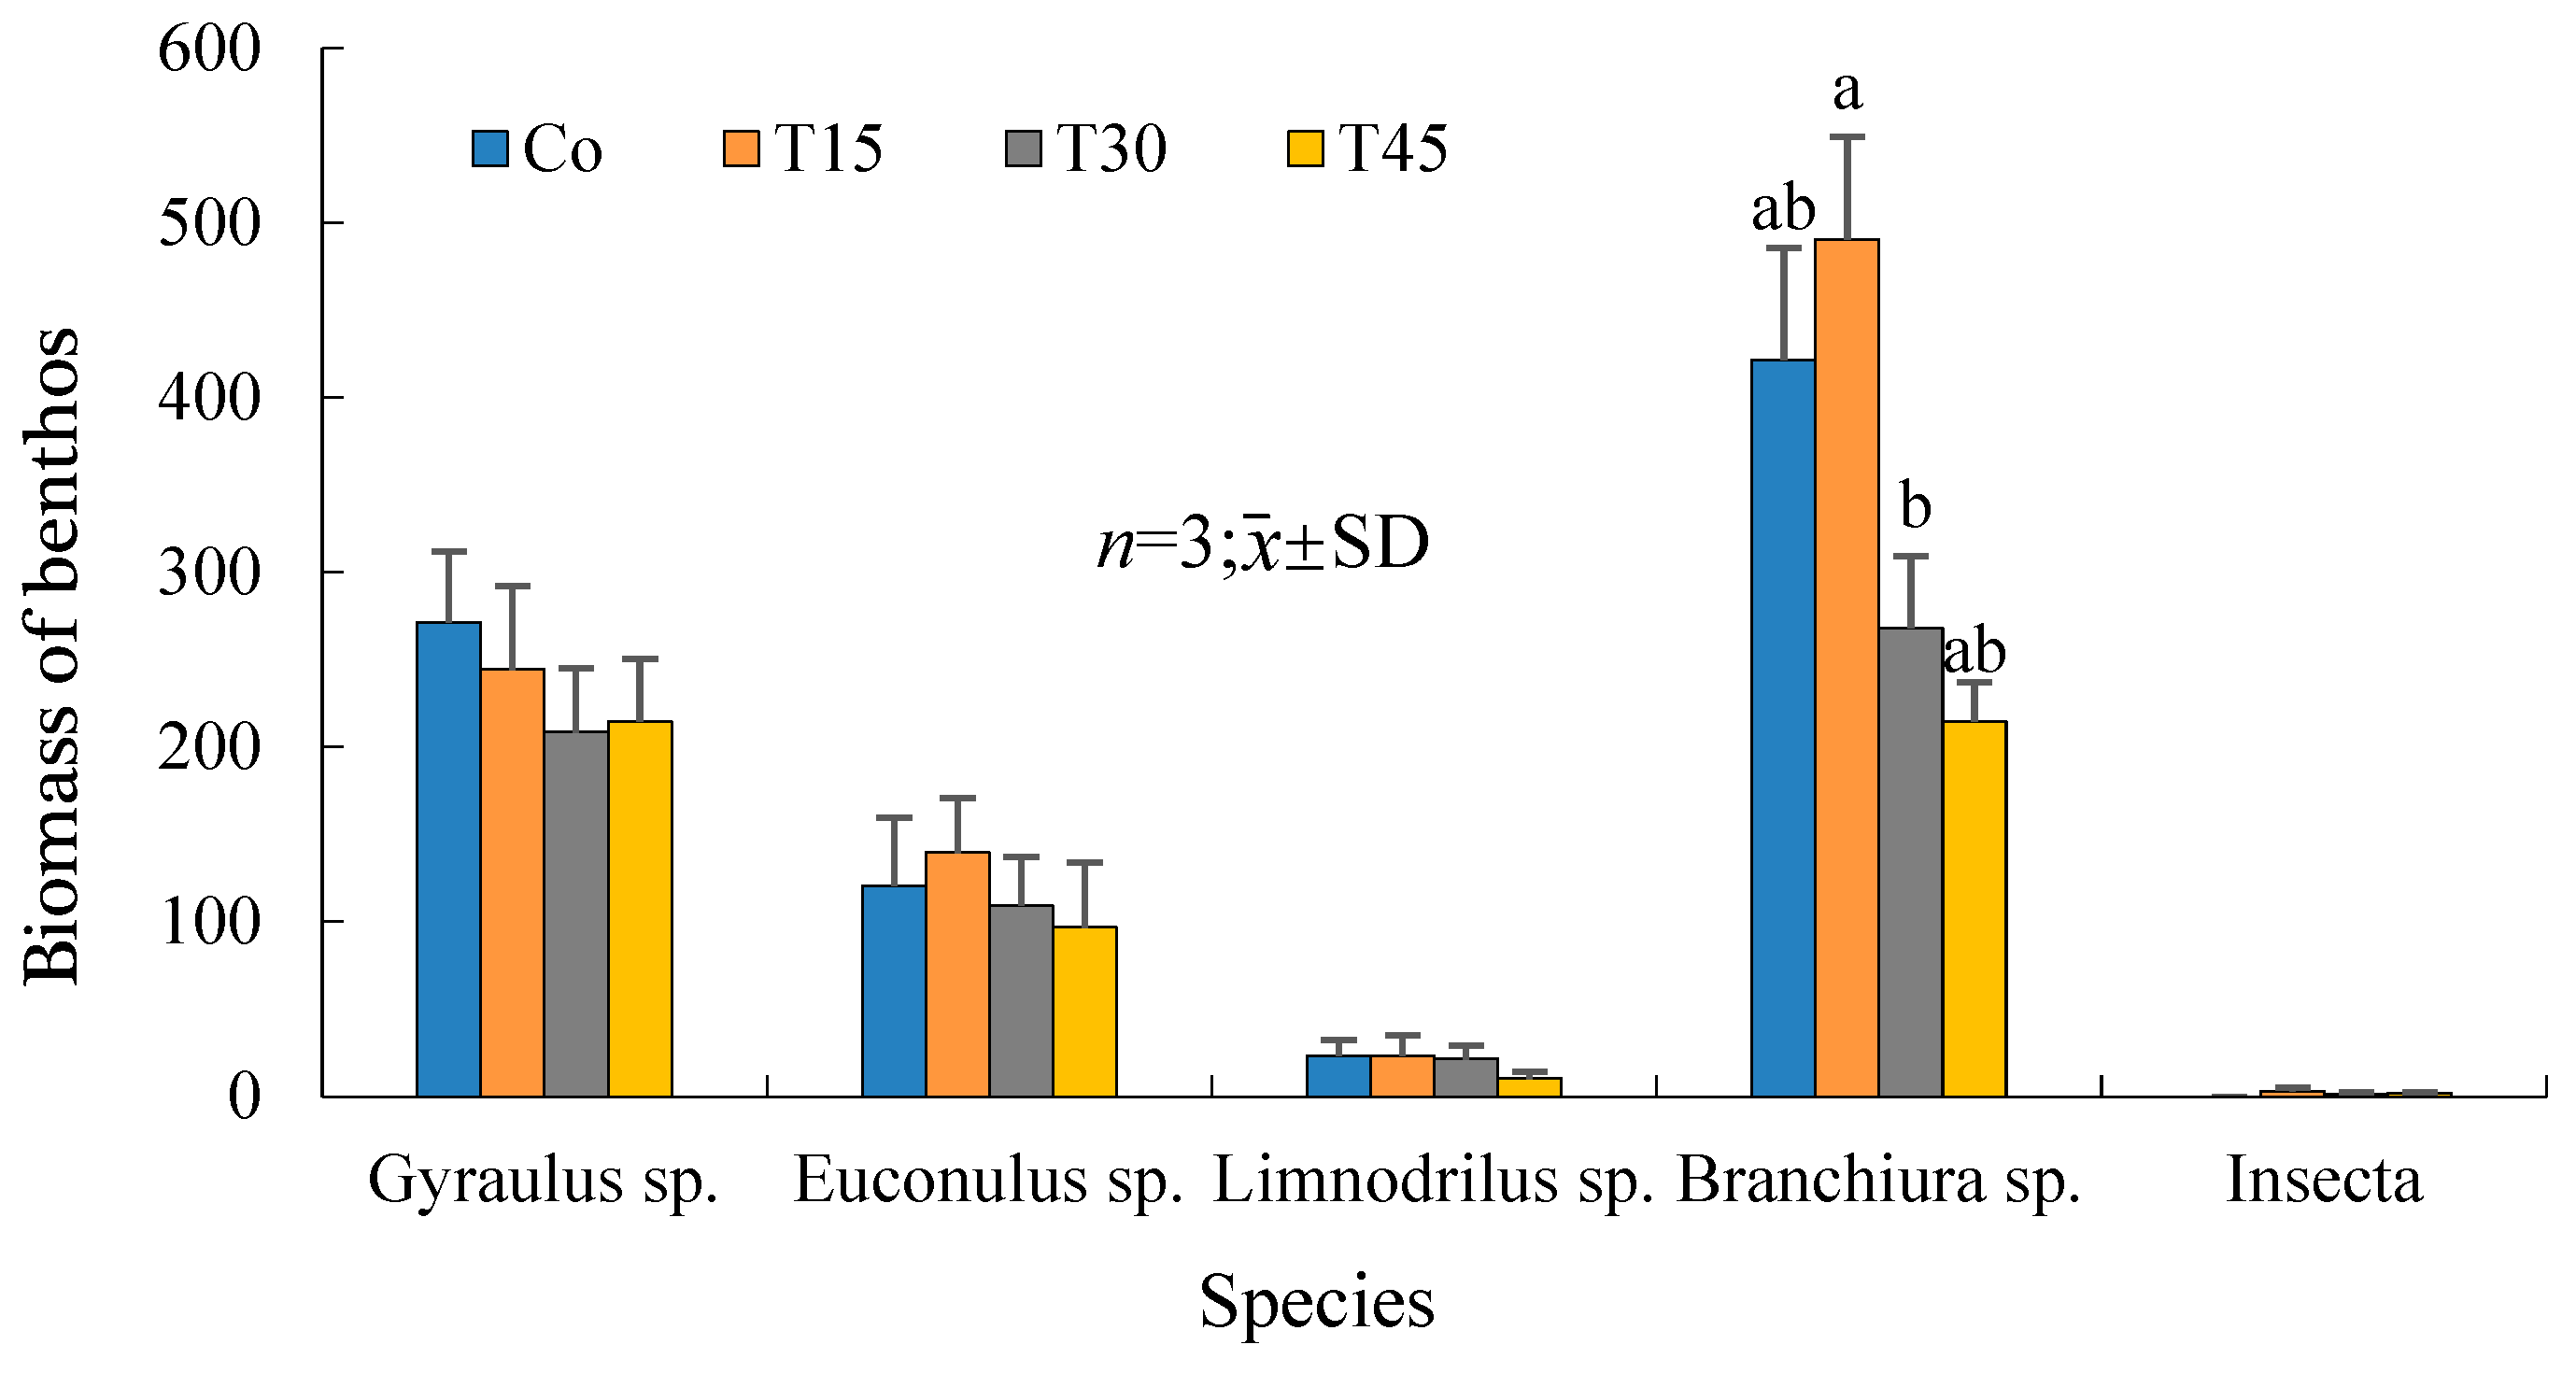
3.6. Variations in the Benthic Animal Species and Quantities with Time

The diversity and biomass of benthic animals in different treatment groups are shown in Table A8 and Figure 16. Five taxa were found in the nine samples from the four treatment groups, i.e., Gyraulus sp., Euconulus sp., Limnodrilus sp., Branchiura sp., and Insecta.
The biomass of benthic animals in different treatment groups changed over time. Generally, they initially increased from 23 May to 29 July, then decreased rapidly to 15 August, followed by a gradual decline through September until the end of the experiment (Figure 17). On 2 September, the biomass of the benthic animals in the Co group was significantly higher than that in the T45 and T30 groups (p < 0.05). No significant difference was found among various treatment groups at the same sampling time.

4. Discussion

4.1. Effects of Diets with Different Protein Levels on the Growth Performance and Yield of Juvenile Crabs

Protein is one of the most important nutritional components in the diet of crabs, and the level required varies depending on growth stages [16]. The five separate measurements of morphological parameters of the crabs revealed that the high-protein compound feed resulted in significantly higher crab carapace length, width, and height and body weight compared with those in the low-protein group. Feeding with a high-protein compound feed had a significantly positive effect on the weight gain rate, final body weight, and specific growth rate of juvenile crabs. These results support the findings of Zhang [6]. However, the T30 group in this experiment may have escaped and/or had “milky disease” [17]. The rate of disease varied according to the original health status of the crabs and may have resulted in the observed differences in survival rates; however, there was no significant difference in the crab yield between the different diet treatments. These results do not correspond with the growth rate results. Therefore, the contribution of natural food to crab growth may be underestimated in the rice–crab co-culture mode.
Integrated agricultural and aquaculture systems can effectively contribute to green and sustainable agricultural development and ensure food security [18]. In 2017, the “General Principles of Technical Specifications for Rice and Fishing Integrated Planting and Culture,” issued by the Chinese Agriculture and Rural Affairs Bureau, highlighted the fact that animals raised in aquaculture should make full use of natural bait present in the environment (in this case the rice paddies), reducing the use of fish feed. The results of this experiment strongly support this statement. The lower temperature in the paddies is more favorable to the growth of crabs compared with the temperature in monoculture crab systems, which can reduce crab sexual precocity [19].
In this experiment, the sexual precocity rate in the T45 group was approximately 10%, which may be due to the high protein content. Chen et al. [20] demonstrated that when the protein content in the feed is too high, excess protein is converted into fat and stored in the hepatopancreas, resulting in sexual precocity in crabs. Sexual precocity during the breeding process reduces culture efficiency. Studies have shown that the survival rate of adult crabs cultured with precocious crab species in the second year is already extremely low [21]. Therefore, it is important to prevent the sexual precocity of crabs in production.

4.2. Changes in Physical and Chemical Properties of Paddy Water Environment

There were no obvious changes in water temperature, pH, salinity, ammonia nitrogen, or nitrite nitrogen over the course of this experiment. There were also no significant differences between the experimental groups. The ammonia nitrogen and nitrite content of the water was low. However, there was a downward trend in dissolved oxygen levels in the water, which may have been caused by a variety of factors. The daily photosynthesis of plants is the main source of dissolved oxygen in water [22]. Animal respiration in the water releases large amounts of organic matter. Additional organic matter is produced during decay (after death) and after feeding, which leads to an increase in the respiration in water and sediments, and is also the main destination of dissolved oxygen [23]. The crabs were placed in the experimental enclosures on 29 May. On the same day, the dissolved oxygen in the water began to decrease, indicating that crab respiration was the main factor causing the low dissolved oxygen in the rice–crab co-culture. As the experiment progressed, the shading effect of large vascular plants (including the rice) led to a decrease in phytoplankton photosynthesis. This is also one of the reasons for the decrease in dissolved oxygen levels. In the later stages of the experiment, the plankton species and biomass and the biomass of zooplankton increased, while the biomass of the phytoplankton decreased. Consequently, there were more aerobic biological factors and less oxygen-producing organisms in the environment, resulting in a decrease in the dissolved oxygen levels in the water. The levels of dissolved oxygen ranged from 3.04 to 8.75 mg/L, which is lower than the normal dissolved oxygen requirements of crabs (5 mg/L). In low dissolved oxygen conditions, crabs tend to escape. Crabs also crawl to the shore in the later culture stage. The dissolved oxygen content of the water in rice–crab co-culture is lower than that in conventional rice fields [24,25]. This may cause a stress response in the crabs and is, therefore, one of the shortcomings of breeding crabs in rice paddies.

4.3. Effects of Diets with Different Protein Levels on the Phytoplankton in Paddy Fields

As primary producers, phytoplankton also act as a natural food source for crabs in rice–crab co-culture systems. Through the experiment, the aquatic organisms and water quality factors affected and correlated with each other. Species diversity is a basic characteristic of biological communities and is an important indicator of a healthy system [26]. In this experiment, the overall average Shannon–Wiener diversity index of the phytoplankton in the paddy field was 1.07, indicating that the phytoplankton diversity in the paddy field environment was not extremely diverse but superior to that in polluted waters. Studies have shown the Shannon–Wiener diversity index for phytoplankton in the rice–crab co-culture mode is higher than that in conventional rice fields [5,27]. This is due to the reduction in the use of chemical fertilizers and pesticides in rice–fish symbiosis [27,28]. Thus, biodiversity in the paddy fields has been well protected [29,30].
The rice growth and the subsequent shading effect of the rice reduced the light-receiving area of the water in the paddy field. This weakened the photosynthesis by phytoplankton. Furthermore, the physical and chemical factors involved in water quality and organisms in the water environment interact with each other [30,31]. Individual phytoplankton are small and varied, and different species can affect the environment in diverse ways. Adaptability of the species differs, and most can intuitively reflect the changes in water physicochemical factors after environmental changes. Rice will absorb nutrients and ions in the paddy field, effectively regulating the physical properties and chemicals in the environment, and can inhibit the absorption of nutrients by phytoplankton. Therefore, it was expected that the total average biomass of phytoplankton would show a decreasing trend with time. When the phytoplankton productivity is low, the consumption of phytoplankton by zooplankton is an important factor affecting phytoplankton growth [32]. For example, the sample collected on 15 August revealed that the phytoplankton biomass had abnormally increased. When the data were combined with the analysis of changes in zooplankton biomass, the zooplankton biomass had decreased significantly at that time. Reduced grazing pressure on phytoplankton results in abnormally elevated phytoplankton biomass. In the natural environment, there are many reasons for an increase in phytoplankton biomass. For example, an increase in nutrient concentration can lead to similar results. The water quality monitoring results showed that the nutrient index in the water was not significantly different from that in other periods; therefore, there was no increased nutrient concentration.
The results of this experiment revealed that the diversity of the dominant phytoplankton species in the control group presented an increasing trend. However, it did not vary among the feeding groups. This may be because the addition of exogenous nutrients in the feed led to the eutrophication of the water body, resulting in a decrease in biodiversity. Water eutrophication destroys the ecosystem balance and can even lead to the collapse of the entire aquatic system [33]. When the nutrients in the water increased, Cyanophyta phytoplankton gradually became the dominant species at the expense of other species, indicating that Cyanophyta are indicator organisms for water eutrophication [34]. In this experiment, the dominance of Chroococcus in the T45 group was significantly higher than that of the other three groups on 2 September, after which it decreased with no significant difference, indicating that high protein levels could cause water eutrophication. However, in a paddy field environment, water eutrophication is not a concern owing to the self-purification function of rice.

4.4. Effects of Different Protein Levels in the Crab Diet on Zooplankton in Paddy Fields

In the rice–crab co-culture environment, zooplankton can feed on phytoplankton, which is also the main food of crabs. Zooplankton is an important link between energy flow and material cycling in the ecosystem [35]. Zooplankton species and community structure are affected by environmental factors. A total of 51 species of zooplankton were identified in this experiment, and the Shannon–Wiener diversity index was 1.73. Previous research has shown that the Shannon–Wiener diversity index of Cladocera and Rotifers in a water environment under rice–crab co-culture is higher than that of conventional rice fields [36]. In addition, owing to the purification effect of rice, zooplankton in crab paddy fields is highly diverse.
The results of this experiment showed that the zooplankton biomass initially increased and then decreased before increasing again. Combined with the analysis of the changes in phytoplankton in the paddy field, the biomass of the phytoplankton was relatively high in the early stage of the experiment. Then, the zooplankton fed on the phytoplankton and grew rapidly; its biomass also increased. As crabs grew, they preyed on the zooplankton, and the zooplankton biomass decreased. Horn et al. [37] tracked zooplankton body length and found that not only the maximum body length of zooplankton decreases, but the average body length and length frequency distribution of zooplankton also shifted to that of smaller individuals under predation pressure. The results showed that predation pressure on zooplankton by crabs led to the miniaturization of zooplankton. In the later stage of this experiment, the miniaturization of zooplankton, combined with the larger size and mouthparts of crabs, reduced the crab predation on zooplankton, so the biomass of zooplankton increased.
The dominant zooplankton species in the early stages of the experiment, on 25 May and 30 June, were rotifers, especially Polyarthra trigla, which is consistent with Zhang’s [6] results. Rotifers, Cladocera, and copepods all competitively feed on phytoplankton in paddy fields. According to Gilbert [38], when there is competition between Cladocera and rotifers, Cladocera has an advantage. Therefore, the existence of Cladocera affects the diversity and quantity of rotifers. As the experiment progressed, some Cladocera species gradually became dominant. In the later stage of this experiment, the dominant species of zooplankton in the crab paddy field were small and mainly existed in the state of copepod nauplii, with the dominant species being mainly protozoa.

4.5. Effects of Crabs on Aquatic Vascular Plants in Paddy Fields

Large plants control zooplankton, provide habitats for fish that feed on zooplankton, and provide shelter for phytoplankton [39]. In the early stages of this experiment, the main submerged plant in the paddy field environment was S. polyrhiza. The growth of the submerged plants, including V. spiralis and Potamogeton sp., increased, and the biomass of submerged plants also increased. Shading also increases with the rapid growth of emergent plants [40]. Crabs began feeding on the submerged plants, which reduced their growth until no submerged plants were detected from 15 September. On 7 October, the emergent plants decayed and died, decreasing the biomass.
Farmers have traditionally used chemical weeding machines to remove large weeds from rice fields. Over time, weed resistance and herbicide damage have become increasingly serious problems [41], since crabs are omnivorous and feed on large plants, such as aquatic vascular plants [42]. Even if there is an excess of animal food in the environment, crabs will still consume aquatic plants, especially submerged plants [43]. However, crabs rarely feed on emergent plants, which allows the emergent plants to grow and absorb fertilizer from the crab pond sediment [44]. Lv et al. [45] found that the fresh and dry weights of weeds in the experimental group without crabs being provided artificial feed were significantly lower than those in the crab feeding group. Other studies have also shown that weed control by rice crabs is more effective than traditional weed control methods used in rice production [19,46].

4.6. Changes in Benthic Animals in Rice–Crab Co-Culture

Benthic animals are the main food source for crabs [47]. Xu et al. [48] found that crabs affect habitat structure in two ways: feeding and reducing competition with aquatic plants by preying on attached organisms, thereby promoting the growth of aquatic plants. At the beginning of the experiment, the local benthic animals were in the culture period, and the biomass showed an upward trend, which is consistent with Li et al. [46]. As crabs grew, the predation of benthic animals by crabs increased, and the biomass of the benthic animals decreased. The stress of predation by crabs caused Branchiura sp., Limnodrilus sp., and other benthic animals that reproduce via burrowing, to increase in numbers, causing an overall increase in the benthic animal biomass.
In this experiment, the crabs fed with high-protein compound feed were larger and had a stronger predation ability on benthic animals than the representative crabs. On 2 September, the biomass of benthic animals increased with the level of dietary protein. The biomass of benthic animals in the control group was significantly higher than that of the three experimental groups. Xu et al. [48] found that the stocking of crabs reduced the benthic animal diversity in the environment based on the lakes where crabs were stocked, outside the lake enclosure, in natural lake waters, and in lakes where fish were stocked. Benthic species diversity decreased significantly, and the production volume and density decreased by more than 60% compared with those of the control water body. The results vary from the results in our experiment, which may be caused by the different environments, sampling times, and stocking densities of the crabs. First, lake and paddy field environments are quite different. Second, unlike Xu et al.’s [48] experiment, which took four samples twice a year for two years, we monitored the dynamics of zoobenthos nine times over a period of nearly five months (from May to October). By comparing the culture densities, Xu et al. [48] showed that the over farming of crabs causes the high variations. Conversely, our experiment used normal crab culture density.

5. Conclusions

In this study, we evaluated how different levels of protein in crab feed could affect the performance of crabs and the environment in rice–crab co-culture in paddy fields. The results showed that feed with 15% protein level compound diet can not only meet the nutritional requirements of crabs but also reduce the cost of cultivation and improve the water quality of the paddy field. The discharged water had low ammonia nitrogen and nitrite content, and no eutrophication was observed. Consequently, the water could be recycled. These findings provide a scientific basis for feed formulation for juvenile crabs in rice–crab co-culture.

Author Contributions

Conceptualization, X.L. (Xiaodong Li), J.W. and Y.Y.; data curation, Y.Y.; formal analysis, Y.Y. and X.L. (Xiaochen Liang); funding acquisition, X.L. (Xiaodong Li); investigation, X.L. (Xiaochen Liang), Y.W., X.L. (Xueshen Liu), J.M. and Y.Y.; methodology, N.S. and Y.Y.; project administration, Y.Y. and N.S.; resources, X.L. (Xiaodong Li) and N.S.; supervision, X.L. (Xiaodong Li) and N.S.; validation, X.L. (Xiaodong Li); writing—original draft preparation, Y.Y.; writing—review and editing, X.L. (Xiaodong Li). All authors have read and agreed to the published version of the manuscript.

Funding

This research was funded by Liaoning Province Key R&D Planning Project (2019JH2/10200006), National Key R&D Program of China (2018YFD0901702), Liaoning Province Key R&D Guidance Program (201802120), Shenyang Agricultural University High Level Introduction of talent Program (880416005), and Liaoning Province “The Open Competition Mechanism to Select the Best Candidates” Project, Grant (2021JH1/10400040). The funders had no role in the design of the study; in the collection, analyses, or interpretation of data; in the writing of the manuscript, or in the decision to publish the results.

Institutional Review Board Statement

Our study did not involve endangered or protected species. In China, breeding and catching Chinese mitten crabs, Eriocheir sinensis, in rice fields does not require specific permits. All efforts were made to minimize animal suffering and discomfort. The animal study protocol was approved by the Animal Ethics Committee of Shenyang Agriculture University.

Data Availability Statement

The data presented in this study are not publicly available but are available upon request from the corresponding author.

Acknowledgments

The author would like to acknowledge my mentor Li for imparting knowledge to me and helping me revise the article carefully. We would also like to thank all employees of the Panjin Guanghe Crab Industry Co., Ltd. for patiently helping us and providing us with an excellent test environment. We thank teacher Hu, who is a teacher and a friend, for helping me to revise the article and overcome many difficulties. We are very grateful to Tian for his suggestions on the revision of the article and teaching us a lot of knowledge. Thanks to Jiang for helping me contact the company to polish the article. Thanks to my employees at the company’s R and D center for their experimental help and guidance. The author would also like to acknowledge Zuo and Liu from Dalian Ocean University for their great help with the formula and production of the feed required for the experiment. Thanks also to Liu and Zheng who gave me practical guidance and help with the culture. I would also like to thank MSA Bi who provided guidance on testing techniques. Thanks to my junior Liang for assisting me in data processing and analysis.

Conflicts of Interest

The authors declare no conflict of interest.

Appendix A

Table A1. The cost of each experimental feed.
Unit Price/RMB yuan/tonCost/RMB yuan/ton
T15T30T45
7360 442 1987 3459
3380 101 456 794
3920 118 118 118
2623 1904 1130 396
15,000 1125 825 525
11,000 55 55 55
19,600 392 392 392
133,000 2660 2660 2660
30,000 300 300 300
44,000 220 220 220
65,600 131 131 131
7200108108108
178,000 178 178 178
1,000,000 100 100 100
22,900 23 23 23
7857 8684 9459
Table A2. Phytoplankton in each enclosure with the average wet weight.
SpeciesAverage Wet Weight of Cells/mg
Bacillariophyta
Nitzschia sp.0.003
Cyclotella meneghiniana0.00125
Nitzschia frustulum0.006
Nitzschia acicularis0.005
Synedra sp.0.005
Chaetoceros sp.0.0014
Navicula amphibola0.0017
Navicula placentula0.006
Melosira sp.0.006
Coscinodisous sp.0.02
Fragilaria sp.0.001
Gyrosigma sp.0.03
Mastogloia sp.0.00325
Navicula directa0.03
Amphora exigua0.0017
Pleurosigma sp.0.047
Eunotogramma sp.0.001
Navicula sp.0.001
Chtysophyta
Chromulina pygmaea Nygaard0.00065
Cyanophyta
Chroococcus sp.0.0001
Spirulina sp.0.0077
Merismopedia sinica0.00025
Oscillatoria sp.0.01
Microcystis sp.0.0016
Nostoc sp.0.00025
Anabaena sp.0.0005
Merismopedia sp.0.00003
Phormidium sp.0.002
Chlorophyta
Oocystis borgei0.004
Schroederi krosch0.003
Closterium sp.0.08
Actinastrum lag sp.0.001
Chlorella pyrenoidesa0.00015
Selenastrum bibraianum0.001
Chlamydomonas sp.0.01
Pandorina morum0.04
Dictyosphaerium sp.0.001
Eudorina elegans0.02
Tetraedron trilobulatum0.003
Crucigenia sp.0.001
Kirchneriellalunaris lunatis0.001
Platymonas sp.0.012
Spirogyra sp.0.02
Ankistrodesmus convolutus0.002
Pediastrum sp.0.01
Sceneclesmus sp.0.002
Euglenophyta
Euglena sp.0.04
Euglena oxyuris0.15
Phacus sp.0.06
Euglena viridis0.04
Euglena pisciformis0.15
Cryptophyta
Cryptomonas sp.0.01
Phrrophyta
Gymmodinium sp.0.008
Table A3. Phytoplankton in each enclosure with the average wet weight.
SpeciesAverage Wet Weight of Cells/mg
Protozoa
Sarcomastigophora
Saccamoeba sp.0.00003
Difflugia sp.0.00003
Difflugia oblonga0.00024
Tintinnidium fliuviatile0.00024
Arcella vulgaris0.00003
Globigerinoides sp.0.00002
Ciliophora
Coleps sp.0.00003
Strobilidium sp.0.00003
Litonotus sp.0.00003
Tintinnopsis sp.0.00003
Lembadion sp.0.000016
Zoothamnium sp.0.0000017
Euplotes sp.0.000016
Pseudoprorodon sp.0.00005
Didinium nasufum0.00045
Actinobolina sp.0.00003
Prorodon ovum0.00005
Pleuronema sp.0.0000017
Stentor polymorphrus0.000002
Vorticella sp.0.000014
Colpoda sp.0.0000017
Trachelius sp.0.000007
Rhabdostyla sp.0.00005
Cladocera
Daphnia carinata0.2
Daphnia magna0.01
Moinidae brachiata0.1
Moinidae rectirostris0.01
Moinidae macrocopa0.05
Chydoroidea quadrangula0.01
Chydoroidea sphaericus0.03
Chydoroidea longirostris0.03
Copepoda
Cyclops sp.0.03
Copepodid0.003
Calanoida sp.0.312
Copepod nauplius0.003
Rotifera
Brachionus calyciflorus0.0025
Brachionus ureus0.00024
Brachionus quadridentatus0.00055
Polyarthra trigla0.000331
Polyarthra sp.0.0025
Lecanidae inermis0.026
Asplachna brightwelli0.0005
Brachionus diversicornis0.0005
Rotaria citrine0.00028
Filinia sp.0.0003
Lepadella ovalis0.0003
Pedalia mira0.000027
Keratella cochlearis0.0003
Keratella valga0.00024
Euchlanis pellucida0.0025
Table A4. Species and biomass of the phytoplankton in each enclosure and grouped by crab diet (n = 3).
SpeciesBiomass/mg·L−1
CoT15T30T45
Bacillariophyta16.64 ± 6.8315.29 ± 6.1613.46 ± 5.929.85 ± 5.59
Nitzschia sp.1.33 ± 0.790.78 ± 0.440.78 ± 0.440.44 ± 0.36
Cyclotella meneghiniana0.14 ± 0.240.23 ± 0.250.05 ± 0.080.00 ± 0.00
Nitzschia frustulum1.11 ± 1.091.56 ± 1.52.00 ± 1.541.11 ± 1.09
Nitzschia acicularis0.00 ± 0.000.00 ± 0.000.00 ± 0.000.00 ± 0.00
Synedra sp.4.07 ± 3.901.67 ± 1.011.11 ± 0.690.19 ± 0.31
Chaetoceros sp.0.00 ± 0.000.00 ± 0.000.05 ± 0.090.05 ± 0.09
Navicula amphibola0.25 ± 0.250.06 ± 0.110.06 ± 0.110.00 ± 0.00
Navicula placentula0.67 ± 0.830.22 ± 0.380.00 ± 0.000.00 ± 0.00
Melosira sp.0.44 ± 0.520.00 ± 0.000.00 ± 0.000.89 ± 1.51
Coscinodisous sp.0.00 ± 0.000.00 ± 0.000.00 ± 0.000.00 ± 0.00
Fragilaria sp.0.11 ± 0.140.04 ± 0.060.00 ± 0.000.00 ± 0.00
Gyrosigma sp.1.11 ± 1.890.00 ± 0.000.00 ± 0.000.00 ± 0.00
Mastogloia sp.0.00 ± 0.000.00 ± 0.000.00 ± 0.000.24 ± 0.41
Navicula directa3.89 ± 3.224.44 ± 3.557.78 ± 5.835.56 ± 5.47
Amphora exigua0.06 ± 0.110.00 ± 0.000.00 ± 0.000.00 ± 0.00
Pleurosigma sp.0.00 ± 0.005.22 ± 4.920.00 ± 0.000.00 ± 0.00
Eunotogramma sp.0.78 ± 1.260.00 ± 0.000.00 ± 0.000.00 ± 0.00
Navicula sp.1.63 ± 1.11.07 ± 0.771.63 ± 0.932.00 ± 0.96
Chrysophyta47.47 ± 35.6724.46 ± 19.6315.74 ± 11.7319.72 ± 9.42
Chromulina pygmaea Nygaard47.47 ± 35.6724.46 ± 19.6315.74 ± 11.7319.72 ± 9.42
Cyanophyta16.1 ± 5.8715.23 ± 5.3711.37 ± 4.1317.87 ± 6.72
Chroococcus sp.0.25 ± 0.160.28 ± 0.140.28 ± 0.150.76 ± 0.55
Spirulina sp.1.03 ± 1.330.57 ± 0.670.57 ± 0.670.29 ± 0.48
Merismopedia sinica0.05 ± 0.060.02 ± 0.030.01 ± 0.020.12 ± 0.19
Oscillatoria sp.10.00 ± 3.8510.00 ± 4.067.78 ± 2.9211.11 ± 4.66
Microcystis sp.0.53 ± 0.481.13 ± 0.870.12 ± 0.140.47 ± 0.41
Nostoc sp.0.17 ± 0.250.00 ± 0.000.00 ± 0.000.00 ± 0.00
Anabaena sp.0.15 ± 0.170.06 ± 0.090.02 ± 0.030.00 ± 0.00
Merismopedia sp.0.00 ± 0.010.00 ± 0.000.00 ± 0.000.01 ± 0.00
Phormidium sp.3.93 ± 2.113.19 ± 1.342.59 ± 1.285.11 ± 3.35
Chlorophyta42.28 ± 23.3224.23 ± 12.3621.59 ± 10.2641.79 ± 23.33
Oocystis borgei0.15 ± 0.250.3 ± 0.350.59 ± 0.790.3 ± 0.35
Schroederi krosch0.32 ± 0.410.56 ± 0.470.00 ± 0.000.22 ± 0.26
Closterium sp.2.96 ± 5.045.93 ± 6.982.96 ± 5.045.93 ± 6.98
Actinastrum lag sp.0.00 ± 0.000.04 ± 0.060.04 ± 0.060.04 ± 0.06
Chlorella pyrenoidesa7.25 ± 5.094.71 ± 2.345.56 ± 3.485.12 ± 2.42
Selenastrum bibraianum0.63 ± 0.420.48 ± 0.260.78 ± 0.620.89 ± 0.83
Chlamydomonas sp.14 ± 19.468.15 ± 7.701.11 ± 1.3919.20 ± 2.62
Pandorina morum4.44 ± 5.541.48 ± 2.527.41 ± 5.183.07 ± 0.15
Dictyosphaerium sp.0.00 ± 0.000.00 ± 0.000.04 ± 0.060.04 ± 0.06
Eudorina elegans8.89 ± 8.571.48 ± 1.751.48 ± 1.752.59 ± 2.81
Tetraedron trilobulatum0.22 ± 0.260.22 ± 0.260.00 ± 0.000.33 ± 0.42
Crucigenia sp.0.00 ± 0.000.00 ± 0.000.37 ± 0.630.37 ± 0.33
Kirchneriellalunaris lunatis0.00 ± 0.000.00 ± 0.000.00 ± 0.000.04 ± 0.06
Platymonas sp.0.89 ± 1.050.00 ± 0.000.00 ± 0.000.00 ± 0.00
Spirogyra sp.0.00 ± 0.000.00 ± 0.000.00 ± 0.000.74 ± 1.26
Ankistrodesmus convolutus0.67 ± 0.680.22 ± 0.280.15 ± 0.250.33 ± 0.35
Pediastrum sp.0.37 ± 0.630.00 ± 0.000.00 ± 0.000.00 ± 0.00
Sceneclesmus sp.1.41 ± 0.720.67 ± 0.511.11 ± 0.612.52 ± 1.87
Euglenophyta136.60 ± 22.87104.40 ± 1.9477.78 ± 20.02183.40 ± 30.75
Euglena sp.33.33 ± 20.7933.33 ± 24.8533.33 ± 24.8561.11 ± 12.33
Euglena oxyuris16.67 ± 15.7122.22 ± 22.3822.22 ± 22.3822.30 ± 17.75
Phacus sp.6.67 ± 11.334.44 ± 5.240.00 ± 0.000.00 ± 0.00
Euglena viridis68.89 ± 29.3744.44 ± 19.0422.22 ± 4.4488.89 ± 22.84
Euglena pisciformis11.11 ± 18.890.00 ± 0.000.00 ± 0.0011.11 ± 18.89
Cryptophyta5.19 ± 3.192.22 ± 1.391.11 ± 1.053.70 ± 3.03
Cryptomonas sp.5.19 ± 3.192.22 ± 1.391.11 ± 1.053.7 ± 3.03
Pyrrophyta0.00 ± 0.000.30 ± 0.00.50.00 ± 0.000.00 ± 0.00
Gymmodinium sp.0.00 ± 0.000.30 ± 0.50.00 ± 0.000.00 ± 0.00
Total biomass160.7108.485.49127.1
Note: 0.00 mg·L−1 is provided when the average biomass is less than 0.005 mg·L−1 or not detected.
Table A5. Composition of the predominant species of phytoplankton in the enclosures of each treatment group (n = 3).
DateGroupDominant Species (Degree of Dominance)
05-25CoChromulina pygmaea Nygaard (0.34) Chlorella pyrenoidesa (0.26)
T15Navicula sp. (0.03) Chromulina pygmaea Nygaard (0.21) Chlorella pyrenoidesa (0.17)
T30Chromulina pygmaea Nygaard (0.27) Chlorella pyrenoidesa (0.41)
T45Navicula sp. (0.02) Chromulina pygmaea Nygaard (0.29) Chlorella pyrenoidesa (0.33)
06-30CoChromulina pygmaea Nygaard (0.31) Chlorella pyrenoidesa (0.32)
T15Chromulina pygmaea Nygaard (0.17) Chroococcus sp. (0.14) Phormidium sp. (0.03) Chlorella pyrenoidesa (0.13)
T30Navicula sp. (0.02) Chromulina pygmaea Nygaard (0.27) Chroococcus sp. (0.14) Phormidium sp. (0.03) Chlorella pyrenoidesa (0.17) Selenastrum bibraianum (0.02)
T45Chromulina pygmaea Nygaard (0.26) Chroococcus sp. (0.15) Phormidium sp. (0.05) Chlorella pyrenoidesa (0.19) Chlamydomonas sp. (0.02) Sceneclesmus sp. (0.02)
07-15CoNavicula sp. (0.04) Oscillatoria sp. (0.05) Microcystis sp. (0.02) Phormidium sp. (0.06) Chlorella pyrenoidesa (0.53)
T15Oscillatoria sp. (0.11) Microcystis sp. (0.09) Phormidium sp. (0.07) Chlorella pyrenoidesa (0.30)
T30Navicula sp. (0.03) Chroococcus sp. (0.05) Phormidium sp. (0.04) Chlorella pyrenoidesa (0.69)
T45Navicula sp. (0.07) Chromulina pygmaea Nygaard (0.12) Oscillatoria sp. (0.05) Phormidium sp. (0.06) Chlorella pyrenoidesa (0.35)
07-29CoChromulina pygmaea Nygaard (0.17) Oscillatoria sp. (0.03) Chlorella pyrenoidesa (0.06) Ankistrodesmus convolutus (0.08)
T15Chromulina pygmaea Nygaard (0.38) Oscillatoria sp. (0.03) Phormidium sp. (0.05) Chlorella pyrenoidesa (0.03)
T30Navicula directa (0.04) Navicula sp. (0.03) Chromulina pygmaea Nygaard (0.19) Oscillatoria sp. (0.08)
T45Chromulina pygmaea Nygaard (0.30) Chlorella pyrenoidesa (0.31)
08-15CoChromulina pygmaea Nygaard (0.30) Chlorella pyrenoidesa (0.07)
T15Chromulina pygmaea Nygaard (0.38) Chlorella pyrenoidesa (0.22)
T30Chromulina pygmaea Nygaard (0.11) Chroococcus sp. (0.05) Oscillatoria sp. (0.03) Phormidium sp. (0.04) Chlorella pyrenoidesa (0.04)
T45Chromulina pygmaea Nygaard (0.31) Oscillatoria sp. (0.04) Chlorella pyrenoidesa (0.33)
09-02CoNitzschia sp. (0.04) Chromulina pygmaea Nygaard (0.05) Chroococcus sp. (0.15) Chlorella pyrenoidesa (0.11) Sceneclesmus sp. (0.06)
T15Chromulina pygmaea Nygaard (0.25) Chlorella pyrenoidesa (0.25)
T30Chromulina pygmaea Nygaard (0.14) Chlorella pyrenoidesa (0.48)
T45Chromulina pygmaea Nygaard (0.03) Chroococcus sp. (0.04) Oscillatoria sp. (0.03) Chlorella pyrenoidesa (0.64)
09-15CoChromulina pygmaea Nygaard (0.17) Schroederi krosch (0.02) Pandorina morum (0.02) Eudorina elegans (0.03) Cryptomonas sp. (0.13)
T15Chromulina pygmaea Nygaard (0.21) Chlorella pyrenoidesa (0.61)
T30Synedra sp. (0.03) Chromulina pygmaea Nygaard (0.35) Chlorella pyrenoidesa (0.19)
T45Chromulina pygmaea Nygaard (0.24) Chlorella pyrenoidesa (0.53) Sceneclesmus sp. (0.04)
09-26CoChromulina pygmaea Nygaard (0.17) Chlorella pyrenoidesa (0.68)
T15Chromulina pygmaea Nygaard (0.05) Chlorella pyrenoidesa (0.87)
T30Chlorella pyrenoidesa (0.51) Crucigenia sp. (0.04)
T45Chromulina pygmaea Nygaard (0.18) Chroococcus sp. (0.07) Chlorella pyrenoidesa (0.31) Crucigenia sp. (0.06)
10-07CoSynedra sp. (0.02) Navicula amphibola (0.02) Anabaena sp. (0.10) Selenastrum bibraianum (0.02) Eudorina elegans (0.10)
T15Chromulina pygmaea Nygaard (0.15) Chroococcus sp. (0.10) Chlorella pyrenoidesa (0.41)
T30Chlorella pyrenoidesa (0.56)
T45Navicula sp. (0.02) Chromulina pygmaea Nygaard (0.11) Chroococcus sp. (0.08) Chlorella pyrenoidesa (0.55)
Table A6. Biomass and species of zooplankton in the enclosures of each treatment group (n = 3).
SpeciesBiomass/mg/L
CoT15T30T45
Protozoa1.75 ± 0.472.34 ± 1.021.36 ± 0.481.63 ± 0.47
Sarcomastigophora1.52 ± 0.472.09 ± 1.011.25 ± 0.471.47 ± 0.48
Saccamoeba sp.0.04 ± 0.030.05 ± 0.060.03 ± 0.020.02 ± 0.01
Difflugia sp.0.13 ± 0.050.15 ± 0.080.13 ± 0.050.11 ± 0.05
Difflugia oblonga0.37 ± 0.230.82 ± 0.610.41 ± 0.300.44 ± 0.23
Tintinnidium fliuviatile0.97 ± 0.391.07 ± 0.490.68 ± 0.380.00 ± 0.37
Arcella vulgaris0.00 ± 0.000.00 ± 0.000.00 ± 0.000.00 ± 0.00
Globigerinoides sp.0.00 ± 0.000.00 ± 0.000.00 ± 0.000.00 ± 0.00
Ciliophora0.24 ± 0.10.25 ± 0.210.11 ± 0.040.15 ± 0.05
Coleps sp.0.08 ± 0.060.07 ± 0.060.04 ± 0.020.05 ± 0.03
Strobilidium sp.0.03 ± 0.020.08 ± 0.090.04 ± 0.020.06 ± 0.03
Litonotus sp.0.00 ± 0.000.00 ± 0.000.00 ± 0.010.01 ± 0.01
Tintinnopsis sp.0.01 ± 0.010.05 ± 0.060.01 ± 0.020.00 ± 0.00
Lembadion sp.0.06 ± 0.050.03 ± 0.020.01 ± 0.010.02 ± 0.01
Zoothamnium sp.0.00 ± 0.000.00 ± 0.000.00 ± 0.000.00 ± 0.00
Euplotes sp.0.00 ± 0.000.01 ± 0.010.00 ± 0.000.00 ± 0.00
Pseudoprorodon sp.0.00 ± 0.000.00 ± 0.000.00 ± 0.010.01 ± 0.01
Didinium nasufum0.03 ± 0.060.00 ± 0.000.00 ± 0.000.00 ± 0.00
Actinobolina sp.0.00 ± 0.000.00 ± 0.000.00 ± 0.000.00 ± 0.00
Prorodon ovum0.01 ± 0.010.00 ± 0.000.00 ± 0.000.00 ± 0.00
Pleuronema sp.0.00 ± 0.000.00 ± 0.000.00 ± 0.000.00 ± 0.00
Stentor polymorphrus0.00 ± 0.000.00 ± 0.000.00 ± 0.000.00 ± 0.00
Vorticella sp.0.00 ± 0.000.00 ± 0.000.00 ± 0.000.00 ± 0.00
Colpoda sp.0.00 ± 0.000.00 ± 0.000.00 ± 0.000.00 ± 0.00
Trachelius sp.0.00 ± 0.000.01 ± 0.000.00 ± 0.000.01 ± 0.01
Rhabdostyla sp.0.00 ± 0.000.00 ± 0.000.00 ± 0.000.00 ± 0.00
Cladocera22.16 ± 4.5725.30 ± 5.7729.19 ± 5.3540.52 ± 6.71
Daphnia carinata1.48 ± 2.528.89 ± 2.742.30 ± 0.440.74 ± 1.26
Daphnia magna6.67 ± 1.330.00 ± 0.006.67 ± 1.3316.67 ± 18.32
Moinidae brachiata2.30 ± 0.781.52 ± 0.663.56 ± 1.732.52 ± 1.32
Moinidae rectirostris5.93 ± 1.45.93 ± 0.214.44 ± 3.319.63 ± 3.05
Moinidae macrocopa1.19 ± 0.420.52 ± 0.290.96 ± 0.120.44 ± 0.19
Chydoroidea quadrangula2.59 ± 0.627.04 ± 0.469.26 ± 0.847.78 ± 0.61
Chydoroidea sphaericus0.00 ± 0.000.07 ± 0.130.00 ± 0.000.07 ± 0.13
Chydoroidea longirostris2.00 ± 1.891.33 ± 1.372.00 ± 2.312.67 ± 2.39
Copepoda27.00 ± 5.1929.65 ± 2.8839.10 ± 3.2730.70 ± 1.25
Cyclops sp.8.44 ± 2.519.67 ± 0.2210.89 ± 1.813.11 ± 2.83
Copepodid0.60 ± 0.500.30 ± 0.170.30 ± 0.170.22 ± 0.14
Calanoida sp.13.87 ± 1.7816.18 ± 12.1325.42 ± 0.8613.87 ± 1.78
Copepod nauplius4.09 ± 0.023.50 ± 0.042.49 ± 0.293.50 ± 0.87
Rotifera0.70 ± 0.700.48 ± 0.290.21 ± 0.090.86 ± 0.72
Brachionus calyciflorus0.07 ± 0.100.15 ± 0.160.04 ± 0.040.05 ± 0.06
Brachionus ureus0.03 ± 0.020.10 ± 0.090.03 ± 0.030.05 ± 0.03
Brachionus quadridentatus0.00 ± 0.000.00 ± 0.000.00 ± 0.000.00 ± 0.00
Polyarthra trigla0.16 ± 0.090.16 ± 0.140.06 ± 0.040.11 ± 0.08
Polyarthra sp.0.00 ± 0.000.00 ± 0.000.00 ± 0.000.00 ± 0.00
Lecanidae inermis0.00 ± 0.000.00 ± 0.000.02 ± 0.030.00 ± 0.00
Asplachna brightwelli0.39 ± 0.650.00 ± 0.000.00 ± 0.000.58 ± 0.72
Brachionus diversicornis0.01 ± 0.010.01 ± 0.020.00 ± 0.000.02 ± 0.04
Rotaria citrine0.01 ± 0.010.03 ± 0.020.02 ± 0.020.04 ± 0.03
Filinia sp.0.01 ± 0.010.00 ± 0.000.01 ± 0.010.00 ± 0.00
Lepadella ovalis0.01 ± 0.010.02 ± 0.020.01 ± 0.010.01 ± 0.01
Pedalia mira0.00 ± 0.000.00 ± 0.000.00 ± 0.000.00 ± 0.00
Keratella cochlearis0.00 ± 0.000.00 ± 0.000.00 ± 0.000.00 ± 0.00
Keratella valga0.00 ± 0.000.00 ± 0.000.00 ± 0.000.00 ± 0.00
Euchlanis pellucida0.00 ± 0.000.00 ± 0.000.02 ± 0.030.00 ± 0.00
Total biomass51.5957.7769.8573.71
Note: 0.00 mg·L−1 is the term used when the average biomass is less than 0.005 mg·L−1 or is not detected.
Table A7. Composition of the predominant zooplankton species in the enclosures of each treatment group (n = 3).
DateGroupDominant Species (Degree of Dominance)
05-25CoStrobilidium sp. (0.26) Tintinnopsis sp. (0.03) Difflugia sp. (0.06) Saccamoeba sp. (0.05)
Copepod nauplius (0.06) Brachionus calyciflorus (0.05) Brachionus ureus (0.23)
T15Coleps sp. (0.09) Strobilidium sp. (0.25) Tintinnopsis sp. (0.15) Saccamoeba sp. (0.05)
Brachionus calyciflorus (0.04) Brachionus ureus (0.12)
T30Strobilidium sp. (0.18) Daphnia carinata (0.13) Brachionus ureus (0.18)
T45Coleps sp. (0.07) Strobilidium sp. (0.25) Tintinnidium fliuviatile (0.04) Daphnia magna (0.06)
Brachionus ureus (0.10)
06-30CoTintinnidium fliuviatile (0.13) Moinidae brachiata (0.06) Cyclops sp. (0.02) Copepod nauplius (0.22)
Polyarthra trigla (0.13) Brachionus diversicornis (0.02) Rotaria citrine (0.02)
T15Strobilidium sp. (0.02) Difflugia sp. (0.18) Tintinnidium fliuviatile (0.12) Zoothamnium sp. (0.02)
Stentor polymorphrus (0.02) Moinidae brachiata (0.06) Chydoroidea quadrangula (0.04) Copepod nauplius (0.12) Brachionus ureus (0.02) Polyarthra trigla (0.17) Rotaria citrine (0.03)
T30Tintinnopsis sp. (0.03) Difflugia sp. (0.20) Tintinnidium fliuviatile (0.17) Moinidae brachiata (0.07)
Moinidae macrocopa (0.03) Chydoroidea quadrangula (0.04) Copepod nauplius (0.08) Brachionus ureus (0.08) Polyarthra trigla (0.09)
T45Strobilidium sp. (0.12) Difflugia sp. (0.12) Tintinnidium fliuviatile (0.13) Moinidae brachiata (0.05)
Copepod nauplius (0.11) Brachionus ureus (0.09) Polyarthra trigla (0.21) Brachionus diversicornis (0.02)
07-15CoStrobilidium sp. (0.03) Difflugia sp. (0.09) Tintinnidium fliuviatile (0.13) Moinidae brachiata (0.08)
Moinidae macrocopa (0.05) Cyclops sp. (0.03) Copepod nauplius (0.30) Polyarthra trigla (0.03)
T15Tintinnopsis sp. (0.03) Difflugia sp. (0.10) Tintinnidium fliuviatile (0.09) Moinidae brachiata (0.06) Cyclops sp. (0.03) Chydoroidea quadrangula (0.03) Copepod nauplius (0.19) Polyarthra trigla (0.13) Lepadella ovalis (0.08)
T30Difflugia sp. (0.21) Tintinnidium fliuviatile (0.15) Moinidae brachiata (0.11) Cyclops sp. (0.04) Moinidae macrocopa (0.07) Chydoroidea quadrangula (0.08) Chydoroidea longirostris (0.06) Copepod nauplius (0.05)
T45Difflugia sp. (0.15) Difflugia oblonga (0.04) Tintinnidium fliuviatile (0.20) Cyclops sp. (0.09)
Moinidae brachiata (0.17) Moinidae macrocopa (0.03) Chydoroidea quadrangula (0.04) Chydoroidea longirostris (0.05)
07-29CoDifflugia sp. (0.29) Tintinnidium fliuviatile (0.07) Moinidae brachiata (0.09) Cyclops sp. (0.06)
Chydoroidea longirostris (0.05) Copepod nauplius (0.23)
T15Difflugia sp. (0.25) Difflugia oblonga (0.08) Tintinnidium fliuviatile (0.14) Cyclops sp. (0.04) Moinidae rectirostris (0.03) Chydoroidea longirostris (0.03) Copepod nauplius (0.05) Rotaria citrine (0.03)
T30Difflugia sp. (0.19) Tintinnidium fliuviatile (0.05) Saccamoeba sp. (0.10) Moinidae brachiata (0.08)
Cyclops sp. (0.04) Copepod nauplius (0.15) Polyarthra trigla (0.02) Filinia sp. (0.02)
T45Rotaria citrine (0.11) Polyarthra trigla (0.04) Copepod nauplius (0.11) Chydoroidea quadrangula (0.09)
Cyclops sp. (0.09) Moinidae brachiata (0.05) Tintinnidium fliuviatile (0.03) Difflugia oblonga (0.09)
Difflugia sp. (0.24)
08-15CoColeps sp. (0.05) Difflugia sp. (0.05) Tintinnidium fliuviatile (0.03) Pleuronema sp. (0.03) Trachelius sp. (0.04) Saccamoeba sp. (0.04) Moinidae brachiata (0.04) Moinidae macrocopa (0.02) Cyclops sp. (0.02)
Copepod nauplius (0.21)
T15Copepod nauplius (0.13) Trachelius sp. (0.22) Difflugia sp. (0.03) Coleps sp. (0.13)
T30Coleps sp. (0.15) Strobilidium sp. (0.03) Difflugia sp. (0.09) Trachelius sp. (0.06) Rhabdostyla sp. (0.03)
Moinidae brachiata (0.11) Cyclops sp. (0.09) Copepod nauplius (0.15)
T45Coleps sp. (0.02) Difflugia sp. (0.05) Trachelius sp. (0.05) Saccamoeba sp. (0.02) Cyclops sp. (0.07)
Copepod nauplius (0.23)
09-02CoColeps sp. (0.03) Difflugia sp. (0.03) Tintinnidium fliuviatile (0.08) Lembadion sp. (0.07) Zoothamnium sp. (0.02) Saccamoeba sp. (0.02) Cyclops sp. (0.05) Copepod nauplius (0.12) Polyarthra trigla (0.03)
T15Copepod nauplius (0.20) Cyclops sp. (0.07) Lembadion sp. (0.20) Difflugia oblonga (0.15)
T30Difflugia sp. (0.03) Difflugia oblonga (0.07) Cyclops sp. (0.03) Copepod nauplius (0.30)
T45Copepod nauplius (0.12) Moinidae rectirostris (0.04) Lembadion sp. (0.08) Tintinnidium fliuviatile (0.05)
Difflugia oblonga (0.03) Strobilidium sp. (0.08) Coleps sp. (0.05)
09-15CoColeps sp. (0.08) Difflugia oblonga (0.05) Tintinnidium fliuviatile (0.05) Zoothamnium sp. (0.04)
Cyclops sp. (0.02) Copepod nauplius (0.34) Polyarthra trigla (0.14)
T15Copepod nauplius (0.42) Cyclops sp. (0.06) Moinidae brachiata (0.03) Difflugia oblonga (0.07) Coleps sp. (0.06)
T30Coleps sp. (0.12) Difflugia oblonga (0.13) Moinidae rectirostris (0.02) Cyclops sp. (0.04)
Chydoroidea quadrangula (0.09) Copepod nauplius (0.35)
T45Copepod nauplius (0.42) Chydoroidea quadrangula (0.06) Zoothamnium sp. (0.05) Tintinnidium fliuviatile (0.03)
09-26CoDifflugia sp. (0.07) Difflugia oblonga (0.03) Lembadion sp. (0.32) Cyclops sp. (0.07) Calanoida sp. (0.03) Copepod nauplius (0.36)
T15Copepod nauplius (0.58) Calanoida sp. (0.02) Chydoroidea quadrangula (0.02) Cyclops sp. (0.06) Lembadion sp. (0.08)
T30Difflugia sp. (0.03) Difflugia oblonga (0.06) Lembadion sp. (0.10) Cyclops sp. (0.08) Chydoroidea quadrangula (0.05) Copepod nauplius (0.43)
T45Brachionus ureus (0.02) Copepod nauplius (0.39) Chydoroidea quadrangula (0.03) Cyclops sp. (0.11) Lembadion sp. (0.03) Difflugia oblonga (0.09)
10-07CoColeps sp. (0.06) Moinidae rectirostris (0.04) Cyclops sp. (0.05) Copepod nauplius (0.47) Copepodid (0.02) Polyarthra trigla (0.03)
T15Moinidae brachiata (0.02) Moinidae rectirostris (0.04) Cyclops sp. (0.08) Copepod nauplius (0.61)
T30Coleps sp. (0.03) Cyclops sp. (0.17) Calanoida sp. (0.06) Copepod nauplius (0.38)
T45Coleps sp. (0.05) Moinidae brachiata (0.03) Cyclops sp. (0.12) Copepod nauplius (0.52) Asplachna brightwelli (0.02)
Table A8. Species and biomass of benthos in the enclosures of each treatment group (n = 3; x ¯ ± SD).
SpeciesBiomass/g·m−2
CoT15T30T45
Annelida205.54 ± 438.17290.72 ± 465.5171.53 ± 208.79124.92 ± 184.82
Oligochaeta205.54 ± 438.17290.72 ± 465.5171.53 ± 208.79124.92 ± 184.82
Limnodrilus sp.18.14 ± 26.0318.14 ± 32.5511.91 ± 19.695.67 ± 10.33
Branchiura sp.187.4 ± 424.71272.58 ± 451.5459.63 ± 193.87119.25 ± 181.1
Mollusca391.63 ± 174.88383.92 ± 338.97277.43 ± 153.15300.6 ± 134.79
Gastropoda391.63 ± 174.88383.92 ± 338.97277.43 ± 153.15300.6 ± 134.79
Gyraulus sp.271.18 ± 119.68244.36 ± 141.38208.6 ± 107.14214.56 ± 106.47
Euconulus sp.120.45 ± 115139.57 ± 274.8868.83 ± 83.1286.04 ± 107
Arthropoda0.00 ± 0.000.7 ± 3.550.35 ± 1.780.37 ± 1.78
Insecta0.00 ± 0.000.7 ± 3.550.35 ± 1.780.37 ± 1.78
Ephydra sp.0.00 ± 0.000.7 ± 3.550.35 ± 1.780.35 ± 1.78
Corixa substriata0.00 ± 0.000.00 ± 0.000.00 ± 0.000.02 ± 0.1

References

  1. Bao, J.; Jiang, H.; Li, X. Thirty years of rice-crab coculture in China—Research progress and prospects. Rev. Aquac. 2022, 14, 1597–1612. [Google Scholar] [CrossRef]
  2. Jia, E.T.; Zheng, X.; Cheng, H.; Jie, L.; Zhang, D. Dietary fructooligosaccharide can mitigate the negative effects of immunity on Chinese mitten crab fed a high level of plant protein diet. Fish Shellfish. Immunol. 2019, 84, 100–107. [Google Scholar] [CrossRef] [PubMed]
  3. Chen, F.; Zhang, Z. Ecological economic analysis of a rice-crab model. Chin. J. Appl. Ecol. 2002, 13, 323–326. (In Chinese) [Google Scholar]
  4. Bashir, M.A.; Liu, J.; Geng, Y.; Wang, H.; Pan, J.; Zhang, D.; Rehim, A.; Aon, M.; Liu, H. Co-culture of rice and aquatic animals: An integrated system to achieve production and environmental sustainability. J. Clean. Prod. 2020, 249, 119310. [Google Scholar] [CrossRef]
  5. Zhang, Q.; Lv, D.; Ma, X.; Wang, A.; Wang, W. The effects of different transplanting ways on the phytoplankton community in rice-crab culture system. J. Food Agric. Environ. 2014, 12, 199–204. [Google Scholar]
  6. Zhang, C. In Partial Fulfillment of the Requirement for the Degree of Master in Hydrobiology. Master’s Thesis, Dalian Ocean University, Dalian, China, 2015. (In Chinese). [Google Scholar]
  7. Lunger, A.N.; Mclean, E.; Craig, S.R. The effects of organic protein supplementation upon growth, feed conversion and texture quality parameters of juvenile cobia (Rachycentron canadum). Aquaculture 2007, 264, 342–352. [Google Scholar] [CrossRef]
  8. Lin, S.; Luo, L.; Ye, Y. Effects of dietary protein level on growth, feed utilization and digestive enzyme activity of the Chinese mitten crab, Eriocheir sinensis. Aquac. Nutr. 2010, 16, 290–298. [Google Scholar] [CrossRef]
  9. Xu, C.; Wen, L.; Zhang, D.; Liu, J.; Zheng, X.; Zhang, C.; Yao, J.; Zhu, C.; Chi, C. Effects of partial fish meal replacement with two fermented soybean meals on the growth of and protein metabolism in the Chinese mitten crab (Eriocheir sinensis). Aquac. Rep. 2020, 17, 100328. [Google Scholar] [CrossRef]
  10. Ministry of Agriculture and Rural Development of China. Development report of China’s rice and fishery comprehensive planting and breeding industry. China Fish. 2020, 10, 12–19. (In Chinese) [Google Scholar]
  11. Lei, Y. Environmental Chemistry of Aquaculture Water (for Aquaculture Specialty), 1st ed.; China Agricultural Publishing House: Beijing, China, 2004; pp. 67–108. (In Chinese) [Google Scholar]
  12. Fu, L.; Zhou, G.; Li, Y.; Lu, Q.; Pan, J. Research progress on precocious puberty of Chinese mitten crab. Jiangsu Agric. Sci. 2017, 45, 5. (In Chinese) [Google Scholar]
  13. Li, H.; Sun, C.; Zhang, Q.; Zhang, P.; Bao, H.; Ren, H.; Yao, X.; Zhong, W.; Cui, K.; You, H.; et al. Study on the Composition of Plankton Species in Tianjin Area; Tianjin Aquatic Products Technology Promotion Statio: Tianjin, China, 2017. (In Chinese) [Google Scholar]
  14. Zhao, W. Aquatic Biology, 1st ed.; China Agricultural Publishing House: Beijing, China, 2005; pp. 62–365. (In Chinese) [Google Scholar]
  15. Li, Y.; Ding, J.; Xu, F. On the distribution and hatching of resting eggs of rotifer in fishponds. Acta Hydrobiol. Sin. 1985, 9, 20–31. (In Chinese) [Google Scholar]
  16. Cheng, Y.X.; Du, N.S.; Lai, W. Lipid composition in hepatopancreas of Chinese mitten crab Eriocheir sinensis at different stages. Acta Hydrobiol. Sin. 1998, 44, 420–429. [Google Scholar]
  17. Bao, J.; Jiang, H.; Shen, H.; Xing, Y.; Chen, Q. First description of milky disease in the Chinese mitten crab Eriocheir sinensis caused by the yeast Metschnikowia bicuspidata. Aquaculture 2021, 532, 735984. [Google Scholar] [CrossRef]
  18. Prein, M. Integration of aquaculture into crop–animal systems in Asia. Agric. Syst. 2002, 71, 127–146. [Google Scholar] [CrossRef]
  19. Hu, L.; Guo, L.; Zhao, L.; Shi, X.; Ren, W.; Zhang, J.; Tang, J.; Chen, X. Productivity and the complementary use of nitrogen in the coupled rice-crab system. Agric. Syst. 2020, 178, 102742. [Google Scholar] [CrossRef]
  20. Chen, X.; Wang, J.; Xin, H.; Yue, W.; Shu, H. Tissue-expression profiles unveils the gene interaction of hepatopancreas, eyestalk, and ovary in precocious female Chinese mitten crab, Eriocheir sinensis. BMC Genet. 2018, 20, 12. [Google Scholar] [CrossRef] [Green Version]
  21. Zhang, T.; Li, Z.; Cui, Y. Survival, Growth, Sex Ratio, and Maturity of the Chinese Mitten Crab (Eriocheir sinensis) Reared in a Chinese Pond. J. Freshw. Ecol. 2001, 16, 633–640. [Google Scholar] [CrossRef] [Green Version]
  22. Guo, Q.; Li, W.; Liu, D.; Wu, W.; Liu, Y.; Wen, X.; Liao, Y. Seasonal characteristics of CO2 fluxes in a rain-fed wheat field ecosystem at the Loess Plateau. Span. J. Agric. Res. 2013, 11, 980–988. [Google Scholar] [CrossRef] [Green Version]
  23. Mb, A.; Mma, B.; Mk, C.; Ph, A.; Bta, B.; Lpa, B. Dissolved oxygen deficits in a shallow eutrophic aquatic ecosystem (fishpond)-sediment oxygen demand and water column respiration alternately drive the oxygen regime. Sci. Total Environ. 2020, 766, 142647. [Google Scholar]
  24. Zhang, Y.J.; Wang, A.; Ma, X.; Wang, W.; Li, Y. Preliminary study on level changes of water quality in rice-crab culture. Guangdong Agric. Sci. 2013, 40, 16–19. [Google Scholar]
  25. Wang, A.; Wang, W.; Ma, X.; Wang, Q.; Yu, Y.; Chen, W. Study on the changes of water nnvironmental factors in rice-crab culture system. Hubei Agric. Sci. 2011, 50, 6. (In Chinese) [Google Scholar]
  26. Lobo-Araújo, L.W.; Toledo, M.; Efe, M.; Malhado, A.; Vital, M.; Toledo-lima, G.; Macario, P.; Santos, J.; Ladle, R. Bird communities in three forest types in the Pernambuco Centre of Endemism, Alagoas, Brazil. Iheringia Série Zool. 2013, 103, 85–96. [Google Scholar] [CrossRef] [Green Version]
  27. Jian, X.; Hu, L.; Tang, J.; Wu, X.; Li, N. Ecological mechanisms underlying the sustainability of the agricultural heritage rice-fish coculture system. Proc. Natl. Acad. Sci. USA 2011, 108, E1381–E1387. [Google Scholar]
  28. Frei, M.; Khan, M.; Razzak, M.; Hossain, M.; Dewan, S.; Becker, K. Effects of a mixed culture of common carp, Cyprinus carpio L.; Nile tilapia, Oreochromis niloticus (L.), on terrestrial arthropod population, benthic fauna, and weed biomass in rice fields in Bangladesh. Biol. Control. 2007, 41, 207–213. [Google Scholar] [CrossRef]
  29. Altieri, M.A. Linking ecologists and traditional farmers in the search for sustainable agriculture. Front. Ecol. Environ. 2004, 2, 35–42. [Google Scholar] [CrossRef]
  30. Ren, W.; Hu, L.; Guo, L.; Zhang, J.; Tang, L. Preservation of the genetic diversity of a local common carp in the agricultural heritage rice-fish system. Proc. Natl. Acad. Sci. USA 2018, 115, E546–E554. [Google Scholar] [CrossRef] [Green Version]
  31. Lassen, M.F.; Bramm, M.; Richardson, K.; Yusoff, F.; Shariff, M. Phytoplankton community composition and size distribution in the Langat River estuary, Malaysia. Estuaries 2004, 27, 716–727. [Google Scholar] [CrossRef]
  32. Sterner, R.W.; Chrzanowski, T.; Elser, J.; George, N. Sources of nitrogen and phosphorus supporting the growth of bacteria and phytoplankton in an oligotrophic Canadian shield lake. Limnol. Oceanogr. 1995, 40, 242–249. [Google Scholar] [CrossRef]
  33. Odum, W.E. Ecological Guidelines for Tropical Coastal Development; IUCN Publications New Series. No. 42; IUCN: Gland, Switzerland, 1976. [Google Scholar]
  34. Cabecinha, E.; Cortes, R.; Cabral, J.; Ferreira, T.; Lourenço, M.; Pardal, M. Multi-scale approach using phytoplankton as a first step towards the definition of the ecological status of reservoirs. Ecol. Indic. 2009, 9, 240–255. [Google Scholar] [CrossRef]
  35. Sun, W.T.; Zhang, Q.; Xu-Zhou, M.; Wang, W.; Wang, A. A study on effects of different crab stocking density on water environment and rice yield. J. Shanghai Ocean. Univ. 2014, 23, 366–373. [Google Scholar]
  36. Qingtian, L.I.; Wang, H.; Zheng, L.I. The biodiversity and dynamics of oribatid mites in rice paddies. Syst. Appl. Acarol. 2000, 5, 9. [Google Scholar]
  37. Horn, W. Long-term development of the crustacean plankton in the Saidenbach Reservoir (Germany)–changes, causes, consequences. Hydrobiologia 2003, 504, 185–192. [Google Scholar] [CrossRef]
  38. Gilbert, K. Quantitative comparison of food niches in some freshwater zooplankton. Oecologia 1987, 72, 331–340. [Google Scholar]
  39. Perrow, M.R.; Jowitt, A.; Stansfield, J.; Phillips, G. The Practical Importance of the Interactions between Fish, Zooplankton and Macrophytes in Shallow Lake Restoration; Springer: Dordrecht, The Netherlands, 1999. [Google Scholar]
  40. Wen, X.F.; Zhang, Y.; Zhen, L.; Jin, J.; Duan, T. Research on effection of the comprehensive cultivation mode of the shrimp, crab, submerged plant polyculture and the ecological floating bed. Guangdong Agric. Sci. 2012, 24, 138–142. [Google Scholar]
  41. Ueji, M.; Inao, K. Rice paddy field herbicides and their effects on the environment and ecosystems. Weed Biol. Manag. 2001, 1, 71–79. [Google Scholar] [CrossRef]
  42. Guo, H.; Tang, D.; Shi, X.; Wu, Q.; Wang, Z. Comparative transcriptome analysis reveals the expression and characterization of digestive enzyme genes in the hepatopancreas of the Chinese mitten crab. Fish. Sci. 2019, 85, 979–989. [Google Scholar] [CrossRef]
  43. Sun, L.P.; Song, X.; Zhu, J.; Meng, X.; Zhang, L. Effects of submerged plants on growth performance and non-specific immunity of Chinese mitten crab (Eriocheir sinensis). Freshw. Fish. 2012, 42, 35–40. [Google Scholar]
  44. Zeng, Q.; Jeppesen, E.; Gu, X.; Mao, Z.; Chen, H. Cannibalism and Habitat Selection of Cultured Chinese Mitten Crab: Effects of Submerged Aquatic Vegetation with Different Nutritional and Refuge Values. Water 2018, 10, 1542. [Google Scholar] [CrossRef] [Green Version]
  45. Lv, D.; Wang, W.; Xu-Zhou, M.; Wang, Q.; Wang, A.; Chen, Z.; Tian, S. Ecological Prevention and Control of Weeds in Rice-crab Polycultured Field. Hubei Agric. Sci. 2011, 50, 1574–1578. [Google Scholar]
  46. Li, X.; Dong, S.; Lei, Y.; Li, Y. The effect of stocking density of Chinese mitten crab Eriocheir sinensis on rice and crab seed yields in rice–crab culture systems. Aquaculture 2007, 273, 487–493. [Google Scholar] [CrossRef]
  47. Hong, Y.; Jiang, C. Effects of stocking Chinese mitten crab on the zoobenthos and aquatic vascular plant in the east lake reservoir, Heilongjiang, China. Acta Hydrobiol. Sin. 2005, 29, 430–434, (In Chinese with English Abstract). [Google Scholar]
  48. Xu, Q.; Wang, H.; Zhang, S. The impact of overstocking of mitten crab, Eriocheir sinensis, on lacustrine zoobentic community. Acta Hydrobiol. Sin. 2003, 27, 41–46, (In Chinese with English Abstract). [Google Scholar]
Figure 1. Experimental design field of the crab–rice field. Inlet is where the enclosure received water; the outlet is where the enclosure drained water. Co is the control group with no artificial feed supplied, and T15, T30, and T45 represent the treatment groups fed with experimental feeds of 15%, 30%, and 45% protein content, respectively.
Water 14 01941 g001
Figure 2. Comparison of morphological parameters of crabs among different protein-content groups. I, the initial size in the beginning of experiment; F, the final size at end of experiment; CL, carapace length; CW, carapace width; CH, carapace height. Different letters indicate the significant difference among treatment groups (p < 0.05).
Water 14 01941 g002
Figure 3. Water quality parameters of each enclosure during the experiment. The y-axis of NO2-N is the secondary coordinate axis (right), and others correspond to the left primary coordinate axis.
Water 14 01941 g003
Figure 4. Species of phytoplankton observed in different treatment groups during the experiment.
Water 14 01941 g004
Figure 5. Shannon–Wiener diversity distribution indexes in different treatment groups during the experiment.
Water 14 01941 g005
Figure 6. Phytoplankton biomass in different treatment groups during the experiment. Different lowercase letters in each group represent significant differences (p < 0.05).
Water 14 01941 g006
Figure 7. Dominance phytoplankton at phyla level in different treatment groups during the experiment.
Water 14 01941 g007
Figure 8. Dominance of Chroococcus sp. in different treatment groups during the experiment.
Water 14 01941 g008
Figure 9. Species of zooplankton in different treatment groups during the experiment.
Water 14 01941 g009
Figure 10. Shannon–Wiener diversity indexes of the zooplankton in different treatment groups during the experiment.
Water 14 01941 g010
Figure 11. Zooplankton biomass in different treatment groups during the experiment.
Water 14 01941 g011
Figure 12. Composition of the predominant zooplankton species in different treatment groups during the experiment.
Water 14 01941 g012
Figure 13. Species and biomass of aquatic vascular plants in different treatment groups during the experiment.
Water 14 01941 g013
Figure 14. Biomass of the submerged plants in different treatment groups during the experiment.
Water 14 01941 g014
Figure 15. Biomass of the emergent aquatic plants in different treatment groups during the experiment.
Water 14 01941 g015
Figure 16. Species and biomass of benthos in different treatment groups during the experiment.
Water 14 01941 g016
Figure 17. Biomass of the zoobenthos in different treatment groups during the experiment.
Water 14 01941 g017
Table 1. Detailed list of contents of each experimental feed.
Ingredients/%Content
T15T30T45
Fish meal62747
Soybean meal 313.523.5
Beer yeast 333
Wheatmeal72.5943.0915.09
Fish oil7.55.53.5
Lecitin0.50.50.5
Mineral premix222
Vitamin premix222
Squid paste111
Glycine betaine0.50.50.5
Choline chloride0.20.20.2
Calcium dihydrogen phosphate1.51.51.5
Chromium oxide0.10.10.1
Ethoxyquin0.010.010.01
Calcium propionate0.10.10.1
Total100100100
Crude protein 15.0030.4945.25
Crude lipid9.139.279.31
Total energy/KJ·g−118.0916.5717.17
Table 2. Effects of different dietary protein content levels on the growth performance and yield (n = 3; x ¯ ± SD) of juvenile Chinese mitten crabs.
Growth Performance and YieldGroups
CoT15T30T45
Initial body weight/g·ind−10.09 ± 0.020.09 ± 0.010.09 ± 0.010.09 ± 0.02
Final body weight/g·ind−18.30 ± 3.19 a13.10 ± 1.59 ab14.35 ± 1.87 ab17.28 ± 6.23 b
Survival rate/%17.93 ± 8.2512.51 ± 3.388.46 ± 2.7610.38 ± 3.43
Weight gain rate/%9641.86 ± 3738.90 a15,277.93 ± 1860.99 ab16,737.02 ± 2194.882 ab20,181.73 ± 7316.62 b
Specific growth rate/%·d−13.30 ± 0.33 a3.67 ± 0.09 ab3.74 ± 0.09 b3.85 ± 0.26 b
Total output/g·m−248.38 ± 10.1458.62 ± 10.0543.86 ± 12.2760.41 ± 1.18
Net output/g·m−242.62 ± 10.1452.86 ± 10.0538.10 ± 12.2754.64 ± 1.18
Note: Values in each row with different superscripts are significantly different (p < 0.05).
Publisher’s Note: MDPI stays neutral with regard to jurisdictional claims in published maps and institutional affiliations.

