Article

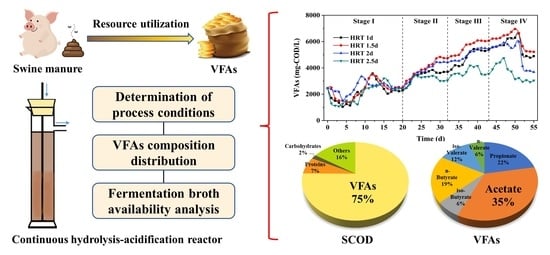
Continuous Production of Volatile Fatty Acids (VFAs) from Swine Manure: Determination of Process Conditions, VFAs Composition Distribution and Fermentation Broth Availability Analysis

1
School of Environment and Energy, South China University of Technology, Guangzhou 510006, China
2
The Key Laboratory of Pollution Control and Ecosystem Restoration in Industry Clusters, Ministry of Education, Guangzhou 510006, China
*
Author to whom correspondence should be addressed.
Water 2022, 14(12), 1935; https://doi.org/10.3390/w14121935
Submission received: 25 April 2022 / Revised: 4 June 2022 / Accepted: 14 June 2022 / Published: 16 June 2022
(This article belongs to the Topic Anaerobic Digestion Processes)

Abstract

:
For pollution control and waste utilization, a promising future direction is to obtain high-value carbon sources from organic waste. In this experiment, swine manure was efficiently converted into high concentration volatile fatty acids through continuous hydrolysis-acidification bioreactors. This study determined the process conditions, the composition distribution of volatile fatty acids and the availability of fermentation broth. The results showed that the reactor with a hydraulic retention time of 1.5 days had the optimal production performance of volatile fatty acids. The highest hydrolysis degree (62.2%) and acidification degree (42.5%) were realized in this reactor at the influent soluble chemical oxygen demand of 5460 mg/L. Furthermore, when the influent soluble chemical oxygen demand was 7660 mg/L, volatile fatty acids of 6065 mg-COD/L could be produced stably, and the proportion of volatile fatty acids in soluble chemical oxygen demand was the largest (75%). Additionally, the fermentation broth rich in volatile fatty acids could be applied to deep nitrogen and phosphorus removal. This work provides a productive approach to resource recovery from swine manure.

Graphical Abstract

1. Introduction

With the sharply increasing demand for porcine meat [1,2], the rapid development of large-scale pig farms has resulted in a massive amount of swine manure emissions. Unreasonable discharge or treatment of swine manure will bring serious environmental pollution problems, resulting in enormous economic loss and waste of resources. Swine manure is a potential biomass resource. Proper management and utilization of swine manure can reduce the pollution of the ecological environment and promote the development of the circular bio-economy. Anaerobic digestion is one of the most widely adopted technologies for waste valorization into resources [3,4]. The anaerobic digestion process basically consists of four main stages: hydrolysis, acidogenesis, acetogenesis, and methanogenesis [5]. Volatile fatty acids (VFAs) are produced during the stages of acidogenesis and acetogenesis. Hence, the production time of VFAs is much shorter than that of methane. VFAs can be used as raw materials for the production of bioplastics [6] and bioenergy [7,8], as well as additional carbon sources for nitrogen and phosphorus removal in wastewater treatment [9,10]. The economic value of producing VFAs from agroindustrial residues has been reported to be more than three times higher than that of methane production [11]. In view of this, directional conversion of organic matter in swine manure to VFAs plays a vital role in the utilization of resources from swine manure.
The production yield, efficiency and composition of VFAs are significantly affected by the operational conditions of the hydrolysis and acidification process, such as pH, temperature, hydraulic retention time (HRT), solids retention time (SRT) and organic loading rate (OLR) [12]. To increase the degree of hydrolysis-acidification and inhibit or reduce methane production, the optimum process parameters of hydrolysis and acidification of swine manure were investigated. It has been found that the highest production of VFAs can be reached at an initial pH of 10.0 in the hydrolysis and acidification of swine manure [13], and an initial pH 10.0 pretreatment (16 days) achieved similar maximum VFAs production faster than continued pH 10.0 adjustment (22 days) [14]. Huang et al. [15] also showed that initial pHs of 11.0 and 10.0 were conducive to VFAs accumulation from the dry anaerobic digestion of swine manure at 55 °C and 20% TS. Therefore, pH 10.0 was set as the initial pH condition of the experiment. However, the above studies were based on batch experiments. To date, there are few reports on VFAs production by continuous hydrolysis and the acidification of swine manure. In order to obtain higher yields of VFAs, it is necessary to establish continuous flow reactors to explore the VFAs production characteristics and the possibility of deriving VFAs-rich fermentation broth from swine manure.
HRT is a key variable used to control the microbial activity of mixed microflora in continuous anaerobic systems [16]. Longer HRT allows more time for microorganisms to react with organic substrates, which could be advantageous to the production of metabolites. However, prolonged HRT may lead to stagnation of VFA production [17]. Kim et al. [18,19] investigated the thermophilic acidogenesis of swine wastewater. According to the optimization results of the response surface methodology, the optimum conditions for VFAs production were an HRT of 2.0 days and 51 °C, at which the net concentration of VFAs was 1.7 g/L, and VFAs production was more affected by HRT than by temperature. In addition, with the increase of the concentration of soluble chemical oxygen demand (SCOD) in influent, the content of organic matter that can be converted into VFAs in the reactor increases, but too high a concentration of influent SCOD will affect the stability of the reactor. Based on the relatively few number of current reports, it is essential to determine the optimum condition of HRT and the maximum allowable concentration of influent SCOD for continuous hydrolysis and the acidification of swine manure.
In wastewater treatment, commercial chemical carbon sources, such as methanol, glucose and acetate, are conventionally used as additional carbon sources to improve the efficiency of nitrogen and phosphorus removal, but at a high price. It is a cost-effective alternative to use VFAs produced from waste as additional carbon sources for both denitrification and phosphorus uptake [20]. A number of studies have demonstrated that VFAs derived from waste are superior to traditional carbon sources in improving biological nutrient removal [21,22,23]. Therefore, it has enormous potential to use swine manure fermentation broth as an additional carbon source to enhance nitrogen and phosphorus removal, and the feasibility of using fermentation broth in this field should be explored.
The aim of this study was to establish a continuous hydrolysis-acidification system to obtain a large number of high-quality organic carbon sources rich in VFAs from swine manure. Specifically, the effects of HRT and influent SCOD on the product characteristics of continuous hydrolysis and acidification were investigated, and the optimum operating conditions for VFAs production were determined. Moreover, the VFAs composition distribution and the application feasibility of fermentation broth in enhanced nitrogen and phosphorus removal were analyzed. These results can offer the theoretical basis for controlling and optimizing the production and application of VFAs from swine manure.

2. Materials and Methods

2.1. Swine Manure

The swine manure used in this study was obtained from a pig farm located in Yueyang City, Hunan Province, China. The raw swine manure was sealed and stored in a −20 °C freezer for subsequent experiments. An appropriate amount of swine manure was thawed in a 4 °C refrigerator prior to use. The characteristics of swine manure are shown in Table 1.

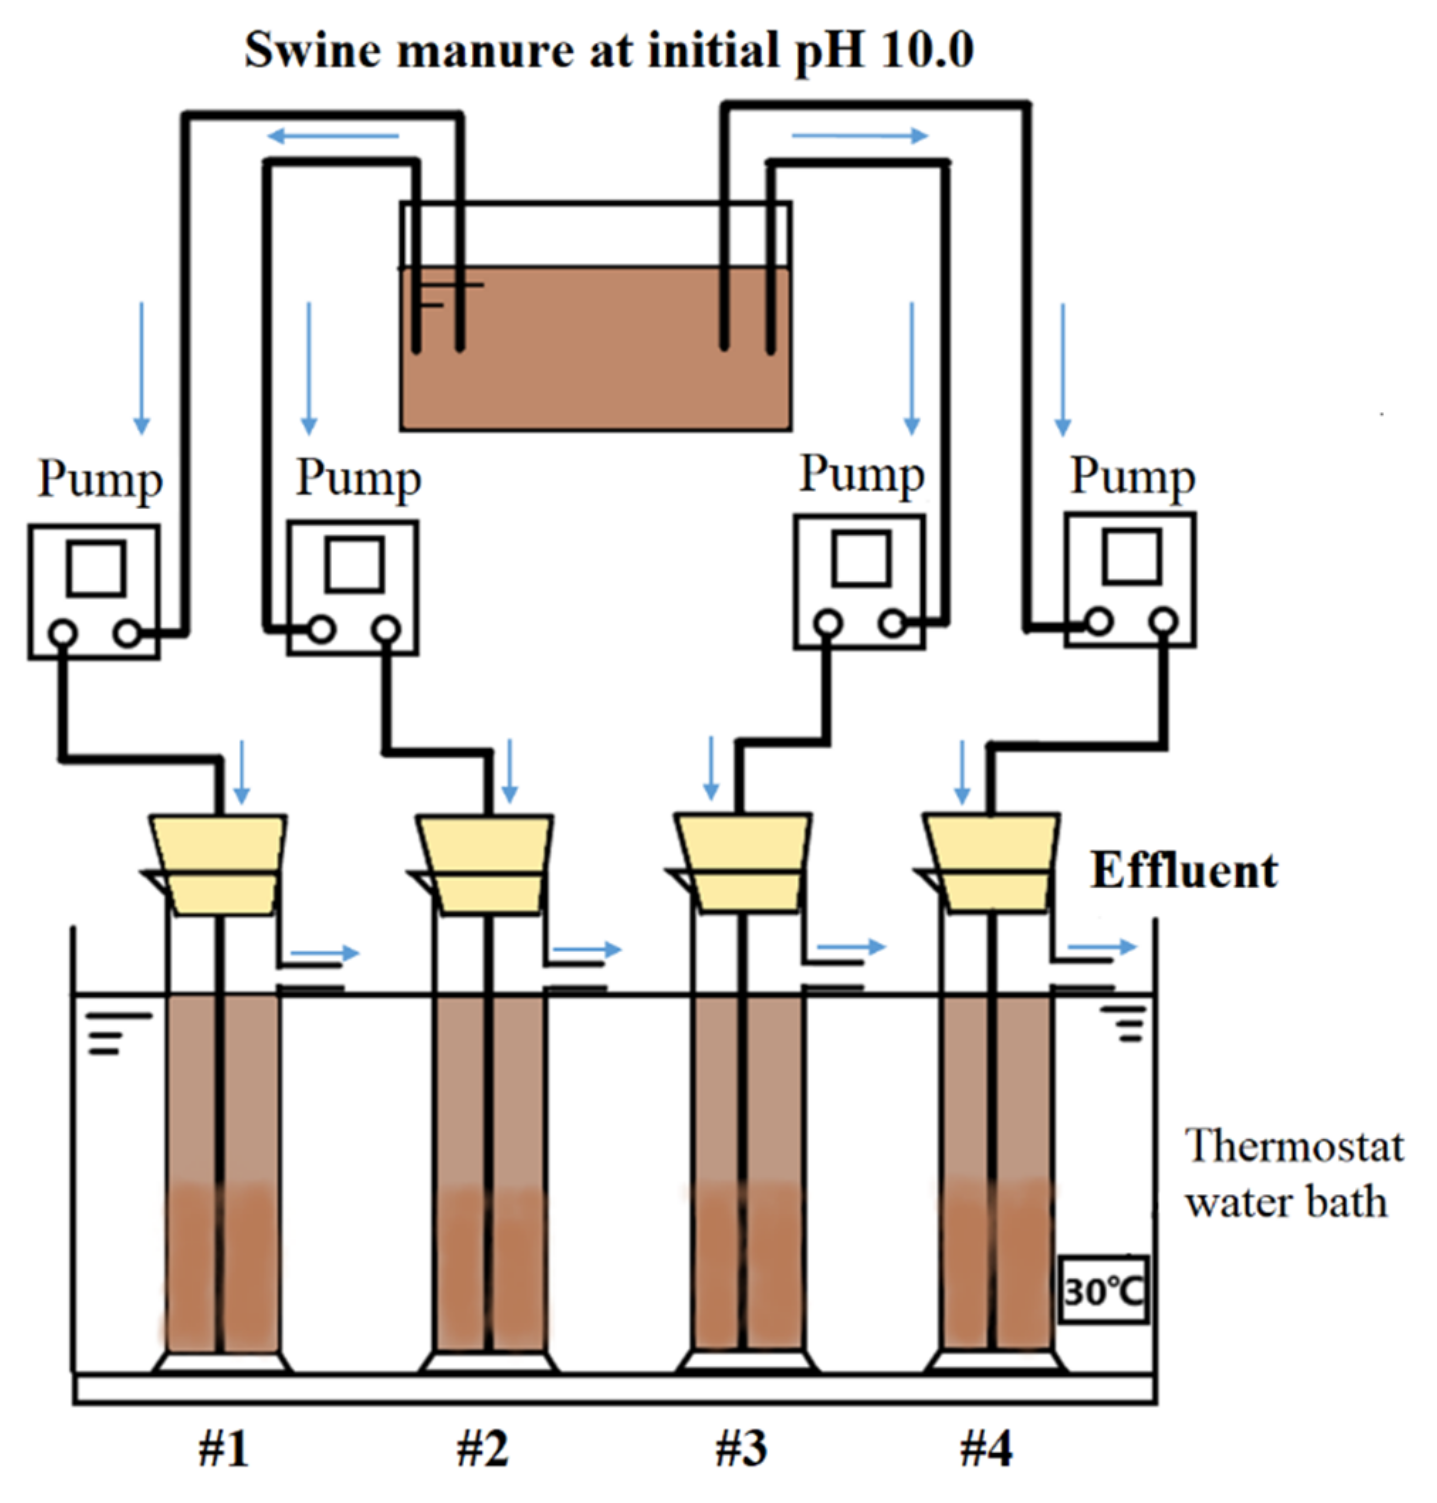
2.2. Experimental Design

Four continuous hydrolysis-acidification reactors with the same specification and structure were employed in this study. The experimental device is depicted in Figure 1. The HRTs of four reactors were set as 1.0 day, 1.5 days, 2.0 days and 2.5 days, which were labeled as #1, #2, #3, and #4, respectively. Each cylindrical reactor was made of polypropylene with a diameter of 95 mm, a height of 490 mm and an effective volume of 2 L. The reactors were placed in the thermostat water bath at 30 ± 2 °C. The tops of the reactors were sealed with rubber stoppers, and the walls were wrapped with tin foil to avoid light. Each reactor operated independently and continuously to demonstrate the characteristics of continuous production of VFAs under different operating conditions.
After of the swine manure samples were mixed uniformly, and 240 g of each sample was added into reactors #1–#4 and diluted with distilled water. The initial pH was adjusted to 10.0 with 5 M NaOH, which was the initial state of each reactor (day 0). In this experiment, the microbial community of the hydrolysis-acidification function was gradually enriched and acclimated from swine manure without additional inoculation sludge. In addition, some manure samples were taken, and distilled water was added to adjust to the set concentration of SCOD. The prepared influent was pumped into each reactor, and the continuous hydrolysis-acidification reactors were started. The operational process was divided into four stages (I, II, III and IV), with the concentrations of influent SCOD maintained at 3670 ± 80, 5460 ± 140, 7660 ± 180 and 10,130 ± 230 mg/L, respectively (Table S1 in the Supplementary Materials). The concentrations of influent total chemical oxygen demand (TCOD) in four stages were 7480 ± 180, 11,200 ± 290, 15,850 ± 430 and 21,800 ± 610 mg/L, respectively. When the variation ranges of concentrations of SCOD and VFAs in the effluent of each stage were less than 10%, the hydrolysis-acidification system could be regarded as a stable state, and the concentration of influent SCOD could be further increased. During the experimental period, the reactors operated continuously for 55 days.

2.3. Analytical Methods

Total solids (TS) content was measured by drying the manure sample at 105 °C until a constant weight was reached, and the volatile solids (VS) content was determined by igniting the dried manure at 600 °C for 3 h. SCOD and TCOD were measured by the dichromate reflux method, ammonium nitrogen (NH4+-N) was determined by Nessler’s reagent spectrophotometry method, and soluble phosphorus (PO43-P) was measured by the ascorbic acid reduction method [24]. The pH was measured by pHS-3C (REX, Shanghai, China). The concentrations of soluble proteins and carbohydrates were measured using the Coomassie brilliant blue method [25] and anthrone-sulfuric acid colorimetric method [26]. The concentrations and compositions of VFAs (C2-C5) were analyzed by gas chromatography (Echrom A90, Shanghai, China) equipped with a flame ionization detector (FID) and a capillary column (DB-FFAP, 30 m × 0.32 mm × 0.50 um, Agilent, Santa Clara, USA). The carrier gas was high purity nitrogen with a flow rate of 20 mL/min and a split ratio of 10:1. The temperatures of injector and detector were 250 °C and 300 °C, respectively. In the experiment, six kinds of VFAs were mainly produced by hydrolysis and the acidification of swine manure, which were acetate, propionate, iso-butyrate, n-butyrate, iso-valerate and n-valerate, respectively, according to the peak order. The conversion factors used to calculate the COD equivalents of organic compounds were (g COD/g compound): 1.07 for acetate, 1.51 for propionate, 1.82 for iso-butyrate and n-butyrate, 2.04 for iso-valerate and n-valerate, 1.44 for soluble proteins, and 1.19 for soluble carbohydrates [27].

2.4. Calculation Method of Acidification Degree

The acidification degree was calculated by converting each VFA in the effluent of each reactor into COD units, and then adding these values to obtain the concentration of VFAs (VFAs in mg-COD/L) and dividing it by the concentration of influent TCOD (TCODIn in mg/L). The equation is shown by Equation (1) referring to the previous research [28]:
Acidification   degree   ( % ) = VFAs TCOD In   ×   100

2.5. Statistical Analysis

The results were subjected to statistical analysis to test for significance using SPSSAU at a significance level of p < 0.05. All of the figures were developed by Origin 2018.

3. Results and Discussion

3.1. Hydrolysis-Acidification Effect and Determination of Process Conditions

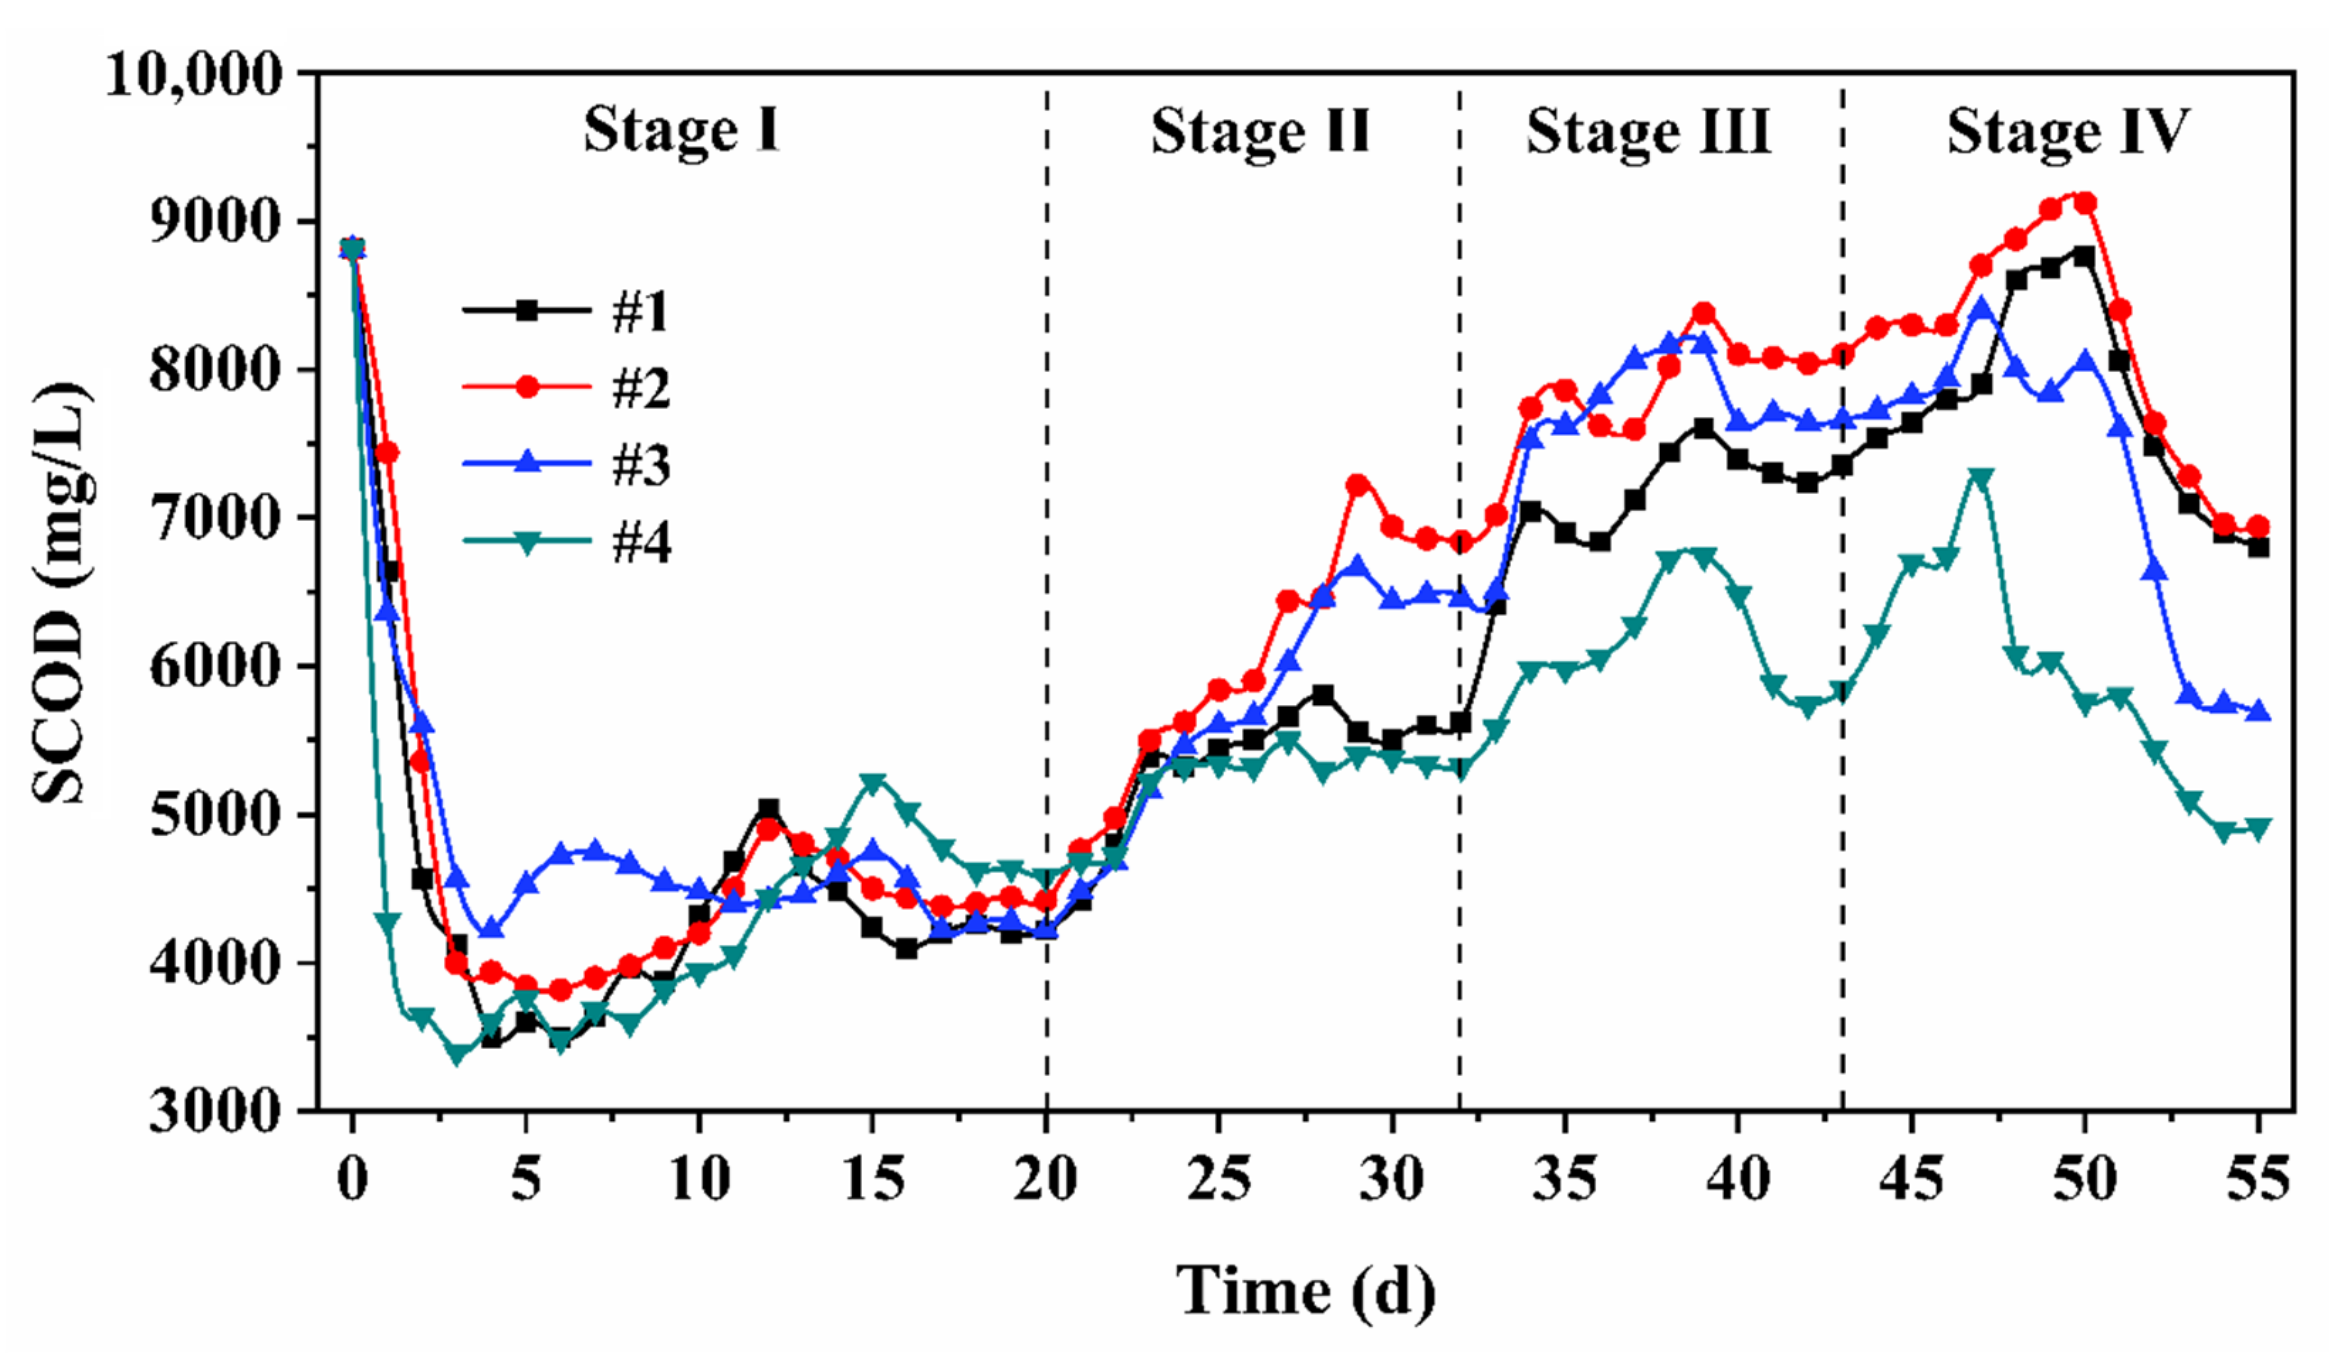
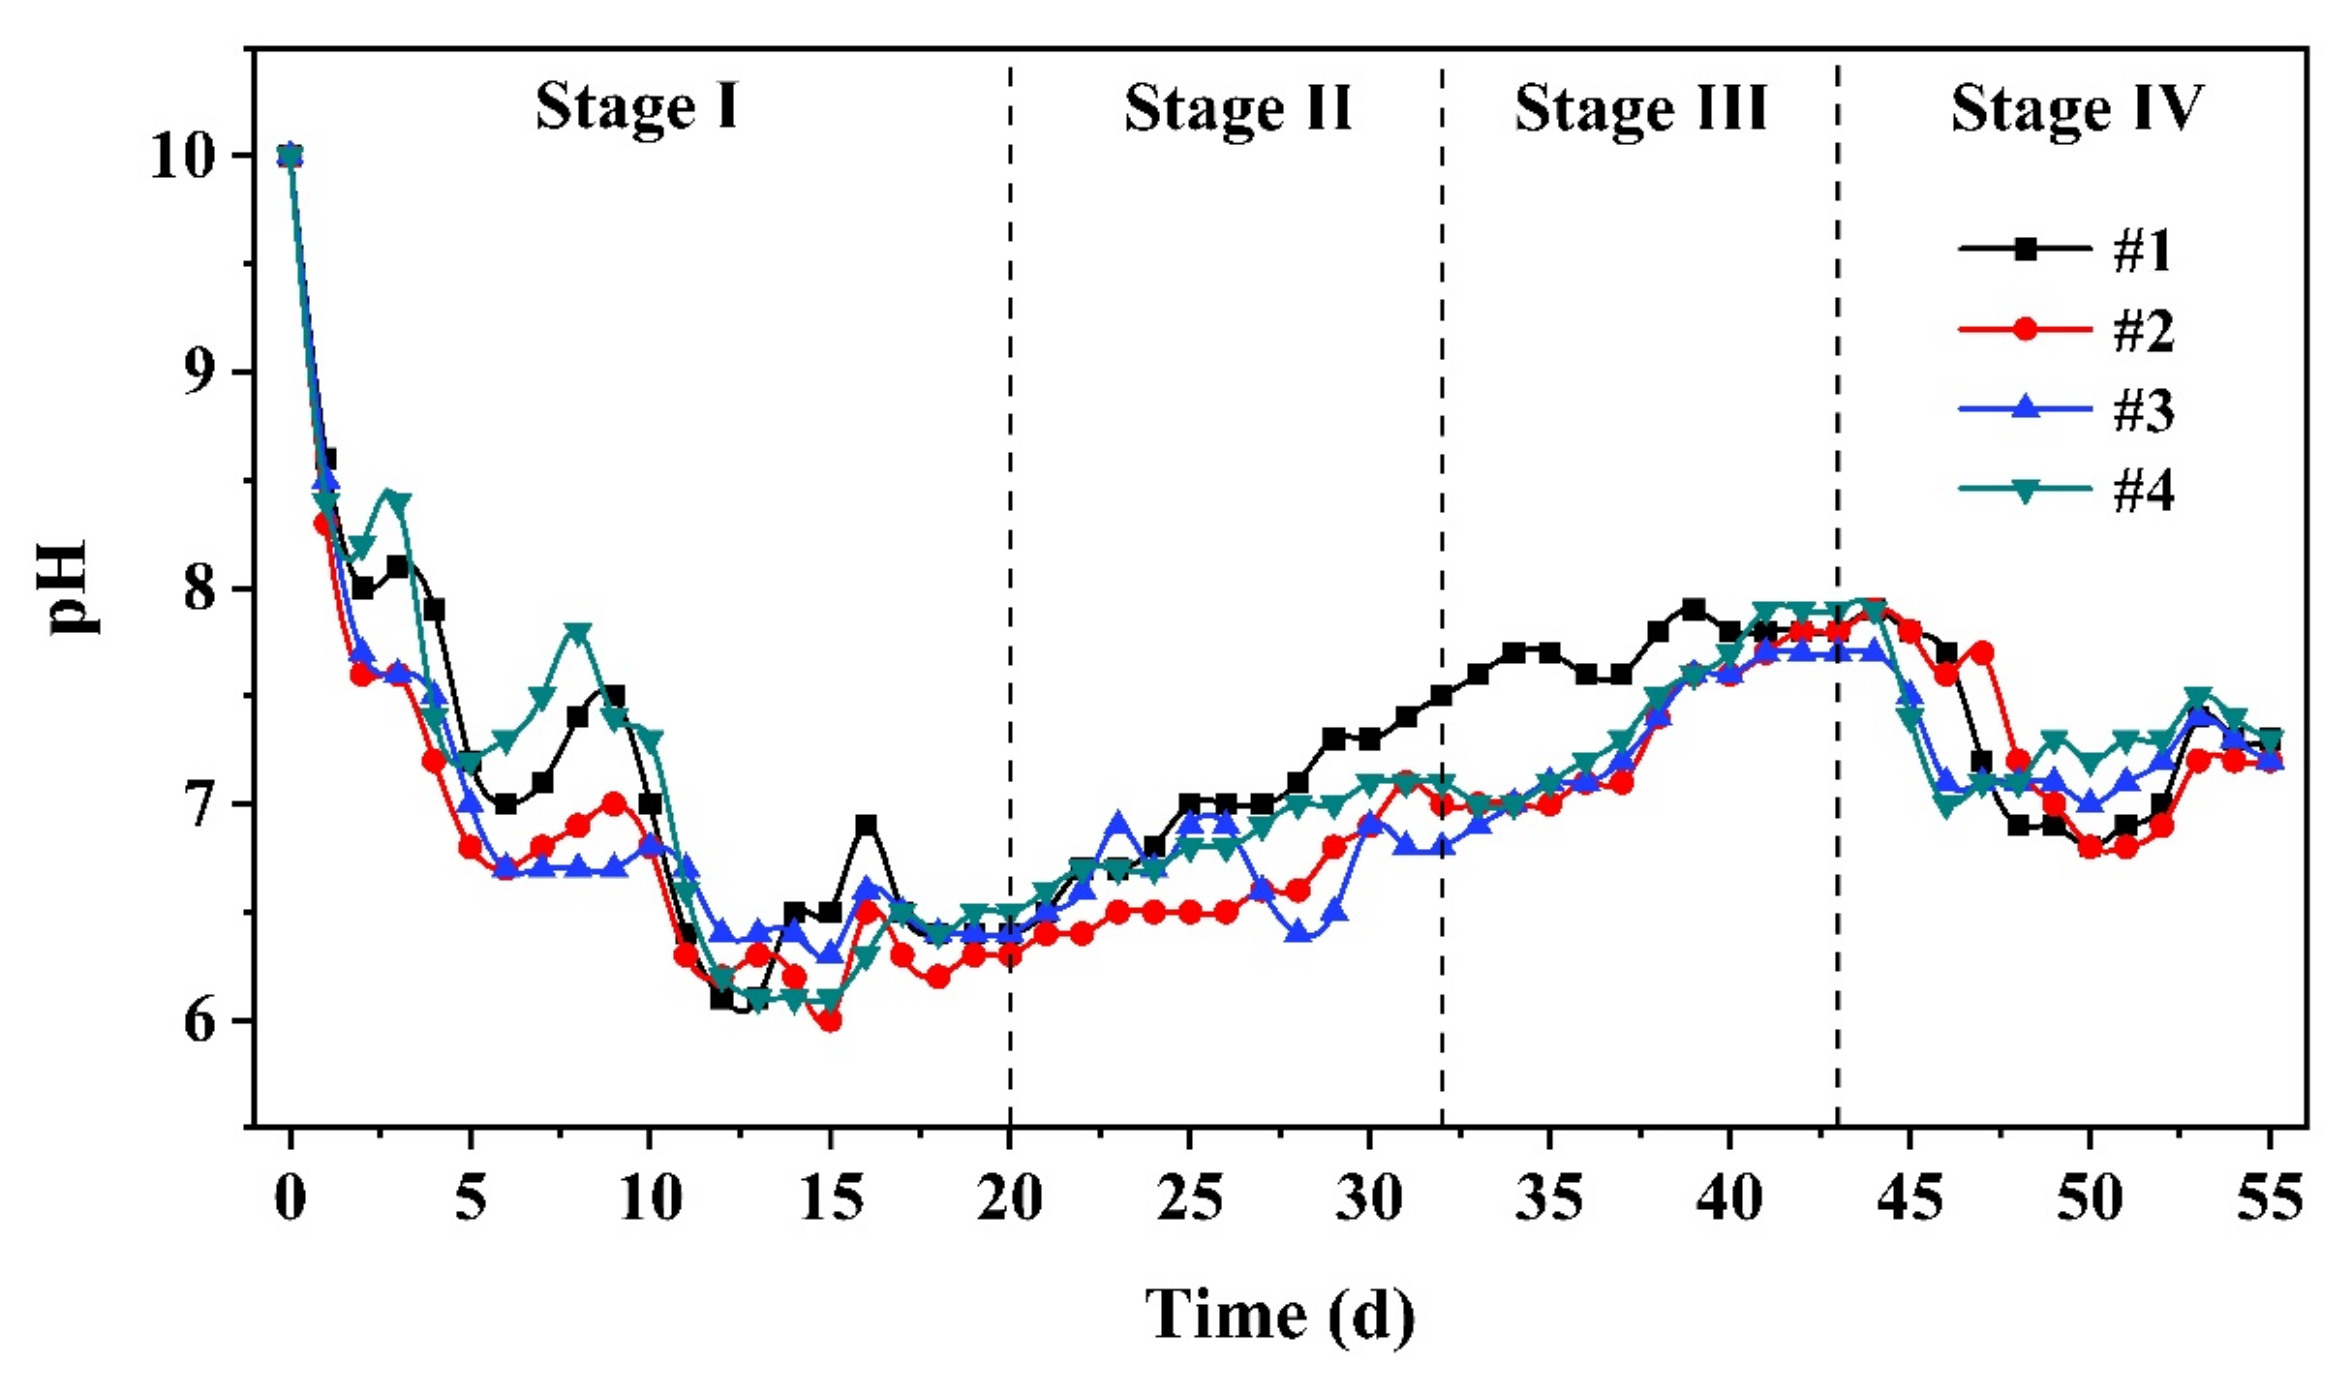
3.1.1. Hydrolysis Performance

The existence of soluble organic matter is the premise of VFAs production in the hydrolysis and acidification process. A large amount of organic matter in swine manure exists in the solid form (particulate matter). In order to produce a high concentration of VFAs, particulate organic matter must be effectively converted into soluble organic matter through the hydrolysis process. As reported by the literature, hydrolysis can be expressed by the variation of SCOD concentration [29,30]. Figure 2 shows the changes of SCOD under different concentrations of influent during the operation of four continuous flow reactors with different HRTs.
As shown in Figure 2, in stage I, the SCOD of each reactor decreased rapidly, then fluctuated up and down, and became stable after 17 days of operation. The main reason was that the original soluble organic matter in each reactor flowed out with the effluent or was consumed by indigenous microorganisms, while the particulate organic matter was converted into soluble organic matter slowly. When the release and degradation rate of soluble organic matter gradually reached equilibrium, the system was in a stable state. When the influent concentration increased in stage II, the SCOD of each reactor continued to increase, and the differential concentration gradually became more conspicuous. The SCOD concentrations in reactors #1–#4 were stable at 5570 ± 53, 6965 ± 175, 6510 ± 101 and 5360 ± 37 mg/L after 28 days, respectively. In stage III, the SCOD in reactor #2 (HRT of 1.5 days) was maintained at the highest level (8080 ± 28 mg/L) after stable operation. In stage IV, the SCOD of the four reactors rose to the highest value (reactor #2 reached 9120 mg/L), and then decreased rapidly and sharply. This fall can be ascribed to the slow transfer of fermentation products under high influent concentration, which affected the enzyme activity [31]. Moreover, a high substrate content may lead to imbalance of osmotic pressure and destroy the metabolism of bacteria [31]. Compared to other reactors in hydrolysis performance, reactor #2 attained the highest concentration of SCOD in most cases, and hence the optimum HRT of 1.5 days was appropriate to maximize hydrolysis and avoid methane production.
The percentage of SCOD in influent TCOD can reflect the hydrolysis degree of swine manure and organic matter solubilization rate [30,32]. As Table 2 illustrates, the hydrolysis degree of reactors #2 and #3 was the highest in stage II, and the hydrolysis degree of reactors #1 and #4 decreased with the increase of influent SCOD. The maximum hydrolysis degree in this experiment (62.2%) was much higher than the reported hydrolysis degree of swine manure (24%) [29]. Nonetheless, in stage IV, SCOD removal began to occur in all four reactors, and the hydrolysis degree decreased drastically. Consequently, the influent SCOD could exert a clear effect on the hydrolysis degree. For appropriate substrate supply, the concentration of influent SCOD should be less than 7660 mg/L.

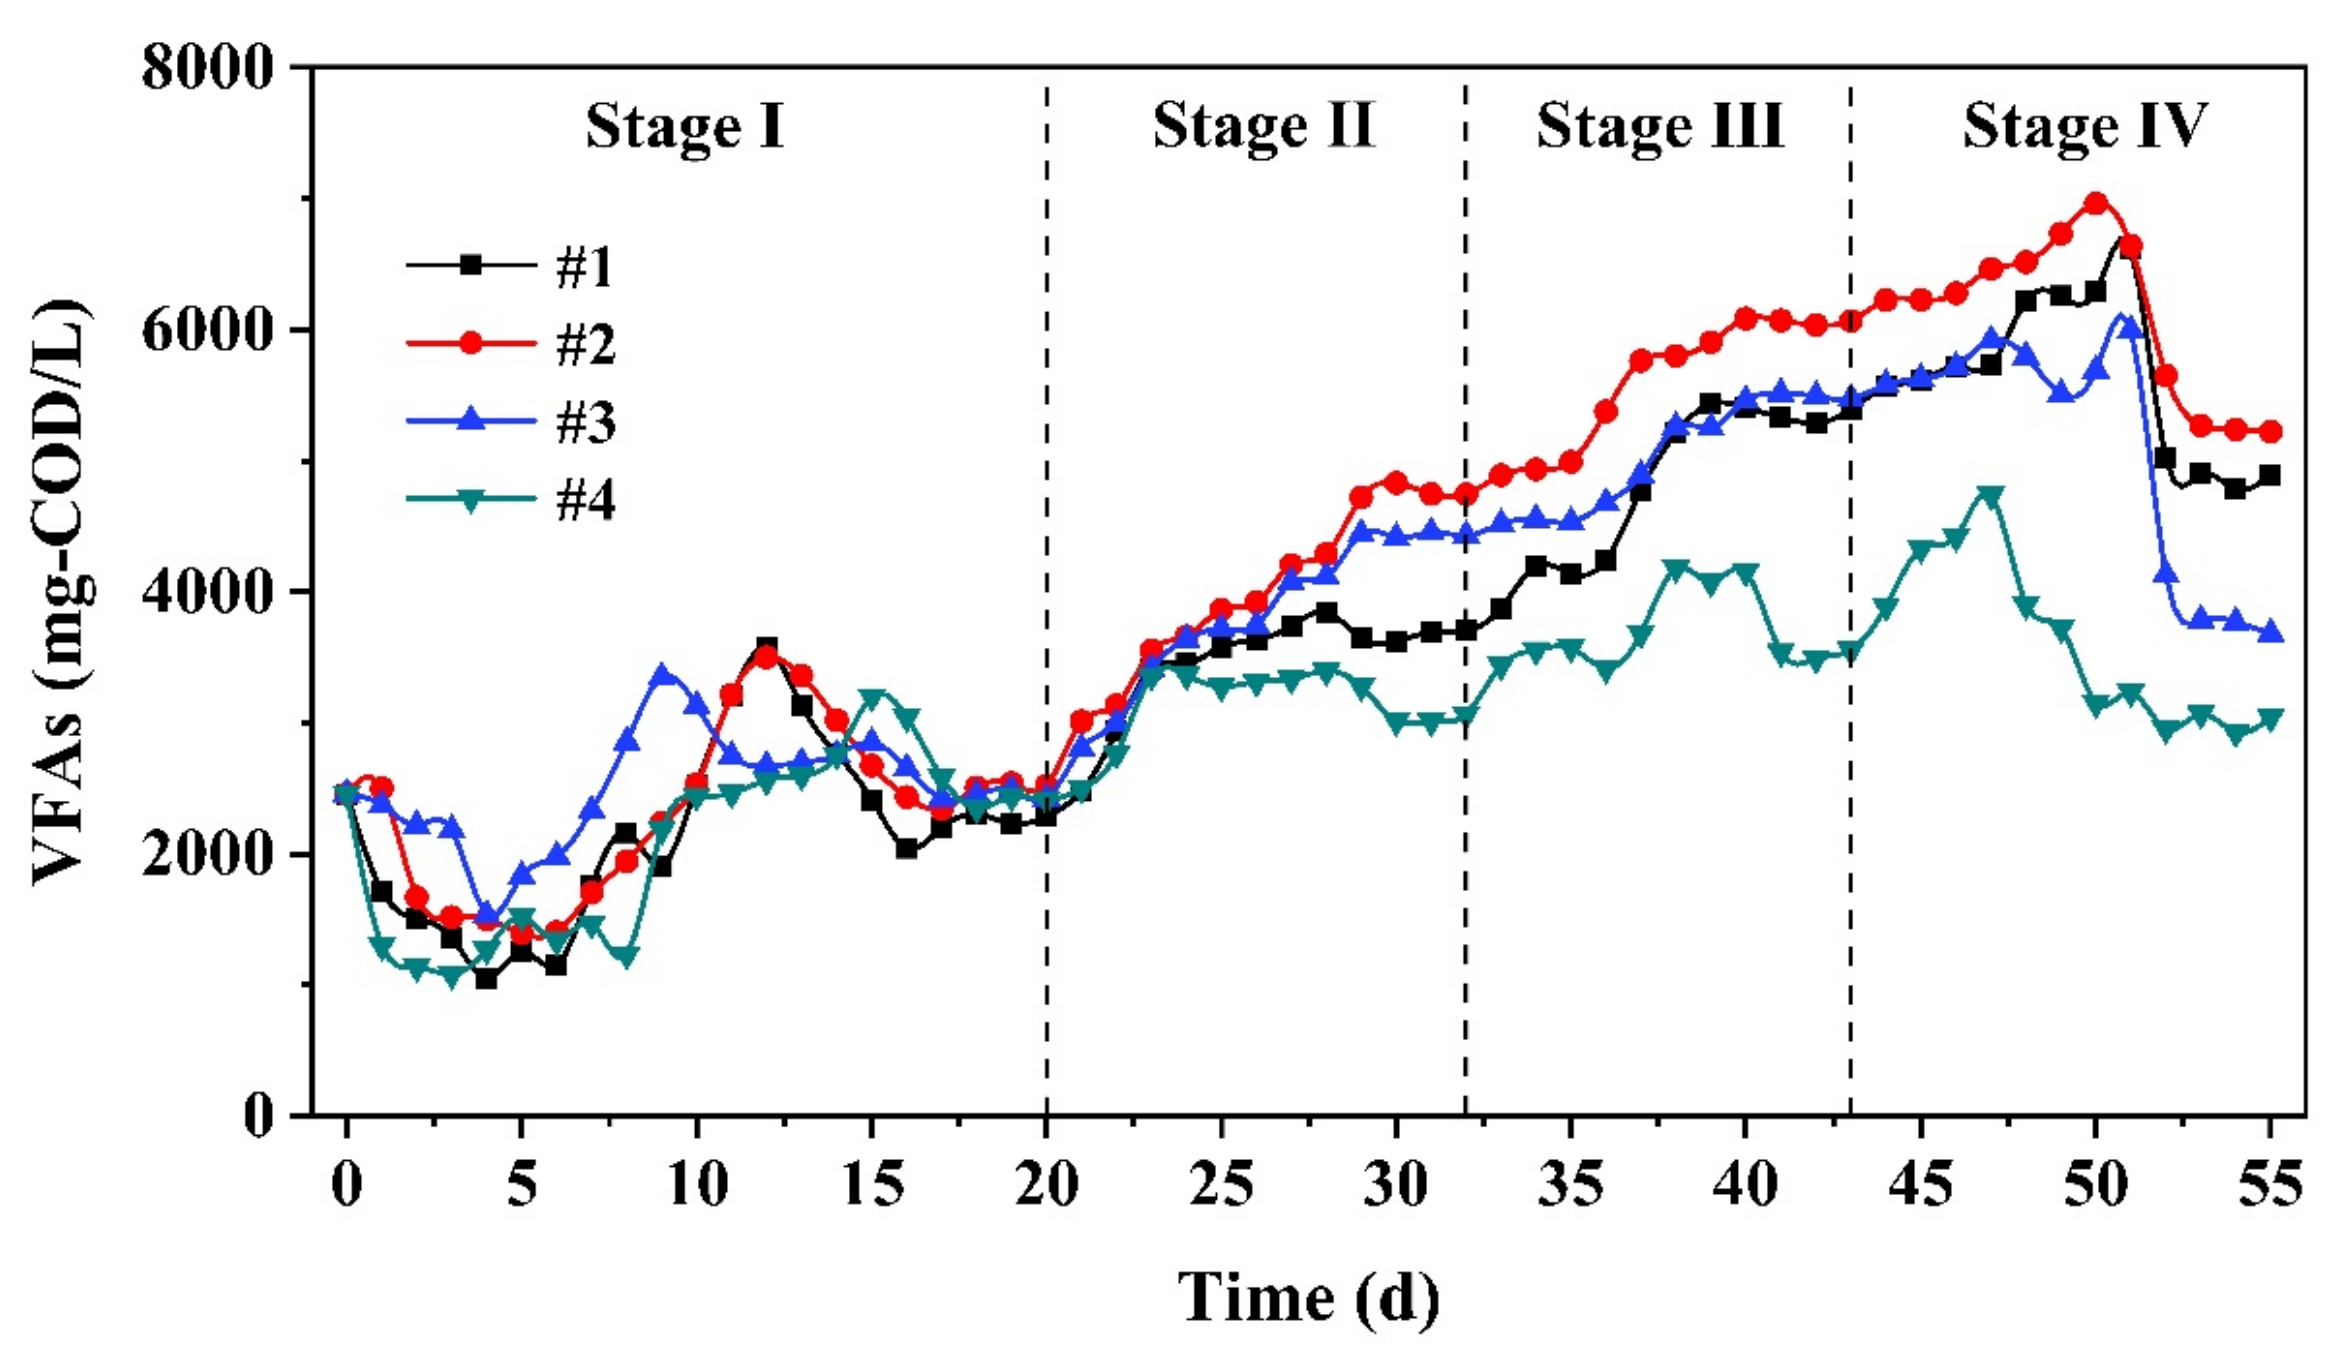
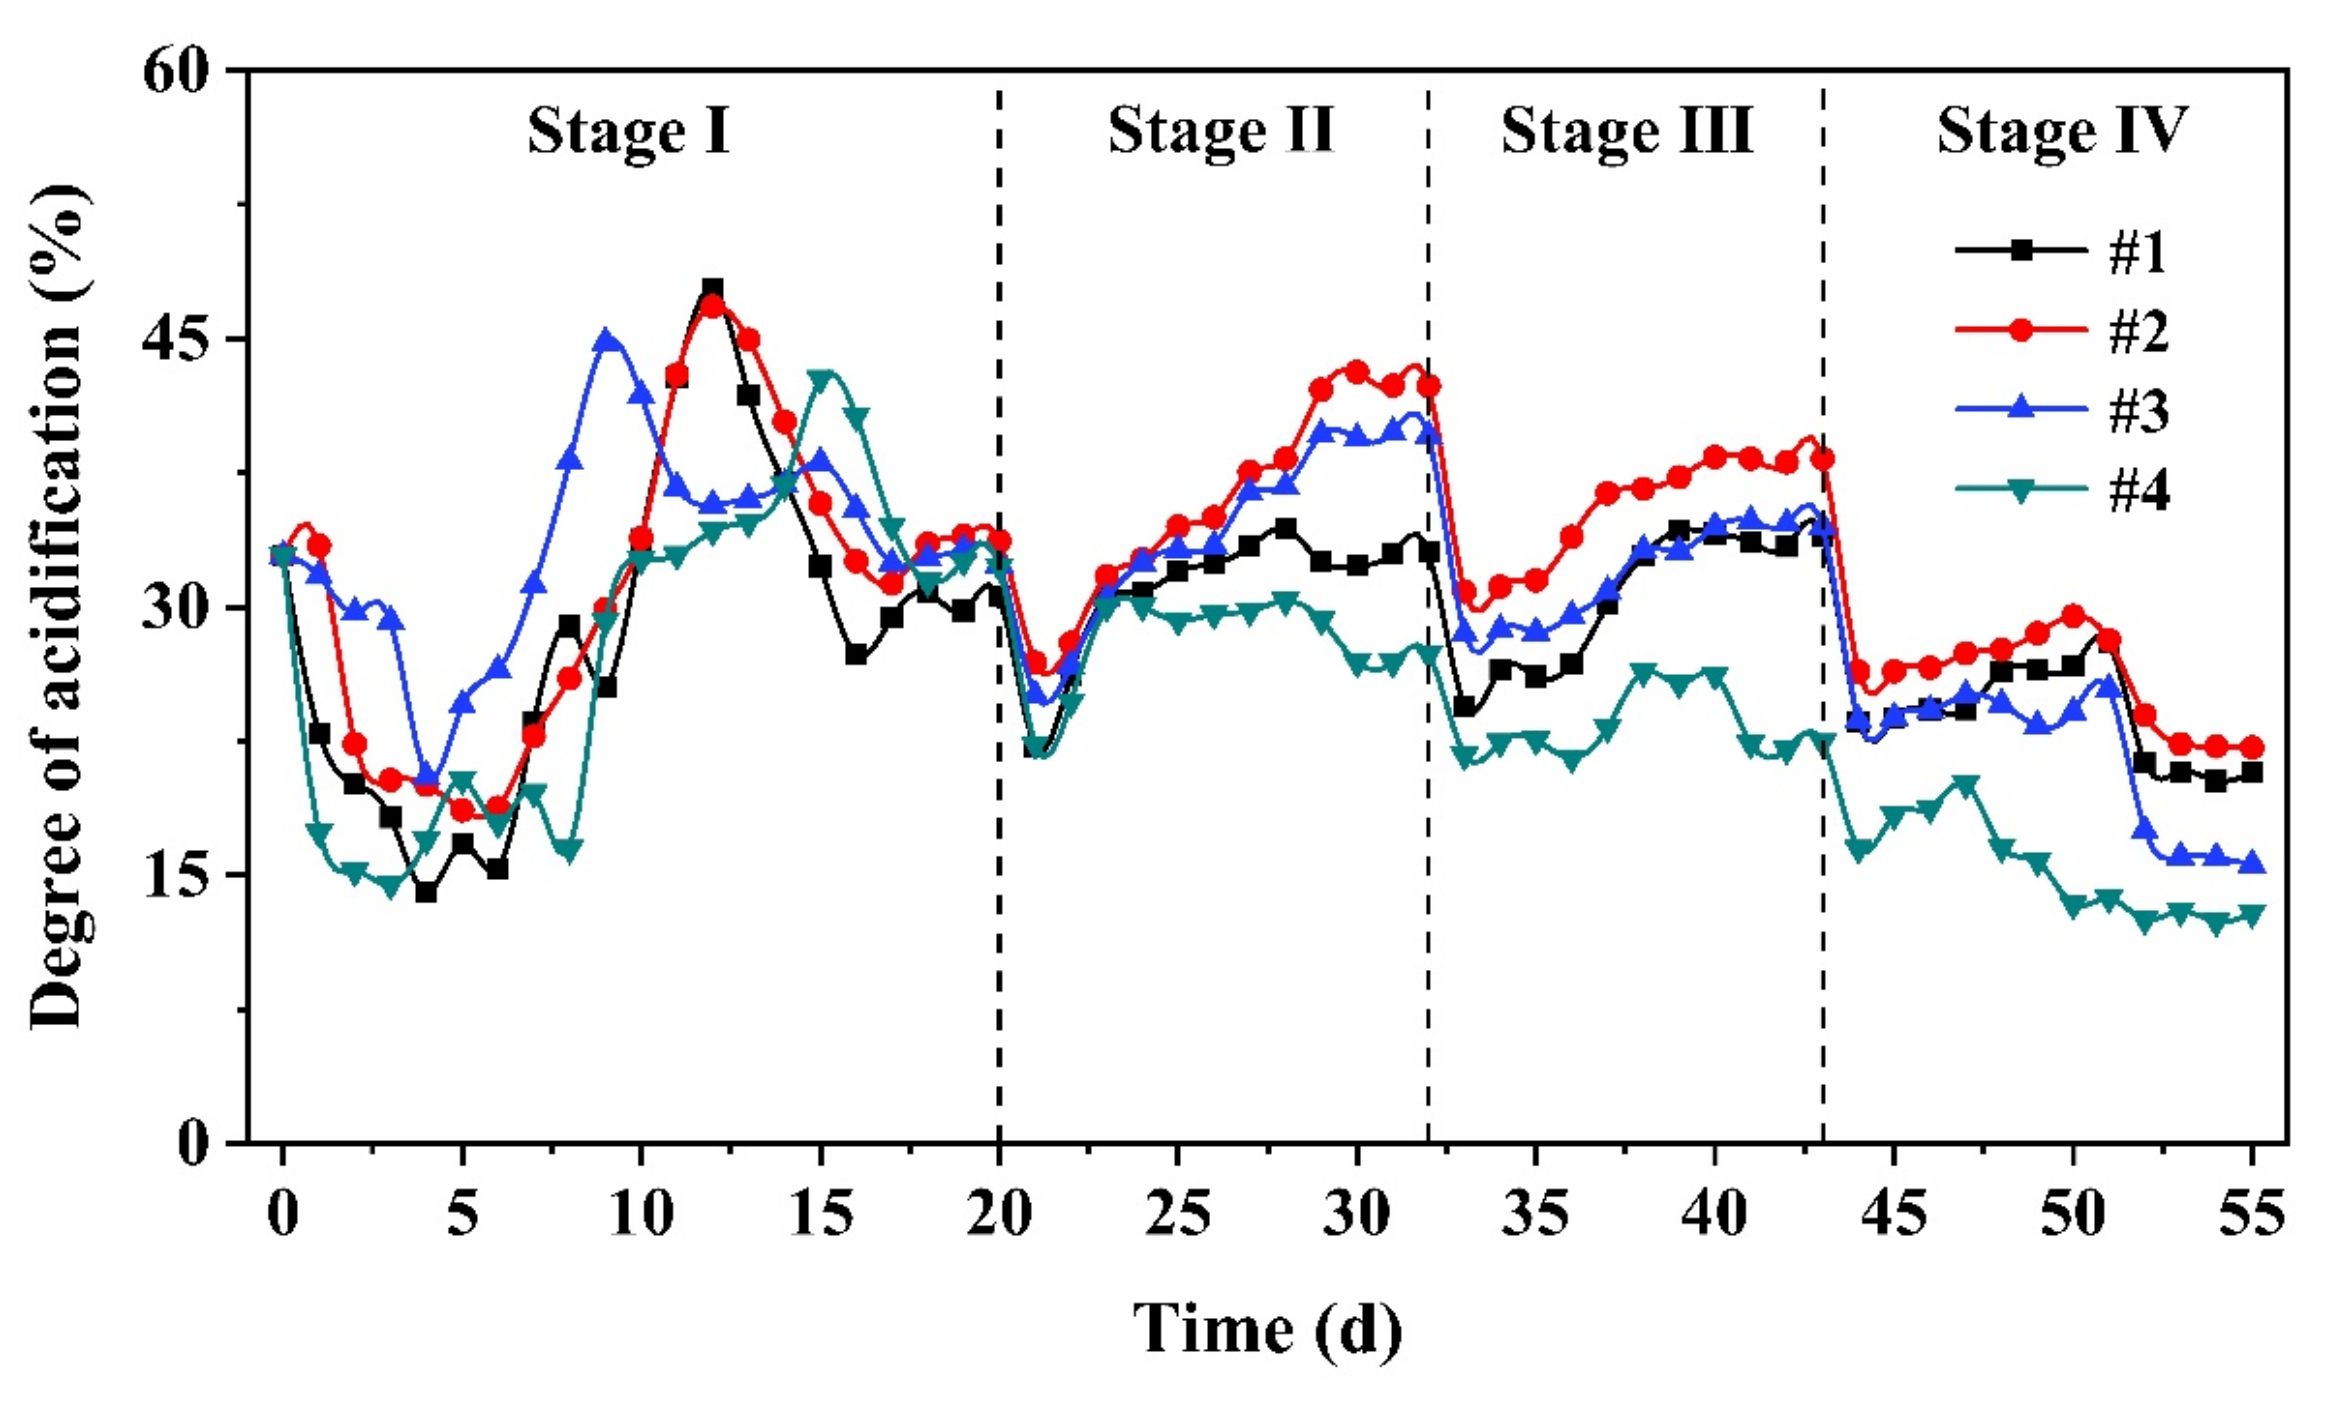
3.1.2. Acidification Performance

The variations of VFAs concentration and SCOD concentration in four continuous flow reactors with different HRTs were similar. As exhibited in Figure 3, the optimal conditions of VFAs production were determined as HRT of 1.5 days and influent SCOD of 7660 mg/L, under which VFAs concentration of 6065 ± 19 mg-COD/L was obtained continuously. This advantage of reactor #2 can be attributed to acidogenic bacteria making full use of hydrolysate to produce VFAs, and the fact that shorter HRT can prevent methanogens from dominating.
When the concentration of influent SCOD rose within the allowable range, there would be more available carbon sources and nutrients for the growth of acidogenic bacteria, and the activity of microorganisms would also be improved. Furthermore, the VFAs production rate of acidogenic bacteria was not correlated with the VFAs degradation rate of acetogenic and methanogenic bacteria [3,33]. Therefore, the continuous increase of VFAs concentration in each reactor from stage II to stage III was observed. However, the sudden increase of influent SCOD might break the balance between substrates and the microbial community, and change hydrolysis-acidification reactors from steady states to unsteady states [34]. Stage IV showed that although all reactors achieved high concentrations of VFAs at high influent SCOD, they were unable to sustain high production. For instance, the maximum concentration of VFAs produced in reactor #2 reached 6961 mg-COD/L, but then it dropped rapidly and stabilized at about 5244 mg-COD/L. The results indicated that the activity of acidogenic bacteria in each reactor had been affected by the high organic loading in the influent. It is known that the accumulation of VFAs can adversely affect the fermentation process [35], and the production rate of VFAs can be inhibited by the accumulation of undissociated VFAs [36]. Hence, when the concentration of influent SCOD increased to a certain level, the hydrolysis and acidification process of swine manure would be inhibited, and the VFAs accumulated in each reactor would be consumed by methanogens, acetogenic bacteria and sulfate-reducing bacteria. The system did not reach a steady state until the production rate and degradation rate of VFAs were basically consistent.
The acidification degree is an important parameter in assessing the hydrolysis-acidification system, as it represents the percentage of initial organic matter converted into VFAs and the VFAs production level during operation. Hwang et al. [37] reported that the acidification degree of swine wastewater was less than 25%. Figure 4 shows the changes of acidification degree during the operation of continuous flow reactors. It can be observed that each reactor reaches a relatively stable VFAs production level after seven to nine days of fluctuation after increasing the influent SCOD. Among them, the average acidification degree of reactor #2 in the stable phase of each stage was the highest, which followed a descending order as stage II (42.5%) > stage III (38.3%) > stage I (33.7%) > stage IV (22.2%). For reactor #1, the average acidification degree of stages I–III during the stable phases was almost at the same level, showing that the hydrolysis-acidification system was relatively steady. However, the acidification degree of reactor #4 revealed a downward trend, from 32.1% in stage I to 12.8% in stage IV.
As illustrated in Figure 5, the pH of reactor #1 was at a high level in stages II and III. Too short an HRT may have caused the reactor to be greatly affected by the influent, which brought about pH changes and ultimately affected the hydrolysis and acidification performance of reactor #1. Meanwhile, the pH of four reactors increased in stages I–III, because the consumption of VFAs, the production of NH4+-N, and the reduction of sulfate could lead to the increase in alkalinity. Previous reports have shown that methanogens mainly prefer nearly neutral pH conditions, with the optimum range being between 6.5 and 8.2 [38,39]. The change of pH may promote methanogenesis, resulting in the decrease of acidification degree in stage III. As mentioned above, a better acidification degree (42.5%) can be achieved by the continuous hydrolysis-acidification of swine manure at an HRT of 1.5 days and an influent SCOD of 5460 mg/L, thereby realizing efficient bioconversion of organic matter.

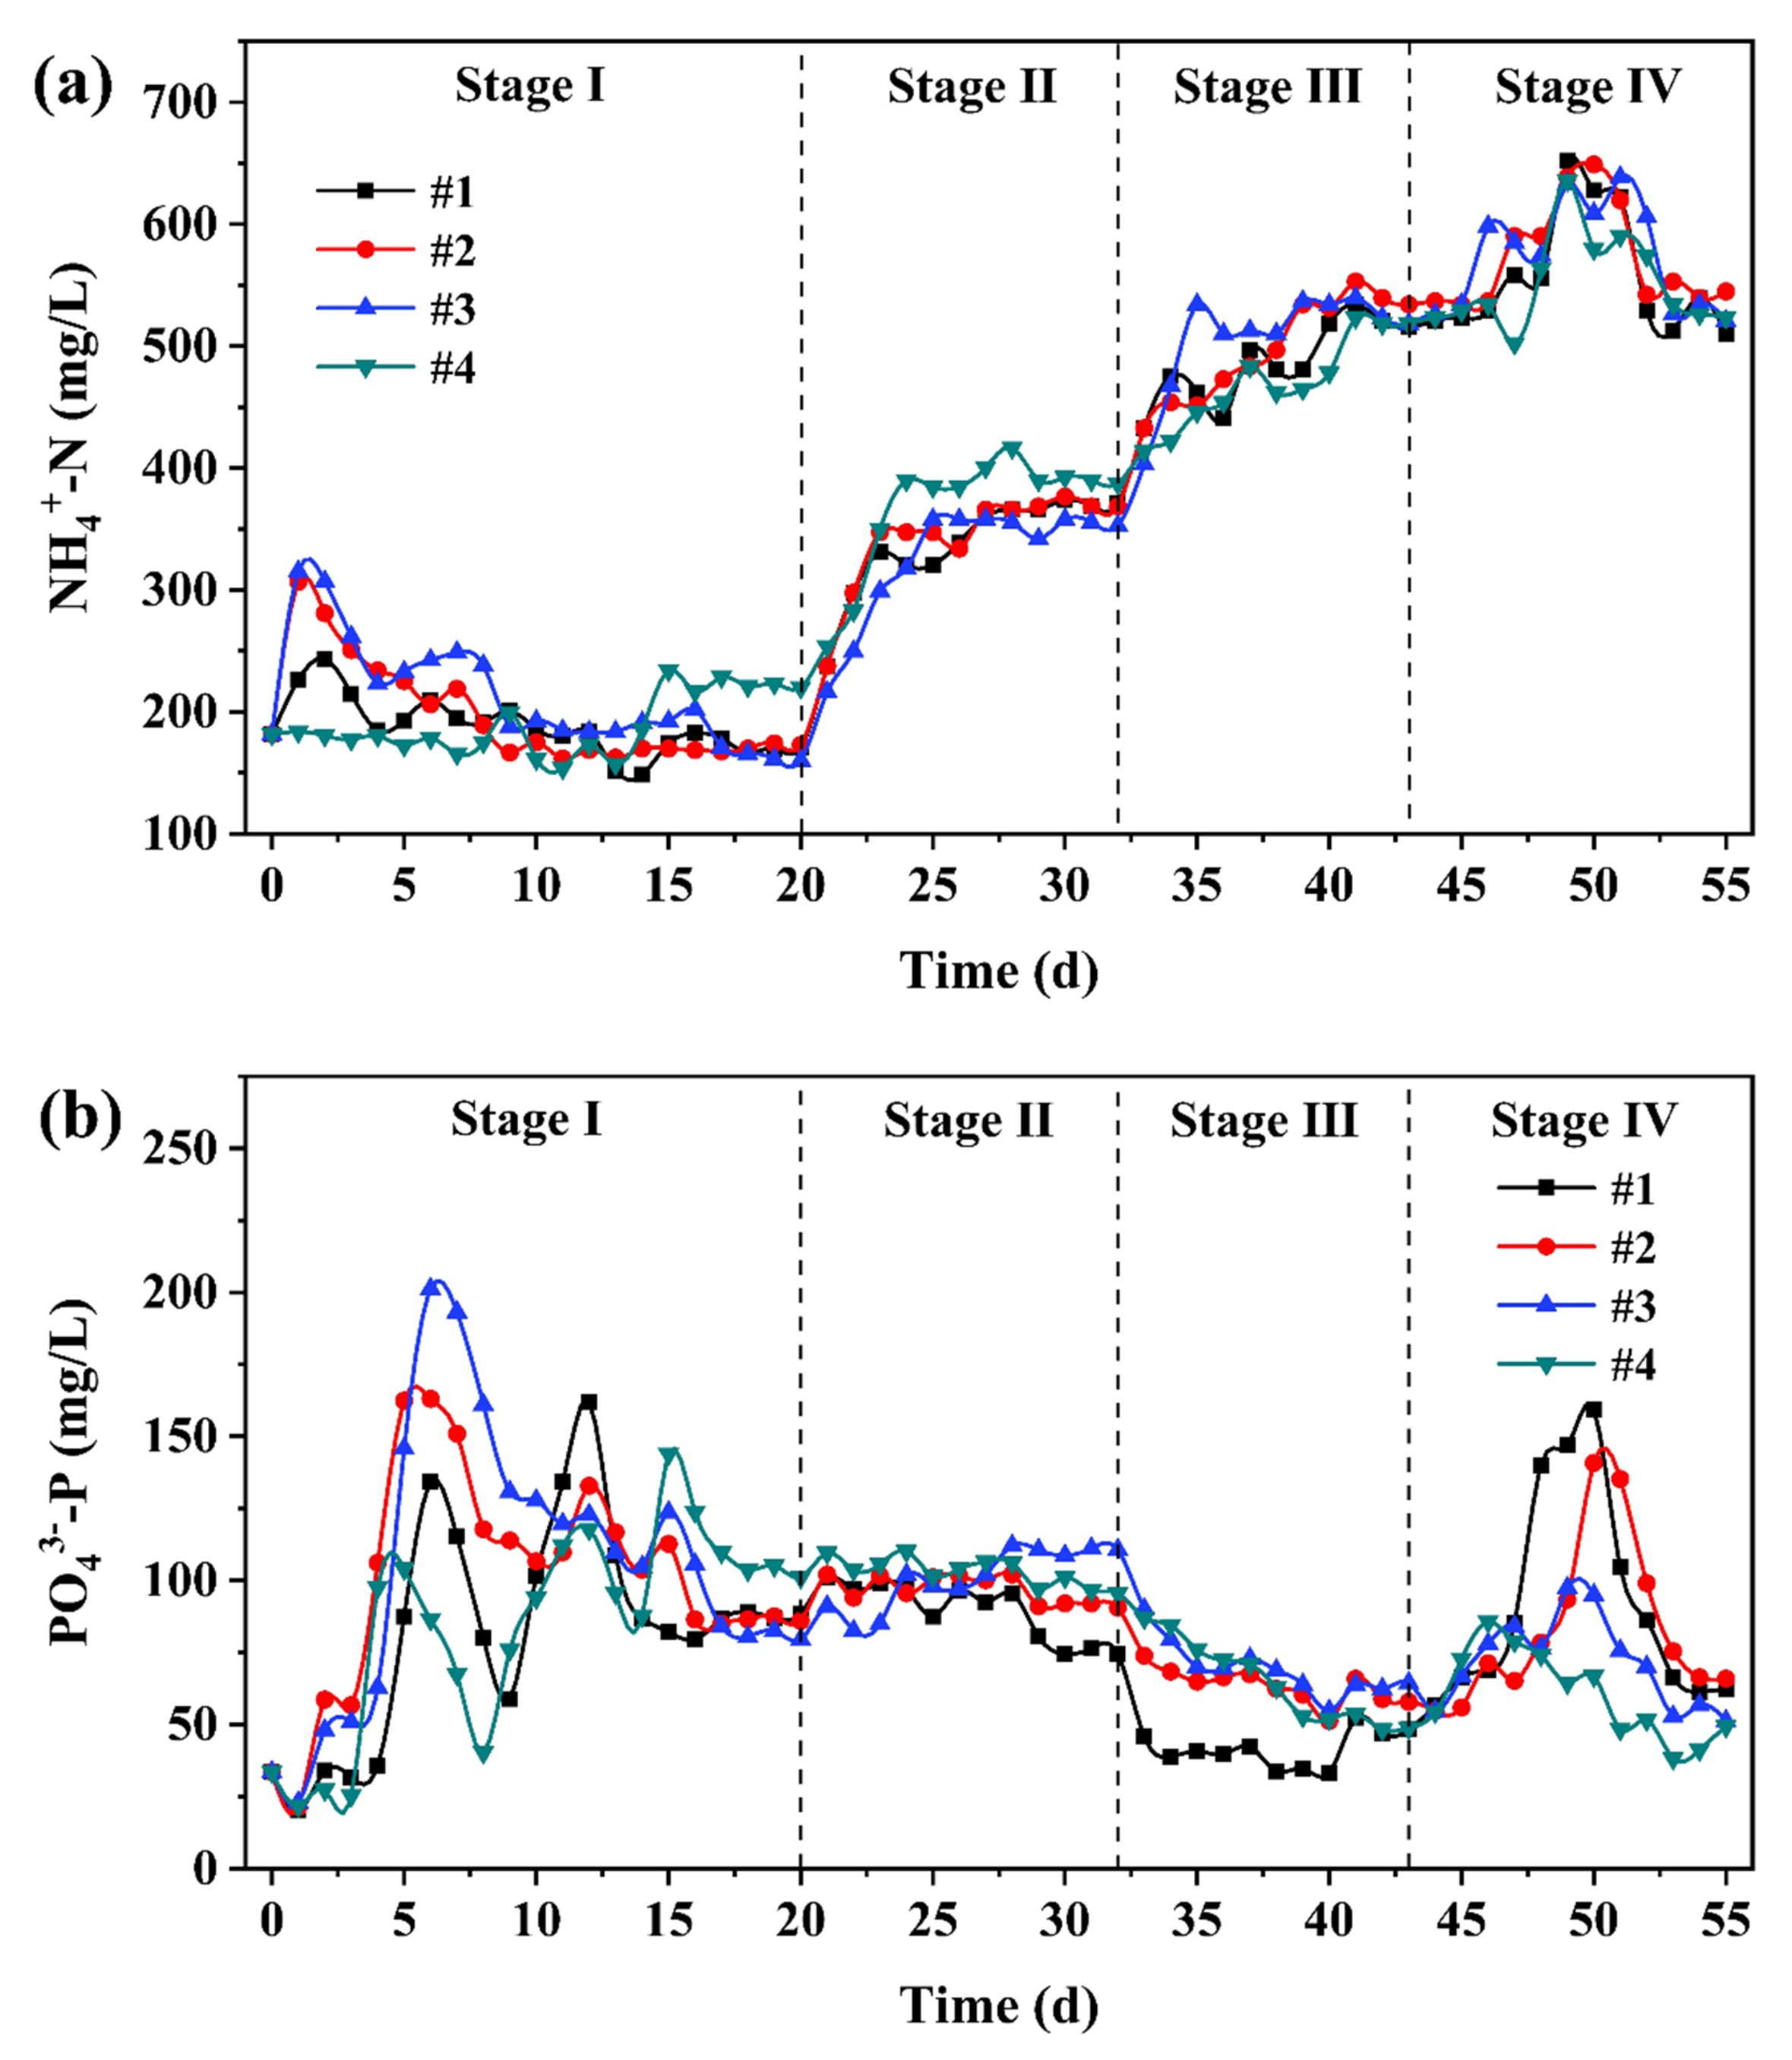
3.1.3. NH4+-N and PO43−-P Release

The degradation of organic matters containing nitrogen or phosphorus will lead to the release of NH4+-N or PO43−-P during the fermentation process. In addition, considering the feasibility of swine manure fermentation broth as an additional carbon source for enhanced nitrogen and phosphorus removal, NH4+-N and PO43−-P produced in the hydrolysis and acidification process are two important parameters.
NH4+-N is a necessary nitrogen source for the growth of anaerobic microorganisms, and can also be used as a buffer in the system, but a high concentration of NH4+-N will inhibit microbial activity [40]. Yang et al. [16] indicated that the NH4+-N concentration of less than 1200 mg/L had no significant effect on the biochemical acidogenic potential of swine wastewater. According to Figure 6a, the low ammonium level in this experiment did not adversely affect the hydrolysis and acidification process. The NH4+-N of reactor #4 remained the highest during the stable phases of stages I and II, illustrating that reactor #4 had the best degradation effect of nitrogenous organic matter in this period, but the SCOD and VFAs concentration of reactor #4 was the lowest in stage II due to the role of methanogens. Furthermore, as the SCOD and NH4+-N of the influent increased in stages II–IV, the NH4+-N of each reactor increased. However, the NH4+-N first rose and then fell in stage IV. The possible reason was that the degradation process of nitrogenous organic matter was inhibited after the reactor failed, and NH4+-N was utilized by microorganisms or reacted with coexisting ions to form precipitates. In stages II–IV, the NH4+-N of each reactor had no significant difference, and the variation trend was roughly the same. This indicated that the release of NH4+-N was less affected by HRT and was mainly related to the influent substrate concentration.
As shown in Figure 6, the release of PO43−-P during the operation process was less than that of NH4+-N, which was also observed by Ucisik and Henze [41] and Banister et al. [42] in their fermentation studies. There are high concentrations of calcium and magnesium in swine manure, which can form chemical precipitates with PO43−-P [43,44], and the precipitation reaction is more complete at higher pH values [45]. In stage II, the PO43−-P decreased the most in reactor #1 and increased the most in reactor #3, which was mainly related to the pH changes of the two reactors (Figure 5 and Figure 6b). Likewise, in stage III, the pH value of each reactor increased, accompanied by a decrease in PO43−-P. To sum, the PO43−-P in the swine manure fermentation broth was negatively correlated with the change of pH in the reactor. The main reason was that the acidic environment could enhance the dissolution of phosphorus, while the alkaline environment could promote the precipitation of phosphorus.

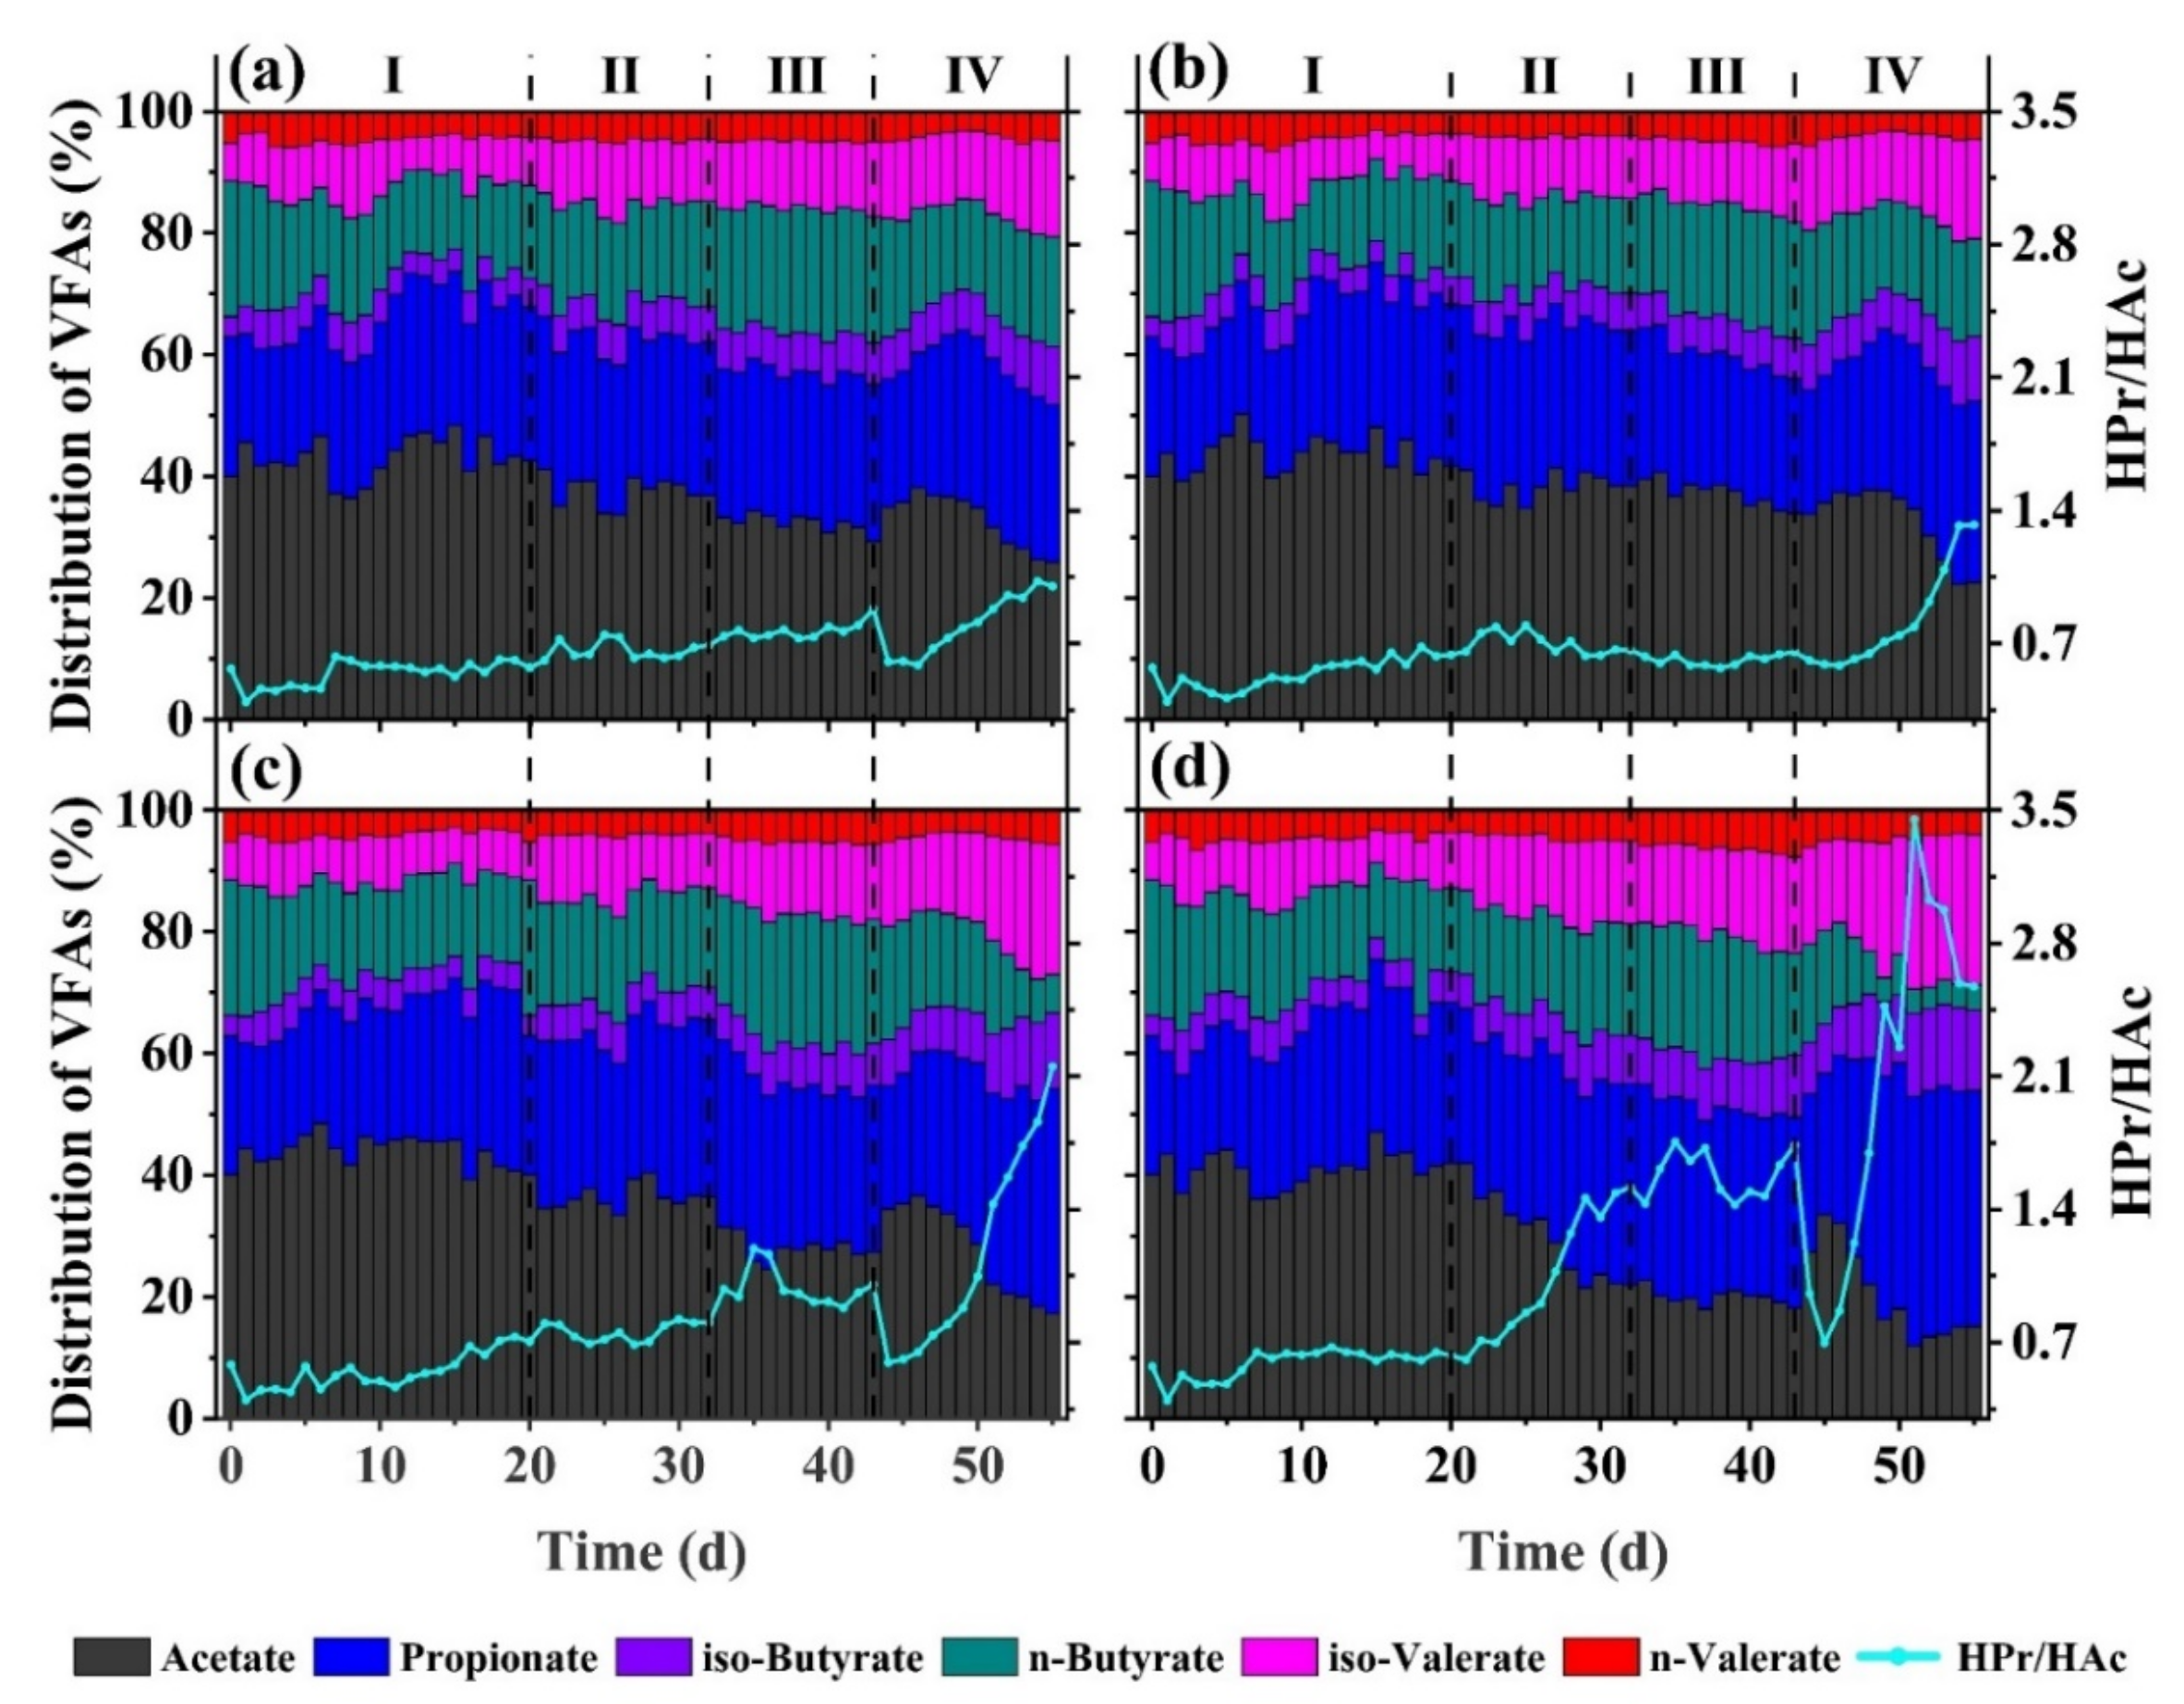
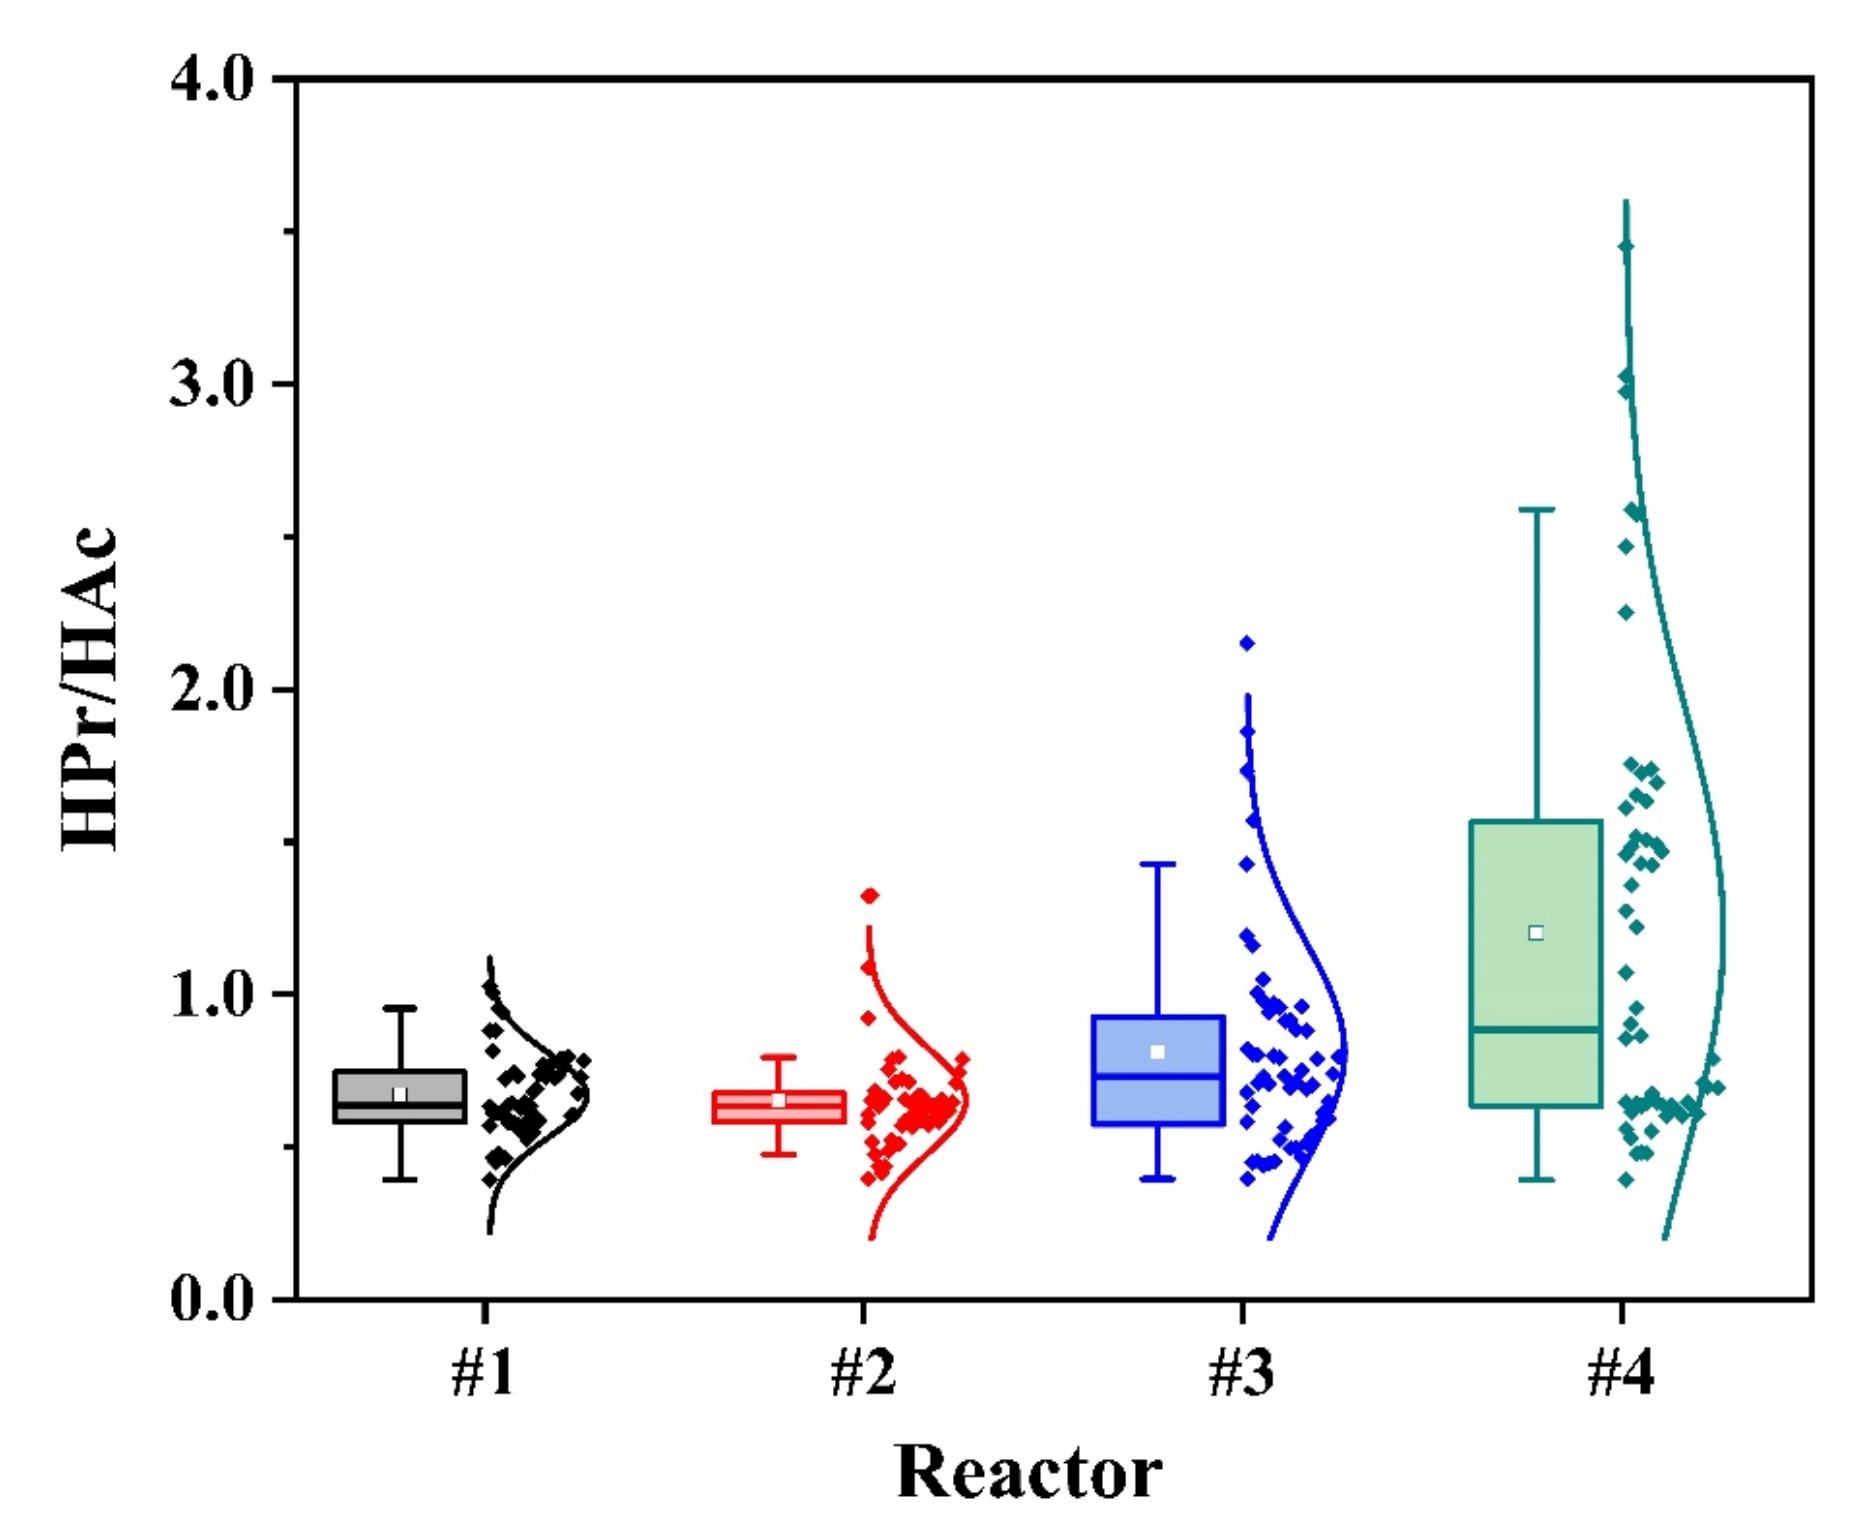
3.2. VFAs Composition Distribution Characteristics

During the hydrolysis and acidification process, the metabolic pathways can be influenced by multifarious factors such as the concentration and characteristics of the substrates, the operational conditions, and the type of inoculum bacteria [46,47]. Generally, the distribution of VFAs can reflect the metabolic pathways during acidogenic fermentation. Accordingly, the variations of VFAs distribution during the continuous operation in four reactors with different HRTs were analyzed in this study. As presented in Figure 7, the percentage of acetate accounting for VFAs in each reactor shows a general downward trend, especially in reactors #3 and #4, where the proportion of acetate decreased from 40.0% on day 0 to 17.2% and 15.1% on day 55, respectively. This is mainly due to the enrichment of methanogens, which use acetate to produce methane. Moreover, the proportions of iso-butyrate and iso-valerate in all reactors indicated an overall upward trend. The proportion of iso-butyrate in reactor #4 increased from 3.2% on day 0 to 13.2% on day 55, and the proportion of iso-valerate increased from 6.2% to 24.8%. This trend can be attributed to the conversion between VFAs through β-oxidation followed by isomerization [48]. On the other hand, the decomposition rates of VFAs with a straight chain (normal form) are greater than those of their respective isomers with a branched chain (iso form) [49].
In terms of the VFAs distribution during the stable phases of stages I–III (Table 3), the order of individual VFA percentage in reactors #1–#3 was acetate > propionate > n-butyrate > iso-valerate > iso-butyrate > n-valerate, which indicated that acetate-type fermentation was the prevailing metabolic pathway of the reactors. Rajagopal and Béline [29] found a consistent order and a similar proportion of acetate (37.2%) corresponding to the highest VFAs production time of swine manure (842 mg/L of VFAs on day 0.5). In stages I–III, the proportion of acetate in reactor #2 had more subtle changes (33.9–50.2%) than in the other reactors, revealing that acetate-type fermentation in reactor #2 was more stable within the influent concentration range of 3670–7660 mg/L. In stage IV of reactors #1–#3 and stages II–IV of reactor #4, the prevailing metabolic pathway changed from acetate-type fermentation to propionate-type fermentation, and the proportion of propionate was 21.1–28.3%, 20.6–29.9%, 20.4–37.0% and 23.3–41.1%, respectively. Meanwhile, acetate (Figure S1 in the Supplementary Materials) and n-butyrate had the greatest reduction in concentration among the VFAs components in each reactor. This can be explained by the fact that the degradation rates of acetate and n-butyrate are higher than that of propionate [49].
The HPr/HAc ratio is an important parameter in the evaluation of the stability of an anaerobic system, and can be used as a warning indicator of reactor failure caused by organic overload [50]. However, the HPr/HAc ratio depends on feedstock composition and operational conditions. Hill et al. [51] considered that an HPr/HAc ratio greater than 1.40 indicates impending reactor failure, while Weiland [52] proposed that the HPr/HAc ratio in a stable system should be lower than 1.00. Variations of HPr/HAc ratio in four reactors during the operation process were statistically evaluated, as shown in Figure 8. The HPr/HAc ratios of reactors #1–#3 basically obey normal distributions, which may make HPr/HAc an effective indicator for monitoring the hydrolysis-acidification system.
Figure 8 illustrates that the longer the HRT, the greater the fluctuation range of the HPr/HAc ratio, and the lower the stability of the hydrolysis -acidification system. The distribution of HPr/HAc ratio in reactor #2 was the most concentrated, ranging from 0.58 to 0.68 (1st and 3rd quartiles). Also, more than 95% of HPr/HAc values in reactors #1 and #2 did not exceed 0.95, which was the upper limit of reactor #1 and could be used to judge the status of the hydrolysis-acidification system. It can be seen from Figure 7 that the stages of each reactor with HPr/HAc ratio greater than 0.95 were stage IV of the reactors #1 and #2, stages III and IV of reactor #3, and stages II–IV of reactor #4. Obviously, the HPr/HAc ratios of reactors #3 and #4 in stages III and IV were large, indicating poor system stability, while the VFAs production performances of reactors #1 and #2 were relatively stable in long-term operation. The HPr/HAc ratio of reactor #2 (0.57–0.65) was significantly kept at the minimum among all the reactors, especially in stage III.
The above results suggest that a high influent concentration may change the distribution of VFAs and affect the prevailing metabolic pathway in the reactors. The continuous fermentation at an HRT of 2.5 days was conducive to methane production, while the hydrolysis-acidification system was more stable at an HRT of 1.5 days, which promoted VFAs production and reduced VFAs consumption. In addition, the HPr/HAc ratio was a reliable indicator for assessing the performance of VFAs production and the stability of the continuous hydrolysis-acidification system. According to the HPr/HAc ratio, the stable operation conditions of the system for VFAs production were an HRT of 1.5 days and an influent SCOD of 7660 mg/L.

3.3. Application Feasibility Analysis of Fermentation Broth

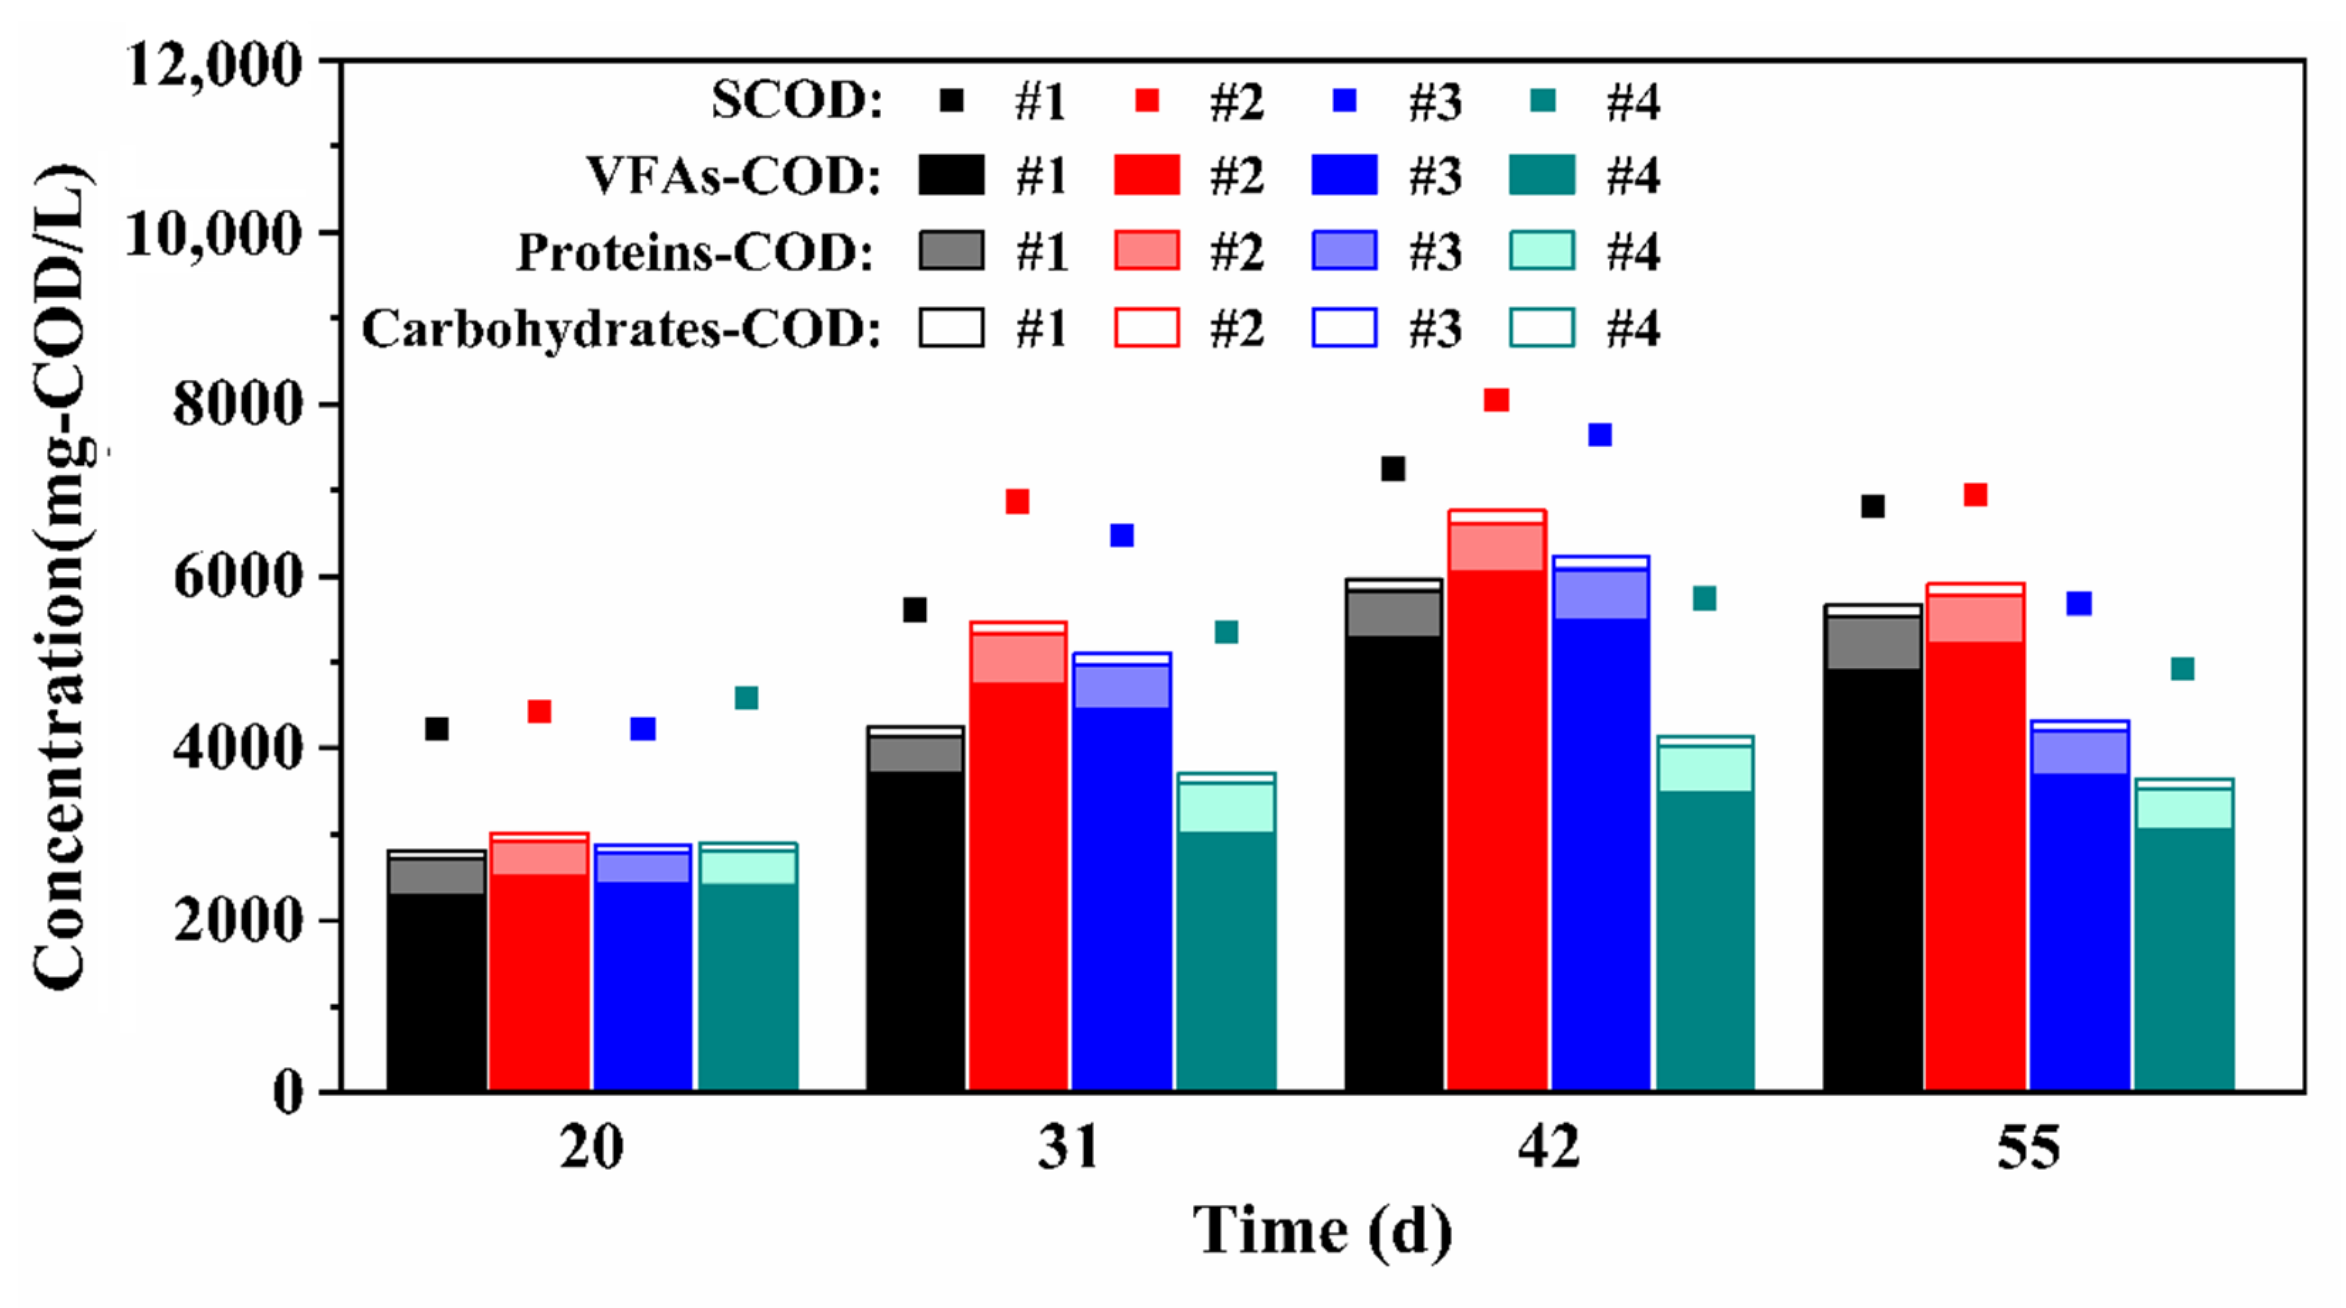
3.3.1. Distribution of Organic Carbon Sources

Figure 9 provides the distribution of organic carbon sources in four continuous flow reactors at different HRTs on days 20, 31, 42 and 55, which were in the stable phases of stages I–IV, respectively. The main components of SCOD were VFAs, soluble proteins and soluble carbohydrates. The variations of soluble proteins and soluble carbohydrates are shown in Figures S2 and S3 in the Supplementary Materials. Besides, the remainder of SCOD may include lipids, long-chain fatty acids, amino acids, some peptides insensitive to Coomassie brilliant blue reagent, other soluble C1–C5 metabolic products, etc., [53]. As illustrated in Figure 9, VFAs were the largest component of SCOD in the four reactors. In most cases, the VFAs/SCOD ratio of reactor #2 is the largest among all reactors, with the ratios of 57%, 69%, 75% and 75% on days 20, 31, 42 and 55, respectively. Rajagopal and Béline [29] examined the anaerobic fermentation potential of various organic substrates and determined that the VFAs/SCOD ratio of pretreated and untreated secondary sludge was in the range of 66–70%, whereas that of swine and cattle manure was 34–39%. Garcia-Aguirre et al. [54] found that during the fermentation of slaughterhouse wastewater, paper mill wastewater, winery wastewater, crude glycerol, sewage sludge, municipal solid waste, and meat and bone meal at an initial pH of 10 and a temperature of 35 °C, the VFAs/SCOD ratios can reach 11%, 37%, 57%, 47%, 50%, 94% and 52%, respectively. In this study, the VFAs/SCOD ratios of reactors #1–#4 were all more than 50% during the stable phases, and all reached the maximum values in stage IV, which were 82%, 79%, 79% and 66%, respectively. In conclusion, a fermentation broth with a high VFAs/SCOD ratio could be acquired in the continuous flow reactors after the initial pH of swine manure was adjusted to 10.0, which indicated that swine manure had immense potential for VFAs production, and the fermentation broth rich in VFAs had broad application prospects.

3.3.2. Availability Analysis of Fermentation Broth Applied to Enhanced Nitrogen and Phosphorus Removal

When the swine manure fermentation broth is used as an additional carbon source for enhanced nitrogen and phosphorus removal, the presence of NH4+-N and PO43−-P in the fermentation broth will consume VFAs and reduce the utilization rate of carbon source. Studies have shown that 2.86 and 6–9 mg COD are needed to remove 1 mg N and 1 mg P from wastewater by biological methods, respectively [9]. During the stable phases of stage II, the mean concentrations of NH4+-N and PO43−-P in the fermentation broth of reactor #2 were 371 and 91 mg/L, respectively, and the available VFAs in reactor #2 were calculated to be 2880 mg-COD/L, accounting for 41% of the original SCOD. In stage III, after reactor #2 operates stably, it is calculated that the VFAs in the fermentation broth need to consume 2070 mg-COD/L to remove NH4+-N and PO43−-P, and the remaining 3995 mg-COD/L VFAs account for 49% of the original SCOD in the fermentation broth. Based on calculations, it is feasible for fermentation broth to be used as a high-quality carbon source for enhanced biological nitrogen and phosphorus removal. Furthermore, other easily degradable carbon sources produced in the hydrolysis and acidification of swine manure can also be utilized by denitrifying bacteria and phosphorus accumulating organisms (PAOs). Su et al. [55] demonstrated that cysteine in sludge fermentation broth can reduce excessive reactive nitrogen species produced during the denitrification process and recover the biological nutrient removal performance. According to Nguyen et al. [56], Tetrasphaera, an abundant PAO in enhanced biological phosphorus removal (EBPR) systems, is able to absorb amino acids, glucose, and acetate.
The effect of enhanced nitrogen and phosphorus removal depends not only on the content of VFAs, but also on the composition of VFAs. For the denitrification process, the denitrifying bacteria consume acetate first, followed by butyrate, then propionate, and finally valerate [57]. Furthermore, the average specific denitrification rate of acetate is more than double that of propionate [57]. This indicates that the concentration and proportion of acetate should be augmented when the swine manure fermentation broth is utilized as an additional carbon source of denitrification. Accordingly, the fermentation broth produced by reactor #2 in stage II is more suitable for denitrification as an additional carbon source. Previous studies have demonstrated that Accumulibacter PAOs have similar uptake rates of acetate and propionate, while different species of glycogen accumulating organisms seem to have different preferences for carbon sources [10,58,59]. Nevertheless, a better phosphorus removal performance is frequently observed in propionate-fed EBPR systems [60]. Chen et al. [61] suggested that increasing propionate content would result in superior EBPR in long-term cultivation. Therefore, on the basis of the concentration and proportion of propionate, the fermentation broth produced in stage II of reactor #3 is more conducive to improving phosphorus removal efficiency.
From the distribution of VFAs in the fermentation broth, the high-quality carbon source obtained from swine manure in this study is expected to have important value in improving the micro-ecological environment and population structure of nitrogen and phosphorus removal microorganisms.

4. Conclusions

This study ascertained that the optimal operation conditions for continuous stable production of VFAs by hydrolysis and acidification of swine manure were an HRT of 1.5 days and influent SCOD of 7660 mg/L, under which the VFAs concentration attained 6065 mg-COD/L continuously. The remarkable VFAs production performance was attributable to the stabilization of acetate-type fermentation and the inhibition of methanogenesis. An application feasibility analysis suggested that the fermentation broth could be utilized as a high-quality external carbon source for enhanced nitrogen and phosphorus removal. The findings of this study have a number of practical implications for the recycling of resources from swine manure.

Supplementary Materials

The following supporting information can be downloaded at: https://www.mdpi.com/article/10.3390/w14121935/s1, Figure S1: Changes in acetate (HAc) concentration during the operation process; Figure S2: Changes in soluble protein concentration during the operation process; Figure S3: Changes in soluble carbohydrate concentration during the operation process; Table S1. Operational parameters of the experiment.

Author Contributions

Conceptualization, Z.W. and P.L.; methodology, Z.W. and W.W.; validation, Z.W., P.L. and Y.L.; formal analysis, Z.W.; investigation, Z.W. and Y.L.; resources, W.W., P.L. and J.W.; data curation, Z.W.; writing—original draft preparation, Z.W.; writing—review and editing, W.W. and P.L.; visualization, Z.W. and P.L.; supervision, P.L.; funding acquisition, P.L. and J.W. All authors have read and agreed to the published version of the manuscript.

Funding

This research was funded by the National Natural Science Foundation of China (41977114), the Guangdong Basic and Applied Basic Research Foundation, China (2020A1515011113), and the Guangzhou Science and Technology Project, China (202002030455).

Institutional Review Board Statement

Not applicable.

Informed Consent Statement

Not applicable.

Data Availability Statement

The data presented in this study are available on request from the corresponding author. The data are not publicly available to avoid possible misuse or unauthorized use of them.

Conflicts of Interest

The authors declare that they have no conflict of interest.

References

  1. Global Pork Meat Market 2020–2024. Available online: https://www.reportlinker.com/p05144646/Global-Pork-Meat-Market.html (accessed on 29 May 2022).
  2. Cheng, D.L.; Ngo, H.H.; Guo, W.S.; Chang, S.W.; Nguyen, D.D.; Kumar, S.M. Microalgae biomass from swine wastewater and its conversion to bioenergy. Bioresour. Technol. 2019, 275, 109–122. [Google Scholar] [CrossRef] [PubMed]
  3. Aboudi, K.; Álvarez-Gallego, C.J.; Romero-García, L.I. Semi-continuous anaerobic co-digestion of sugar beet byproduct and pig manure: Effect of the organic loading rate (OLR) on process performance. Bioresour. Technol. 2015, 194, 283–290. [Google Scholar] [CrossRef] [PubMed]
  4. Cheng, H.H.; Narindri, B.; Chu, H.; Whang, L.M. Recent advancement on biological technologies and strategies for resource recovery from swine wastewater. Bioresour. Technol. 2020, 303, 13. [Google Scholar] [CrossRef] [PubMed]
  5. Zhen, G.; Lu, X.; Kato, H.; Zhao, Y.; Li, Y.-Y. Overview of pretreatment strategies for enhancing sewage sludge disintegration and subsequent anaerobic digestion: Current advances, full-scale application and future perspectives. Renew. Sustain. Energy Rev. 2017, 69, 559–577. [Google Scholar] [CrossRef]
  6. Huang, L.; Chen, Z.; Xiong, D.; Wen, Q.; Ji, Y. Oriented acidification of wasted activated sludge (WAS) focused on odd-carbon volatile fatty acid (VFA): Regulation strategy and microbial community dynamics. Water Res. 2018, 142, 256–266. [Google Scholar] [CrossRef]
  7. Raychaudhuri, A.; Behera, M. Enhancement of bioelectricity generation by integrating acidogenic compartment into a dual-chambered microbial fuel cell during rice mill wastewater treatment. Process Biochem. 2021, 105, 19–26. [Google Scholar] [CrossRef]
  8. Cho, S.H.; Kim, J.; Han, J.; Lee, D.; Kim, H.J.; Kim, Y.T.; Cheng, X.; Xu, Y.; Lee, J.; Kwon, E.E. Bioalcohol production from acidogenic products via a two-step process: A case study of butyric acid to butanol. Appl. Energy 2019, 252, 9. [Google Scholar] [CrossRef]
  9. Liu, W.; Yang, H.; Ye, J.J.; Luo, J.H.; Li, Y.Y.; Liu, J.Y. Short-chain fatty acids recovery from sewage sludge via acidogenic fermentation as a carbon source for denitrification: A review. Bioresour. Technol. 2020, 311, 10. [Google Scholar] [CrossRef]
  10. Wang, D.Q.; Tooker, N.B.; Srinivasan, V.; Li, G.Y.; Fernandez, L.A.; Schauer, P.; Menniti, A.; Maher, C.; Bott, C.B.; Dombrowski, P.; et al. Side-stream enhanced biological phosphorus removal (S2EBPR) process improves system performance—A full-scale comparative study. Water Res. 2019, 167, 14. [Google Scholar] [CrossRef]
  11. Perimenis, A.; Nicolay, T.; Leclercq, M.; Gerin, P.A. Comparison of the acidogenic and methanogenic potential of agroindustrial residues. Waste Manag. 2018, 72, 178–185. [Google Scholar] [CrossRef]
  12. Lee, W.S.; Chua, A.S.M.; Yeoh, H.K.; Ngoh, G.C. A review of the production and applications of waste-derived volatile fatty acids. Chem. Eng. J. 2014, 235, 83–99. [Google Scholar] [CrossRef]
  13. Lin, L.; Wan, C.; Liu, X.; Lee, D.-J.; Lei, Z.; Zhang, Y.; Tay, J.H. Effect of initial pH on mesophilic hydrolysis and acidification of swine manure. Bioresour. Technol. 2013, 136, 302–308. [Google Scholar] [CrossRef] [PubMed] [Green Version]
  14. Lin, L.; Wen, L.; Chen, S.; Yang, X.; Liu, X.; Wan, C. Effect of alkaline treatment pattern on anaerobic fermentation of swine manure. Process Biochem. 2015, 50, 1710–1717. [Google Scholar] [CrossRef]
  15. Huang, W.; Huang, W.; Yuan, T.; Zhao, Z.; Cai, W.; Zhang, Z.; Lei, Z.; Feng, C. Volatile fatty acids (VFAs) production from swine manure through short-term dry anaerobic digestion and its separation from nitrogen and phosphorus resources in the digestate. Water Res. 2016, 90, 344–353. [Google Scholar] [CrossRef] [PubMed] [Green Version]
  16. Yang, K.; Oh, C.; Hwang, S. Optimizing volatile fatty acid production in partial acidogenesis of swine wastewater. Water Sci. Technol. 2004, 50, 169–176. [Google Scholar] [CrossRef] [PubMed]
  17. Lim, S.-J.; Kim, B.J.; Jeong, C.-M.; Choi, J.-d.-r.; Ahn, Y.H.; Chang, H.N. Anaerobic organic acid production of food waste in once-a-day feeding and drawing-off bioreactor. Bioresour. Technol. 2008, 99, 7866–7874. [Google Scholar] [CrossRef] [PubMed]
  18. Kim, W.; Hwang, K.; Shin, S.G.; Lee, S.; Hwang, S. Effect of high temperature on bacterial community dynamics in anaerobic acidogenesis using mesophilic sludge inoculum. Bioresour. Technol. 2010, 101, S17–S22. [Google Scholar] [CrossRef] [PubMed]
  19. Kim, W.; Shin, S.G.; Lim, J.; Hwang, S. Effect of temperature and hydraulic retention time on volatile fatty acid production based on bacterial community structure in anaerobic acidogenesis using swine wastewater. Bioprocess Biosyst. Eng. 2013, 36, 791–798. [Google Scholar] [CrossRef]
  20. Liu, H.; Han, P.; Liu, H.; Zhou, G.; Fu, B.; Zheng, Z. Full-scale production of VFAs from sewage sludge by anaerobic alkaline fermentation to improve biological nutrients removal in domestic wastewater. Bioresour. Technol. 2018, 260, 105–114. [Google Scholar] [CrossRef]
  21. Kim, H.; Kim, J.; Shin, S.G.; Hwang, S.; Lee, C. Continuous fermentation of food waste leachate for the production of volatile fatty acids and potential as a denitrification carbon source. Bioresour. Technol. 2016, 207, 440–445. [Google Scholar] [CrossRef]
  22. Zheng, X.; Chen, Y.; Liu, C. Waste activated sludge alkaline fermentation liquid as carbon source for biological nutrients removal in anaerobic followed by alternating aerobic-anoxic sequencing batch reactors. Chin. J. Chem. Eng. 2010, 18, 478–485. [Google Scholar] [CrossRef]
  23. Frison, N.; Di Fabio, S.; Cavinato, C.; Pavan, P.; Fatone, F. Best available carbon sources to enhance the via-nitrite biological nutrients removal from supernatants of anaerobic co-digestion. Chem. Eng. J. 2013, 215–216, 15–22. [Google Scholar] [CrossRef]
  24. Federation, W.E.; Association, A. Standard Methods for the Examination of Water and Wastewater; American Public Health Association (APHA): Washington, DC, USA, 2005. [Google Scholar]
  25. Bradford, M.M. A rapid and sensitive method for the quantitation of microgram quantities of protein utilizing the principle of protein-dye binding. Anal. Biochem. 1976, 72, 248–254. [Google Scholar] [CrossRef]
  26. Roe, J.H. The determination of sugar in blood and spinal fluid with anthrone reagent. J. Biol. Chem. 1955, 212, 335–343. [Google Scholar] [CrossRef]
  27. Donoso-Bravo, A.; Pérez-Elvira, S.; Aymerich, E.; Fdz-Polanco, F. Assessment of the influence of thermal pre-treatment time on the macromolecular composition and anaerobic biodegradability of sewage sludge. Bioresour. Technol. 2011, 102, 660–666. [Google Scholar] [CrossRef] [PubMed]
  28. Wainaina, S.; Awasthi, M.K.; Horváth, I.S.; Taherzadeh, M.J. Anaerobic digestion of food waste to volatile fatty acids and hydrogen at high organic loading rates in immersed membrane bioreactors. Renew. Energy 2020, 152, 1140–1148. [Google Scholar] [CrossRef]
  29. Rajagopal, R.; Béline, F. Anaerobic hydrolysis and acidification of organic substrates: Determination of anaerobic hydrolytic potential. Bioresour. Technol. 2011, 102, 5653–5658. [Google Scholar] [CrossRef]
  30. Chen, Y.; Wen, Y.; Zhou, J.; Xu, C.; Zhou, Q. Effects of pH on the hydrolysis of lignocellulosic wastes and volatile fatty acids accumulation: The contribution of biotic and abiotic factors. Bioresour. Technol. 2012, 110, 321–329. [Google Scholar] [CrossRef]
  31. Cao, Q.; Zhang, W.; Lian, T.; Wang, S.; Dong, H. Short chain carboxylic acids production and dynamicity of microbial communities from co-digestion of swine manure and corn silage. Bioresour. Technol. 2021, 320, 124400. [Google Scholar] [CrossRef]
  32. Chen, Y.; Jiang, S.; Yuan, H.; Zhou, Q.; Gu, G. Hydrolysis and acidification of waste activated sludge at different pHs. Water Res. 2007, 41, 683–689. [Google Scholar] [CrossRef]
  33. Ahring, B.K.; Sandberg, M.; Angelidaki, I. Volatile fatty acids as indicators of process imbalance in anaerobic digestors. Appl. Microbiol. Biotechnol. 1995, 43, 559–565. [Google Scholar] [CrossRef]
  34. Zhang, L.; Liu, H.; Zheng, Z.; Ma, H.; Yang, M.; Liu, H. Continuous liquid fermentation of pretreated waste activated sludge for high rate volatile fatty acids production and online nutrients recovery. Bioresour. Technol. 2018, 249, 962–968. [Google Scholar] [CrossRef] [PubMed]
  35. Owusu-Agyeman, I.; Plaza, E.; Cetecioglu, Z. Production of volatile fatty acids through co-digestion of sewage sludge and external organic waste: Effect of substrate proportions and long-term operation. Waste Manag. 2020, 112, 30–39. [Google Scholar] [CrossRef] [PubMed]
  36. Ge, S.; Usack, J.G.; Spirito, C.M.; Angenent, L.T. Long-term n-caproic acid production from yeast-fermentation beer in an anaerobic bioreactor with continuous product extraction. Environ. Sci. Technol. 2015, 49, 8012–8021. [Google Scholar] [CrossRef] [PubMed]
  37. Hwang, S.; Lee, Y.; Yang, K.Y. Maximization of acetic acid production in partial acidogenesis of swine wastewater. Biotechnol. Bioeng. 2001, 75, 521–529. [Google Scholar] [CrossRef]
  38. Lee, D.H.; Behera, S.K.; Kim, J.W.; Park, H.-S. Methane production potential of leachate generated from Korean food waste recycling facilities: A lab-scale study. Waste Manag. 2009, 29, 876–882. [Google Scholar] [CrossRef]
  39. Mao, C.; Feng, Y.; Wang, X.; Ren, G. Review on research achievements of biogas from anaerobic digestion. Renew. Sustain. Energy Rev. 2015, 45, 540–555. [Google Scholar] [CrossRef]
  40. Rajagopal, R.; Massé, D.I.; Singh, G. A critical review on inhibition of anaerobic digestion process by excess ammonia. Bioresour. Technol. 2013, 143, 632–641. [Google Scholar] [CrossRef]
  41. Ucisik, A.S.; Henze, M. Biological hydrolysis and acidification of sludge under anaerobic conditions: The effect of sludge type and origin on the production and composition of volatile fatty acids. Water Res. 2008, 42, 3729–3738. [Google Scholar] [CrossRef]
  42. Banister, S.S.; Pitman, A.R.; Pretorius, W.A. The solubilisation of N and P during primary sludge acid fermentation and precipitation of the resultant P. Water SA 1998, 24, 337–342. [Google Scholar]
  43. Wild, D.; Kisliakova, A.; Siegrist, H. Prediction of recycle phosphorus loads from anaerobic digestion. Water Res. 1997, 31, 2300–2308. [Google Scholar] [CrossRef]
  44. Li, H.; Tan, F.; Ke, L.; Xia, D.; Wang, Y.; He, N.; Zheng, Y.; Li, Q. Mass balances and distributions of C, N, and P in the anaerobic digestion of different substrates and relationships between products and substrates. Chem. Eng. J. 2016, 287, 329–336. [Google Scholar] [CrossRef]
  45. Zhao, J.; Yang, Q.; Li, X.; Wang, D.; An, H.; Xie, T.; Xu, Q.; Deng, Y.; Zeng, G. Effect of initial pH on short chain fatty acid production during the anaerobic fermentation of membrane bioreactor sludge enhanced by alkyl polyglcoside. Int. Biodeterior. Biodegrad. 2015, 104, 283–289. [Google Scholar] [CrossRef]
  46. Zhou, M.; Yan, B.; Wong, J.W.C.; Zhang, Y. Enhanced volatile fatty acids production from anaerobic fermentation of food waste: A mini-review focusing on acidogenic metabolic pathways. Bioresour. Technol. 2018, 248, 68–78. [Google Scholar] [CrossRef] [PubMed]
  47. Jomnonkhaow, U.; Uwineza, C.; Mahboubi, A.; Wainaina, S.; Reungsang, A.; Taherzadeh, M.J. Membrane bioreactor-assisted volatile fatty acids production and in situ recovery from cow manure. Bioresour. Technol. 2021, 321, 124456. [Google Scholar] [CrossRef]
  48. Parawira, W.; Murto, M.; Read, J.S.; Mattiasson, B. Volatile fatty acid production during anaerobic mesophilic digestion of solid potato waste. J. Chem. Technol. Biotechnol. 2004, 79, 673–677. [Google Scholar] [CrossRef]
  49. Wang, Q.; Kuninobu, M.; Ogawa, H.I.; Kato, Y. Degradation of volatile fatty acids in highly efficient anaerobic digestion. Biomass Bioenergy 1999, 16, 407–416. [Google Scholar] [CrossRef]
  50. Marchaim, U.; Krause, C. Propionic to acetic acid ratios in overloaded anaerobic digestion. Bioresour. Technol. 1993, 43, 195–203. [Google Scholar] [CrossRef]
  51. Hill, D.T.; Cobb, S.A.; Bolte, J.P. Using volatile fatty acid relationships to predict anaerobic digester failure. Trans. Am. Soc. Agric. Eng. 1987, 30, 496–501. [Google Scholar] [CrossRef]
  52. Weiland, P. Wichtige messdaten für den prozessablauf und stand der technik in der praxis. Gülzower Fachgespräche 2008, 27, 17–31. [Google Scholar]
  53. Yang, Y.; Yang, F.; Huang, W.; Huang, W.; Li, F.; Lei, Z.; Zhang, Z. Enhanced anaerobic digestion of ammonia-rich swine manure by zero-valent iron: With special focus on the enhancement effect on hydrogenotrophic methanogenesis activity. Bioresour. Technol. 2018, 270, 172–179. [Google Scholar] [CrossRef] [PubMed]
  54. Garcia-Aguirre, J.; Aymerich, E.; de Goñi, J.G.M.; Esteban-Gutiérrez, M. Selective VFA production potential from organic waste streams: Assessing temperature and pH influence. Bioresour. Technol. 2017, 244, 1081–1088. [Google Scholar] [CrossRef] [PubMed]
  55. Su, Y.; Chen, Y.; Zheng, X.; Wan, R.; Huang, H.; Li, M.; Wu, L. Using sludge fermentation liquid to reduce the inhibitory effect of copper oxide nanoparticles on municipal wastewater biological nutrient removal. Water Res. 2016, 99, 216–224. [Google Scholar] [CrossRef] [PubMed] [Green Version]
  56. Nguyen, H.T.T.; Le, V.Q.; Hansen, A.A.; Nielsen, J.L.; Nielsen, P.H. High diversity and abundance of putative polyphosphate-accumulating Tetrasphaera-related bacteria in activated sludge systems. FEMS Microbiol. Ecol. 2011, 76, 256–267. [Google Scholar] [CrossRef] [Green Version]
  57. Elefsiniotis, P.; Wareham, D.G. Utilization patterns of volatile fatty acids in the denitrification reaction. Enzym. Microb. Technol. 2007, 41, 92–97. [Google Scholar] [CrossRef]
  58. Oehmen, A.; Yuan, Z.; Blackall, L.L.; Keller, J. Comparison of acetate and propionate uptake by polyphosphate accumulating organisms and glycogen accumulating organisms. Biotechnol. Bioeng. 2005, 91, 162–168. [Google Scholar] [CrossRef]
  59. Dai, Y.; Yuan, Z.; Wang, X.; Oehmen, A.; Keller, J. Anaerobic metabolism of Defluviicoccus vanus related glycogen accumulating organisms (GAOs) with acetate and propionate as carbon sources. Water Res. 2007, 41, 1885–1896. [Google Scholar] [CrossRef]
  60. Shen, N.; Zhou, Y. Enhanced biological phosphorus removal with different carbon sources. Appl. Microbiol. Biotechnol. 2016, 100, 4735–4745. [Google Scholar] [CrossRef]
  61. Chen, Y.; Randall, A.A.; McCue, T. The efficiency of enhanced biological phosphorus removal from real wastewater affected by different ratios of acetic to propionic acid. Water Res. 2004, 38, 27–36. [Google Scholar] [CrossRef]
Figure 1. Schematic diagram of continuous hydrolysis-acidification reactors.
Water 14 01935 g001
Figure 2. Changes of SCOD under different HRTs and influent SCOD during the continuous operation.
Water 14 01935 g002
Figure 3. Changes of VFAs concentration under different HRTs and influent SCOD.
Water 14 01935 g003
Figure 4. Changes of acidification degree during the operation process.
Water 14 01935 g004
Figure 5. Changes of pH during the operation process.
Water 14 01935 g005
Figure 6. Changes in the concentrations of (a) NH4+-N and (b) PO43−-P during the operation process.
Water 14 01935 g006
Figure 7. Variations of VFAs distribution and HPr/HAc (propionate/acetate) ratio during the continuous operation of reactors (a) #1, (b) #2, (c) #3, (d) #4.
Water 14 01935 g007
Figure 8. Variations of HPr/HAc ratio in four reactors during the operation process.
Water 14 01935 g008
Figure 9. Distribution of organic carbon sources during the operation process.
Water 14 01935 g009
Table 1. Characteristics of swine manure.
ParameterUnitValue
pH7.1 ± 0.1
Total solids (TS)%26.9 ± 0.1
Volatile solids/total solids (VS/TS)%83.1 ± 0.2
Soluble chemical oxygen demand (SCOD)mg/L71,867 ± 1820
Total chemical oxygen demand (TCOD)mg/L191,822 ± 7705
Soluble proteinsmg/L10,073 ± 368
Soluble carbohydratesmg/L2714 ± 93
Ammonium nitrogen (NH4+-N)mg/L1954 ± 78
Soluble phosphorus (PO43−-P)mg/L664 ± 41
Table 2. The hydrolysis degree of four reactors during the stable phases of stages I–IV.
ReactorHydrolysis Degree (%)
Stage IStage IIStage IIIStage IV
#156.5 ± 0.449.7 ± 0.546.2 ± 0.429.4 ± 0.6
#259.1 ± 0.362.2 ± 1.651.0 ± 0.229.9 ± 0.8
#356.9 ± 0.458.1 ± 0.948.3 ± 0.224.3 ± 0.3
#461.7 ± 0.447.9 ± 0.337.8 ± 2.121.1 ± 0.5
Table 3. The mean and standard deviation of the percentage of individual VFA accounting for VFAs in four reactors during the stable phases of stages I–IV.
ReactorStageAcetate
(%)
Propionate
(%)
iso-Butyrate
(%)
n-Butyrate
(%)
iso-Valerate
(%)
n-Valerate
(%)
#1I42.6 ± 0.725.9 ± 0.54.6 ± 0.115.0 ± 0.77.7 ± 0.34.2 ± 0.1
II37.4 ± 1.125.0 ± 0.46.0 ± 0.116.7 ± 1.210.1 ± 0.04.8 ± 0.4
III31.2 ± 1.725.3 ± 0.56.6 ± 0.120.5 ± 0.211.4 ± 0.85.0 ± 0.2
IV26.7 ± 1.226.4 ± 0.59.0 ± 0.617.7 ± 0.315.2 ± 0.94.9 ± 0.4
#2I41.6 ± 1.327.1 ± 0.44.4 ± 0.215.9 ± 0.77.2 ± 0.53.8 ± 0.2
II38.9 ± 0.825.6 ± 0.26.0 ± 0.115.4 ± 0.410.2 ± 0.14.0 ± 0.0
III34.8 ± 1.222.2 ± 0.16.4 ± 0.319.4 ± 0.511.7 ± 1.05.6 ± 0.3
IV23.7 ± 2.229.3 ± 0.710.2 ± 0.616.4 ± 0.416.0 ± 1.04.5 ± 0.3
#3I40.9 ± 0.529.2 ± 0.64.4 ± 0.114.4 ± 0.47.5 ± 0.33.5 ± 0.2
II36.1 ± 0.629.2 ± 0.25.5 ± 0.216.4 ± 0.19.1 ± 0.43.9 ± 0.1
III27.7 ± 1.126.3 ± 1.07.1 ± 0.320.8 ± 0.512.6 ± 0.55.5 ± 0.3
IV18.5 ± 1.435.2 ± 1.612.2 ± 0.87.1 ± 0.821.7 ± 0.65.3 ± 0.4
#4I42.6 ± 1.526.7 ± 0.25.0 ± 0.413.0 ± 0.89.2 ± 0.23.5 ± 0.3
II22.6 ± 1.032.7 ± 0.68.0 ± 0.218.3 ± 0.413.5 ± 0.15.0 ± 0.1
III19.1 ± 1.030.7 ± 1.19.4 ± 0.717.4 ± 0.716.1 ± 0.47.3 ± 0.4
IV14.6 ± 0.739.6 ± 1.213.4 ± 0.24.0 ± 0.224.4 ± 0.74.0 ± 0.2
Publisher’s Note: MDPI stays neutral with regard to jurisdictional claims in published maps and institutional affiliations.

