Article

Study of the Effects of Ten-Year Microclimate Regulation Based on Different Vegetation Type Combinations in a City Riparian Zone

1
State Environmental Protection Key Laboratory of Wetland Ecology and Vegetation Restoration, Northeast Normal University, Changchun 130117, China
2
Key Laboratory for Vegetation Ecology Ministry of Education, Northeast Normal University, Changchun 130117, China
3
Key Laboratory of Environmental Materials and Pollution Control, The Education Department of Jilin Province, School of Environmental Science and Engineering, Jilin Normal University, Siping 136000, China
4
Jilin Provincial Academy of Forestry Sciences, Changchun 130033, China
*
Authors to whom correspondence should be addressed.
Water 2022, 14(12), 1932; https://doi.org/10.3390/w14121932
Submission received: 15 May 2022 / Revised: 8 June 2022 / Accepted: 14 June 2022 / Published: 16 June 2022
(This article belongs to the Section Hydrology)

Abstract

:
Ecological engineering construction is the main method for urban riparian landscape restoration. Continuous ecological environmental monitoring can reflect the effects of engineering construction and can provide a scientific basis for the improvement of engineering technology. However, the evaluation of riparian ecological engineering mainly focuses on the water environmental function and biodiversity conservation function after the construction period. Studies on the long-term evaluation of regional microclimate regulation and human settlement improvement are limited. In this paper, an ecological restoration project along the Yitong River in northern China was selected as the research object. Temperature, relative humidity and wind speed under different vegetation type combinations were monitored in the riparian ecological engineering construction during the first, second, third and tenth years. The temperature–humidity index (THI) was selected to evaluate human comfort and the improvement effect of microclimate was assessed for different vegetation type combinations. The results showed that vegetation type combinations can play a good role in regulating the microclimate and human comfort. The riparian ecological restoration project achieved a stable function for microclimate regulation in the third year. There was no significant regulation difference between tree–shrub–herb and tree–herb combinations. To realize the optimization of ecological benefits, economic benefits and social benefits, the tree–herb combination can be appropriately increased, and the tree–shrub–herb can be reduced in the application of ecological engineering. Microclimate regulation is an important achievement in engineering construction effects and can be regarded as one of the indices to evaluate the effect of ecological restoration.

1. Introduction

Rapid economic development and population expansion have led to the serious destruction of urban riparian zones [1]. The majority of the riparian (74.36%) falls under the medium vulnerability class in the last 20 years in Dehradun City, India [2]. The construction of river ecological restoration projects can bring the improvement of biodiversity, water quality and the ecosystem process of rivers [3]. With the improvement of the ecological consciousness of people and the pursuit of landscape aesthetics, urban riparian ecological protection and ecological renovation projects have achieved unprecedented development [4]. Because of their special geographic position, city riparian zones not only play a normal ecological regulation function, but they also have a social service function and landscape beautification function [5,6,7,8,9,10]. Riparian ecosystems are likely to become adaptation ‘hotspots’ as the century unfolds [11]. To verify the effectiveness of riparian ecological engineering construction, monitoring and evaluation are essential. However, current studies on river ecological restoration have mostly focused on design and technology in the early stage of ecological restoration [12]. Because of the cost of maintenance and monitoring, the long-term and convenient monitoring research on effective evaluation after ecological restoration projects was lacking. At present, the evaluation of riparian ecological engineering construction mostly adopts water quality and biodiversity as indicators, and the evaluation time is mostly limited to one or two years after the completion of the project [13]. The degree of ecological improvement is usually taken as the evaluation index of the engineering effect. Plants regulate the regional microclimate [14,15]. Different vegetation types have different improvement effects on the microclimate. The microclimate can directly affect human comfort levels. It is of a great significance for improving the comfort levels of urban public living space environments [16]. The climate suitability brought by temperature and humidity is a concern for residents [17]. At the 9th Urban Climate Conference held in France in 2016, the evaluation of microclimate change and human perception in different regions was proposed as a part of the global public environmental quality assessment [18]. However, there is no relatively complete scientific discussion on the effect of ecological restoration by using microclimate as an indicator, and studies on microclimate regulation of vegetation type combinations of urban riparian ecological restoration projects are limited.
The middle course of the Yitong River is located in Changchun, Jilin Province. It is a large landscape river in Changchun city and one of the main places for daily leisure activities of people. The ecological reconstruction and restoration project for the riparian zone of the Yitong River was carried out in 2010. In the design process of the riparian zone, riprap revetment and permeable rigidity revetment were designed in the wading area, and emergent and wet vegetation were planted. This design can enhance the communication between river and riparian soil, groundwater, achieving a purpose of stability and flood control. A “two-grade and three-layer” vegetation revetment system was proposed and constructed in the design of the vegetation zone. The “two-grade” refers to setting two vegetation buffer zones between a residential area and flood bank. The “three-layer” refers to different landscape types: specifically, a combination of trees, shrubs and herbs. This design of a vegetation zone can reduce slope runoff and the pollution load of rivers, and beautify the riparian environment. According to the characteristics of ecological engineering, which needs a long time for its effects to take hold for the improvement of different vegetation type combinations on the microclimate, the long-term and convenient monitoring research on the effective evaluation of microclimate regulation was lacking after riparian ecological restoration projects. In this study, the riparian ecological restoration project of the Yitong River in northern China was selected as the research object. The objectives of our study were as follows: (1) to monitor three microclimatic indices (temperature, relative humidity and wind speed) for different vegetation type combinations in the first, second, third and tenth years after riparian ecological engineering restoration; (2) to analyze the changes in the microclimate under different vegetation type combinations and different restoration times and to calculate the changes in human comfort; (3) to explore the effects of different vegetation type combinations and restoration times on microclimate function in ecological engineering construction.

2. Materials and Methods
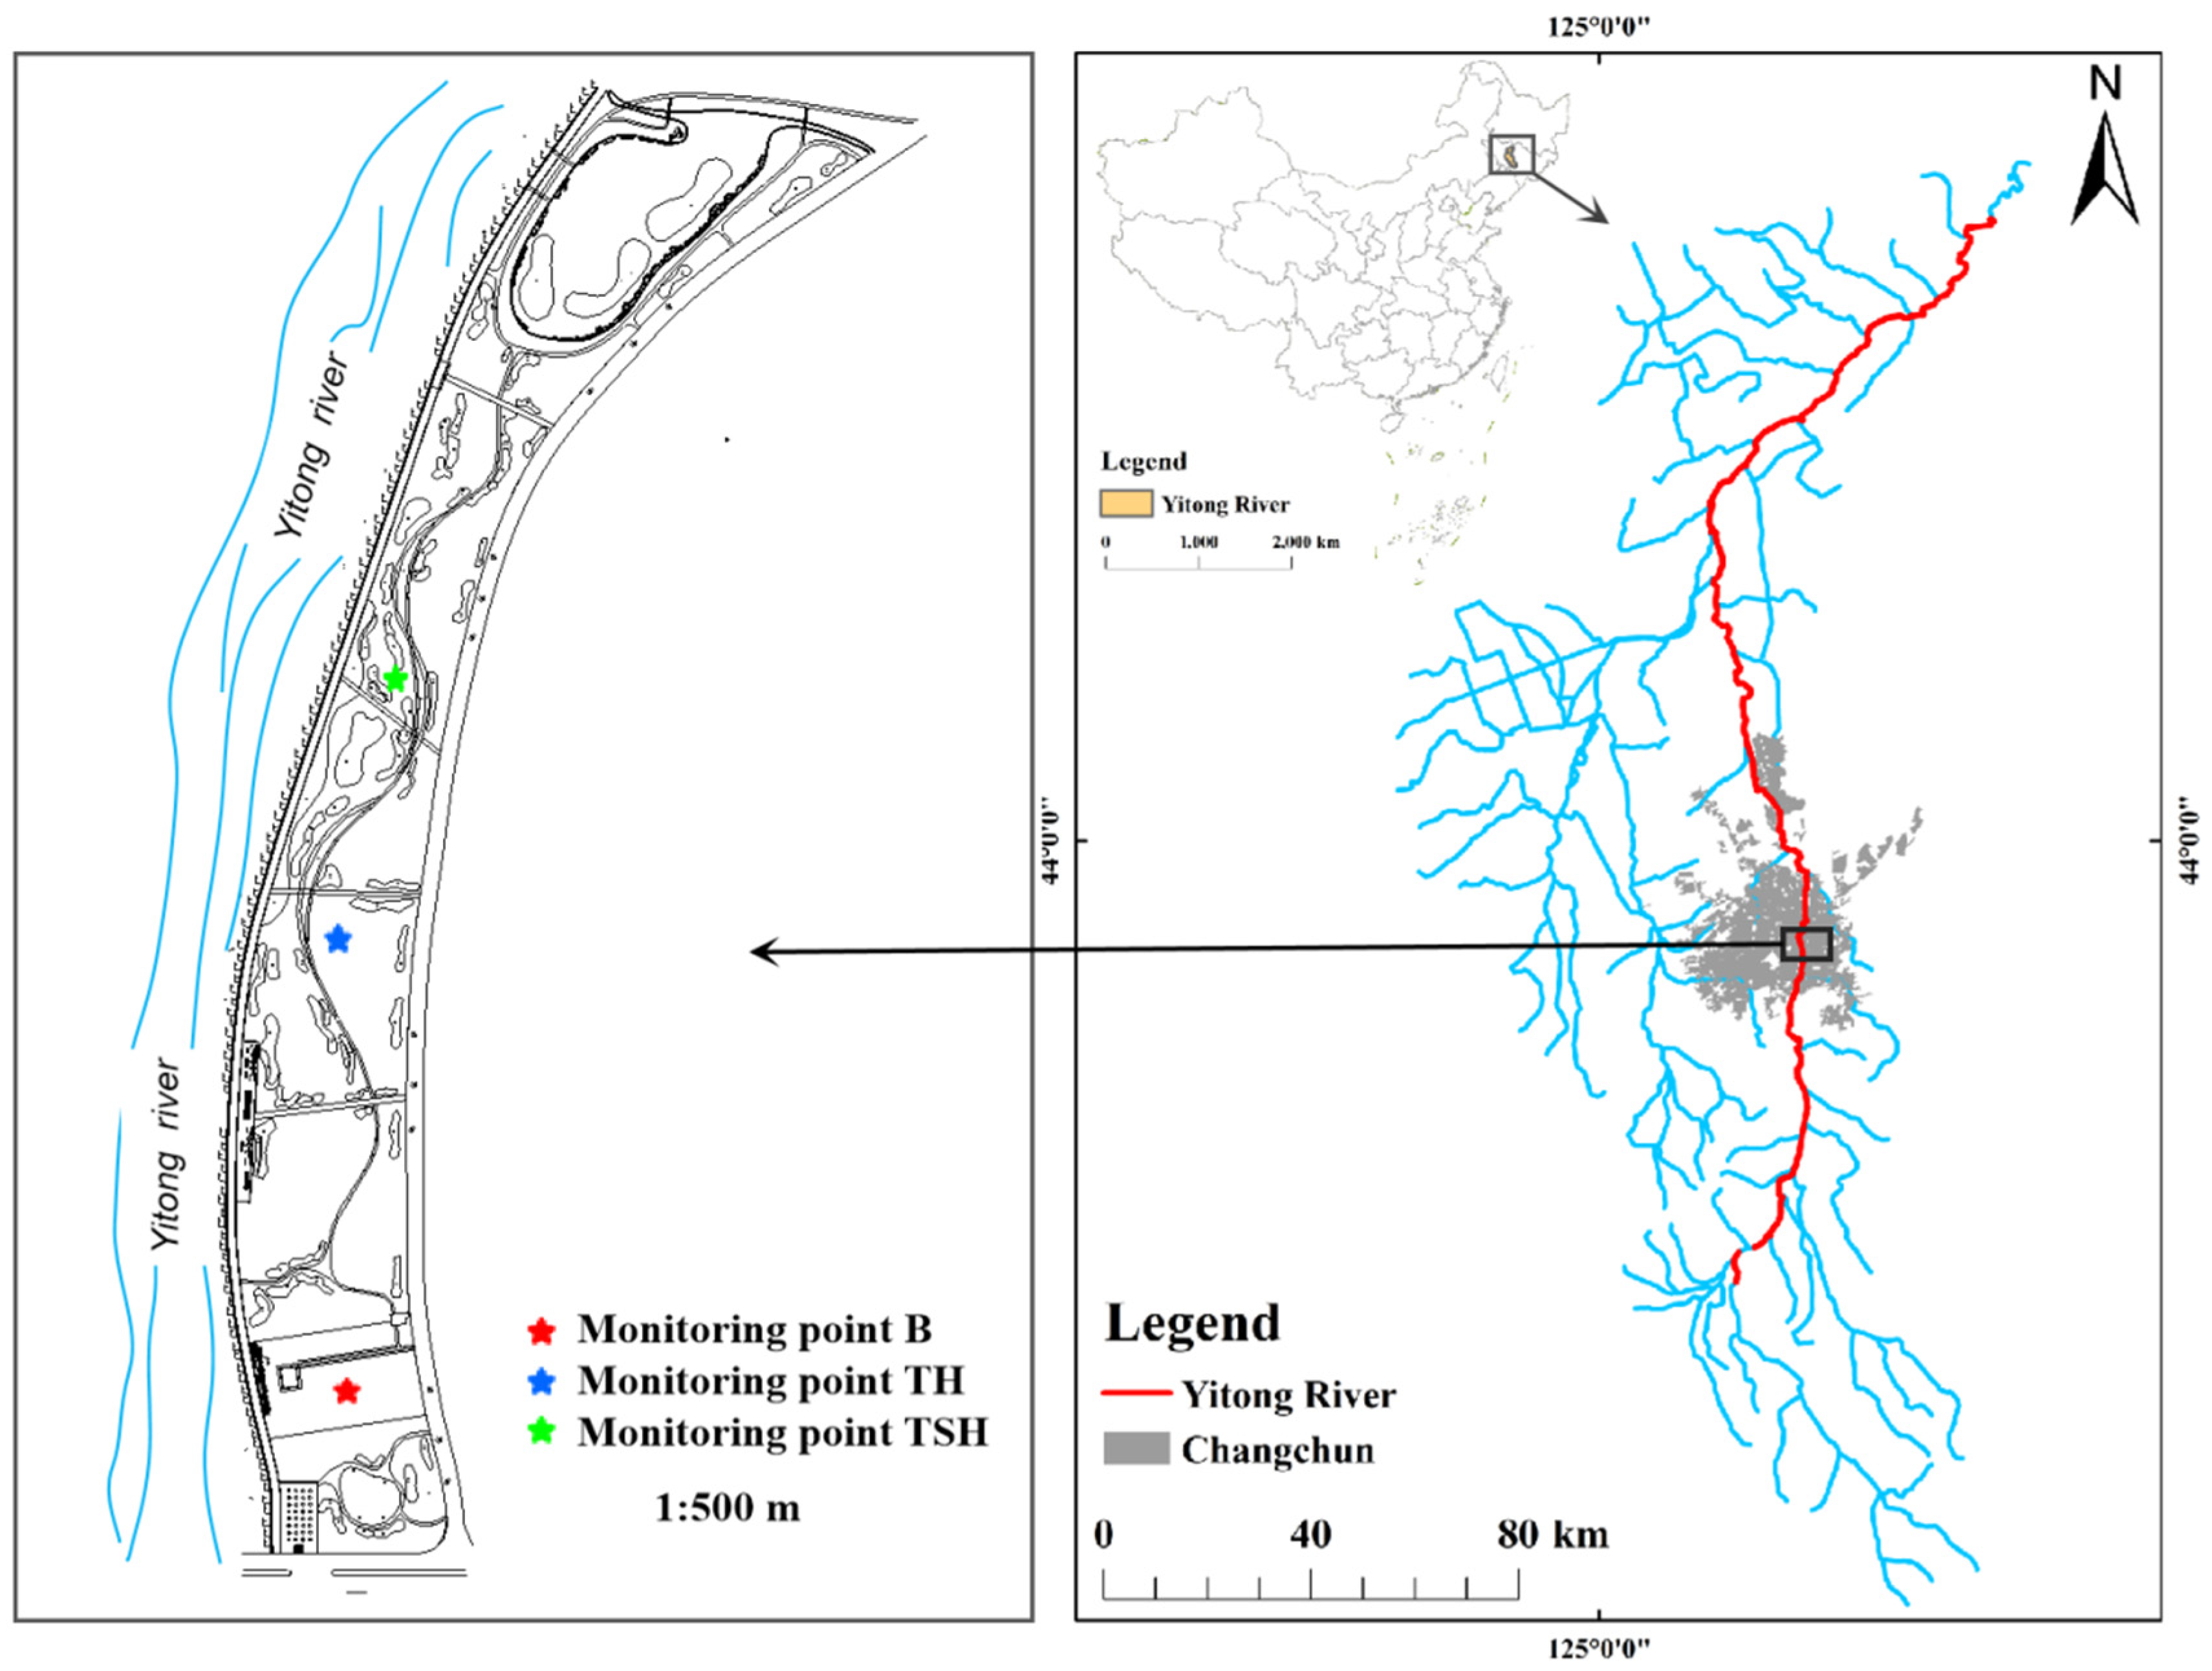
2.1. Study Area

The Yitong River is the second tributary of the Songhua River, with a total length of 343.5 km and a basin area of 8440 km2 (Figure 1). The Yitong River Basin has a temperate zone continental monsoon climate. The average annual temperature is 5.5 °C. The annual rainfall in the study area is 570.5 mm. Yitong River is a river strongly controlled by humans. There is a reservoir built in the upstream to control the flow of Yitong River. “Yitong River management Committee”, as a special management organization, can maintain and manage the riparian zone. The study area was not affected by more destructive disturbance factors during the study period, such as floods. Camping and recreational activities are the biggest disturbance factors in the riparian zone.

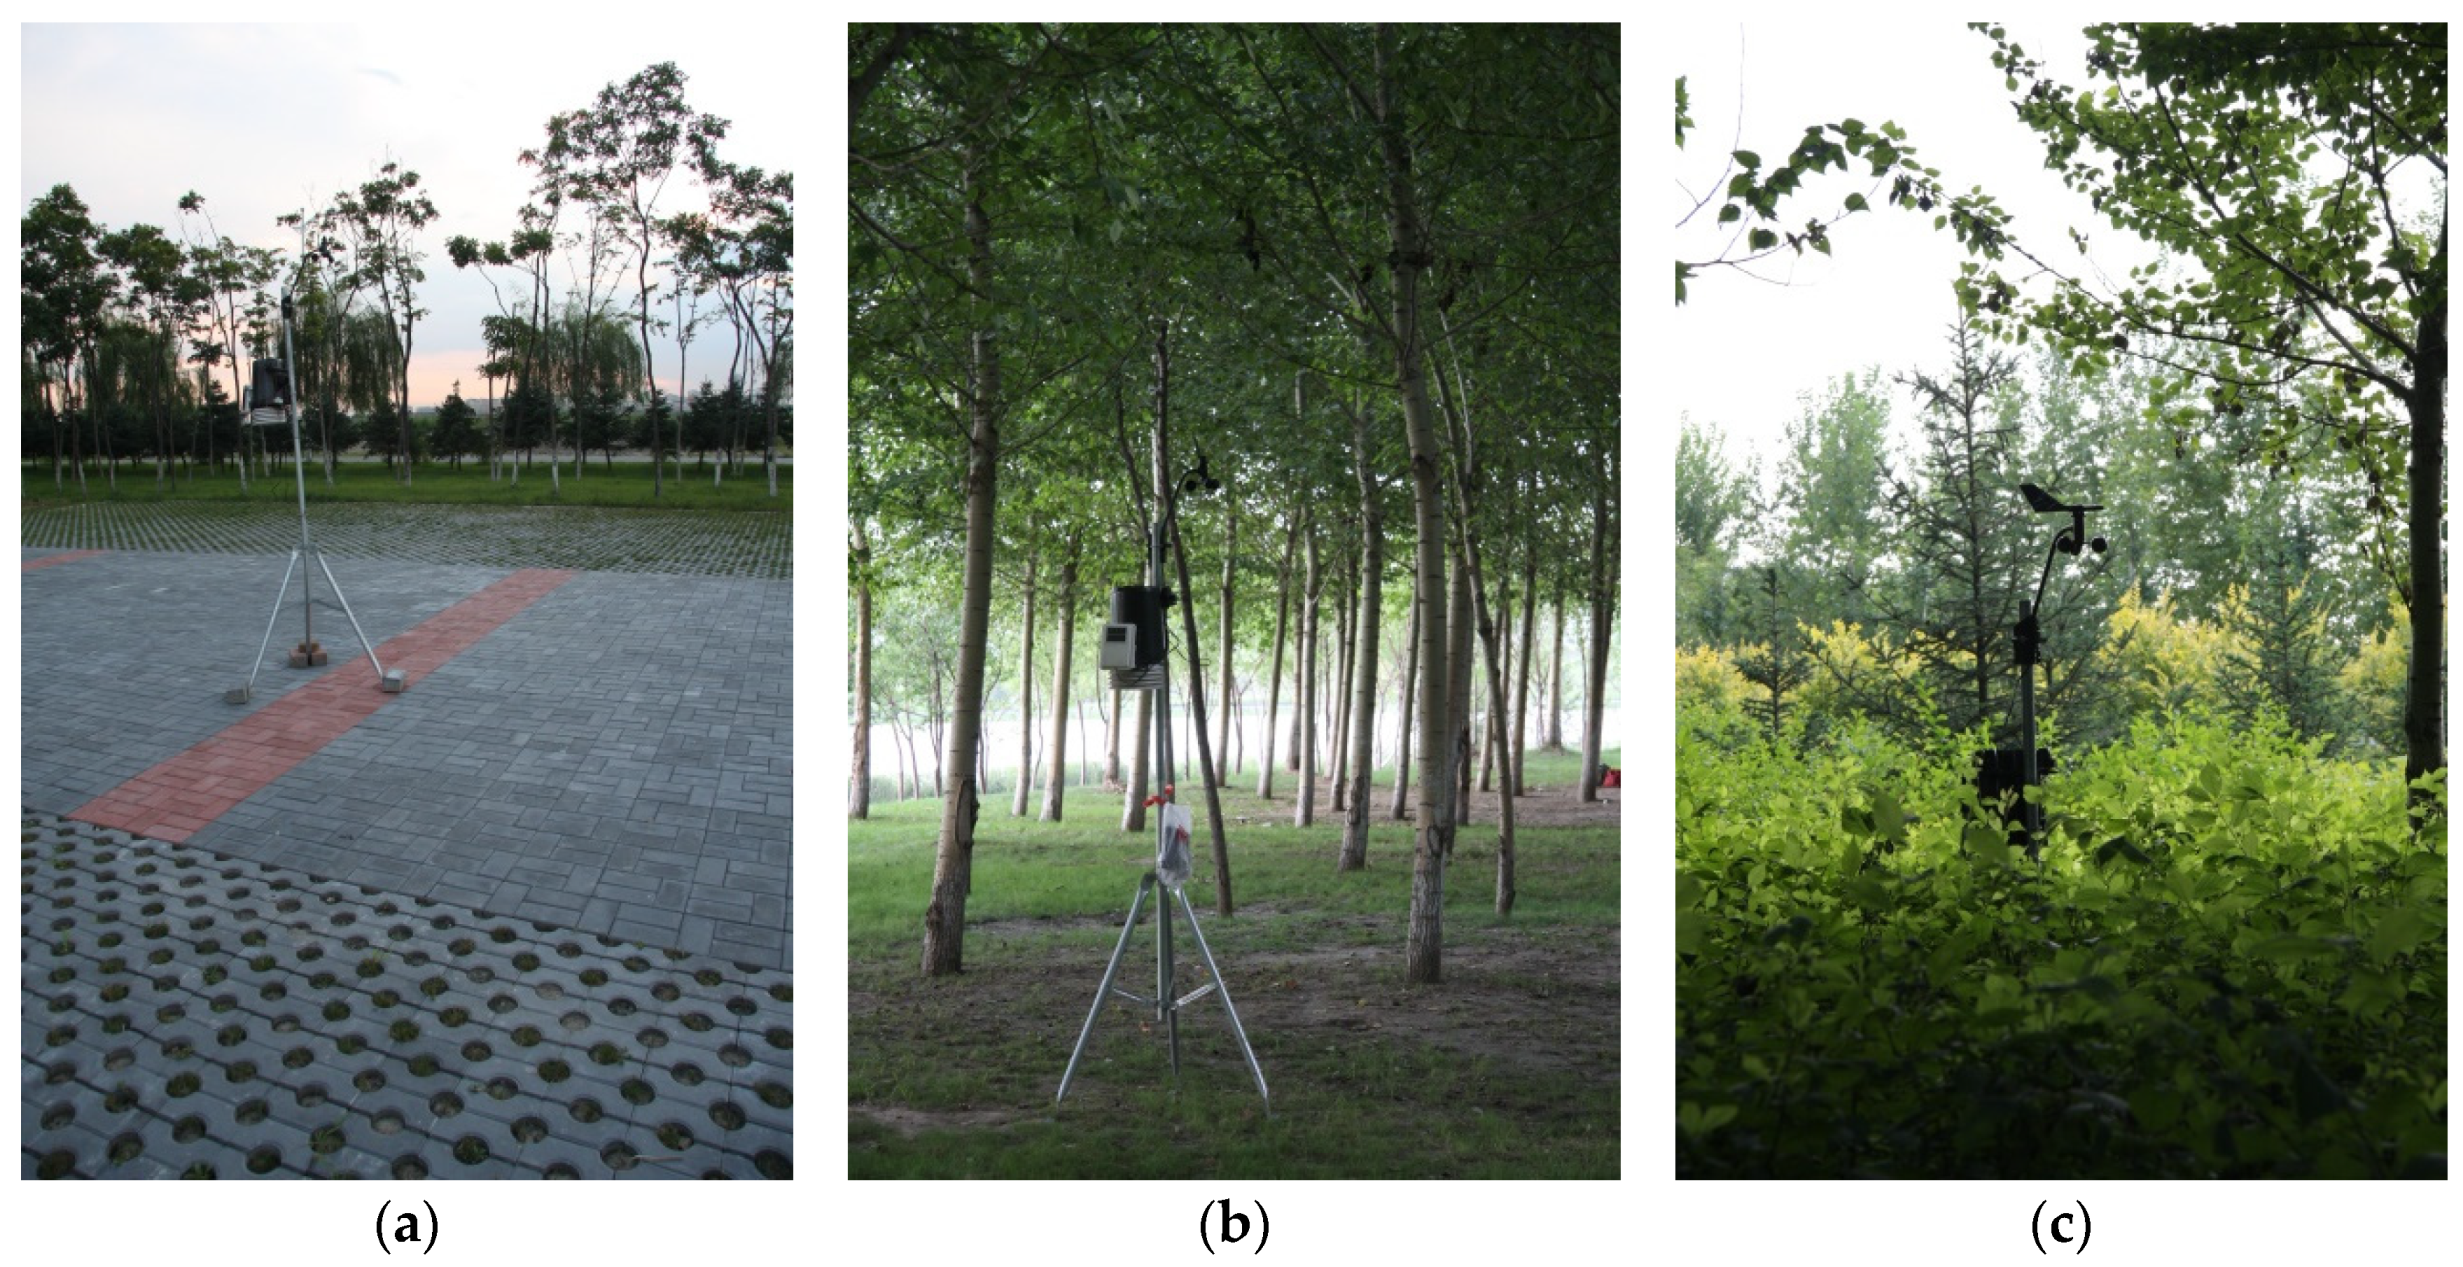
2.2. Monitoring Method

To study microclimate regulation with or without vegetation and different vegetation type combinations, bare land, tree–herb and tree–shrub–herb combinations were selected for monitoring (Figure 1). The monitoring point of bare land was selected at the central point of a 30 × 30 m residential activity area covered by brick and without planted vegetation on the river bank (Figure 1, Point B). The monitoring point of the tree–herb land was selected at the center point of a 50 × 20 m rectangular sample (Figure 1, Point TH). The vegetation of tree–herb was composed of Populus cathayana and Trifolium repens. The height of P. cathayana was approximately 6 m. The density of P. cathayana was 4 individuals per 10 m2. The coverage of T. repens was over 70%. The coverage of P. cathayana and T. repens stabilized at about 90% in the third year of restoration project. The monitoring point of the tree–shrub–herb land was selected at the center point of a 30 × 10 m rectangular sample (Figure 1, Point TSH). The vegetation of the tree–shrub–herb was composed of P. cathayana, Cornus alba and T. repens. The height of P. cathayana was approximately 6 m. The density of P. cathayana was 4 individuals per 10 m2. The height of C. alba was approximately 1 m. The density of C. alba was 25 individuals per 1 m2. The coverage of T. repens was over 70% (Figure 2). In the third year of restoration project, the coverage of herbs can reach more than 90% and the total coverage was about 95%. The vegetation can achieve self-recovery and only needs simple maintenance after three years of restoration. The height of the trees was approximately 15 m and the height of shrubs was approximately 2 m after ten years of restoration. However, the recreational activities of residents had a certain influence on the tree–herb areas. Its average coverage was about 70%, which was the same as the initial coverage.
The monitoring was conducted in August in 2010, 2011, 2012, and 2019. The reasons for the monitoring time selected in August are as follows: firstly, the study area is located in the north temperate zone of Northeast China. The growth period of plants is relatively short and the peak of vegetation growth is August, which has the strongest influence on the microclimate. Secondly, the average annual temperature is only 5.5 °C in the study area. High-temperature weather in this region is mainly focused on August in the summer, which is the main period for residents to avoid summer heat in the riverside zone. All the monitoring periods were sunny, and the previous week was sunny. A Davis weather station was used to monitor temperature, relative humidity and wind speed at a height of 2 m above the ground from 6:00 to 18:00. During the monitoring process, the Davis weather station automatically collected data every 15 min.

2.3. Analysis Method

SPSS 21.0 software was used for data collation and significance analysis. The Kolmogorov–Smirnov test was selected to examine whether the microclimatic data followed a normal distribution. The homogeneity of variance was checked out by the homogeneity test. If the microclimatic data fit the normal distribution, a one-way ANOVA analysis was used to determine statistical differences and the least significant difference (LSD) was used to perform multiple comparisons. If the microclimatic data did not fit the normal distribution, nonparametric test was used.
The temperature–humidity index (THI) can indicate the difference of microclimate regulation and is widely used to assess the microclimate [19]. Most researches show that the change of temperature, humidity and wind speed has the greatest impact on human comfort in all the meteorological factors [20,21]. Therefore, the THI used by the National Weather Service was selected to represent the comprehensive comfort of human in summer. The THI can be calculated by Equation (1) [22]. THI was evaluated according to human comfort level (Table 1).
THI = T 0.55 × ( T 14.5 ) × ( 1 HR )
where T is the measured temperature (°C) and HR is the relative humidity (%).

3. Results

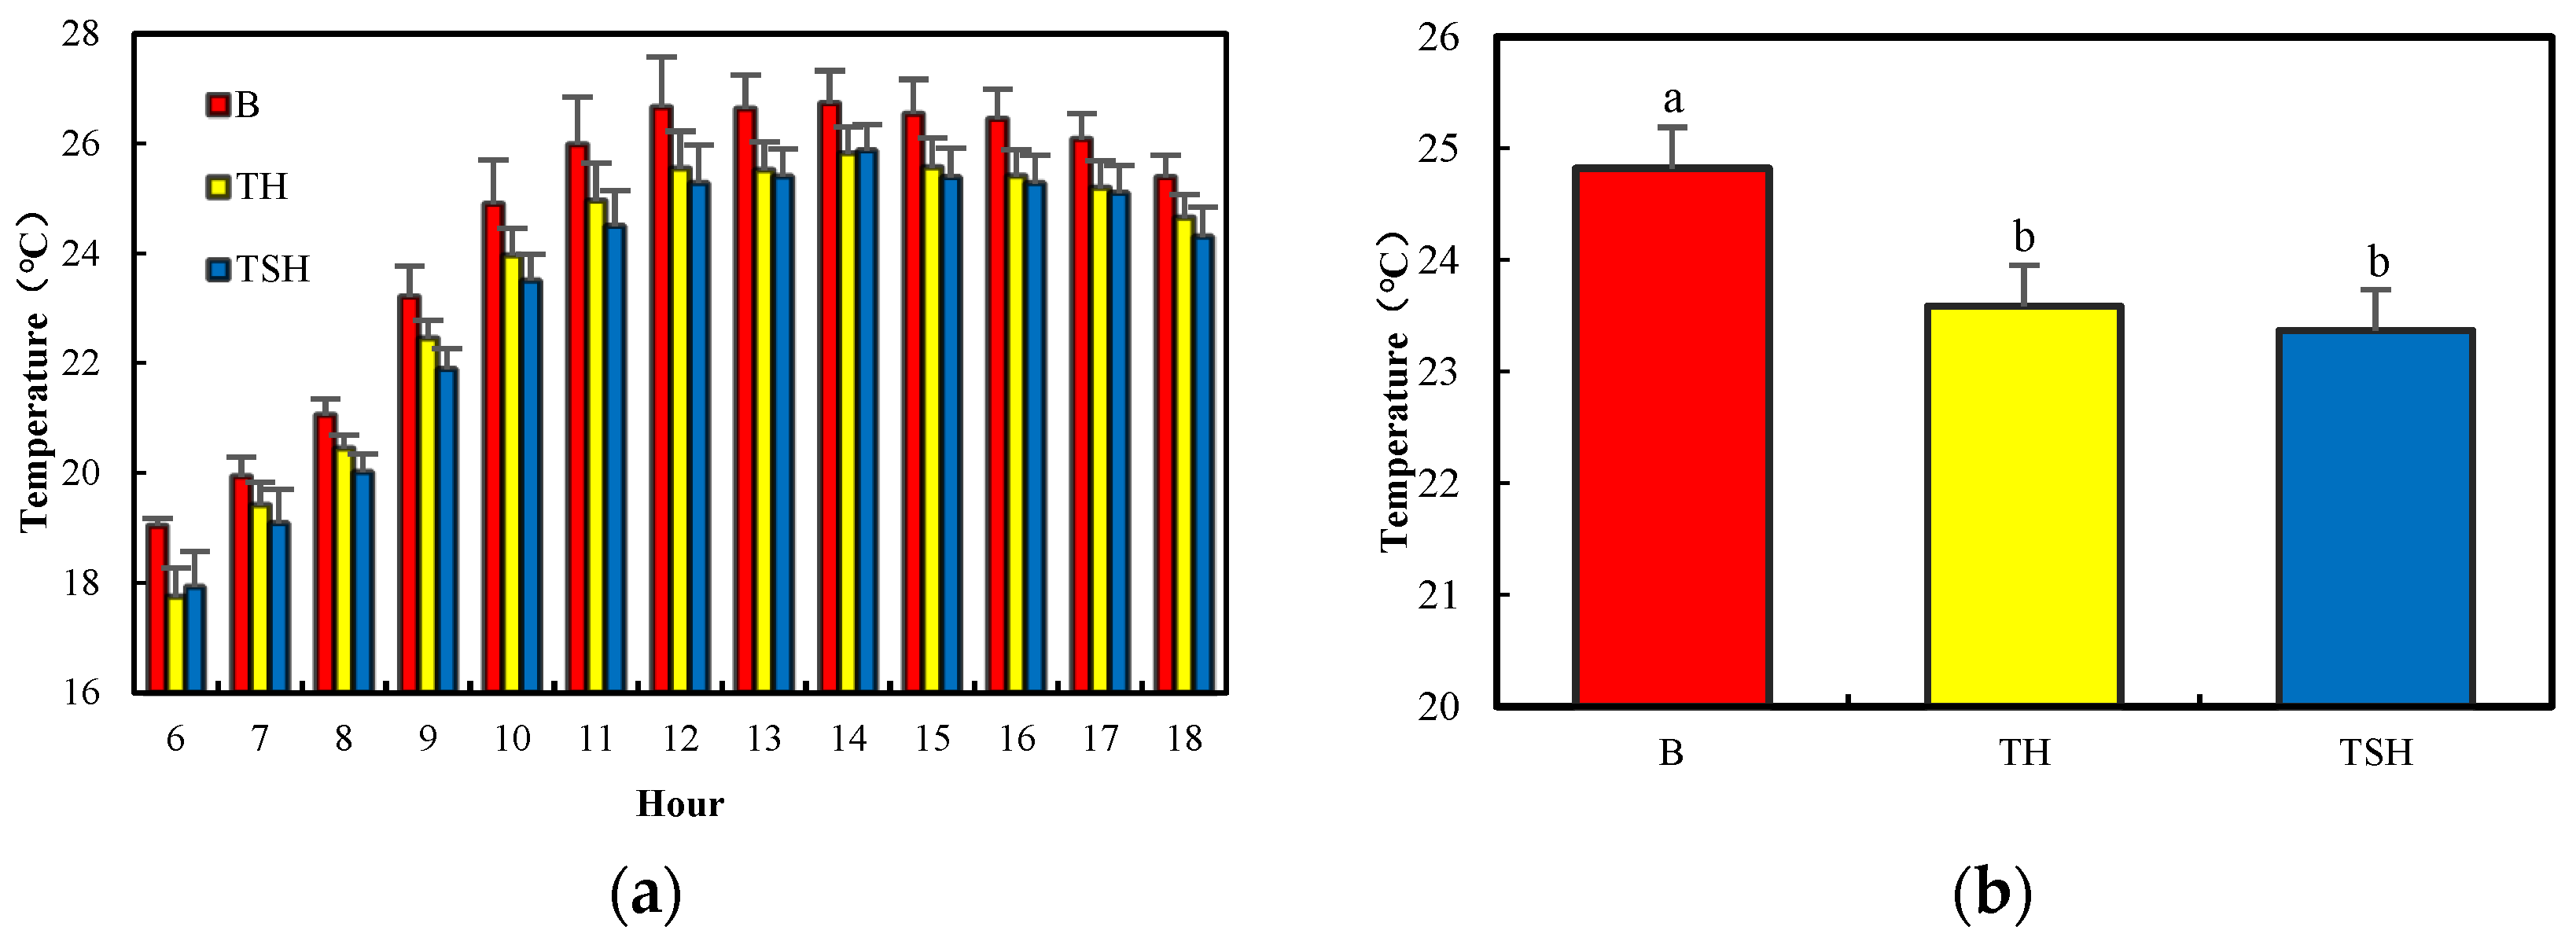
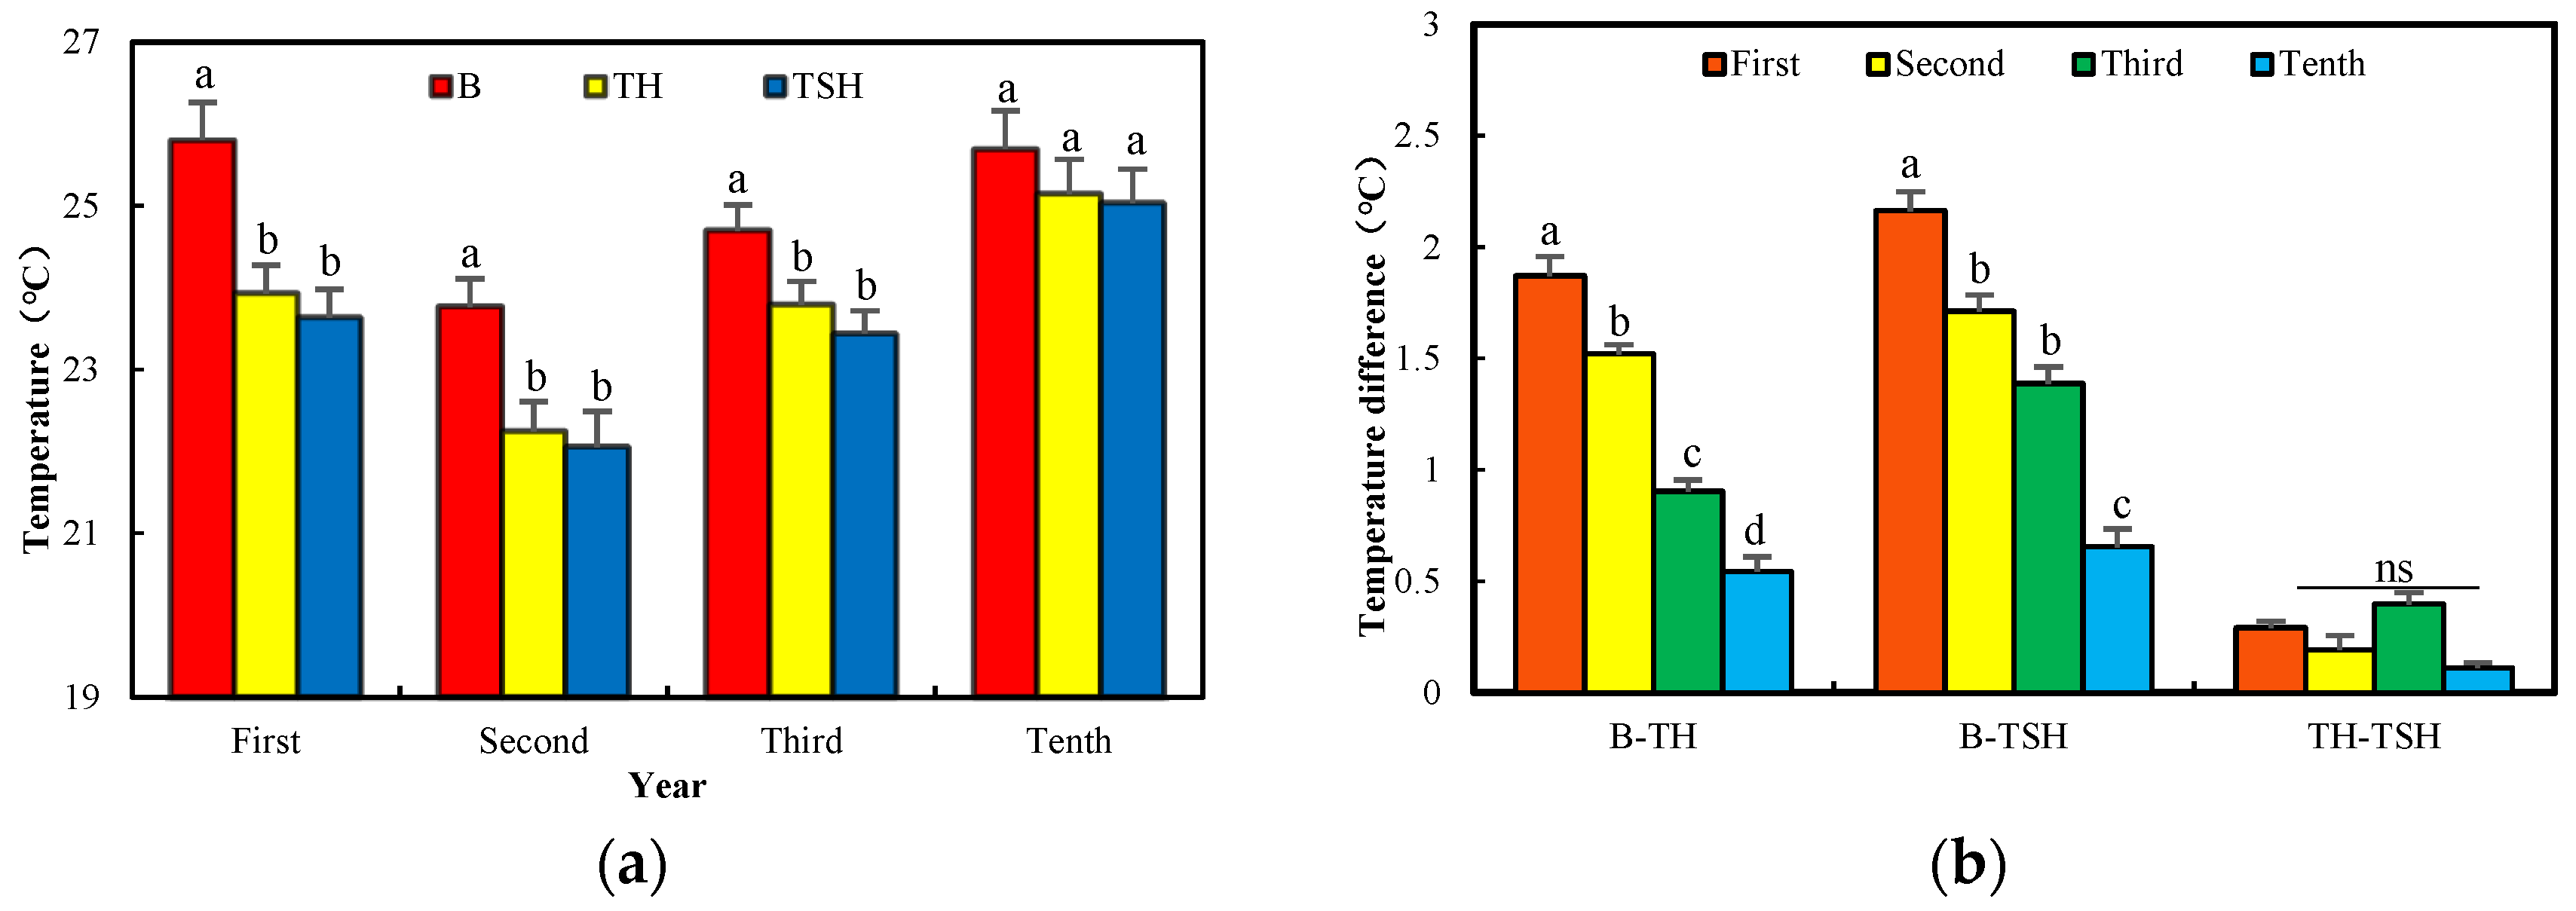
3.1. Temperature Regulatory Function

The temperature variation for each hour was similar in the three vegetation type combinations (Figure 3a). The temperature rapidly increased from 6:00 to 12:00. The temperature basically remained stable from 12:00 to 14:00 and decreased slowly from 14:00 to 18:00. The temperature of three vegetation type combinations all reached a maximum value at 14:00. The maximum temperatures of TB, TTH, and TTSH were 26.73 ± 0.59, 25.82 ± 0.48 and 25.88 ± 0.46 °C, respectively. There were differences in temperature among the different vegetation type combinations. Figure 3b shows that TB > TTH > TTSH. TB was significantly higher than that of TTH and TTSH (p < 0.05). TTH was slightly higher than TTSH, but the temperature difference was not significant (p > 0.05).
Figure 4a shows that the temperature difference among the different vegetation type combinations decreased with increasing restoration years. However, the average temperature of the different vegetation type combinations followed the order TB > TTH > TTSH. There was a significant difference between TB and TTH (TB − TH) and TB and TTSH (TB − TSH) in the first three years of the project (p < 0.05). Through comparing the temperature differences among the different vegetation type combinations in different restoration years, TB − TTH and TB − TTSH were the maximums in the first year of the project (Figure 4b). Then, the temperature differences gradually decreased. The TB − TH decreased from 1.87 ± 0.09 to 0.54 ± 0.07 °C and the TB − TSH decreased from 2.16 ± 0.09 to 0.65 ± 0.08 °C. There was a significant difference in different years. The differences in TTH and TTSH (TTH − TSH) were relatively stable over the ten years, and the difference was not significant. The temperature differences of the three vegetation type combinations were small and not significant in the tenth year after carrying out the ecological restoration project.

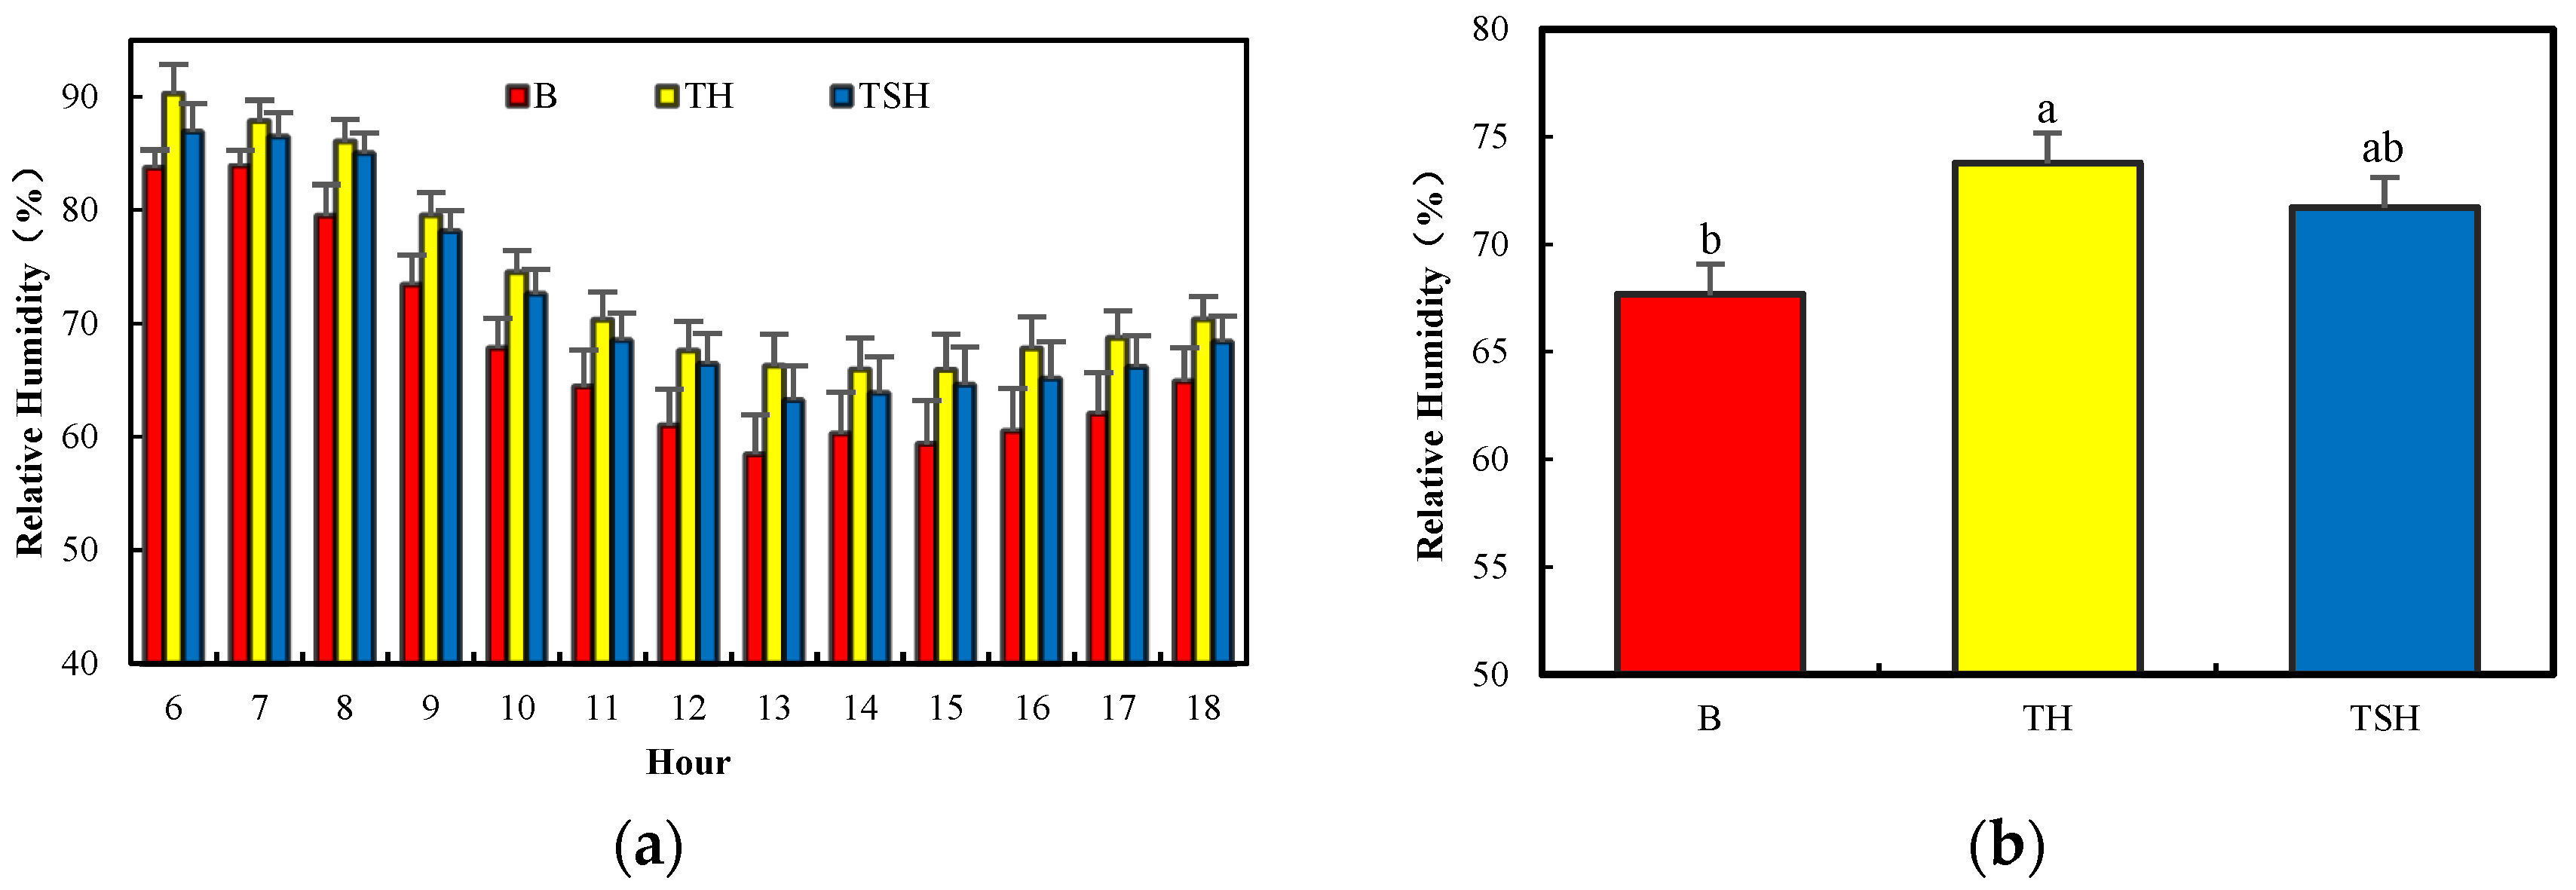
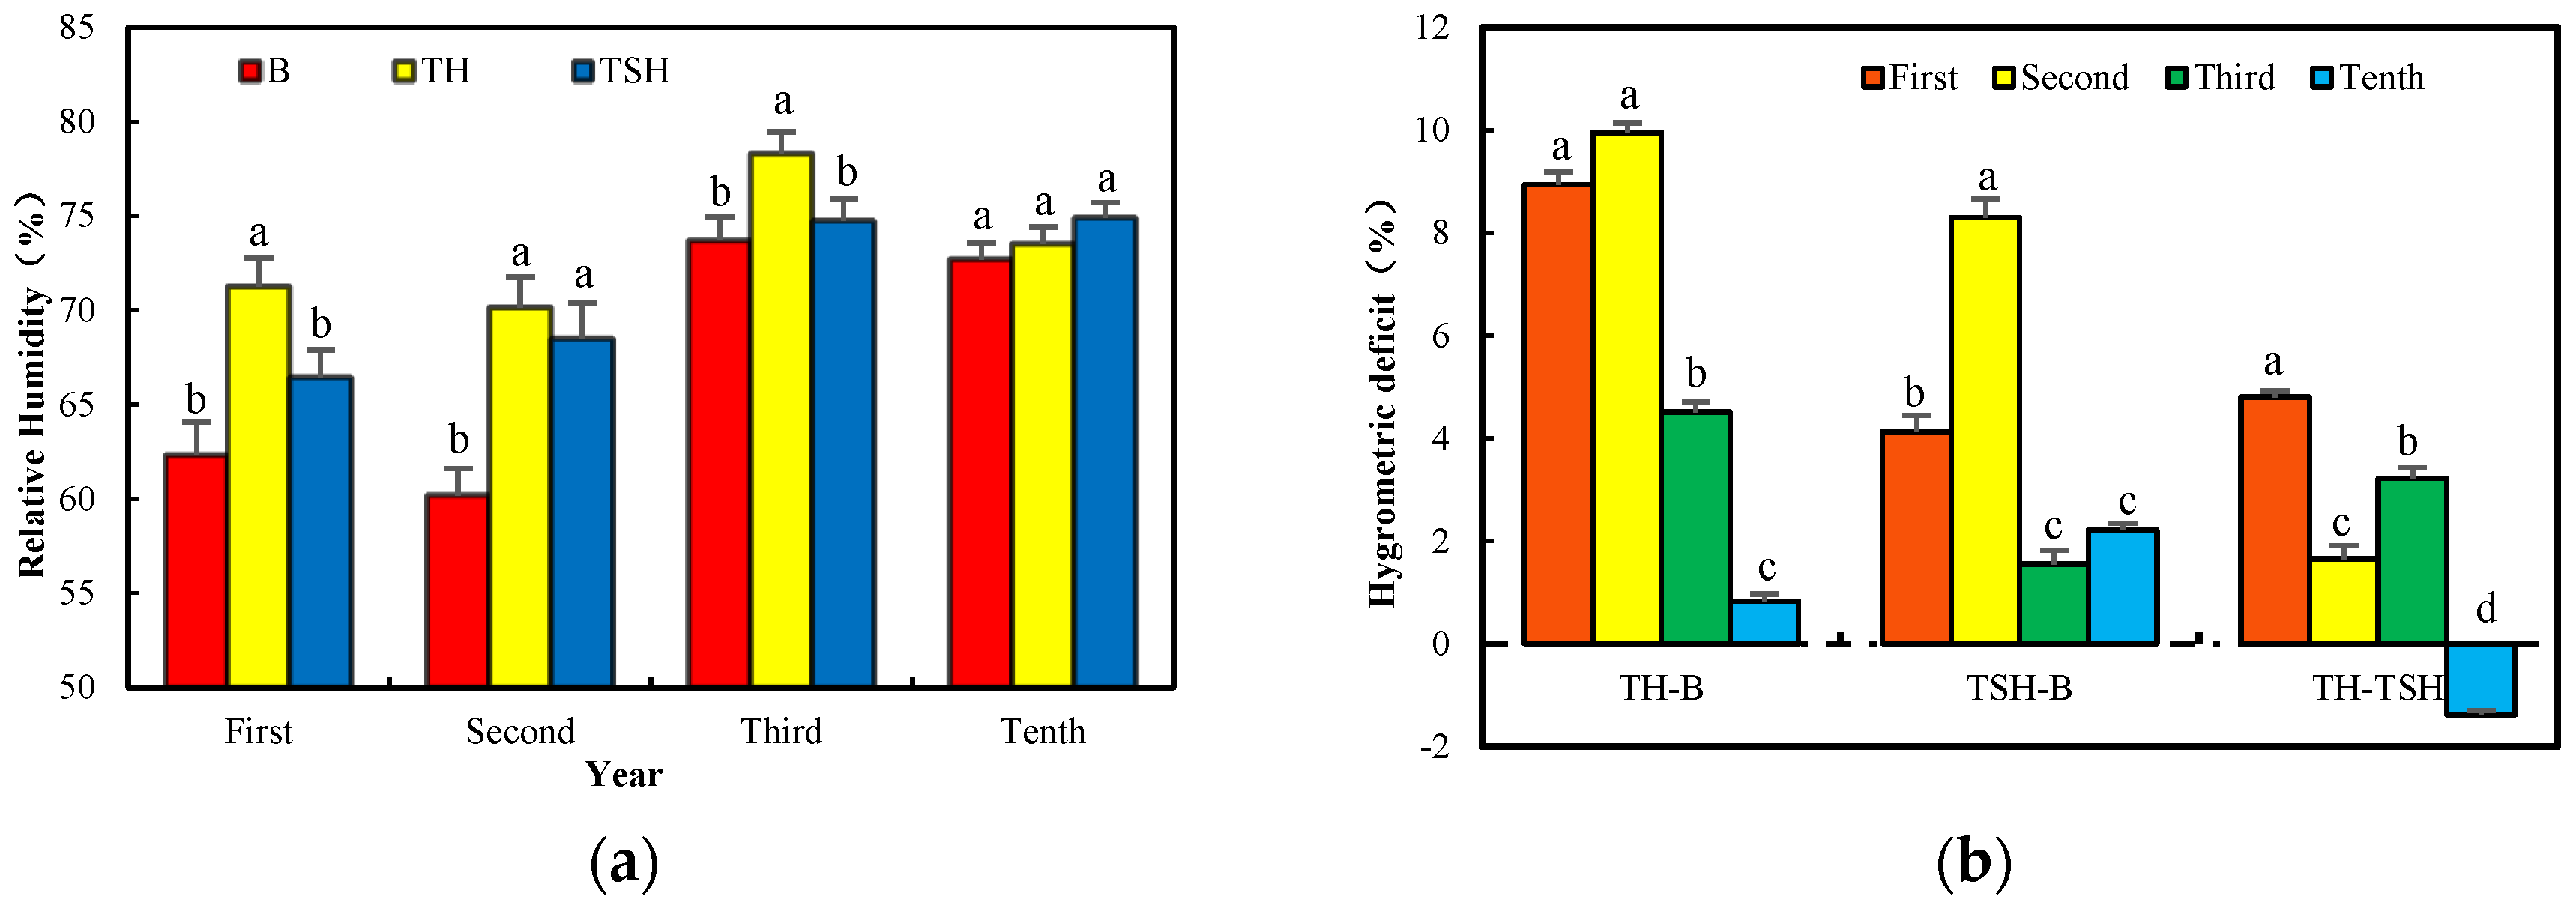
3.2. Relative Humidity Regulatory Function

The relative humidity variation of the three vegetation type combinations was similar (Figure 5a) and contrary to the temperature. The relative humidity was high from 6:00 to 8:00 and showed a slow decreasing trend. The relative humidity decreased rapidly from 8:00 to 13:00 and reached its lowest value at 13:00. The lowest values of HB, HTH, and HTSH were 58.45 ± 3.50, 66.28 ± 2.78, and 63.24 ± 3.05%, respectively. The relative humidity basically remained stable from 13:00 to 15:00 and rose slowly from 15:00 to 18:00. There were some differences in relative humidity among the different vegetation type combinations. Figure 5b shows that HB < HTSH < HTH. HB was significantly lower than HTH (p < 0.05). HB was lower than TTSH, but the difference in relative humidity was not significant (p > 0.05). HTSH was close to HTH.
Figure 6a shows that the relative humidity among different vegetation type combinations increased with increasing restoration years and that the relative humidity difference declined. HB was always lower than HTH and HTSH. There was a significant difference between HTH and HB and HTSH in the first and third years of the project (p < 0.05). The relative humidity of the three vegetation type combinations showed that HB < HTH < HTSH and did not have a significant difference in the tenth year after carrying out the ecological restoration project. The HTH − B decreased from 9.95 to 0.83% and the HTSH − B decreased from 8.30 to 2.22% from the second year to the tenth year, respectively (Figure 6b). However, the HTH − STH decreased from 4.8 to −1.39% from the first year to the tenth year, respectively (Figure 6b).

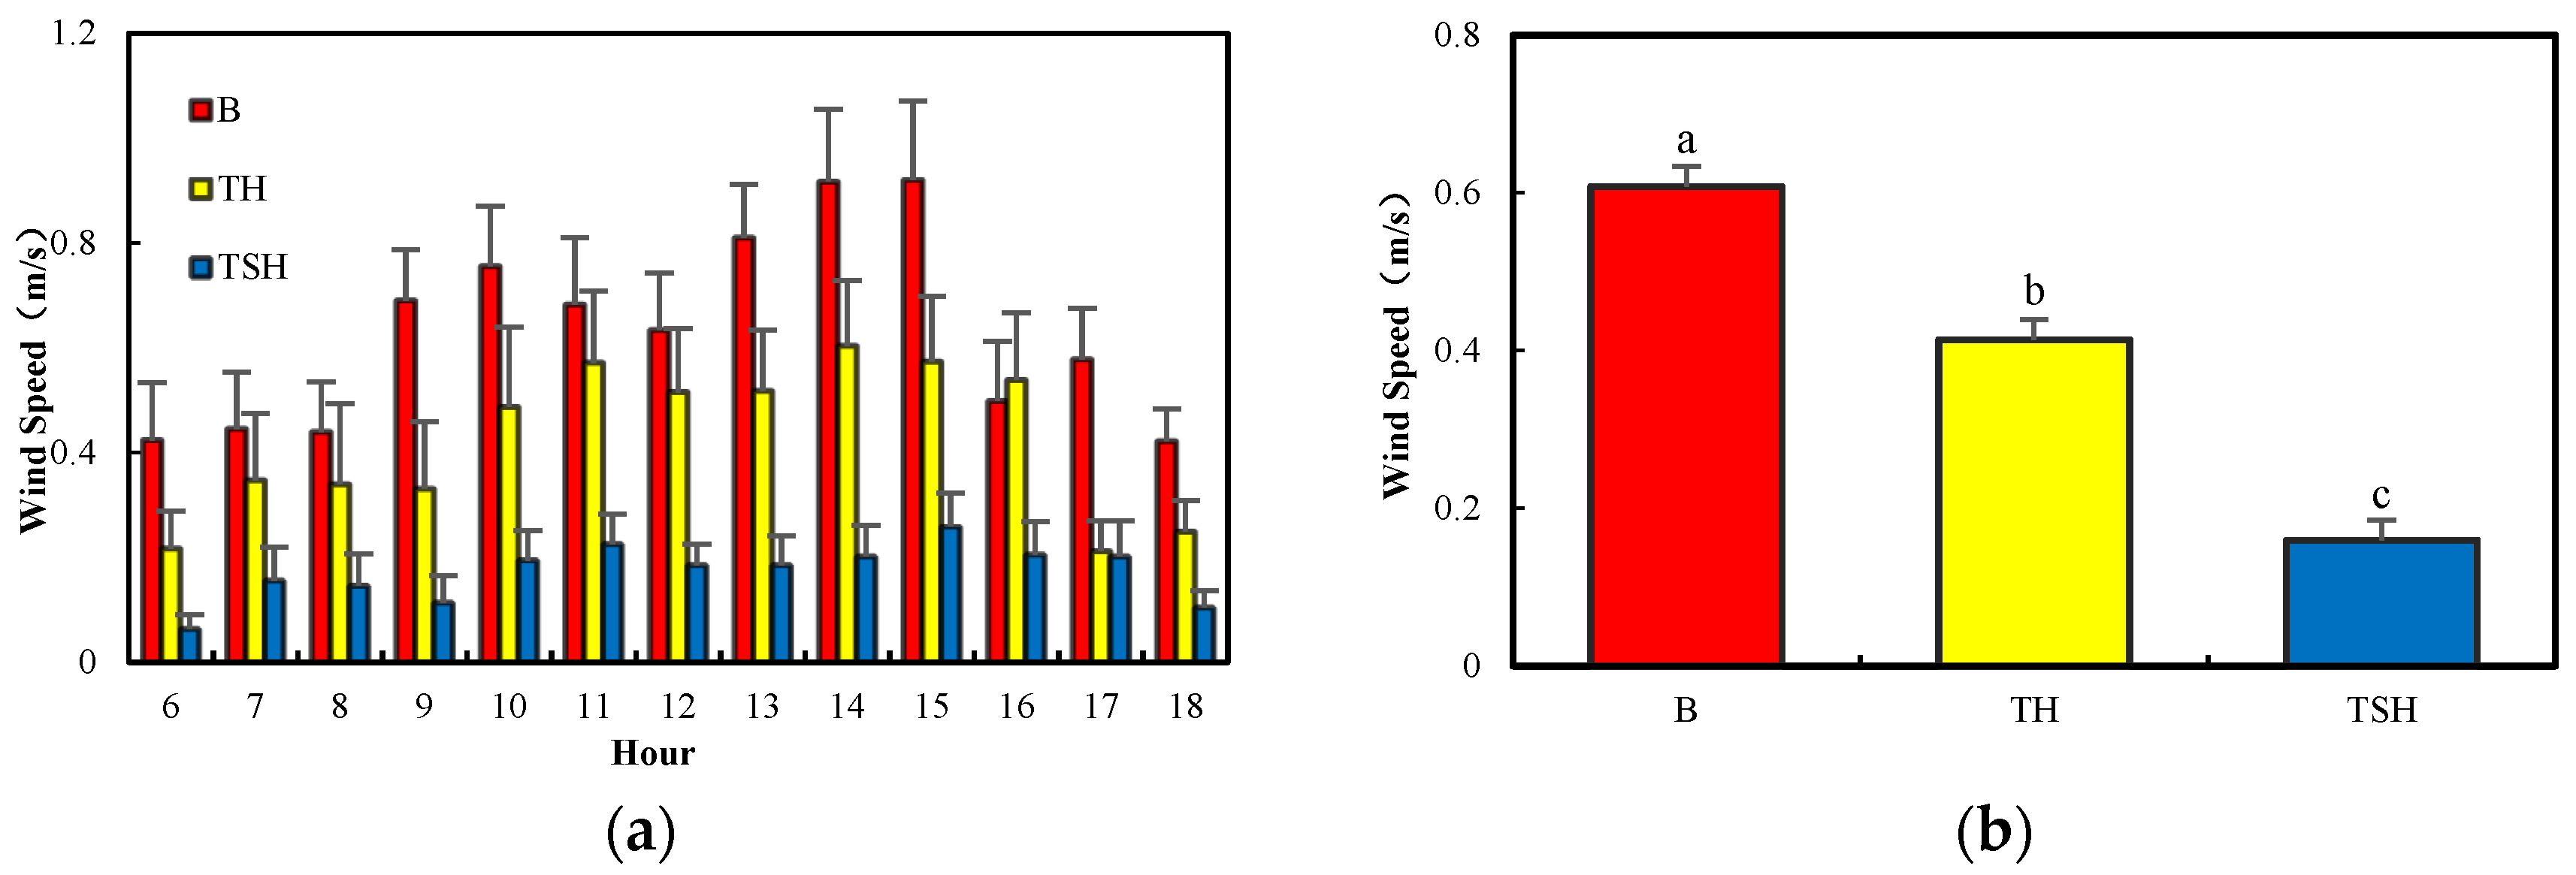
3.3. Wind speed regulatory function

The diurnal wind speed variation of the three vegetation type combinations was different (Figure 7a). There were two peak periods for SB from 9:00~10:00 and 13:00~15:00. STH was relatively stable. STSH was approximately 0.16 m/s for the whole day. However, STH was higher than STSH. There were some differences in wind speed among different vegetation type combinations. Figure 7b shows that SB > STH > STSH, which was similar to the temperature variation. SB, STH and STSH were approximately 0.61 ± 0.03, 0.44 ± 0.02 and 0.16 ± 0.01 m/s, respectively. There were significant differences in wind speed among the different vegetation type combinations (p < 0.05).
Figure 8a shows that the wind speed variation among different vegetation type combinations was different with increasing restoration years. There was no regular change for SB. SB was lower than STH in the first year of the restoration project and was higher than STH and STSH in the second, third and tenth years. STSH was always stable at approximately 0.22 m/s, reached a minimum and was close to 0 in the second year. There was always a significant difference between SB and STH and STSH (p < 0.05). Figure 8b shows that the differences in SB and STH (SB − TH) and SB and STSH (SB − TSH) displayed upwards trends year by year. STH was at a maximum in the first year and stabilized in a range of 0.19~0.37 m/s in the following years. There was a significant difference between STH and STSH in the first and second years of the project (p < 0.05). However, the difference between STH and STSH was not significant from the third year of the restoration project. The difference between SB and STH (STH − TSH) gradually decreased.

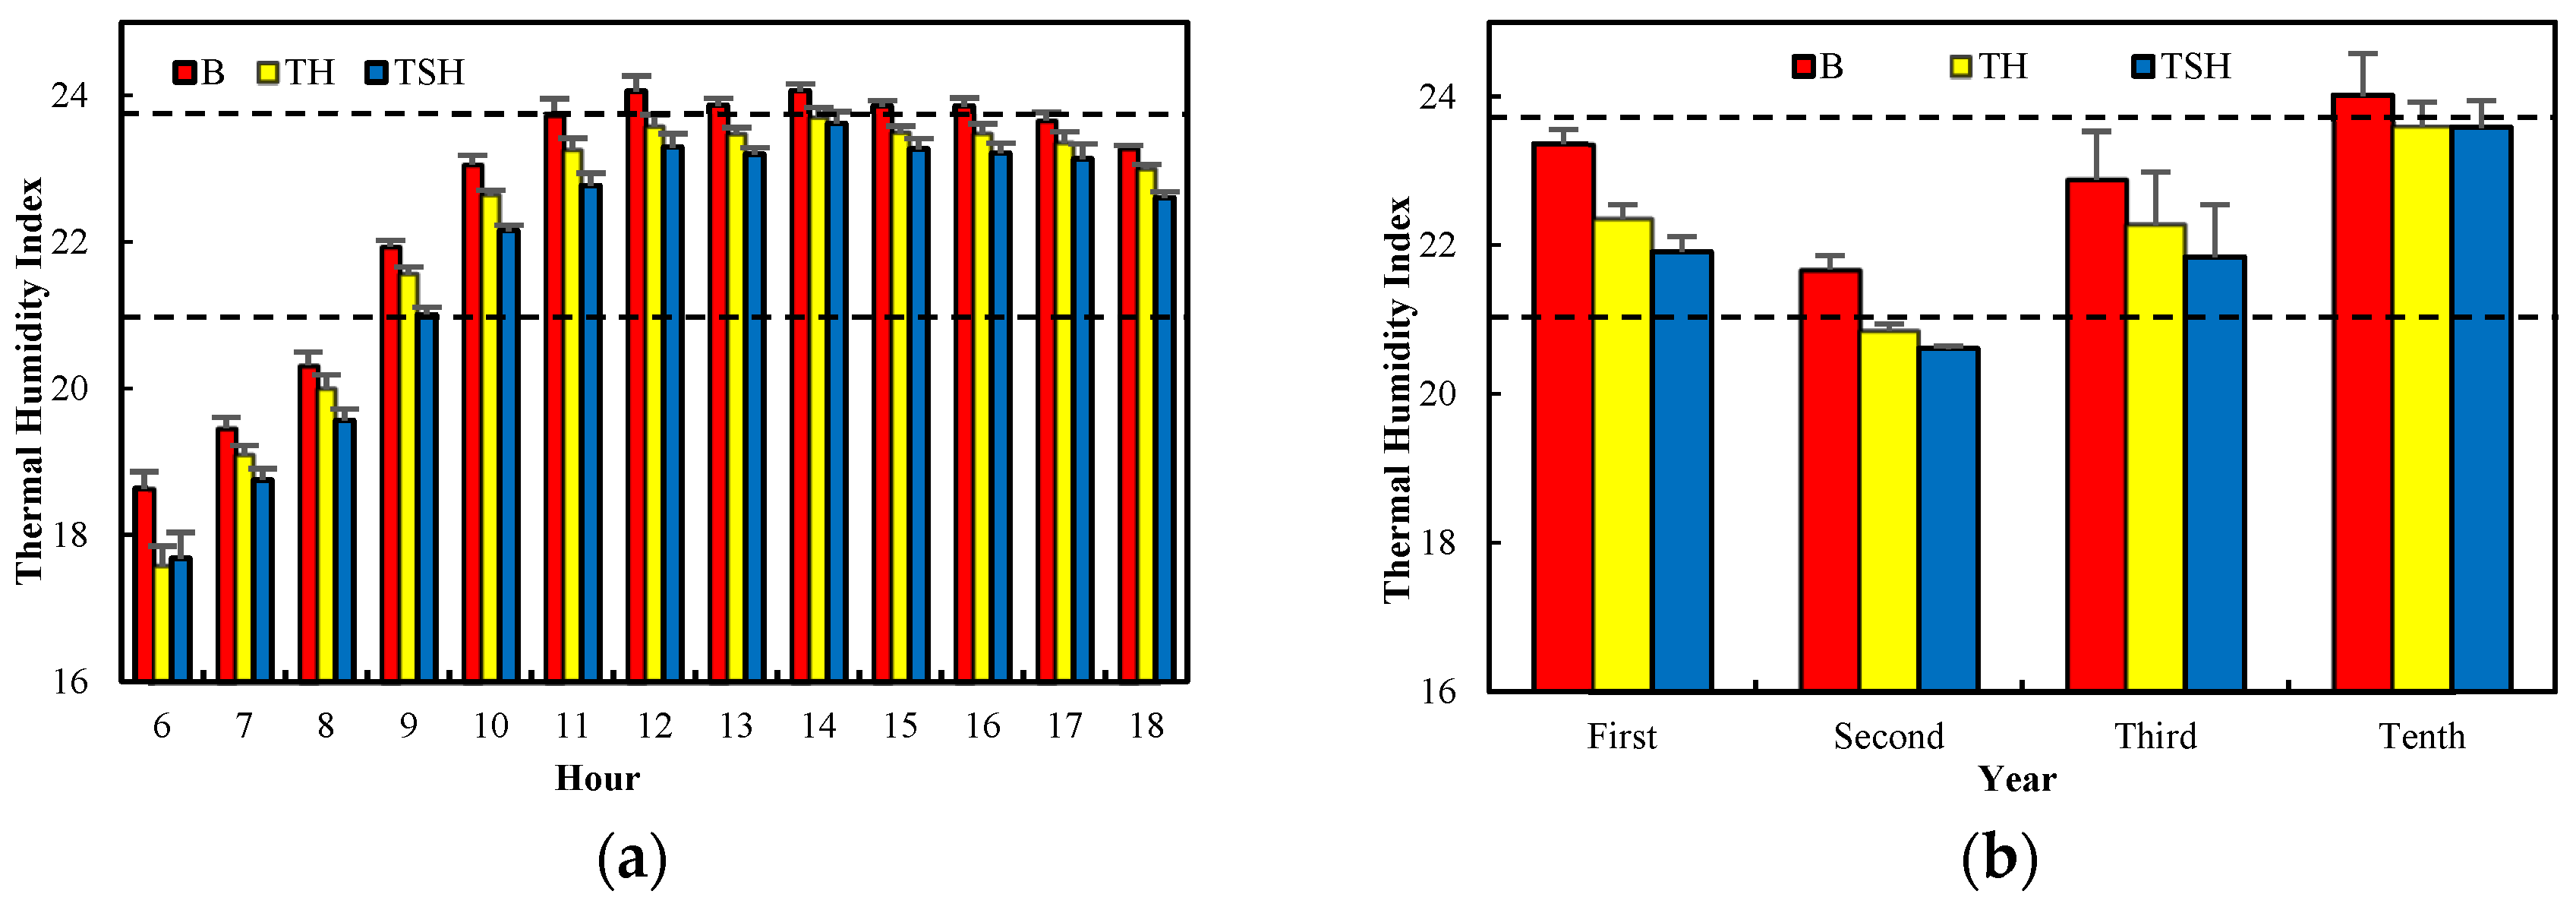
3.4. Human Comfort Index

The human comfort indices of different vegetation type combinations were calculated by Equation (1). The results show that the diurnal THI variations of the three vegetation type combinations were similar (Figure 9a). The THI rapidly rose from 6:00 to 12:00 and reached a maximum value at 14:00. The THI basically remained stable from 12:00 to 16:00 and decreased slowly from 16:00 to 18:00. Figure 9a shows that THIB > THITH > THITSH. According to the evaluation standard of the THI, THIB was classified as Level 1 from 6:00 to 8:00, Level 3 from 12:00 to 16:00 and Level 2 for other times; THITH was classified as Level 1 from 6:00 to 8:00 and Level 2 for other times; THITSH was classified as Level 1 from 6:00 to 9:00 and Level 2 for other times.
Figure 9b shows that THIB > THITH > THITSH for each year after the completion of the project. There was no significant difference among THIB, THITH and THITSH (p > 0.05). The THI was always stable at Level 2 for the three vegetation type combinations in the ten years, in addition to THITH and THITSH in the second year and THIB in the tenth year.

4. Discussion

Microclimate improvement dominated by temperature, humidity and wind speed has become an important indicator and index for evaluating the ecological restoration effects of urban river riparian zones [11,18].

4.1. Temperature

The cooling range of the vegetation community is mainly related to the plant composition level and crown density [23]. The monitoring point B was open and unshaded, with direct sunlight and strong reflection from the ground. Therefore, the temperature of bare land was highest. However, there were tall tree layers in TH and TSH. The species and density of trees have different effects on microclimate improvement [24]. P. cathayana has wide leaves and a high leaf density in the study area and can significantly impact the temperature. The reasons for cooling are attributed to the fact that the crown of P. cathayana can reduce the penetration of solar radiation and prevent the exchange of infrared radiation in the city. At the same time, the air in the upper layer is constantly exchanged with air in the lower layer, which can also have a cooling effect. T. repens can also effectively reduce infrared radiation from the ground. Therefore, TTH and TTSH were lower than TB. The shrub layer of TSH could further block solar radiation and absorb heat from the surrounding environment through transpiration, leading to a reduction in the environment and surface temperatures. However, there was no significant difference among TTH, TTSH and TTH − TSH in different periods and years. This explains why the two-layer plant combination already had a good temperature regulation function. Therefore, to reduce the cost of restoration, the use of shrub layers can appropriately be reduced in the ecological restoration of riparian zones. There was a significant difference among TB, TTH, and TTSH in the first three years of the project (p < 0.05). Although the average temperature of different vegetation type combinations also followed the order TB > TTH > TTSH in the tenth year, the temperature differences have reduced (Figure 4a). It indicates that the plant community had a regional effect in the riparian zone with the growth of trees and shrubs. The temperature of B could be affected by the regional control effect of TH and TSH in this region, leading to a reduction in the temperature difference. These results are similar to a study that showed that when the climate changed, the temperature of the park was only 1.1 °C lower than that of the adjacent square [25]. The temperatures of the three monitoring points did not decrease with increasing time in different restoration years. Although the monitoring times of different years were selected as being the same period as much as possible, the annual temperature was different due to the influence of global climate change and urban development. In addition, the restoration project could only play a microclimate regulation role on the temperature of a certain area and could not play a large-scale regulation role on the temperature of the whole city.

4.2. Relative Humidity

The plant community has an obvious humidification function in the understory environment [26]. The transpiration of vegetation and the evapotranspiration of soil produce more water vapor, but the forest canopy slows the transport of water vapor and is conducive to maintaining high air humidity in the forest [27]. Investigation of the effects of vegetation restoration on the Loess Plateau indicated that vegetation coverage has a good humidification effect [28]. Because B was not sheltered by trees and was affected by sunlight, HB was obviously lower than HTH and HTSH. HTH was slightly higher than HTSH. This is different from the results obtained by other researchers in which a community with many plant layers, a large crown density and high shrubs had the best humidification effect [26]. The reason for this was that the monitoring points were located in the riparian zone, and TH was not blocked by shrubs and was greatly affected by water evaporation due to its strong air circulation.
The plant community had not formed a stable structure at the preliminary stage of the restoration project. HTH and HTSH were greatly affected by river evaporation. There was no significant humidification effect for the multilayer vegetation combination. However, the growth of the shrub layer in TSH increased the crown density and plant quantity of microhabitats with increasing restoration years, forming a dominant community structure with temperature control and moisture preservation and narrowing the humidity difference between TSH and TH. HTH and HTSH were stabilized at approximately 75% in the third year of the restoration project. There was no significant difference between HTH and HTSH in the tenth year after carrying out the ecological restoration project. Affected by the community regional effect of TH and TSH, HB also increased, leading to a reduction in the humidity difference between different regions of engineering construction.
The multilayer plant community combination can effectively improve the relative humidity of the environment after long-term restoration. TSH requires long-term growth and development. However, TH can also maintain high relative humidity after restoration projects. Therefore, TH can be preferentially used in the construction of riparian restoration projects.

4.3. Wind Speed

Forestland can reduce the wind speed and weaken the intensity of air turbulence exchange near the ground [29]. Affected by river pressure, the wind speed of B was significantly higher than that of the area covered by vegetation. The wind speed of B changed significantly throughout the day. When the substratum airflow meets the forest belt, it will be blocked. A part of the airflow will pass through the gap of the forest belt, and the other part will be forced to pass over the forest belt. Therefore, the two-layer and three-layer vegetation combinations can effectively block the transverse wind. When compared to bare land, the wind speed of tree-herb decreased by 0.19 m/s, and, compared to tree-herb, the wind speed of tree-shrub-herb decreased by 0.25 m/s. Therefore, the average difference of wind speed was 0.22 m/s in different vegetation type combinations. STSH could also maintain a steady state throughout the day. SB − TH and SB − TSH further increased in the tenth year, indicating that the TH and TSH vegetation combinations had obvious advantages and could improve the microclimate after long-term restoration.
The TH vegetation type did not play a role in reducing wind power due to the large difference in height between trees and herbs at the preliminary stage of the restoration project. Because of the close distance to the river, STH was higher than SB. However, the plants lessening wind were further strengthened with the increase in restoration years. There was no significant difference between STH and STSH in the third year of the restoration project. The wind speeds remained low and steady. Therefore, if decreasing wind speed is considered in the ecological restoration project, two-layer and three-layer vegetation zones should be reasonably allocated. The three-layer vegetation zone can slow the riparian wind speed at the preliminary stage of the restoration project. The two-layer vegetation zone can achieve a good effect after the third year of the restoration project.

4.4. Human Comfort Level

The improvement of human comfort levels can increase happiness and health [30]. Urban microclimatic conditions have an important influence on the subjective thermal sensation of people [31]. The urban riparian zone is one of the main places for the recreation of residents. Improving the microclimate environment and human comfort levels is the main goal of riparian zone ecological restoration. Temperature is the main factor affecting the THI. The THI increases with increasing temperature. However, there was no significant change in human comfort levels in different periods. THIB was higher than 23.8 form 12:00 to 16:00. According to the evaluation standard of the THI, THIB reached an average comfortable level from 12:00 to 16:00, which may be not suitable for the recreation of residents. This indicates that areas with vegetation combinations are suitable for the recreation of residents and have a function with increasing comfort levels. Ecological restoration projects have a good social benefit.
The variation in the THI was the same as that of temperature in different vegetation combinations and different years during the ten years after ecological engineering. It was further verified that the THI was most affected by temperature. The THI did not decrease with increasing restoration time. This may be attributed to global warming and the heat island effect of urban development. The overall temperature of the city has increased, and the humidification effect of vegetation growth was significant (the relative humidity was stable at more than 73% in the third year), which placed the riparian zone at a relatively high temperature and high humidity microenvironment at noon in summer. The humid environment would have increased human thermal sensations and would have reduced human comfort levels [32], resulting in a transition in the human comfort levels between Levels 2 and 3. Although there was no significant difference in the THI among the different vegetation type combinations over the ten years, THITH was always lower than THITSH. This shows that plants can improve human comfort levels. However, there was no difference in human comfort levels between the two-layer and three-layer vegetation combinations.

5. Conclusions

Different vegetation type combinations can play a better role in regulating the microclimate in the construction of riparian ecological restoration projects. Vegetation combinations also have a regional control effect in improving the surrounding bare land microclimate. They could achieve a stable microclimate regulation function in the third year of a riparian ecological restoration project. There was no significant difference in regulating microhabitat temperature, relative humidity or wind speed between TH and TSH combinations from the long-term effect of microclimate regulation. Plants can improve human comfort levels. However, there was no difference in the human comfort index between TH and TSH. Therefore, TH combinations can be appropriately increased, and TSH combinations can be reduced in the construction of riparian ecological restoration projects. This can achieve the maximum microclimate regulation function through limited investment and realize the optimization of ecological benefits, economic benefits and social benefits.
Microclimate regulation is an important result of riparian ecological restoration project construction and its application has achieved a better effect in the evaluation of ecological restoration. The microclimate regulation function can be stable over three years and quickly reflects the effect of engineering construction. The improvement and stability of the microclimate regulation function can provide a scientific basis for the improvement of engineering schemes.

Author Contributions

Conceptualization, J.G. and H.J.; methodology, D.L.; software, G.D. and X.W.; validation, H.J., Y.W. and C.H.; investigation, J.G. and C.Z.; resources, H.J.; data curation, J.G.; writing—original draft preparation, J.G.; writing—review and editing, H.J. All authors have read and agreed to the published version of the manuscript.

Funding

This research was funded by the National Natural Science Foundation of China, grant numbers 41901116 and U19A2042, and the Foundation of Jilin Educational Committee, grant numbers JJKH20220448KJ.

Institutional Review Board Statement

Not applicable.

Informed Consent Statement

Not applicable.

Data Availability Statement

The date presented in this study are available on request from the corresponding author.

Conflicts of Interest

The authors declare no conflict of interest. The funders had no role in the design of the study; in the collection, analyses, or interpretation of data; in the writing of the manuscript, or in the decision to publish the results.

References

  1. Zelnik, I.; Mavrič Klenovšek, V.; Gaberščik, A. Complex Undisturbed Riparian Zones Are Resistant to Colonisation by Invasive Alien Plant Species. Water 2020, 12, 345. [Google Scholar] [CrossRef] [Green Version]
  2. Olokeogun, O.S.; Kumar, M. An indicator based approach for assessing the vulnerability of riparian ecosystem under the influence of urbanization in the Indian Himalayan city, Dehradun. Ecol. Indic. 2020, 119, 106796. [Google Scholar] [CrossRef]
  3. Palmer, M.; Ruhi, A. Linkages between flow regime, biota, and ecosystem processes: Implications for river restoration. Science 2019, 365, eaaw2087. [Google Scholar] [CrossRef] [PubMed] [Green Version]
  4. Bai, X.Y.; Zhu, X.F.; Jiang, H.B.; Wang, Z.Q.; He, C.G.; Sheng, L.X.; Zhuang, J. Purification Effect of Sequential Constructed Wetland for the Polluted Water in Urban River. Water 2020, 12, 1054. [Google Scholar] [CrossRef] [Green Version]
  5. Åberg, E.U.; Tapsell, S. Revisiting the River Skerne: The long-term social benefits of river rehabilitation. Landsc. Urban Plan. 2013, 113, 94–103. [Google Scholar] [CrossRef]
  6. Chen, D.S.; Pan, Y.Q.; Jin, X.L.; Du, H.Y.; Li, M.C.; Jiang, P.H. The delineation of ecological redline area for catchment sustainable management from the perspective of ecosystem services and social needs: A case study of the Xiangjiang watershed, China. Ecol. Indic. 2021, 121, 107130. [Google Scholar] [CrossRef]
  7. Li, K.; Zhang, Z.X.; Yang, H.J.; Bian, H.F.; Jiang, H.B.; Sheng, L.X.; He, C.G. Effects of instream restoration measures on the physical habitats and benthic macroinvertebrates in an agricultural headwater stream. Ecol. Eng. 2018, 122, 252–262. [Google Scholar] [CrossRef]
  8. Wang, W.D.; Yang, T.; Guan, W.B.; Peng, W.X.; Wu, P.; Zhong, B.; Zhou, C.D.; Chen, Q.H.; Zhang, R.B.; Xu, K.W.; et al. Ecological wetland paradigm drives water source improvement in the stream network of Yangtze River Delta. J. Environ. Sci. 2021, 110, 55–72. [Google Scholar] [CrossRef]
  9. Wang, Y.; Dewancker, B.J.; Qi, Q.L. Citizens’ preferences and attitudes towards urban waterfront spaces: A case study of Qiantang riverside development. Environ. Sci. Pollut. Res. 2020, 27, 45787–45801. [Google Scholar] [CrossRef]
  10. Zhao, Y.W.; Zhou, L.Q.; Dong, B.Q.; Dai, C. Health assessment for urban rivers based on the pressure, state and response framework—A case study of the Shiwuli River. Ecol. Indic. 2019, 99, 324–331. [Google Scholar] [CrossRef]
  11. Capon, S.J.; Chambers, L.E.; Mac Nally, R.; Naiman, R.J.; Davies, P.; Marshall, N.; Pittock, J.; Reid, M.; Capon, T.; Douglas, M.; et al. Riparian Ecosystems in the 21st Century: Hotspots for Climate Change Adaptation? Ecosystems 2013, 16, 359–381. [Google Scholar] [CrossRef]
  12. Wohl, E.; Lane, S.N.; Wilcox, A.C. The science and practice of river restoration. Water Resour. Res. 2015, 51, 5974–5997. [Google Scholar] [CrossRef] [Green Version]
  13. Palmer, M.A.; Hondula, K.L.; Koch, B.J. Ecological Restoration of Streams and Rivers: Shifting Strategies and Shifting Goals. Annu. Rev. Ecol. Evol. Syst. 2014, 45, 247–269. [Google Scholar] [CrossRef] [Green Version]
  14. Barradas, V.L.; Esperon-Rodriguez, M. Ecophysiological Vulnerability to Climate Change in Mexico City’s Urban Forest. Front. Ecol. Evol. 2021, 9, 732250. [Google Scholar] [CrossRef]
  15. Skelhorn, C.; Lindley, S.; Levermore, G. The impact of vegetation types on air and surface temperatures in a temperate city: A fine scale assessment in Manchester, UK. Landsc. Urban Plan. 2014, 121, 129–140. [Google Scholar] [CrossRef]
  16. Leal Filho, W.; Wolf, F.; Castro-Díaz, R.; Li, C.L.; Ojeh, V.N.; Gutiérrez, N.; Nagy, G.J.; Savić, S.; Natenzon, C.E.; Al-Amin, A.Q.; et al. Addressing the urban heat islands effect: A cross-country assessment of the role of green infrastructure. Sustainability 2021, 13, 753. [Google Scholar] [CrossRef]
  17. Li, Y.L.; Fan, S.X.; Li, K.; Zhang, Y.; Kong, L.X.; Xie, Y.F.; Dong, L. Large urban parks summertime cool and wet island intensity and its influencing factors in Beijing, China. Urban For. Urban Green. 2013, 113, 94–103. [Google Scholar] [CrossRef]
  18. Lemonsu, A.; Amosse, A.; Chouillou, D.; Gaudio, N.; Haoues-Jouve, S.; Hidalgo, J.; Le Bras, J.; Legain, D.; Marchandise, S.; Tudoux, B. Comparison of microclimate measurements and perceptions as part of a global evaluation of environmental quality at neighbourhood scale. Int. J. Biometeorol. 2020, 64, 265–276. [Google Scholar] [CrossRef] [Green Version]
  19. Voogt, J.A.; Oke, T.R. Thermal remote sensing of urban climates. Remote Sens. Environ. 2003, 86, 370–384. [Google Scholar] [CrossRef]
  20. Ciobotaru, A.M.; Andronache, I.; Dey, N.; Petralli, M.; Daneshvar, M.R.M.; Wang, Q.; Radulovic, M.; Pintilii, R.D. Temperature-Humidity Index described by fractal Higuchi Dimension affects tourism activity in the urban environment of Focşani City (Romania). Arch. Meteorol. Geophys. Bioclimatol. Ser. B 2019, 136, 1009–1019. [Google Scholar] [CrossRef]
  21. Chow, W.T.L.; Akbar, S.N.; Assyakirin, B.A.; Heng, S.L.; Roth, M. Assessment of measured and perceived microclimates within a tropical urban forest. Urban For. Urban Green. 2016, 16, 62–75. [Google Scholar] [CrossRef] [Green Version]
  22. John, R.M. Climatology Fundamentals and Applications; McGraw-Hill Book: New York, NY, USA, 1974. [Google Scholar]
  23. Lin, B.B.; Egerer, M.H.; Liere, H.; Jha, S.; Bichier, P.; Philpott, S.M. Local- and landscape-scale land cover affects microclimate and water use in urban gardens. Sci. Total Environ. 2018, 610, 570–575. [Google Scholar] [CrossRef] [PubMed]
  24. Sodoudi, S.; Zhang, H.W.; Chi, X.L.; Mueller, F.; Li, H.D. The influence of spatial configuration of green areas on microclimate and thermal comfort. Urban For. Urban Green. 2018, 34, 85–96. [Google Scholar] [CrossRef]
  25. Thorsson, S.; Honjo, T.; Lindberg, F.; Eliasson, I.; Lim, E.M. Thermal comfort and outdoor activity in Japanese urban public places. Environ. Behav. 2007, 39, 660–684. [Google Scholar] [CrossRef]
  26. Wang, Y.R.; Duan, M.J.; Wang, Q.; Xie, J.F.; Yang, C. Ecological health care effect of healthy greenways in urban community belt parks. Landsc. Ecol. Eng. 2022, 25, 1–16. [Google Scholar] [CrossRef]
  27. Kovács, B.; Tinya, F.; Ódor, P. Stand structural drivers of microclimate in mature temperate mixed forests. Agric. For. Meteorol. 2017, 234, 11–21. [Google Scholar] [CrossRef] [Green Version]
  28. Wang, C.; Liang, W.; Yan, J.; Jin, Z.; Zhang, W.; Li, X. Effects of vegetation restoration on local microclimate on the Loess Plateau. J. Geogr. Sci. 2022, 32, 291–316. [Google Scholar] [CrossRef]
  29. Barčić, D.; Habjanec, V.; Španjol, Ž.; Šango, M. Analysis of raising windbreaks on the mediterranean Karst of Croatia. Sumar. List 2021, 145, 175–183. [Google Scholar] [CrossRef]
  30. Liu, B.Y.; Lian, Z.F.; Brown, R.D. Effect of Landscape Microclimates on Thermal Comfort and Physiological Wellbeing. Sustainability 2019, 11, 5387. [Google Scholar] [CrossRef] [Green Version]
  31. Johansson, E.; Yahia, M.W.; Arroyo, I.; Bengs, C. Outdoor thermal comfort in public space in warm-humid Guayaquil, Ecuador. Int. J. Biometeorol. 2018, 62, 387–399. [Google Scholar] [CrossRef] [Green Version]
  32. Yan, H.Y.; Liu, Q.Q.; Zhao, W.; Pang, C.M.; Dong, M.R.; Zhang, H.; Gao, J.Y.; Wang, H.Y.; Hu, B.; Yang, L.; et al. The coupled effect of temperature, humidity, and air movement on human thermal response in hot–humid and hot–arid climates in summer in China. Build. Environ. 2020, 177, 106898. [Google Scholar] [CrossRef]
Figure 1. Location of the study area.
Water 14 01932 g001
Figure 2. (a) The monitoring point of B; (b) The monitoring point of TH; (c) The monitoring point of TSH (Photos by Haibo Jiang on 23 August 2012).
Water 14 01932 g002
Figure 3. (a) Temperature variations for each hour in different vegetation type combinations; (b) Average diurnal temperature in different vegetation type combinations. (a,b): the different letters indicate that there is a significant difference between two vegetation type combinations (p < 0.05).
Water 14 01932 g003
Figure 4. (a) Average temperature of different vegetation type combinations in different restoration years; (b) Temperature differences of different vegetation type combinations in different restoration years. ns: there is no significant difference for temperature among different restoration years. (a–d): the different letters indicate that there is a significant difference between two vegetation type combinations (p < 0.05).
Water 14 01932 g004
Figure 5. (a) Relative humidity variations for each hour in different vegetation type combinations; (b) Average of diurnal relative humidity in different vegetation type combinations. (a,b,ab): the different letters indicate that there is a significant difference between two vegetation type combinations (p < 0.05).
Water 14 01932 g005
Figure 6. (a) Average relative humidity of different vegetation type combinations in different restoration years; (b) Relative humidity differences of different vegetation type combinations in different restoration years. (a–d): the different letters indicate that there is a significant difference between two vegetation type combinations (p < 0.05).
Water 14 01932 g006
Figure 7. (a) Wind speed variations for each hour in different vegetation type combinations; (b) Average of diurnal wind speed in different vegetation type combinations. (a–c): the different letters indicate that there is a significant difference between two vegetation type combinations (p < 0.05).
Water 14 01932 g007
Figure 8. (a) Average wind speeds of different vegetation type combinations in different restoration years; (b) Wind speed differences of different vegetation type combinations in different restoration years. (a–c): the different letters indicate that there is a significant difference between two vegetation type combinations (p < 0.05).
Water 14 01932 g008
Figure 9. (a) THI variations for each hour in different vegetation type combinations; (b) Average THI of different vegetation type combinations in different restoration years.
Water 14 01932 g009
Table 1. Evaluation standard of the temperature–humidity index (THI).
Evaluation GradeTHIHuman Comfort Level
1≤21.1High comfortable
2>21.1~23.8Comfortable
3>23.8~26.6Average comfortable
4>26.6~29.4Uncomfortable
5>29.4Extraordinary uncomfortable
Publisher’s Note: MDPI stays neutral with regard to jurisdictional claims in published maps and institutional affiliations.

