
Quantifying the Contributions of Climate Change and Human Activities to Maize Yield Dynamics at Multiple Timescales


State Key Laboratory of Eco-hydraulics in Northwest Arid Region of China, Xi’an University of Technology, Xi’an 710048, China
*
Author to whom correspondence should be addressed.
Water 2022, 14(12), 1927; https://doi.org/10.3390/w14121927
Submission received: 9 May 2022
/
Revised: 13 June 2022
/
Accepted: 14 June 2022
/
Published: 15 June 2022
(This article belongs to the Special Issue Impacts of Climate Change on Water Resources and Water Risks)
Abstract
:Under a changing environment, the effect of climate change and human activities on maize yield is vital for ensuring food security and efficient socio-economic development. The time series of maize yield is generally non-stationary and contains different frequency components, such as long- and short-term oscillations. Nevertheless, there is no adequate understanding of the relative importance of climate change. In addition, human activities on maize yield at multiple timescales remain unclear, which help in further improving maize yield prediction. Based on the ensemble empirical mode decomposition method (EEMD), the method of dependent variable variance decomposition (DVVD) and the Sen-slope method, the effect of climate change including growing-season precipitation and temperature (i.e., GSP, GEP, CDD, GST, GSMAT, and GSMT) and human activities including effective irrigation area (EIA) and the consumption of chemical fertilizers (CCF) on maize yield were explored at multiple timescales during 1979–2015. The Heilongjiang Province, a highly important maize production area in China, was selected as a case study. The results of this work indicate the following: (1) The original maize yield series was divided into 3.1-, 7.4-, 18.5-, and 37-year timescale oscillations and a residual series with an increasing trend, where the 3.1-year timescale (IMF1), the 18.5-year timescale (IMF3), and the increasing trend (R) were dominant; (2) the original sequence was mainly affected by human activities; (3) climate change and human activities had different effects on maize yield at different timescales: The short-term oscillation (IMF1) of maize yield was primarily affected by climate change. However, human activities dominated the mid- and long-term oscillations (IMF3 and R) of maize yield. This study sheds new insight into multiple timescale analysis of the role of climate and human activities on maize yield dynamics.
1. Introduction
In the past few decades, climate change has turned into one of the most studied topics, with its serious impact on socio-economic, environmental, and biological issues, by numerous domestic and foreign scholars [1,2,3]. Notably, agriculture in developing countries is likely one of the sectors most negatively affected by climate change [4,5]. Despite significant advances in technology and crop yields, food production and safety remain deeply dependent on weather and climate change, as temperature and precipitation are the main drivers of crop growth [6,7,8].
As a result, food security problems caused by extreme climate events have sparked research and public interest in the analysis of climate change [9,10] and agricultural production [11]. A number of studies have explored the effect of climate change on crop yield [12]. As mentioned above, long-term fluctuations in crop yield are closely related to climatic factors, such as temperature and precipitation [13,14]. Nevertheless, most of these studies focused on single timescales using the traditional time series analysis (correlation analysis and linear regression models) or crop growth models [13,15,16,17]. The effect of climate variables on crop yields is scale-dependent [18,19,20]. Single timescale analysis cannot comprehensively reveal the response of crop yield to climate change, and may ignore some important information on other timescales. Meanwhile, climate variability is traditionally very well characterized across timescales, such as annual, inter-annual, and inter-decadal scales [21,22,23,24,25].
In addition to climate change, human activities are a major driver of crop yields [26,27,28,29]. Over the past two decades, crop yields have increased dramatically, driven by the use of fertilizers, improved crop varieties, and agronomic management [30,31]. For example, Niu et al. [32] indicated that at the present cultivation levels (planting of 67,500 plants/ha with 225 kg/ha nitrogen application), the genetic improvement, agronomic-management improvement, and genotype–agronomic management interaction had resulted in yield increases in Northeast China during the last six decades. During this time, contributions leading to increases were 45.4%, 30.9%, and 23.7%, respectively. However, how crops respond to climate change and human activities on different timescales remains unresolved. In fact, the time series of crop yield and climate variables containing different frequency components, such as long- and short-term oscillations, are generally non-stationary [33,34,35,36]. To increase our awareness of the impacts of climate change and develop adaptation practices, it is necessary to separate the effect of climate change from the effect of each climate variable on observed changes in crop yield [37]. Therefore, selecting an appropriate method to divide those non-stationary time series into variations on multiple timescales tends to be critical, which may be conducive to truthfully and comprehensively reveal the relationship between crop yield and climate change at different timescales.
The ensemble empirical mode decomposition (EEMD) method used to linearize and smooth the nonlinear and non-stationary signals [38] has a significant advantage in dealing with non-stationary signals. The method can separate the fluctuations of different timescales and produce a series of intrinsic mode functions (IMFs) containing local characteristic information on different timescales of the original signal and residual (R), which retains the data in the process of decomposition characterization [38]. In this study, we employ the EEMD method to explore the multi-scale characteristics of crop yield fluctuations and their correlations between major influencing factors, which provide new insight into the impact of various climatic influencing factors on maize yield fluctuations at multiple timescales. This work helps in quantifying the impact of climate change on grain production variations, thereby providing support for reliable grain production forecasting. Maize is the crop with the largest planting area and production in China. In accordance with the FAO, the planted area of maize in 2016 was 36.8 million ha and production was 219.6 million tons [39]. The main crop in Heilongjiang Province is maize, which is also an important commodity grain production base in China. Consequently, this study selected maize yield in Heilongjiang Province as the research object. Moreover, since the overall trend in enhancing food production is predominantly caused by human activities (e.g., technological advances, fertilization, irrigation, etc.) [40,41], the impact of human activities on food production was also investigated in this study.
In this study, maize yield, climate change, and human activities at multiple timescales were extracted using the EEMD method. Their effect at multiple timescales was further explored to provide scientific knowledge for food security. Therefore, the main objectives of this study are: (1) To determine which timescale is dominantly responsible for maize yield; (2) to evaluate the relative importance of climate change and human activities on maize yield. Section 2 describes the study database and methods.
2. Materials and Methods
2.1. Data Sources
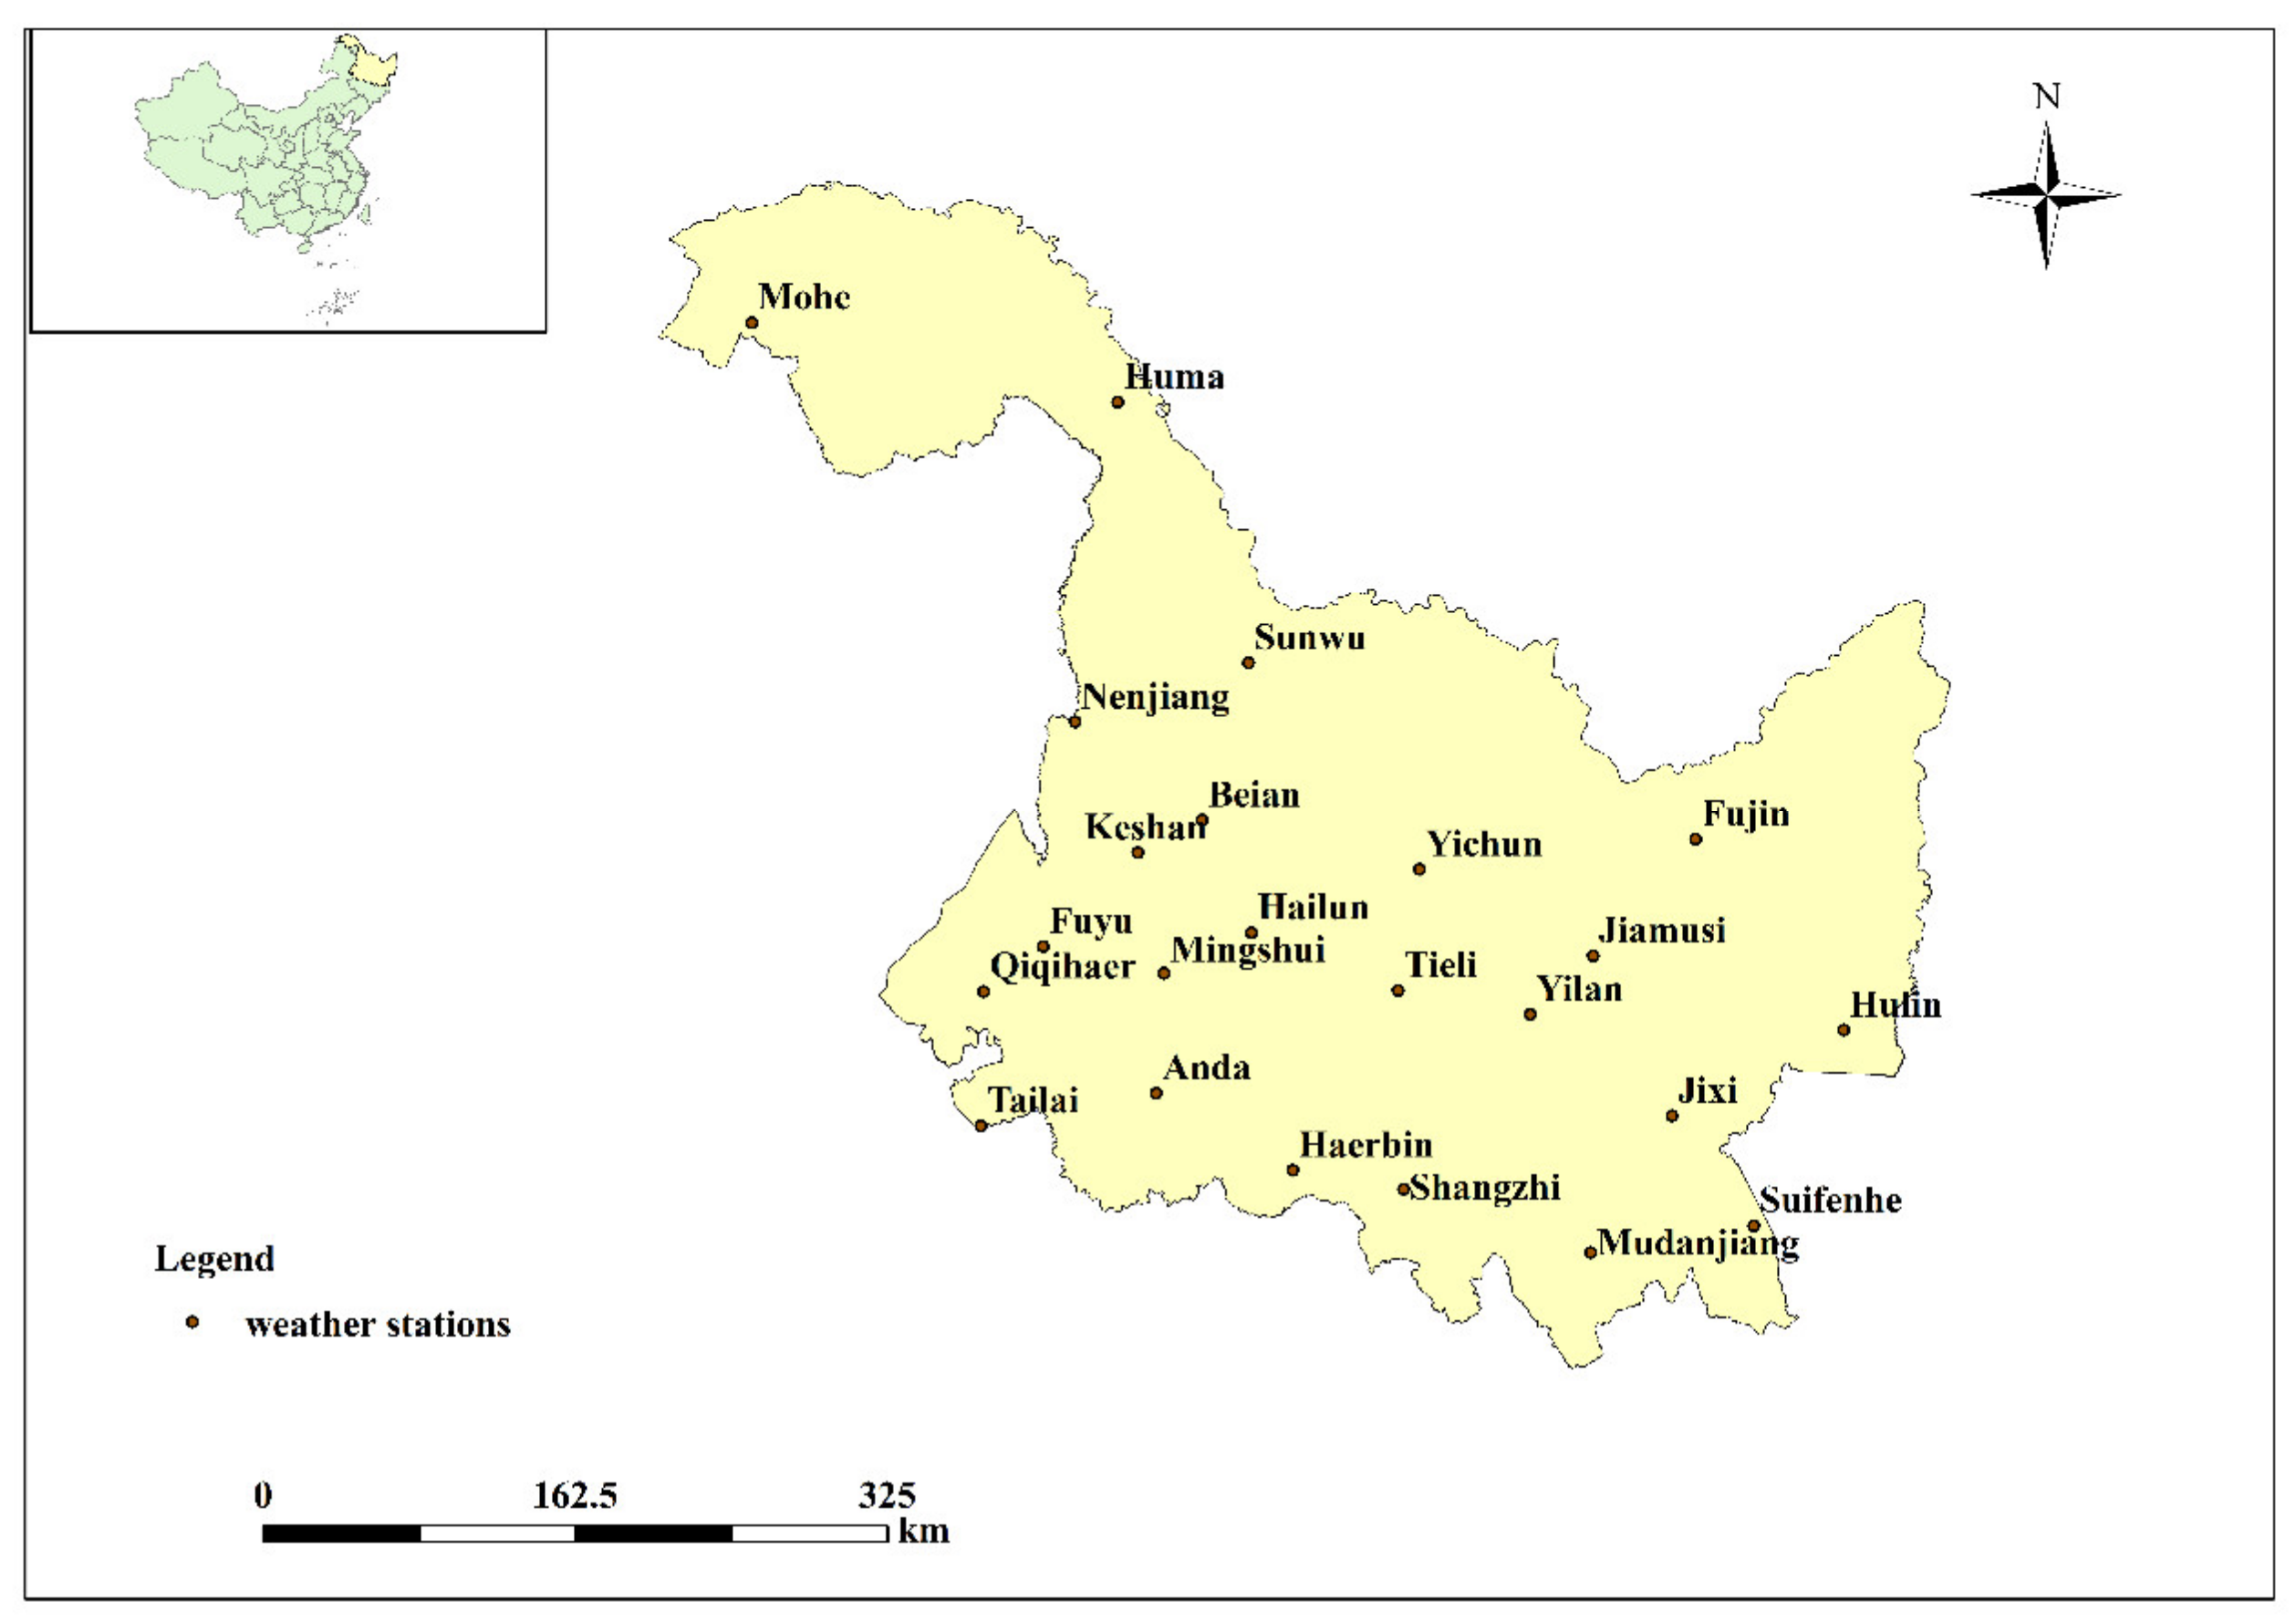
Heilongjiang Province is located in the northeast frontier of China and one of the major crop producing areas in China (Figure 1). Fertile soil and abundant photo-thermal resources provide a high-yield potential for maize production [42,43].
This study used annual, province-level yield per acre data for corn as well as the effective irrigation area (EIA) and the consumption of chemical fertilizers (CCF) data during 1979–2015 from the Ministry of Agriculture and Rural Affairs of the People’s Republic of China (http://sjcx.fldj.agri.cn/moazzys/nongqing.aspx accessed on 1 January 2019). Daily precipitation and temperature data during the period of 1979–2015 were collected by a network of approximately 23 weather stations (Figure 1) provided by Climatic Data Center, National Meteorological Information Center, China Meteorological Administration (http://cdc.cma.gov.cn/ accessed on 1 January 2019). The daily precipitation and daily temperature of the 23 weather stations were averaged over the whole provincial scale. The growing-season precipitation (GSP), the growing-season extremely wet day precipitation amount (GEP), the growing-season consecutive dry days (CDD), the growing-season mean temperature (GST), the growing-season mean maximum temperature (GSMAT), and the growing-season mean minimum temperature (GSMT) were calculated here as the seven main influencing climatic factors since they had strong relationships with maize yield in Heilongjiang Province, China.
2.2. Methods
2.2.1. The Ensemble Empirical Mode Decomposition
Ensemble Empirical mode decomposition (EEMD) is an adaptive method for separating the spectrum of nonlinear and non-stationary signals [44]. It decomposes a given time series or signal in components with different frequencies and amplitudes, known as intrinsic mode functions (IMFs). These IMFs have two attributes that differentiate them from other signals:
- The number of extreme and zero crossings must differ at most by one.
- The mean value between the upper and lower envelope is zero.
- The original time series can be written as Equation (1).
However, for EEMD, there is a problem caused by mode mixing, which can result in an overestimation of the noise in the signal [38]. Therefore, the ensemble empirical mode decomposition (EEMD) method was advanced by adding white noise to the original series, as follows [38]:
First, we added a number (l) of Gaussian white noise to the original signal to obtain a number of noisy pseudo signals .
is adopted as 1000 in this paper.
Second, the EEMD method was applied to these noisy pseudo signals .
Finally, the ith EEMD IMF and rn(t) are obtained by averaging the corresponding EEMD IMFs and residual of these noisy pseudo signals, as follows:
where cij and rnj denote the ith IMF and rn(t) from .
Therefore, EEMD produces a finite number of IMFs and a residual rn(t). Each IMF component represents the oscillation of the original time series at one timescale. The residual reflects the long-term trend of the original sequence.
The mean period of the ith IMF component can be obtained by counting the number of its peaks (local maxima), and then dividing it by the time length (n). The variance contributions were determined to assess the relative importance of each IMF component:
The residual is as follows:
where and are the variance contributions of the ith IMF component and residual (rn(t)), respectively. and are the variance of the ith IMF component and residual (rn(t)).
2.2.2. Method of Dependent Variable Variance Decomposition
Fan [45] was the first to propose the method of dependent variable variance decomposition (DVVD), and then theorized it to study the income gap. It is specifically used to decompose the contribution of each variable that affects the income gap. Theoretically, this method can be used to study the contribution of an independent variable to the variance of a dependent variable based on linear regression equation [45,46]. This paper introduced the method to quantitatively evaluate the sensitivity of climatic factors on maize yield.
Suppose the regression equation is expressed as:
where is the ith independent, is the coefficient of , and h is the number of independent variables. VE, the explainable part of the regression equation, can be obtained by multiplying R2 by the variance V of Y, namely:
The following estimates the contribution of Xi to VE, including two aspects:
First, the direct contribution of sample variance of the sample itself to sample variance of Y, namely:
Second, Xi indirectly contributes to the variance of Y sample due to its correlation with other variables Xj, , namely:
Finally, we added these two together and divided by VE, which is the contribution of Xi to sample variance of Y and can be explained, namely:
The estimated contribution to the variation of maize yield can be understood as the sensitivity of different climatic factors on individual maize yield differences. In this study, the threshold of 3% was selected as it represented a relatively large response of the main influencing factors for the quantitative analysis of the impact of climate change and human activities on maize yield.
2.2.3. Residual Analysis
In this study, the residual trend method was used to distinguish the effect of climate change and human activities on maize yield [47,48]. To deeply understand the relationship between maize yield and climate change and human activities, multivariate regression analysis was conducted [49,50]. The relationship between maize yield and human activities was calculated using multivariate regression analysis. This relationship was used to obtain the predicted maize yield. The difference between the observed maize yield () and the predicted maize yield () was evaluated at different timescales. This difference is the residual (), which is the maize yield change and is not due to human activities. The trend of , , and were calculated by the Sen-slope method [51].
Sen-slope method uses the median value of the slope sequence as the basis of the trend judgment, which can eliminate the influence of data deletion or abnormality on the trend test to a certain extent [51]. The Sen-slope formula is:
where Sen is the Sen-slope value, and are the sequence values of s and t, respectively, and 1 ≤ t < s ≤ k, k is the sequence length. Then, we can calculate the , , and in accordance with Equation (12).
Finally, we calculated the relative role of climate variations and human activities in vegetation change based on , , and , as shown in Table A1 [34,52] in Appendix A.
3. Results
3.1. Multiple Timescale Analysis
3.1.1. Multiple Timescale Analysis of Maize Yield
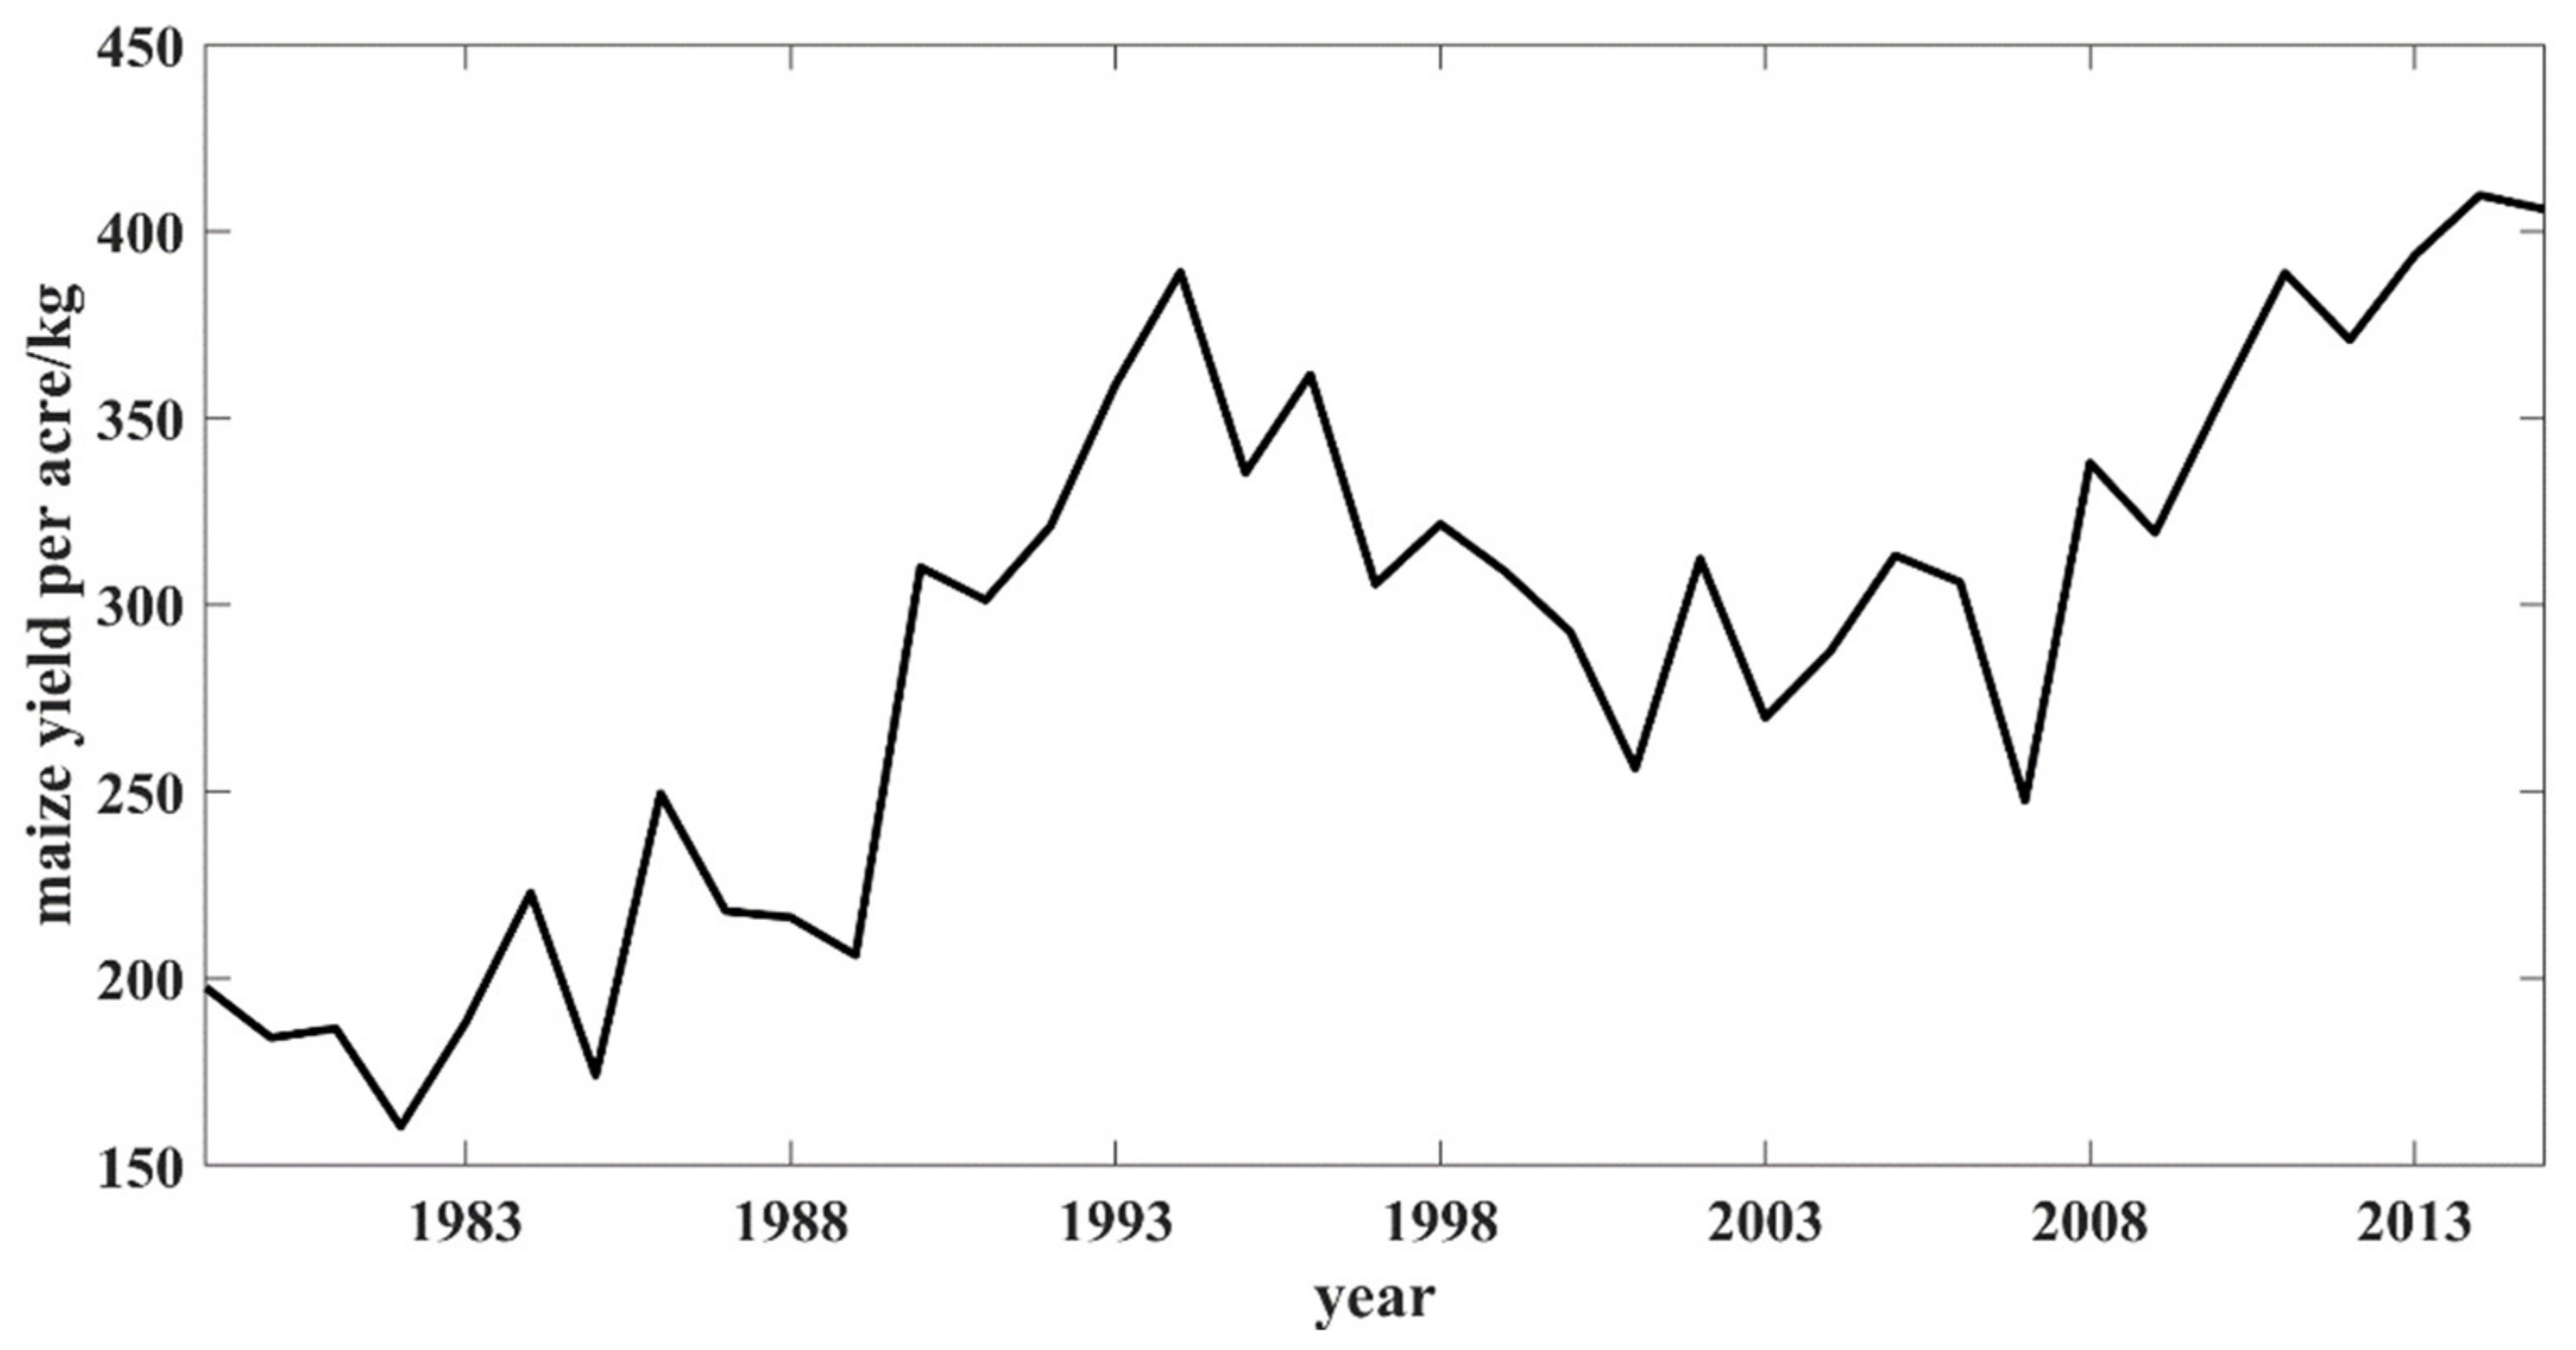
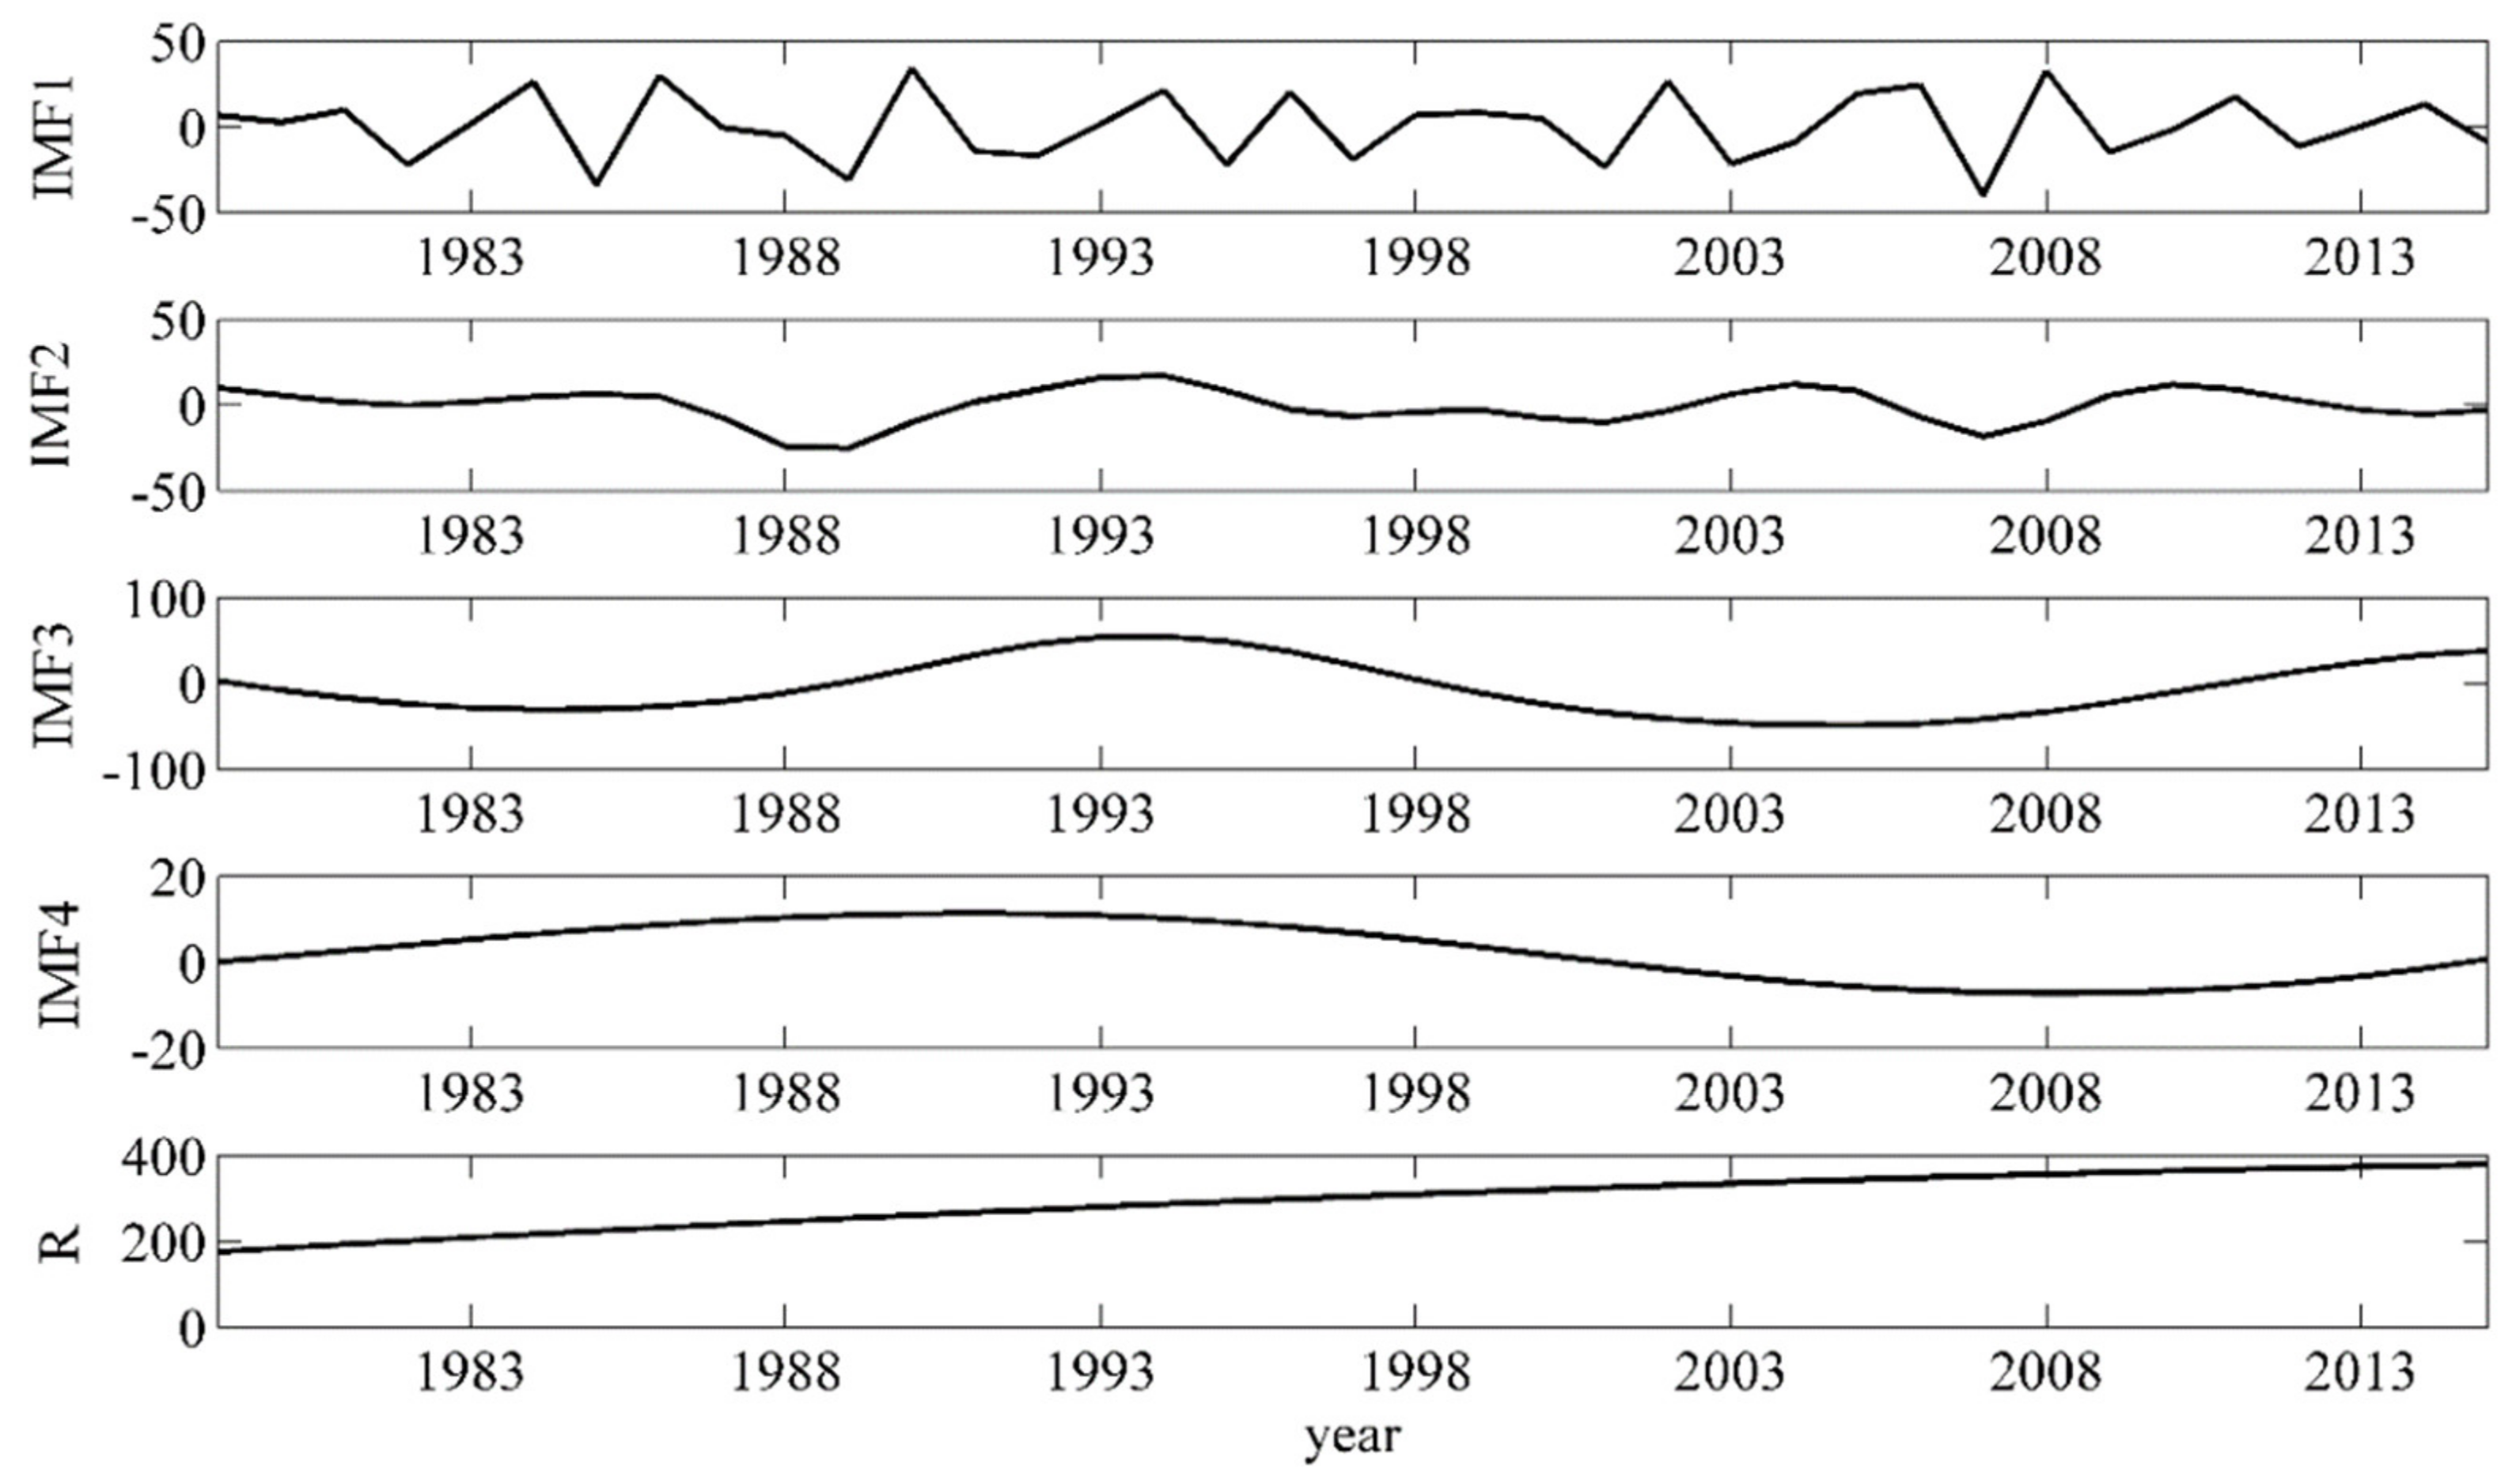
To explore the effect of climate change on maize yield in Heilongjiang Province, China at different timescales, multiple timescale analysis was performed using EEMD for maize yield during 1979–2015. Figure 2 exhibits the temporal change in original signal of maize yield. There was a clear upward trend in the temporal change (Mann–Kendall test value is 4.95). Figure 3 and Table 1 indicated the temporal changes in maize yield, and the average periods with their respective variance contributions at different timescales.
Maize yield sequence (original sequence) is divided into four IMF components and a residual (Figure 3 and Table 1). IMF3 shows the greatest variance contribution in IMFs, followed by IMF1. The contributions of IMF2 and IMF4 were very small (1.86 and 0.79%, respectively), and thus were not considered in the following analyses. The residual showed an increasing trend, with 70.82% variance contribution, which was much larger than the other components. Therefore, the result suggested that maize yield in Heilongjiang Province, China was mostly characterized by 18.5- and 3.1-year timescale oscillations and an increasing trend.
3.1.2. Multiple Timescale Analysis of Climate Change
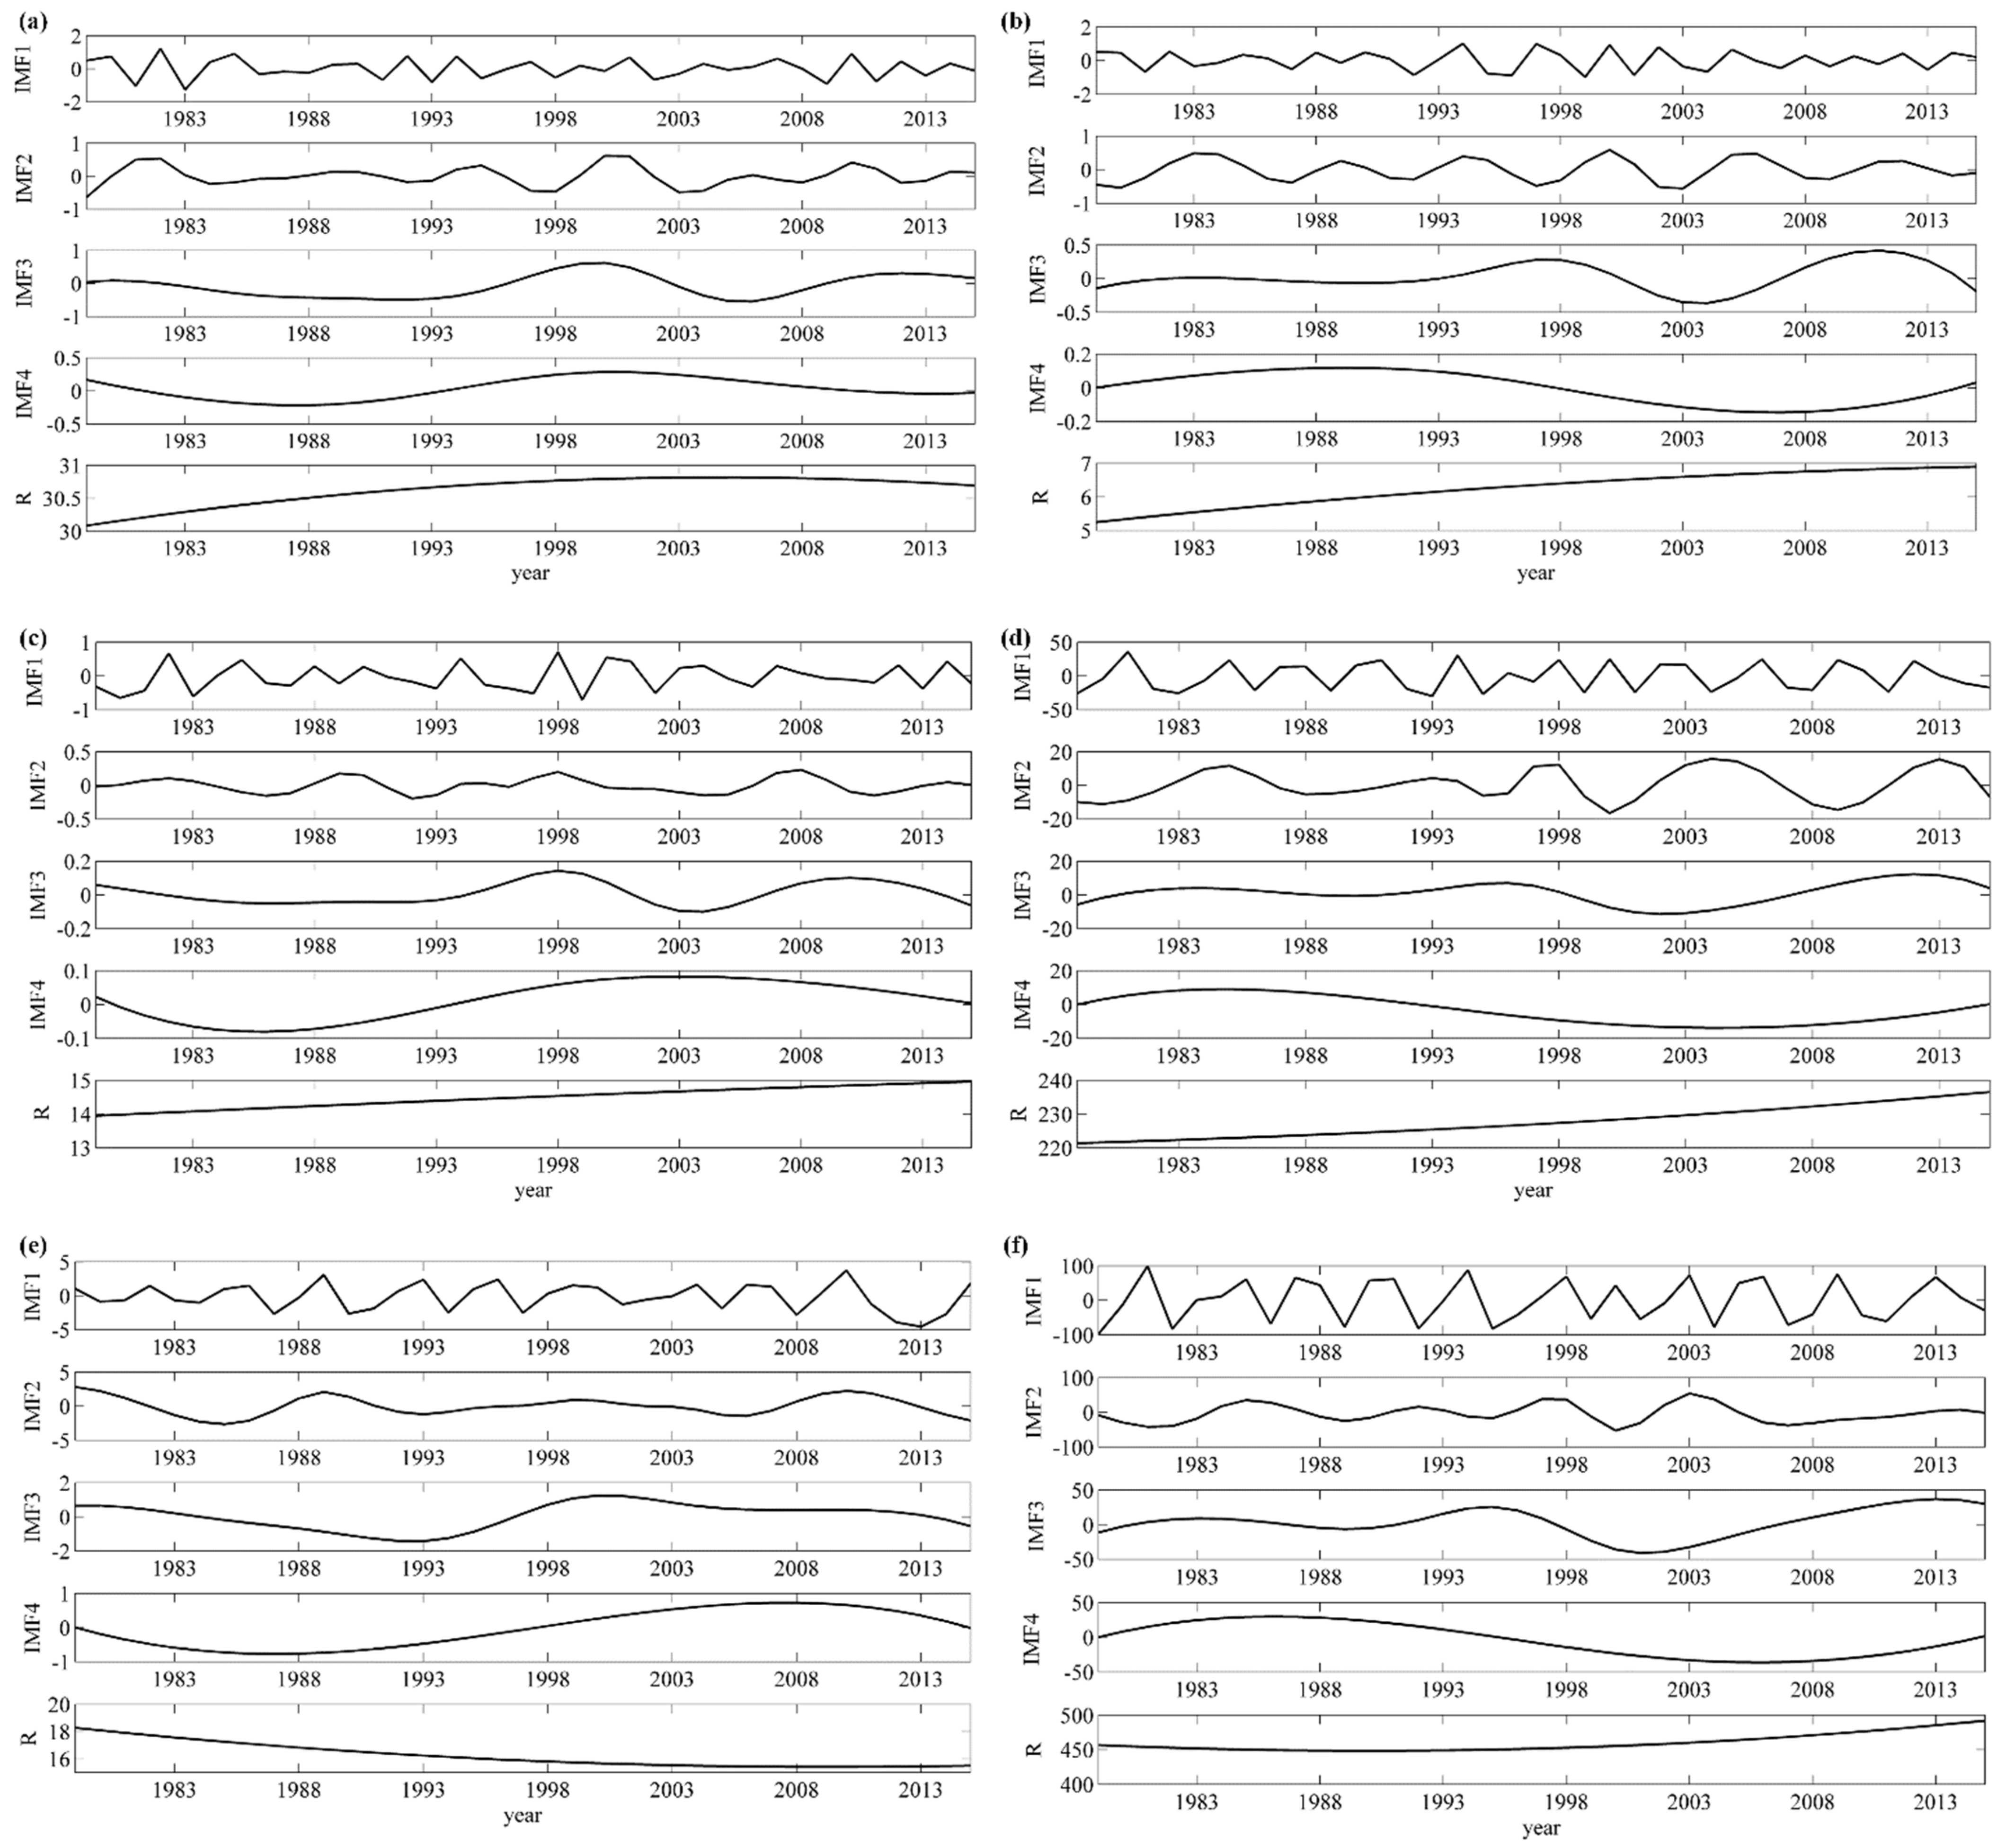
To reveal the changes in GSP, GEP, CDD, GST, GSMAT, and GSMT at different timescales, multiple timescale analysis was performed using EEMD during 1979–2015. Figure 4 and Table 2 indicated the temporal changes, and the average periods and their variance contributions of GSP, GEP, CDD, GST, GSMAT, and GSMT at different timescales.
The GSP changes in Heilongjiang Province, China showed four oscillations at 3.3-, 7.4-, 12.3-, and 33-year timescales and a residual, among which the 3.3- and 12.3-year timescale oscillations and the long-term trend were the main components (Figure 4 and Table 2). The GEP and CDD showed similar oscillation characteristics with GSP. Notably, the CDD exerted a slight decreased trend, which was contrary to GSP and GEP. In addition, for the long-term trend, the GST increased rapidly and then gradually, with variance contribution smaller than the 3.3-year oscillation. The GSMT had the same variability as GST. However, the temporal changes in GSMAT were slightly different from GST and GSMT. The variance contribution of the long-term was less than GST and GSMT, which suggested that GSMAT mainly focused on the oscillation characteristics rather than the trend.
3.1.3. Multiple Timescale Analysis of Human Activities
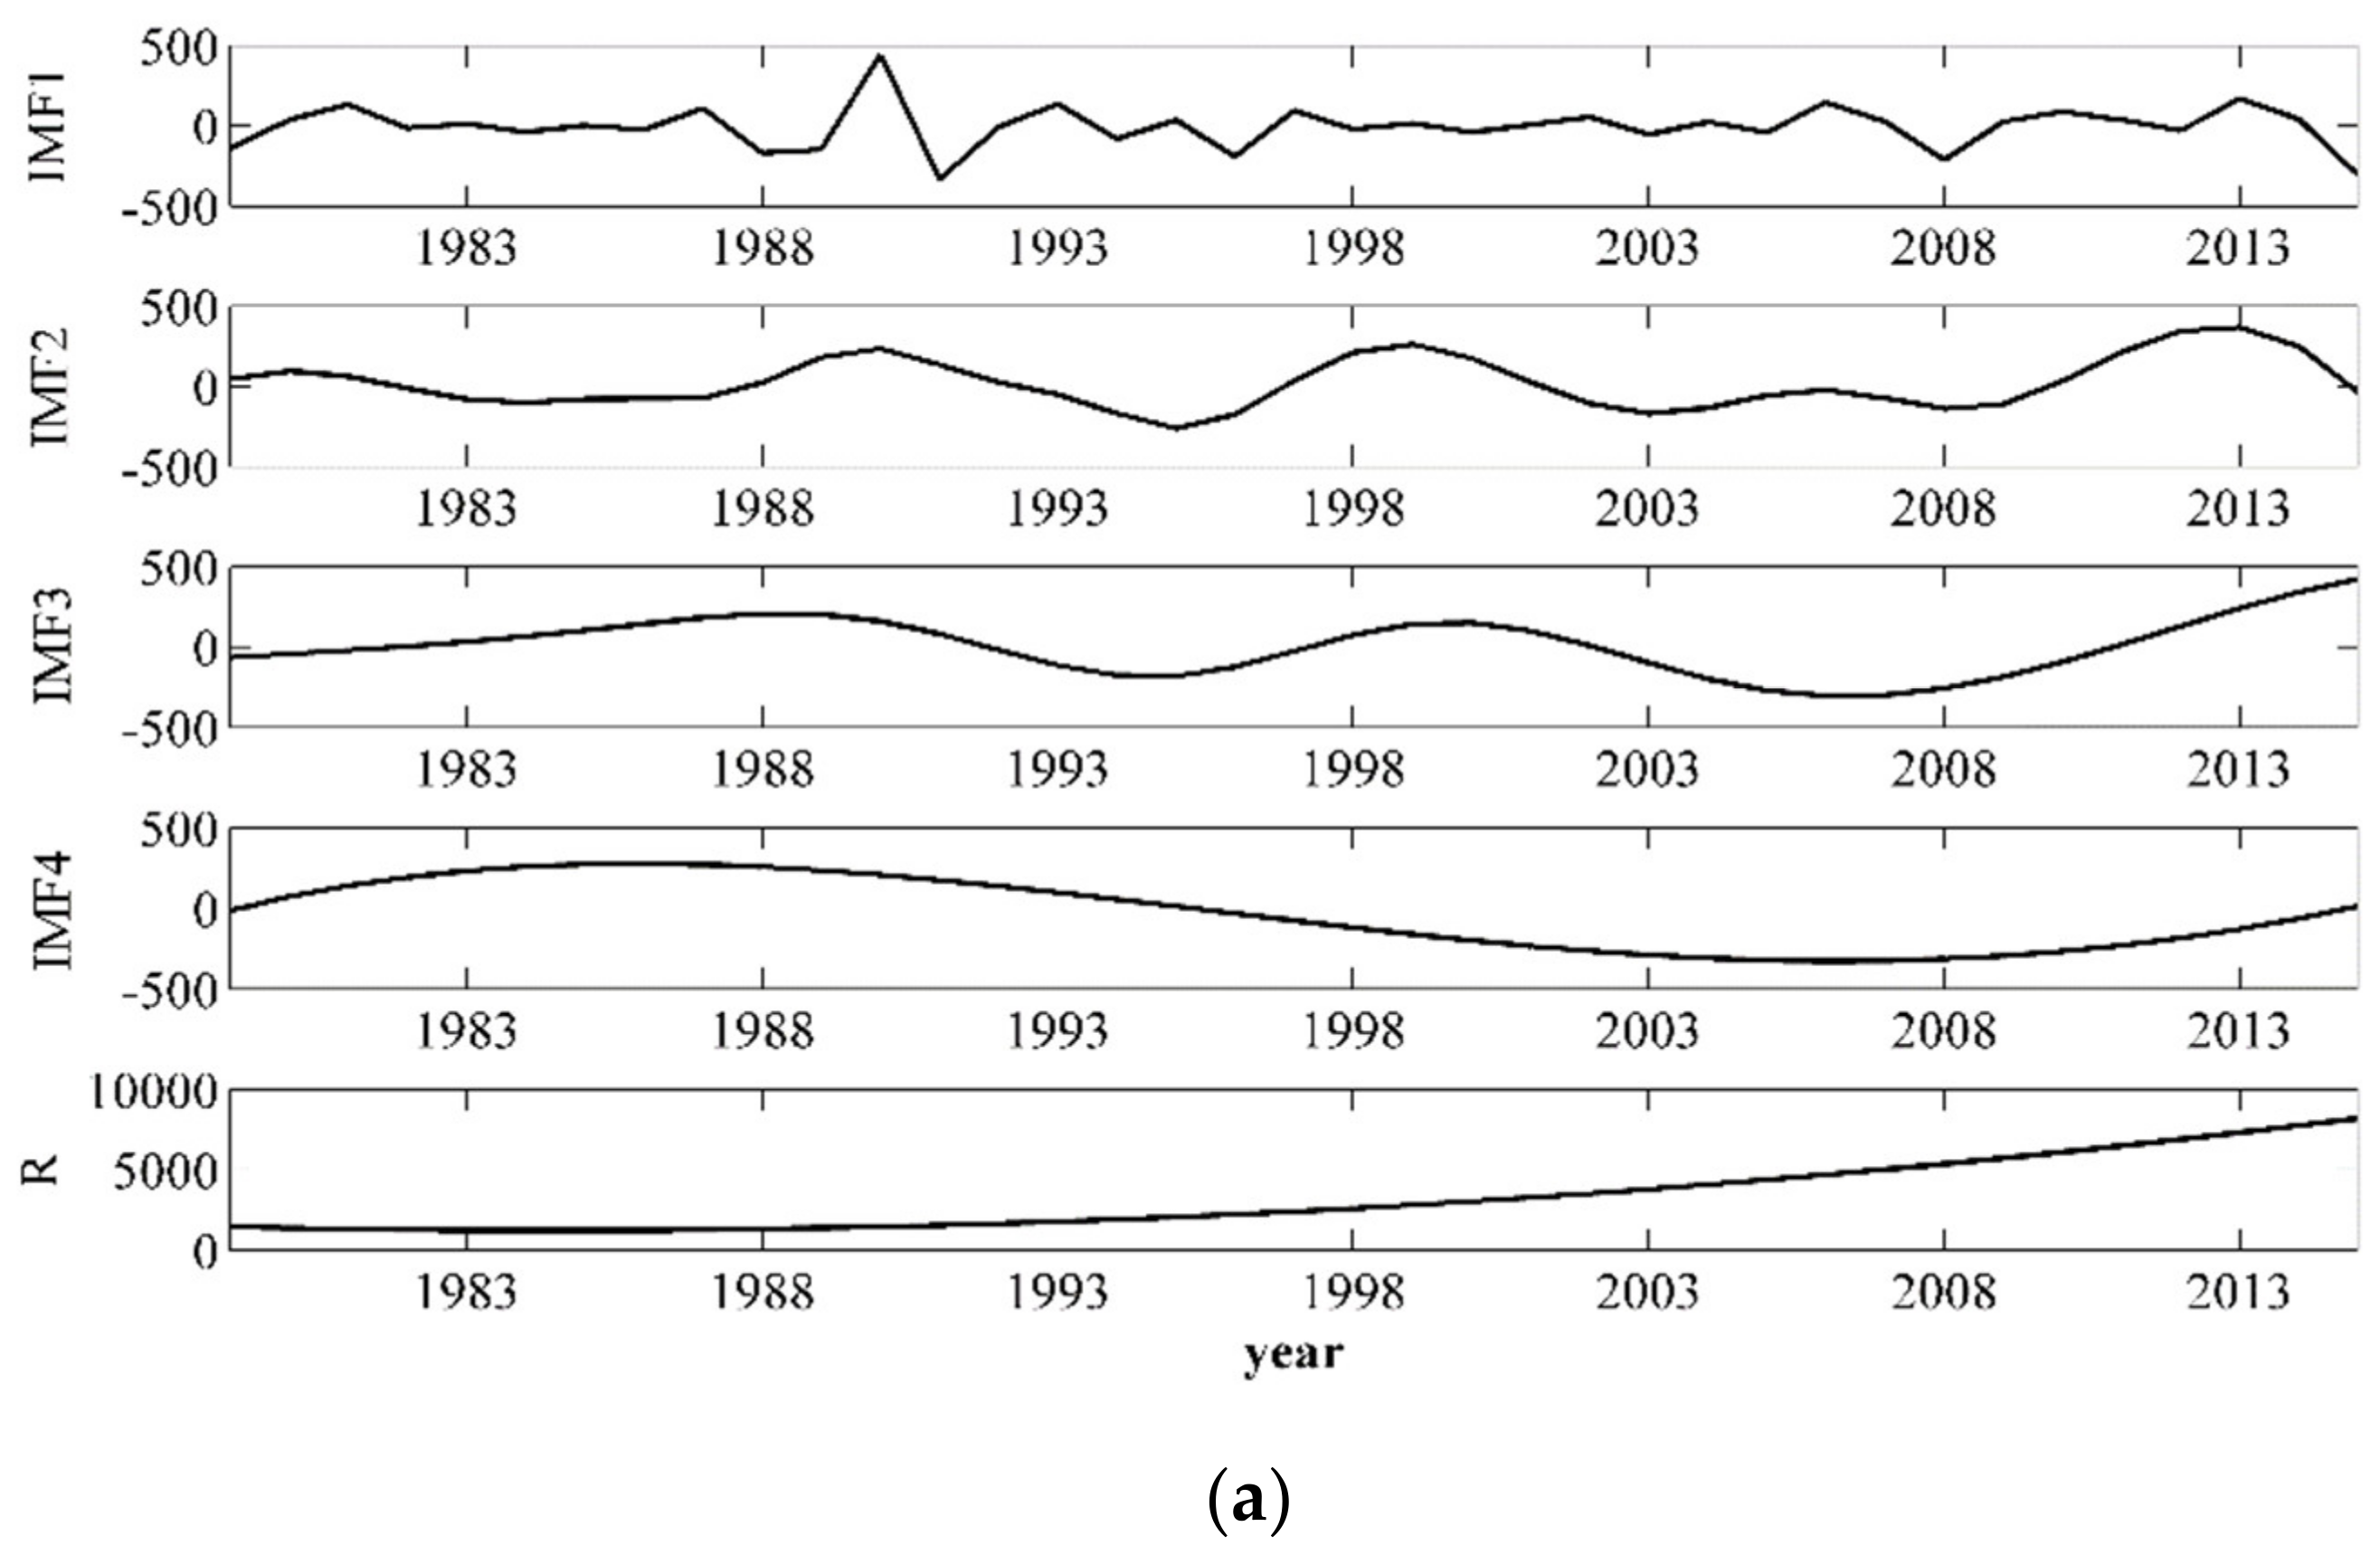
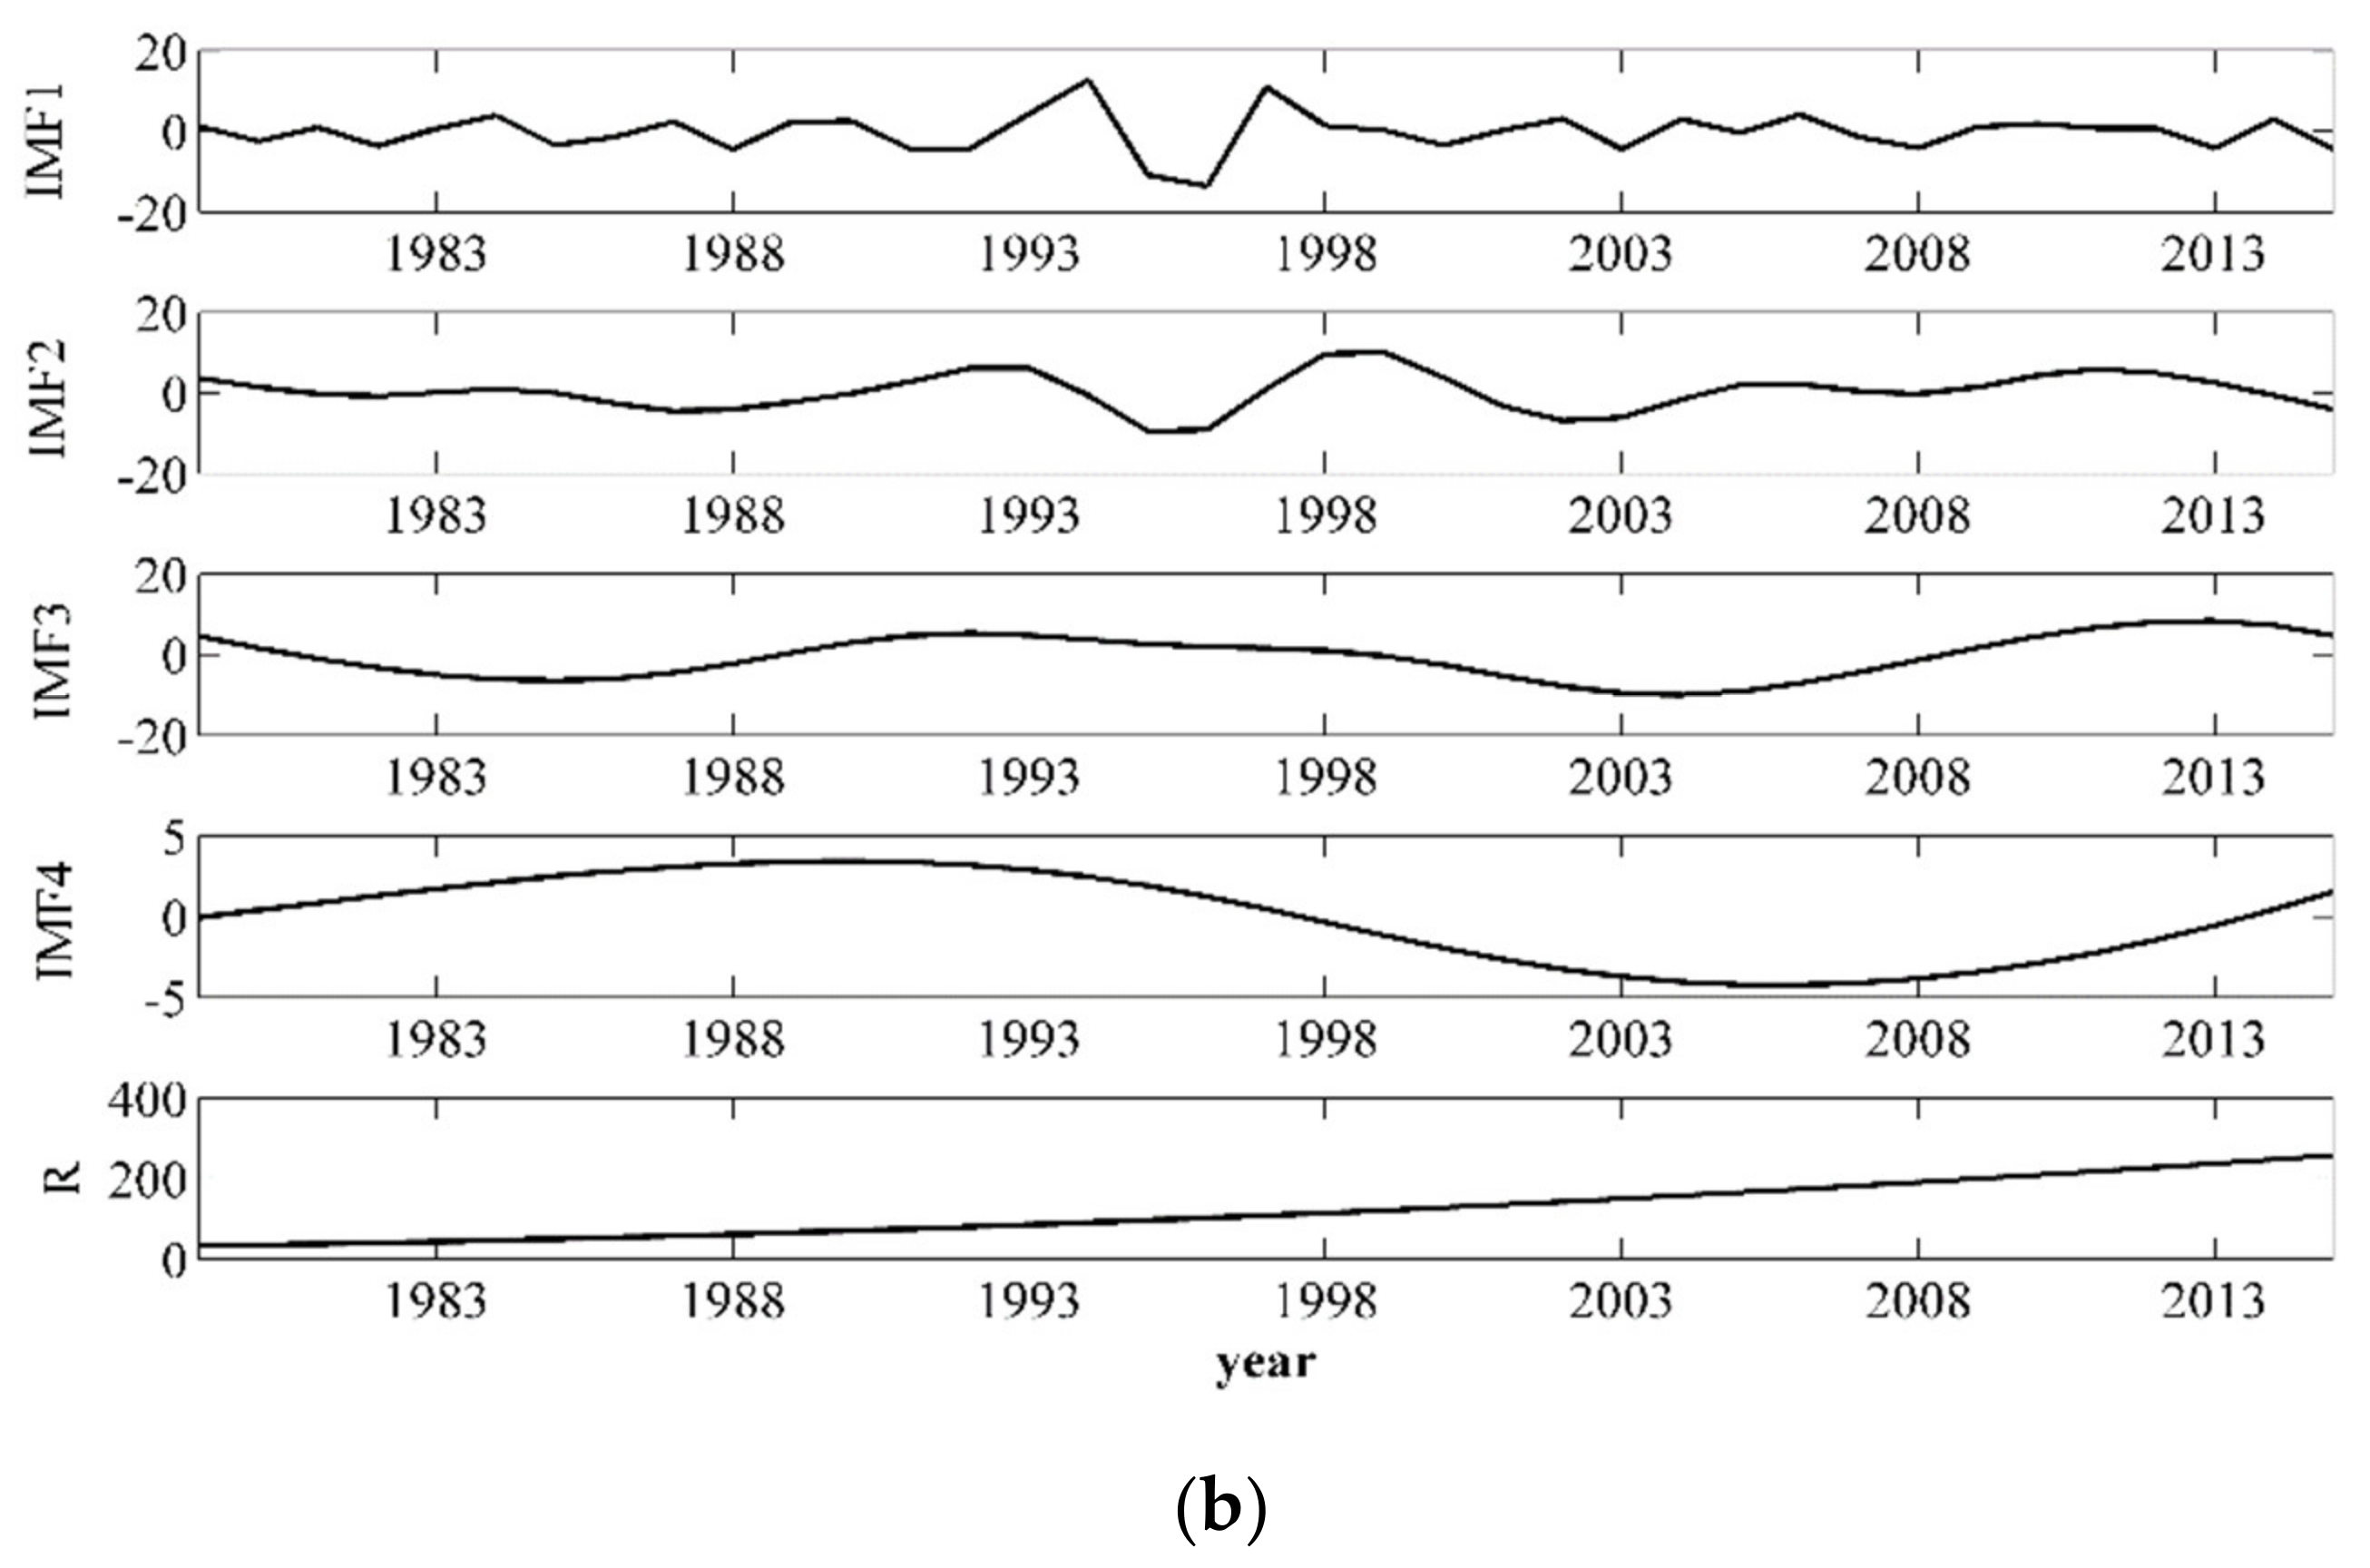
To reveal the changes in the effective irrigation area (EIA) and consumption of chemical fertilizers (CCF) at different timescales, multiple timescale analysis was performed using EEMD during 1979–2015. Figure 5 and Table 3 indicated the temporal changes, and the average periods with their variance contributions of EIA and CCF at different timescales.
EIA changes in Heilongjiang Province, China showed four oscillations at 2.6-, 7.4-, 18.5-, and 37-year timescales and a residual, among which the long-term trend was the main component (Figure 5a and Table 3). CFF had similar changes with EIA, which also exhibited four oscillations at 3.4-, 7.5-, 18.5-, and 37-year timescales and a residual, and the long-term trend was the main component (Figure 5b and Table 3).
3.2. The Effect of Climate Change and Human Activities on Maize Yield at Multiple Timescales
3.2.1. Sensitivity Analysis of Maize Yield to Climate Change and Human Activities
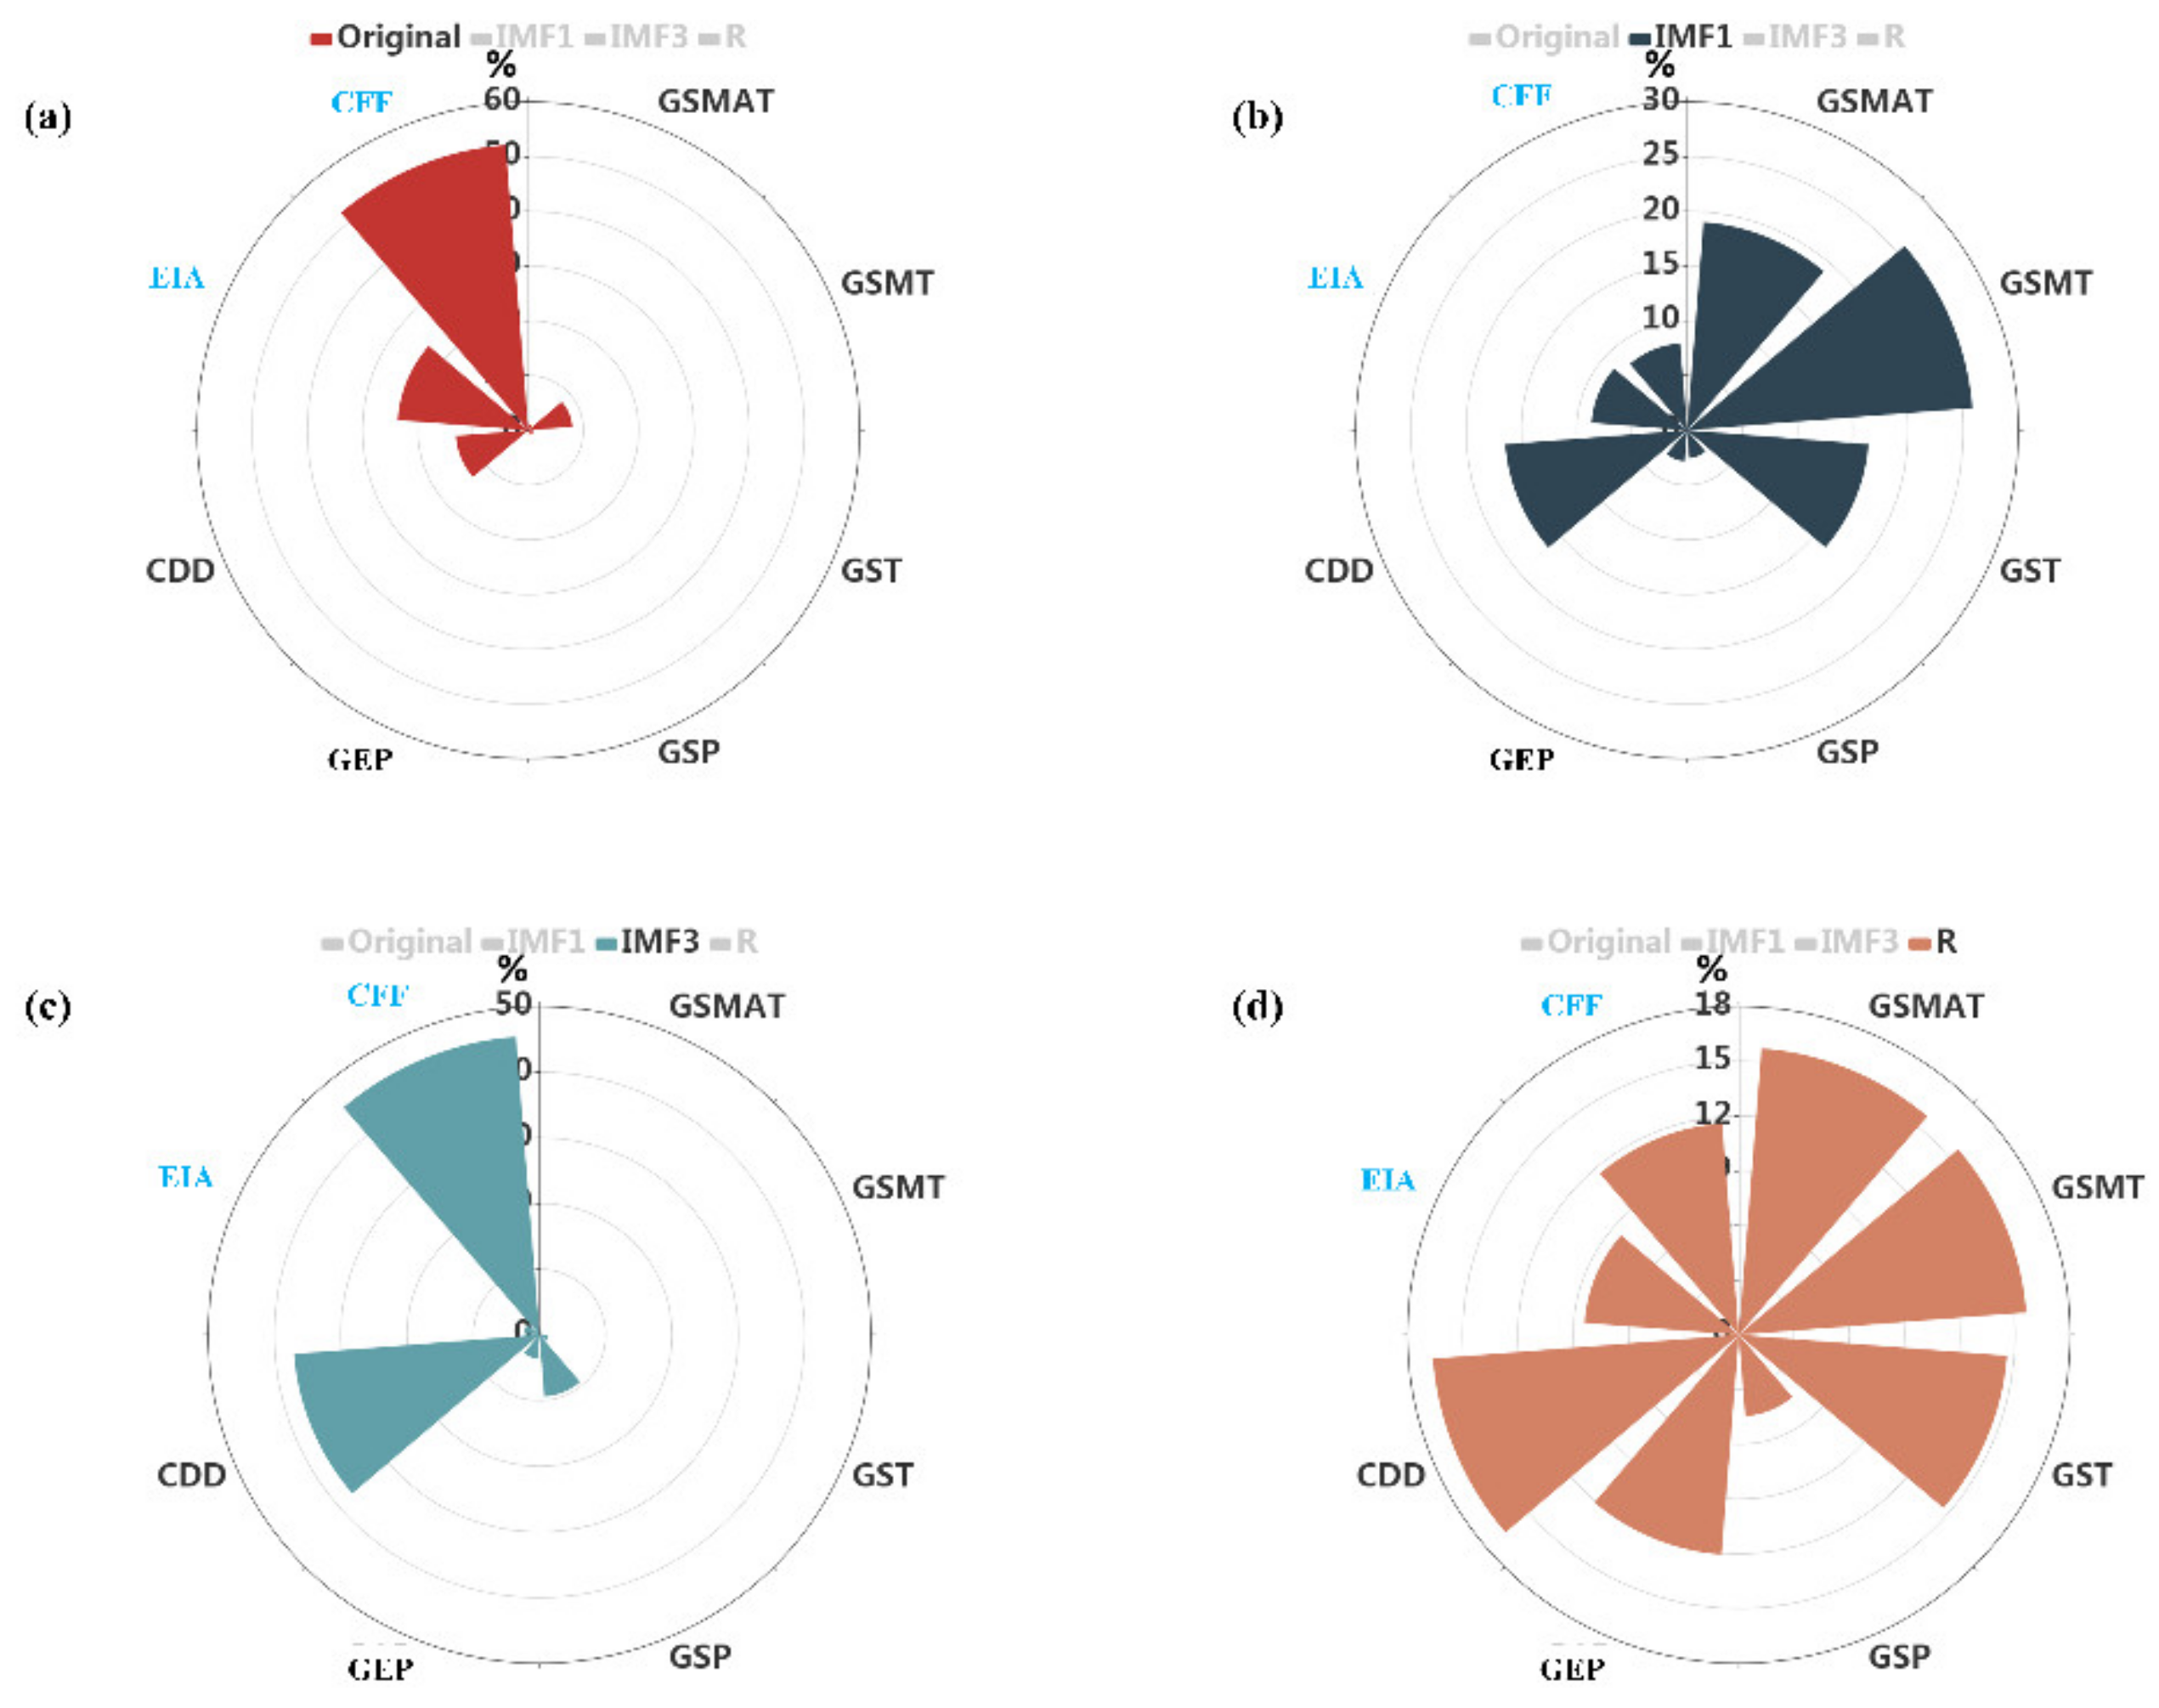
In this study, the sensitivity of maize yield to climate change and human activities was examined using the DVVD method. The sensitivity is defined as the contribution of independent variables (climatic factors and human activities) to the variance of dependent variable (maize yield). The results of sensitivity were shown in Figure 6.
As shown in Figure 6, the factors sensitive to the original sequence of maize yield were GSMT, CDD, EIA, and CFF, the contributions of which to the variance of maize yield were more than 3%. In addition, the contributions of EIA and CFF to the variance of maize yield were significantly greater than CDD and GSMT, which indicated that maize yield was more sensitive to human activities than to climate change. However, it can be found that IMF1 of maize yield had more sensitivity to GSMAT, GSMT, GST, CDD, EIA, and CFF, among which the IMF1 was highly sensitive to GSMAT, GSMT, GST, and CDD than EIA and CFF, indicating that the short-term oscillation (3.1-year oscillation) of maize yield were more sensitive to climate change than human activities (shown in Figure 6). By contrast, there were some differences in IMF3 (18.5-year oscillation) of maize yield. At this timescale, there were only four factors, GSP, GEP, CDD, and CFF, to which IMF3 of maize yield was more sensitive. Notably, the long-term oscillation showed more sensitivity to GSMAT, GSMT, GST, GSP, GEP, CDD, EIA, and CFF, which illustrated that the trend component of maize yield was highly sensitive to climate change and human activities.
In summary, in different timescales, the sensitive factors influencing the change in maize yield were not the same. The main sensitive factors of short-term oscillation were climatic factors, while the main sensitive factors of mid- and long-term fluctuations (18.5-year oscillation) were human activities. In addition, the long-term trend in maize yield was sensitive to both climate change and human activities.
3.2.2. The Detailed Effect of Climate Change and Human Activities on Maize Yield at Different Timescales
Our study found that the sensitivity of maize yield to climate change and human activities varied with the timescales. To further confirm the above analysis results, the linear correlation method (the Pearson correlation method) was used to further explore the effect of climate change and human activities on maize yield at multiple timescales (shown in Table 4). In this case, only the correlation coefficients between maize yield and sensitive factors were identified in Section 3.2.1 in Table 4.
Table 4 indicated that CDD was negatively correlated with maize yield [53] at different timescales, while other factors (climatic factors and human activities) were positively correlated with maize yield [28]. The relationship indicated that both climate change and human activities had a significant effect on maize yield, whether at different timescales or without multiple timescales. Furthermore, there was a significant increasing trend (shown in Figure 3) in maize yield. It can be found that CDD had a decreasing trend (Figure 4e) and other factors had increasing trends (Figure 4a–d and Figure 5b). Based on the combined results listed in Table 5, we can conclude that due to the increase in precipitation in Heilongjiang Province, the trend of dryness was alleviated, which was beneficial to the growth of maize [49,53,54,55,56]. In addition, increasing temperatures have changed the thermal conditions in Heilongjiang Province, leading to earlier sowing and increased accumulation time of dry matter, which has increased maize yields. The important increase in maize yields is a comprehensive result of human activities and climate change [13,14,57,58]. At the same time, the increased use of fertilizer increased the maize yield [28,29,59].
3.2.3. Relative Importance of Climate Changes and Human Activities for Maize Yield at Different Timescales
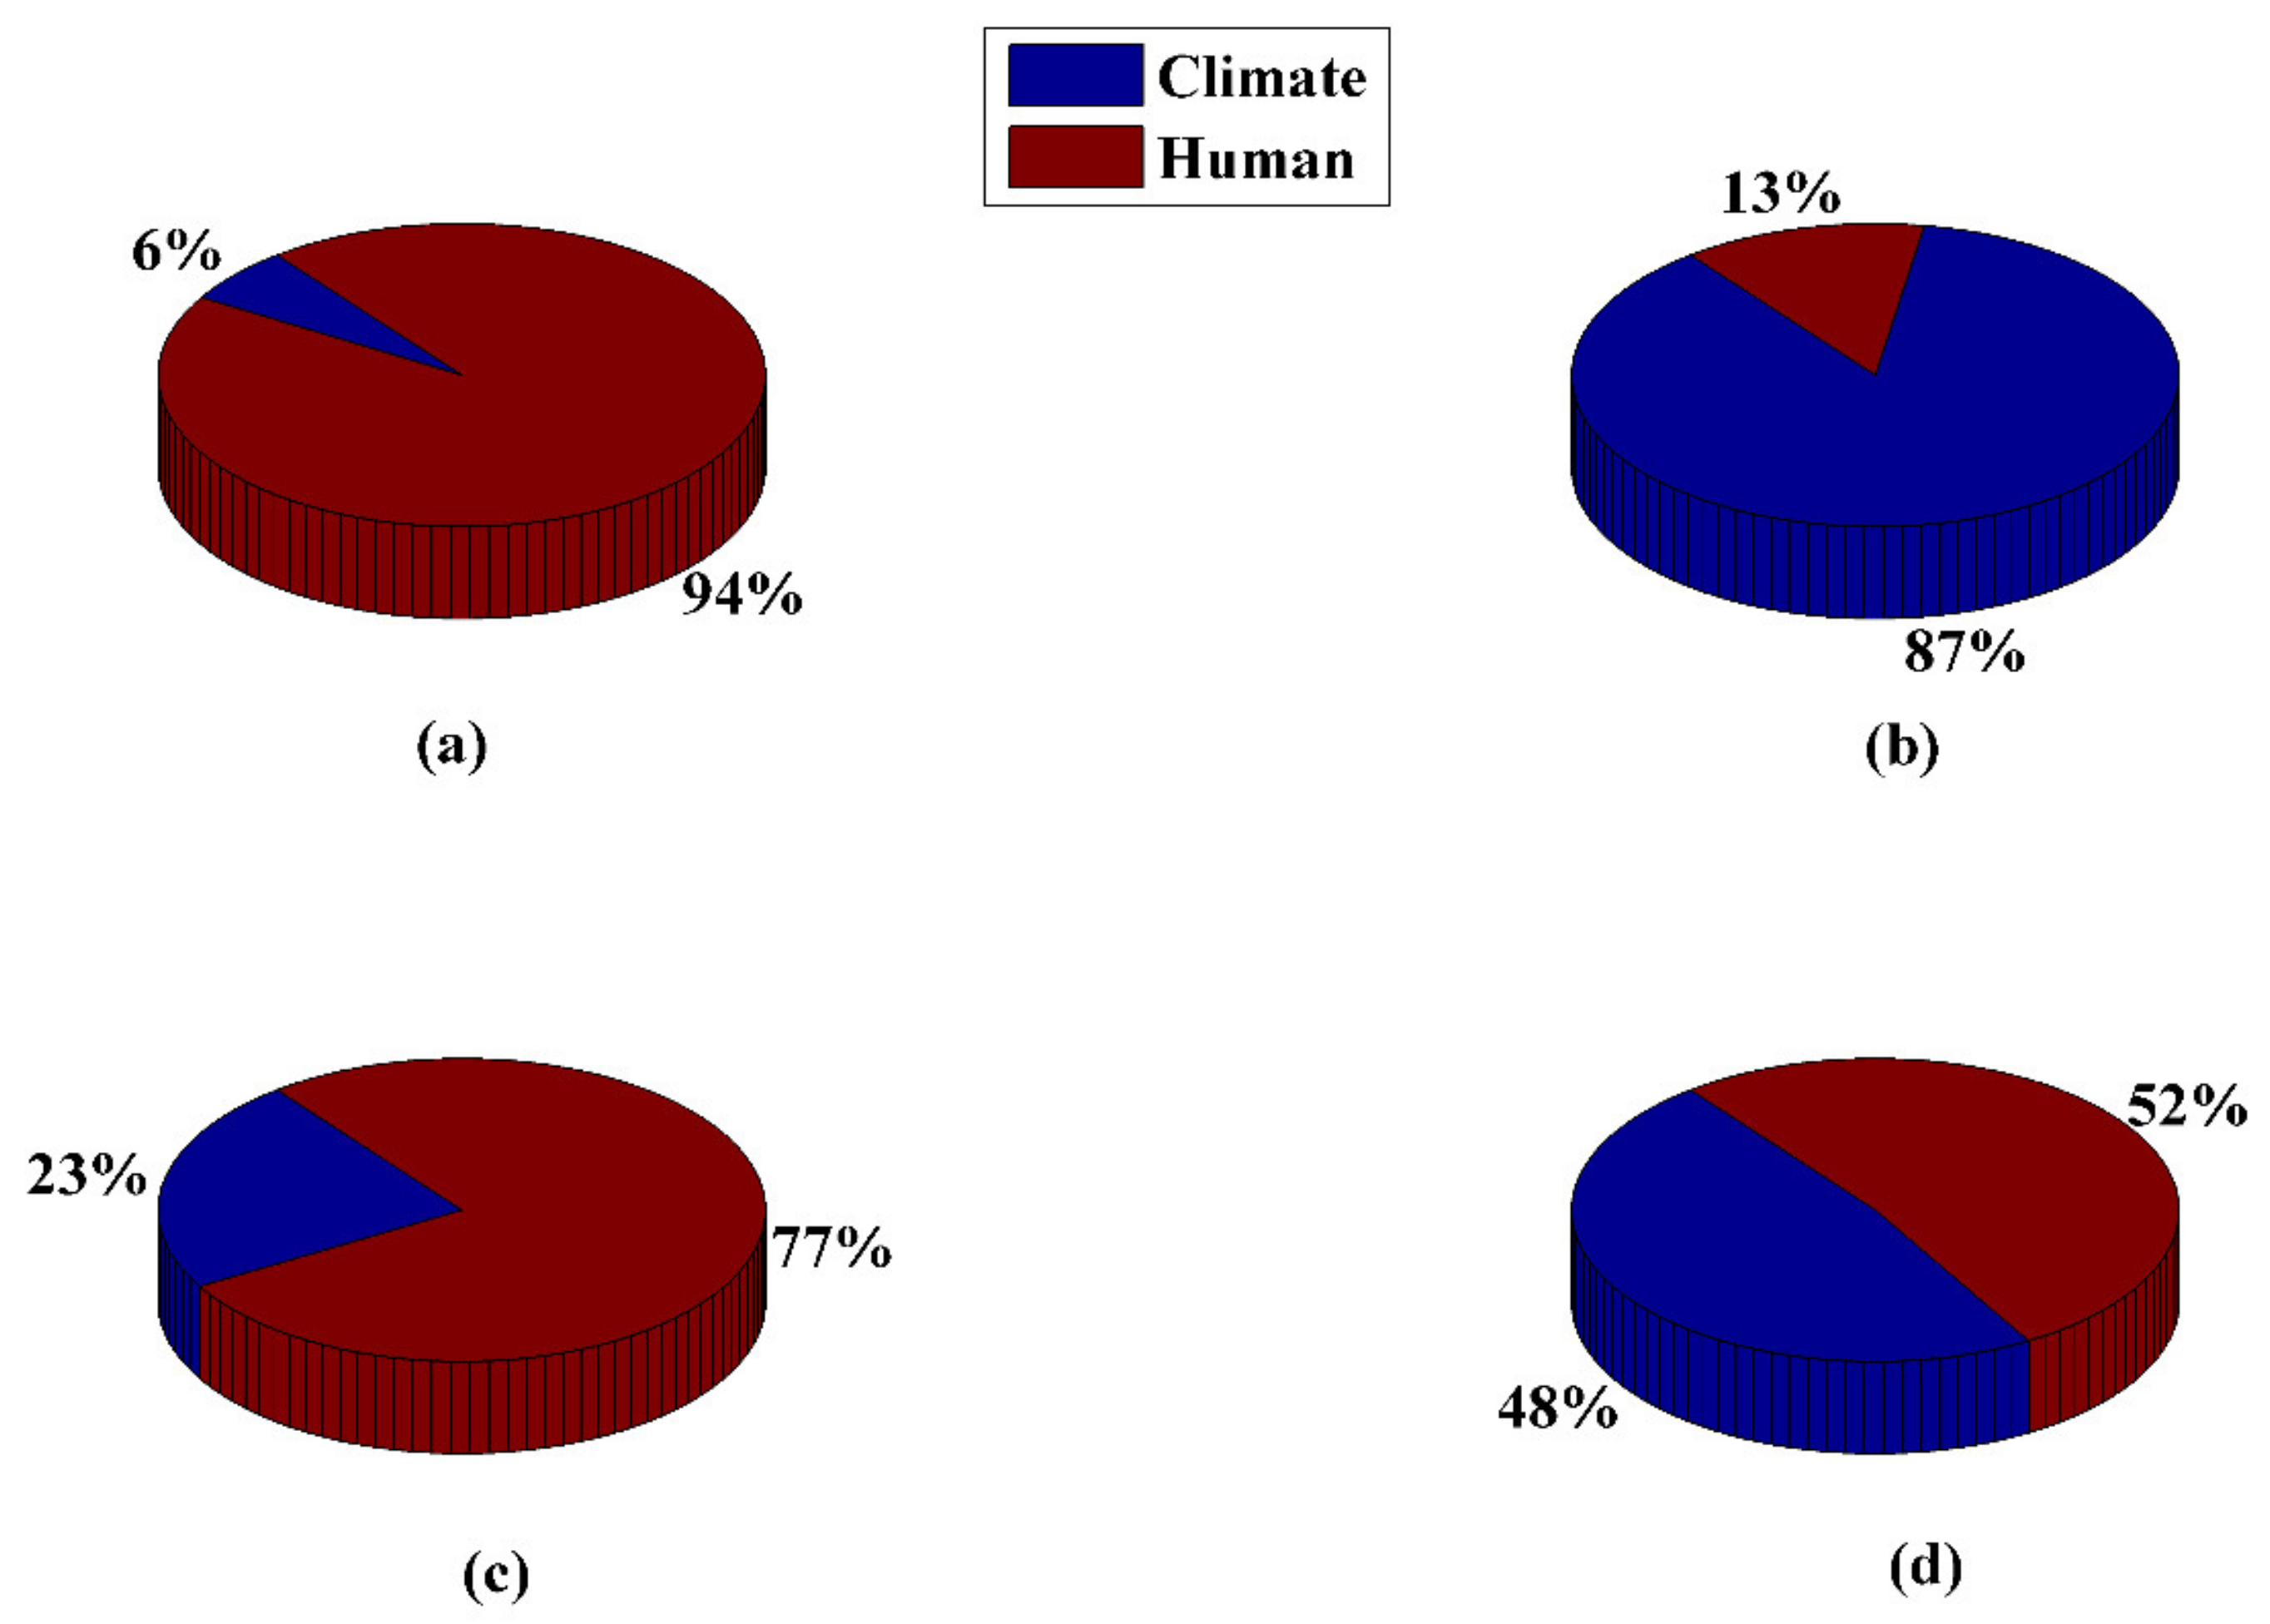
To reveal the relative importance of climate change and human activities for maize yield, the multivariate regression analysis and Sen-slope trend method for maize yield based on sensitivity factors were determined in Section 3.2.1, with and without the multiple timescale (original sequence). Table 5 and Figure 7 indicated the Sen-slope values, and the relative contributions of climate change and human activities on maize yield with and without the multiple timescale analysis.
As shown in Table 5, except for the trend changes in IMF1, maize yield showed an increasing trend, in which the original sequence and the residual term increased significantly. For the original sequence, the 18.5-year timescale, and long-term trend, the increasing trends were caused by human activities and climate change (Figure 7), among which human activities were the main factors (the relative contributions of human activities were 94%, 77%, and 52%, respectively). These results indicated that human activities had a stronger influence on maize yield than climate change in the mid- and long-term timescales. For regression accounting for multiple timescales (the main ones were 18.5-year timescale and the long-term trend), the relative contribution of climate change to maize yield was still lower than human activities to maize yield change, with the increase in timescale, the impact of climate change on maize yield increased gradually, while the impact of human activities on maize yield decreased gradually (Table 5 and Figure 7). Indeed, this suggested that climate change significantly affects maize yield, which illustrated that ignoring timescales may strikingly underestimate the impact of climate change on maize yield. Among multiple timescales, the 3.1-year timescale (IMF1) was an exception. In this timescale, the relative contribution of climate change for maize yield was 87% (Figure 7b). Over the 3.1-year timescale (in IMF1 of maize yield), climate change was the dominant factor, which led to the declining trend of maize yield.
4. Discussion
Possible causes of the dominant effect of climate and human activities on maize yield were explored at different timescales. As shown in this study, the DVVD and Sen-slope methods were used to analyze the effect of climate change and human activities on maize yield at 3.1-year timescale, which showed that climate change had a significant impact on maize yield (Figure 7b). In accordance with the results in Table 2, the change cycle of the IMF1 of climatic factors is basically consistent with the IMF1 of maize yield, and the variance contribution rate of the IMF1 of these climatic factors accounts for more than 50% of the total variance contribution rate. Therefore, climate change mainly affects the 3.1-year timescale oscillation in maize yield. Moreover, previous studies considered the relationship between maize yield and climate change (temperature and precipitation) in Heilongjiang Province, China [13,60].
For the 18.5-year timescale and the long-term trend, human activities were the dominant factor. On the one hand, it can be found in Table 3 that the long-term increasing trend was the main component for EIA and CFF, which indicated that the effect of human activities on maize yield was mainly reflected in the trend [36,61]. On the other hand, agricultural policies in Heilongjiang Province have a significant impact on maize yield [38,62,63,64,65]. During the period 1979–1994, the implementation of the household contract responsibility system resulted in a significant increase in maize production [64,65]. There was a clear downward trend of maize yield in 1995–2007, for which the main reason was that from the early stage of reform and opening up to the first half of the 1990s, the increase in grain production brought by the increase in agricultural production enthusiasm led to the “difficulty in selling grain” of farmers. The problem of increasing production and not increasing the income of farmers became increasingly serious, which seriously affected the enthusiasm of farmers to engage in agricultural production [38,62]. In addition, it was found that there was a significant increasing trend in maize yield during the period 2008–2015, which was mainly due to the fact that under the influence of the central policy of benefiting farmers and the revitalization of the old industrial base in northeast China, the agricultural production efficiency in Heilongjiang Province had been greatly improved [63]. Moreover, the change cycles of food policies are basically the same as the IMF3 of maize yield (at 18.5-year timescale). Food policies mainly work on maize yield through measures, such as fertilizer application and irrigation improvement by farmers.
5. Conclusions
In this study, multiple timescale analysis for the relationship between maize yield and climate change and human activities was performed employing the EEMD method. Maize yield in Heilongjiang Province can be divided into 3.1-, 7.4-, 18.5-, and 37-year timescale oscillations and a long-term trend during the period 1979–2015. Maize yield dominated by 3.1- and 18.5-year timescale oscillations and the long-term trend with high variance contributions. The DVVD and Sen-slope methods with multiple timescale analysis showed that human activities predominated the original sequence of maize yield series. As the timescale increased, there were different effects of climate change and human activities on maize yield, in which climate change mainly affected maize yield at short timescales, and human activities mainly influenced the original sequence, 18.5-year oscillation, and long-term trend of maize yield. As a whole, human activities had a stronger impact on maize yield than climate change at the 18.5-year timescale and long-term trend, but the effect of climate change on short-term fluctuations in maize yield was stronger than human activities. The findings of this study indicated that the effect of human activities on the original sequence of maize yields has obscured the effect of climate change. Therefore, it is beneficial to carry out multiple timescale studies to help better characterize the impact of human activity and climate change on maize yields, which will improve maize yield forecasting and modelling. This study facilitates a better understanding of the relationship between crop yield and climate change and human activities at multiple timescales. Furthermore, it provides few scientific references for food security under global climate change.
Author Contributions
Conceptualization, Q.H. and S.H.; methodology, P.L. and X.Z.; formal analysis, J.Z.; data curation, P.L.; writing—original draft preparation, P.L.; writing—review and editing, Q.H., P.L. and S.H.; visualization, P.L. and L.M.; project administration, Q.H. and S.H. All authors have read and agreed to the published version of the manuscript.
Funding
This research was jointly funded by the Strategic Priority Research Program of the Chinese Academy of Sciences (grant number XDA28060100), the National Key Research and Development Program of China (grant number 2017YFC0405900), the National Natural Science Foundation of China (grant number 51709221), the Planning Project of Science and Technology of Water Resources of Shaanxi (grant numbers 2017slkj-19), the Open Research Fund of State Key Laboratory of Simulation and Regulation of Water Cycle in River Basin (China Institute of Water Resources and Hydropower Research, grant number IWHR-SKL-KF201803), and the Doctoral Dissertation Innovation Funding of Xi′an University of Technology (grant number 310-252072112).
Institutional Review Board Statement
Not applicable.
Informed Consent Statement
Informed consent was obtained from all subjects involved in the study.
Data Availability Statement
Not applicable.
Conflicts of Interest
The authors declare no conflict of interest.
Appendix A

Table A1.
Methods for assessing the relative roles of climate changes and human activities in vegetation changes under different scenarios.
Table A1.
Methods for assessing the relative roles of climate changes and human activities in vegetation changes under different scenarios.
| Relative Contribution of Human Activities (%) | Relative Contribution of Climate Change (%) | Explanation | |||
|---|---|---|---|---|---|
| <0 | >0 | <0 | 0 | 100 | Climate-dominated maize yield decrease |
| <0 | <0 | 100 | 0 | Human-dominated maize yield decrease | |
| <0 | <0 | Both climate and human induced maize yield decrease | |||
| >0 | >0 | - | - | Error | |
| >0 | <0 | >0 | 0 | 100 | Climate-dominated maize yield increase |
| >0 | <0 | 100 | 0 | Human-dominated maize yield increase | |
| >0 | >0 | Both climate and human induced maize yield increase | |||
| <0 | <0 | - | - | Error |
References
- IPCC. Climate Change 2014: Synthesis Report. In Contribution of Working Gro-ups I, II and III to the Fifth Assessment Report of the Intergovernmental Panel on Climate Change; Core Writing Team, Pachauri, R.K., Meyer, L.A., Eds.; IPCC: Geneva, Switzerland, 2014; p. 151. [Google Scholar]
- Li, P.; Huang, Q.; Huang, S.Z.; Leng, G.Y.; Peng, J.; Wang, H.; Zheng, X.D.; Li, Y.F.; Fang, W. Various maize yield losses and their dynamics triggered by drought thresholds based on Copula-Bayesian conditional probabilities. Agric. Water Manag. 2022, 261, 107391. [Google Scholar] [CrossRef]
- Li, Y.F.; Huang, S.Z.; Wang, H.Y.; Zheng, X.D.; Huang, Q.; Deng, M.J.; Peng, J. High-resolution propagation time from meteorological to agricultural drought at multiple levels and spatiotemporal scales. Agric. Water Manag. 2022, 262, 107428. [Google Scholar] [CrossRef]
- Ringler, C. Climate Variability and Change Impact on Water and Food Outcomes; International Food Policy Research Institute (IFPRI): Washington, DC, USA, 2008. [Google Scholar]
- Nelson, G.C.; Rosegrant, M.W.; Koo, J.; Robertson, R.; Sulser, T.; Zhu, T.J.; Ringler, C.; Msangi, S.; Palazzo, A.; Batka, M.; et al. Climate Change Impacts on Agriculture and Costs of Adaptation (Research Report); International Food Policy Research Institute: Washington, DC, USA, 2009. [Google Scholar]
- Rosenzweig, C.; Iglesias, A.; Yang, X.B.; Epstein, P.R.; Chivian, E. Climate change and extreme weather events-implications for food production, plant diseases, and pests. Glob. Change Hum. Health 2001, 2, 90–104. [Google Scholar] [CrossRef]
- Richard, P.; Hasenauer, H. Climate input parameters for real-time online risk assessment. Nat. Hazards 2014, 70, 1749–1762. [Google Scholar]
- Zou, J.; Xie, Z.; Zhan, C.; Chen, F.; Qin, P.H.; Hu, T.; Xie, J.B. Coupling of a Regional Climate Model with a Crop Development Model and Evaluation of the Coupled Model across China. Adv. Atmos. Sci. 2019, 36, 527–540. [Google Scholar] [CrossRef]
- Guo, Y.; Huang, S.Z.; Huang, Q.; Wang, H.; Fang, W. Copulas-based bivariate socioeconomic drought dynamic risk assessment in a changing environment. J. Hydrol. 2019, 575, 1052–1064. [Google Scholar] [CrossRef]
- Fang, W.; Huang, S.Z.; Huang, Q.; Huang, G.H.; Wang, H.; Leng, G.Y.; Wang, L.; Guo, Y. Probabilistic assessment of remote sensing-based terrestrial vegetation vulnerability to drought stress of the Loess Plateau in China. Remote Sens. Environ. 2019, 232, 111290. [Google Scholar] [CrossRef]
- Cui, Y.; Jiang, S.M.; Jin, J.L. Quantitative assessment of soybean drought loss sensitivity at different growth stages based on S-shaped damage curve. Agric. Water Manag. 2019, 213, 821–832. [Google Scholar] [CrossRef]
- Tao, F.L.; Zhang, S.; Zhang, Z.; Rötterc, R.P. Temporal and spatial changes of maize yield potentials and yield gaps in the past three decades in China. Agric. Ecosyst. Environ. 2015, 208, 12–20. [Google Scholar] [CrossRef]
- Zhao, J.F.; Guo, J.P.; Xu, Y.H.; Mu, J. Effects of climate change on cultivation patterns of spring maize and its climatic suitability in Northeast China. Agric. Ecosyst. Environ. 2015, 202, 178–187. [Google Scholar] [CrossRef]
- Zhao, J.; Yang, X.G.; Dai, S.W.; Lv, S.; Wang, J. Increased utilization of lengthening growing season and warming temperatures by adjusting sowing dates and cultivar selection for spring maize in Northeast China. Eur. J. Agron. 2015, 67, 12–19. [Google Scholar] [CrossRef]
- Dubey, S.K.; Sharma, D. Assessment of climate change impact on yield of major crops in the Banas River Basin, India. Sci. Total Environ. 2018, 635, 10–19. [Google Scholar] [CrossRef]
- Ma, J.; Maystadt, J.F. The impact of weather variations on maize yields and household income: Income diversification as adaptation in rural China. Glob. Environ. Change 2017, 42, 93–106. [Google Scholar] [CrossRef] [Green Version]
- Amouzou, K.A.; Lamers, J.P.A.; Naab, J.B.; Borgemeister, C.; Vlek, P.L.G.; Becker, M. Climate change impact on water- and nitrogen-use efficiencies and yields of maize and sorghum in the northern Benin dry savanna, West Africa. Field Crops Res. 2019, 235, 104–117. [Google Scholar] [CrossRef]
- Challinor, A. Towards the development of adaptation options using climate and crop yield forecasting at seasonal to multi-decadal timescales. Environ. Sci. Policy 2009, 12, 453–465. [Google Scholar] [CrossRef] [Green Version]
- Jha, P.K.; Athanasiadis, P.; Gualdi, S.; Trabucco, A.; Mereu, V.; Shelia, V.; Hoogenboom, G. Using daily data from seasonal forecasts in dynamic crop models for yield prediction: A case study for rice in Nepal’s Terai. Agric. For. Meteorol. 2019, 265, 349–358. [Google Scholar] [CrossRef]
- Brown, J.N.; Hochman, Z.; Holzworth, D.; Horan, H. Seasonal climate forecasts provide more definitive and accurate crop yield predictions. Agric. For. Meteorol. 2018, 260, 247–254. [Google Scholar] [CrossRef]
- Viles, H.A.; Goudie, A.S. Interannual decadal and multidecadal scale climatic variability and geomorphology. Earth-Sci. Rev. 2003, 61, 105–131. [Google Scholar] [CrossRef]
- Cao, L.; Bala, G.; Caldeira, K. Climate response to changes in atmospheric carbon dioxide and solar irradiance on the time scale of days to weeks. Environ. Res. Lett. 2012, 7, 034015. [Google Scholar] [CrossRef]
- Bala, G.; Caldeira, K.; Nemani, R. Fast versus slow response in climate change: Implications for the global hydrological cycle. Clim. Dyn. 2009, 35, 423–434. [Google Scholar] [CrossRef]
- Hannachi, A.; Straus, D.M.; Franzke, C.L.E.; Corti, S.; Woollings, T. Low-Frequency Nonlinearity and Regime Behavior in the Northern Hemisphere Extratropical Atmosphere: Nonlinearity and Regime Behaviour. Rev. Geophys. 2017, 55, 199–234. [Google Scholar] [CrossRef]
- Han, Z.M.; Huang, S.Z.; Huang, Q.; Leng, G.Y.; Wang, H.; He, L.; Fang, W.; Li, P. Assessing GRACE-based terrestrial water storage anomalies dynamics at multi-timescales and their correlations with teleconnection factors in Yunnan Province, China. J. Hydrol. 2019, 574, 836–850. [Google Scholar] [CrossRef]
- Li, S.; Wheeler, T.; Challinor, A.; Lin, E.; Ju, H.; Xu, Y.L. The observed relationships between wheat and climate in China. Agric. For. Meteorol. 2010, 150, 1412–1419. [Google Scholar] [CrossRef]
- Piao, S.L.; Ciais, P.; Huang, Y.; Shen, S.S.; Li, J.S.; Zhou, L.P.; Liu, H.Y.; Ma, Y.C.; Ding, Y.H.; Friedlingstein, P.; et al. The impacts of climate change on water resources and agriculture in China. Nature 2010, 467, 43–51. [Google Scholar] [CrossRef]
- Xu, X.P.; He, P.; Zhang, J.J.; Pampolino, M.F.; Johnston, A.M.; Zhou, W. Spatial variation of attainable yield and fertilizer requirements for maize at the regional scale in China. Field Crops Res. 2017, 203, 8–15. [Google Scholar] [CrossRef]
- Li, X.L.; Tong, L.; Niu, J.; Kang, S.Z.; Du, T.S.; Li, S.; Ding, R.S. Spatio-temporal distribution of irrigation water productivity and its driving factors for cereal crops in Hexi Corridor, Northwest China. Agric. Water Manag. 2017, 179, 55–63. [Google Scholar] [CrossRef]
- Mueller, N.D.; Gerber, J.S.; Johnston, M.; Ray, D.K.; Ramankutty, N.; Foley, J.A. Closing yield gaps through nutrient and water management. Nature 2012, 490, 254–257. [Google Scholar] [CrossRef]
- Chen, X.P.; Cui, Z.L.; Fan, M.S.; Vitousek, P.; Zhao, M.; Ma, W.Q.; Wang, Z.L.; Zhang, W.J.; Yan, X.Y.; Yang, J.C.; et al. Producing more grain with lower environmental costs. Nature 2014, 514, 486–489. [Google Scholar] [CrossRef]
- Niu, X.K.; Xie, R.Z.; Liu, X.; Zhang, F.L.; Li, S.K.; Gao, S.J. Maize yield gains in Northeast China in the last six decades. J. Integr. Agric. 2013, 12, 630–637. [Google Scholar] [CrossRef]
- Liu, Z.; Menzel, L. Identifying long-term variations in vegetation and climatic variables and their scale-dependent relationships: A case study in Southwest Germany. Glob. Planet. Change 2016, 147, 54–66. [Google Scholar] [CrossRef]
- Qi, X.; Jia, J.; Liu, H.; Lin, Z.S. Relative importance of climate change and human activities for vegetation changes on China’s silk road economic belt over multiple timescales. Catena 2019, 180, 224–237. [Google Scholar] [CrossRef]
- Yin, Y.H.; Ma, D.Y.; Wu, S.H.; Dai, E.F.; Zhu, Z.C.; Myneni, R.B. Nonlinear variations of forest leaf area index over China during 1982-2010 based on EEMD method. Int. J. Biometeorol. 2017, 61, 977–988. [Google Scholar] [CrossRef] [PubMed]
- Heerink, N.; Qu, F.T.; Kuiper, M.; Shi, X.P.; Tan, S.H. Policy reforms, rice production and sustainable land use in China: A macro–micro analysis. Agric. Syst. 2007, 94, 784–800. [Google Scholar] [CrossRef]
- Bai, H.Z.; Tao, F.L.; Xiao, D.P.; Liu, F.S.; Zhang, H. Attribution of yield change for ricewheat rotation system in China to climate change, cultivars and agronomic management in the past three decades. Clim. Change 2015, 135, 539–553. [Google Scholar] [CrossRef]
- Wu, Z.H.; Huang, N.E. Ensemble empirical mode decomposition: A noise-assisted data analysis method. Adv. Adapt. Data Anal. 2009, 1, 1–41. [Google Scholar] [CrossRef]
- Tian, L.X.; Li, J.; Bi, W.S.; Zuo, S.Y.; Li, L.J.; Li, W.L.; Sun, L. Effects of waterlogging stress at different growth stages on the photosynthetic characteristics and grain yield of spring maize (Zea mays L.) Under field conditions. Agric. Water Manag. 2019, 218, 250–258. [Google Scholar] [CrossRef]
- Lu, J.; Carbone, G.J.; Gao, P. Detrending crop yield data for spatial visualization of drought impacts in the United States, 1895-2014. Agric. For. Meteorol. 2017, 237, 196–208. [Google Scholar] [CrossRef]
- Liu, Y.; Yang, H.S.; Li, J.S.; Li, Y.F.; Yan, H.J. Estimation of irrigation requirements for drip-irrigated maize in a sub-humid climate. J. Integr. Agric. 2018, 17, 677–692. [Google Scholar] [CrossRef]
- Gu, W.R.; Jin, Y.; Meng, Y.; Wang, J.G.; Zhao, X.L.; Li, J.; Wei, S. SWOT Analysis and Development Strategies of Maize Industry in Heilongjiang Province. J. Northeast Agric. Univ. 2013, 20, 76–84. [Google Scholar]
- NBSC (National Bureau of Statistics of China). China Statistics Yearbook; China Statistics Press: Beijing, China, 2015. (In Chinese) [Google Scholar]
- Huang, N.E.; Shen, Z.; Long, S.R. The empirical mode decomposition and the Hilbert spectrum for nonlinear and nonstationary time series analysis. Proc. R. Soc. Lond. Ser. A Math. Phys. Eng. Sci. 1998, 454, 899–955. [Google Scholar] [CrossRef]
- Fan, M. Labor Market Factors of Residents’ Income Gap—Data from Questionnaire Survey in Zhengzhou Province. In Income Gap and Poverty during China’s Transition Period; Cai, F., Wan, G., Eds.; Social Sciences Academic Press: Beijing, China, 2006; pp. 239–250. [Google Scholar]
- Fan, M.; Yu, Y.W. Income Distribution Behavior and Policy; Social Sciences Academic Press: Beijing, China, 2013; pp. 225–227. (In Chinese) [Google Scholar]
- Herrmann, S.M.; Anynamba, A.; Tucker, C.J. Recent trends in vegetation dynamics in the African Sahel and their relationship to climate. Glob. Environ. Change 2005, 15, 394–404. [Google Scholar] [CrossRef]
- Zhao, A.Z.; Zhang, A.B.; Liu, J.H.; Feng, L.L.; Zhao, Y.L. Assessing the effects of drought and “Grain for Green” Program on vegetation dynamics in China’s Loess Plateau from 2000 to 2014. Catena 2019, 175, 446–455. [Google Scholar] [CrossRef]
- Liu, H.Y.; Zhang, M.Y.; Lin, Z.S.; Xu, X.J. Spatial heterogeneity of the relationship between vegetation dynamics and climate change and their driving forces at multiple time scales in Southwest China. Agric. For. Meteorol. 2018, 256, 10–21. [Google Scholar] [CrossRef]
- Wen, Z.F.; Wu, S.J.; Chen, J.L.; Lv, M.Q. NDVI indicated long-term interannual changes in vegetation activities and their responses to climatic and anthropogenic factors in the Three Gorges Reservoir Region, China. Sci. Total Environ. 2017, 574, 947–959. [Google Scholar] [CrossRef] [PubMed]
- Sen, K. Estimates of the regression coefficient based on Kendall’stau. J. Am. Stat. Assn. 1968, 63, 1379–1389. [Google Scholar] [CrossRef]
- Sun, Y.L.; Yang, Y.L.; Zhang, L.; Wang, Z.L. The relative roles of climate variations and human activities in vegetation change in North China. Phys. Chem. Earth 2015, 87, 67–78. [Google Scholar] [CrossRef]
- Guo, E.L.; Liu, X.P.; Zhang, J.Q.; Wang, Y.F.; Wang, C.L.; Wang, R.; Li, D.J. Assessing spatiotemporal variation of drought and its impact on maize yield in Northeast China. J. Hydrol. 2017, 553, 231–247. [Google Scholar] [CrossRef]
- Lobell, D.B. Climate and Management Contributions to Recent Trends in U.S. Agricultural Yields. Science 2003, 299, 1032. [Google Scholar] [CrossRef]
- Isik, M.; Devadoss, S. An analysis of the impact of climate change on crop yields and yield variability. Appl. Econ. 2006, 38, 835–844. [Google Scholar] [CrossRef]
- Zuo, D.P.; Cai, S.Y.; Xu, Z.X.; Peng, D.Z.; Kan, G.Y.; Sun, W.C.; Pang, B.; Yang, H. Assessment of meteorological and agricultural droughts using in-situ observations and remote sensing data. Agric. Water Manag. 2019, 22, 125–138. [Google Scholar] [CrossRef]
- Wang, X.H.; Peng, L.Q.; Zhang, X.P.; Yin, G.D.; Zhao, C.; Piao, S.L. Divergence of climate impacts on maize yield in Northeast China. Agric. Ecosyst. Environ. 2014, 196, 51–58. [Google Scholar] [CrossRef]
- Qiao, Y.F.; Miao, S.J.; Li, Q.; Jin, J.; Luo, X.S.; Tang, C.X. Elevated CO2 and temperature increase grain oil concentration but their impacts on grain yield differ between soybean and maize grown in a temperate region. Sci. Total Environ. 2019, 666, 405–413. [Google Scholar] [CrossRef]
- Quan, Z.; Li, S.; Zhang, X.; Zhu, F.F.; Li, P.P.; Sheng, R.; Chen, X.; Zhang, L.M.; He, J.Z.; Wei, W.X.; et al. Fertilizer nitrogen use efficiency and fates in maize cropping systems across China: Field 15N tracer studies. Soil Tillage Res. 2020, 197, 104498. [Google Scholar] [CrossRef]
- Guo, J.P.; Zhao, J.F.; Yuan, B. Evaluation of agricultural climatic resource utilization during spring maize cultivation in Northeast China under climate change. Acta Meteorol. Sin. 2013, 27, 758–768. [Google Scholar] [CrossRef]
- Liu, Y.; Huang, J.K. A multi-objectives decision model of farmers’ crop production. Econ. Res. 2010, 1, 148–157. (In Chinese) [Google Scholar]
- Dong, H.M. Study on the evolution of agricultural production efficiency in Heilongjiang Province. Bus. Econ. 2014, 2, 22–23. (In Chinese) [Google Scholar]
- Yu, W.; Elleby, C.; Zobbe, H. Food security policies in India and China: Implications for national and global food security. Food Secur. 2015, 7, 405–414. [Google Scholar] [CrossRef]
- Zhan, S. Riding on self-sufficiency: Grain policy and the rise of agrarian capital in China. J. Rural. Stud. 2017, 54, 151–161. [Google Scholar] [CrossRef]
- Rada, N.; Wang, C.; Qin, L. Subsidy or market reform? Rethinking China’s farm consolidation strategy. Food Policy 2015, 57, 93–103. [Google Scholar] [CrossRef]
Figure 1.
Distribution of meteorological stations in Heilongjiang Province, China.

Figure 2.
The temporal changes in original signal of maize yield during 1979–2015.

Figure 3.
The temporal changes in maize yield during 1979−2015 at different timescales based on the EEMD method.
Figure 3.
The temporal changes in maize yield during 1979−2015 at different timescales based on the EEMD method.

Figure 4.
The temporal changes in seven main influencing climatic factors (GSMAT, GSMT, GST, GEP, CDD, and GSP, respectively corresponding to subplots (a–f) during 1979–2015 at different timescales based on the EEMD method.
Figure 4.
The temporal changes in seven main influencing climatic factors (GSMAT, GSMT, GST, GEP, CDD, and GSP, respectively corresponding to subplots (a–f) during 1979–2015 at different timescales based on the EEMD method.

Figure 5.
The temporal changes in human activities (EIA (a) and CFF (b)) during 1979−2015 at different timescales based on the EEMD method.
Figure 5.
The temporal changes in human activities (EIA (a) and CFF (b)) during 1979−2015 at different timescales based on the EEMD method.


Figure 6.
The sensitivity analysis of maize yield (original (a), IMF1 (b), IMF3 (c), and R (d)) to climate change and human activities at different timescales based on the DVVD method.
Figure 6.
The sensitivity analysis of maize yield (original (a), IMF1 (b), IMF3 (c), and R (d)) to climate change and human activities at different timescales based on the DVVD method.

Figure 7.
The relative contributions of human activities and climate change for maize yield over different timescales (original (a), IMF1 (b), IMF3 (c), and R (d)).
Figure 7.
The relative contributions of human activities and climate change for maize yield over different timescales (original (a), IMF1 (b), IMF3 (c), and R (d)).

Table 1.
Average periods and their respective variance contributions of maize yield changes at different timescales in Heilongjiang Province, China.
Table 1.
Average periods and their respective variance contributions of maize yield changes at different timescales in Heilongjiang Province, China.
| IMF1 | IMF2 | IMF3 | IMF4 | Residual | |
|---|---|---|---|---|---|
| Period (year) | 3.1 | 7.4 | 18.5 | 37 | |
| Variance contribution (%) | 7.34 | 1.86 | 19.19 | 0.79 | 70.82 |
Table 2.
The average periods and their variance contributions of climatic factors: GSP, GEP, CDD, GST, GSMAT, and GSMT changes at different timescales in Heilongjiang Province, China during 1979–2015.
Table 2.
The average periods and their variance contributions of climatic factors: GSP, GEP, CDD, GST, GSMAT, and GSMT changes at different timescales in Heilongjiang Province, China during 1979–2015.
| IMF1 | IMF2 | IMF3 | IMF4 | Residual | ||
|---|---|---|---|---|---|---|
| GSMAT | Period (year) | 2.5 | 5.2 | 12.3 | 18.5 | |
| Variance contribution (%) | 57.2 | 13.6 | 18.1 | 3.8 | 7.3 | |
| GSMT | Period (year) | 2.8 | 6.1 | 12.3 | 37 | |
| Variance contribution (%) | 44.6 | 14.3 | 5.4 | 1.2 | 34.5 | |
| GST | Period (year) | 3.3 | 6.1 | 12.3 | 37 | |
| Variance contribution (%) | 57.7 | 4.5 | 1.6 | 1.2 | 35.0 | |
| GEP | Period (year) | 3.1 | 7.4 | 12.3 | 37 | |
| Variance contribution (%) | 67.1 | 13.1 | 6.1 | 10.3 | 3.4 | |
| CDD | Period (year) | 4.1 | 12.3 | 18.5 | 34 | |
| Variance contribution (%) | 53.3 | 24.9 | 7.5 | 3.7 | 10.6 | |
| GSP | Period (year) | 3.3 | 7.4 | 12.3 | 33 | |
| Variance contribution (%) | 66.6 | 12.2 | 7.9 | 10.1 | 3.2 |
Table 3.
The average periods and their variance contributions of changes in human activities, EIA, and CFF at different timescales in Heilongjiang Province, China during 1979–2015.
Table 3.
The average periods and their variance contributions of changes in human activities, EIA, and CFF at different timescales in Heilongjiang Province, China during 1979–2015.
| IMF1 | IMF2 | IMF3 | IMF4 | Residual | ||
|---|---|---|---|---|---|---|
| EIA | Period (year) | 2.6 | 7.4 | 18.5 | 37 | |
| Variance contribution (%) | 0.40 | 0.51 | 0.65 | 0.96 | 97.48 | |
| CFF | Period (year) | 3.4 | 7.5 | 18.5 | 37 | |
| Variance contribution (%) | 0.51 | 0.43 | 0.60 | 0.15 | 98.32 |
Table 4.
Relationship between maize yield and climatic factors and human activities at different timescales.
Table 4.
Relationship between maize yield and climatic factors and human activities at different timescales.
| GSMAT | GSMT | GST | GEP | CDD | GSP | EIA | CFF | |
|---|---|---|---|---|---|---|---|---|
| original | - | 0.573 ** | - | - | −0.383 * | - | 0.671 ** | 0.787 ** |
| IMF1 | −0.230 | 0.249 | −0.195 | - | −0.244 | - | 0.173 | 0.199 |
| IMF3 | 0.007 | 0.365 * | 0.186 | 0.547 ** | −0.696 ** | 0.594 ** | 0.418 * | 0.833 ** |
| R | 0.912 ** | 0.999 ** | 0.997 ** | 0.961 ** | −0.974 ** | 0.741 ** | 0.833 ** | 0.953 ** |
** Passing 99% significance test; * passing 95% significance test.
Table 5.
The Sen-slope value of human activities and climate change for maize yield over different timescales.
Table 5.
The Sen-slope value of human activities and climate change for maize yield over different timescales.
| Original | 3.56 | 3.04 | 0.20 |
| IMF1 | −0.01 | 0.01 | −0.07 |
| IMF3 | 0.30 | 0.26 | 0.07 |
| R | 5.13 | 2.67 | 2.46 |
Publisher’s Note: MDPI stays neutral with regard to jurisdictional claims in published maps and institutional affiliations. |
© 2022 by the authors. Licensee MDPI, Basel, Switzerland. This article is an open access article distributed under the terms and conditions of the Creative Commons Attribution (CC BY) license (https://creativecommons.org/licenses/by/4.0/).
Share and Cite
MDPI and ACS Style
Li, P.; Huang, S.; Huang, Q.; Zhao, J.; Zheng, X.; Ma, L. Quantifying the Contributions of Climate Change and Human Activities to Maize Yield Dynamics at Multiple Timescales. Water 2022, 14, 1927. https://doi.org/10.3390/w14121927
AMA Style
Li P, Huang S, Huang Q, Zhao J, Zheng X, Ma L. Quantifying the Contributions of Climate Change and Human Activities to Maize Yield Dynamics at Multiple Timescales. Water. 2022; 14(12):1927. https://doi.org/10.3390/w14121927
Chicago/Turabian StyleLi, Pei, Shengzhi Huang, Qiang Huang, Jing Zhao, Xudong Zheng, and Lan Ma. 2022. "Quantifying the Contributions of Climate Change and Human Activities to Maize Yield Dynamics at Multiple Timescales" Water 14, no. 12: 1927. https://doi.org/10.3390/w14121927
Note that from the first issue of 2016, this journal uses article numbers instead of page numbers. See further details here.