
The Toxic Effects of Lindane via the Impact of pH and Dissolved Organic Matter on Microcystis aeruginosa

1
Xiamen Institute of Technology, Xiamen 361021, China
2
FuJian HuaRong Construction Group Limited Company, Fuzhou 350009, China
3
State Key Laboratory of Pollution Control and Resource Reuse, School of the Environment, Nanjing Univesity, Nanjing 210023, China
*
Author to whom correspondence should be addressed.
Water 2022, 14(12), 1915; https://doi.org/10.3390/w14121915
Submission received: 5 May 2022
/
Revised: 4 June 2022
/
Accepted: 7 June 2022
/
Published: 14 June 2022
(This article belongs to the Section Biodiversity and Functionality of Aquatic Ecosystems)
Abstract
:The toxic effects of Lindane (γ-BHC) on Microcystis aeruginosa were studied under lab culture conditions. Total protein levels, as well as malondialdehyde (MDA) levels and superoxide dismutase (SOD) enzyme activity, in algal cells, were determined after exposure to different concentrations of Lindane. The bioaccumulation of Lindane, as well as the influence of pH and dissolved organic matter (DOM) on the toxic effects, was also evaluated in algal cells. The growth of M. aeruginosa was inhibited by the Lindane treatment (96 h), resulting in a 50% maximal effect (EC50) concentration of 442 μg/L. In addition, the lowest observed effect concentration (LOEC) was found to be 120 μg/L; the no observed effect concentration (NOEC) was found to be 60 μg/L, and the maximum acceptable toxicant concentration (MATC) was 85 μg/L. With increasing concentrations of Lindane and exposure time, M. aeruginosa growth was significantly inhibited; in addition, the total protein levels and SOD activity significantly decreased. MDA concentration, however, showed an insignificant increase after 96 h. Lindane has the potential for bioaccumulation in algal cells with a bioconcentration factor (BCF) of 340. Furthermore, the toxic effects of Lindane on M. aeruginosa were influenced by environmental factors, such as pH and DOM. The toxic effects decreased with increasing pH and humic acid concentrations. Ultrastructure cell images were used to depict Lindane-induced apoptosis.
1. Introduction
Lindane (γ-BHC) is an organochlorine insecticide that is classified as a persistent organic pollutant (POP), and serious health problems can arise after exposure to it [1] It is a highly chlorinated compound that has been used worldwide as a broad spectrum insecticide on a variety of crops [2]. The compound has also been used in human health applications to treat scabicide and pediculicide in the form of lotions and shampoos [3]. Lindane is the main insecticide produced in China. Lindane is categorized as a persistent organic pollutant, and its concentrated form persists in the aquatic environment. However, a significant amount of Lindane is also found in soil sediments and air vapours. Lindane is highly persistent due to the presence of its high lipid content and is highly toxic as it migrates long distances and spreads contamination by affecting the environment. The reported half-life for Lindane in water is 2292 days and in soil is 708 [4]. The highly stable nature of Lindane leads to its easy accumulation in the environment and thus in organisms. Lindane enters the food chain and accumulates in the adipose tissues of living organisms and has been observed to be highly toxic for aquatic organisms. In the cases of mammals and birds, it has been found moderately toxic. The presence of a high lipid content and its solubility increase its toxic effects on both animals and humans [5]. Today, Lindane is no longer in production; however, it persists in the environment and has been found in water, sediment, soil, plant and animal samples [6,7,8,9].
Algae are primary producers in aquatic ecosystems and provide a source of food and energy for zooplankton, fish and other aquatic organisms; the levels of algae are used to monitor and evaluate water environment quality [10]. Blue–green algae (cyanobacteria) are a common, naturally occurring component in most recreational water environments. Excessive cyanobacteria populations in surface water are indicative of a eutrophic water environment. Microcystis aeruginosa is a single-celled alga that belongs to Microcystis, Chroococcales, Cyanophyta. M. aeruginosa is the dominant species in most eutrophic lakes in China and is found in eutrophic bodies of water all over the world. The toxic effects of Lindane (γ-BHC) on Microcystis aeruginosa were specially studied because of its persistence in aquatic ecosystems. From the ecological point of view, Lindane is studied to inhibit Microcystis aeruginosa because it has the potential to restrict its growth. This study is possible by means of different lab experiments under different lab conditions. This study is a novel approach because it shows satisfactory results to inhibit the growth of algae in aquatic ecosystems. The inhibition of freshwater algae from direct exposure to Lindane concentration and exposure time ultimately favor our research. This study provides a complete approach to inhibiting the growth of algae under different parameters. Nevertheless, further investigations are still required to determine the toxic effects of Lindane on algal cells [4]. This study aims to investigate the toxic effects of Lindane on M. aeruginosa as well as some environmental factors affecting its toxicity.
2. Materials and Methods
2.1. Reagents and Materials
Lindane was purchased from J&K Scientific Ltd. (Beijing, China, purity 99.3%) and humic acid (HA) was purchased from Sigma-Aldrich (Shanghai, China). All of the chemicals used in this study were analytical grade reagents. Microcystis aeruginosa (FACHB905) was obtained from the Institute of Hydrobiology, Chinese Academy of Sciences. It was cultured in BG11 medium [11] at pH 7.1–7.5, 25 °C with a 12:12 light/dark cycle (2000 lx). BG-11 media is used as universal media for optimum growth and cultivation of blue–green algae and their derivatives. In those areas in which the growth of cyanobacterial algae is not visible to the naked eye, BG-11 media is convenient to use for the isolation of such cyanobacteria from rivers and lakes. For the preparation of BG-11 media, 1.627 g BG-11 is suspended in one liter of distilled water.
2.2. Algal Cell Density Measurements
A series of different concentrations of M. aeruginosa were prepared. Algae concentrations were measured by cell counting with a hemacytometer, and their absorbances at 680 nm were determined with a spectrophotometer. A significant linear correlation between cell number and absorbance was observed (y = 0.0002 x + 0.0116, R2 = 0.9971). The absorbance was then used as an index to measure the growth status of M. aeruginosa in the present study.
2.3. Acute and Chronic Toxicity Test
M. aeruginosa was cultured in 250 mL of BG11 medium and different initial concentrations of Lindane (0, 50, 89, 158, 281 and 500 μg/L) were added. Experiments were performed in triplicate. The initial cell density was 1.7 × 10⁴ cells/mL. The algal optical density at 680 nm (OD680) was measured every 24 h by spectrophotometer, and the growth inhibition rate (Ia) was calculated using the following equation:
where N represents the test group, and N0 represents the control group at OD680. In accordance with the principle of the linear relationship between the natural logarithm of the toxicant concentration and the percentage of biological effect, we can calculate the concentration for 50% of maximal effect (EC50) at the 96-h time point through the probability method [12]. The lowest observed effect concentration (LOEC) is the lowest concentration that has a significant difference from the control, and the no observed effect concentration (NOEC) is the highest concentration that has no significant difference from the control [13]. The maximum acceptable toxicant concentrations (MATC) were obtained using the following equation:
Ia = (1 − N/N0) × 100%
MATC = (LOEC × NOEC)1/2
2.4. Determination of the Protein, SOD and MDA Levels in Algal Cells
An algal solution (50 mL) was centrifuged for 10 min at 2000× g, the supernatant was discarded and then the algal cells were washed using Mili-Q water (3×). Phosphate buffer solution (PBS) (0.05 M, pH = 7.8, 5 mL), a small amount of liquid nitrogen and quartz sand were added to grind the cell material. The homogenate was then centrifuged for 10 min at 2000× g; the resulting supernatant contained a crude enzyme solution. The total protein levels in algal cells were determined using the Coomassie Brilliant Blue G-250 staining method [14]. The superoxide dismutase (SOD) enzymatic activity was determined according to the nitrogen blue tetrazolium photoreduction method [5]. Malondialdehyde (MDA) levels were measured according to the thiobarbituric acid method (Heath and Packer, 1968) with 10% trichloroacetic acid (TCA) substituting for PBS.
2.5. Determination of Lindane Concentration in Algal Cells
An algal solution (70 mL) was centrifuged for 10 min at 2000× g, and the supernatant was discarded. The cell pellet was washed 3× using Mili-Q water. Acetic acid (100 nL), a small amount of liquid nitrogen and quartz sand were added to lyse algal cells. The homogenate was centrifuged for 10 min at 2000× g. The supernatant was filtered through a GF/C membrane (0.45 μm) (MF-Millipore®, Cat# HAWP04700) and passed through a C18 column. The column was then washed with 10 mL of methanol and 10 mL of H2O to clear away contaminants. The extract was eluted with 10 mL of petroleum ether and then concentrated to 1 mL using a vacuum rotary evaporator and a gentle stream of pure nitrogen gas. Lindane concentration was determined using capillary gas chromatography with an electron capture detector (GC-ECD, Agilent 7890) fitted with an HP-5 column (30 m × 0.25 mm × 0.25 μm, Agilent, Santa Clara, CA, USA). The injector port temperature was 200 °C. The oven temperature started at 140 °C for 2 min and increased to 260 °C at a rate of 10 °C min−1. The temperature was then maintained at 260 °C for 10 min. The temperature of the detector was set at 300 °C. A standard curve was prepared using Lindane solutions of various concentrations (5, 10, 20, 50, 100, 200 and 500 μg/L). A linear regression equation (y = 294.27 x − 863.53) (R2 = 0.9998) for the standard curve was obtained for quantification of the Lindane concentration in the M. aeruginosa cells. The recovery efficiency and precision of the process were determined in three different concentrations of Lindane; in these experiments, we observed an 84.6–91.9% recovery and a 1.98–4.62% relative standard deviation (RSD). The bioconcentration factor of Lindane, in the treated M. aeruginosa cells, was determined using the Kukkonen method [5]. The Kukkonen formula is below:
where, Cf represents the concentrations of Lindane (mg/kg) in the algal cells, and Cw represents the concentration of Lindane in the water (mg/L).
BCF = Cf/Cw
2.6. The Influence of pH and DOM
To determine the influence of pH and DOM, the growth of M. aeruginosa after exposure to different concentrations of Lindane (5, 10, 20, 50, 100, 200, 500 μg/L) for 96 h was assessed. In these experiments, cells were grown in various pH conditions (pH 5, 7, 9) and various humic acid (HA) concentrations (0, 2.5, 5.0, 7.5, 10.0 mg/L). Phosphate buffer saline (PBS) was used as a buffer solution to maintain the pH around 7 to 7.4 in this research, while alkaline solutions, such as phosphate buffers, were used to maintain a basic pH around 7 and 9 for algal cells. Cell growth was monitored every 24 hrs to evaluate the influence of pH and DOM.
2.7. The Ultrastructural Observations of M. aeruginosa
M. aeruginosa was grown in different concentrations of Lindane (5, 10, 20, 50, 100, 200, 500 μg/L) for 96 h, and then samples were taken. Algal solutions were centrifuged for 10 min at 2000× g, and the supernatant was discarded. Cells pellets were washed 3× using 0.2 M PBS (pH = 7.4). The algal cells were fixed with 2.5% glutaraldehyde (Sigma-Aldrich, St. Louis, MO, USA) and 2% paraformaldehyde, rinsed with 0.2 M PBS (pH = 7.4) and then suspended in 2% agar in PBS. Phosphate buffer saline was used for washing before and after the fixation of cells. This saline helps to maintain a constant pH in all the cells. This saline was used for washing algal cells because it acts as an isotonic and non-toxic solution for most cells. For the washing of algal cells, the pH was maintained around 7 to 7.6, which maintains the osmotic balance between cells in order to keep them healthy. Next, the small blocks of agar-suspended algae were post-fixed in 1% osmium tetroxide, dehydrated with ethanol and embedded in Epon812 epoxy resin. Ultrathin sections were cut with a diamond knife and sequentially stained with 3% methanolic uranyl acetate followed by lead citrate [15]. The ultrastructure of M. aeruginosa was studied by transmission electron microscopy (TEM) using the JEM-200CX (JEOL, Tokyo, Japan).
2.8. Statistical Analysis
The t-test was used to evaluate statistical differences among the different test groups using the SPSS software (Version 16.0, Armonk, NY, USA). All charts were generated with Origin 8.0 and Excel 2007 (Microsoft corporation).
3. Results and Discussion
3.1. Growth Inhibition of M. aeruginosa by Lindane
Significant growth inhibition was observed in M. aeruginosa under increasing concentrations of Lindane and across various exposure times (Figure 1). Through the probit regression function where y = 0.6435 x + 1.0806 (R2 = 0.9964), the toxicological data of Lindane on M. aeruginosa was obtained. The following toxicological values were determined using this method: EC50 442 μg/L; the lowest observed effect concentration (LOEC) was found to be 120 μg/L; the no observed effect concentration (NOEC) was found to be 60 μg/L; and the maximum acceptable toxicant concentration (MATC) was 85 μg/L. The software US EPA ECOTOX database was used to compare our results with the available reported value (300 μg/L), and the LOEC value is observed to be the same as that reported in the database (US EPA, 2013).
3.2. Cellular Effects of Lindane Exposure in M. aeruginosa
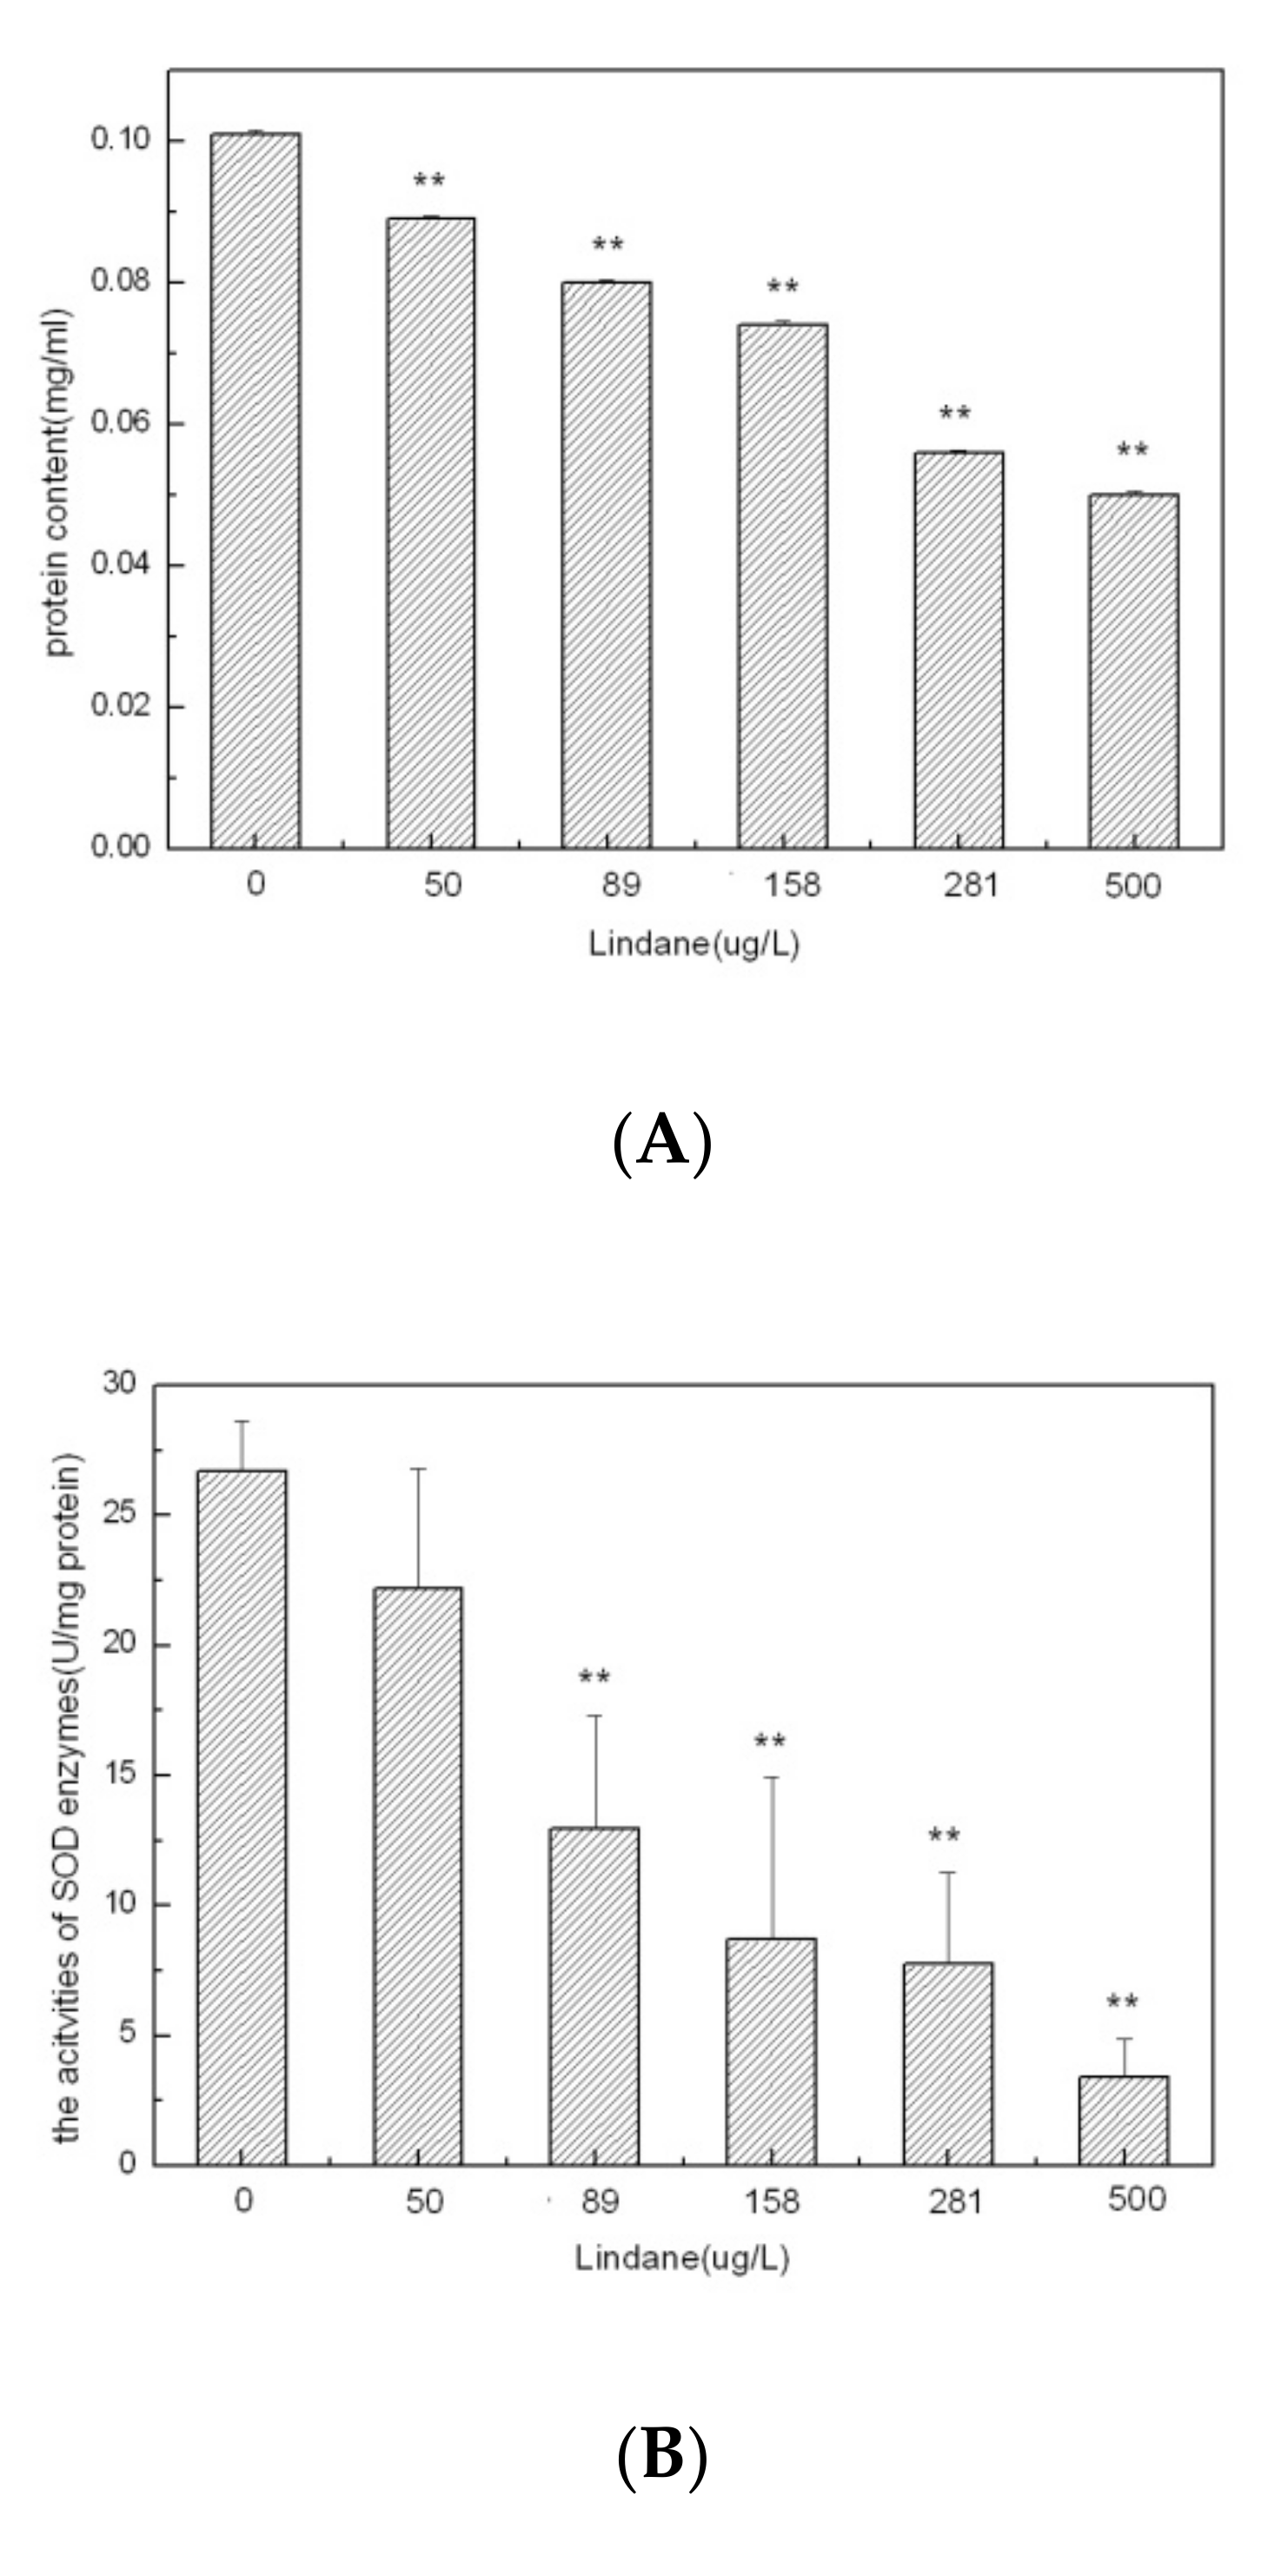
The protein levels found in algal cells grown under different concentrations of Lindane after 96 h of exposure are shown in Figure 2A. The protein levels decreased with increasing concentrations of Lindane. No reduction in the protein levels was observed under low concentrations of Lindane (50–158 μg/L). On the contrary, a significant reduction in the protein level was observed for high concentrations of Lindane (281 and 500 μg/L). In these samples, the protein levels were 55.4% (281 μg/L) and 49.5% (500 μg/L) of the control sample (p < 0.01). These results indicate that Lindane exposure may disrupt protein synthesis in M. aeruginosa. [16] reported that the protein content of Anabaena sp. (cyanobacteria) decreased significantly as the Lindane dosage and exposure times increased.
The effect of Lindane exposure on the SOD enzyme activity is shown in Figure 2B. The SOD enzyme activity decreased with increasing concentrations of Lindane (50–500 μg/L for 96 h). A marked enzymatic activity reduction occurred at all concentrations of 50 μg/L and higher (p < 0.01). The SOD enzyme activity was only 12.8% of the control sample in the 500 μg/L Lindane sample. The SOD enzyme catalyzes excess O2− to H2O2 and O2, in order to prevent free-radical toxicity and protect cells [17]. In this study, the activity of SOD decreased with increasing concentrations of Lindane. This decrease in the SOD activity resulted in a decrease in the cell membrane’s osmotic adjustment ability. Superoxide dismutases play a crucial role in signaling pathways in conjugation by producing a low number of reactive oxygen species (ROS). To maintain a balance between ROS generation and suppression, the SOD activity declines as the oxidative stress increases. Antioxidant enzymes, such as superoxide dismutases, enable algae cells to cope with oxidative stress [18].
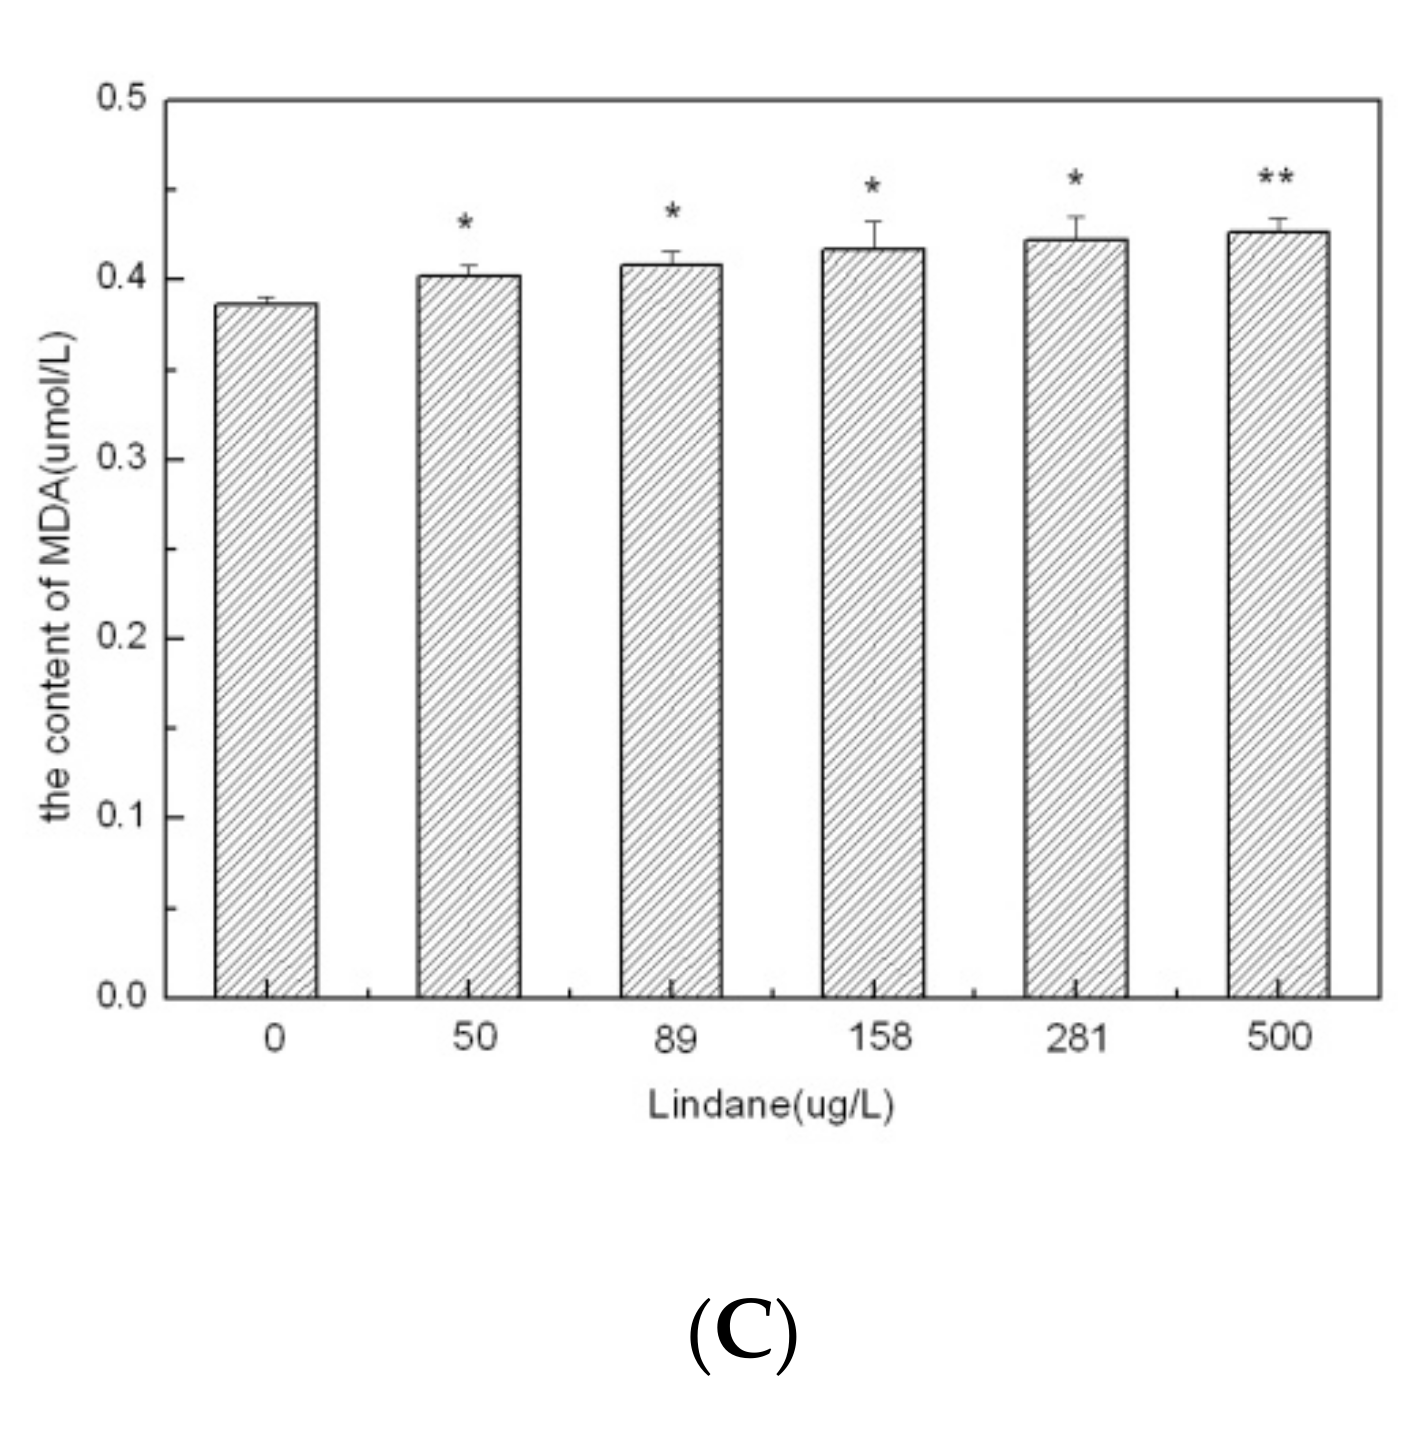
The cellular content of MDA increased gradually from 0.386 μmol/L to 0.427 μmol/L with increasing concentrations of Lindane (Figure 2C). The increasing MDA levels in the treatments varied from 4.0% to 10.6% compared to the control (p < 0.05). MDA is an oxidized product of membrane lipids. MDA has been shown to accumulate when plants are exposed to oxidative stresses. Cellular levels of MDA are considered to be an indicator of lipid peroxidation and cellular stress [19]. The results revealed that the MDA levels gradually increased in accordance with the Lindane concentration levels. These results suggest that Lindane promotes lipid peroxides in M. aeruginosa. Overall, we observed that Lindane exposure caused a reduction in the total cellular protein content and SOD activity, as well as elevation in the MDA levels in M. aeruginosa. The decreased activity of superoxide dismutases was associated with a decrease in the contents of cellular proteins. Under abiotic stresses, the enhancement of ROS was mainly responsible for oxidative damage in algal cells. In such conditions, increasing levels of ROS produce harmful effects in various cellular components, including the cell membrane and contents of proteins and lipids. To counteract such oxidative stresses, algal cells produce SOD, which functions as an antioxidant for suppression of ROS [5]. Moreover, these results indicate that high concentrations of Lindane may destroy the anti-oxidative system of M. aeruginosa.
3.3. Bioaccumulation of Lindane in M. aeruginosa
The concentration of Lindane in M. aeruginosa was determined using GC-ECD after exposure to different concentrations of Lindane (Table S1). As expected, the cellular concentration of Lindane increased with increasing initial concentrations of Lindane in the algal solution. The BCF of Lindane in M. aeruginosa was obtained when the initial concentration of Lindane was 400 μg/L, and the algae cell population was 2.0 × 10⁴ cells/mL (Table S2 and Figure S1). The BCF value of 340 (log BCF, 2.53) indicated that Lindane has a relatively strong bioaccumulation potential in M. aeruginosa. Lindane has been previously shown to be bioaccumulated in different aquatic organisms [17,20,21]. Moreover, the BCF value in this study is similar to previously reported values [4]. This review reported the BCF values of Lindane in over 140 aquatic organisms, which ranged from 0.52 to 3.32 for logBCF and from 2.16 to 3.32 for acceptable log BCF.
3.4. The Influence of pH and DOM on Lindane Toxicity
The influences of pH and DOM on Lindane toxicity in M. aeruginosa are represented in Table 1. There was little impact observed on the LOEC, NOEC and MATC of the samples. The EC50 did increase with an increase in pH; this result implies that weak alkaline conditions could reduce Lindane toxicity in M. aeruginosa. [22] reported that the optimal pH range is 8.5–9.5 for the growth of M. aeruginosa. Lindane is hydrolyzed in alkaline conditions. Hydrolysis is an important mechanism in the abiotic transformation of Lindane [23]. Previous studies revealed that Lindane hydrolysis could be catalyzed by hydroxide and hydrogen ions, especially in alkaline conditions [23,24]. The values of LOEC, NOEC and MATC at pH 5 and 9 were slightly higher than that at pH 7 (Table 1). [25] reported that the hydrolysis of Lindane was not significant under certain growth conditions, specifically, pH 5 or pH 7 at 25 °C. This study reported that the half-life of Lindane hydrolysis was approximately 2310 d (pH 5) and 1386 d (pH 7); however, the half-life of this reaction was 28.1 d at pH 9. Thus, pH has a significant effect on the rate at which Lindane is hydrolyzed in the environment. The products of Lindane hydrolysis, including 1,2,4-trichlorobenzene, 1,2,3-trichlorobenzene 1,3,5-trichlorobenzene and pentachlorocyclohexene, have been identified, and their distributions are shown to be dependent on pH [25]. Perhaps these products are less toxic and persistent than Lindane in the environment, and therefore, support previous data in that a weak alkaline condition degrades the Lindane toxicant and favors M. aeruginosa growth.
The toxic effects of Lindane on M. aeruginosa decreased dramatically with increasing concentrations of HA (Table 1). The EC50 value of Lindane increased from 554 μg/L to 920 μg/L when the concentration of HA increased from 2.5 mg/L to 10 mg/L. DOM is regarded as a natural chelator [26]. Previous studies have shown the hydrophobic component of DOM has a high affinity to pesticides; thus, DOM improves solubility in water and migration of hydrophobic organic contaminants [27,28]. DOM has been reported to decrease the bioconcentration of organic chemicals in aquatic animals. These decreases in bioconcentration have been attributed to DOM interactions with chemical compounds. Under these conditions, aggregates are formed that are too large and/or too polar to be taken up by test organisms [29]. In the present study, the increased EC50 value may be the result of a stable chelate formation involving HA and Lindane.
3.5. The Ultrastructure of M. aeruginosa
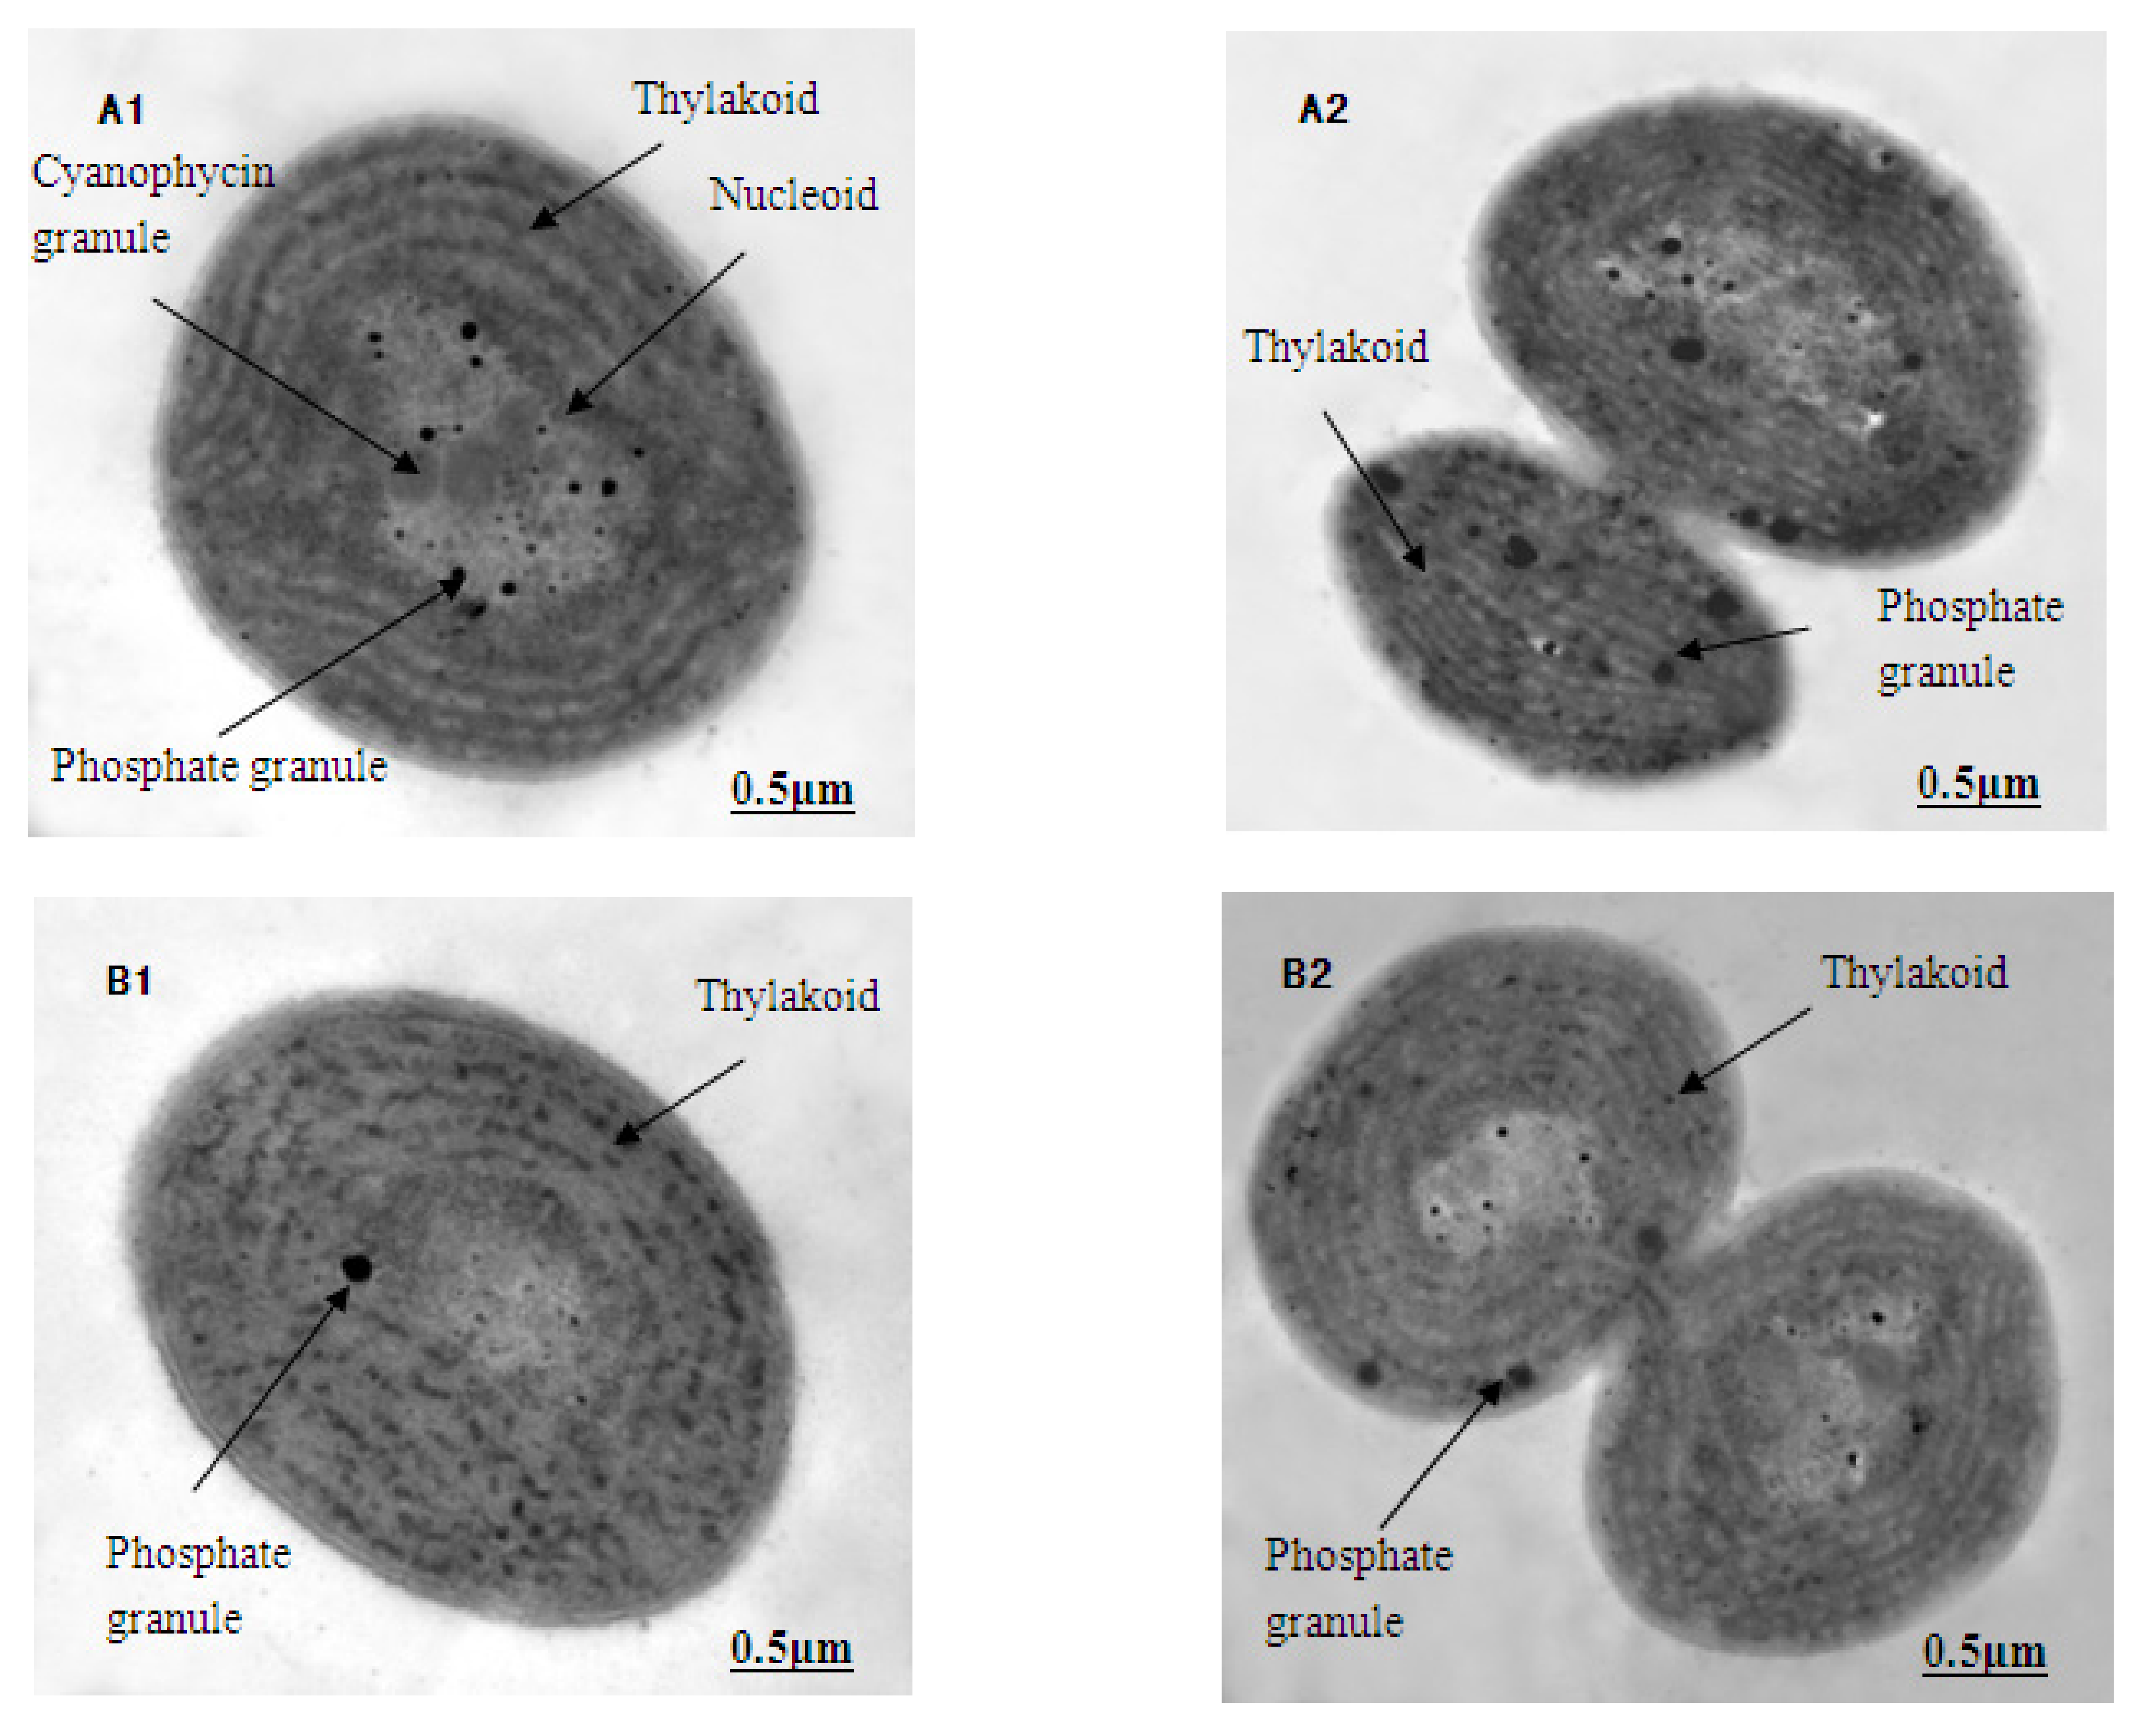
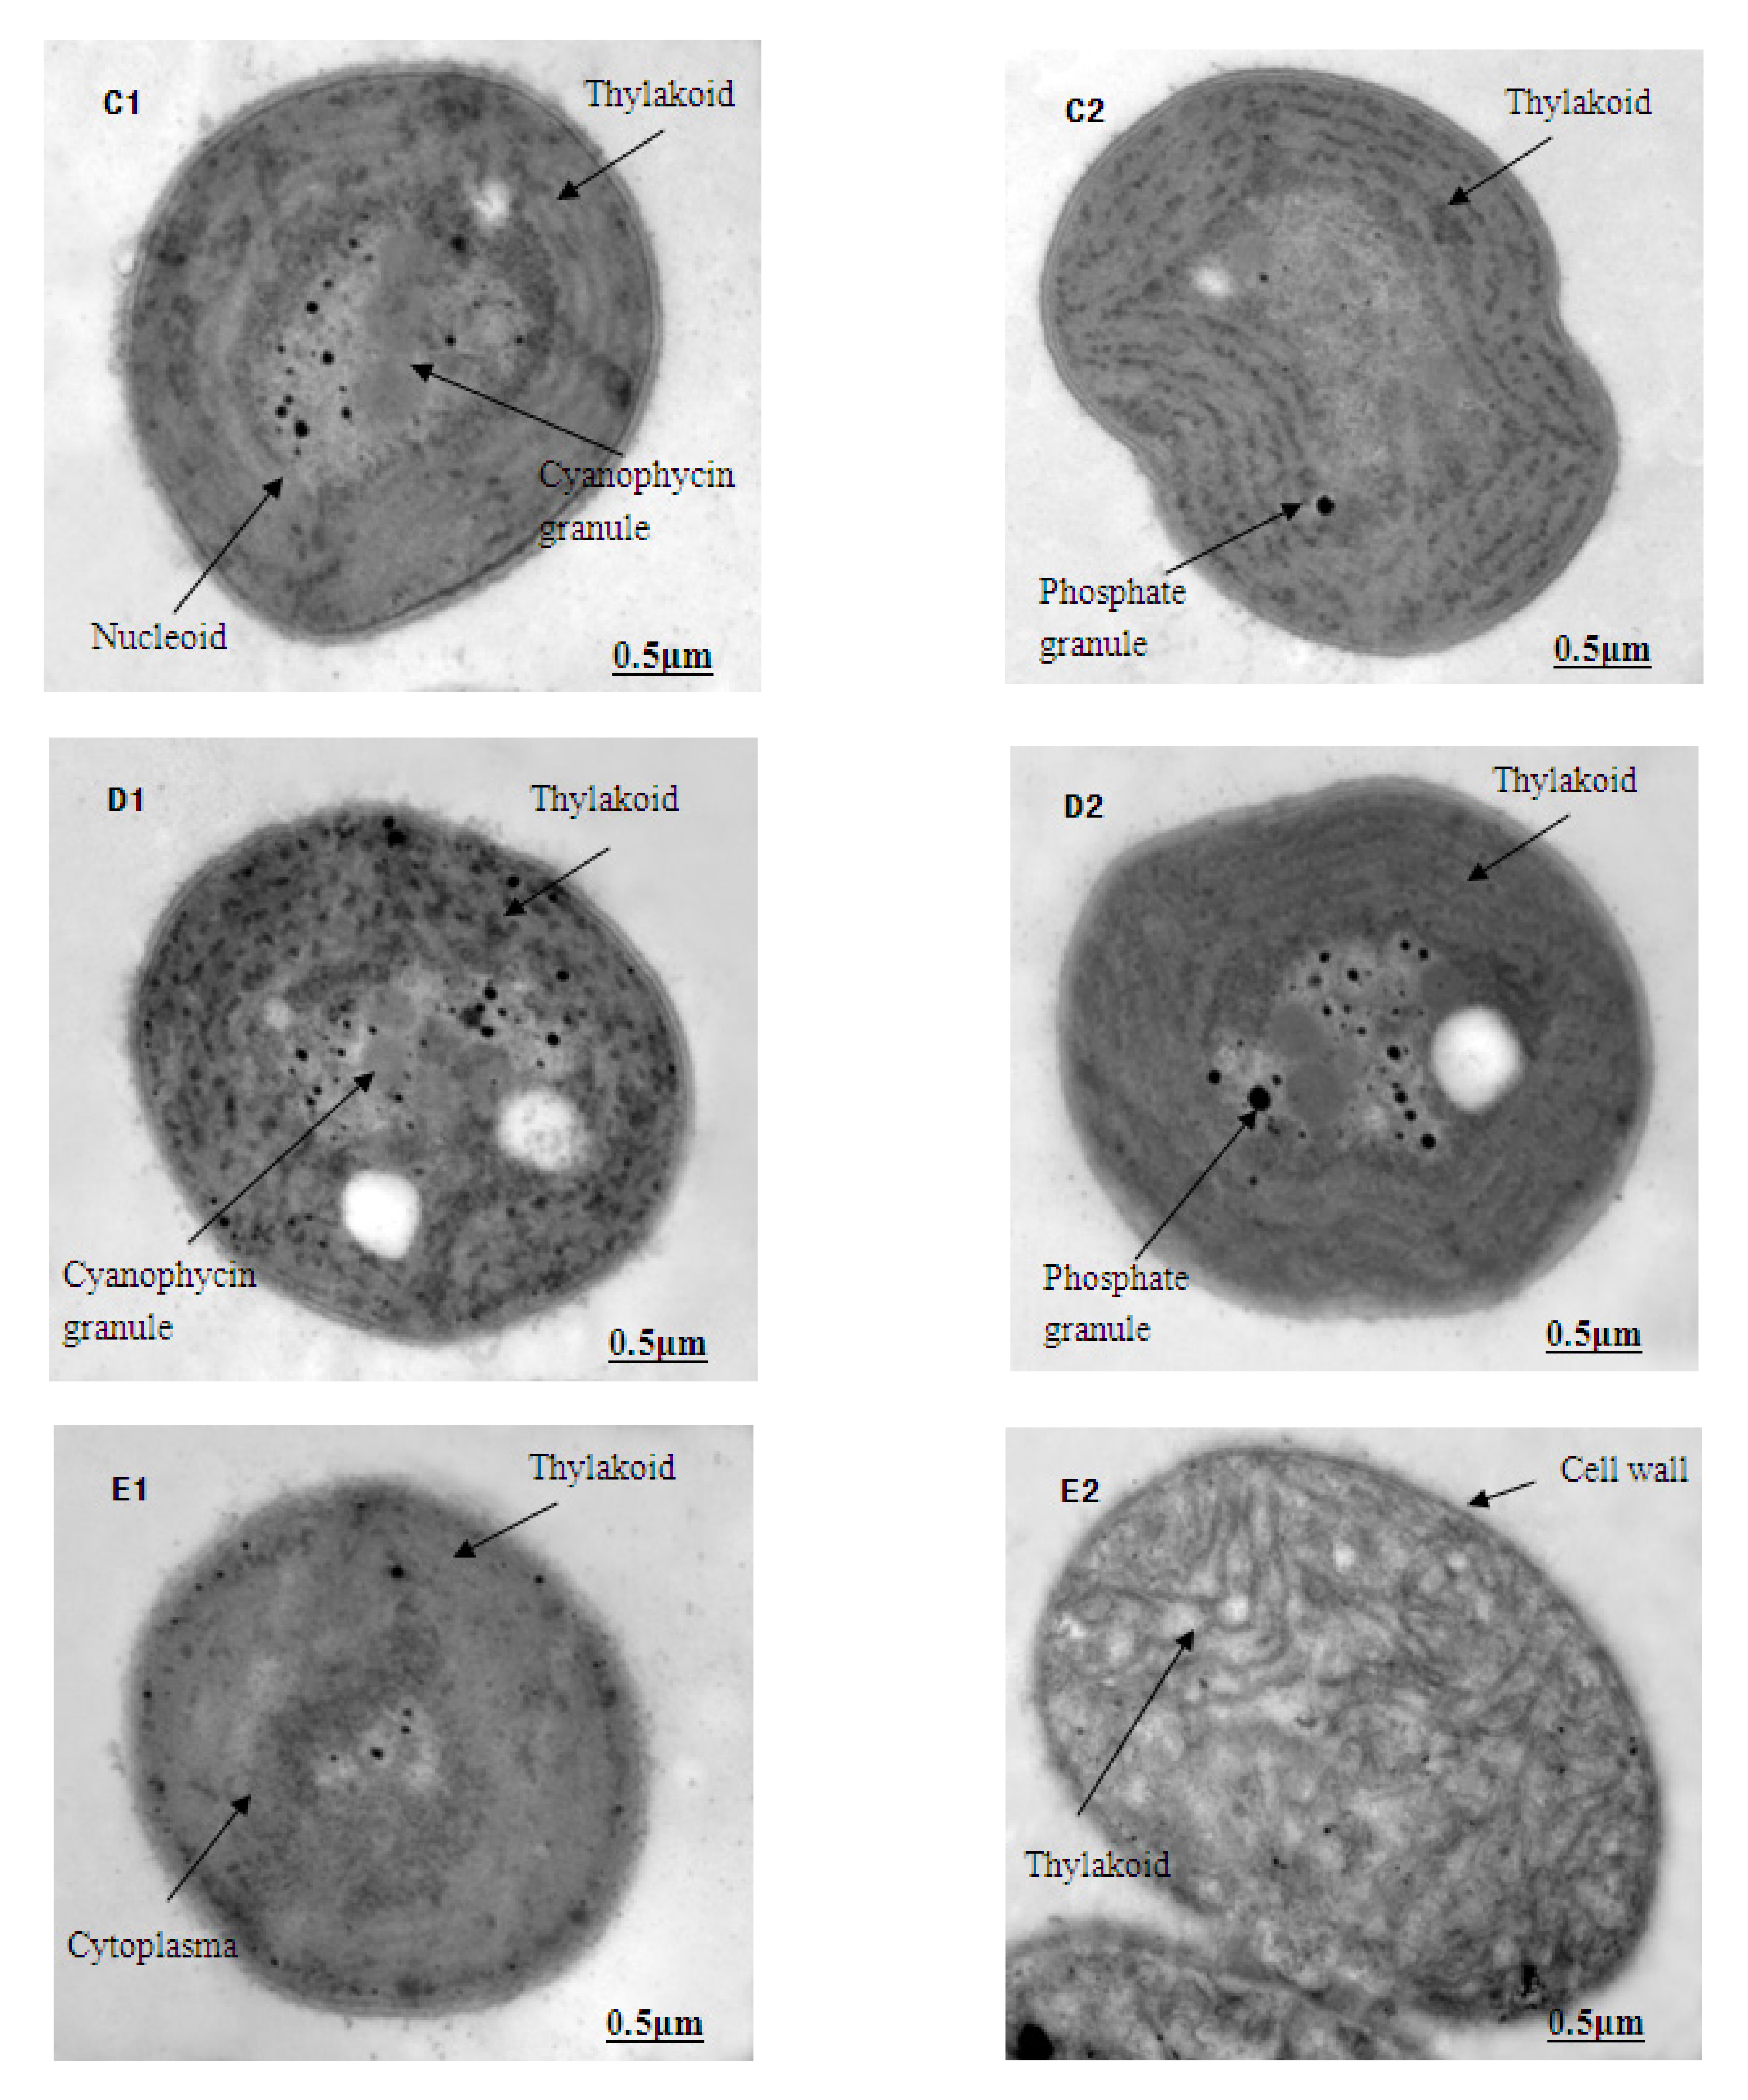
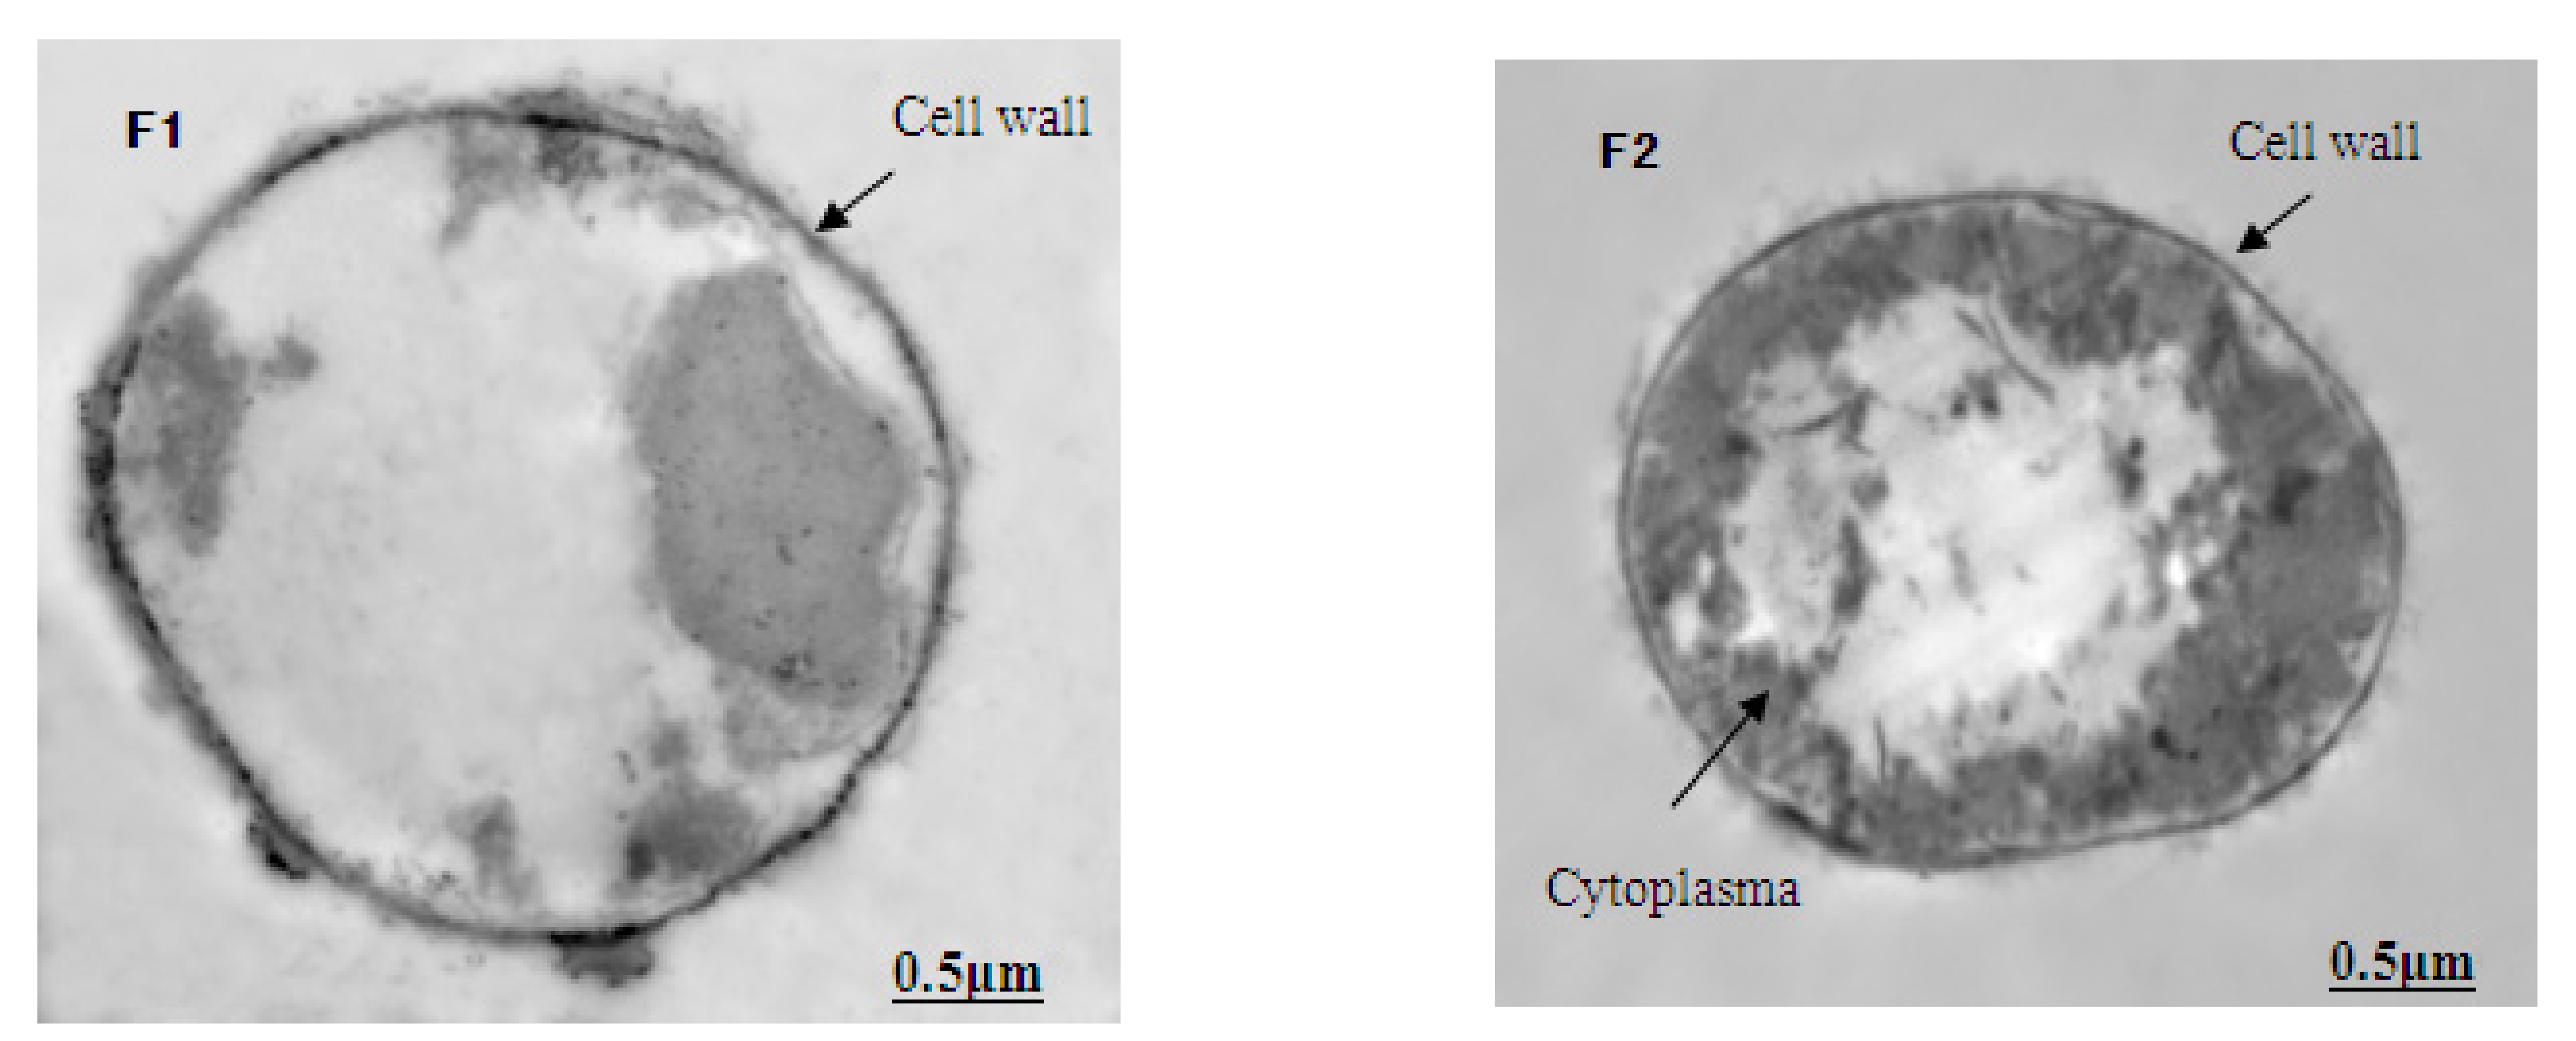
The ultrastructure photos of M. aeruginosa exposed to different concentrations of Lindane are shown in Figure 3 (1-cell growth; 2-cell division). Here, the M. aeruginosa cells grown in BG-11 medium, without Lindane, demonstrate a dense cytoplasm and an intact cell wall and membrane. The thylakoids were abundant with a compact, neat arrangement in the cytoplasm. The central nuclei were obvious, ribosomes were evenly distributed throughout the cells and there were many phosphate granules around the central nucleus (Figure 3A1,A2). Under the stress of Lindane (50 μg/L) exposure, the vast majority of the M. aeruginosa cells began to degrade, and the hylakoids gradually blurred and became fuzzy (Figure 3B1,B2). Disintegration of the thylakoids became more obvious, and the nucleus began to appear as an empty cavity in cells treated with 89 μg/L of Lindane (Figure 3C1,C2). In samples in which the concentration of Lindane was greater than 158 μg/L, the thylakoids were broken further and disintegrated; empty nuclei cavities became more abundant (Figure 3D1,D2). The structure of algal cells became blurred, and the nuclei gradually disappeared (Figure 3E1,E2). When the concentration of Lindane was increased to 500 μg/L, the cells all but disintegrated; however, the cell walls remained intact (Figure 3F1,F2).
The structural integrity of a cell’s periphery plays an important role in protecting the internal structure as well as maintaining normal viability and cellular activity. These TEM images of M. aeruginosa indicate that Lindane can destroy the structure of these cells. This results in the cells’ inability to perform photosynthesis, thus leading to death.
4. Conclusions
Here, we report that growth of M. aeruginosa is inhibited by Lindane. This study demonstrated that Lindane exposure resulted in an EC50 442 μg/L, LOEC 120 μg/L, NOEC 60 μg/L and MATC 85 μg/L in M. aeruginosa after 96 h of exposure. The observed decrease in protein levels and SOD activity, as well as the increase in MDA levels, suggested that the main mechanism of Lindane toxicity might result from oxidative damage of lipids and other biological macromolecules. Furthermore, the BCF value of 340 indicates that Lindane has the potential to bioaccumulate in M. aeruginosa. Here, we observed the toxic effects of Lindane’s decrease as the pH increased and as the concentrations of HA increased. Finally, the ultrastructure images of M. aeruginosa showed that increasing concentrations of Lindane destroyed cellular structures. This destruction resulted in the loss of photosynthesis, subsequently preventing cellular metabolism and reproduction and eventually leading to cell death.
Supplementary Materials
The following supporting information can be downloaded at: https://www.mdpi.com/article/10.3390/w14121915/s1, Table S1: The compositions of BG11 medium; Table S2: The concentrations of Lindane in algal cells of M. aeruginosa (96 h); Figure S1: The BCF of Lindane in M. aeruginosa cells. Initial concentrations of Lindane and algal cells are 400 μg/L and 2.0 × 10⁴ cells/mL, respectively. Each value is the mean ± S.D.
Author Contributions
Conceptualization, Q.X. and X.D.; methodology, X.D.; software, X.D.; validation, Q.X., X.D. and Y.J.; formal analysis, X.D.; investigation, X.D.; resources, Q.X.; data curation, X.D.; writing—original draft preparation, X.D.; writing—review and editing, Q.X. and X.D.; visualization, X.D. and Y.J.; supervision, Q.X.; project administration, Q.X.; funding acquisition, Q.X. All authors have read and agreed to the published version of the manuscript.
Funding
This study was funded by the Major Science and Technology Program for Water Pollution Control and Treatment (2012ZX07529-003) and the National High Technology Research and Development Program of China (2013AA06A309).
Data Availability Statement
Data will be provided upon request to the authors.
Conflicts of Interest
The authors declare no conflict of interest.
References
- Saez, J.M.; Benimeli, C.S.; Amoroso, M.J. Lindane removal by pure and mixed cultures of immobilized actinobacteria. Chemosphere 2012, 89, 982–987. [Google Scholar] [CrossRef] [PubMed]
- Bidlan, R.; Afsar, M.; Manonmani, H.K. Bioremediation of HCH-contaminated soil: Elimination of inhibitory effects of the insecticide on radish and green gram seed germination. Chemosphere 2004, 56, 803–811. [Google Scholar] [CrossRef] [PubMed]
- Phillips, T.M.; Seech, A.G.; Lee, H.; Trevors, J.T. Biodegradation of hexachlorocyclohexane (HCH) by microorganisms. Biodegradation 2005, 16, 363–392. [Google Scholar] [CrossRef] [PubMed]
- Arnot, J.A.; Gobas, F.A.P.C. A review of bioconcentration factor (BCF) and bioaccumulation factor (BAF) assessments for organic chemicals in aquatic organisms. Environ. Rev. 2006, 14, 257–297. [Google Scholar] [CrossRef]
- Beauchamp, C.; Fridovich, I. Superoxide dismutase: Improved assays and an assay applicable to acrylamide gels. Anal. Biochem. 1971, 44, 276–287. [Google Scholar] [CrossRef]
- Carvalho, P.N.; Rodrigues, P.N.R.; Basto, M.; Vasconcelos, M. Organochlorine pesticides levels in Portuguese coastal areas. Chemosphere 2009, 75, 595–600. [Google Scholar] [CrossRef]
- Cid, F.D.; Anton, R.I.; Caviedes-Vidal, E. Organochlorine pesticide contamination in three bird species of the Embalse La Florida water reservoir in the semiarid midwest of Argentina. Sci. Total Environ. 2007, 385, 86–96. [Google Scholar] [CrossRef]
- Concha-Grana, E.; Turnes-Carou, M.I.; Muniategui-Lorenzo, S.; Lopez-Mahia, P.; Prada-Rodriguez, D.; Fernandez-Fernandez, E. Evaluation of HCH isomers and metabolites in soils, leachates, river water and sediments of a highly contaminated area. Chemosphere 2006, 64, 588–595. [Google Scholar] [CrossRef]
- Vega, F.A.; Covelo, E.F.; Andrade, M.L. Accidental organochlorine pesticide contamination of soil in Porrino, Spain. J. Environ. Qual. 2007, 36, 272–279. [Google Scholar] [CrossRef]
- Kobraei, M.E.; White, D.S. Effects of 2, 4-dichlorophenoxyacetic acid on Kentucky algae: Simultaneous laboratory and field toxicity testings. Arch. Environ. Contam. Toxicol. 1996, 31, 571–580. [Google Scholar] [CrossRef]
- Olvera-Ramirez, R.; Coria-Cedillo, M.; Canizares-Villanueva, R.O.; Martinez-Jeronimo, F.; Ponce-Noyola, T.; Rios-Leal, E. Growth evaluation and bioproducts characterization of Calothrix sp. Bioresour. Technol. 2000, 72, 121–124. [Google Scholar] [CrossRef]
- Hoekstra, J.A. Estimation of the LC50, a review. Environmetrics 1991, 2, 139–152. [Google Scholar] [CrossRef]
- Saker, M.L.; Neilan, B.A. Varied diazotrophies, morphologies, and toxicities of genetically similar isolates of Cylindrospermopsis raciborskii (nostocalss, cyanophyceae) from northern Australia. Appl. Environ. Microbiol. 2001, 67, 1839–1845. [Google Scholar] [CrossRef] [PubMed] [Green Version]
- Bradford, M.M. A rapid and sensitive method for the quantitation of microgram quantities of protein utilizing the principle of protein-dye binding. Anal. Biochem. 1976, 72, 248–254. [Google Scholar] [CrossRef]
- Pollio, A.; Pinto, G.; Ligrone, R.; Aliotta, G. Effects of the potential allelochemical α-asarone on growth, physiology and ultrastructure of two unicellular green algae. J. Appl. Phycol. 1993, 5, 395–403. [Google Scholar] [CrossRef]
- Hans, R.K.; Singh, J.; Viswanathan, P.N.; Joshi, P.C. Effect of lindane on the growth and metabolic activities of cyanobacteria. Ecotoxicol. Environ. Saf. 2001, 48, 219–221. [Google Scholar]
- Scandalios, J.G. Oxygen stress and superoxide dismutases. Plant Physiol. 1993, 101, 7–12. [Google Scholar] [CrossRef] [Green Version]
- Mittler, R. Oxidative stress, antioxidants and stress tolerance. Trends Plant Sci. 2002, 7, 405–410. [Google Scholar] [CrossRef]
- Chaoui, A.; Mazhoudi, S.; Ghorbal, M.H.; El Ferjani, E. Cadmium and zinc induction of lipid peroxidation and effects on antioxidant enzyme activities in bean (Phaseolus vulgaris L.). Plant Sci. 1997, 127, 139–147. [Google Scholar] [CrossRef]
- Thybaud, E.; Le Bras, S. Absorption and elimination of lindane byAsellus aquaticus (Crustacea, Isopoda). Bull. Environ. Contam. Toxicol. 1988, 40, 731–735. [Google Scholar] [CrossRef]
- Vigano, L.; Galassi, S.; Gatto, M. Factors affecting the bioconcentration of hexachlorocyclohexanes in early life stages of Oncorhynchus mykiss. Environ. Toxicol. Chem. 1992, 11, 535–540. [Google Scholar] [CrossRef]
- Jin, X.C.; Li, Z.C.; Zheng, S.F.; Yang, S.W.; Hu, X.Z.; Chu, Z.S. Studies on the Growth Characteristics of Microcystis aeruginosa. Res. Environ. Sci. S 2004, 17, 52–54, 61. [Google Scholar]
- Ngabe, B.; Bidleman, T.F.; Falconer, R.L. Base hydrolysis of .alpha.- and .gamma.-hexachlorocyclohexanes. Environ. Sci. Technol. 1993, 27, 1930–1933. [Google Scholar] [CrossRef]
- Saleh, F.Y.; Dickson, K.L.; Rodgers, J.H. Fate of lindane in the aquatic environment: Rate constants of physical and chemical processes. Environ. Toxicol. Chem. 1982, 1, 289–297. [Google Scholar] [CrossRef]
- Liu, X.M.; Peng, P.A.; Huang, W.L.; Sheng, G.Y.; Fu, J.M. Influence of acidity on Lindane hydrolysis. China Environ. Sci. 2002, 22, 485–489. [Google Scholar]
- Boggs, S.; Livermore, D.G.; Seitz, M.G. Humic macromolecules in natural waters. J. Macromol. Sci.-Rev. Macromol. Chem. Phys. 1985, 25, 599–657. [Google Scholar] [CrossRef]
- Edwards, R.; Cole, D.J. Glutathione Transferases in Wheat (Triticum) Species with Activity toward Fenoxaprop-Ethyl and Other Herbicides. Pestic. Biochem. Physiol. 1996, 54, 96–104. [Google Scholar] [CrossRef]
- Thevenot, M.; Dousset, S.; Hertkorn, N.; Schmitt-Kopplin, P.; Andreux, F. Interactions of diuron with dissolved organic matter from organic amendments. Sci. Total Environ. 2009, 407, 4297–4302. [Google Scholar] [CrossRef]
- Haitzer, M.; Hoss, S.; Traunspurger, W.; Steinberg, C. Effects of dissolved organic matter (DOM) on the bioconcentration of organic chemicals in aquatic organisms—A review. Chemosphere 1998, 37, 1335–1362. [Google Scholar] [CrossRef]
Figure 1.
The growth inhibition of Microcystis aeruginosa by Lindane. Each value is the mean ± S.D.

Figure 2.
Cellular effects of Lindane on Microcystis aeruginosa (96 h): (A) protein content; (B) SOD activities; (C) MDA content. Each value is the mean ± S.D. * p < 0.05, ** p < 0.01.
Figure 2.
Cellular effects of Lindane on Microcystis aeruginosa (96 h): (A) protein content; (B) SOD activities; (C) MDA content. Each value is the mean ± S.D. * p < 0.05, ** p < 0.01.


Figure 3.
Effect of Lindane on the cellular ultrastructure of M. aeruginosa (7000×): (A–F): ultrastructure of M. aeruginosa in 0, 50, 89, 158, 281 and 500 μg/L Lindane, respectively; 1-cell growth, 2-cell division. (A) shows cyanophycin granules, nucleoid and phosphate granules; (B) shows thylakoid and phosphate granules; (C) shows thylakoid, phosphate granules and nucleoid; (D) shows cyanophycin, thylakoid and phosphate granules; (E) shows cytoplasm, thylakoid and cell wall; (F) shows cell wall and cytoplasm.


Table 1.
The influence of pH and DOM on the toxic effects of Lindane on M. aeruginosa (96 h).
| pH | HA (mg/L) | The Regression Equation | R2 | EC50 (μg/L) | LOEC (μg/L) | NOEC (μg/L) | MATC (μg/L) |
|---|---|---|---|---|---|---|---|
| 5 | 0 | y = 0.6766 x + 0.9149 | 0.9923 | 419 | 121 | 63 | 87 |
| 7 | y = 0.6435 x + 1.0806 | 0.9964 | 442 | 120 | 60 | 85 | |
| 9 | y = 0.6607 x + 0.9533 | 0.9787 | 457 | 128 | 66 | 92 | |
| 7 | 2.5 | y = 0.6330 x + 1.0018 | 0.9988 | 554 | 147 | 73 | 104 |
| 5 | y = 0.6330 x + 0.8135 | 0.9966 | 745 | 198 | 99 | 140 | |
| 7.5 | y = 0.6140 x + 0.8358 | 0.9756 | 882 | 225 | 110 | 157 | |
| 10 | y = 0.6505 x + 0.5610 | 0.9813 | 920 | 238 | 129 | 175 |
Publisher’s Note: MDPI stays neutral with regard to jurisdictional claims in published maps and institutional affiliations. |
© 2022 by the authors. Licensee MDPI, Basel, Switzerland. This article is an open access article distributed under the terms and conditions of the Creative Commons Attribution (CC BY) license (https://creativecommons.org/licenses/by/4.0/).
Share and Cite
MDPI and ACS Style
Deng, X.; Jiang, Y.; Xian, Q. The Toxic Effects of Lindane via the Impact of pH and Dissolved Organic Matter on Microcystis aeruginosa. Water 2022, 14, 1915. https://doi.org/10.3390/w14121915
AMA Style
Deng X, Jiang Y, Xian Q. The Toxic Effects of Lindane via the Impact of pH and Dissolved Organic Matter on Microcystis aeruginosa. Water. 2022; 14(12):1915. https://doi.org/10.3390/w14121915
Chicago/Turabian StyleDeng, Xiru, Yingnan Jiang, and Qiming Xian. 2022. "The Toxic Effects of Lindane via the Impact of pH and Dissolved Organic Matter on Microcystis aeruginosa" Water 14, no. 12: 1915. https://doi.org/10.3390/w14121915
Note that from the first issue of 2016, this journal uses article numbers instead of page numbers. See further details here.