
Study on Index of Groundwater Ecological Function Crisis Classification and Early Warning in Northwest China

1
Institute of Hydrogeology and Environmental Geology, Chinese Academy of Geological Sciences, Shijiazhuang 050061, China
2
China University of Geosciences (Beijing), Beijing 100083, China
3
Key Laboratory of Groundwater Sciences and Engineering, Ministry of Natural Resources, Shijiazhuang 050061, China
*
Author to whom correspondence should be addressed.
Water 2022, 14(12), 1911; https://doi.org/10.3390/w14121911
Submission received: 13 April 2022
/
Revised: 10 June 2022
/
Accepted: 11 June 2022
/
Published: 14 June 2022
(This article belongs to the Topic Water and Soil Management in Adaptation to Climate Change)
Abstract
:The natural oases in the plain area of the northwest inland basin strongly depend on the groundwater depth. With the overexploitation and utilization of groundwater, natural oases are faced with the problems of serious degradation and rehabilitation. How to evaluate the degree of the degeneration crisis of groundwater ecological function has become one of the key scientific and technological problems to be solved. In this paper, the Shiyang River basin of Gansu Province was selected as a typical research area. The remote sensing interpretation, groundwater–soil ecology comprehensive investigation, and groundwater in situ monitoring were adopted to carry out the research. Based on the correlation analysis method of natural ecology and groundwater, the interactive relationship between the natural ecological environment and groundwater depth in different ecological types of the region were studied: (1) under the arid climate condition in northwest China, the relationships between the ecological situation and the groundwater depth in different ecological types of the region were obviously different, and as a result, the optimal or limit ecological water level of groundwater in different ecological types was also different; (2) in the natural wetland area, the suitable ecological water level of groundwater was between 0.5 m to 1.5 m, and the limit ecological water level was 8.0 m; in the natural vegetation area, the suitable ecological water level was between 3.0 m to 5.0 m, and the limit ecological water level was 10.0 m; and in the farmland area, the suitable ecological water level was between 2.0 m to 5.0 m, and the limit ecological water level was 2.0 m; (3) in order to effectively protect the natural ecology in different ecological types, a five-level early warning and control index system should be established for the ecological function degeneration crisis of groundwater. It may be beneficial to promote restoration and protection of the groundwater ecological function and natural ecology in the inland area of northwest China.
1. Introduction
Concept of GEF: groundwater is not only an important resource but also supports many ecosystems [1]. Because of the low precipitation and high evaporation, as well as scarce water resources in the arid area of northwest China, the ecological environment is highly dependent on groundwater, which is also called groundwater-dependent ecological systems (GDEs) [2,3,4,5,6,7]. Groundwater plays a positive role or effect in providing numerous services to humankind [8], such as maintaining natural vegetation, natural wetland, and land quality, which is called groundwater ecological function (GEF) [9].
Challenges of water resource utilization in arid areas: the sustainable use and management of limited groundwater resources remains a challenge owing to the growing demand for water, the pressures of economic development, climate change, and the increasing scarcity of water resources. In the lower reaches of the inland basin of northwest China, the amount of groundwater recharge in the lower reaches of the basin has been decreasing due to the long-term large-scale interception of surface runoff from the mountains for farmland irrigation in the middle and upper reaches. In order to meet the increasing demand of water, the groundwater in the lower reaches has to be exploited continuously, which leads to the decrease in groundwater depth. When the groundwater depth is deeper than the suitable ecological groundwater level or the limit ecological groundwater level, the ecosystem such as natural wetland and natural vegetation area may degenerate to different degrees. Otherwise, in the process of artificial water transfer to natural wetlands to restore the ecology, the groundwater in the surrounding oasis is too shallow, which makes the surface soil seriously salinized, thus inhibiting the development and growth of natural vegetation or crops. Therefore, in the inland of northwest China, if the groundwater depth is too deep or too shallow, the GEF decreases or disappears [10], which may lead to the degeneration crisis of the ecological environment and seriously threaten the local ecological security [11].
Research methods and examples of ecological groundwater level in arid areas: the ecological groundwater level is the key index of water resource management and groundwater and ecological environment protection in arid oasis regions. Ecological survey statistics and analysis, hydrological simulation analysis, and remote sensing statistical analysis are the primary methods to determine the ecological groundwater level [12]. Ecological survey statistics and analysis is the most common method. The vegetation coverage, frequency, and abundance can be obtained through the ecological quadrat survey, and then the statistical model can be used for quantitative analysis of the functional relationship between each ecological factor and the groundwater depth. Thus, the ecological groundwater level of different types of ecological protection areas can be determined [13,14,15,16,17]. Hydrological simulation analysis is used to simulate the groundwater depth and vegetation index by a mathematical model, or to calculate the appropriate groundwater depth according to the capillary rise theory. Then, the ecological groundwater level in a natural vegetation area is determined by scenario contrast analysis and field verification [18,19,20,21,22]. Remote sensing statistical analysis is used to acquire spatial data such as the vegetation index and groundwater depth by multi-source remote sensing satellite data, combined with ground fixed-point observation, to determine the reasonable groundwater depth by the quantitative relationship between groundwater depth and vegetation status [23,24,25]. For example, Li et al. fitted the curve of the relation between vegetation and groundwater depth by normal and lognormal distributions, in which the ‘suitable water depth’ range corresponded to the higher frequency of vegetation distribution. The suitable groundwater depth for shrub growth was 3–5 m and 1–3 m for grass growth [26]. Qi et al. considered the sum of the thickness of the vegetation root layer and the height of the capillary rise of different soils as the ecological threshold of groundwater in western Jilin province. The reasonable threshold value of suitable growth of various vegetation crops was 3.76~5.66 m [27]. Soil salinization is also closely related to the groundwater depth. The salt dissolved in phreatic water is brought to the soil surface and accumulated mainly through phreatic evaporation. In northwest China, based on the research investigation and remote sensing inversion, it is considered that the groundwater depth to prevent soil salinization should be controlled above 2.0–3.0 m [28,29,30]. In Uzbekistan, some scholars believed that salinization can be effectively controlled if the groundwater depth is greater than 1.5 m [31]. The groundwater depth of natural wetland is of great significance to maintain the stability of the wetland ecosystem. For example, the temporal variation of wetlands in the lower reaches of the Tarim River from 2000 to 2018 was analyzed based on the long time series remote sensing data at the monthly scale. The study showed that the key groundwater depth for the sustainable and stable growth of wetlands was 3.5–5.0 m [32]. Groundwater depth is deeply influenced by natural factors (climate change, topography, soil, etc.) [33,34] and human-made factors (change in underlying surface conditions, irrigation, groundwater exploitation, etc.) [35,36], and the ecological groundwater level in different areas has significant difference. Therefore, the reasonable threshold of groundwater depth at the regional scale is usually determined by regional hydrogeological characteristics, vegetation ecology, soil salinization, agricultural production, and so on [37,38].
Research methods and examples of GEF in arid areas: groundwater contributes to the maintenance of the functioning of ecosystems [39]. In the face of the above challenge, scientific mapping of GEF at the watershed scale has been given more and more attention in many countries. It is pivotal to understanding the interaction between groundwater and ecosystem as well as rational allocation of regional water resources [40]. The mapping of GEF can be achieved through ecosystem fieldwork [41], and remote sensing data are necessary and feasible for studying GEF in regions. The identification methods based on remote sensing include supervised classification [42], unsupervised classification [43], index classification [44], and standardized NDVI classification [45,46]. For example, Australia carried out catchment-scale mapping research on groundwater-dependent ecosystems to provide a scientific basis for natural resource management in 2015 [47]. Jeanette Howard et al. illuminated the connection between groundwater and surface ecosystems by identifying and mapping the distribution of groundwater-dependent ecosystems (GDEs) in California [48]. Cruz et al. identified the GEF in the Azores volcanic islands, dividing the ecosystem’s dependence on groundwater into five levels: not applicable, very low, low, moderate, and high [39]. By using the analytic hierarchy process (AHP), Huang et al. established an index system for evaluating the GEF in the Golmud Plain area and evaluated the present situation of GEF [49]. From 2017 to 2021, the research team of the authors carried out the project “Groundwater Development and Utilization and Ecological Function Protection of Special Geomorphic Areas in Western China”. The research team inherited and developed the technical system of groundwater function evaluation and mapping the suitability for arid and semi-arid regions [50,51]. It provides scientific support for local government departments to carry out targeted and rational management of groundwater through scientific mapping of different groundwater functional areas.
Literature summary and research purpose of the paper: in view of different types of ecosystems, the predecessors have studied and put forward the suitable ecological water level of groundwater. According to the dependence of different ecosystems on groundwater, the mapping and current situation evaluation of GEF were carried out. These research results are of great help and support to ecological protection and groundwater management. However, with the dynamic change in groundwater depth, how the state of each ecological factor gradually degenerates or even deteriorates is still a problem that needs to be further studied. Moreover, the previous studies on the GEF are limited to the current status and lack of a prediction of the future dynamic trend. What is more, the state of GEF is not invariable, but changes with the dynamics of groundwater depth. Once the groundwater depth is greater than the ecological water level, the ecological function of groundwater degrades. In addition, the “suitable ecological water level” of a natural vegetation reserve, natural wetland reserve, and farmland reserve is different. When the groundwater depth increases gradually, the degree of degeneration of GEF in different regions is also different. Therefore, in order to realize the sustainable utilization of groundwater and the protection of ecological environment, it is needed not only to study the state of the GEF and the degree of degeneration but also to predict its future dynamics, so as to put forward the crisis classification warning index suitable for different regions of GEF and formulate the corresponding countermeasures. It is necessary for groundwater management and ecological protection planning.
2. Materials and Methods
2.1. Study Area
In the northwest inland basin, from the upper reaches to the lower reaches, not only the topography, meteorology, hydrology and water resources, but also the natural ecological conditions, population, and economic and industrial conditions all show distinct zonation. The upper reaches is the water source area, the middle reaches is the main development and utilization area of water resources and groundwater, and the lower reaches is the main area of serious water shortage, ecological fragility, and degradation. The groundwater resources in the middle and lower reaches of the basin are mainly derived from the surface water of the mountains in the upper reaches, and are replenished by river seepage, the canal system, and field infiltration. Although the groundwater depth is deeply influenced by natural factors (climate change, topography, and soil) and human factors (change in underlying surface conditions, irrigation, and groundwater exploitation), human factors play an absolutely dominant role. Due to the scarce precipitation and high evaporation, the precipitation has little significance on groundwater recharge. Therefore, the shortage of natural water resources and groundwater supply in the inland areas of northwest China, coupled with the continuous development of the population and economy, have led to a series of ecological and environmental problems, in which the Shiyang River basin is a typical and representative basin with the most serious overutilization of water resources and groundwater and the most intense impact of human activities.
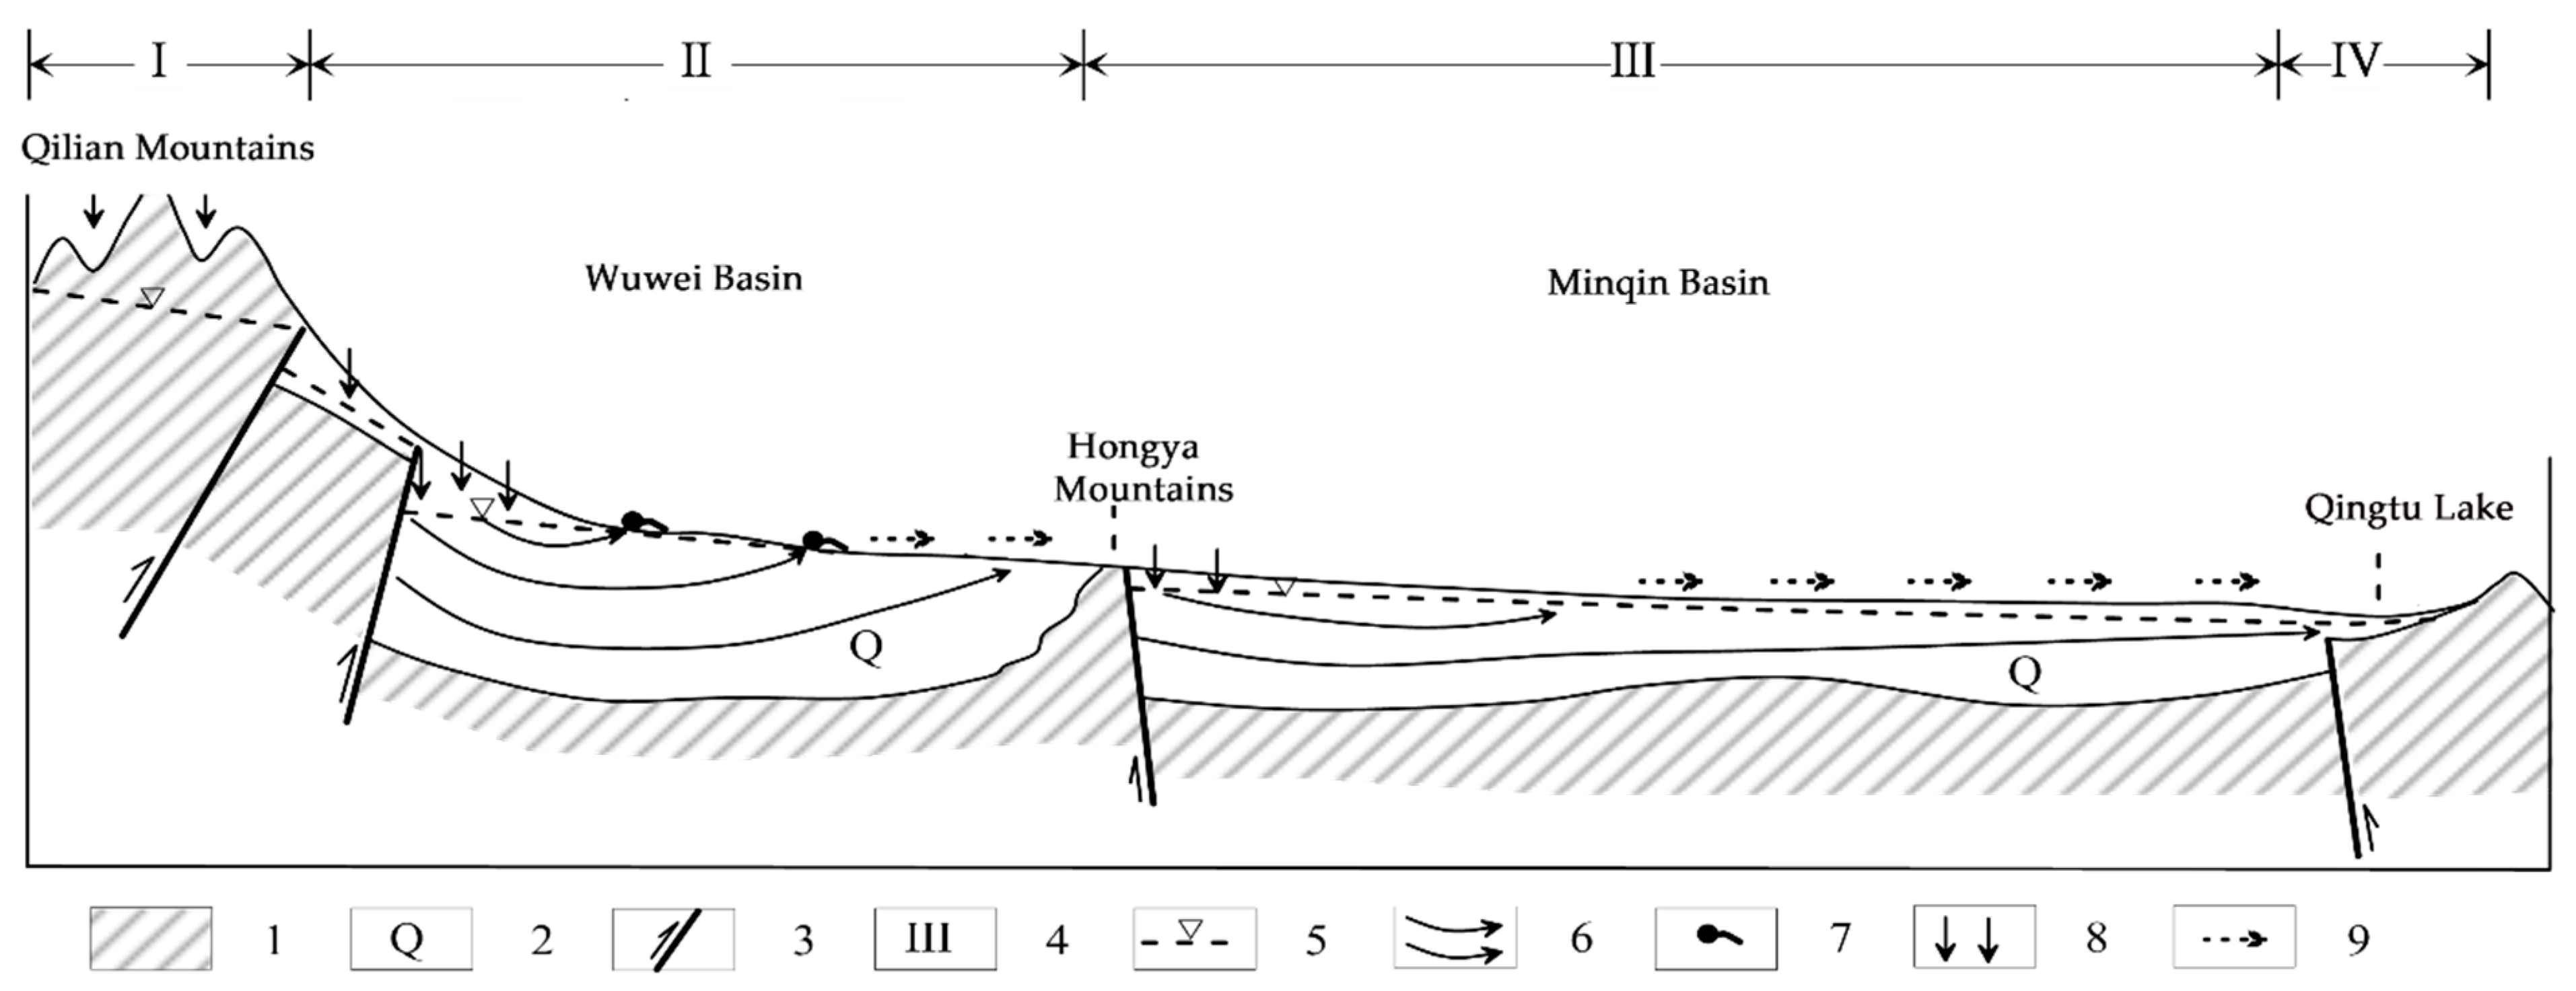
Shiyang River basin is in the east of Hexi Corridor of Gansu province (101°06′–104°04′ E, 37°10′–39°24′ N), the watershed area of which is 41,600 km2, and belongs to a typical continental temperate arid climate [52]. The topography of the basin is high in the south and low in the north, and the bedrock is mainly sandstone. Controlled by geological faults, several relatively independent water resource systems are formed in the basin: Qilian Mountains, Wuwei Basin, Minqin Basin, and Qingtu Lake (Figure 1). The quaternary strata in the basin are the main aquifer, and the lithology is mainly alluvial–diluvial sediments. The thickness of the quaternary in the Wuwei Basin reaches from 470 m in the south to 100 m in the north, and the thickness of the quaternary system in the Minqin Basin gradually changes from about 400 m to less than 200 m from south to north.
Under natural conditions, the upper, middle, and lower reaches of the basin have different GEFs because of the obvious vertical climate characteristics in the basin [53]: (1) The upper reaches of the basin is the Qilian Mountains, where the climate belongs to the alpine semi-arid and humid region, with an annual average precipitation of 361 mm. This area is the source of water resources in the basin, and the GEF is mainly soil and water conservation and river base flow maintenance; the human activities in this area have little influence, and the ecological environment is in the natural characteristics; (2) the middle reaches of the basin is Wuwei sub-basin, where the climate belongs to the arid plain, with an annual average precipitation of 166 mm. The water resources mainly come from the surface runoff of the upper Qilian Mountains. The Wuwei sub-basin can be further divided into the piedmont inclined alluvial–diluvial fan area and fine soil plain area according to the groundwater depth. The dominant function of groundwater in piedmont alluvial–diluvial fan is water resource function, while in the fine soil plain, the GEF is strong and mainly manifested as maintenance of surface vegetation, farmland quality, and ecological base flow in the downstream area; the human activities have the strongest influence in this area, and the ecological environment is dominated by artificial oases such as irrigated farmland; (3) the lower reaches of the basin is the Minqin sub-basin and desert, where the climate belongs to warm arid areas, with an annual average precipitation of 113 mm. This area is a severe water shortage area, with almost no surface runoff, and water resources mainly depend on water supply from the middle and upper rivers. The GEF is strong, and mainly manifested as maintenance of natural oases and artificial oases; (4) Qingtu Lake is the tail lake of Shiyang River, located at the end of the basin, with an annual precipitation of less than 100 mm and groundwater depth of 1–3 m. It has strong GEF and is mainly manifested as the maintenance of surface vegetation and wetland. The natural water resources in the area are extremely poor, and the natural ecology is extremely fragile. Artificial water conveyance is still needed to maintain the ecological stability.
2.2. Materials and Methods
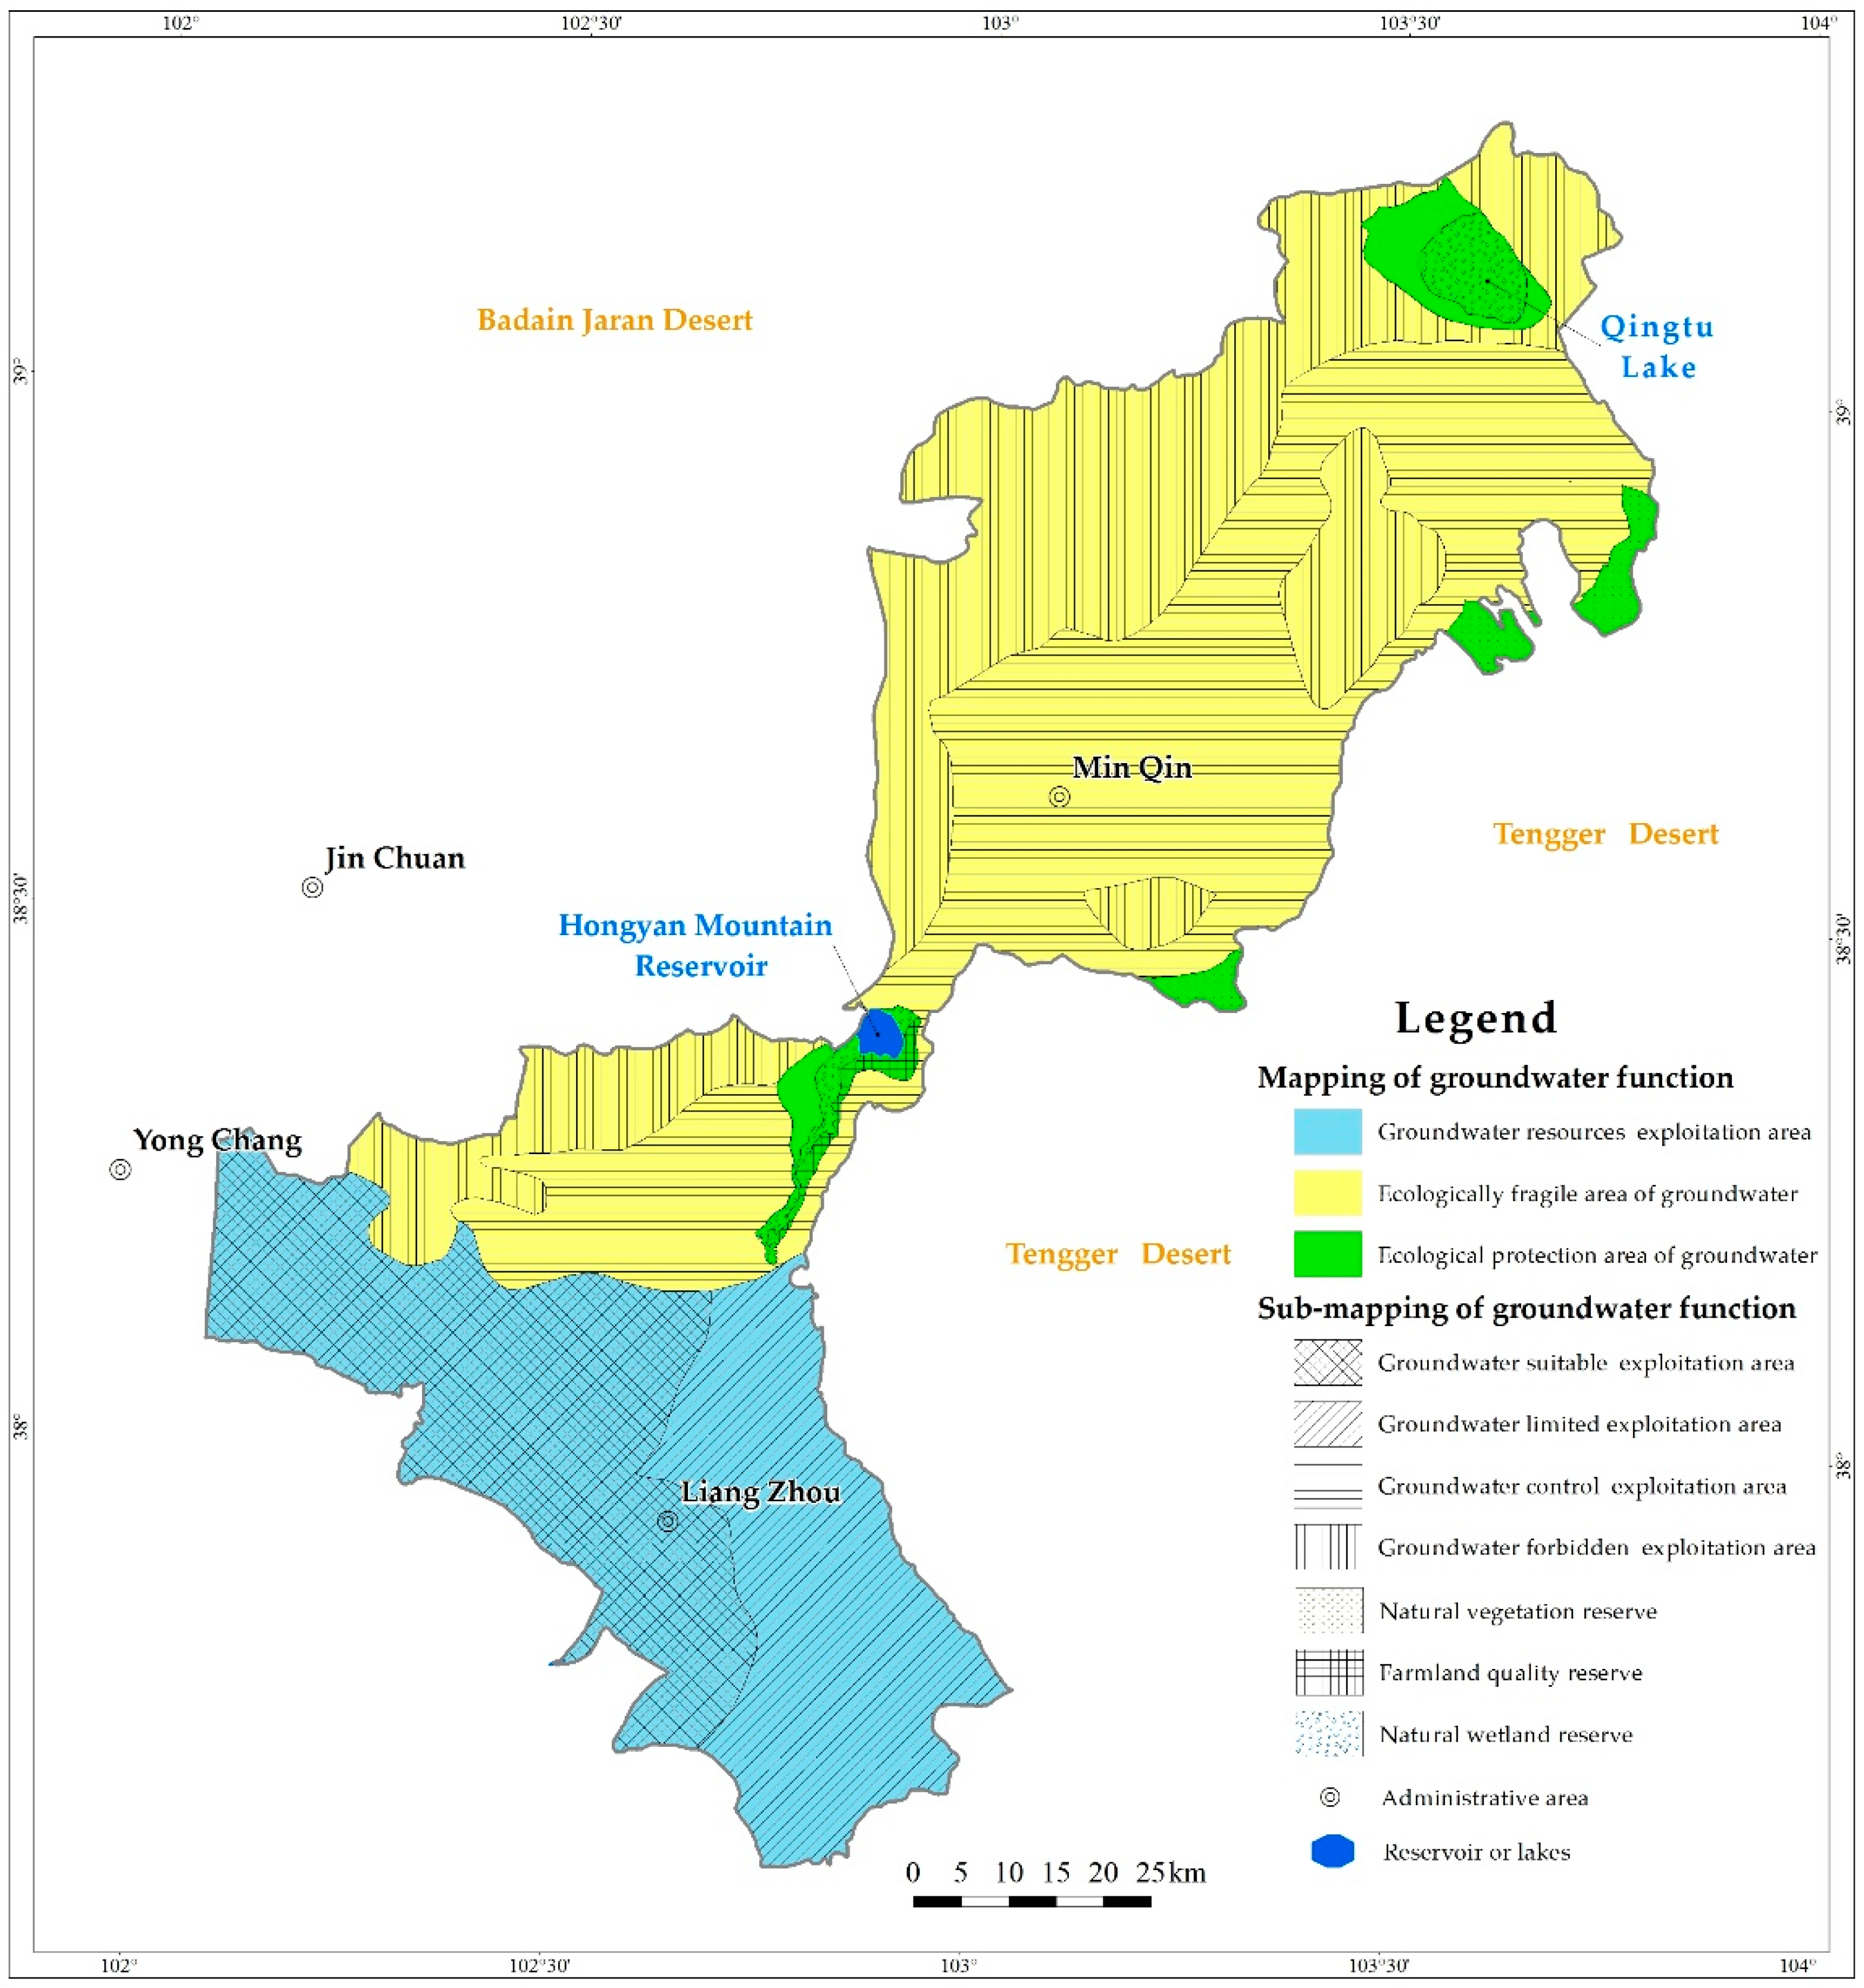
Based on the evaluation and mapping of groundwater function in the Shiyang River basin [51], natural wetland reserve, natural vegetation reserve, and farmland quality reserve were selected as the main research areas (Figure 2) to carry out a field ecological vegetation–groundwater–soil comprehensive investigation and in situ groundwater monitoring. Combined with previous research results, remote sensing interpretation technology and ArcGIS 10.3 platform were used to analyze the relationship between typical ecological factors and groundwater in each reserve, to explore the response characteristics of different ecological factors with the change in groundwater depth, reveal the process of GEF degeneration from good to catastrophic degeneration so as to develop indexes of GEF crisis classification and early warning in different ecological reserves in northwest China. The descriptions of data including the monitoring duration, periods, and types of parameters are listed in Table 1.
2.2.1. Field Surveys
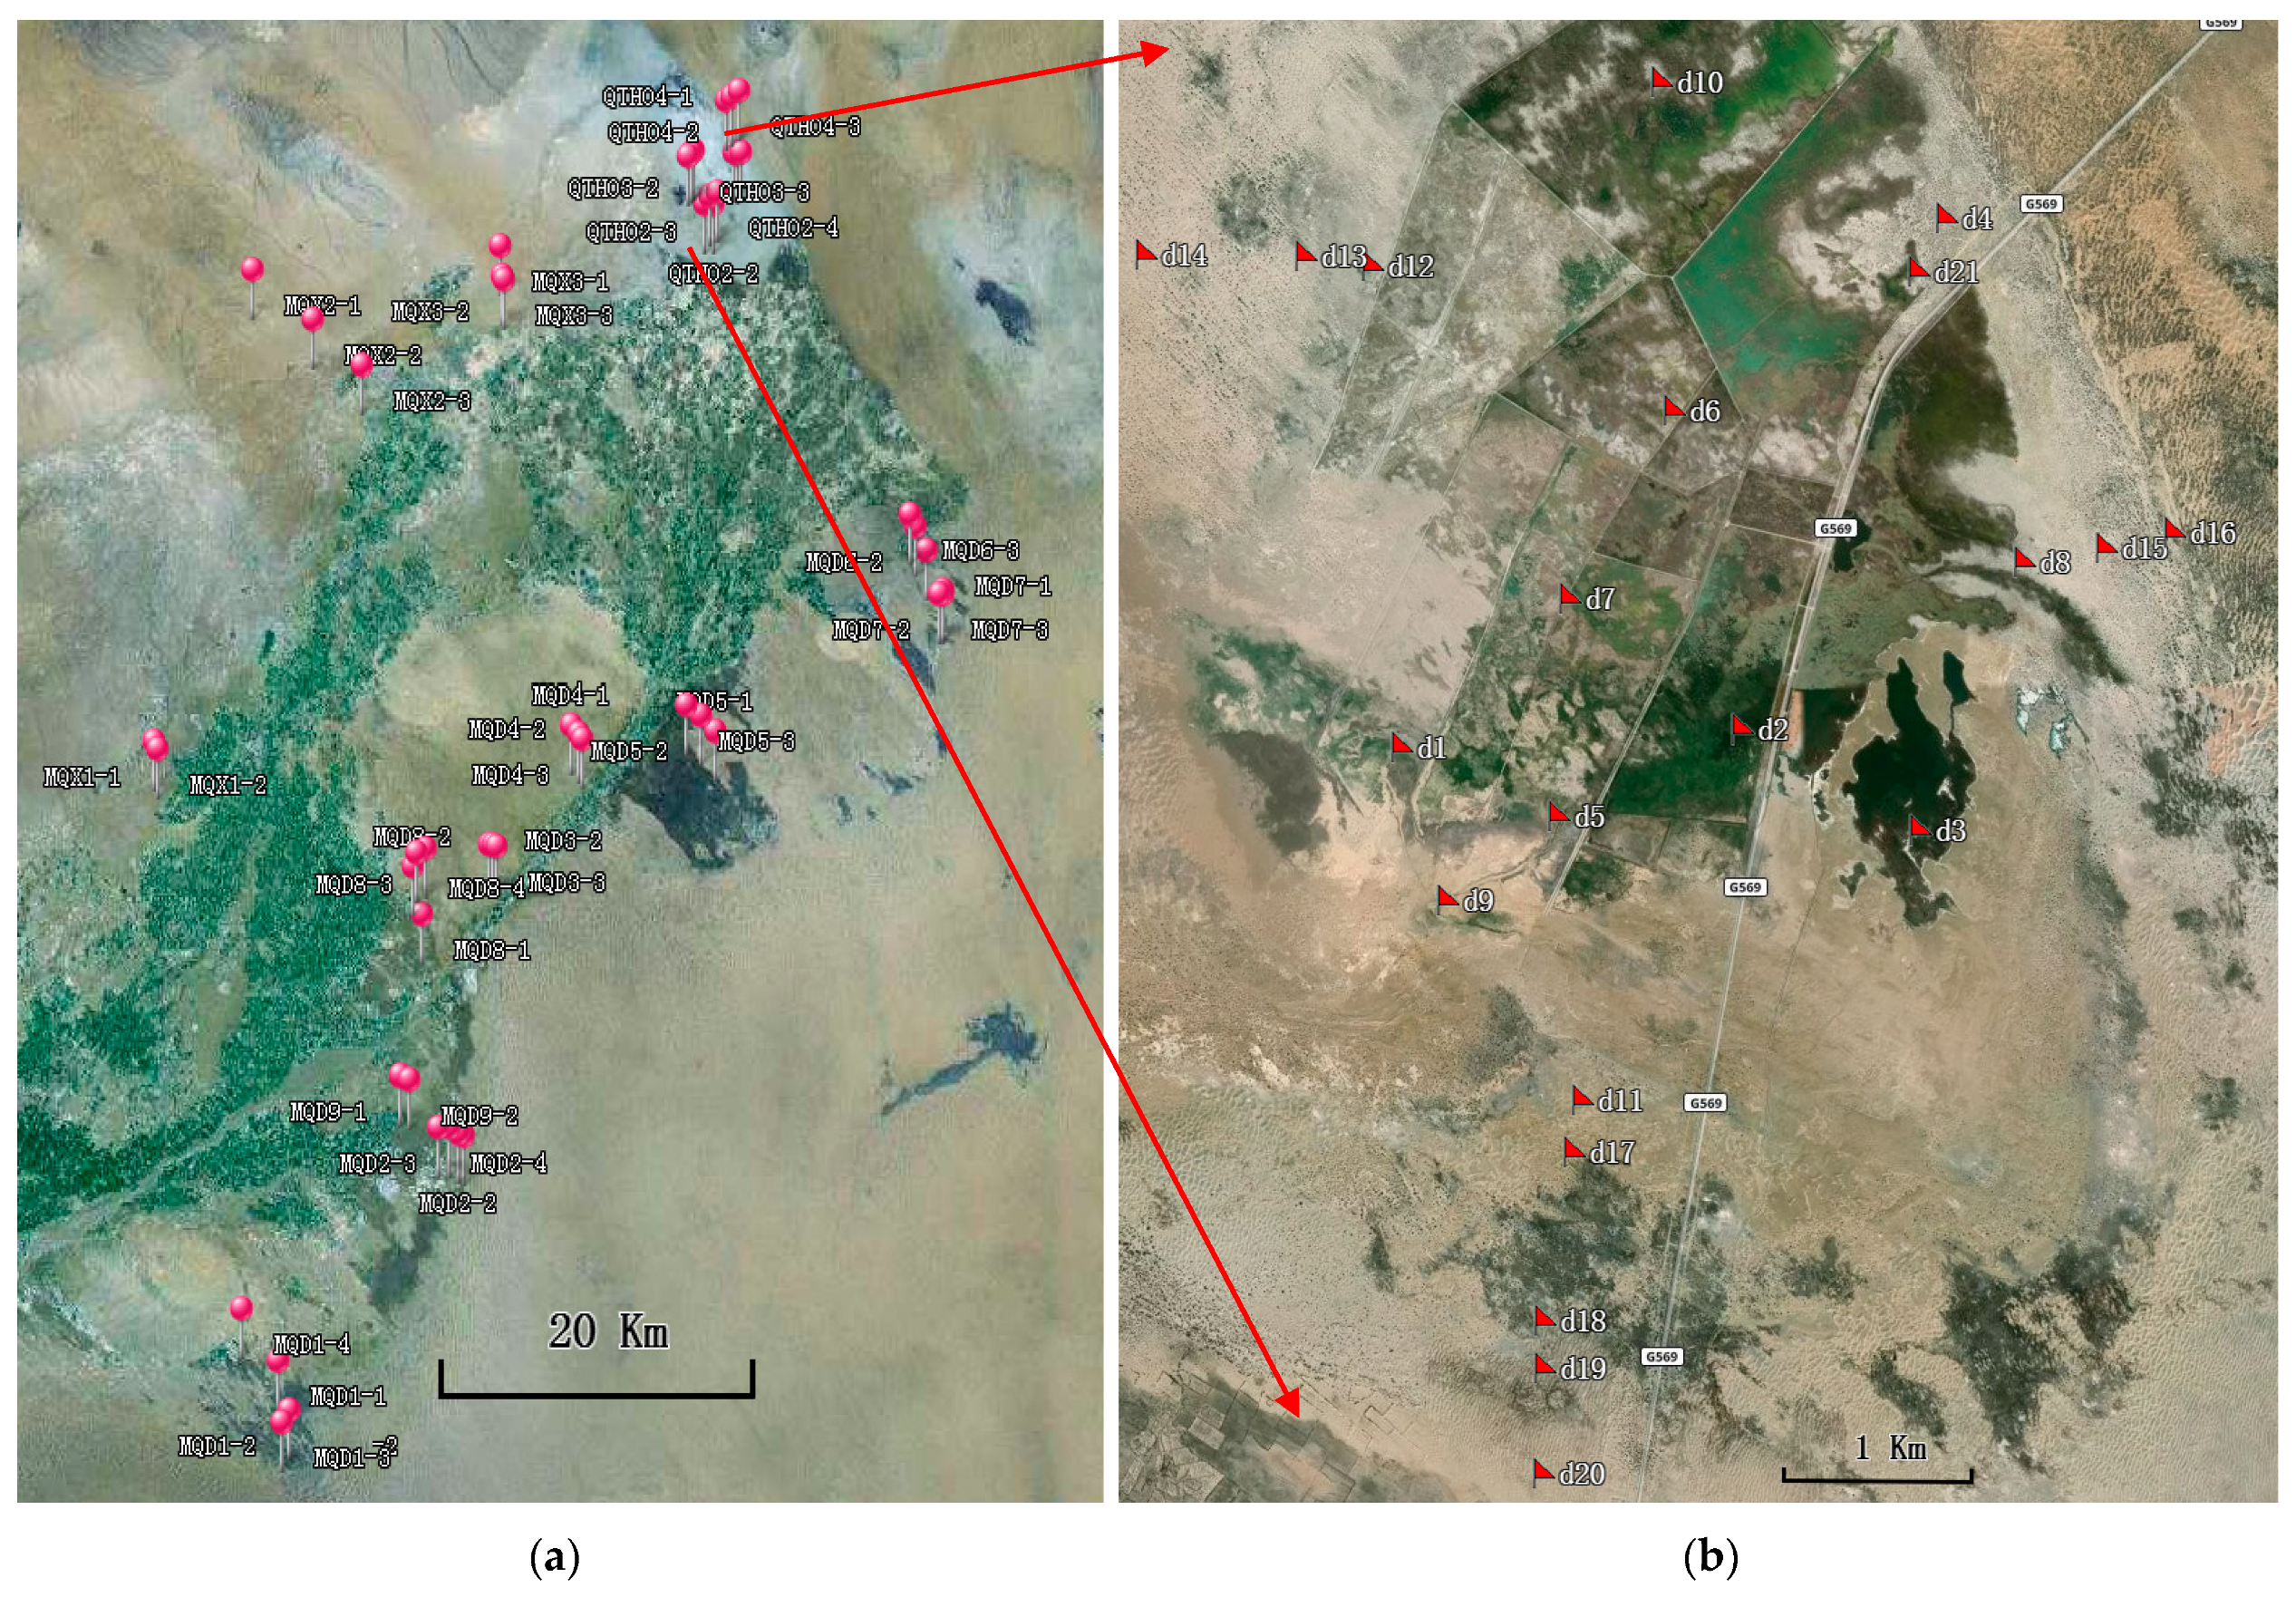
The field ecological vegetation–groundwater–soil comprehensive investigation was carried out in the Minqin Oasis and Qingtu Lake area in August 2018 and August 2019 which is the best season for natural vegetation (Figure 3a). There were 50 investigation points in the area, and the groundwater depth, ecological status of surrounding natural vegetation, and soil salt content within 1 m depth were studied in detail. At the same time, a total of 21 in situ groundwater monitoring sites (Figure 3b) were set up in and around the Qingtu Lake wetland, which is in the lower reaches of the Shiyang River, to monitor the annual variation of groundwater depth in the lake area. The groundwater monitoring period was from August 2018 to December 2019 at a frequency of 30 min using the groundwater level meter (Levelogger 5 LTC) that is made by solinst in Toronto, Canada. In addition, the response characteristics of the water area of Qingtu Lake wetland to the dynamic change of groundwater depth were determined by remote sensing interpretation in 2018 and 2019 during the period of artificial conveyance from August to September.
Qingtu Lake wetland is a seasonal water area, which needs artificial water conveyance to maintain a certain water area after agricultural irrigation in August every year. The wetland water area gradually increases with the artificial water conveyance, and gradually decreases with the influence of leakage and evaporation after the water conveyance, so there are only a few areas that can maintain water throughout the year. Since the monitoring points in the central area of the wetland are inundated by seasonal lake water, the monitoring point (d11) was selected to establish the correlation between the wetland water area and groundwater depth during the water conveyance period (September–October) (Figure 3b), which is about 1 km away from the south of the wetland.
2.2.2. The NDVI
The NDVI is the most widely used vegetation index and has become the best remote sensing index for monitoring vegetation coverage and growth [54,55]. Its value ranges from ࡀ1 to 1. A negative value indicates that the ground object has high reflection characteristics in the visible light band, and is often associated with cloud, water, snow, etc.; a value of 0 tends to represent rock or bare soil; a positive value represents different degrees of vegetation coverage, and the larger the value, the higher the vegetation coverage. Remote sensing data were collected from Landsat satellite data during 2000–2017, with a temporal resolution of 16 days and a spatial resolution of 30 m. Based on the annual mean value of NDVI calculated by 30 m spatial resolution Landsat satellite data [56] and long-term observation data of groundwater depth in the Minqin Basin that were collected from 2000 to 2017, the relationship curve between groundwater depth and NDVI value was established to determine the index of GEF degeneration classification and early warning in the natural vegetation oasis area.
3. Results
3.1. Index of GEF Crisis Classification and Early Warning in Natural Wetland
3.1.1. Relationship between Wetland Water Area and Groundwater Depth
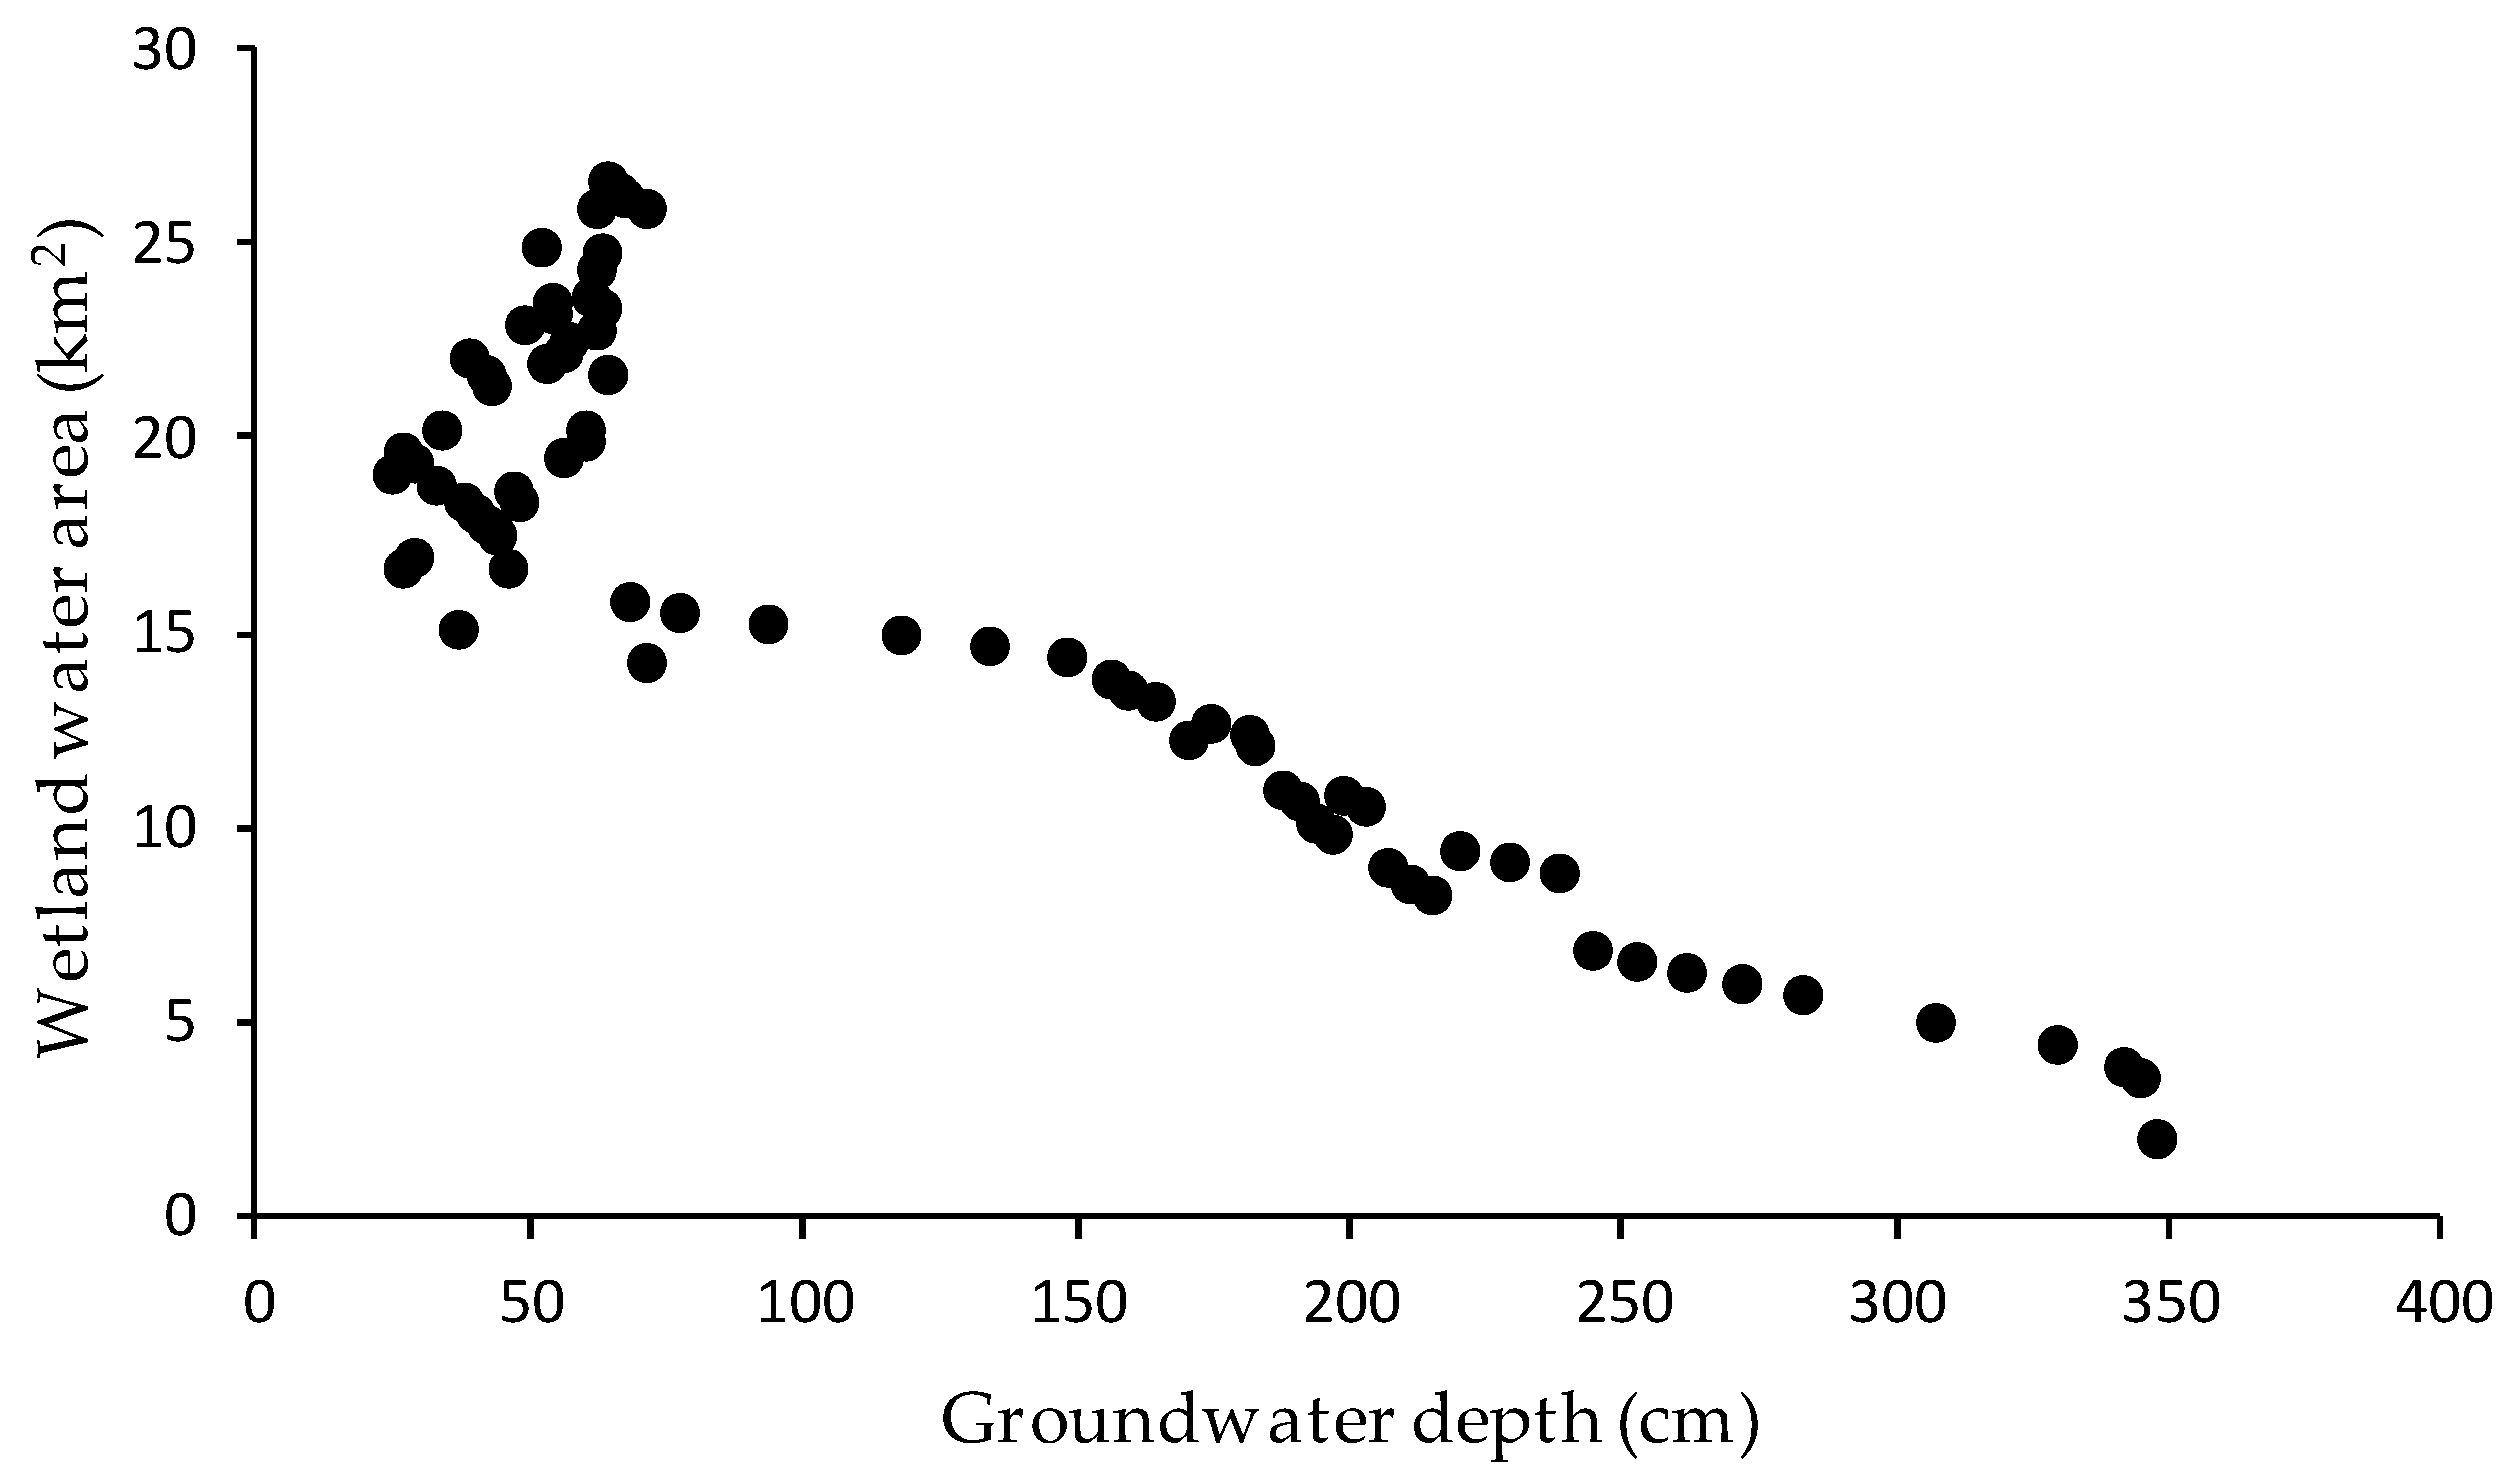
As can be seen from Figure 4, the wetland water area was closely related to groundwater depth. When the groundwater depth was more than 3.0 m, the wetland water area was the smallest in the whole water conveyance period, which was less than 5 km2; when the groundwater depth was 1.5–3.0 m, the wetland water area increased gradually from 5 km2 to 15 km2 with the rise in groundwater depth; when the groundwater depth was 0.5–1.5 m, the wetland water area could be maintained at about 15 km2; when the groundwater depth was less than 0.5 m, the wetland water area could be maintained at a large level of 25–35 km2. Therefore, 1.5 m can be used as the key groundwater depth threshold of “suitable ecological water level” for the wetland area. When groundwater depth is less than 1.5 m, it can maintain the wet water area which does not continue to decrease, and ensure the ecological safety of the wetland.
3.1.2. Correlation between Vegetation Diversity and Groundwater Depth
Artificial water conveyance starts in August every year, which is the lowest water level period of the Qingtu Lake wetland, with the smallest lake area and the largest groundwater depth at each monitoring point. The relationship between vegetation diversity and groundwater depth was studied by ecological sample investigation in the wetland. In the area where the groundwater depth was less than 0.5 m, the topography was low, and the topsoil was almost saturated. The area is a seasonal lake, which forms a lake quickly when the water is transported artificially, and then it gradually dries up or retains only a few water surfaces along with leakage and evaporation. The dominant vegetation around is Phragmites australis. In the area with a groundwater depth of 0.5–1.5 m, most of the area is submerged after artificial water conveyance, and the dominant vegetation in this area is also Phragmites australis. In the area with a groundwater depth of 1.5–3.0 m, only a small part of the area is submerged after artificial water conveyance. There are abundant species in this area, such as Nitraria sibirica, Tamarix ramosissima, Lycium barbarum, Phragmites australis, Goose down vine, etc., and the dominant species is shrub. The area with a groundwater depth of 3.0–8.0 m belongs to the periphery of the wetland, and the vegetation type is mainly cultivated Haloxylon ammodendron. The area with a groundwater depth greater than 8.0 m is the desert area, where the vegetation is dominated by Nitraria sibirica. It is about 4 km away from the center of the lake area, and the groundwater dynamic changes are basically not affected by the wetland. Therefore, 8.0 m can be used as the key groundwater depth threshold of “limit ecological water level” for wetland area degradation into a desert.
3.1.3. Early Warning Index System and Countermeasures
The natural wetland is closely related to the groundwater depth. According to the relationship between groundwater depth and the wetland area, as well as that between groundwater depth and vegetation growth, it not only determines the suitable ecological water level but also analyzes the response of the natural wetland area to the gradual decrease in groundwater depth. When groundwater depth was less than 0.5 m, the GEF in the natural wetland reserve was in a good state, and wetland water had the maximum area. When groundwater depth was in the range of 0.5–1.5 m, the GEF situation was in a normal state, and groundwater could basically maintain a stable wetland water area. When the groundwater depth was in the range of 1.5–3.0 m, the GEF of the nature wetland reserve was in a gradual degeneration state, and the groundwater could not maintain a stable wetland water area. With the increase in groundwater depth, the wetland water area gradually declined, and the vegetation communities began to change from a single reed community to multiple vegetation species. When groundwater depth was in the range of 3.0–8.0 m, the GEF in the nature wetland reserve was in a serious degeneration, and the wetland water was basically dried up, and as a result, cultivated Haloxylon ammoderma is needed to ensure ecological security and prevent further ecological degradation. When groundwater depth was greater than 8.0 m, the GEF in the nature wetland reserve was in a catastrophic degeneration state, and the land desertification occurred. Therefore, the GEF of nature wetland reserve in the lower reaches of northwest China can be divided into five levels of warning based on the above analysis: good, normal, gradual degeneration, serious degeneration, and catastrophic degeneration, as shown in Table 2. In each level of early warning state, different “conclusions of early warning” and “countermeasures and suggestions” were formulated according to the dynamic trend of the groundwater level. Among them, the decline in groundwater level corresponds to “general change”, “negative change”, and “worse change”, while the rise of groundwater level corresponds to “positive change”.
3.2. Index of GEF Crisis Classification and Early Warning in Natural Vegetation Area
3.2.1. Relationship between Vegetation NDVI and Groundwater Depth
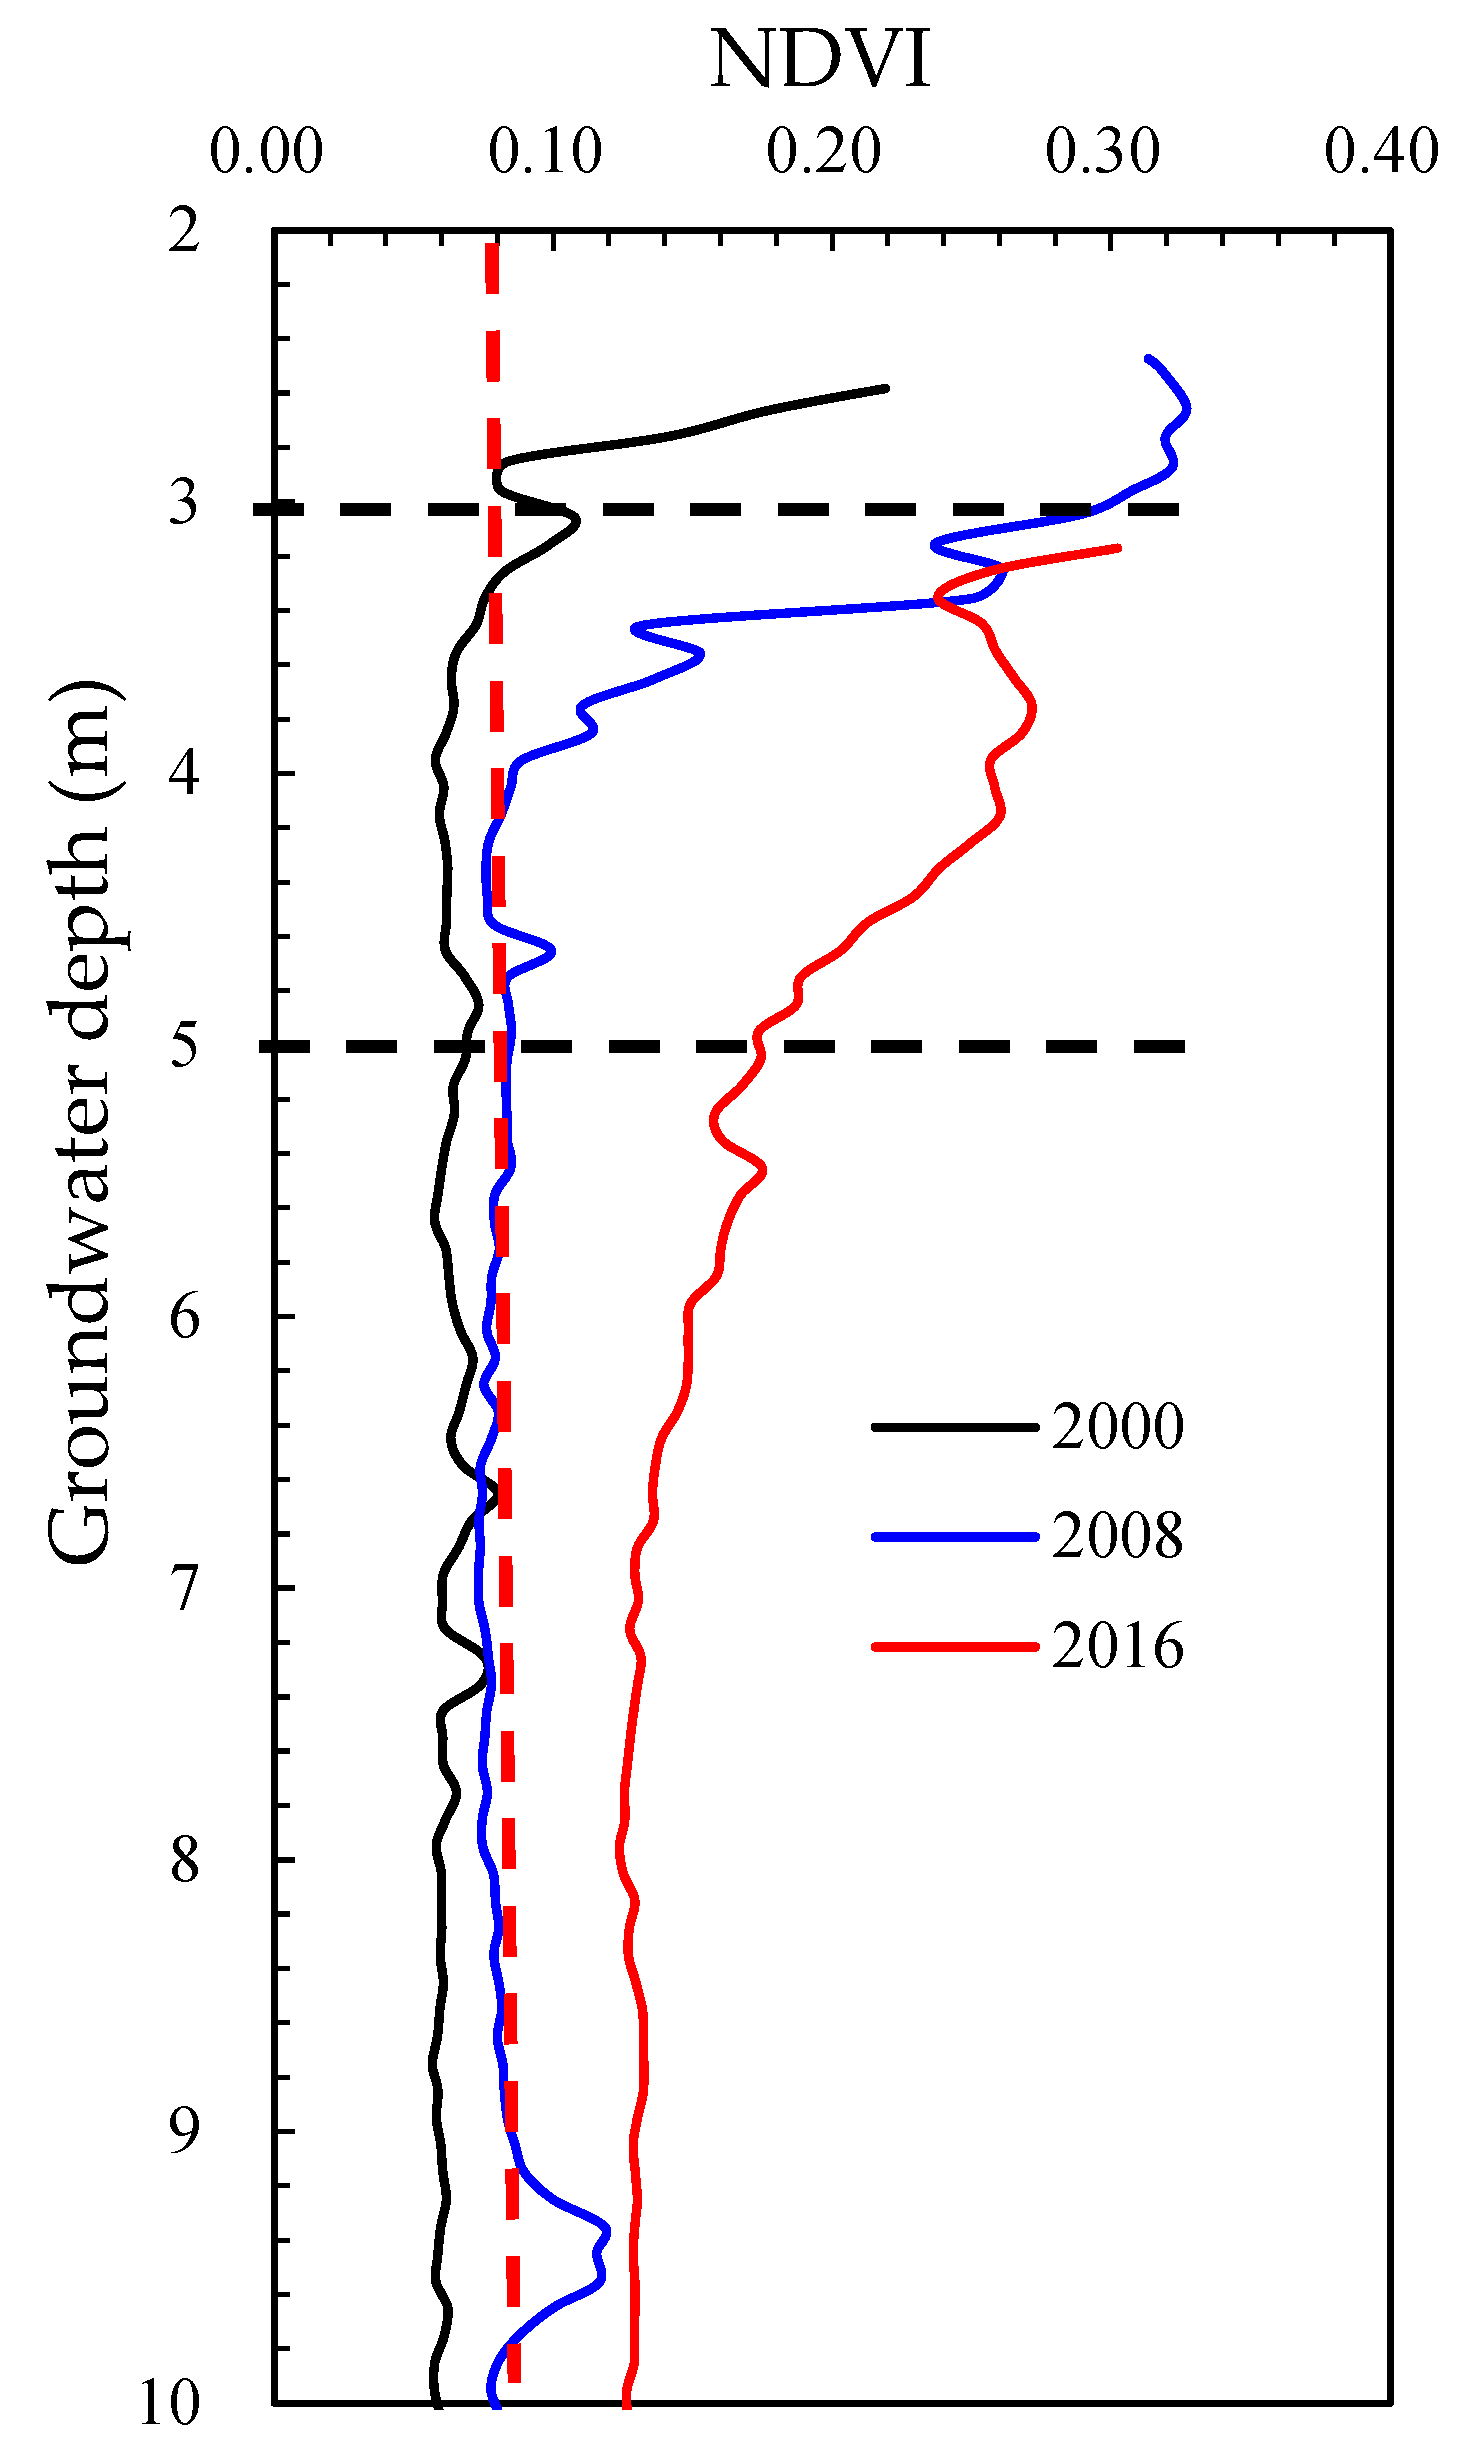
Jin’s research showed that vegetation is considered to develop when the NDVI is greater than 0.08 in the arid areas of northwest China [57]. It can be seen from Figure 5 that the NDVI is negatively correlated with the groundwater depth, and the NDVI gradually decreases with the increase in groundwater depth in the range of 1–5 m. According to the correlation curves between the NDVI and groundwater depth in 2000, 2008, and 2016, the following characteristics could be obtained: when groundwater depth was less than 3.0 m, the NDVI decreased rapidly with the increase in groundwater depth, indicating that it is most suitable for the growth of land surface vegetation which strongly depends on groundwater for survival; when groundwater depth was between 3.0 m and 5.0 m, the NDVI decreased slowly with the increase in groundwater depth, indicating that it can still provide water for parts of land surface vegetation; when groundwater depth was greater than 5.0 m, the NDVI was basically unrelated to groundwater depth. With the increase in groundwater depth, the NDVI was always limited in the range of 0.06–0.18. In this case, the vegetation was degraded and could only survive by precipitation or human irrigation. Therefore, in natural conditions, 3.0 m can be as the key threshold of groundwater depth that is most suitable for the growth of land surface vegetation, while 5.0 m can be as the key threshold of groundwater depth at which most vegetation growth is inhibited and begins to degenerate.
3.2.2. Relationship between Natural Vegetation Growth and Groundwater Depth
Based on the investigation of vegetation, groundwater, and soil in the Shiyang River basin, it was found that the main natural plant species include Elaeagnus angustifolia, Tamarix chinensis, Haloxylon ammoderma, Caragana Korshinskii Kom, Reaumuria songarica, Hedysarum scoparium, Nitraria sibirica, Kalidium foliatum, and Phragmites australis. Kalidium foliatum and Phragmites australis were mainly distributed in wetland areas, in which the groundwater depth is generally in the range of 0–2.0 m; Tamarix chinensis and Phragmites australis were generally distributed in the riparian zone, in which the groundwater depth is generally from 1.0 m to 3.0 m; Elaeagnus angustifolia and Caragana Korshinskii Kom were generally distributed far from the riparian zone, in which the groundwater depth is generally from 3.0 m to 5.0 m; the groundwater depth in the oasis and desert transition zone was 3.0–7.0 m, and the distribution of Reaumuria songarica was mainly near the oasis area, while the distribution of Nitraria sibirica and Haloxylon ammoderma were mainly near the desert area; when groundwater depth was greater than 7.0 m, the relationship between surface vegetation distribution and groundwater depth was not obvious, and there were only Nitraria sibirica and Haloxylon ammoderma left; when groundwater depth was greater than 10.0 m, the land surface was mostly desertification, and generally, there were only herbaceous plants maintained by precipitation or Nitraria sibirica with little dependence on groundwater (Table 3).
3.2.3. Early Warning Index System and Countermeasures
Based on the above analysis, establishing the relationship between groundwater depth and NDVI, as well as that between groundwater depth and vegetation growth, not only determines the suitable ecological water level but also analyzes the response of the natural vegetation area to the gradual decrease in groundwater depth. When groundwater depth was less than 3.0 m, the GEF in the natural vegetation area was in a good state, and the natural vegetation grew well; When groundwater depth was between 3.0 m and 5.0 m, the GEF in the natural vegetation area was in a normal state, and the vegetation species were abundant; when groundwater depth was between 5.0 m and 7.0 m, the GEF in the natural vegetation area was in a gradual degeneration state, and vegetation coverage decreased significantly; when groundwater depth was between 7.0 m and 10.0 m, the GEF in the natural vegetation area was in a serious degeneration state, the vegetation community changed, vegetation growth had no relation to groundwater, and the dominant species was replaced by xerophytic vegetation; when groundwater depth was greater than 10.0 m, the GEF in the natural vegetation area was in a catastrophic degeneration state, and desertification occurred in the natural vegetation area. Therefore, the GEF of the natural vegetation area in the lower reaches of northwest China can be divided into five levels of warning: good, normal, gradual degeneration, serious degeneration, and catastrophic degeneration, as shown in Table 4. In each level of early warning state, different “conclusions of early warning” and “countermeasures and suggestions” were formulated according to the dynamic trend of the groundwater level. Among them, the decline in groundwater level corresponds to “general change”, “negative change”, and “worse change”, while the rise of groundwater level corresponds to “positive change”.
3.3. Index of GEF Crisis Classification and Early Warning in Farmland Area
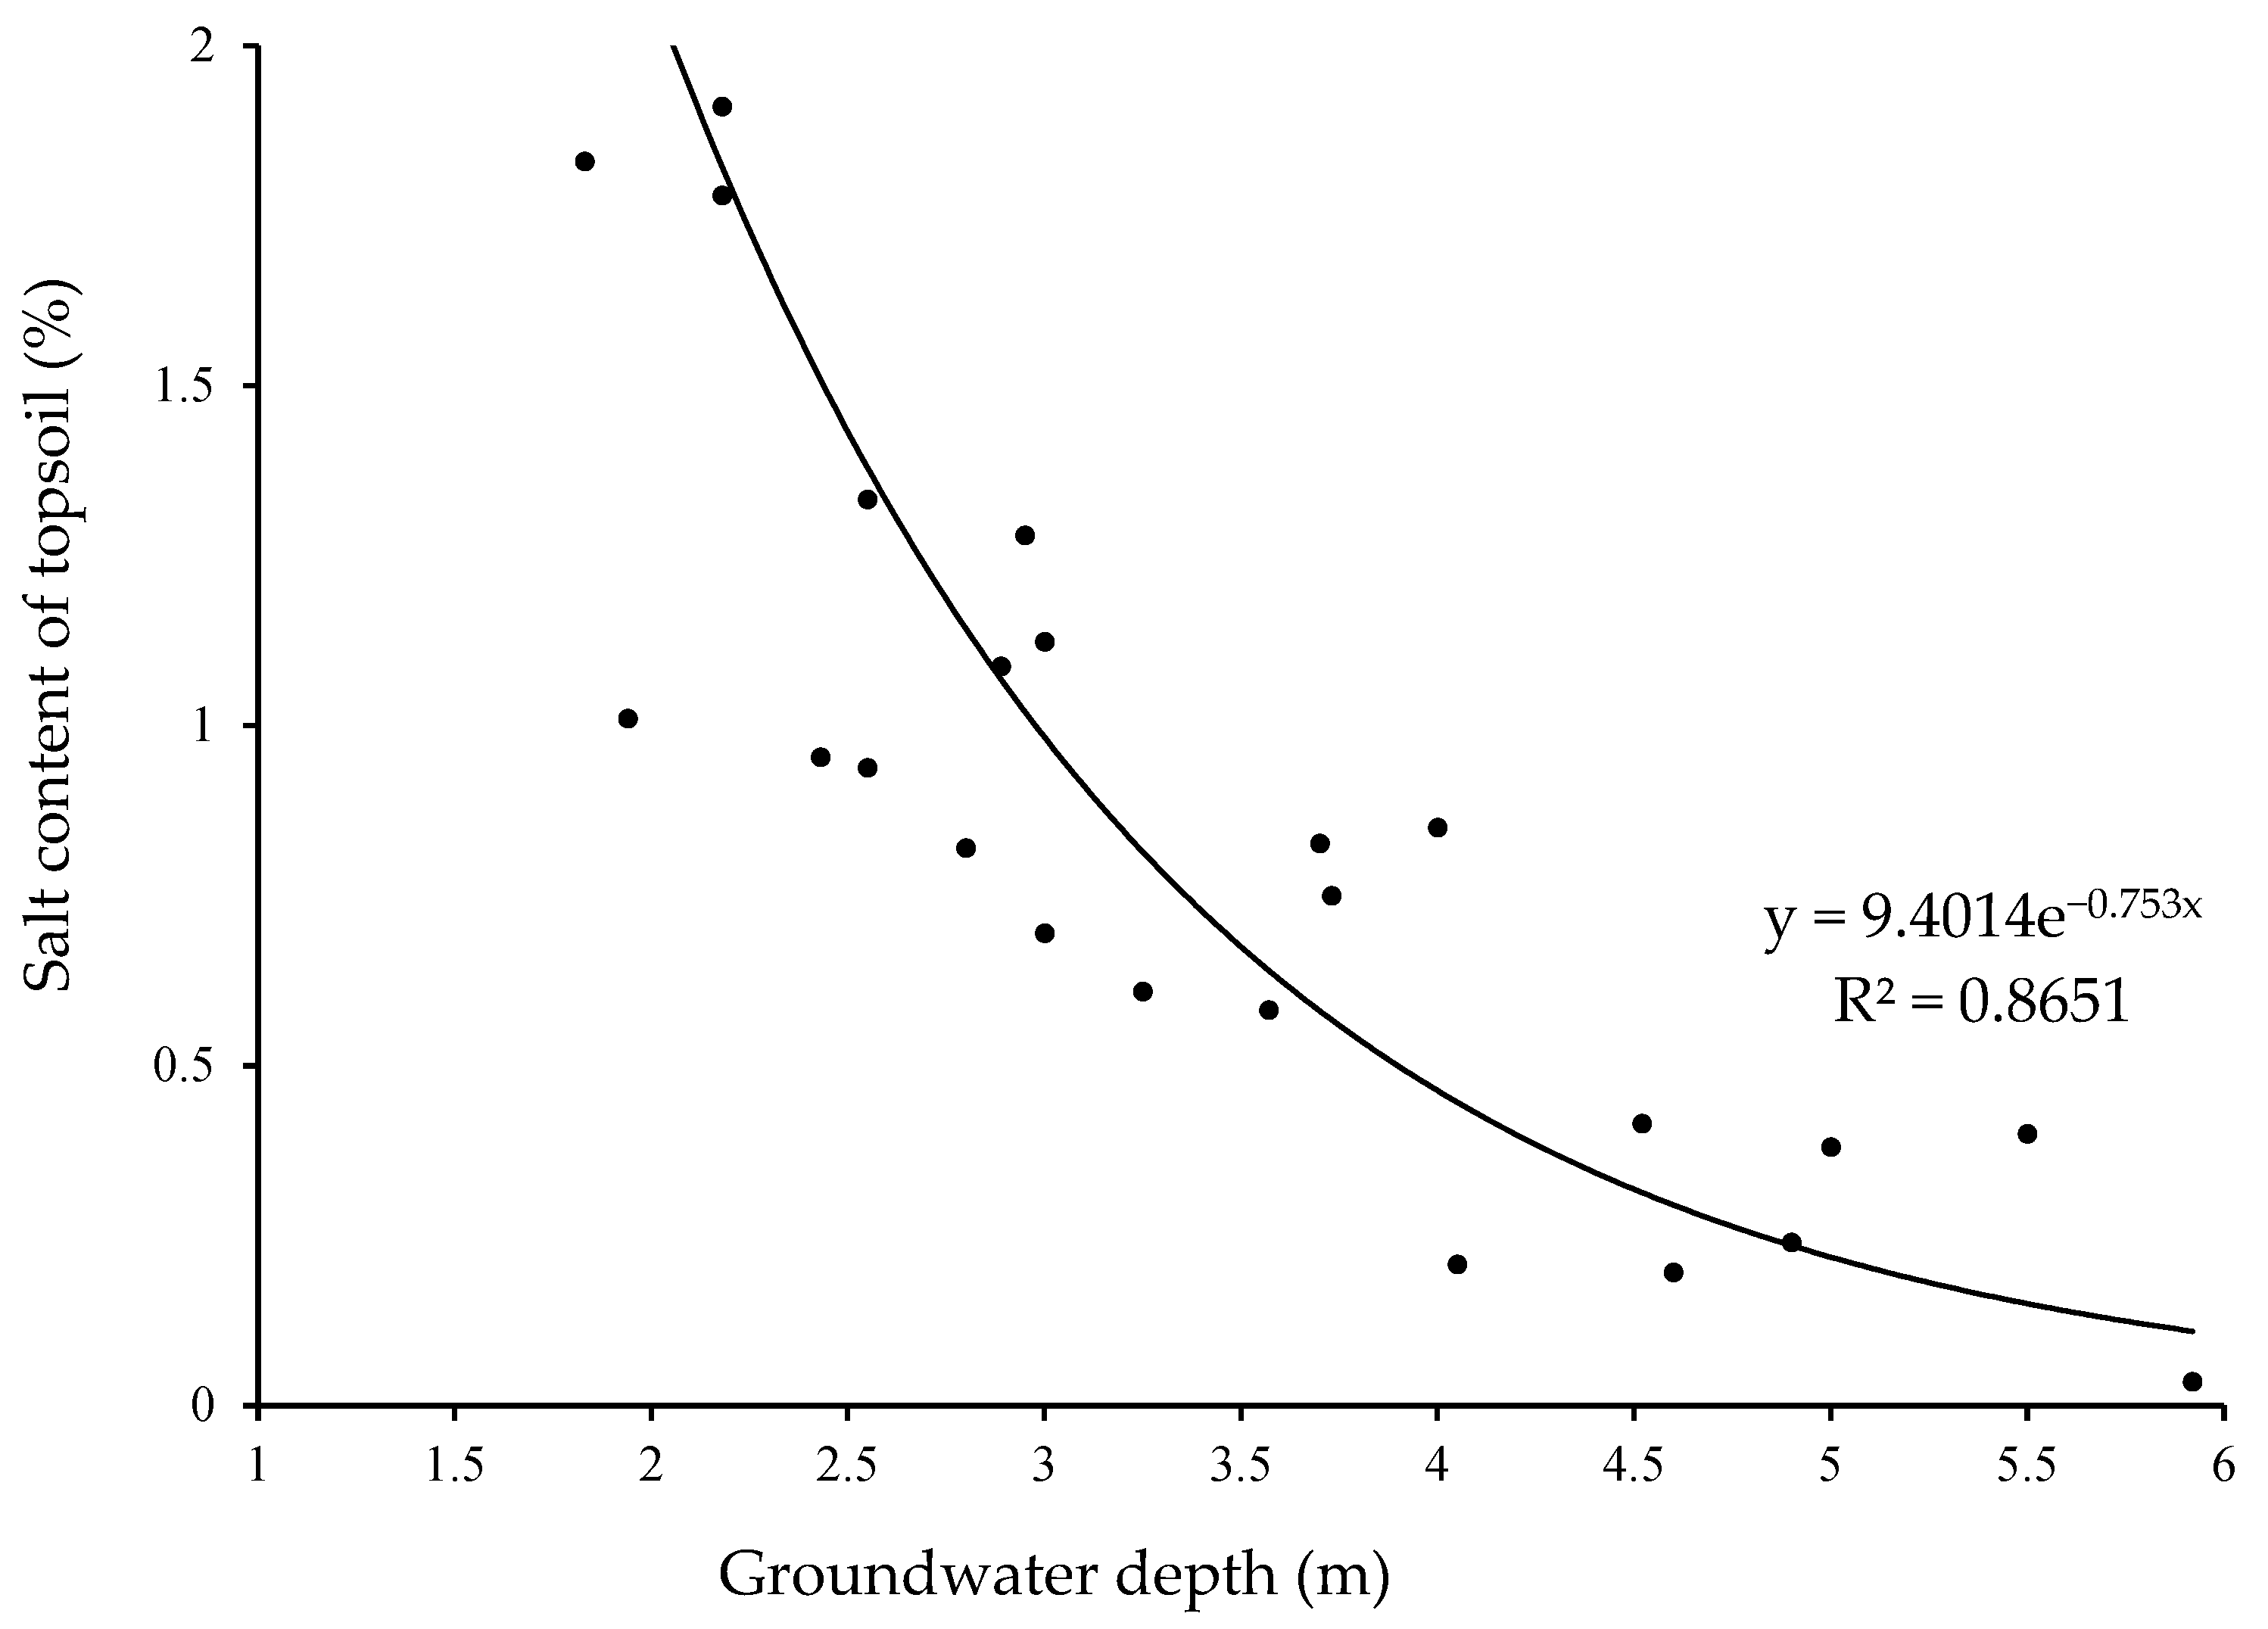
When the groundwater depth is too deep, the farmland mainly depends on artificial irrigation and has no relation to the groundwater. However, along with the natural wetland restoration process, the farmland around the natural wetland or with shallow groundwater depth in the lower reaches should be focused on the problem of soil salinization caused by the rise in groundwater level. In the classification index of soil salinization in China [59], the salinization degree is divided into five levels according to soil salt content (Table 5 and Figure 6). Studies have shown [60,61,62] that when the soil surface salt content reaches 0.3% of dry soil weight, salt-sensitive crops are slightly inhibited and their yields are affected. Once the soil salt content is greater than 2.0%, the growth of most crops is severely inhibited and crop yields are severely reduced. Based on the research of Wang et al. [50], the relationship between the groundwater depth and the total salt content of 0–20 cm surface soil was established. Thus, the corresponding groundwater depth could be deduced according to different salinization conditions of surface soil (Table 5). As can be seen from Figure 6, the shallower the groundwater depth was, the higher the salt content of surface soil was. On the contrary, the deeper groundwater depth was, the lower soil salt content was; when groundwater depth was greater than 5.0 m, farmland was not salinized, and once groundwater depth was less than 5.0 m, the farmland was salinized to a different degree, which affected the growth of crops and reduced the yield. Therefore, 5.0 m is the key groundwater depth threshold of surface soil salinization in the irrigated farmland area, and it is the maximum groundwater depth that can form salinized soil.
Based on the above analysis, according to the relationship between soil salinization and groundwater depth, the GEF of farmland area in the lower reaches of northwest China can be divided into five levels of warning according to the degree of salinization: good, normal, gradual degeneration, serious degeneration, and catastrophic degeneration, as shown in Table 6. When groundwater depth is greater than 5.0 m, the GEF in the farmland area is in a good state, the total soil salt content is less than 0.2%, and soil salinization does not occur; when groundwater depth is between 4.0 m and 5.0 m, the GEF in farmland area is in a normal state, the total salt content in soil is between 0.2% and 0.4%, soil may be slightly salinized, and crop growth may be slightly affected; when groundwater depth is between 3.5 m and 4.0 m, the GEF in the farmland area is in a gradual degeneration state, and the total salt content in soil is between 0.4% and 0.6%, so the soil may be “moderately salinized”, which has a significant impact on crop growth; when groundwater depth is between 2.0 m and 3.5 m, the GEF in the farmland area is in a serious degeneration state, the total salt content in soil is between 0.6% and 2.0%, and soil may be “intensive salinized”, which has a severe impact on crop growth; when groundwater depth is less than 2.0 m, the GEF in the farmland area is in a catastrophic degeneration state, the total salt content in soil is more than 2.0%, the soil becomes salinized soil, and the yield of most crops is seriously reduced. In each level of early warning state, different “conclusions of early warning” and “countermeasures and suggestions” were formulated according to the dynamic trend of the groundwater level. Among them, the decline in groundwater level corresponds to “positive change”, while the rise of groundwater level corresponds to “general change”, “negative change”, and “worse change”.
4. Discussions
The irrational utilization of water resources and the serious overexploitation of groundwater caused the degradation of GEF in arid areas. In the process of groundwater depth decreasing gradually, the GDEs received less and less water from groundwater until they could not get enough water, and had different degrees of degradation, which was confirmed in the above-mentioned research results.
The other scholars have only studied the suitable ecological water level for different ecological types of areas. However, what are the response characteristics of GDEs if the groundwater depth is not in the appropriate ecological water level range? In order to solve this problem, on the basis of previous studies, this paper analyzed the response characteristics of the state of different ecological types of areas with the dynamic change in groundwater depth, and determined the different groundwater depth thresholds from good to catastrophic degeneration. The results showed that the dynamic relationship between the states of each ecological factor and the groundwater depth was not a simple linear relationship but a complex variation limited by the groundwater depth threshold. In the suitable ecological water level range, the states of each ecological factor changed gradually with the decrease in groundwater depth, but once the specific groundwater depth threshold was exceeded, the ecological factor deteriorated sharply. It was particularly evident in the relationship between natural wetland and groundwater depth. As can be seen from Figure 4, the water area of the natural wetland decreased gradually with the decrease in groundwater depth within the range of 1.5–3 m, and once the groundwater depth was greater than 3 m, the water area of the natural wetland decreased sharply or even shrank. In addition, the relationship between the degree of soil salinization and groundwater depth was not linear but an exponential function. When the groundwater depth was greater than 5 m, the soil was not salinized, but when the local groundwater depth was less than 5 m, the soil was salinized rapidly to varying degrees, and especially when the water level depth was less than 2 m, serious saline soil salinization occurred (Figure 6).
The research results were based on the ecological vegetation–groundwater–soil comprehensive investigation and analysis of remote sensing interpretation data in the Shiyang River basin of China. Although the research results may not be applicable to all arid areas because of certain regional limitations, the ideas and methods of this study can be used as a reference for other regions. It is suggested to further study the groundwater depth thresholds of different types of ecological areas from good, normal, gradual degeneration, serious degeneration, and catastrophic degeneration processes, and strengthen the dynamic monitoring of groundwater depth. Then, according to the dynamics of groundwater depth, it is suggested to predict the ecological states and formulate countermeasures in time. It should be noted that the premise of this work was to carry out the groundwater ecological function zoning of the basin first, and obtain the current situation information of different ecological environments such as natural wetlands, natural vegetation areas, and farmland protection areas.
5. Conclusions
The development of groundwater resources at the basin scale should establish a hierarchical control threshold according to different groundwater ecological function areas. Taking the Shiyang River basin of China as an example, this paper subdivided the threshold of ecological water level in different areas into five levels according to the response characteristics of different ecological factors to the dynamic change of groundwater, which corresponded to the five-level warning status of GEF (good, normal, gradual degeneration, serious degeneration, and catastrophic degeneration) for the natural wetland protection area, natural vegetation protection area, and farmland protection area. According to the dynamic trend of groundwater depth, different “warning conclusions” and “countermeasure suggestions” were formulated for each warning level. Among them, in the natural wetland area, the suitable ecological water level of groundwater was between 0.5 m to 1.5 m, and the limit ecological water level was 8.0 m; in the natural vegetation area, the suitable ecological water level was between 3.0 m to 5.0 m, and the limit ecological water level was 10.0 m; in the farmland area, the suitable ecological water level was between 2.0 m to 5.0 m, and the limit ecological water level was 2.0 m.
The study may be helpful for better recognition of relationships among groundwater sustainability, ecosystem health, and groundwater management policies. It is suggested that the local management department carries out real-time monitoring and early warning to the GEF. According to the status and degeneration degree of the GEF in different groundwater function areas, the protection and management of groundwater in different zones should be carried out. It is of great significance to realize the sustainable utilization of groundwater, fine management, and ecological protection.
Author Contributions
Conceptualization, G.Z.; methodology, H.C.; software, H.C.; validation, J.W., Q.W. and M.L.; formal analysis, H.C.; investigation, J.W., Q.W. and H.C.; data curation, G.Z.; writing—original draft preparation, H.C.; writing—review and editing, M.L.; visualization, H.C.; supervision, M.Y.; project administration, G.Z.; funding acquisition, M.Y., Q.W. and H.C. All authors have read and agreed to the published version of the manuscript.
Funding
This research was funded by National Key R&D Program of China (Grant No. 2017YFC0406106), the National Natural Science Foundation of China (Grant No. 41807217), and National Special Geological Survey Project (DD20221773-04).
Institutional Review Board Statement
Not applicable.
Informed Consent Statement
Not applicable.
Data Availability Statement
The data presented in this study are available on request from the corresponding author.
Conflicts of Interest
The authors declare no conflict of interest.
References
- Sun, Z.; Wang, J.; Ge, M.; Qiao, S. Isotopic approaches to identify groundwater dependent terrestrial vegetation: Progress, challenges, and prospects for future research. Bull. Geol. Sci. Technol. 2020, 39, 11–20. [Google Scholar]
- Eamus, D.; Froend, R. Groundwater-dependent ecosystems: The where, what and why of GDEs. Aust. J. Bot. 2006, 54, 91–96. [Google Scholar] [CrossRef]
- Wang, H.; Qin, D.; Wang, Y.; Wang, F. Ecological status and its evolution trend in arid region of northwest China. J. Hydraul. Eng. 2004, 35, 8–14. [Google Scholar] [CrossRef]
- Liu, J.; Fei, L.; Nan, Z.; Yin, Y. Study on ecological water requirement of the arid area oasis based on the theory of ecological security. J. Hydraul. Eng. 2010, 41, 226–232. [Google Scholar] [CrossRef]
- Li, L.; Wang, Z.; He, H.; Ma, Z.; Xie, X.; Wei, C. Research of water resources multi-dimensional equilibrium allocation based on ecohydrological threshold regulation in inland arid region. J. Hydraul. Eng. 2019, 50, 377–387. [Google Scholar] [CrossRef]
- Huang, F.; Chunyu, X.; Zhang, D.; Chen, X.; Ochoa, C.G. A framework to assess the impact of ecological water conveyance on groundwater-dependent terrestrial ecosystems in arid inland river basins. Sci. Total Environ. 2020, 709, 136155. [Google Scholar] [CrossRef]
- Chunyu, X.; Huang, F.; Xia, Z.; Zhang, D.; Chen, X.; Xie, Y. Assessing the Ecological Effects of Water Transport to a Lake in Arid Regions: A Case Study of Qingtu Lake in Shiyang River Basin, Northwest China. Int. J. Environ. Res. Public Health 2019, 16, 145. [Google Scholar] [CrossRef] [Green Version]
- Wang, T.; Istanbulluoglu, E.; Lenters, J.; Scott, D. On the role of groundwater and soil texture in the regional water balance: An investigation of the Nebraska Sand Hills, USA. Water Resour. Res. 2009, 45, W10413. [Google Scholar] [CrossRef] [Green Version]
- Yang, Z.; Wang, W. Reviews and prospects on eco-effect induced by groundwater in arid and semi-arid regions. Arid Land Geog. 2009, 32, 739–745. [Google Scholar] [CrossRef]
- Zheng, Y.; Xing, L.; Wei, Y. Influences of urbanization of inland river basins in northwest China on downstream water resources and ecological environment: A case of Shiyang River Basin. Yangtze River 2014, 45, 81–84. [Google Scholar] [CrossRef]
- Hu, S.; Ma, R.; Sun, Z.; Ge, M.; Zeng, L.; Huang, F.; Bu, J.; Wang, Z. Determination of the optimal ecological water conveyance volume for vegetation restoration in an arid inland river basin, northwestern China. Sci. Total Environ. 2021, 788, 14775. [Google Scholar] [CrossRef] [PubMed]
- Zhai, J.; Dong, Y.; Qi, S.; Zhao, Y.; Liu, K.; Zhu, Y. Advances in Ecological Groundwater Level Threshold in Arid Oasis Regions. J. Hydrol. 2021, 41, 7–14. [Google Scholar] [CrossRef]
- Cheng, Y.; Chen, L.; Yin, J.; Bai, Z.; Zhao, W. Depth interval study of vegetation ecological groundwater in the water source area at Manaz River valley. Environ. Sci. Technol. 2018, 41, 26–33. [Google Scholar] [CrossRef]
- Zhang, L.; Dong, Z.; Huang, X. Modeling on relation between major plants growth and groundwater depth in arid area. J. Desert Res. 2004, 24, 110–114. [Google Scholar]
- Chen, Y.; Zilliacus, H.; Li, W.; Zhang, H.; Chen, P. Ground-water level affects plant species diversity along the lower reaches of the Tarim river, Western China. J. Arid Environ. 2006, 66, 231–266. [Google Scholar] [CrossRef]
- Wang, W.; Su, X.; Wan, X. Vegetation ecological risk assessment research under the impact of groundwater withdraw: A case study of Wulannao Area, Ordos Basin. J. Jilin Univ. Earth Sci. Ed. 2010, 40, 1344–1352. [Google Scholar] [CrossRef]
- Zhang, E.; Tao, Z.; Wang, X.; Cui, X.; Yin, L. A study of vegetation response to groundwater on regional scale in northern Ordos Basin based on structure chart method. Geol. China 2012, 39, 811–817. [Google Scholar]
- Zhao, C.; Wang, Y.; Chen, X.; Li, B. Simulation of the effects of groundwater level on vegetation change by combining FEFLOW software. Ecol. Modell. 2005, 187, 341–351. [Google Scholar] [CrossRef]
- Li, X.; Zheng, Y.; Sun, Z.; Tian, Y.; Zheng, C.; Liu, J.; Liu, S.; XU, Z. An integrated ecohydrological modeling approach to exploring the dynamic interaction between groundwater and phreatophytes. Ecol. Modell. 2017, 356, 127–140. [Google Scholar] [CrossRef]
- Doble, R.; Simmons, C.; Jolly, I.; Walker, G. Spatial relationships between vegetation cover and irrigation-induced groundwater discharge on a semi-arid floodplain, Australia. J. Hydrol. 2006, 329, 75–97. [Google Scholar] [CrossRef]
- Chui, T.; Low, S.; Liong, S. An ecohydrological model for studying groundwater-vegetation interactions in wetland. J. Hydrol. 2011, 409, 291–304. [Google Scholar] [CrossRef]
- Chen, M.; Zhang, Q.; Wang, Y.; Yan, L.; Deng, W. Critical depth of recharge of the vegetation by groundwater in the West Liaohe Plain. Adv. Water Sci. 2019, 30, 24–33. [Google Scholar] [CrossRef]
- Sun, X.; Jin, X.; Wan, L. Effect of groundwater on vegetation growth in Yinchuan Plain. Geoscience 2008, 22, 321–324. [Google Scholar] [CrossRef]
- Wang, Y.; Wang, S.; Feng, X.; Cheng, Z.; Yun, K.; Yang, H. Controlling depth of groundwater tables along mainstream and in downstream tributary intensive areas of Ejina River. Trans. Chin. Soc. Agric. Eng. 2011, 27, 101–106. [Google Scholar] [CrossRef]
- Song, Y.; Guo, Z.; Lu, Y.; Yan, D.; Liao, Z.; Liu, H.; Cui, Y. Pixel-level spatiotemporal analyses of vegetation fractional coverage variation and its influential factors in a desert steppe: A case study in Inner Mongolia, China. Water 2017, 9, 478. [Google Scholar] [CrossRef]
- Li, F.; Wang, Y.; Zhao, Y.; Qiao, J. Modelling the response of vegetation restoration to changes in groundwater level, based on ecologically suitable groundwater depth. Hydrogeol. J. 2018, 26, 2189–2204. [Google Scholar] [CrossRef]
- Qi, Z.; Xiao, C.; Wang, G.; Liang, X. Study on Ecological Threshold of Groundwater in Typical Salinization Area of Qian’an County. Water 2021, 13, 856. [Google Scholar] [CrossRef]
- Huang, Q.; Xu, X.; Lv, L.; Ren, D.; Ke, J.; Xiong, Y.; Huo, Z.; Huang, G. Soil salinity distribution based on remote sensing and its effect on crop growth in Hetao Irrigation District. Trans. Chin. Soc. Agric. Eng. 2018, 34, 102–109. [Google Scholar] [CrossRef]
- Wang, X.; Hu, S. Characteristics and amelioration of farm land salinized soils in the Qaidam Basin. J. Arid Land Resour. Environ. 1998, 12, 75–85. [Google Scholar] [CrossRef]
- Li, M.; Ning, L.; Lu, T. Determination and the control of critical groundwater table in soil salinization area. J. Irrig. Drain. 2015, 34, 46–50. [Google Scholar] [CrossRef]
- Ibrakhimov, M.; Khamzina, A.; Forkutsa, I.; Paluasheva, G.; Lamers, J.; Tischbein, B.; Vlek, P.L.G.; Martius, C. Groundwater table and salinity: Spatial and temporal distribution and influence on soil salinization in Khorezm region (Uzbekistan, Aral Sea Basin). Irrig. Drain. Syst. 2007, 21, 219–236. [Google Scholar] [CrossRef]
- Yu, L.; Li, J.; Bao, A.; Bai, J.; Huang, Y.; Liu, T.; Shen, Z. Temporal areal changes of wetlands in the lower reaches of the Tarim River and their responses to ecological water conveyance. Chin. J. Plant Ecol. 2020, 44, 616–627. [Google Scholar] [CrossRef]
- Jia, L.; Guo, Z.; Long, Y.; Guo, K.; Liao, Z. Research advances in ecological groundwater level in arid areas. Ecol. Sci. 2015, 34, 187–193. [Google Scholar] [CrossRef]
- Klove, B.; Ala-aho, P.; Bertrand, G.; Gurdak, J.; Kupfersberger, H.; Kværner, J.; Muotka, T.; Mykrä, H.; Preda, E.; Rossi, P.; et al. Climate change impacts on groundwater and dependent ecosystems. J. Hydrol. 2014, 518, 250–266. [Google Scholar] [CrossRef]
- Zurek, A.; Witczak, S.; Dulinski, M.; Wachniew, P.; Rozanski, K.; Kania, J.; Postawa, A.; Karczewski, J.; Moscicki, W.J. Quantification of anthropogenic impact on groundwater-dependent terrestrial ecosystem using geochemical and isotope tools combined with 3-D flow and transport modeling. Hydrol. Earth Syst. Sci. 2015, 19, 1015–1033. [Google Scholar] [CrossRef] [Green Version]
- Li, F.; Chen, H.; Wang, K.; Chen, X. Comprehensive review of groundwater -dependent ecosystems. Adv. Water Sci. 2018, 29, 750–758. [Google Scholar] [CrossRef]
- Wang, P.; Zhang, Y.; Yu, J.; Fu, G.; Fei, A. Vegetation dynamics induced by groundwater fluctuations in the lower Heihe River Basin, Northwestern China. J. Plant Ecol. 2011, 4, 77–90. [Google Scholar] [CrossRef]
- Zhang, Y.; Bai, Q.; Wang, H. Discussion on suitable depth of groundwater level, water-saving threshold and water-salt balance in Hetao irrigation district. J. Irrig. Drain. 2019, 38, 83–86. [Google Scholar] [CrossRef]
- Cruz, J.V.; Coutinho, R.; Andrade, C.; Medeiros, D.; Cymbron, R. Identification and Mapping of Groundwater Dependent Ecosystems in the AZORES Volcanic Archipelago (Portugal). Water 2022, 14, 1126. [Google Scholar] [CrossRef]
- Xu, W.; Kong, F.; Mao, R.; Song, J.; Sun, H.; Wu, Q.; Liang, D.; Bai, H. Identifying and mapping potential groundwater-dependent ecosystems for a semi-arid and semi-humid area in the Weihe River, China. J. Hydrol. 2022, 609, 127789. [Google Scholar] [CrossRef]
- Isabel, P.; Nir, K.; Reza, K.; Roy, A. A review of advances in the identification and characterization of groundwater dependent ecosystems using geospatial technologies. Geosciences 2016, 6, 17. [Google Scholar] [CrossRef] [Green Version]
- Martínez-Santos, P.; Díaz-Alcaide, S.; Hera-Portillo, A.; Gómez-Escalonilla, V. Mapping groundwater-dependent ecosystems by means of multi-layer supervised classification. J. Hydrol. 2021, 603, 126873. [Google Scholar] [CrossRef]
- Barron, O.V.; Irina, E.; Van, N.; Daniel, P.; Geoff, H. Mapping groundwater-dependent ecosystems using remote sensing measures of vegetation and moisture dynamics. Hydrol. Process. 2014, 28, 372–385. [Google Scholar] [CrossRef]
- Si, G.; Gonzales, S.; Miller, G.R. Mapping potential groundwater-dependent ecosystems for sustainable management. Groundwater 2015, 53, 99–110. [Google Scholar] [CrossRef]
- Liu, C.; Liu, H.; Yu, Y.; Zhao, W.; Zhang, Z.; Guo, L.; Yetemen, O. Mapping groundwater-dependent ecosystems in arid Central Asia: Implications for controlling regional land degradation. Sci. Total Environ. 2021, 797, 149027. [Google Scholar] [CrossRef]
- Páscoa, P.; Gouveia, C.; Besson, C. A Simple Method to Identify Potential Groundwater-Dependent Vegetation Using NDVI MODIS. Forests 2020, 11, 147. [Google Scholar] [CrossRef] [Green Version]
- Glanville, K.; Ryan, T.; Tomlinson, M.; Muriuki, G.; Ronan, M.; Pollett, A. A Method for Catchment Scale Mapping of Groundwater-Dependent Ecosystems to Support Natural Resource Management (Queensland, Australia). Environ. Manag. 2016, 57, 432–449. [Google Scholar] [CrossRef]
- Howard, J.; Merrifield, M. Mapping Groundwater Dependent Ecosystems in California. PLoS ONE 2010, 5, e11249. [Google Scholar] [CrossRef] [Green Version]
- Huang, Y. Ecological Function Evaluation of Groundwater in Golmud Region; China University of Geosciences: Beijing, China, 2005. [Google Scholar]
- Wang, J.; Zhang, G.; Yan, M.; Tian, Y.; Wang, Q. Index weight analysis of groundwater function evaluation and zoning system in arid areas. Trans. Chin. Soc. Agric. Eng. 2020, 36, 133–143. [Google Scholar] [CrossRef]
- Tang, K.; Tang, Y.; Li, Y.; Hou, J. Technical system of functional division for groundwater and its application in China. J. Hydraul. Eng. 2012, 43, 1349–1356. [Google Scholar] [CrossRef]
- Kang, D.; Gu, F.; Zhou, W. Comprehensive evaluation of groundwater management in Shiyang River Basin. Yellow River 2021, 43, 65–69. [Google Scholar] [CrossRef]
- Gao, C.; Zhao, J.; Wang, Y.; Jin, G.; Wang, J.; Hu, X. Study on the constraint effect of natural vegetation on ecosystem services in the Shiyang River Basin. Acta Ecol. Sin. 2020, 40, 2851–2862. [Google Scholar] [CrossRef]
- Bai, Y.; Gao, J.; Zhang, B. Monitoring of Crops Growth Based on NDVI and EVI. Trans. Chin. Soc. Agric. Mach. 2019, 50, 153–161. [Google Scholar] [CrossRef]
- Lin, Y.; Hu, X.; Qiu, R.; Zhang, Z.; Lin, Q.; Lin, J. Responses Landsat-based NDVI to the interaction of vegetation and influencing factors. Trans. Chin. Soc. Agric. Mach. 2018, 49, 212–219. [Google Scholar] [CrossRef]
- Cao, L.; Nie, Z.; Liu, M.; Wang, L.; Wang, J.; Wang, Q. The Ecological Relationship of Groundwater–Soil–Vegetation in the Oasis–Desert Transition Zone of the Shiyang River Basin. Water 2021, 13, 1642. [Google Scholar] [CrossRef]
- Jin, X. Quantitative relationship between the desert vegetation and groundwater depth in Ejina Oasis, the Heihe River Basin. Earth Sci. Front. 2010, 17, 181–186. [Google Scholar]
- Liu, M.; Nie, Z.; Cao, L.; Wang, L.; Lu, H.; Wang, Z.; Zhu, P. Comprehensive evaluation on the ecological function of groundwater in the Shiyang River watershed. J. Groundwater Sci. Eng. 2021, 9, 326–340. [Google Scholar] [CrossRef]
- Wang, Z.; Zhu, S.; Yu, R.; Li, L.; Shan, G.; You, W.; Zeng, X.; Zhang, C.; Zhang, L. Saline Soil of China; Science Press: Beijing, China, 1993; pp. 250–305. [Google Scholar]
- Zhang, T.; Zhang, X. Effect of soil salinity on several crops in Yellow River irrigating area in central Gansu. J. Gansu Agric. Univ. 2005, 5, 609–612. [Google Scholar]
- Huang, J.; Kong, Y.; Xu, Q.; Zhu, C.; Zhu, L.; Cao, X.; Hong, X.; Zhang, J. Progresses for characteristics and amelioration measures of saline Soil. Soils 2022, 54, 18–23. [Google Scholar] [CrossRef]
- Zheng, J.; Zhu, C.; Zhai, Y. Impact of Alternating Irrigation Using Saline and Fresh Water on Maize Growth and Its Yield. J. Irrig. Drain. 2017, 36, 37–41. [Google Scholar] [CrossRef]
Figure 1.
Water cycle patterns and ecological functions in the natural state of the Shiyang River basin. 1. Bedrock; 2. Quaternary; 3. fault; 4. water cycle transformation and GEF zoning number; 5. groundwater depth; 6. groundwater movement; 7. spring; 8. precipitation; 9. surface runoff.
Figure 1.
Water cycle patterns and ecological functions in the natural state of the Shiyang River basin. 1. Bedrock; 2. Quaternary; 3. fault; 4. water cycle transformation and GEF zoning number; 5. groundwater depth; 6. groundwater movement; 7. spring; 8. precipitation; 9. surface runoff.

Figure 2.
Mapping of groundwater function in Shiyang River basin.

Figure 3.
The map of field survey points. (a) Field ecological vegetation–groundwater–soil comprehensive investigation; (b) in situ monitoring sites of groundwater.
Figure 3.
The map of field survey points. (a) Field ecological vegetation–groundwater–soil comprehensive investigation; (b) in situ monitoring sites of groundwater.

Figure 4.
Correlation between wetland water area and groundwater depth.

Figure 5.
Relationship between NDVI and groundwater depth.

Figure 6.
Correlation between salt content of topsoil and groundwater depth.


Table 1.
Data description of field investigation and collection.
| Type of Data | Source of Data | Types of Parameters | Duration of Data | Period of Data |
|---|---|---|---|---|
| Vegetation–groundwater–soil comprehensive investigation | Field surveys | Vegetation growth including coverage, dominant species, plant height, salt content of topsoil, and groundwater depth | August 2018 and August 2019 | Yearly |
| Monitoring of groundwater depth in wetland | In situ monitoring | Groundwater depth | August 2018 to December 2019 | 30 min |
| Area of wetland | Collected by the local groundwater authority | Water area | From September to October of 2018 and 2019, respectively | Daily |
| Groundwater depth of the study area | Collected by the local groundwater authority | Groundwater depth | 2000 to 2017 | Monthly |
| NDVI | Collected by Landsat satellite data | Index of NDVI | 2000 to 2017 | Monthly |
Table 2.
Ecological security early warning and management threshold index system of natural wetland in northwest inland basin.
Table 2.
Ecological security early warning and management threshold index system of natural wetland in northwest inland basin.
| Groundwater Depth (m) | Ecological Security Situation | Groundwater Dynamic | Conclusion of Early Warning | Countermeasures and Suggestions |
|---|---|---|---|---|
| <0.5 | Good | ↑ | Positive change | Maintain existing regulatory measures |
| ↓ | General change | Appropriately strengthen monitoring and management | ||
| 0.5–1.5 | Normal | ↑ | Positive change | Maintain existing regulatory measures |
| ↓ | Negative change | Strengthen monitoring and early warning measures | ||
| 1.5–3.0 | Gradual degeneration | ↑ | Positive change | Maintain existing regulatory measures |
| ↓ | Negative change | Strengthen monitoring, early warning measures, and management | ||
| 3.0–8.0 | Serious degeneration | ↑ | Positive change | Maintain existing regulatory measures |
| ↓ | Worse change | Strengthen monitoring and early warning measures, and appropriately reduce groundwater exploitation or increase groundwater recharge | ||
| >8.0 | Catastrophic degeneration | ↑ | Positive change | Maintain existing regulatory measures |
| ↓ | Worse change | Strengthen monitoring, early warning measures, and management; meanwhile, strictly control groundwater exploitation or increase groundwater recharge |
Note: “↑” means groundwater level is rising; on the contrary, “↓” means groundwater level is in a state of decline.
Table 3.
Relationship between natural vegetation growth and groundwater depth [58]. Reprinted with permission from Ref. [58]. 2021 Journal of Groundwater Science and Engineering.
| Groundwater Depth (m) | Species Richness | Vegetation Coverag (%) | Dominant Species | Height of Dominant Species (m) |
|---|---|---|---|---|
| 0–2 | 1–3 | 75–90 | Tamarix chinensis | 3.8 |
| Phragmites australis | 1.0 | |||
| Kalidium foliatum | 0.6 | |||
| 2–4 | 2–7 | 45–100 | Elaeagnus angustifolia | 6.0 |
| Tamarix chinensis | 2.6 | |||
| Caragana Korshinskii Kom | 2.2 | |||
| 3–6 | 3–10 | 30–70 | Reaumuria songarica | 0.6 |
| Hedysarum scoparium | 1.2 | |||
| 5–7 | 2–4 | 20–30 | Nitraria sibirica | 0.5 |
| Reaumuria songarica | 0.5 | |||
| 7–10 | 1–2 | <25 | Haloxylon ammoderma | 1.2 |
| Nitraria sibirica | 0.4 |
Table 4.
Ecological security early warning and management threshold index system of natural vegetation area.
Table 4.
Ecological security early warning and management threshold index system of natural vegetation area.
| Groundwater Depth (m) | Ecological Security Situation | Groundwater Dynamic | Conclusion of Early Warning | Countermeasures and Suggestions |
|---|---|---|---|---|
| <3 | Good | ↑ | Positive change | Maintain existing regulatory measures |
| ↓ | General change | Appropriately strengthen monitoring and management | ||
| 3–5 | Normal | ↑ | Positive change | Maintain existing regulatory measures |
| ↓ | Negative change | Strengthen monitoring and early warning measures | ||
| 5–7 | Gradual degeneration | ↑ | Positive change | Maintain existing regulatory measures |
| ↓ | Negative change | Strengthen monitoring, early warning measures, and management | ||
| 7–10 | Serious degeneration | ↑ | Positive change | Maintain existing regulatory measures |
| ↓ | Worse change | Strengthen monitoring and early warning measures, and appropriately reduce groundwater exploitation or increase groundwater recharge | ||
| >10 | Catastrophic degeneration | ↑ | Positive change | Maintain existing regulatory measures |
| ↓ | Worse change | Strengthen monitoring, early warning measures, and management, meanwhile, strictly control groundwater exploitation or increase groundwater recharge |
Note: “↑” means groundwater level is rising; on the contrary, “↓” means groundwater level is in a state of decline.
Table 5.
Classification of soil salinization and corresponding groundwater depth.
| Degree of Salinization | Non-Salinization | Mild Salinization | Moderate Salinization | Intensity Salinization | Saline Soil |
|---|---|---|---|---|---|
| Total of soil salinity (%) | <0.2 | 0.2–0.4 | 0.4–0.6 | 0.6–2.0 | >2.0 |
| Groundwater depth (m) | >5.0 | 4.0–5.0 | 3.5–4.0 | 2.0–3.5 | <2.0 |
Table 6.
Ecological security early warning and management threshold index system of farmland area.
| Groundwater Depth (m) | Ecological Security Situation | Groundwater Dynamic | Conclusion of Early Warning | Countermeasures and Suggestions |
|---|---|---|---|---|
| <2.0 | Catastrophic degeneration | ↑ | Worse change | Strengthen monitoring and significantly increase the amount of groundwater exploitation |
| ↓ | Positive change | Maintain existing regulatory measures | ||
| 2.0–3.5 | Serious degeneration | ↑ | Worse change | Strengthen monitoring and significantly increase the amount of groundwater exploitation |
| ↓ | Positive change | Maintain existing regulatory measures | ||
| 3.5–4.0 | Gradual degeneration | ↑ | Negative change | Strengthen monitoring and increase the amount of groundwater exploitation |
| ↓ | Positive change | Maintain existing regulatory measures | ||
| 4.0–5.0 | Normal | ↑ | Negative change | Appropriately strengthen monitoring and increase the amount of groundwater exploitation |
| ↓ | Positive change | Maintain existing regulatory measures | ||
| >5.0 | Good | ↑ | General change | Appropriately strengthen monitoring and increase the amount of groundwater exploitation |
| ↓ | Positive change | Maintain existing regulatory measures |
Note: “↑” means groundwater level is rising; on the contrary, “↓” means groundwater level is in a state of decline.
Publisher’s Note: MDPI stays neutral with regard to jurisdictional claims in published maps and institutional affiliations. |
© 2022 by the authors. Licensee MDPI, Basel, Switzerland. This article is an open access article distributed under the terms and conditions of the Creative Commons Attribution (CC BY) license (https://creativecommons.org/licenses/by/4.0/).
Share and Cite
MDPI and ACS Style
Cui, H.; Zhang, G.; Wang, Q.; Wang, J.; Liu, M.; Yan, M. Study on Index of Groundwater Ecological Function Crisis Classification and Early Warning in Northwest China. Water 2022, 14, 1911. https://doi.org/10.3390/w14121911
AMA Style
Cui H, Zhang G, Wang Q, Wang J, Liu M, Yan M. Study on Index of Groundwater Ecological Function Crisis Classification and Early Warning in Northwest China. Water. 2022; 14(12):1911. https://doi.org/10.3390/w14121911
Chicago/Turabian StyleCui, Haohao, Guanghui Zhang, Qian Wang, Jinzhe Wang, Min Liu, and Mingjiang Yan. 2022. "Study on Index of Groundwater Ecological Function Crisis Classification and Early Warning in Northwest China" Water 14, no. 12: 1911. https://doi.org/10.3390/w14121911
Note that from the first issue of 2016, this journal uses article numbers instead of page numbers. See further details here.