
The Spatial and Temporal Assessment of the Water–Land Nexus in a Changing Environment: The Huang-Huai-Hai River Basin (China)


1
Institute of Hydrology and Water Resources, College of Civil Engineering and Architecture, Zhejiang University, Hangzhou 310058, China
2
State Key Laboratory of Hydrology-Water Resources and Hydraulic Engineering, Nanjing Hydraulic Research Institute, Nanjing 210029, China
*
Author to whom correspondence should be addressed.
Water 2022, 14(12), 1905; https://doi.org/10.3390/w14121905
Submission received: 9 May 2022
/
Revised: 10 June 2022
/
Accepted: 10 June 2022
/
Published: 13 June 2022
(This article belongs to the Topic Water and Soil Management in Adaptation to Climate Change)
Abstract
:In addition to agriculture, the water–land nexus (WLN) also profoundly affects the sustainable development of industry and residents’ lives. However, little research has been designed to assess the water–land nexus from the perspective of industry development and people’s quality of life. In the current paper, Wi, a regional industrial water–land nexus matching index, and Wd, a matching index of the domestic water–land nexus, were proposed for evaluating the water–land nexus from the industry development and quality of life perspectives separately in the current paper. Furthermore, climate change and human activities have significant impacts on the water–land nexus. The WLNs were assessed spatially and temporally for the first time based on these two indexes in 128 municipalities in the Huang-Huai-Hai River Basin of China from 1951 to 2017 to analyze the impacts of the changing environment on them. The impact of changing environment was explored based on changes of some climate factors and land use. The value of Wi are higher in the eastern and southern cities than the western and northern cities, while Zhenjiang city in Jiangsu Province has the highest Wi. For Wd, there are two low Wd zones across the basin, while the minimum values occurred in Linxia Hui Autonomous Region (Wd = 35.34 mm). Wi and Wd in most cities in the basin showed a significant downward trend, and some cities in the southwest of the basin have the fastest-decreasing of Wd. Wt and Wa were also calculated to assess the total and agricultural water–land nexus separately based on existing research. The Wt for the Huang-Huai-Hai River Basin gradually increases from northwest to southeast, and its spatial distribution characteristics are similar to precipitation in the river basin. In addition, the government should simultaneously implement water transfer plans to reduce the agricultural water pressure in Ningxia and Gansu provinces. Dynamic driving factors of change of the four assessment indexes (Wt, Wa, Wi, Wd) are briefly analyzed in the end of the paper.
1. Introduction
Water and land are two fundamental resources that both directly and indirectly support regional economic and social development [1,2]. (In this study, water resources refers to available water, and land resources refers to available land area.) However, the total water resources per capita in China equaled 2083.8 billion m3, which is close to the international warning level of 1700 billion m3 per capita [3], and the arable land per capita in China is less than half of the global average [4]. Among all the basins in China, the problems of water scarcity and land erosion are pronounced in the Huang-Huai-Hai River Basin. The river plays a significant strategic role in Chinese economic development [5]. The gross domestic product (GDP), population, and cultivated land area of this region respectively account for 31%, 35%, and 38% of the whole country. However, only 7.2% of China’s total water resources are in this region [6]. Climate change might have a crucial impact on water resource system vulnerability. The fifth assessment report of the Intergovernmental Panel on Climate Change pointed out that climate change, population growth, and economic activities have adverse impacts on water resource systems [7], and since the 21st century, the economic development of the Huang-Huai-Hai River Basin has driven the process of urbanization, and great changes have taken place in land-use types [8]. Under the impact factors of changing environments, such as climate change and human activities, the total amounts of water and land resources available are changing in Huang-Huai-Hai River Basin, which could lead to risks in the future.
The spatial dislocation of agricultural water and land resources is an important factor restricting the sustainable development of agriculture [9]. Similarly, spatial dislocation influences the sustainable development of industry and the quality of residents’ lives. Since the construction of new factories needs land and the cooling in the production process needs water, abundant water and land are clearly critical for life and living standards. Although developing and extending industrial water-saving technologies would make the factories need less water, the availability of water is still an inescapable limiting factor for sustainable development. Meanwhile, water scarcity has direct impacts on human health and well-being. Thus, the total amount and spatial distribution of water and land resources both affect the development of agriculture and industry as well as local quality of life.
Water and land resources impose checks and balances on each other: a shortage or surplus of one resource affects the usage of the other. For example, the adoption of a specific land use policy could cause adverse effects on freshwater resources [10]. There is growing recognition that the interdependence of water and land requires nexus thinking, which is an important metaphor for investigating different kinds of resource interconnections [11], and in the current paper, the water–land nexus (WLN) was considered as a unit. An appropriate agricultural WLN can help to effectively take advantage of limited arable land and water resources and would be of great significance for guaranteeing food security [12]. Similarly, with appropriate industry WLN, the water and land resources used for industry could be a solid foundation for the sustainable development of regional industry. If the domestic WLN, meaning the water and land resources provided for residents’ lives, is coordinated with residents’ use, residents’ quality of life will improve significantly, especially in those cities that water deficiency is serious. However, the use of water and land for industry could consume resources needed for agriculture. Therefore, there are trade-offs among the different WLN uses (agriculture, industry and domestic). The factors of changing environment including climate change and the intensive human activities are profoundly affecting the spatial and temporal characteristics of WLNs [13]. Thus, it is necessary to assess the WLN from different perspectives among different users in the context of the changing environment of the Huang-Huai-Hai River Basin for the continued efficient utilization of water–land resources and their optimal allocation for the comprehensive and balanced development of the region. Analyzing and evaluating WLNs in different regions is useful for regional managers to carry out synergistic optimization and allocation strategies that are suitable for local conditions, which is also the key to constructing a basin-wide WLN evaluation system.
The nexus approach has been adopted by many researchers to study interactions between resources, such as water–energy–land–food, water–energy, and water–land. The nexus approach has proven a valuable tool for identifying gaps and incoherencies in current policies, for understanding major interlinkages across sectors and scales, and for promoting the Sustainable Development Goals (SDGs) [14]. In particular, nexuses are usually considered with the impact of climate change. A water–energy–food nexus was combined with climate service to avoid myopia in improving policy making [15]. The dynamics were explored of the water–energy–land nexus in urban systems suffering increased climate change-related droughts and their implications for sustainability [16]. The nexus perspective was also adopted to elicit sectoral stakeholders’ perceptions of the relationships of the regional nexus entities to relevant measures and their perceived synergies and trade-offs [17]. For the assessment of WLN, researchers focused on the coupling relationship between water and land resources, and matching indexes were applied to indicate the balance between water and land resources. The matching of water and land resources indexes can be calculated from three aspects: (1) calculating the matching index of water and land resources with the total water resource volume per hectare as the index; (2) evaluating the overall matching situation of water and land resources in the region by the Gini coefficient model; or (3) using data envelopment analysis (DEA) to analyze the matching characteristics of water and land resources. For the first aspect, this method was widely used for its convenience and efficiency. The matching index of water resources and land resources was calculated using the total water per hectare [18]. For the second aspect, the Gini coefficient is an important quantitative indicator of the degree of matching between water and land resources. A Lorenz curve was used to characterize the matching state of agricultural water and land [19]. The Gini coefficient model was constructed to evaluate the degree of matching between agricultural water and land resources [20]. The Gini coefficient was also calculated to reveal the changes in the matching degree between agricultural water and cultivated land resources [21]. The Gini coefficient model and the matching index model were used together to analyze the matching between water and land resources in Central Asia [22]. For the DEA model, the water and land resources are used as the input indicators and the agricultural output is the output index for studying the matching degree of water and land resources [23].
Previously, most studies were about the assessment of WLN by calculating matching indexes from the perspective of agricultural development. Since a mismatch in the spatial distribution of water and land resources available for agricultural purposes raises a dilemma for food production activities between the conservation of water resources and the full utilization of land to fulfill the demand for food [24]. An R index was proposed for evaluating the regional agricultural WLN from a green–blue water perspective.Input–output analysis, ecological network analysis, and Dempster–Shafer evidence theory were integrated into a supernetwork model to detect the water–land–food nexus among economic sectors with the aim of exploring effective strategic paths for resource management and facilitating the construction of a resource-saving society [25]. The impact of urbanization on the water–land–food nexus was explored based on changes in land use [26]. Although the WLN has been widely assessed from the perspective of agriculture, it is not enough to consider only the development of agriculture when managing a WLN. In fact, the matching of water and land resources not only influences agriculture but also has prominent impacts on the development of industry and the life quality of residents, as mentioned above. Thus, it is necessary to evaluate the WLN from the perspectives of industry development and the life quality of residents to perfect the existing assessment system of WLN. Then, managers could make more comprehensive resource utilization decisions to balance development for agriculture, industry, and quality of life purposes. However, the assessment of WLN to support sectors such as industry and community life has not yet been studied sufficiently. From the perspective of industry development, some studies have investigated the WLN focusing on the management of trade-offs and synergies between policies across sectors [27]. Some analyzed the impacts of economic factors on the WLN [28,29]. Few researchers have studied the WLN from a clearly industry perspective, and we found no studies on the assessment of WLN to support quality of life, another area that is heavily affected by the uses of the WLN. To fill the research gap, this paper aimed at (1) assessing the WLN from the perspectives of industry development and residents’ life quality; (2) analyzing the characteristics of the temporal and spatial variations in WLN from different aspects; (3) identifying the driving factors of variations in WLN. Our study constructed a more comprehensive assessment system for the water–land nexus to support the development of different sectors; the utilization of both water and land resources is enhanced when they are considered as a nexus. Furthermore, the analysis of the spatial-temporal dynamic changes in the water–land nexus under the impacts of a changing environment also provide an important reference for addressing the risks from a changing environment in the future. Analyzing and assessing the water–land nexus in different regions is also useful for regional managers to carry out synergistic optimization and allocation strategies that are suitable for local conditions.
2. Data and Methods
2.1. Study Area
The Huang-Huai-Hai River Basin is the general name of three first-level water resource regions in China, the Yellow River Basin, Huaihe River Basin, and Haihe River Basin, as shown in Figure 1. It is located at 95°53′–122°60′ E and 32°10′–43° N. The basin consists of 16 provinces and 128 cities in China. There are many important political and cultural centers, major agricultural production areas, and important nature reserves in this basin, so it plays a crucial role in China’s long-term development strategy. However, there is a serious shortage of water and land resources in the Huang-Huai-Hai River Basin [30,31]. The water and resources that were considered for this study refer to the total available surface water and land area in the basin. For such an important basin, with scarce water and land resources as well as unbalanced distribution of the two, we need to understand the matching pattern between the water and land resource system in both time and space to provide a scientific basis for the planning and utilization of the water and land resources together as a whole system to improve the management efficiency.
2.2. Data
The 67 years (January 1951–December 2017) of daily meteorological data used in this study were obtained from the China Surface Climate Data Daily Value Data Set (V3.0) of the Data Information Center of China Meteorological Administration (http://data.cma.cn/ (accessed on 10 October 2020)). The data set contains daily atmospheric pressure, air temperature, precipitation, evaporation, relative humidity, wind direction and speed, sunshine duration, and 0 cm ground temperature data collected from 824 reference and basic meteorological stations in China since January 1951; all data are observed data. In this study, the daily meteorological elements including precipitation and temperature were sorted into monthly and yearly values. Due to the long time span, a small number of station data were missing. We eliminated the missing data from the set. Additionally, the numbers of meteorological stations changed over the past 67 with the establishment of new ones. Therefore, to include all stations in the calculation process, we divided the historical meteorological data into 5 time periods: 1951–1965, 1966–1980, 1981–1995, 1996–2008, and 2009–2017. Because of the installation and deployment of new weather stations over the full study period, the numbers of meteorological stations are different in the five individual study periods: 160, 166, 184, 182, and 185, respectively. We selected all the meteorological stations in the Huang-Huai-Hai River Basin in each time period to determine the regional meteorological data we needed. Based on the original data, we created a rectangular grid of the study area and divided it into 32,400 small grids to obtain the coordinate sequence of the center points of all grids. We used the inverse distance weighting method (IDW) [26,27,28,29,30] to interpolate the meteorological data of the station to the center points of all small grids. For precipitation, the data at the center points of the grids approximately replaced the surface precipitation data of the grids. When boundaries and grids intersected with each other, the area-weighted average was used to obtain the meteorological data for each part of the grid. The sums of the central points in all grids within every city boundary replaced that city’s precipitation data. For temperature, the weighted average of all grid data in the region was calculated to replace the temperature data of the region. Ultimately, the yearly precipitation and temperature data for 128 cities in the Huang-Huang-Hai Basin from 1951 to 2017 could be obtained.
The total amounts of water resources, the total available surface water and water consumption in each sector, were derived from the 1985–2017 annual Hydrology Statistical Yearbook, Local Yearbook, Urban Statistical Yearbook, and Water Resources Bulletin, which were issued by the water conservancy departments and hydrological bureaus of the 16 provincial (municipal) administrative regions and 128 municipal administrative regions in the Huang-Huai-Hai River Basin. The historical water resources data for all provincial and prefecture-level municipalities in the Huang-Huai-Hai River Basin only date to 1985, and the data integrity is poor. Therefore, concentrating on the Hydrology Statistical Yearbook, this study collected first-level regional water resource data for the three individual water resources from 1951 to 2017 for the missing data interpolation.
The land use data were provided by the remote sensing monitoring database of land use in China and released by the Institute of Geographic Sciences and Natural Resources Research of the Chinese Academy of Sciences and the Resource and Environmental Science Data Center (http://www.resdc.cn/data.aspx?DATAID=184 (accessed on 20 December 2020)). The data set includes seven typical years: 1980, 1990, 1995, 2000, 2005, 2010, and 2015. As shown in Table 1, there are 6 primary and 25 secondary land use types in the data set.
The data for population, gross domestic product, and ten thousand yuan of industrial added value of all provinces and cities were acquired from the statistical yearbooks of the 16 provinces in the Huang-Huai-Hai River Basin from 1985 to 2017.
2.3. Methods
2.3.1. The Evaluation of WLN in the Huang-Huai-Hai River Basin
In this study, a new method of evaluating a WLN system was developed to estimate how well the water resources system and land resources system match in time and space to support the sustainable development of an economy and its society. In previous studies on evaluating the WLM matching index, the main focus was on the calculation and analysis of the matching indexes for total WLN and agricultural WLN. Such an evaluation method might lead to negative external impacts on water and land resource planning due to the neglect of the matching status of water and land resources for other purposes. In order to perfect the existing evaluation system for WLN and consider the matching state of the water and land resources in a more comprehensive way, in this study, we used water resources data and land use data to establish a new evaluation system of matching the systems. Then, we calculated the total WLN matching index, agricultural WLN matching index, industrial WLN matching index, and domestic WLN matching index for all cities in the Huang-Huai-Hai River Basin according to the new evaluation method we proposed. We construct the comprehensive WLN evaluation method as follows:
where is the regional total WLN matching index, and is the total water resources in a region (m3), representing the total available surface water. is the total land area in a region (m2); is the regional agricultural WLN matching index; is the amount of water (m3) used for agriculture; is the area of farmland (m2); is the regional industrial WLN matching index, is the regional water consumption with ten thousand yuan of industrial added value (m3), is the land area of ten thousand yuan of industrial added value (m2); and represents the regional domestic WLN matching index. is the per capita domestic water consumption (m3), and is the per capita living area (m2). The values for , , and could be obtained from official publications as mentioned in Section 2.2 when there were measured. When there were no reference data in some years, they were calculated using the method described in detail in the following. The values for in different regions could be obtained in the data set mentioned in Section 2.2 using the original spatial statistical method in the ARCGIS platform. refers to the area of first primary type (arable land) of land use in Table 1, which included both paddy field and dry field, and the area of arable land in a region is calculated using an attribute table in ARCGIS. represents the 53rd most common land use type (other construction land) in Table 1 and refers to factories and mines, large industrial areas, oil fields, salt farms, quarries, and other land. Because almost all of the land in the 53rd type is used for industry development, we used to calculate . is ten thousand yuan of industrial added value (m2). is calculated by combining the 51th (urban land use) and 52th (rural settlements) since they reflect the land used by urban and rural residents. is the population of a region. , , , and need to be restored when there are no recorded data. In Section 2.2, we already obtained the precipitation data from 1951 to 2017 for 128 cities in the basin by IDW. The water yield coefficient reflects the ability of rainfall to generate water resources in a region, which is closely related to regional climate conditions and underlying surface conditions; therefore, instead of setting the water yield coefficient as a fixed value, we included the coefficient of water yield as a dynamic parameter in the calculation to reflect the impacts of climate change and human behavior on a water resource system. According to the regional similarity, the missing total water resources data of each provincial administrative region from 1985 to 2017 were interpolated by fitting with the sequence of neighboring provinces. Then, the available data on the total water resources of cities were fitted to the time series of their provinces to make up the missing data for each city from 1985 to 2017. The water yield coefficient (WYC) refers to the amount of gross water resources (i.e., the amount of surface water and groundwater that does not overlap with surface water generated by precipitation) in a region [32].Then, based on the precipitation data in Section 2.2, the water yield coefficients from 1985 to 2017 of all prefecture-level cities and their corresponding values of the three first-level resource regions in the Huang-Huai-Hai River Basin were calculated using Equation (7):
where WPC is water yield coefficient, is total amount of water resources, and P is precipitation [33,34].
The water yield coefficient has spatial similarity, so its change trend in small regions (provinces and cities) is theoretically similar to that in first-level water resource regions. Basing on the relationship, multiple linear were applied to extend the time series of the water yield coefficients for 128 prefecture-level cities from 1951 to 2017. Different function fitting models were built in MATLAB according to the different data characteristics of the different cities. All errors are controlled within 10% (the errors here do not include the errors generated in data measurement, and all measured data are true data by default). Then, base on the calculated precipitation data, the total water resources (all available surface water) for the 128 cities in the basin could be obtained by the Equation (8)
Based on the trend of proportional relationships between the water consumption for different uses and the restored total water resources data for 1980–2017, the water consumption for different uses of the 128 cities from 1951 to 1980 were obtained by trend and regression analysis. We obtained the total water resources, total water consumption, agricultural water consumption, industrial water consumption, and domestic water consumption data for 128 prefecture-level cities in the Huang-Huai-Hai River Basin from 1951 to 2017.
2.3.2. Land Use Data Analysis Method
In this study, we used the importance index of land use change and the proportion of land use change area to described the land use type and area change characteristics for all the provinces and cities in the Huang-Huai-Hai River Basin from 1980 to 2015. These indexes can be calculated by the following method in Equations (9)–(16).
The importance index of land use change can be expressed as :
where is the changed area of land in category i and is the sum of all types of land change area. Then, in
is the proportion of changed land use in the total area, which reflects the intensity of land use changes in the region. is the total area of the region.
The conversion process of land use types in different periods was identified by calculating the land use transfer matrix. The land use transfer matrix was calculated as follows Equations (12)–(16):
where n represents the number of land types, is the area of type j land use at time T2, is the area of i-th type land use converted to j-th land use type from time T1 to T2, is the area of i-th land use type at T1, the diagonal element is the area of i-th land use type that remains unchanged from T1 to T2, is the area that is converted from other land use types to type j-th land use from T1 to T2, is the area of other land use types converted to type j land use from T1 to T2, is the area of j-th land use type that remains unchanged from T1 to T2, is the area of i-th land use type at T2, and is the net change area from T1 to T2 of the i-th land use type. The total change area of i-th land use can be expressed as as the follow Equation (17):
where is the area of other land use types that is converted to type i from T1 to T2 [35,36,37]. Particularly, in order to calculate and analyze the spatial change of the matching index of WLN every 10 years, the land use data for each city from 1980 to 2017 needed to be extended to 1951. Due to the lack of a baseline for the time-series data, we assumed that the land uses in the 128 prefecture-level cities in the Huang-Huai-Hai River Basin from 1951 to 1980 were consistent with the actual data in 1980.
2.3.3. Trend Analysis Method
The Mann-Kendall test has been widely used in time-series studies due to its advantages for trend analysis [38,39,40]. The nonparametric Mann-Kendall test (Mann, 1945; Kendall, 1975) was applied to detect the overall change trend (ZMK) and the average rate of change for the hydrological time-series data [41]. As an effective supplement to the MK trend test, Theil-Sen’s method was used to characterize the overall degree of change in each time series by calculating the Kendall slope β value. The greater the value of β, the greater the degree of change in the time series, and β can be calculated with the following formula:
Herein, represents the median function and and represent sequence values, respectively, and this equation should satisfy the condition that . When β is greater than 0, the sequence has an upward trend; otherwise it has a downward trend [42].
This study was intended to use the MK test and β value to reflect the changes in the time series from the perspective of whether a series has a significant change trend and its overall degree of change.
2.3.4. Correlation and Regression Analysis
Correlation performs a vital part in statistics and engineering; through correlation analysis, the relationship between two variables can be used to evaluate the interdependence of two variables [43]. We used the method of correlation analysis to redefine the relationships of two time series to restore them. Regression analysis is a set of statistical methods used for the estimation of relationships between a dependent variable and one or more independent variables. It can be utilized to assess the strength of the relationships between variables and for modeling the future relationships between them. The role played by regression analysis in data science cannot be overemphasized: Predicting a continuous target is a pervasive task not only in practical terms but also at a conceptual level [44,45]. Based on its characteristics, regression could be used to restore time series. To restore time series, linear regression and nonlinear regression were performed in this study to identify the correlations between different related factors, such as the water yield coefficients for the three first-level regions and the 128 cities in the Huang-Huai-Hai River Basin. The missing time-series data could be restored based on their correlations with another related complete time sequence. Various models of linear regression and nonlinear regression were applied in the water resources quantity estimation. The relative error is controlled within 10%.
3. Results
3.1. The Variation Characteristics of Water Resources in the Huang-Huai-Hai River Basin
3.1.1. The Temporal Changes in Water Resources in the Huang-Huai-Hai River Basin
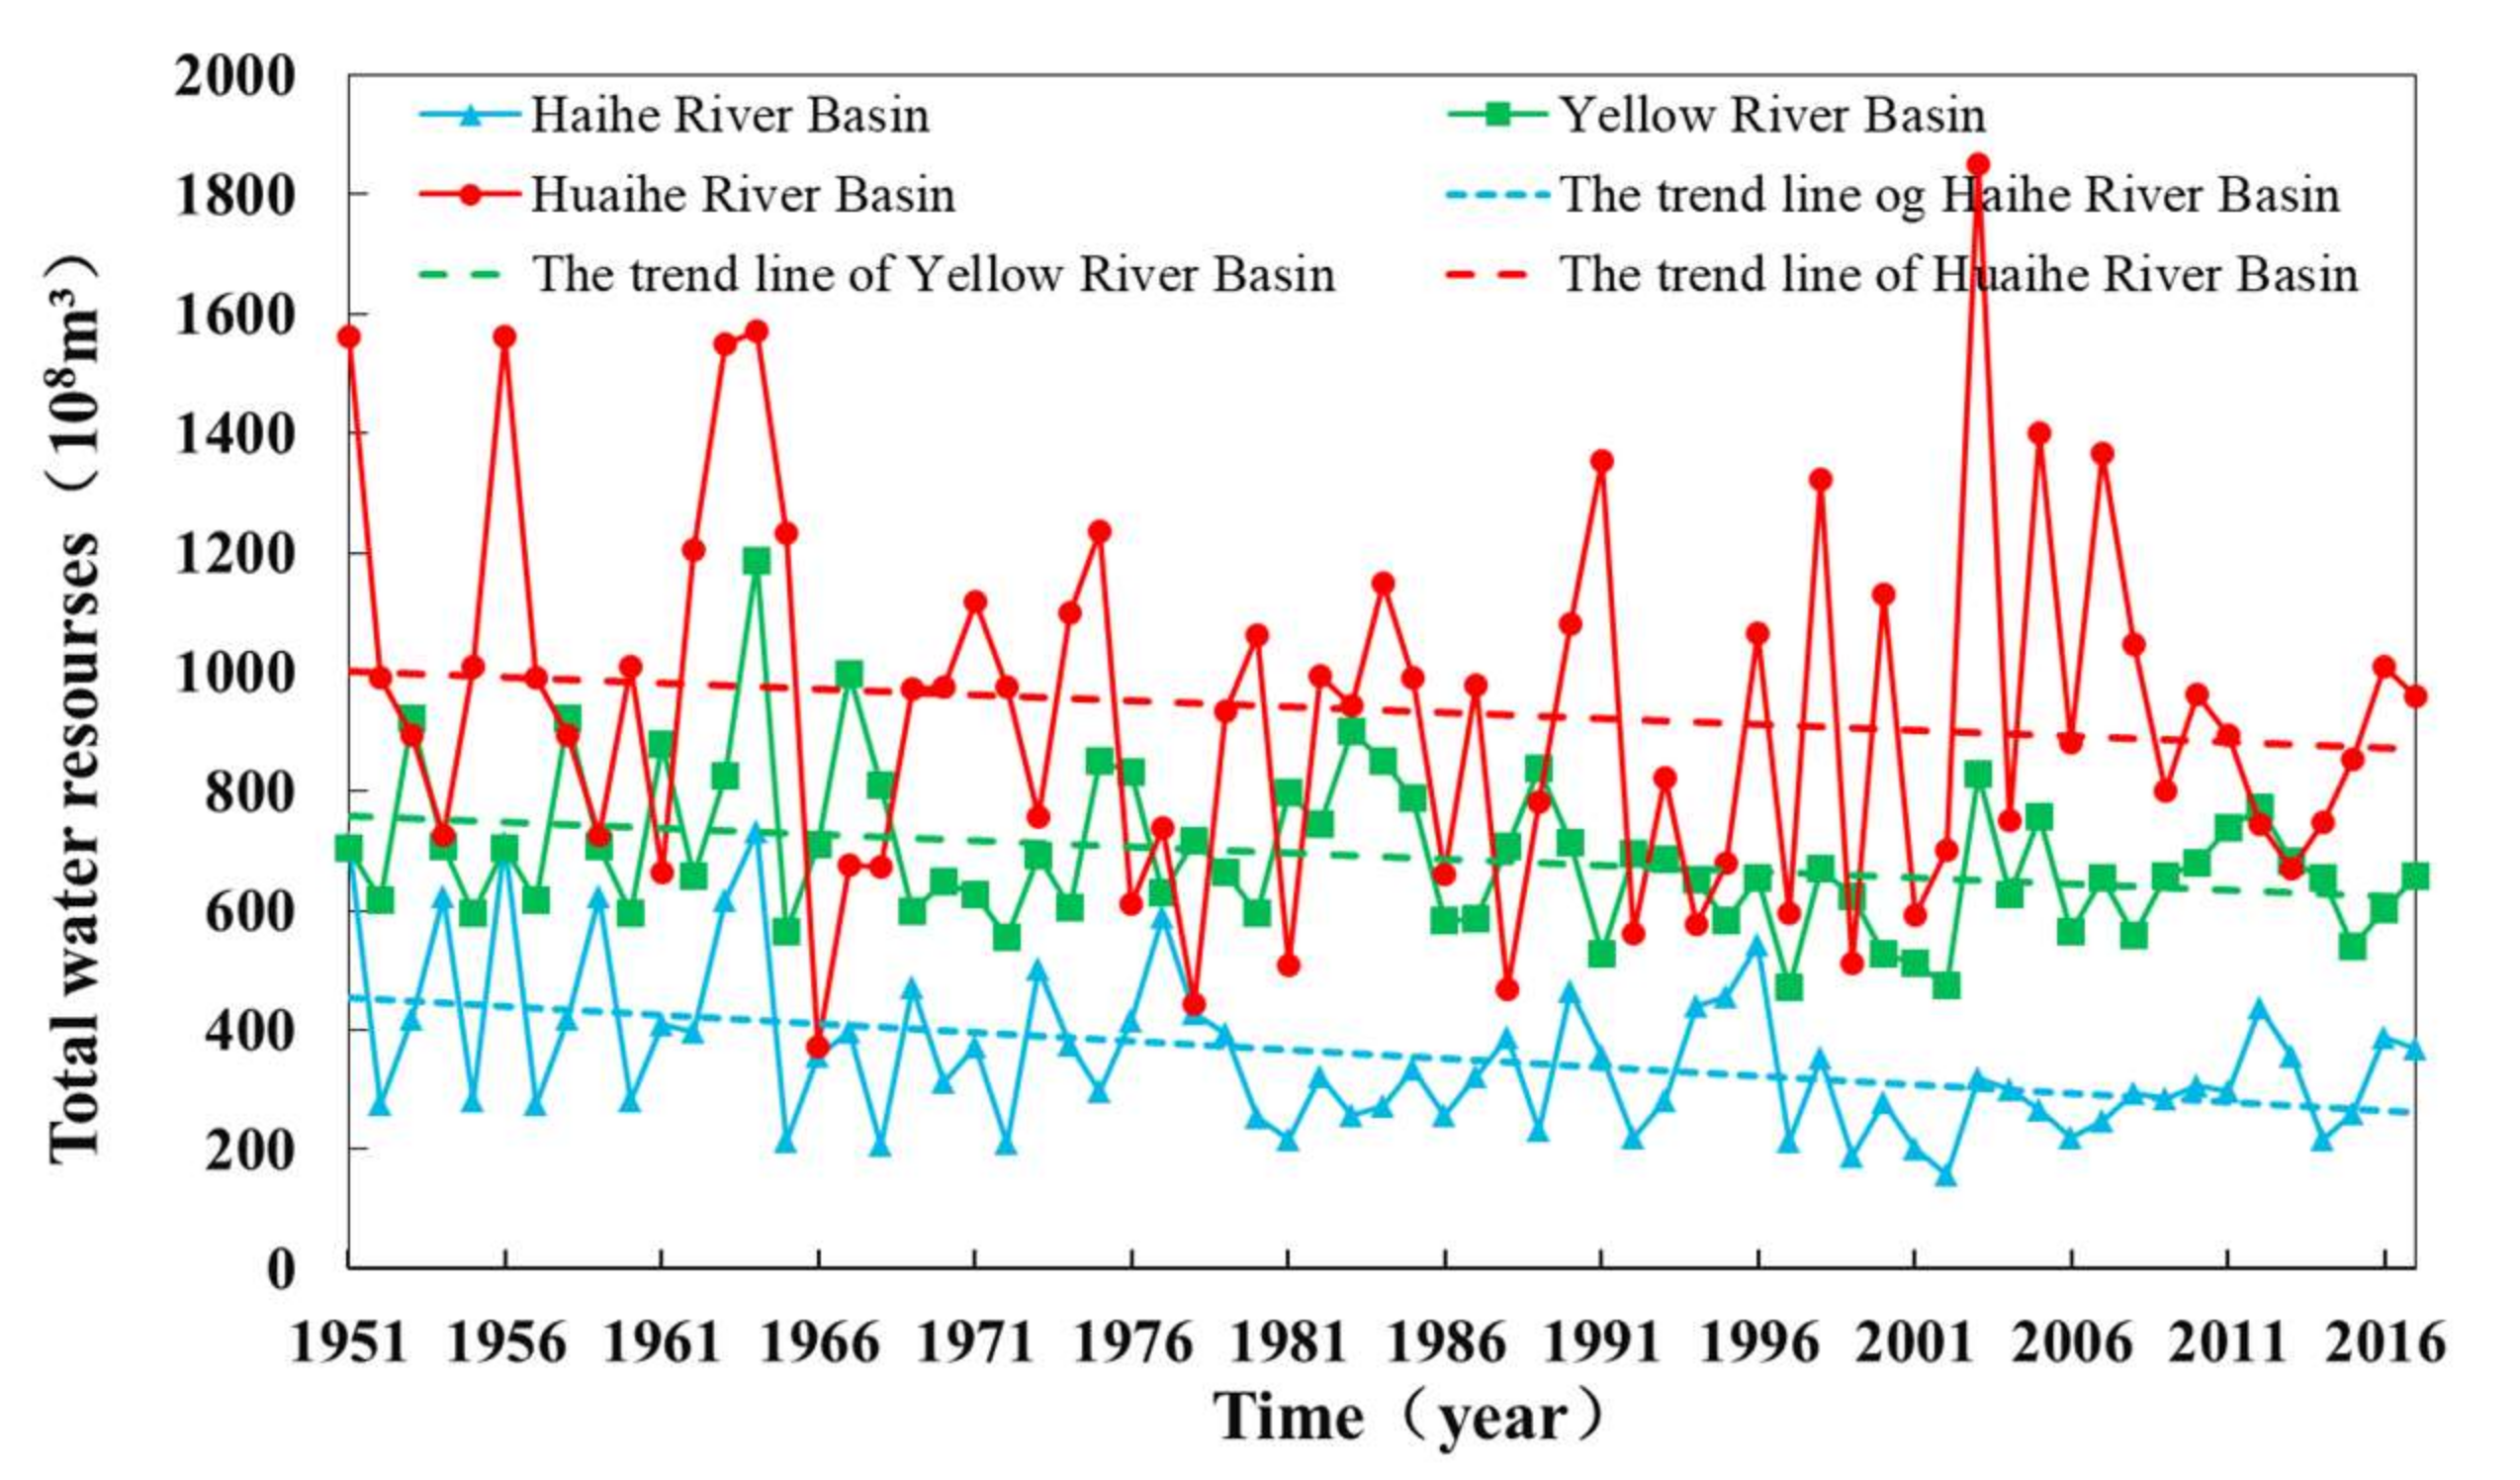
The temporal changes in the total water resources, which means the available surface water in the three first-level regions in the Huang-Huai-Hai River Basin during 1951–2017, are illustrated in Figure 1. Among the regions, the Huaihe River region has the largest annual average water resources with about 92.85 billion m3, followed by the Yellow River region, and Haihe River region, with values of 69.26 billion m3 and 34.86 billion m3, respectively. The total water resources of the Haihe River region showed the most significant decreasing trend (p < 0.01), with a trend slope of −2.6, followed by the Yellow River region with a trend slope of −2.08. The water resources of the Huaihe River region changed slightly with no significant trend (Figure 2).
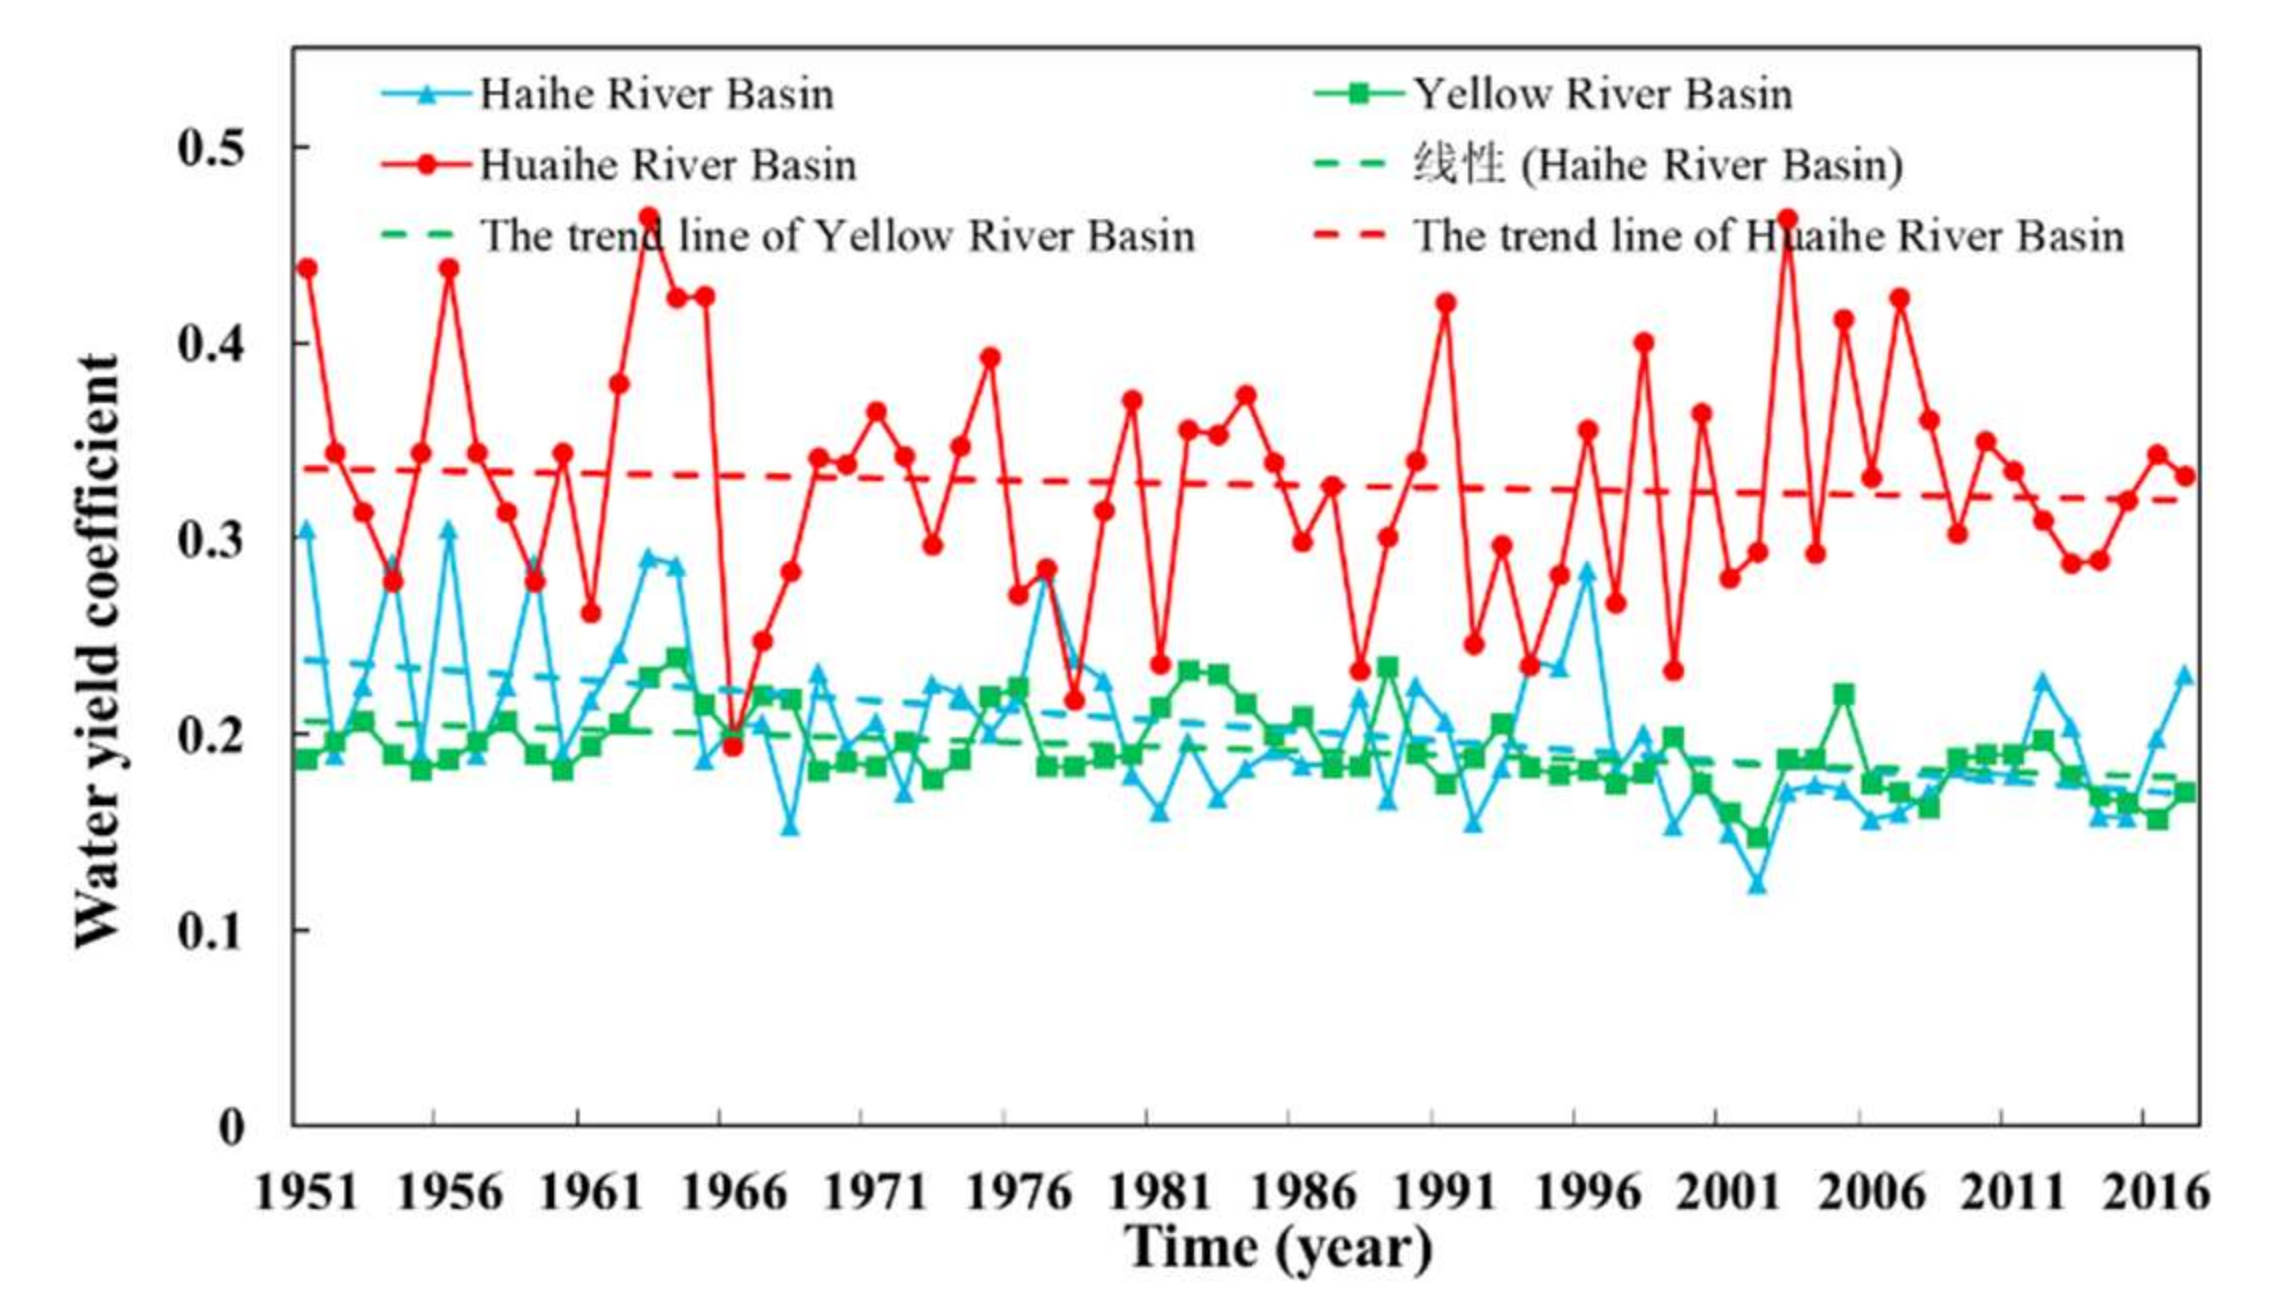
As shown in Figure 3, the change in the water yield coefficient in the Yellow River region could be roughly divided into two stages. It fluctuated above the mean value in 10-year cycles from 1951 to 1990, and it decreased to fluctuate below the mean after 1990. The water yield coefficient in the Huaihe River region changed a lot. Before the 1990s, the variation was similar to that in the Yellow River region, but after that, the fluctuated cycle became longer, and it fluctuated near the mean. The decrease in the water yield coefficient in the Haihe River area is the most obvious, with a sharp decline since the beginning of the 21st century. According to the average water yield coefficient during 1951–2017, the Huaihe River region is the largest (0.33), followed by the Yellow River region and the Haihe River region with the values of 0.19 and 0.20, respectively. The water yield coefficient reflects the potential of precipitation to transform into water resources and a region’s water yield capacity [22]. So, these results indicated that among the three regions, the Huaihe River region has the most powerful water yield capacity with the highest average water yield coefficient. However, the capacity is not stable since the water yield coefficient in the Huaihe River region changed regularly throughout 1951–2017. The Yellow River region has the weakest water production capacity, and it has been decreasing since 1990, mainly due to the increase in intensive human activities.
3.1.2. The Spatial Characteristics of Water Resources in the Huang-Huai-Hai River Basin
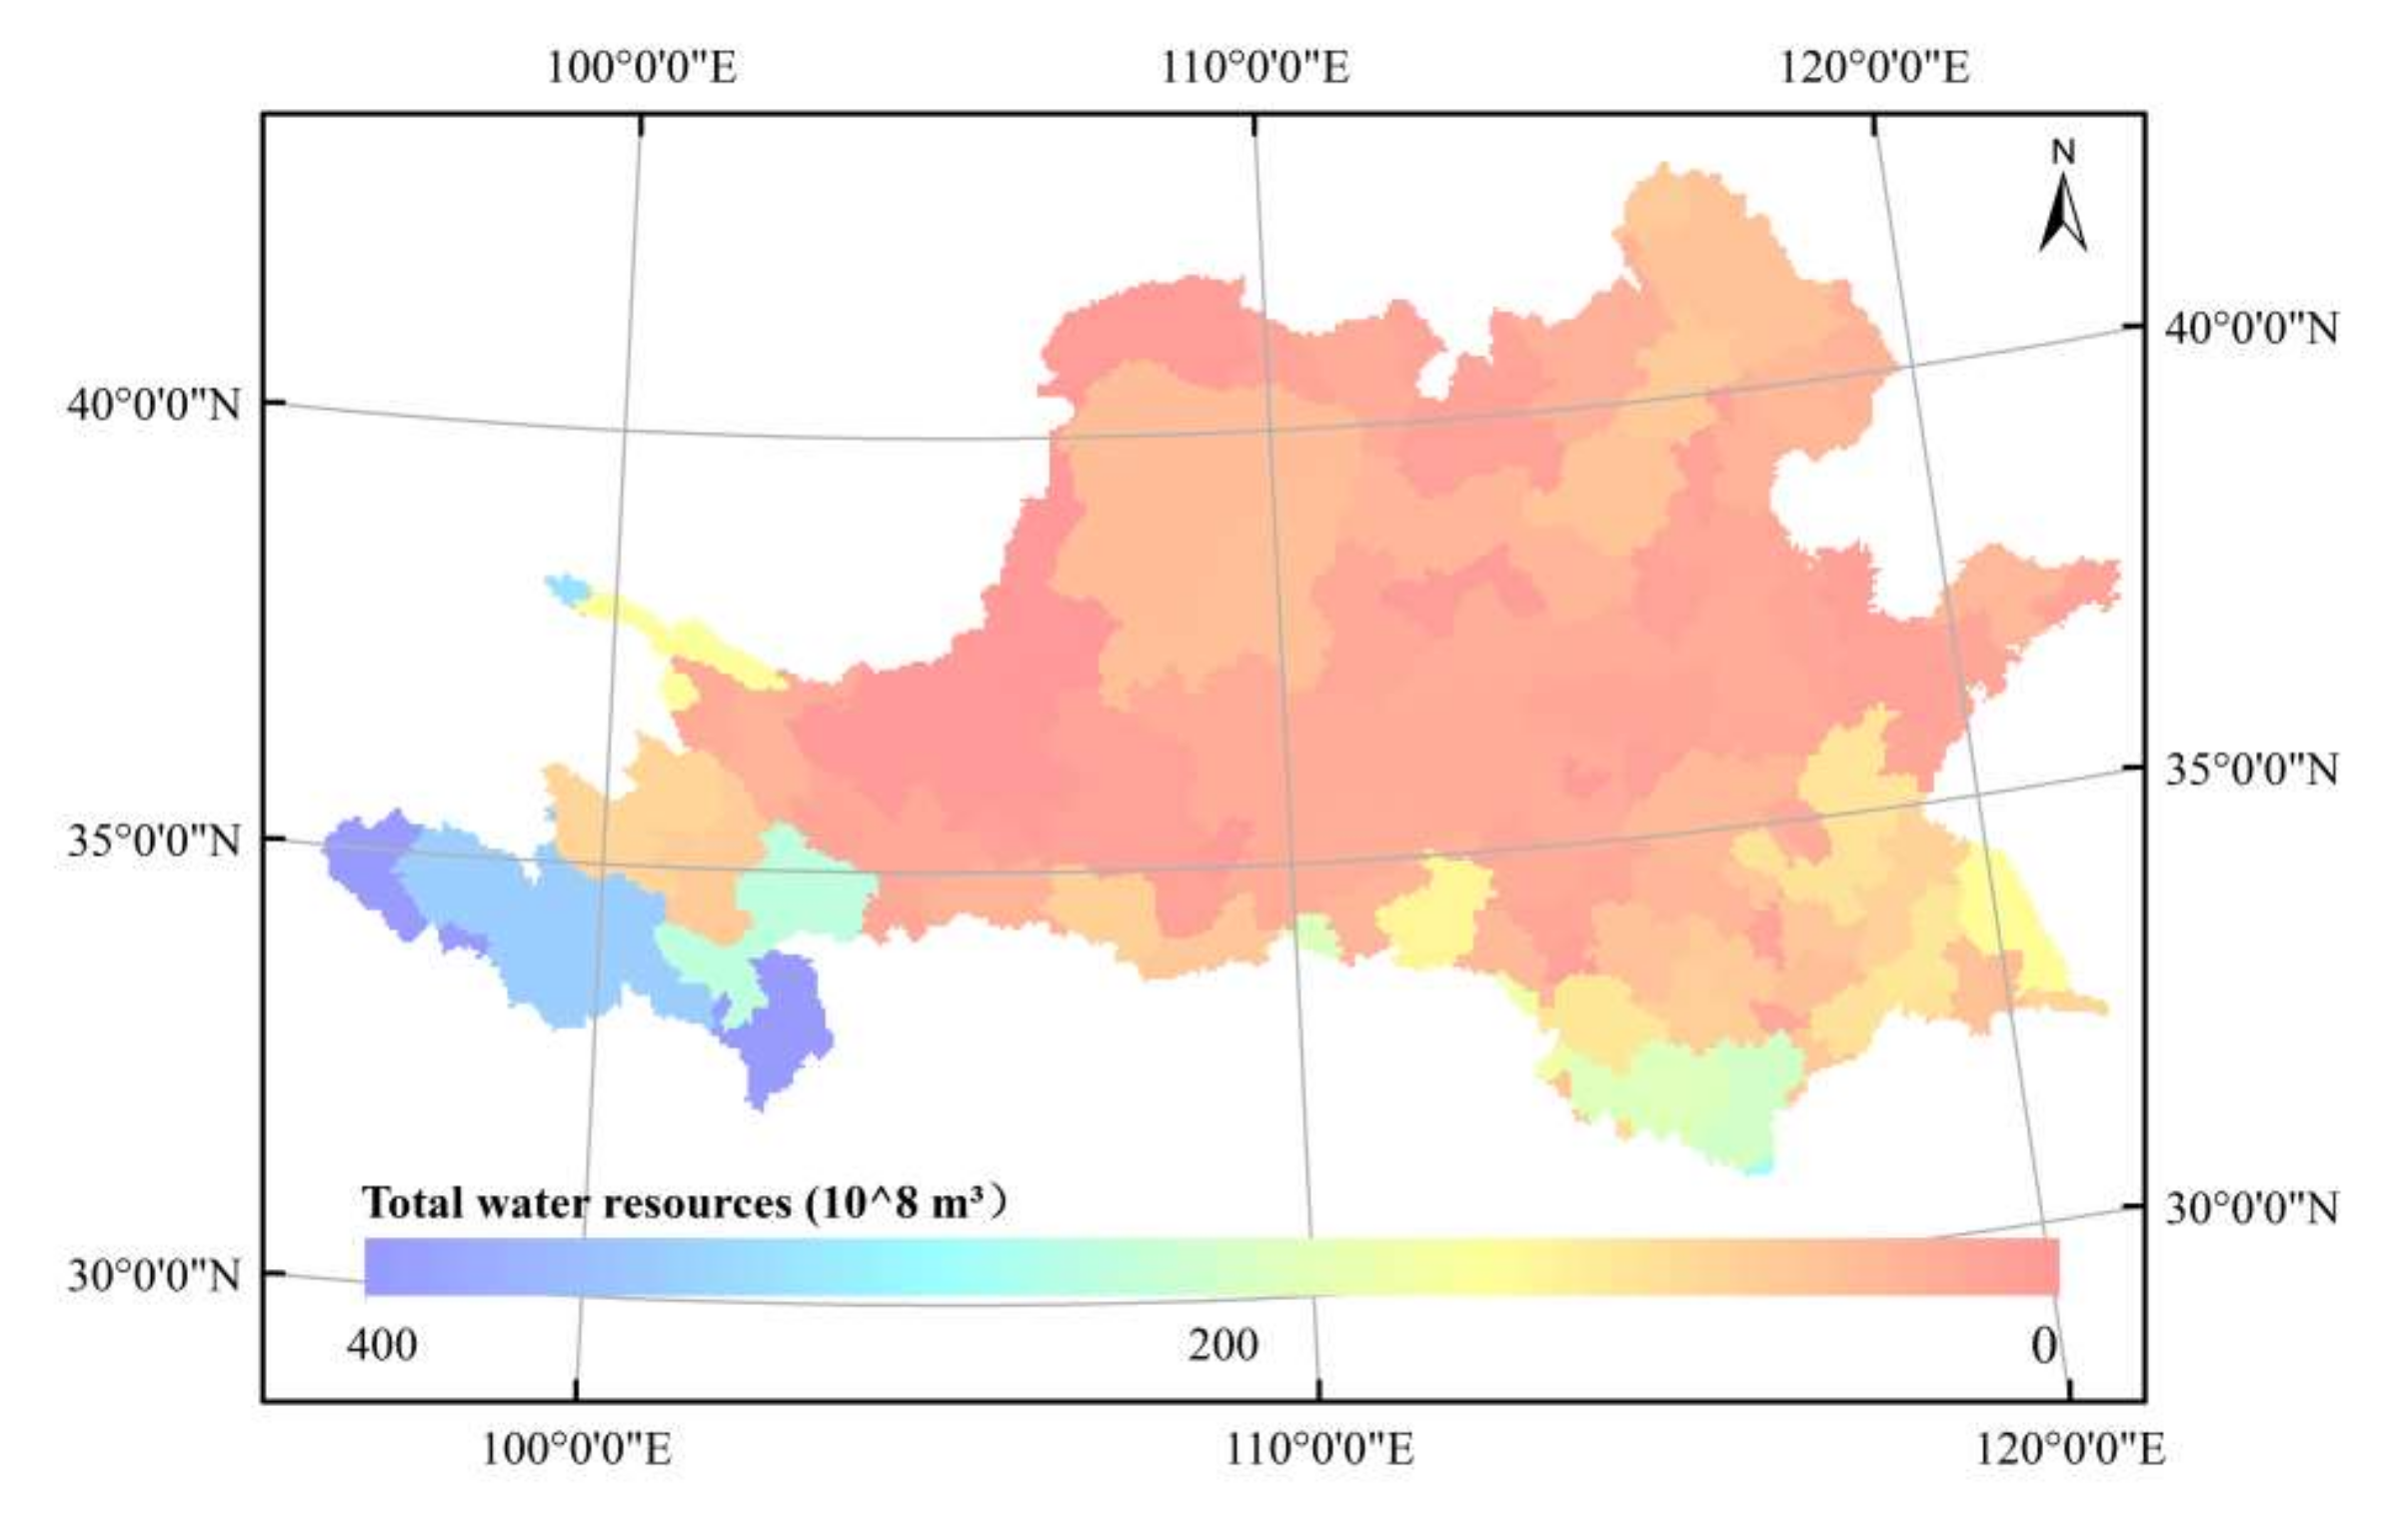
The annual averages of the total water resources for each city are presented in Figure 4. It reflects the natural water resource endowment of each city. On the whole, the cities in the south of the basin have more total water resources than those in the north. The cities with abundant total water resources were concentrated mainly in the southwest of the basin, such as in Aba Tibetan and the Qiang Autonomous Prefecture, which have the highest average annual water resources (39.95 billion m3, 39.02 billion m3). In contrast, the water resources in the northwest cities of the basin are scarce, such as Wuhai (0.03 billion m3), which accounts for only 1.06% of the average for all cities.
3.2. The Variation Characteristics of Land Use in the Huang-Huai-Hai River Basin
Based on the interpretation of the original remote sensing data, the distribution maps of land use types in different years were analyzed by geostatistical methods for the six periods (1980–1990, 1990–1995, 1995–2000, 2000–2005, 2005–2010, 2010–2015). We calculated the area of various types of land use and explored the change law of the land use of the river basin. To further analyze the changes in regional cultivated land types and the corresponding adjustments of the agricultural planting structure, the cultivated land was divided into paddy fields and dry fields. There were no separate statistics available for land use types in the basin that accounted for less than 5%, so only the changes in the main six land use types were analyzed.
3.2.1. The Temporal Changes in Land Use in the Huang-Huai-Hai River Basin
Table 2 summarizes the area of different land use types in the Huang-Huai-Hai River Basin from 1980 to 2015.The areas of urban land, other construction land, rural residential land, and forest have expanded. Among them, the area of urban land has increased the most, accounting for 11,522 km2. On the other hand, the areas of paddy fields, dry land, grassland, unused lands and water body have decreased. The area of dry land has decreased the most, accounting for 14,764 km2.
Then, the type and area change characteristics of land use for all the provinces and cities in the Huang-Huai-Hai River Basin from 1980 to 2015 were explored according to the method in Section 2.3.3. The D values of all the provinces and cities in the basin from 1980 to 2015 show the regional differences, and they also exhibit the similarity and regularity in neighboring provinces. The most significant change in land use in this basin happened from 1990 to 1995: nine provinces had significant changes in land use during this period. This rapid change may be due to the exclusively urban construction brought by the urbanization in the basin at that time.
3.2.2. The Spatial Characteristics of Land Use in Huang-Huai-Hai River Basin
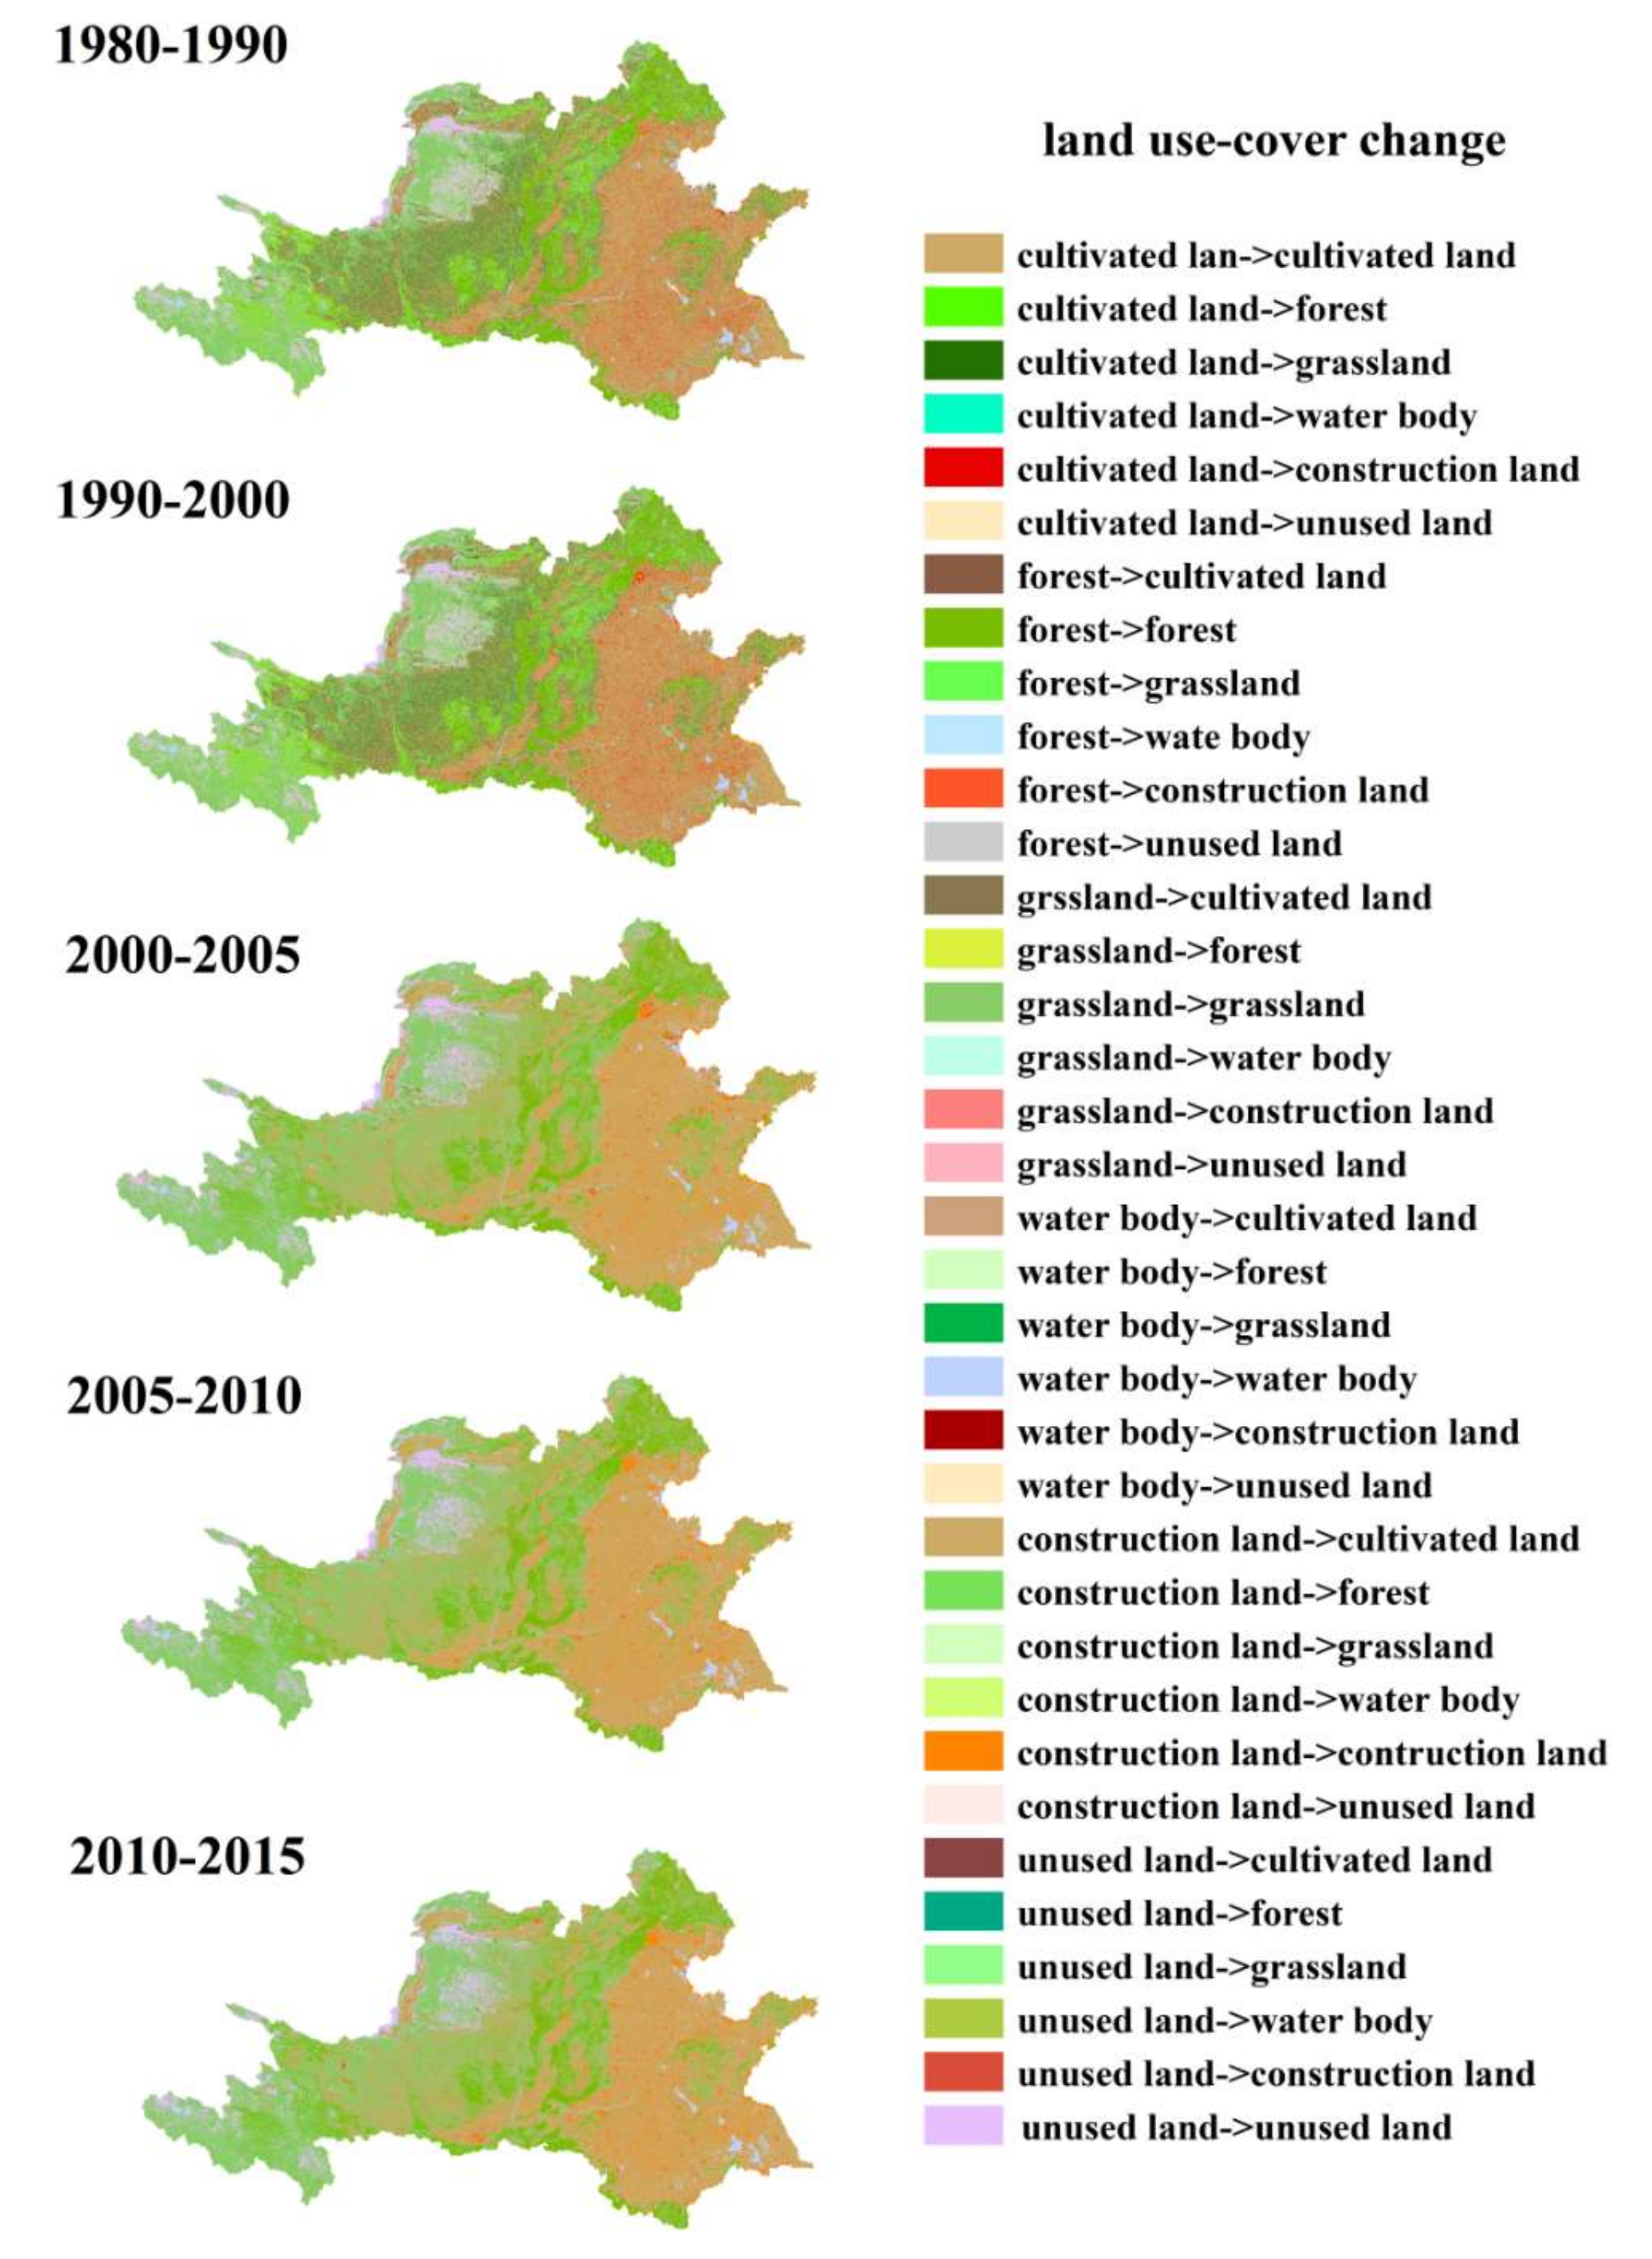
Based on the data on land use types in six periods from 1980 to 2015, the spatial distribution maps of land transformation in each period were obtained using the geospatial data statistics and calculation analysis in pairs in adjacent years. The changes in the spatial characteristics of land use in the periods 1990–1995 and 1995–2000 were inconspicuous, so they were combined into one period. According to Figure 5, the areas of cultivated land, forest, unused land, and grassland were mainly converted to construction land in the eastern part of the basin during 1980–2000, though this transformation trend decreased slightly in the later 15 years; parts of the cultivated land and grassland were also gradually converted to water body area. From 1980 to 2000, the rates of transformation of cultivated land to forest and grassland in the western part of the basin were higher than the rates in the other period. The areas of unused land such as sandy land, gobi land, and saline-alkali land in the northwest of the basin are decreasing gradually. On the whole, the other types of land were mainly converted to construction land in the east of the basin, and the other types were mainly converted to forest and grass land in the west.
3.3. The Spatiotemporal Dynamic Changes in WLN Matching Patterns in the Huang-Huai-Hai River Basin
3.3.1. The Dynamic Spatiotemporal Changes in the Total WLN Matching Index among Provinces and Cities in the Huang-Huai-Hai River Basin
The total WLN matching index reflects the natural endowment of regional water and land. In general, the higher the total matching index is, the better the matching conditions of water and land resources in the region are, and a higher index is more conducive to the sustainable development of the region. The total WLN matching indexes for the 128 prefecture-level cities in the Huang-Huai-Hai River Basin during 1951–2017 are shown in Figure 6.
As shown in Figure 5 the total matching index of water and land resources in the basin gradually increases from the northwest to the southeast. The nine cities in the Inner Mongolia Autonomous Region and the five cities in the Ningxia Hui Autonomous Region, which are located in the northwest corner of the basin, have low total WLN matching indexes, which means their water and land resource endowments are poor, which could restrict their economic and social development. In particular, the Alxa League in the Inner Mongolia Autonomous Region has the lowest total water–land nexus matching index for many years, about 1.14 cubic meters per square kilometer. On the contrary, some cities in Jiangsu, Anhui, and Hubei provinces, located in the southeast corner of the basin, have higher total WLN matching indexes. The matching of water and land resources in these cities are more suitable for supporting sustainable social development. In this area, Anqing City in Anhui Province has the highest total WLN matching index with a multiyear average of about 826.62 cubic meters per square kilometer; the total WLN matching index in the Alxa League differs by more than 800 times. It can be seen that the endowments of water and land resources in the different regions in the basin are very different. From the perspective of time, the total matching indexes of the cities along the border of the basin have declined during 1951–2017, while the cities located in the middle of the basin have clearly increased.
3.3.2. The Spatiotemporal Dynamic Changes in the Different Sectors’ WLN Matching Indexes for the Provinces and Cities in the Huang-Huai-Hai River Basin
From the perspective of the overall spatial distribution characteristics of the agricultural WLN matching index in each period (Figure 7a), the matching index is higher in the south and lower in the north. It is significantly higher in the southwest and southeast corners of the basin than other areas, which reflects that the match between agricultural water resources and land resources is more helpful for agricultural development in these regions. In contrast, the cities in the northwest corner of the basin have the smallest agricultural WLN matching indexes, which reflects the restricted water and land resources for agricultural development in these cities. The area with low agricultural WLN matching indexes decreased consistently, which reflected the overall improvements in the matching conditions for crop cultivation in these cities. In Jiangsu and Anhui provinces, where the total WLN matching indexes are relatively high, the matching index for agriculture decreased gradually from the north to the south in recent years. Comparing Figure 7 and Figure 6, it can be seen that the spatial distribution of the agricultural WLN matching index in the basin is similar to the total WLN matching index. However, some cities in Shanxi Province and Inner Mongolia have low total WLN matching indexes but high agriculture WLN matching indexes, which shows that there would be excessive proportions of agricultural water use in these areas.
In each period (Figure 7b), the industrial WLN matching indexes are higher in the cities in the east and south. They are also higher in the industrial cities, such as in southern Henan, Hubei, and Anhui provinces. Comparing Figure 7b with Figure 6, it can be seen that in general, the higher a city’s total WLN matching index, the higher its industrial WLN matching index. However, there are also some special regions. For example, the two cities in Liaoning Province have poor total WLN matching index, while the industrial WLN matching indexes are high. These findings indicate that these cities might exceed their water resource supplies for industry development; the structure for industrial water use might be unreasonable and wasteful. Before 1980, the industrial WLN matching indexes in most regions of the basin were low, but then increased rapidly. The increase was mainly due to the low level of industrial development in China before 1980. After the reform and opening up in 1978, industry developed rapidly, and the industrial output has continued to increase. Hence, after 1980, the areas with high industrial WLN matching indexes gradually mapped from the southeast to most of the eastern regions of the basin except for some cities in the Shandong Peninsula. The industrial WLN matching index in the northwestern part of the basin is limited by its resource endowments.
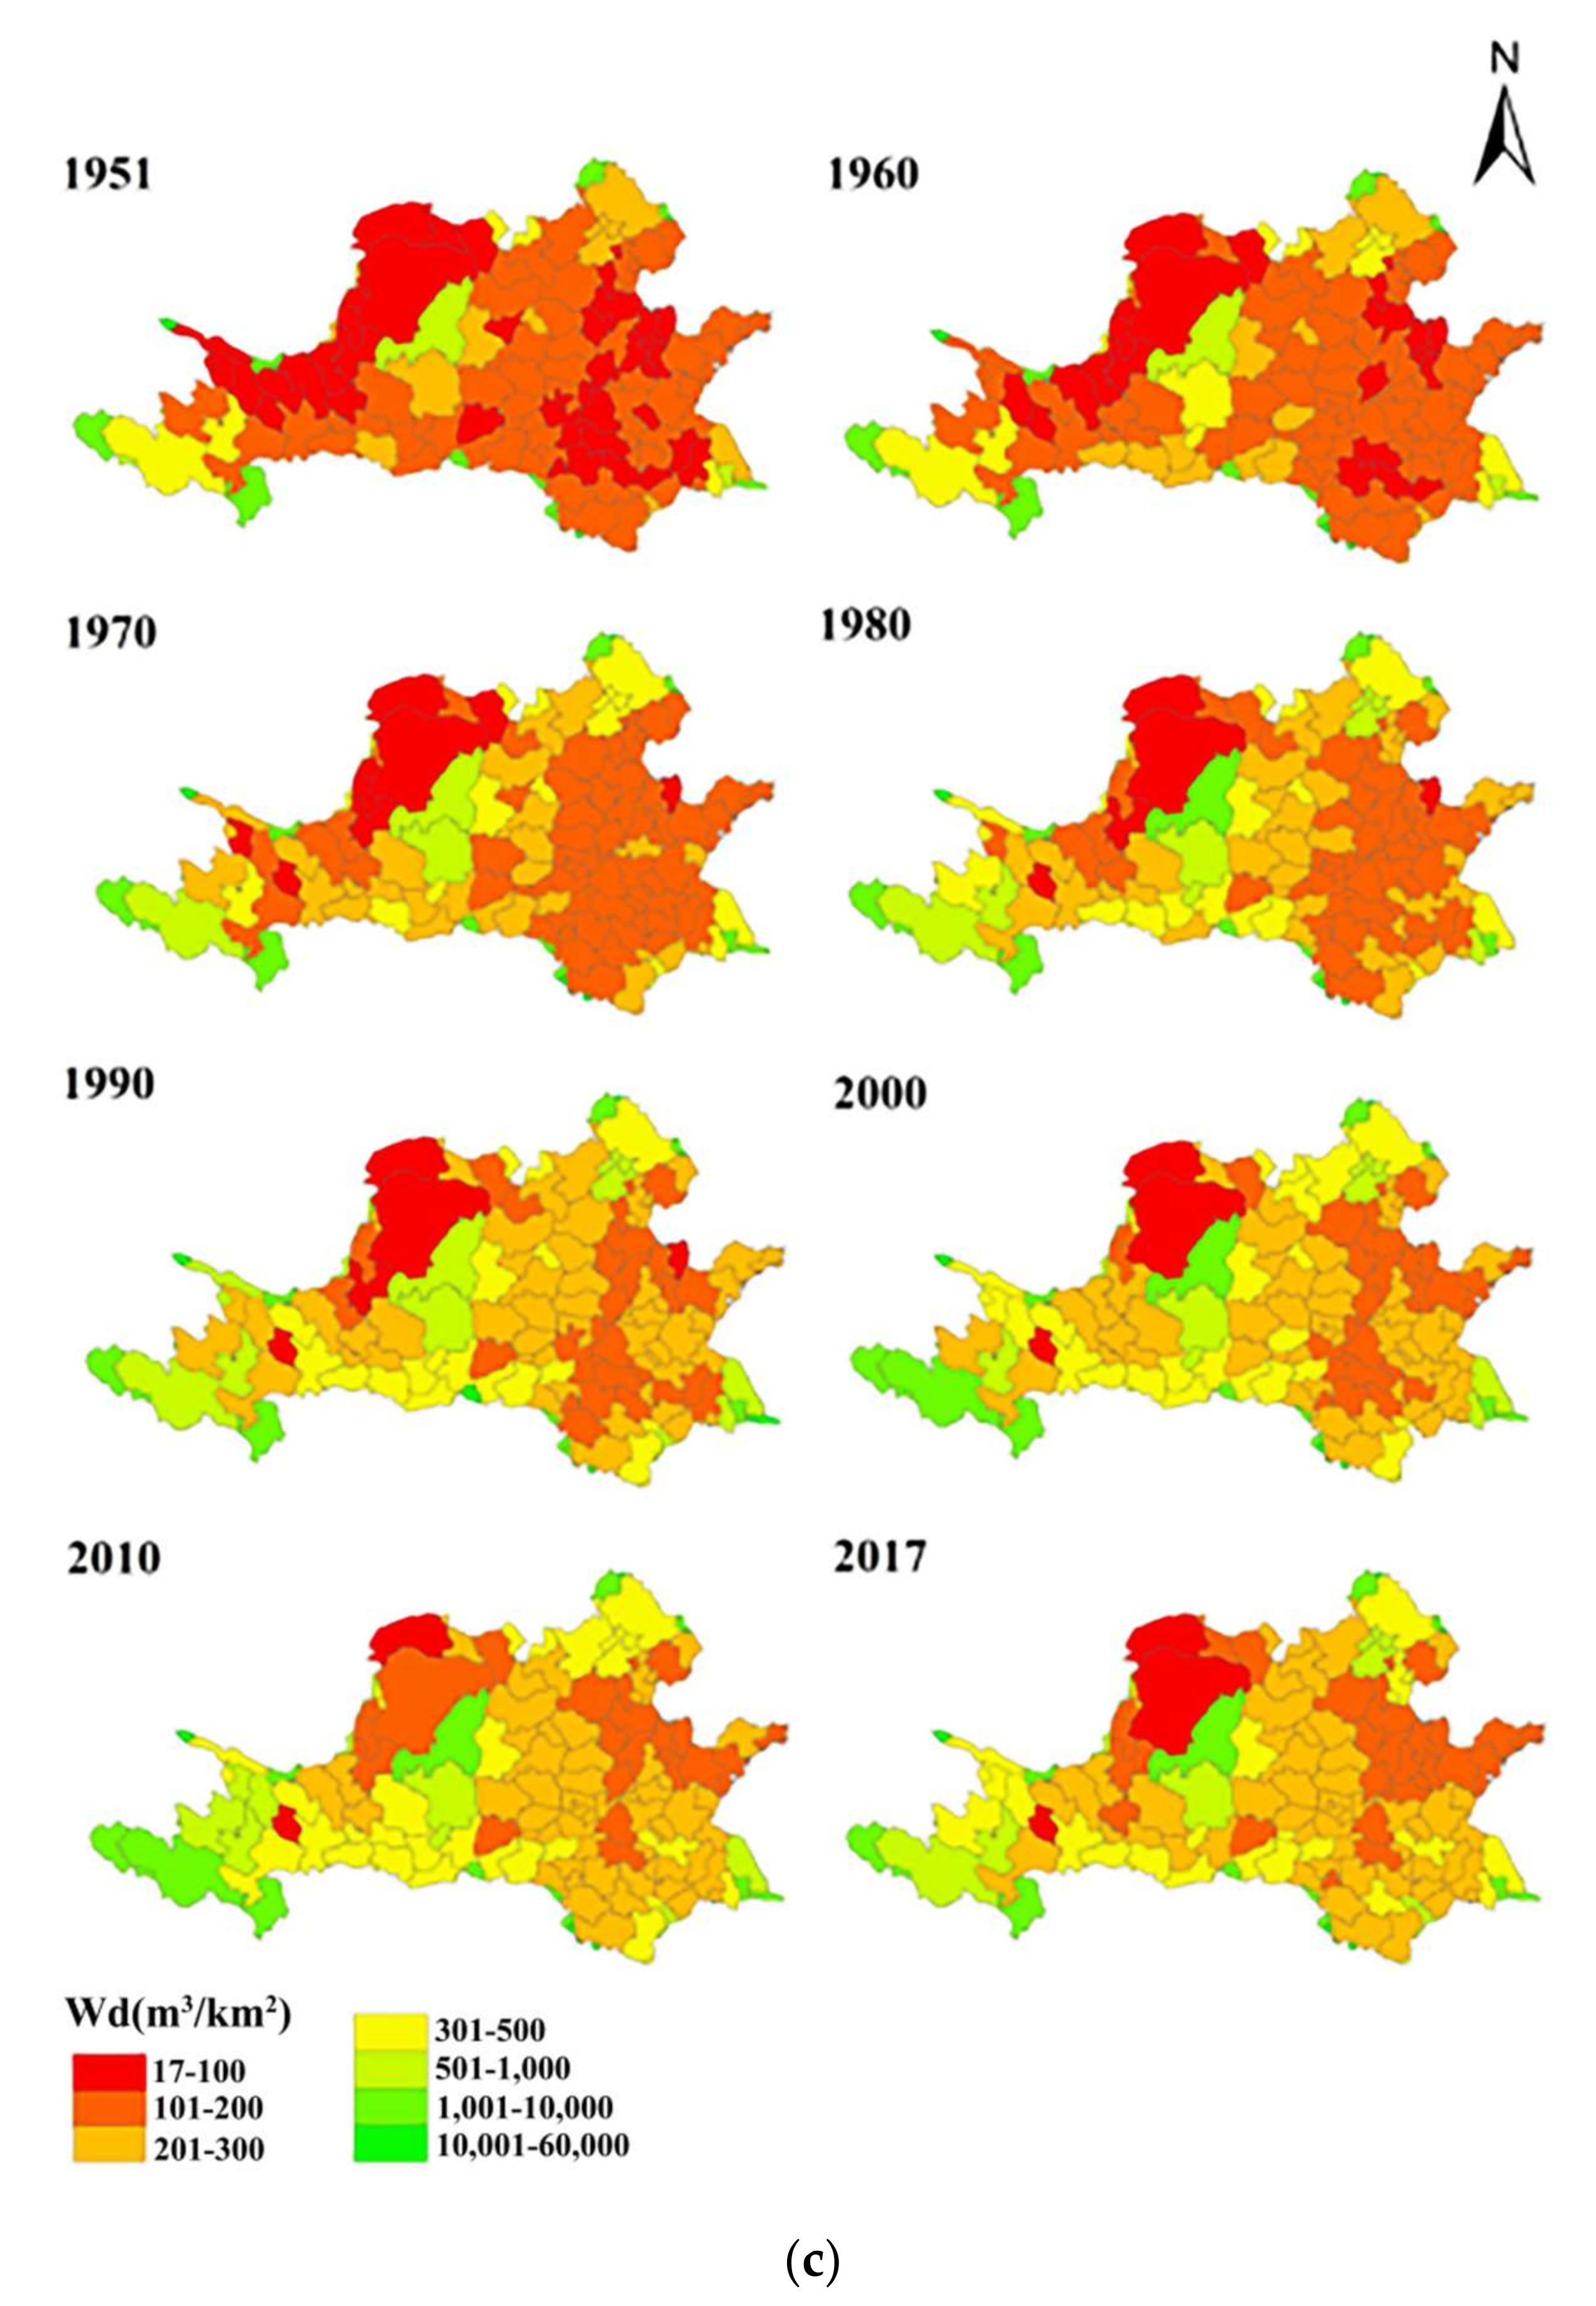
According to the spatial distribution of the domestic land WLN matching indexes in each period (Figure 7c), there are generally two living water-deficient zones. One living water-deficient zone is located in the northwest corner of the basin with a multiyear average of 35.34 mm. The second water-deficient zone is located in the middle and east of the basin, extending from Hebei Province to the southwest at a 45-degree angle. The matching state of domestic WLN extensively influences people’s healthy lives, so it is necessary to strengthen the protection and guarantee of water resources for the areas with low matching domestic WLN indexes such as Ningxia Hui Autonomous Region and Gansu Province, where the domestic WLN matching index is far below the national average, which brings great inconvenience to the lives of local people. The domestic WLN matching index in the northwestern part of the basin is highly consistent with the total WLN matching index, but there are big differences between them in other areas of the basin. Beijing, Tianjin, and Hebei Province have low total WLN matching indexes, but they have high domestic WLN matching indexes. This is mainly because these areas are important political, economic, and cultural centers of the basin with dense populations. Therefore, it is necessary to increase the protection of the domestic water and land resources in this area. During 1951–2017, the areas with high domestic WLN matching indexes in the whole basin have gradually increased as a whole. The domestic WLN matching indexes in the coastal cities of Shandong Peninsula improved after 1980. Conversely, the living water-deficient areas in the northwest corner of the basin gradually expanded. After 1980, cities such as Lanzhou and Dingxi in Gansu Province transformed into living water-deficient areas. Comparison with Figure 6 shows that the industrial water use in these cities may squeeze out domestic water to a certain extent.
3.4. The Dynamic Driving Factors of the Changes in WLN Matching Patterns in the Huang-Huai-Hai River Basin
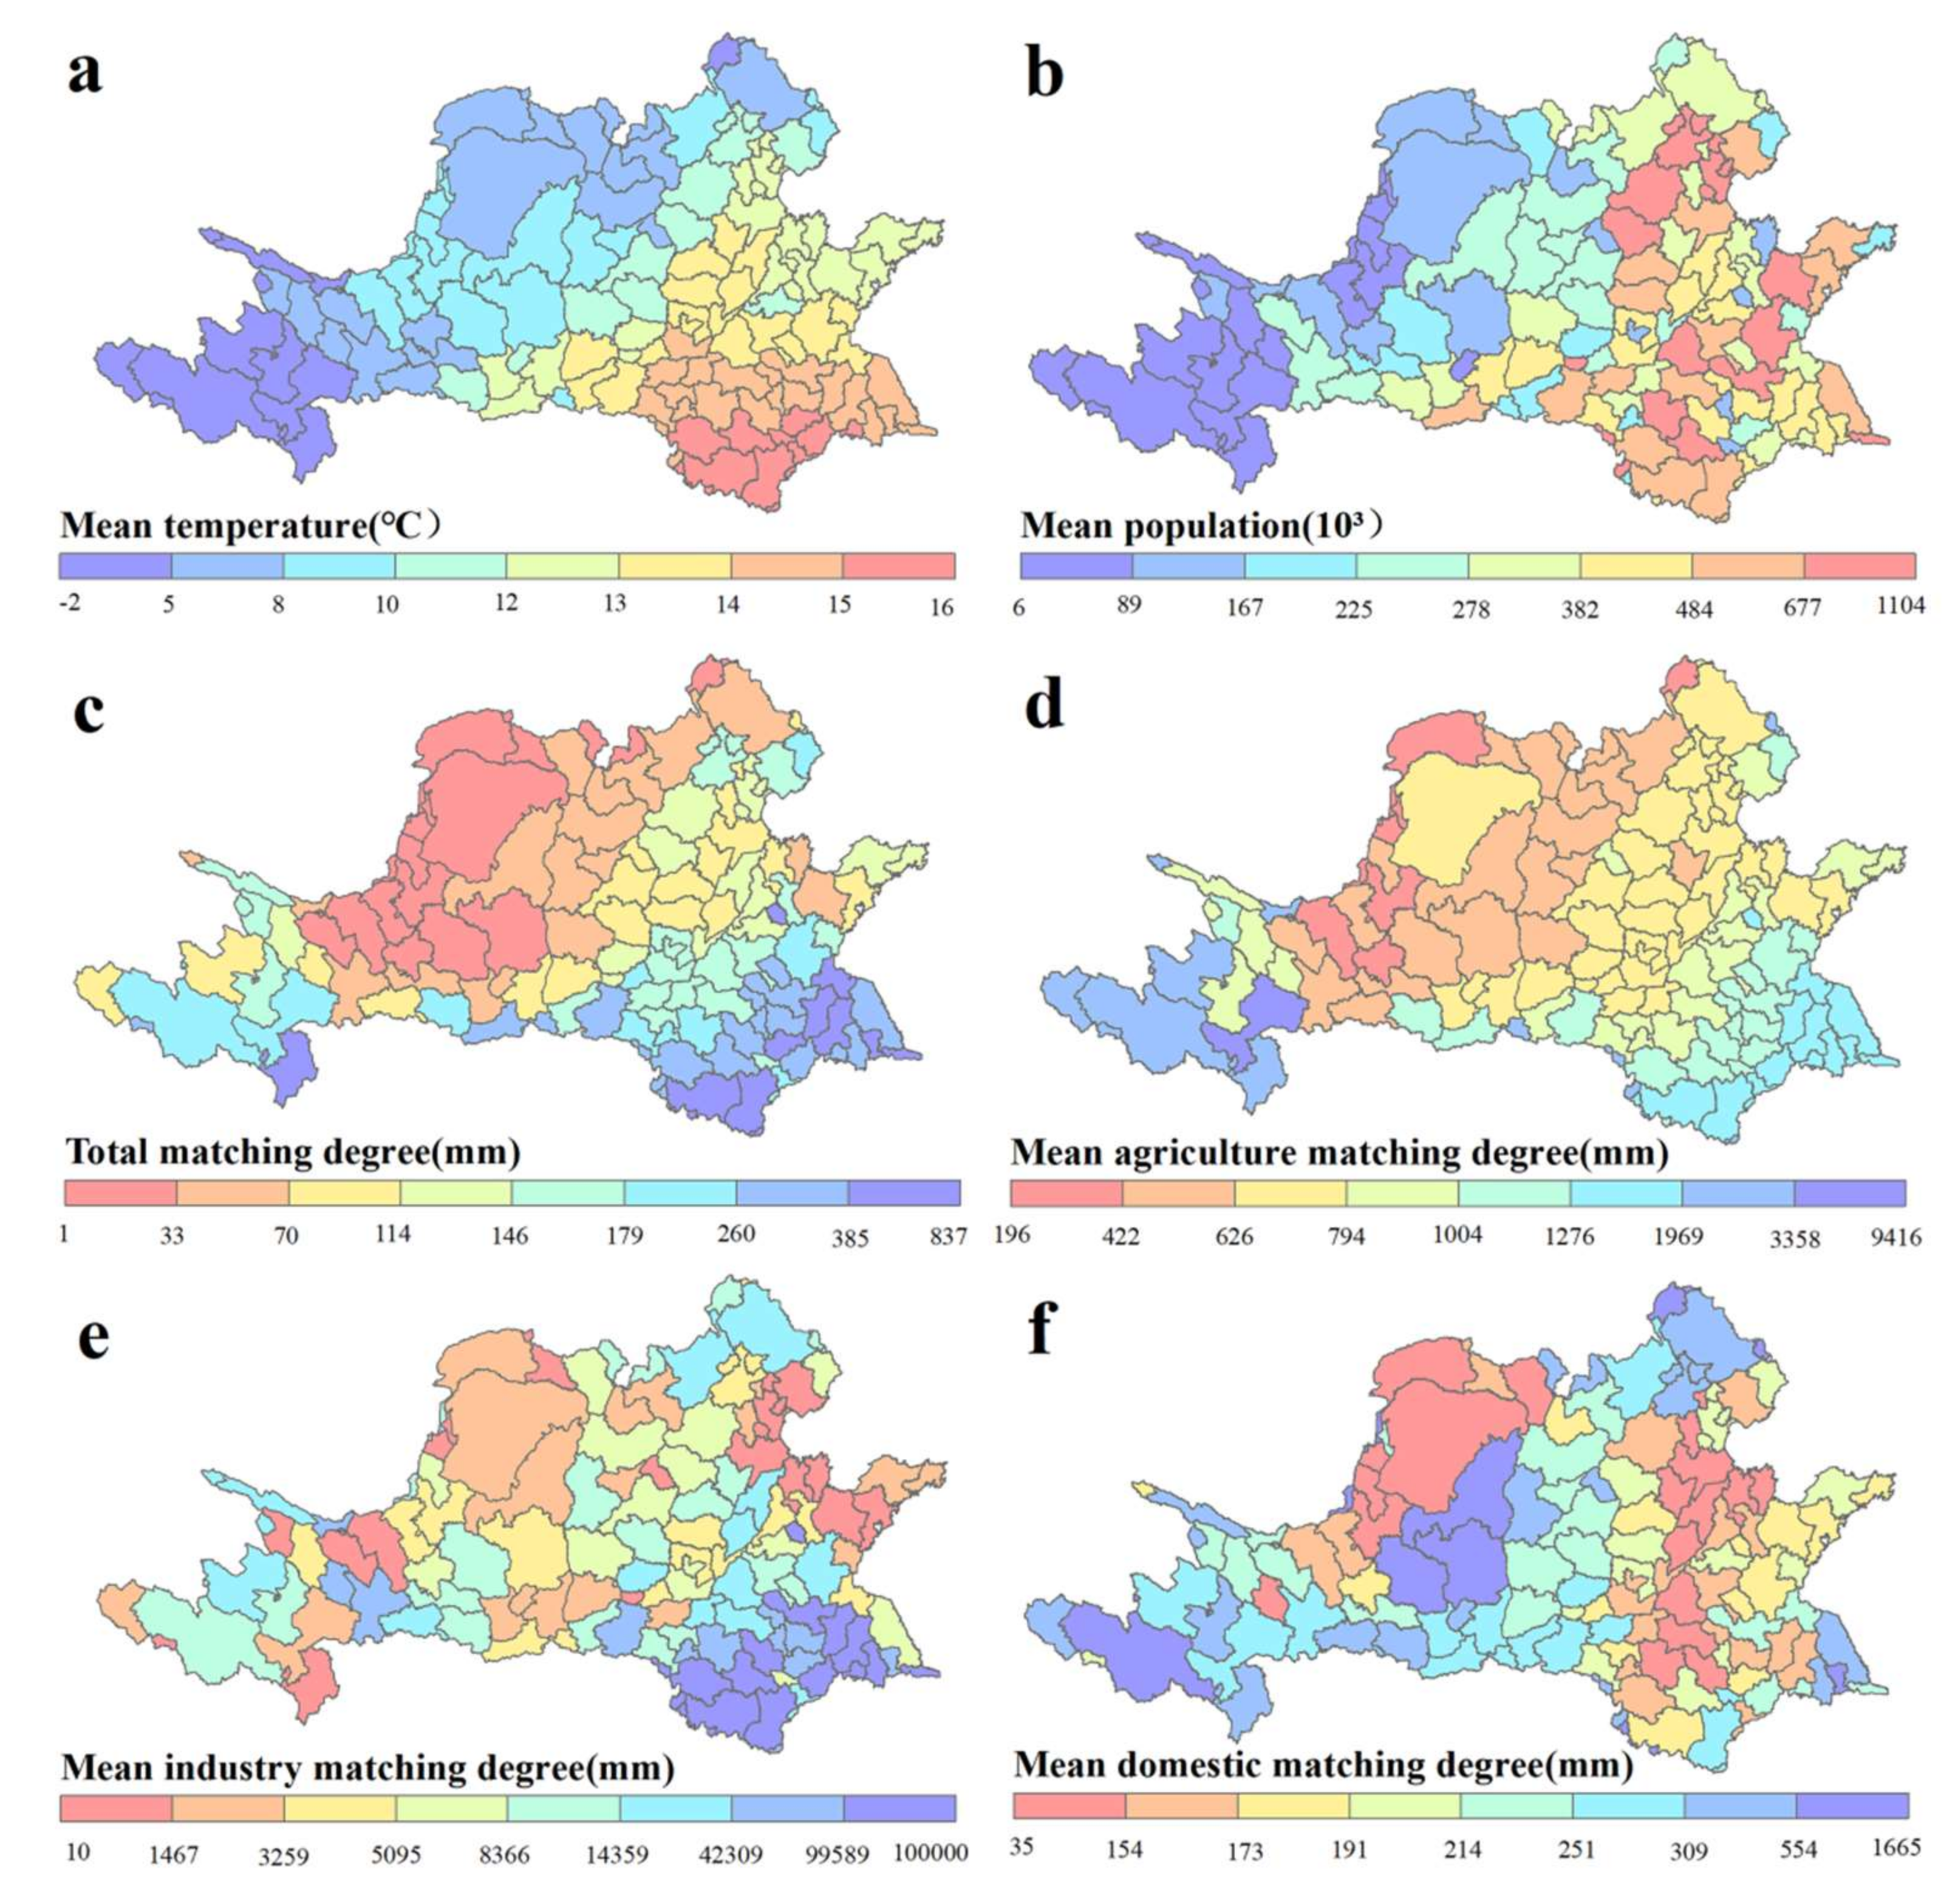
Many cities in the basin are resource-based water-scarce cities, and the total amount of water resources can reflect the regional water resource endowment, which is very important for the changes in the WLN matching indexes for these cities. Therefore, based on the availability of data and the experts’ suggestions, this study selected four driving factors, temperature, precipitation, population, and total water resources, for correlation analysis. We calculated the mean annual temperature, mean population, mean annual total water resources (which means the average available surface water in a region during the past 67 years), mean annual precipitation, and four mean WLM matching indexes (Wt, Wf, Wi, Wd) in the Huang-Huai-Hai River Basin from 1951 to 2017, and we analyzed their spatial distributions as shown in Figure 8.
It can be seen from Figure 8c,d that the spatial distribution characteristics of Wf and Wt are higher in the east than in the west, and they are higher in the south than in the north. From Figure 8e,f, it can be seen that Wi and Wd in the Huang-Huai-Hai River Basin also have a certain spatial similarity. Based on the correlation analysis of Figure 8a and d–h, it can be inferred that drought and low rainfall are the main reasons for the low WLN matching index in the northwestern part of the basin. Following that reasoning, it could be concluded that the main driving factors of Wi and Wd in the northeast of the basin are precipitation and population; the large amount of water resources and small population are the main driving factors for the high WLN matching indexes in the southwest; and total water resources, precipitation, and temperature are the main driving factors for the relatively high Wt, Wf, and Wi in the southeast of the basin.
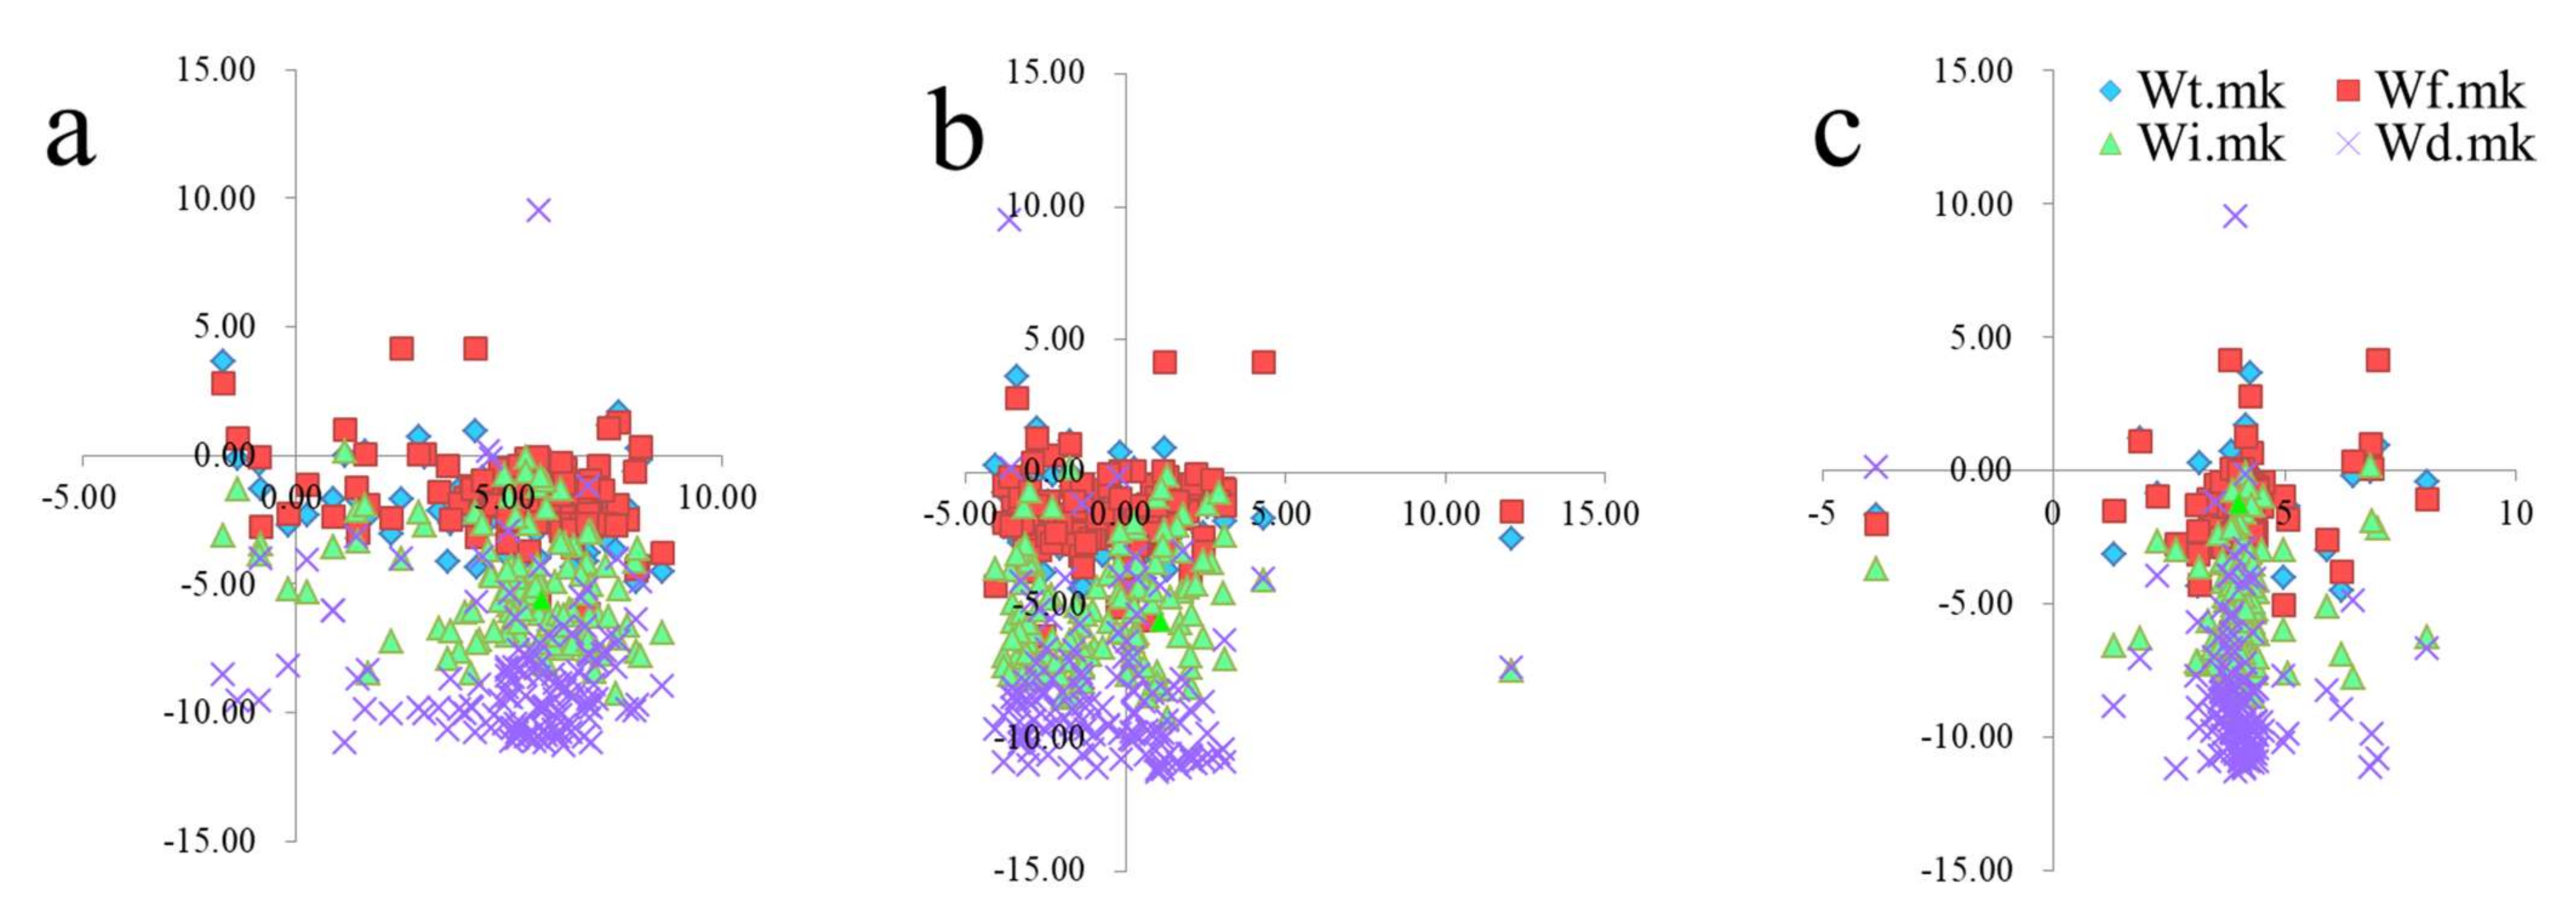
The time series of the WLN matching indexes, precipitation, temperature, and population in each city were tested with the MK method (Section 2.3.4). Then, the correlations between the three driving factors and the WLN matching indexes were analyzed by regression method, as shown in Figure 9. The abscissa represents the MK trend test values for the driving factors (temperature, rainfall, and population), and the ordinate represents the MK trend test values for the matching indexes (Wt, Wa, Wi, Wd). As shown in Figure 9a, the domestic WLN matching index of is significantly negatively correlated with temperature. So, it can draw a rough conclusion that temperature is the main driving factor for the domestic WLN matching index in most cities of the basin. Figure 9b depicts the correlation between the WLN matching index and the precipitation. It is obvious that precipitation has the greatest impact on the total WLN matching index, followed by the agricultural WLN matching index. When precipitation is on a downward trend, the matching indexes for both total and agricultural WLN in most cities also decline. Thus, precipitation is the main driving factor for both the total and the agricultural WLN matching indexes in most cities in the basin. Figure 9c shows the correlations between population and the matching indexes, and most of the points fall in the fourth quadrant. Among them (Figure 9a–c), the correlation between population and the industrial WLN matching index is the most significant. Therefore, it can be speculated that population is the main driving factor of the industrial WLN matching index.
In summary, through the analysis of the driving factors of the temporal changes in the WLN matching indexes in the Huang-Huai-Hai River Basin, we could infer that the main driving factor for changes in the domestic WLN matching index is temperature, the main driving factor for changes in the agricultural WLN matching index is precipitation, and the main driving factors for changes in the industrial WLN matching index are population and temperature.
4. Discussion
4.1. Advantages
There are some advantages of evaluating the matching patterns of water and land resources using this evaluation method. For example, using this method allows us to measure the degrees of support for a region’s agriculture, industry, and life separately by the region’s water and land resources. It can effectively avoid the negative externality of the single evaluation of the total WLN matching index or of just one sector WLN matching index, which means we can trade off the utilization of water and land resources for different sectors by considering all sectors. Then, it is possible to distinguish what sector’s development can be supported based on regional WLN matching patterns. If the agricultural WLN matching index is high, but the industry WLN matching index is low in a city, we can suggest that the management department increase the city’s industrial water allocation and reduce its agricultural water allocation appropriately to ensure the balanced development of different sectors. On the contrary, managers can also vigorously develop sectors with high water and land resource matching indexes according to local conditions to enhance local resource utilization efficiency. Our research thus provides a reference for the joint management of water and land resources to support the sustainable development of different sectors.
4.2. Limitations
There are also some limitations to this research. For example, the agricultural, industrial, and domestic WLN matching indexes only represent the main resources in these sectors, but we ignored some other sectors such as municipal water and infrastructure. Furthermore, since we lacked some historical data, we had to obtain them through some regression methods. There are inevitable errors during the regression process, and accurate and complete historical observations could make these results more persuasive.
4.3. Rationality
Our results on precipitation changes in the Huang-Huai-Hai River Basin are consistent with those of Yuan Y [46]. That is, the annual precipitation gradually increases from west to east and presents significant zonality. Although there are few relevant studies on land use changes and the changes in the matching indexes for water and land resources in the Huang-Huai-Hai River Basin, the rationality of this study can be proved indirectly through the conclusions of relevant studies on land use changes in eastern China. For instance, Zhou Yang found that during the period 1995–2015, the construction area increased in the Yangtze River Delta, the Pearl River Delta, and the Beijing–Tianjin-Hebei region. More than 80% of construction land expansion came from the occupation of cultivated land, and this conclusion is consistent with the calculation and analysis results of land use changes in the Huang-Huai-Hai River Basin in this study.
5. Conclusions
In this study, we calculated the Wt and Wa indexes for evaluating the total water–land nexus and proposed two new indexes, Wi and Wd, reflecting the water–land nexus from the perspectives of industry development and residents’ quality of life. With the new conception and method of assessing the water–land nexus, the existing evaluation system was improved. To understand the past changes in the WLN and face the challenges of changing environments including from climate change and human behavior, the characteristics of the temporal and spatial WLN variations during 1951–2017 were also analyzed along with the driving factors of the variation. This study provides a reference for the joint management of water and land resources to support the sustainable development of different sectors. It is also useful for enhancing water and land resource utilization in further response to the changing environment.
The main findings are as follows:
- (1)
- The total water resources in the Huang-Huang-Hai Basin are decreasing. Among the three first-level regions in the Basin, the Haihe River region decreased the most obviously. The total water resources of the southern cities in the basin are more than those of the northern cities.
- (2)
- The areas of urban land, other construction land, rural residential land, and forest in the Huang-Huai-Hai River Basin increased from 1980 to 2015. Among them, the area of urban land increased the most. However, the areas of paddy fields, dry land, grassland, unused land, and water bodies decreased.
- (3)
- The total matching index of the water–land nexus gradually increases from the northwest to the southeast in the basin. The agricultural WLN matching index is higher in the south than in the north. The areas where the agricultural matching indexes were too low decreased constantly from 1951 to 2017. Literally, the industrial WLN matching indexes are higher in the east and south than in the west and north. There are generally two living water-deficient zones in the Huang-Huai-Hai River Basin, and the areas with relatively high domestic WLN matching indexes across the whole basin are gradually increasing.
Our study provided a more comprehensive assessment system for water–land nexuses from the perspectives of industry development and the quality of residents’ lives in addition to agriculture development. This research fills the research gap in that earlier work has only considered agriculture when assessing the water–land nexus. However, some other sectors were ignored such as municipal water and infrastructure in the process of assessment. Additionally, the uncertainties caused by the absence of a large number of measured data and the data reduction process are also inescapable. Because of spatial confinement and limited data support, the uncertainties and further refinement of the water–land nexus assessment system need to be studied in the future.
Author Contributions
Conceptualization, J.L. and Z.B.; methodology, J.L.; software, X.Z.; validation, G.W. and J.L.; formal analysis, Z.B.; investigation, L.L.; resources, G.W.; data curation, J.L. All authors have read and agreed to the published version of the manuscript.
Funding
This research is funded by the National Key Research and Development Program of China (2021YFC3201100); The National Natural Science Foundation of China: 41961124007; The National Key R&D Program of China: 2017YFA0605002; National Natural Science Foundation of China: 52009121.
Conflicts of Interest
No conflict of interest.
References
- Pan, Y.; Si, X.W.; Jin, M.; Yang, L. Optimal allocation of water and land resource system coupling in the process of urbanization. Bull. Soil Water Conserv. 2010, 30, 216–220. [Google Scholar]
- Yang, Y.Z.; Zhang, W.K.; Feng, Z.M.; Yang, G.G.; Yang, L. Water balance in red soil hilly regions of Southern China under drought climate situations Transactions of the Chinese Society of. Agric. Eng. 2013, 29, 110–119. [Google Scholar]
- Huang, X.; Fang, H.; Wu, M.Y.; Cao, X.C. Assessment of the regional agricultural water-land nexus in China: A green-blue water perspective. Sci. Total Environ. 2022, 804, 150–192. [Google Scholar] [CrossRef] [PubMed]
- Li, M.; Fu, Q.; Singh, V.P.; Liu, D.; Li, T.X.; Li, J. Sustainable management of land, water, and fertilizer for rice production considering footprint family assessment in a random environment. J. Clean. Prod. 2020, 258, 120785. [Google Scholar] [CrossRef]
- Gang, W.; Yan, D.; He, X.; Liu, S.; Zhang, C.; Xing, Z.; Kan, G.; Qin, T.; Ren, M.; Li, H. Trends in extreme temperature indices in Huang-Huai-Hai River Basin of China during 1961–2014.Theor. Appl. Climatol. 2018, 134, 51–65. [Google Scholar]
- Shi, X.; Qin, T.; Yan, D.; Sun, R.; Cao, S.; Jing, L.; Wang, Y.; Gong, B. Analysis of the Changes in the Water Yield Coefficient over the Past 50 Years in the Huang-Huai-Hai River Basin, China. Adv. Meteorol. 2018, 2018, 6302853. [Google Scholar] [CrossRef]
- Bates, B.; Kundzewicz, Z.W.; Wu, S.; Palutikof, J.P. Climate Change and Water; Intergovernmental Panel on Climate Change: Geneva, Switzerland, 2008. [Google Scholar]
- Wang, J.W.; Wang, K.; Qin, T.L.; Nie, H.J.; Lv, Z.Y.; Liu, F.; Shi, X.; Hu, Y. Analysis and prediction of LUCC change in Huang-Huai-Hai River Basin. Open Geosci. 2020, 12, 1406–1420. [Google Scholar] [CrossRef]
- Wang, Y.; Liu, X.; Shi, L.; Shangguan, Z.; Wu, P.; Shan, L.; Zhao, X. Sustainable development of water resources and food security in Northwest China. Strateg. Study Chin. Acad. Eng. 2019, 21, 38–44. [Google Scholar]
- Yira, Y.; Diekkrüger, B.; Steup, G.; Bossa, A.Y. Modeling land use change impacts on water resources in a tropical West African catchment (Dano, Burkina Faso). J. Hydrol. 2016, 537, 187–199. [Google Scholar] [CrossRef]
- Fang, D.l.; Cai, Q.N.; Wu, F.; Chen, B.; Zhang, L.W. Modified linkage analysis for water-land nexus driven by interregional trade. J. Clean. Prod. 2022, 353, 131547. [Google Scholar] [CrossRef]
- Li, P.; Ren, L. Evaluating the effects of limited irrigation on crop water productivity and reducing deep groundwater exploitation in the North China plain using an agro-hydrological model: I. parameter sensitivity analysis, calibration and model validation. J. Hydrol. 2019, 574, 497–516. [Google Scholar] [CrossRef]
- Marhaento, H.; Booij, M.J.; Hoekstra, A.Y. Hydrological response to future land-use change and climate change in a tropical catchment. Hydrol. Sci. J.-J. Des Sci. Hydrol. 2017, 63, 1368–1385. [Google Scholar] [CrossRef] [Green Version]
- Tudose, N.C.; Cremades, R.; Broekman, A.; Sanchez-Plaza, A.; Mitter, H.; Marin, M. Mainstreaming the Nexus Approach in Climate Services Will Enable Coherent Local and Regional Climate Policies. Adv. Clim. Chang. Res. 2021, 12, 752–755. [Google Scholar] [CrossRef]
- Cremades, R.; Mitter, H.; Tudose, C.N.; Sanchez-Plaza, A.; Graves, A.; Broekman, A.; Bender, F.; Giupponi, C.; Koundouri, P.; Bahri, M.; et al. Ten principles to integrate the water-energy-land nexus with climate services for co-producing local and regional integrated assessments. Sci. Total Environ. 2019, 693, 133662. [Google Scholar] [CrossRef]
- Cremades, R.; Sanchez-Plaza, A.; Hewitt, R.J.; Mitter, H.; Baggio, J.A.; Olazabal, M.; Broekman, A.; Kropf, B.; Tudose, N.C. Guiding cities under increased droughts: The limits to sustainable urban futures. Ecol. Econ. 2021, 189, 107140. [Google Scholar] [CrossRef]
- Bernadette, K.; Erwin, S.; Hermine, M. Multi-step cognitive mapping of perceived nexus relationships in the Seewinkel region in Austria. Environ. Sci. Policy 2021, 124, 604–615. [Google Scholar]
- Liu, Y.S.; Gan, H.; Zhang, F.G. Analysis of the Matching patterns of land and water resources in Northeast China. Acta Geogr. Sinica 2006, 61, 847–854. [Google Scholar]
- Li, H.; Zhou, W.B.; Zhuang, Y.; Ma, C.; Liu, B.Y. Agricultural water and soil resources matching patterns and carrying capacity in Yan’an City. Trans. Chin. Soc. Agric. Eng. 2016, 32, 156–162. [Google Scholar]
- Liu, D.; Liu, C.; Fu, Q.; Li, M.; Faiz, M.A.; Khan, M.I.; Li, T.X.; Cui, S. Construction and application of a refined index for measuring the regional matching characteristics between water and land resources. Ecol. Indic. 2018, 91, 203–211. [Google Scholar] [CrossRef]
- Yang, G.Y.; Li, S.Y.; Wang, H.; Wang, L. Study on agricultural cultivation development layout based on the matching characteristic of water and land resources in North China Plain. Agr. Water Man. 2022, 259, 107272. [Google Scholar] [CrossRef]
- Zhang, Y.; Yan, Z.X.; Song, J.X.; Wei, A.L.; Sun, H.T.; Cheng, D.D. Analysis for spatial-temporal matching pattern between water and land resources in CentralAsia. Hydro.Res. 2020, 51, 994–1008. [Google Scholar] [CrossRef]
- Huang, K.W.; Yuan, P.; Liu, G. Research on Water and Soil Resources Matching in Sichuan Province Based on DEA. China Rural. Water Hydropower China 2015, 58–61. [Google Scholar]
- Liu, Y.T.; Wang, S.G.; Chen, B. Water–land nexus in food trade based on ecological network analysis. Eco. Indi. 2019, 97, 455–475. [Google Scholar] [CrossRef]
- Zheng, Y.X.; Hong, J.K.; Xiao, C.L.; Li, Z.M. Unfolding the synergy and interaction of water-land-food nexus for sustainable resource management: A super network analysis. Sci. Total Environ. 2021, 784, 147085. [Google Scholar]
- Shi, x.y.; Takanori, M.; Takashi, M.; Chihiro, H.; Ang, H.; Gan, X.Y. Impact of urbanization on the food–water–land–ecosystem nexus: A study of Shenzhen, China. Sci. Total Environ. 2021, 808, 152138. [Google Scholar] [CrossRef]
- Papadopoulou, C.A.; Papadopoulou, M.P.; Laspidou, C.; Munaretto, S.; Brouwer, F. Towards a low-carbon economy: A nexus-oriented policy coherence analysis in Greece. Sustainability 2020, 12, 373. [Google Scholar] [CrossRef] [Green Version]
- Li, X.; Zhang, Q.; Liu, Y.; Song, J.; Wu, F. Modeling social-economic water cycling and the water–land nexus: A framework and an application. Ecol. Model. 2018, 390, 40–50. [Google Scholar] [CrossRef]
- Totan, G.; Harish, G. Possibilistic multiattribute decision making for water resource management proble munder single-valued bipolar neutrosophic environment. Int. J. Intell. Syst. 2021, 1–28. [Google Scholar] [CrossRef]
- Yuan, Z.; Yan, D.H.; Yang, Z.Y.; Yin, J.; Yuan, Y. Temporal and spatial variability of drought in Huang-Huai-Hai River Basin, China. Theor. Appl. Climatol. 2015, 122, 755–769. [Google Scholar] [CrossRef]
- Wang, G.Q.; Zhang, J.Y. Variation of water resources in the Huang-Huai-Hai areas and adaptive strategies to climate change. Quat. Int. 2015, 380, 180–186. [Google Scholar] [CrossRef]
- Chen, B.; Hanb, M.Y.; Peng, K.; Zhou, S.L.; Shao, L.; Wu, X.F.; Wei, W.D.; Liu, S.Y.; Chen, G.Q. Global land-water nexus: Agricultural land and freshwater use embodied in worldwide supply chains. Sci. Total Environ. 2017, 613, 931–943. [Google Scholar] [CrossRef]
- Cui, B.S.; Yang, Z.F. Eco-environmental water requirement for wetlands in Huang-Huai-Hai Area, China. Prog. Nat. Sci. 2002, 12, 841–848. [Google Scholar]
- Tiwari, S.; Jha, S.K.; Sivakumar, B. Reconstruction of daily rainfall data using the concepts of networks: Accounting for spatial connections in neighborhood selection. J. Hydrol. 2019, 579, 124185. [Google Scholar] [CrossRef]
- Taylan, E.D.; Damçayırı, D. Isparta Bölgesi Yağış Değerlerinin IDW ve Kriging Enterpolasyon Yöntemleri ile Tahmini. Tek. Dergi 2016, 27, 7551–7559. [Google Scholar]
- Song, W.; Deng, X.Z. Land-use/land-cover change and ecosystem service provision in China. Sci. Total Environ. 2017, 576, 705–719. [Google Scholar] [CrossRef]
- Liu, J.Y.; Kuang, W.H.; Zhang, Z.X.; Xu, X.L.; Qin, Y.W.; Ning, J.; Zhou, W.; Zhang, S.; Li, R.; Yan, C.; et al. Spatiotemporal characteristics, patterns, and causes of land-use changes in China since the late 1980s. J. Geogr. Sci. 2014, 24, 195–210. [Google Scholar] [CrossRef]
- Sharma, S.; Saha, A.K. Statistical analysis of rainfall trends over Damodar River basin, India. Arab. J. Geosci. 2017, 10, 1–12. [Google Scholar] [CrossRef]
- Seenu, P.Z.; Jayakumar, K.V. Comparative study of innovative trend analysis technique with Mann-Kendall tests for extreme rainfall. Arab. J. Geosci. 2021, 14, 1–15. [Google Scholar]
- Hamed, K.H.; Rao, A.R. A modified Mann-Kendall trend test for autocorrelated data. J. Hydrol. 1998, 204, 182–196. [Google Scholar] [CrossRef]
- Akritas, M.G.; Murphy, S.A.; LaValley, M.P. The theil-sen estimator with doubly censored-data and applications to astronomy. J. Am. Stat. Assoc. 1995, 90, 170–177. [Google Scholar] [CrossRef]
- Zulqarnain, R.M.; Xin, X.L.; Saqlain, M.; Khan, W.A. TOPSIS Method Based on the Correlation Coefficient of Interval-Valued Intuitionistic Fuzzy Soft Sets and Aggregation Operators with Their Application in Decision-Making. J. Math. 2021, 2021, 16. [Google Scholar] [CrossRef]
- Chicco, D.; Warrens, M.J.; Jurman, G. The coefficient of determination R-squared is more informative than SMAPE, MAE, MAPE, MSE and RMSE in regression analysis evaluation. PeerJ Comput. Sci. 2021, 7, e623. [Google Scholar] [CrossRef]
- Rabia, H.; Saima, M.; Shafqat, I.; Sajawal, P. A Study of Time Series Forecasting Enrollments Using Fuzzy Interval Partitioning Method. J. Comput. Cogn. Eng. 2022, 00, 1–7. [Google Scholar]
- Krishnan, B.; Antonio, G.; Shakoor, H.; Liam, S.; Ben, A. Time series regression studies in environmental epidemiology. Int. J. Epidemiol. 2013, 42, 1187–1195. [Google Scholar] [CrossRef]
- Yuan, Y.; Yan, D.H.; Yuan, Z.; Yin, J.; Zhao, Z.N. Spatial Distribution of Precipitation in Huang-Huai-Hai River Basin between 1961 to 2016, China. Int. J. Environ. Res. Public Health 2019, 16, 3404. [Google Scholar] [CrossRef] [Green Version]
Figure 1.
The map of the study area. The river system of the Huang-Hui-Hai River Basin, including the Yellow River, Hai River, and Huai River. The elevation of the basin is relatively high in the west and low in the east. The location of this basin is also marked in the map of China for reference.
Figure 1.
The map of the study area. The river system of the Huang-Hui-Hai River Basin, including the Yellow River, Hai River, and Huai River. The elevation of the basin is relatively high in the west and low in the east. The location of this basin is also marked in the map of China for reference.

Figure 2.
The total water resources of the three first-level regions in the Huang-Huai-Hai River Basin during 1951–2017.
Figure 2.
The total water resources of the three first-level regions in the Huang-Huai-Hai River Basin during 1951–2017.

Figure 3.
Water yield coefficients for the three first-level regions in the Huang-Huai-Hai River Basin during 1951–2017.
Figure 3.
Water yield coefficients for the three first-level regions in the Huang-Huai-Hai River Basin during 1951–2017.

Figure 4.
The spatial distribution of the annual average water resources in 128 prefecture-level cities in the Huang-Huai-Hai River Basin from 1951 to 2017.
Figure 4.
The spatial distribution of the annual average water resources in 128 prefecture-level cities in the Huang-Huai-Hai River Basin from 1951 to 2017.

Figure 5.
The spatial distribution of land use transfers in each period in the Huang-Huai-Hai River Basin from 1980 to 2015.
Figure 5.
The spatial distribution of land use transfers in each period in the Huang-Huai-Hai River Basin from 1980 to 2015.

Figure 6.
The spatial distribution of the total WLN matching indexes in the Huang-Huai-Hai River Basin during 1951-2017.
Figure 6.
The spatial distribution of the total WLN matching indexes in the Huang-Huai-Hai River Basin during 1951-2017.

Figure 7.
The spatial distributions of the WLN matching indexes for the different sectors for the cities in the Huang-Huai-Hai River Basin from 1951 to 2017 (a). The spatial distribution of the agricultural WLN matching index for cities in the Huang-Huai-Hai River Basin. (b). The spatial distribution of the industrial WLN matching index for cities in the Huang-Huai-Hai River Basin. (c). The spatial distribution of the domestic WLN matching index for cities in the Huang-Huai-Hai River Basin).


Figure 8.
The spatial distributions of all relevant WLN factors for the 128 cities in the Huang-Huai-Hai River Basin from 1951 to 2017.(a), The spatial distribution of mean annual temperature; (b), The spatial distribution of mean annual population; (c), The spatial distribution of the mean annual total WLN matching index (Wt); (d), The spatial distribution of the agricultural WLN matching index (Wf); (e), The spatial distribution of the mean annual industrial WLN matching index (Wi); (f), The spatial distribution of the mean annual domestic WLN matching index (Wd).

Figure 9.
Correlation analysis between the trends in the WLN matching indexes and the trends in the tree-driving factors. (a), Correlation analysis between the trends in the WLN matching indexes and the trends in temperature; (b), Correlation analysis between the trends in the WLN matching indexes and the trends in precipitation; (c), Correlation analysis between the trends in the WLN matching indexes and the trends in population.


Table 1.
The classification system of the remote-sensing monitoring data on land use status in China.
Table 1.
The classification system of the remote-sensing monitoring data on land use status in China.
| Primary Type | Secondary Type | ||
|---|---|---|---|
| ID | Name | ID | Name |
| 1 | Arable land | 11 | Paddy field |
| 12 | Dry land | ||
| 2 | Woodland | 21 | Forestland |
| 22 | Bush | ||
| 23 | Opening | ||
| 24 | Other woodland | ||
| 3 | The grass | 31 | High coverage grassland |
| 32 | Medium coverage grass | ||
| 33 | Medium coverage grass | ||
| 4 | Waters | 41 | Graff a |
| 42 | Graff b | ||
| 43 | Reservoir pits | ||
| 44 | Permanent glacial snow | ||
| 45 | Tidal flats | ||
| 46 | On beaches | ||
| 5 | Urban and rural, industrial and mining, residential land | 51 | Urban land use |
| 52 | Rural settlements | ||
| 53 | Other construction land | ||
| 6 | Unused land | 61 | Unused land |
| 62 | The gobi | ||
| 63 | Saline-alkali land | ||
| 64 | Marsh | ||
| 65 | Bare land | ||
| 66 | Bare rock | ||
| 67 | Bare rock | ||
| 9 | 99 | Ocean | |
Table 2.
The areas of various land use types in the Huang-Huai-Hai River Basin from 1980 to 2015.
| Land Use Types (km2) | Time (Year) | ||||||
|---|---|---|---|---|---|---|---|
| 1980 | 1990 | 1995 | 2000 | 2005 | 2010 | 2015 | |
| Paddy field | 60,528 | 60,286 | 60,750 | 60,663 | 59,641 | 59,101 | 58,436 |
| Dry land | 543,899 | 544,379 | 530,315 | 541,269 | 535,418 | 532,721 | 529,135 |
| Forest | 188,331 | 187,450 | 196,516 | 187,754 | 189,992 | 190,514 | 190,466 |
| Grassland | 460,117 | 461,001 | 464,860 | 457,224 | 454,787 | 455,091 | 453,728 |
| Water body | 36,868 | 34,399 | 33,478 | 35,042 | 35,671 | 35,796 | 36,140 |
| Urban land | 8165 | 8950 | 12,186 | 12,548 | 15,514 | 17,401 | 19,687 |
| Rural residential land | 62,044 | 62,408 | 63,093 | 65,096 | 65,962 | 66,254 | 67,523 |
| Other construction land | 4370 | 5447 | 6224 | 6402 | 7346 | 8308 | 11,469 |
| Unused land | 74,473 | 73,841 | 71,231 | 72,787 | 74,459 | 73,603 | 72,205 |
Publisher’s Note: MDPI stays neutral with regard to jurisdictional claims in published maps and institutional affiliations. |
© 2022 by the authors. Licensee MDPI, Basel, Switzerland. This article is an open access article distributed under the terms and conditions of the Creative Commons Attribution (CC BY) license (https://creativecommons.org/licenses/by/4.0/).
Share and Cite
MDPI and ACS Style
Liu, J.; Bao, Z.; Wang, G.; Zhou, X.; Liu, L. The Spatial and Temporal Assessment of the Water–Land Nexus in a Changing Environment: The Huang-Huai-Hai River Basin (China). Water 2022, 14, 1905. https://doi.org/10.3390/w14121905
AMA Style
Liu J, Bao Z, Wang G, Zhou X, Liu L. The Spatial and Temporal Assessment of the Water–Land Nexus in a Changing Environment: The Huang-Huai-Hai River Basin (China). Water. 2022; 14(12):1905. https://doi.org/10.3390/w14121905
Chicago/Turabian StyleLiu, Jing, Zhenxin Bao, Guoqing Wang, Xinlei Zhou, and Li Liu. 2022. "The Spatial and Temporal Assessment of the Water–Land Nexus in a Changing Environment: The Huang-Huai-Hai River Basin (China)" Water 14, no. 12: 1905. https://doi.org/10.3390/w14121905
Note that from the first issue of 2016, this journal uses article numbers instead of page numbers. See further details here.