
Laboratory-Scale Study on the Effects of Freezing in Soils when Subjected to Different Moisture Content


Department of Horticulture and Department of Crop and Soil Sciences, College of Agricultural and Environmental Sciences, The University of Georgia, Athens, GA 30602, USA
*
Author to whom correspondence should be addressed.
Water 2022, 14(12), 1892; https://doi.org/10.3390/w14121892
Submission received: 19 May 2022
/
Revised: 5 June 2022
/
Accepted: 7 June 2022
/
Published: 12 June 2022
(This article belongs to the Topic Water and Soil Management in Adaptation to Climate Change)
Abstract
:This study was undertaken to investigate how soil characteristics and moisture content impact the freezing process in soils that are common in Georgia, United States. Three soil types (sand, loam, clay loam) with a water content of 30% or 40% field capacity were subjected to temperatures of −1.0 °C, −1.5 °C and −2.0 °C, respectively, in a freezing chamber. The three soil types revealed unique freezing profiles at both 30% and 40% field capacity. In general, all soil types at 40% field capacity remained at higher temperatures for longer periods of time compared to the same soil type at 30% field capacity. The loam soil at 40% WHC (water holding capacity) took the longest time to reach all four threshold temperatures. Both the soil texture and amount of water available for freezing affected the time each soil and water combination took to reach the threshold temperatures. These results have practical implications for the ornamental landscape industry and gardeners in subtropical climates where annual flowers are commonly grown in winter color beds. Since subfreezing soil temperatures are not as common in subtropical areas as they are in more northern climates, especially in recent decades, it would be worthwhile to examine the impact of additional factors such as organic content and nutrition on freezing processes in subtropical soils.
1. Introduction
The local climate and even microclimate can affect plant survival and cold hardiness. This is of interest to commercial growers and landscapers because it affects their plant inventory, plant selection, and ultimately sales and consumer satisfaction. The last-updated cold hardiness map revealed higher average winter temperatures for most of the southeastern United States [1]. Consequently, the ornamental industry and consumers have become interested in growing cold-sensitive plants in more northern areas with expectations that the plant material will exhibit a perennial nature. Numerous plants of tropical and subtropical origins have been marketed as “cold-hardy” to various zones, yet information is often anecdotal rather than based on empirical analysis. Air temperatures are the typical data that is considered in order to determine plant cold hardiness; however, the effects of soil temperature are rarely considered when determining plant winter survival. In addition, soil characteristics such as texture and moisture content can also affect winter survival due to their effect on below-ground root systems. It is a well-known fact that soils lower the freezing point of water [2]. Bouyoucos (1920) showed that mineral soils may be cooled down to −4.20 °C without freezing; he stated that even if thermometers were recording soil temperatures of several degrees below 0 °C, the soils may not actually be frozen. In subtropical areas of the southeastern US, where snow cover does not typically persist for an extended period, soil and root systems are regularly exposed to air temperatures. Air temperatures below freezing (0 °C) may occur in such areas, but the duration may not be sufficient to cause freezing of the soil. Furthermore, even if the temperature of the soil drops below 0 °C, the depth at which this occurs has potential impacts on the survival of root systems. This study was undertaken to investigate how soil characteristics and moisture content impact the freezing process in soils that are common in Georgia, U.S.A. In addition, an attempt was made to make inferences derived from climatological data with regard to plant cold hardiness and winter survival in Georgia.
2. Materials and Methods
2.1. Soil Collection and Analysis
Three types of soils were collected from South and North Georgia, United States; they belonged to sand (S), loam (L), or clay loam (CL) textural classes (Table 1). The soils represented a large portion of agricultural to suburban and urban sites in the state (Soil Survey Staff. 2010). The soils were made to pass through a 2 mm sieve prior to the experiment.
Soil texture was determined by using the Hydrometer method [3]. The water holding capacity of the soils was determined by standard methods [4]). Total organic carbon and soluble salts with saturated paste extract were determined at the Agricultural and Environmental Services Laboratory of the University of Georgia (accessed on 1 May 2022, http://aesl.ces.uga.edu/soil.html). Soils were brought to 30% or 40% water holding capacity (WHC) after determining the initial soil water content by drying subsamples of the soil at 105 °C for 24 h and determining the water lost gravimetrically [4,5]. Water was added to the soils in a sealable plastic bag slowly in a drop-wise fashion while mixing to achieve a uniform distribution and to bring the soils to the mentioned moisture levels. The adjusted soils were packed into the custom-made PVC pipes described below to achieve a bulk density of 1 g/cm3.
2.2. Soil Freezing
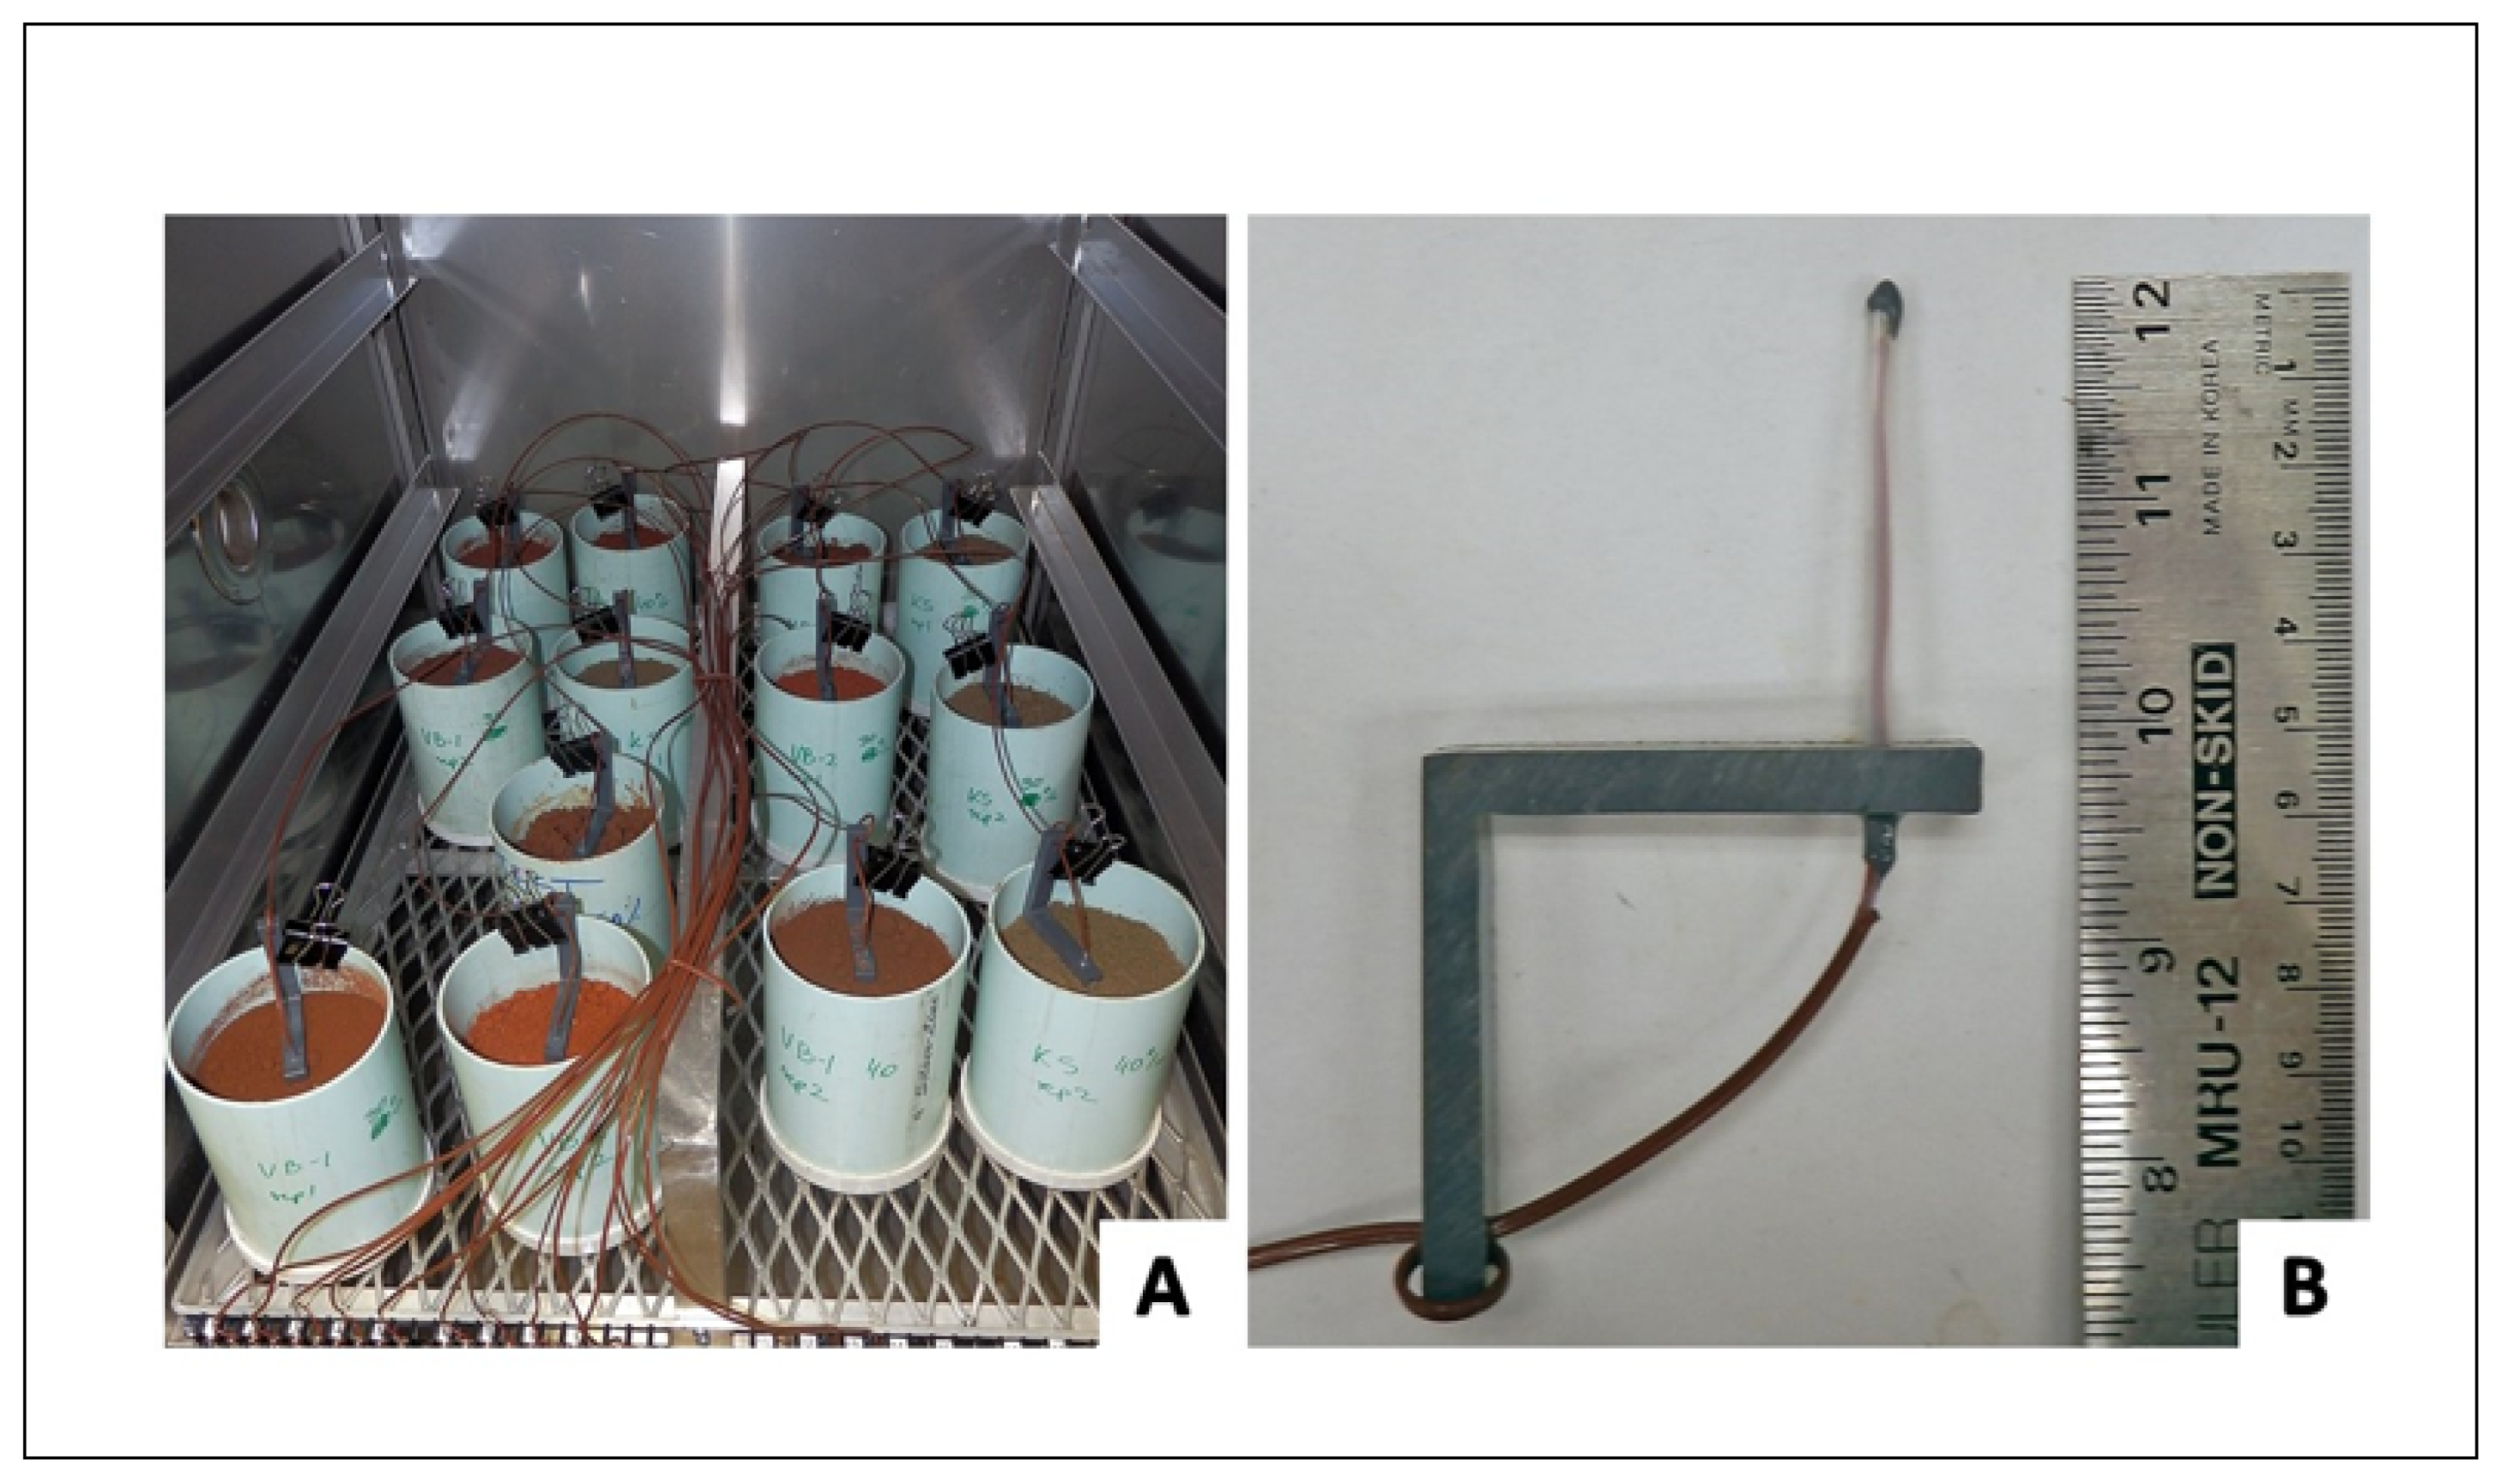
Custom-made containers were designed from PVC pipes (0.19 cm in thickness, d = 10 cm), open at the top and capped at the bottom (Figure 1A). Thermocouples were placed inside rigid nylon tubing and further secured at their location with a custom-designed right-angle shaped PVC bracket (Figure 1B). Each thermocouple was inserted into the center of each container at a depth of 5.08 cm (2 inches). Thermocouples were connected to a CR-7 datalogger (Campbell Scientific, Logan, UT, USA). The containers were placed in a temperature-controlled chamber (ESPEC Platinous Rainbow PR-3F Environmental Chamber, Hudsonville, MI, USA) set at −0 °C for 18 h.
2.3. Data Collection
Thermocouple readings of soil temperature were taken once per minute and recorded as raw data as 5 min averages. The data were examined to determine the length of time needed for each soil to reach four threshold temperature points (−0.5, −1.0, −1.5, and −2.0 °C). If the threshold point was not reached at specific 5 min points in the dataset, the time before and the next time was averaged to obtain an estimate of the actual time the specified threshold was reached. To illustrate, a data point of −0.49 °C was reached at 150 min (after experiment initiation) and a data point of −0.54 °C was reached at 155 min—so the threshold time to reach −0.5 °C was 152.5 min (average of the two numbers). The threshold temperature points reflected the range of soil temperatures below 0 °C encountered in the coldest area in the state of Georgia (USDA Hardiness Zone 6a (air temperatures: −23.3 to −20.6 °C)). Additionally, −1.5 °C is the temperature at which sensitive plant tissue freezes [6].
2.4. Experimental Design and Statistical Analysis
Four identical container combinations of soil type and moisture content were used, for a total of 24 containers (three soil types and two moisture contents); these were averaged to give one replication per run. The experiment was repeated twice for two replications; these are referred therein as “runs”. The statistical model included two independent variables: soil type and moisture content combinations as treatments (total of six) and runs (total of two). The time to reach threshold temperature points was considered a dependent variable. The data subjected to analysis was time (minutes) using PROC MIXED in SAS® Enterprise Guide® Version 4.02 [7]. The Least Square Difference test (LSD) was used to determine mean separation.
3. Results and Discussion
The three soils with two moisture contents took significantly different times to reach the four threshold temperatures (Table 2). When considering the order in which each treatment reached a given threshold temperature, the −0.5 °C threshold was reached first by the clay loam soil at 30% WHC (CL-30%), followed by the loam soil at 30% WHC (L-30%), the clay loam at 40% WHC (CL-40%), the sandy soil at 30% WHC (S-30%), the sandy soil at 40% WHC (S-40%), and the clay loam at 40% WHC (CL-40%). However, the order in which the treatments reached the −1.0 °C, −1.5 °C, and −2.0 °C threshold temperatures was consistent across these three thresholds, although it was different from that presented at −0.5 °C. The clay loam at 30% WHC was the fastest, followed by S-30%, S-40%, CL-40%, L-30%, and L-40% (Table 2).
It is well understood that when soil freezes, not all liquid water converts to ice [8,9]; the relationship between unfrozen water content and subfreezing temperature is known as the soil freezing characteristic curve (SFC) and is much-studied in the context of freeze–thaw cycles [10]. It is also well understood that the freezing temperature of soil increases with decreases in its moisture content [11]; it would logically follow that the higher the water content, the longer it would take for the soil to freeze. However, in the present study, the difference in time to reach the threshold temperatures among these soils cannot be explained only by the absolute amount of water the soils contained. The CL-40% and S-30% soils had the largest and smallest absolute amounts of water, respectively, yet they were not the soils that took the longest and shortest time to reach the threshold temperatures. What is more important is the water potential or the amount of available water for plant uptake or freezing in this case [12,13]. Loam soils in general have higher water availability than clay or sandy soils [14], which explains why they took the longest to reach to the threshold temperatures (−1.0 °C, −1.5 °C and −2.0 °C). Bouyoucos (1920) showed that the degree of supercooling without freezing for loam, silt loam, clay loam, clay, red clay, and even clay subsoil was −4.2 °C—provided they were kept unagitated and at almost full water saturation point. The increase in differences among the soils with decreasing threshold temperatures is due to the inclusion of water that was unavailable for freezing at higher threshold temperatures [13]. As the temperature decreases, the portion of water that is adsorbed on soil particles contained in small pores or crevices is exposed to freezing. It would be reasonable to infer that plants in loam soils would be accorded better protection from freezing than sandy or clay soils, especially at a high moisture content. Hence, a recommended practice of watering plants late in the afternoon when overnight freezing temperatures are forecasted would most likely lessen the negative impact on plant root systems—especially in cases where the subfreezing temperatures do not last for too long.
In the present study, the effects of the two soil factors (texture and moisture) were evaluated—both significantly affected the time it took for the soils to reach threshold temperatures (Table 3). For all threshold temperatures, the loam soil took the longest time, followed by the sandy and clay loam soils, respectively. The difference in time between the loam soil and the clay loam soil were highest for −2.0 °C threshold temperature (69% of the CL time), and lowest for the −0.5℃ threshold temperature (50% of the CL time), indicating a pattern of increasing time difference with decreasing threshold temperatures. The difference in time between the sandy soil and the clay loam soil was not as large as the difference between the sandy and loam soil. For all soils, the 40% WHC resulted in a significantly longer time to reach to the threshold temperatures than soils with 30% WHC (Table 3).
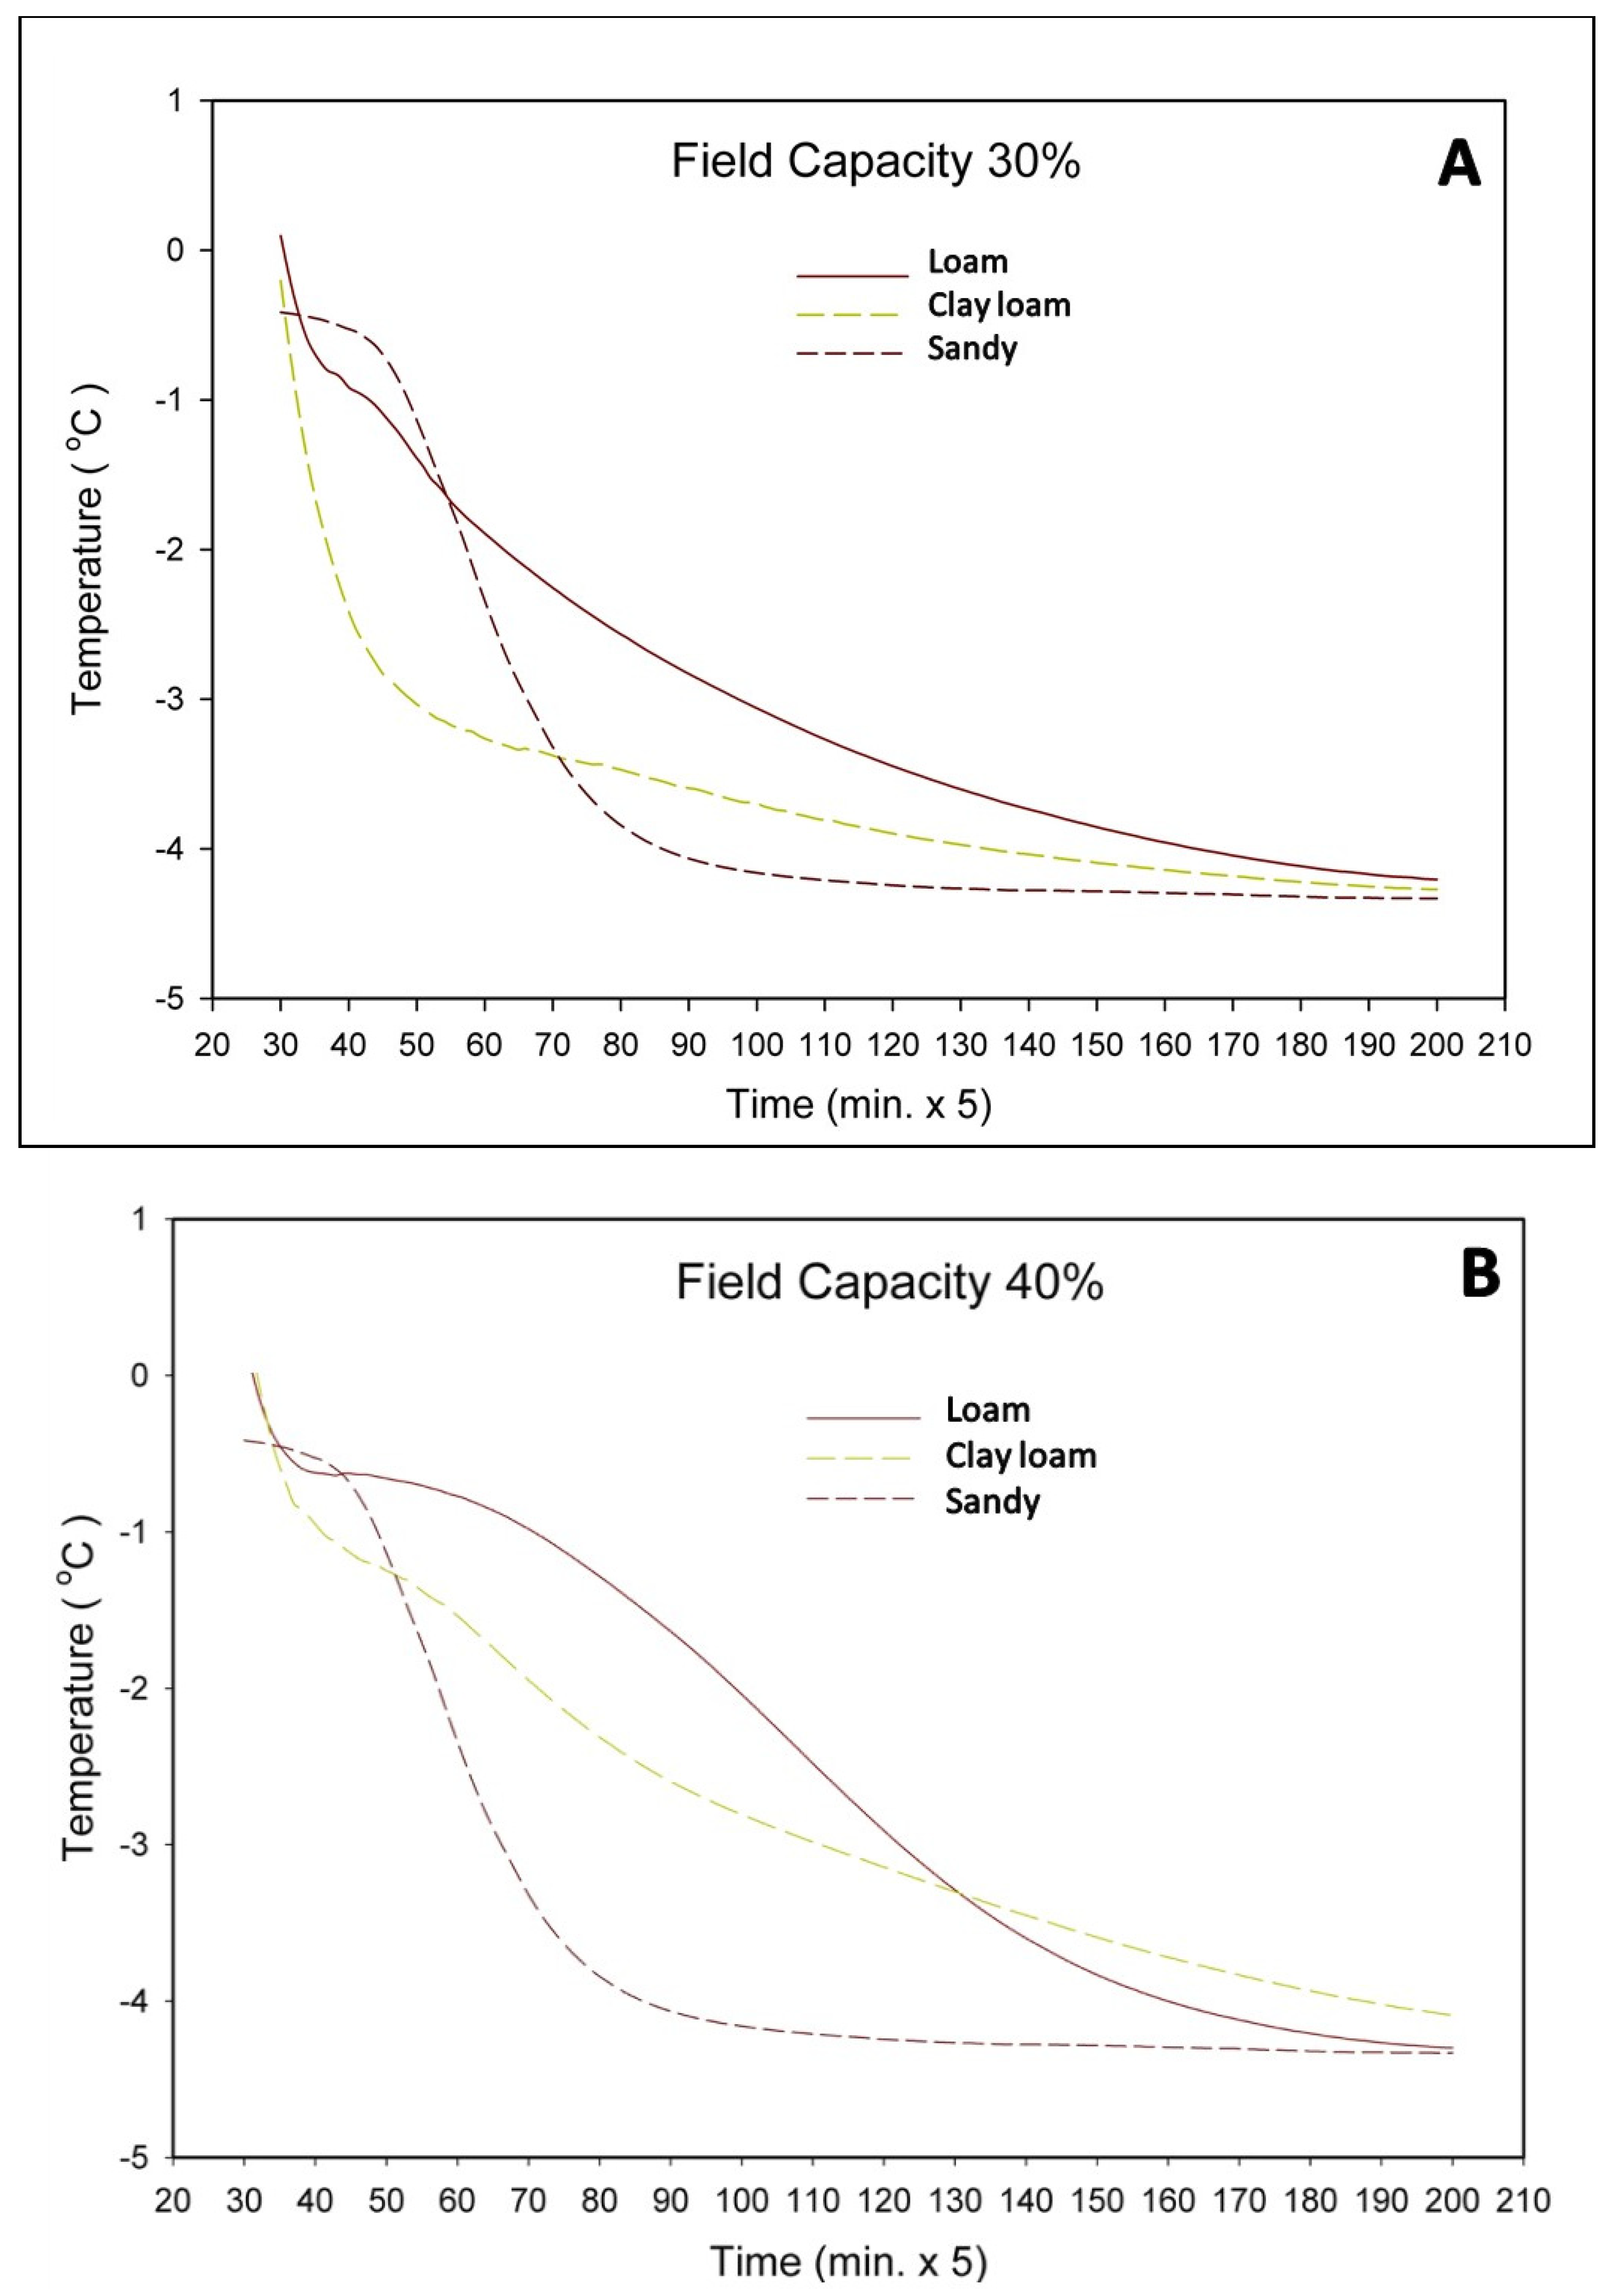
The difference in time to reach the threshold temperatures became larger as the temperature decreased, indicating an increase in the manifestation of the moisture effect as the threshold temperature decreased. The difference in time between the 30% and 40% moisture content was 35% (% of the 30% WHC) for the −0.5 °C threshold temperature, whereas it was 38% for the −2.0 °C threshold temperature. Examining the overall temperature pattern, the three soil types revealed unique freezing profiles (Figure 2) at both 30% and 40% FC. In general, all soil types at 40% FC remained at higher temperatures for longer periods of time compared to the same soil type at 30% FC.
The 10-year historical data shows that in most northern, mountainous regions in Georgia (USDA Zone 6a), in the period of 2010 to 2019, the soil temperature at a 5 cm depth dropped below 0 °C in six of these years—while in the predominately Metro Atlanta area (USDA (United States Department of Agriculture) Zones 8a and 8b)), the soil temperature dipped below 0 °C (lowest point, −1.63 °C in one year, on a single occasion) in four of those years. In many of these instances, the soil temperature remained in the 0 to −1.0 °C range for only a few hours (data extracted from Georgiaweather.net). Previous research shows that bare, non-acclimated tropical (non-hardy) plant roots and rhizomes did not survive temperature exposure at −1.5 °C [6]. However, the same roots and rhizomes survived temperature exposure at −1.5 °C in frozen soil-less media. Even though plants may not have cold hardiness, they may escape cold injury simply because the soil temperature (though frozen) remains above −1.5 °C for extended periods of time (Figure 2).
In addition to moisture content, the presence of salts (e.g., from fertilizer) has been shown to depress the freezing point of soil by means of an increase in osmotic pressure [11,15]. In subtropical climates, fertilizer salts are typically added to winter annual ornamental beds before the onset of winter. Another factor to consider is organic matter content in the soil and on the surface of the soil. While humus loam was supercooled to −4.2 °C, peat could be supercooled to −5.0 °C without freezing [8]. In agreement with these studies, the loam soil that took the longest time to reach the threshold temperatures had the highest total organic carbon and soluble salts (Table 1 and Table 3). Additionally, plant litter can modulate soil temperatures [16]. Mulch is routinely added to winter color beds, and recommendations frequently mention mulching to protect root systems) [17,18]. Thus, under real situations in such environments, the presence of salts and organic matter on the soil surface would likely play a role, which merits further investigation.
4. Conclusions
This study investigated soil freezing processes in three soil texture types and at two moisture contents. The three soil types revealed unique freezing profiles at both 30% and 40% field capacity. In general, all soil types at 40% FC remained at higher temperatures for longer periods of time compared to the same soil type at 30% FC. Based on climatological data from the most recent decade, soils in Georgia’s USDA Zones 6a (coldest) and 8a–b (largest urban population) experienced limited periods of subfreezing temperatures in the top 5 cm layer, and those periods were of short duration. It is possible that with careful attention and with the right combination of cultural techniques (i.e., adding moisture before subfreezing temperatures are anticipated, adding organic soil amendment, or including an insulating layer of mulch), sensitive plants could be successfully protected in subtropical climates.
Author Contributions
Investigation, S.V.P.; Methodology, S.V.P.; Writing—original draft, S.V.P.; Writing—review & editing, S.V.P.; Investigation, M.Y.H.; Methodology, M.Y.H.; Writing—original draft, M.Y.H.; Writing—review and editing, M.Y.H. All authors have read and agreed to the published version of the manuscript.
Funding
This research received no external funding.
Institutional Review Board Statement
Not applicable.
Informed Consent Statement
Not applicable.
Data Availability Statement
Not applicable.
Conflicts of Interest
The authors declare that they have no known competing financial interests or personal relationships that could have appeared to influence the work reported in this paper.
References
- United States Department of Agriculture (USDA). 2012. Available online: https://www.ars.usda.gov/news-events/news/research-news/2012/usda-unveils-new-plant-hardiness-zone-map/ (accessed on 18 May 2022).
- Bitelli, M.; Flury, M.; Campbell, G. A thermodielectric analyzer to measure the freezing and moisture characteristics of porous media. Water Resour. Res. 2003, 39, 1041–1044. [Google Scholar] [CrossRef]
- Gee, G.W.; Bauder, J.W. Particle Size Analysis. In Methods of Soil Analysis, Part I: Physical and Mineralogical Properties; Klute, A., Ed.; American Society of Agronomy, Inc., Soil Science Society of America, Inc.: Madison, WI, USA, 1986; pp. 404–408. [Google Scholar]
- Gardner, W.H. Water Content. In Methods of Soil Analysis, Part I: Physical and Mineralogical Properties; Klute, A., Ed.; American Society of Agronomy, Inc., Soil Science Society of America, Inc.: Madison, WI, USA, 1986; pp. 495–512. [Google Scholar]
- Cassel, D.K.; Nielsen, D.R. Field capacity and available water capacity. In Methods of Soil Analysis, Part I: Physical and Mineralogical Properties; Klute, A., Ed.; American Society of Agronomy, Inc., Soil Science Society of America, Inc.: Madison, WI, USA, 1986; pp. 902–915. [Google Scholar]
- Pennisi, B.; Lindstrom, O. Cold Hardiness of Elephant Ears (Alocasia and Colocasia). HortScience 2012, 47, S27. [Google Scholar]
- SAS Institute. SAS Guide for Personal Computers; Version 9.2. SAS Institute: Cary, NC, USA, 2016. [Google Scholar]
- Bouyoucos, G.J. Degree of temperature to which soils can be cooled without freezing. J. Agric. Res. 1920, 20, 267–269. [Google Scholar] [CrossRef]
- Bouyoucos, G.J.; McCool, M.M. Further Studies on the Freezing Point Lowering of Soils. In Technical Bulletin 31; Michigan Agricultural College Experiment Station: East Lansing, MI, USA, 1916. [Google Scholar]
- Ireson, A.M.; van der Kamp, G.; Ferguson, G.; Nachshon, U.; Wheater, H.S. Hydrological processes in seasonally frozen northern latitudes: Understanding, gaps, and challenges. Hydrogeol. J. 2013, 21, 53–66. [Google Scholar] [CrossRef]
- United States Department of Agriculture (USDA). Improvement of Saline and Alkali Soils. United States Salinity Laboratory Staff. Handbook No. 60. 1954. Available online: https://www.ars.usda.gov/ARSUserFiles/20360500/hb60_pdf/hb60complete.pdf (accessed on 1 May 2022).
- Soil Survey Staff. Keys to Soil Taxonomy, 11th ed.; USDA-Natural Resources Conservation Service: Washington, DC, USA, 2010.
- Spaans, E.J.A.; Baker, J.M. The soil freezing characteristics: Its measurement and similarity to the soil moisture characteristics. Soil Sci. Soc. Am. J. 1996, 60, 13–19. [Google Scholar] [CrossRef]
- Brady, N.C.; Weil, R.R. The Nature and Properties of Soils, 15th ed.; Pearson Education Inc.; Available online: https://www.pearson.com/uk/educators/higher-education-educators/program/Weil-The-Nature-and-Properties-of-Soils-Global-Edition-15th-Edition/PGM1100084.html (accessed on 18 May 2022).
- Ayers, A.D.; Campbell, R.B. Freezing point of water in soil as related to salt and moisture content of the soil. Soil Sci. 1951, 72, 201–205. [Google Scholar] [CrossRef]
- Henry, H.A.L. Soil freeze-thaw cycle experiments: Trends, methodological weaknesses and suggested improvements. Soil Biol. Biochem. 2007, 39, 977–986. [Google Scholar] [CrossRef]
- Pennisi, B.; Thomas, P. Success with Pansies in the Winter Landscape. University of Georgia Cooperative Extension Bulletin B1359. 2016. Available online: https://extension.uga.edu/publications/detail.html?number=B1359&title=Success%20with%20Pansies%20in%20the%20Winter%20Landscape:%20A%20Guide%20for%20Landscape%20Professionals (accessed on 18 May 2022).
- Westerfield, R. Winter Protection of Ornamental Plants. University of Georgia Cooperative Extension Circular C872. 2020. Available online: https://extension.uga.edu/publications/detail.html?number=C872&title=Winter%20Protection%20of%20Ornamental%20Plants (accessed on 18 May 2022).
Figure 1.
(A) Temperature-controlled chamber with containers filled with soil and thermocouples inserted at a depth of 5.08 cm (2 inches). (B) Close-up of thermocouple and bracket. Thermocouples were connected to a CR-7 datalogger (Campbell Scientific, Logan, UT, USA).
Figure 1.
(A) Temperature-controlled chamber with containers filled with soil and thermocouples inserted at a depth of 5.08 cm (2 inches). (B) Close-up of thermocouple and bracket. Thermocouples were connected to a CR-7 datalogger (Campbell Scientific, Logan, UT, USA).

Figure 2.
Freezing profiles of three soil types at two moisture contents: (A) 30% field capacity. (B) 40% field capacity. Each curve is based on two runs and four replications within each run.
Figure 2.
Freezing profiles of three soil types at two moisture contents: (A) 30% field capacity. (B) 40% field capacity. Each curve is based on two runs and four replications within each run.


Table 1.
Soil properties and locations where the soils used in the study were collected. Moisture content refers to the total water amount retained in the soil at the specified WHC. Abbreviations: Ap: plowed A horizon; WHC: water holding capacity.
Table 1.
Soil properties and locations where the soils used in the study were collected. Moisture content refers to the total water amount retained in the soil at the specified WHC. Abbreviations: Ap: plowed A horizon; WHC: water holding capacity.
| Soil ID | Textural Class | Place of Collection | Soil Series | Horizon | Total Water Amount, 30% WHC | Total Water Amount, 40% WHC | Total Organic Carbon | Soluble Salts |
|---|---|---|---|---|---|---|---|---|
| mL | % | mmhos/cm | ||||||
| S | Sand | South Georgia | Dothan | Ap | 67.3 | 86.4 | 0.55 | 0.07 |
| L | Loam | flood plain, South Georgia | Congaree | Ap | 138.8 | 184.9 | 1.43 | 0.10 |
| CL | Clay loam | Swale, North Georgia | Toccoa | Ap | 142.7 | 190.7 | 1.35 | 0.08 |
Table 2.
Time (in minutes) it took for each treatment (soil type x moisture content) to reach defined threshold values of −0.5 °C, −1.0 °C, −1.5 °C, or −2.0 °C from a chamber ambient temperature of 15 °C. Moisture content refers to 30% or 40% of water holding capacity. Mean comparison is valid within columns. Means followed by different letters are statistically significant at p < 0.05. Abbreviations: S, Sand; L, Loam; CL, clay loam.
| Treatment | Time to Reach Threshold Temperature (min) | |||
|---|---|---|---|---|
| −0.5 °C | −1.0 °C | −1.5 °C | −2.0 °C | |
| S-30% | 236 c | 252 e | 264 e | 274 e |
| S-40% | 255 b | 277 d | 292 d | 308 d |
| L-30% | 187 d | 299 b | 372 b | 445 b |
| L-40% | 344 a | 421 a | 483 a | 538 a |
| CL-30% | 162 e | 172 f | 184 f | 202 f |
| CL-40% | 193 d | 284 c | 350 c | 420 c |
| p value | <0.0001 | <0.0001 | <0.0001 | <0.0001 |
Table 3.
Time (in minutes) it took for each soil type and moisture content to reach defined threshold values of −0.5 °C, −1.0 °C, −1.5 °C, or −2.0 °C from an ambient temperature of 15 °C. Means are averaged within soil type or moisture content. Moisture content refers to 30% or 40% of water holding capacity. Mean comparison is valid within columns. Means followed by different letters are statistically significant at p < 0.05. Abbreviations: S, Sand; L, Loam; CL, Llay Loam.
| Soil Texture Type | Time to Reach Threshold Temperature (min) | |||
|---|---|---|---|---|
| −0.5 °C | −1.0 °C | −1.5 °C | −2.0 °C | |
| S | 246 b | 264 b | 278 b | 311 b |
| L | 265 a | 360 a | 427 a | 491 a |
| CL | 177 c | 228 c | 267 c | 291 c |
| p value | <0.0001 | <0.0001 | <0.0001 | <0.0001 |
| Moisture Content | ||||
| 30% | 195 b | 241 b | 273 b | 307 b |
| 40% | 264 a | 327 a | 375 a | 422 a |
| p value | <0.0001 | <0.0001 | <0.0001 | <0.0001 |
Publisher’s Note: MDPI stays neutral with regard to jurisdictional claims in published maps and institutional affiliations. |
© 2022 by the authors. Licensee MDPI, Basel, Switzerland. This article is an open access article distributed under the terms and conditions of the Creative Commons Attribution (CC BY) license (https://creativecommons.org/licenses/by/4.0/).
Share and Cite
MDPI and ACS Style
Pennisi, S.V.; Habteselassie, M.Y. Laboratory-Scale Study on the Effects of Freezing in Soils when Subjected to Different Moisture Content. Water 2022, 14, 1892. https://doi.org/10.3390/w14121892
AMA Style
Pennisi SV, Habteselassie MY. Laboratory-Scale Study on the Effects of Freezing in Soils when Subjected to Different Moisture Content. Water. 2022; 14(12):1892. https://doi.org/10.3390/w14121892
Chicago/Turabian StylePennisi, Svoboda V., and Mussie Y. Habteselassie. 2022. "Laboratory-Scale Study on the Effects of Freezing in Soils when Subjected to Different Moisture Content" Water 14, no. 12: 1892. https://doi.org/10.3390/w14121892
Note that from the first issue of 2016, this journal uses article numbers instead of page numbers. See further details here.