
Using a Grey Niche Model to Predict the Water Consumption in 31 Regions of China


1
College of Management Engineering and Business, Hebei University of Engineering, Handan 056038, China
2
Hebei Key Laboratory of Intelligent Water Conservancy, Hebei University of Engineering, Handan 056038, China
*
Author to whom correspondence should be addressed.
Water 2022, 14(12), 1883; https://doi.org/10.3390/w14121883
Submission received: 28 March 2022
/
Revised: 8 June 2022
/
Accepted: 9 June 2022
/
Published: 11 June 2022
(This article belongs to the Special Issue Optimization and Prediction of Water Quality Model Based on Artificial Intelligence)
Abstract
:Regional development brings significant changes in industrial structure and water consumption. Researching the trend in water consumption by changes in industrial structure can promote water conservation. The grey niche model describes the industrial changes in China and analyzes the water consumption of different leading industries. Using data from 2014 to 2019, and taking the economy as the influencing reason and the industrial niche as the weight, water consumption was predicted. The average percentage errors of the prediction results were all less than 0.1%. While improving the forecasting accuracy, the water consumption forecasting has been strengthened. The calculation results show that regional industry is undergoing transformation, and tertiary industry is rising in the national economy. The successful implementation of industrial water-saving measures has kept the water consumption of industrially developed cities stable but the rapid development of tertiary industries will increase water consumption. Incorporating changes in industrial structure into water use analysis allows the Chinese government to draft water conservation policies for various industries.
1. Introduction
Global water shortage is a difficult problem that human beings need to face together. Terrestrial freshwater assets account for only 6% of international water assets. Among them, 77.2% are in Antarctica, and 22.4% are distributed in the deep earth, which is difficult to develop. Only 0.4% of freshwater is available for human life. Efficient conservation and use of water is of high value to humanity, and water is also the basic guarantee of economic development and construction. Scientific forecasting of water consumption is the premise and basis for drafting water improvement and use plans. This is of great significance and value for realizing the rational share of water and coordinating social and economic improvements [1].
Predicting water consumption has been carried out all over the world, and select water consumption prediction methods have an important influence on the predicted results [2,3,4]. Most scholars use traditional forecasting models. For example, Zhu Bo and others applied the ARIMA entity model to the Hefei water consumption coding sequence to forecast and analyze the water consumption of Hefei over the next two years [5]. Leon Lee P. used soft computing technology to predict water consumption in Tobago and other areas [6]. Li Xuan took Jining as a typical city to analyze the trend in water consumption, and found that its water consumption decreased yearly, and the water consumption developed in a stable direction [7]. However, the change in water consumption is nonlinear, and the methods have some limits in sensible application. The deep learning and integration method has a good application in water consumption forecasting [8,9,10]. For example, Guancheng Guo studied the application possibilities of deep mastering in momentary water consumption forecasting, and settled on a gated recursive unit community model to forecast temporary water consumption [8]. To efficaciously deal with the weekly and annual seasonal integrated models that influence the data, a program of developing an integrated neural network model was used for the short-term prediction of water consumption of small-scale water supply [9]. However, a BP neural network is one of the most used methods in deep learning methods. Because of its strong self-learning ability and generalization skill, it has achieved better results in water quality prediction [10]. Although deep learning can solve the problem of prediction accuracy, it needs many data to support its prediction, and it cannot consider the influencing causes of water consumption.
For water consumption, accurate estimation usually needs to solve the problems of multi-measurement, mixed model and space–time, and single model has strong limits in engineering application. A combined model consisting of multiple models can solve many of the above problems. In addition, scholars have also carried out a series of studies on the use of combined models to predict water consumption. Julia K.A. builds an accurate water consumption prediction model, a single machine learning model, through an ensemble of committee machines. Two water demand datasets from Franca, Brazil, claimed that their responses were better than any single-component model [11]. Then, a superposition model, based on four models, was applied to the real consumption data in the UK, and it was superior to the other water consumption forecasting techniques [12]. Salah L. Z. puts forward a new method of forecasting monthly water consumption based on various weather climates, which uses three methods, including discrete wavelet analysis, to predict water consumption under variable scenarios [13]. The model, composed of multiple models, has strong application value in the research of water consumption forecasting.
Recently, the shortage of water has become a significant problem, and there is the risk that the process of urbanization will be restricted [14]. Under the condition of limited water, it is necessary to keep the continuous growth of the economic scale. Besides strengthening water management, promoting water-saving technologies and appliances, and other water-saving measures are also important. It is necessary to study how to reduce water consumption according to changes in economic and industrial structure. This will reduce the impact of a limited water supply on the national economy. Developing China’s urban economy has brought about the obvious changes in industrial structure and water consumption [15]. Scientific application of industrial structure change to analyze future water consumption is the premise and foundation of water management, and it is of great significance to solve contradictions in water use and ensure the sustainable development of cities. Jiao Shixing and others used niche theory to analyze and assume that industrial structure will affect water consumption [16]. Taking industrial structure as a reason to discuss the change in water consumption is also important [17,18,19,20]. There are few water data in China; however, the gray prediction model is able to extract valuable information from poor information. The characteristics of the grey prediction model make up for the lack of incomplete water consumption information, so it is widely used [21,22,23]. Zhengran Qiao settled the fractional cumulative grey forecasting model (FGM(1,1)) to forecast the water consumption in various regions of China, and the results showed that the total water consumption demonstrated little change [24]. The traditional single variable grey forecasting model only considers the change in water consumption when forecasting water. However, the change is influenced by many reasons, so the grey multivariable model is in widespread use. Xiangmei Meng puts the near collection operator into the grey multivariate convolution model to foretell the annual water consumption in various regions of China under different GDP and population growth rates [25]. The grey multivariate model is not only applicable to the foretelling of water consumption with little data, but also it can consider the reasons affecting water. Afterwards, Zhicun Xu proposed a non-equidistant GM(1,1) model (CGM(1,1)), which has a better fitting degree of prediction [26]. The CGM(1,1) model has higher prediction accuracy for non-equidistant influencing reasons, and it is used as the basic model of the prediction model. Combining the first niche theory with the grey prediction theory to predict water consumption can not only consider the industrial structure change as the influencing reasons, but also solve the problem of little water consumption data in China in recent years.
Traditional models have many shortcomings, including the low prediction accuracy, the large data need of the deep learning model, and the small consideration range of the single model. In this study, a combined niche theory and grey prediction method is used to analyze the change in industrial structure and its impact on water consumption. First, the grey prediction model CGM(1,1) considers the reasons affecting water consumption. It is concluded that the economic development has caused obvious changes in industrial structure and water consumption, so the three major industries are used as influencing reasons to predict water consumption. Second, the niche theory can calculate the three major industries, get the niche of each industry, and directly view the change in regional industry structure and its strength and weakness. Finally, using the niche coefficient as the weighting coefficient, the water consumption, under the structure of the three major industries in each region, is calculated. The water consumption will exist under the simultaneous influence of the three major industries in each region in the future. The water consumption forecasting model, based on the industrial niche (W-CGM(1,1)) put forward in this study, not only has the advantages of grey forecasting theory with less data and high accuracy, but it also shows the change in industrial structure directly and calculates it as a part of the forecast, which makes the forecast result more accurate. The calculated data results can provide a basis for all parts to develop water-saving measures under the change in industrial structure.
2. Materials and Methods
2.1. Regions and Data
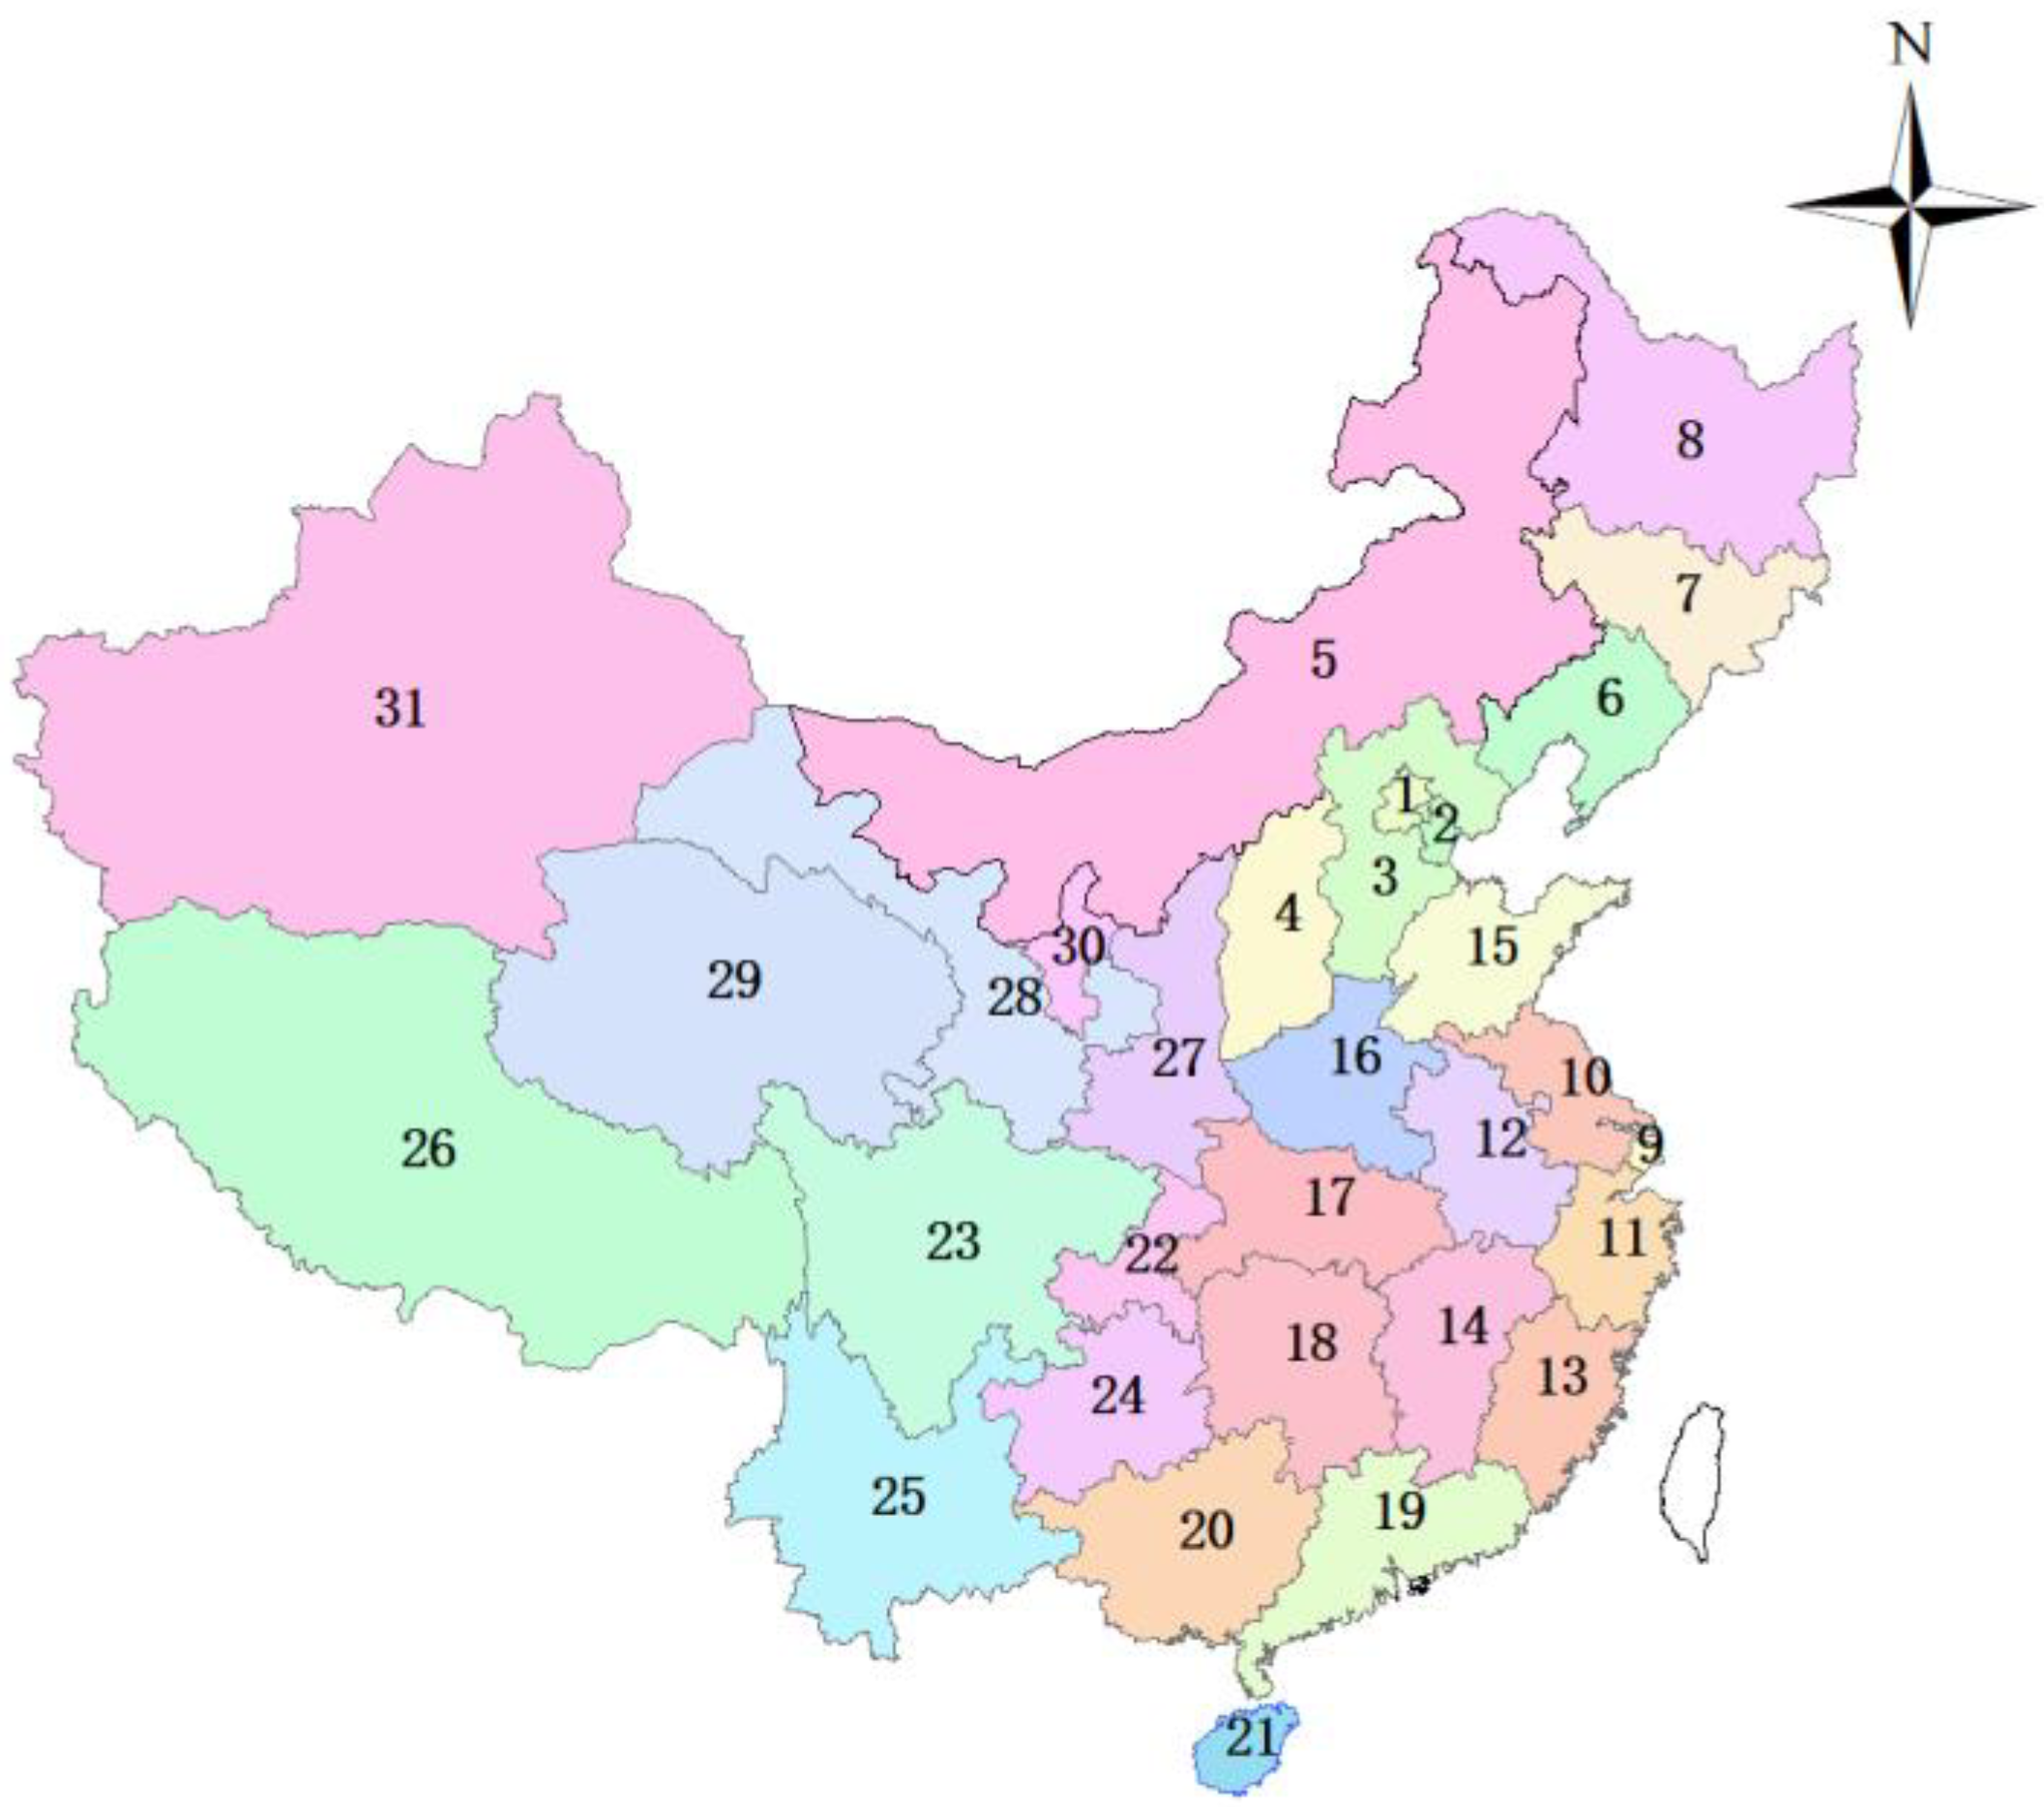
This study will conduct research on 31 regions of China, as shown in Table 1. The detailed geographic locations of China’s 31 provinces are presented in Figure 1. While China’s international status has improved, the tertiary industries have also reached a new era of rapid envelopment. The part played by China’s tertiary industries in the national economy has continued to increase (http://www.stats.gov.cn. 19 September 2021). What follows is a shortage in water supply. In addition, the developments of industries in different regions are different, and there are also many differences in the demand for water. Therefore, it is essential to conduct industry analysis and water consumption forecasts across China.
This study analyzes the changes in China’s industry and its impact on the total regional water consumption. In this study, the industrial added value of various regions in Chine is the influencing reason to predict the regional water consumption, as shown in Table 2. The data in this study are the industrial added value and water consumption data from 2014 to 2019, and the source is the China Statistical Yearbook. Due to the limited number of samples, grey theory can be used for analysis. On this basis, the niche theory is used to analyze the change process of industrialization and combined niche theory and grey prediction theory is used to predict water consumption in China.
2.2. Predictive Model
2.2.1. CGM(1,1) Model
Let be the original sequence and be the influencing factor sequence. If the gap is , is called a non-equigap sequence. In this study, is the water consumption in each region, and is the added value of each industry in each region. is the order cumulative sequence of
where
The range of is . The specific value of is obtained by the particle swarm optimization algorithm (PSO), which aims to find the optimal value that minimizes the prediction error.
The contiguous mean generation sequence of the non-equigap sequence is , where
The mean value formula of CGM(1,1) is
Its whitening differential equation is
The development coefficient is and grey action is . The least square estimation of CGM(1,1) model satisfies
where
The initial condition of the differential equation in Equation (4) is
is time responsive.
Therefore, the reduction sequence of can be obtained as
In grey systems, Equation (10) is usually used to measure model stability.
The prediction model uses the MAPE value as the evaluation standard (Table 3.). It is generally believed that the model has a high predictive power when the MAPE is lower than 10%. The MAPE of the foretelling results of different models for the same set of data can be compared, and the model with a better prediction effect can be selected.
2.2.2. Niche Model of Industrial Structure
The industrial structure niche reflects the status and role of different types of industries in the regions [16]. The calculation formula of the industrial structure niche model is [17]
where: is the niche of the similar industry, . The larger the , the larger the value-added of the type industry, and the larger the contribution to GDP growth. is the added value of the type industry. is the dimensional conversion coefficient, which is related to the time scale, and the value is 1 when calculating. is the difference between the research year and the initial year type industry added value. Moreover, represents the added value of China’s industry, respectively, and is the mean value of the type industry niche.
where: is the utilization rate of water consumption by the type industry.
2.2.3. Grey Niche Model (W-CGM(1,1) Model)
The niche model of the industrial structure shows the changing trend in the industrial structure, and the CGM(1,1) model predicts the water consumption of each region under the influence of the industry. Using the industrial niche as the weight for the water consumption prediction results to gain the final regional water consumption, that is, the W-CGM(1,1) model
where, is the regional water consumption, and is the regional water consumption under the influence factors of different industries, is the utilization rate of water consumption by the type industry.
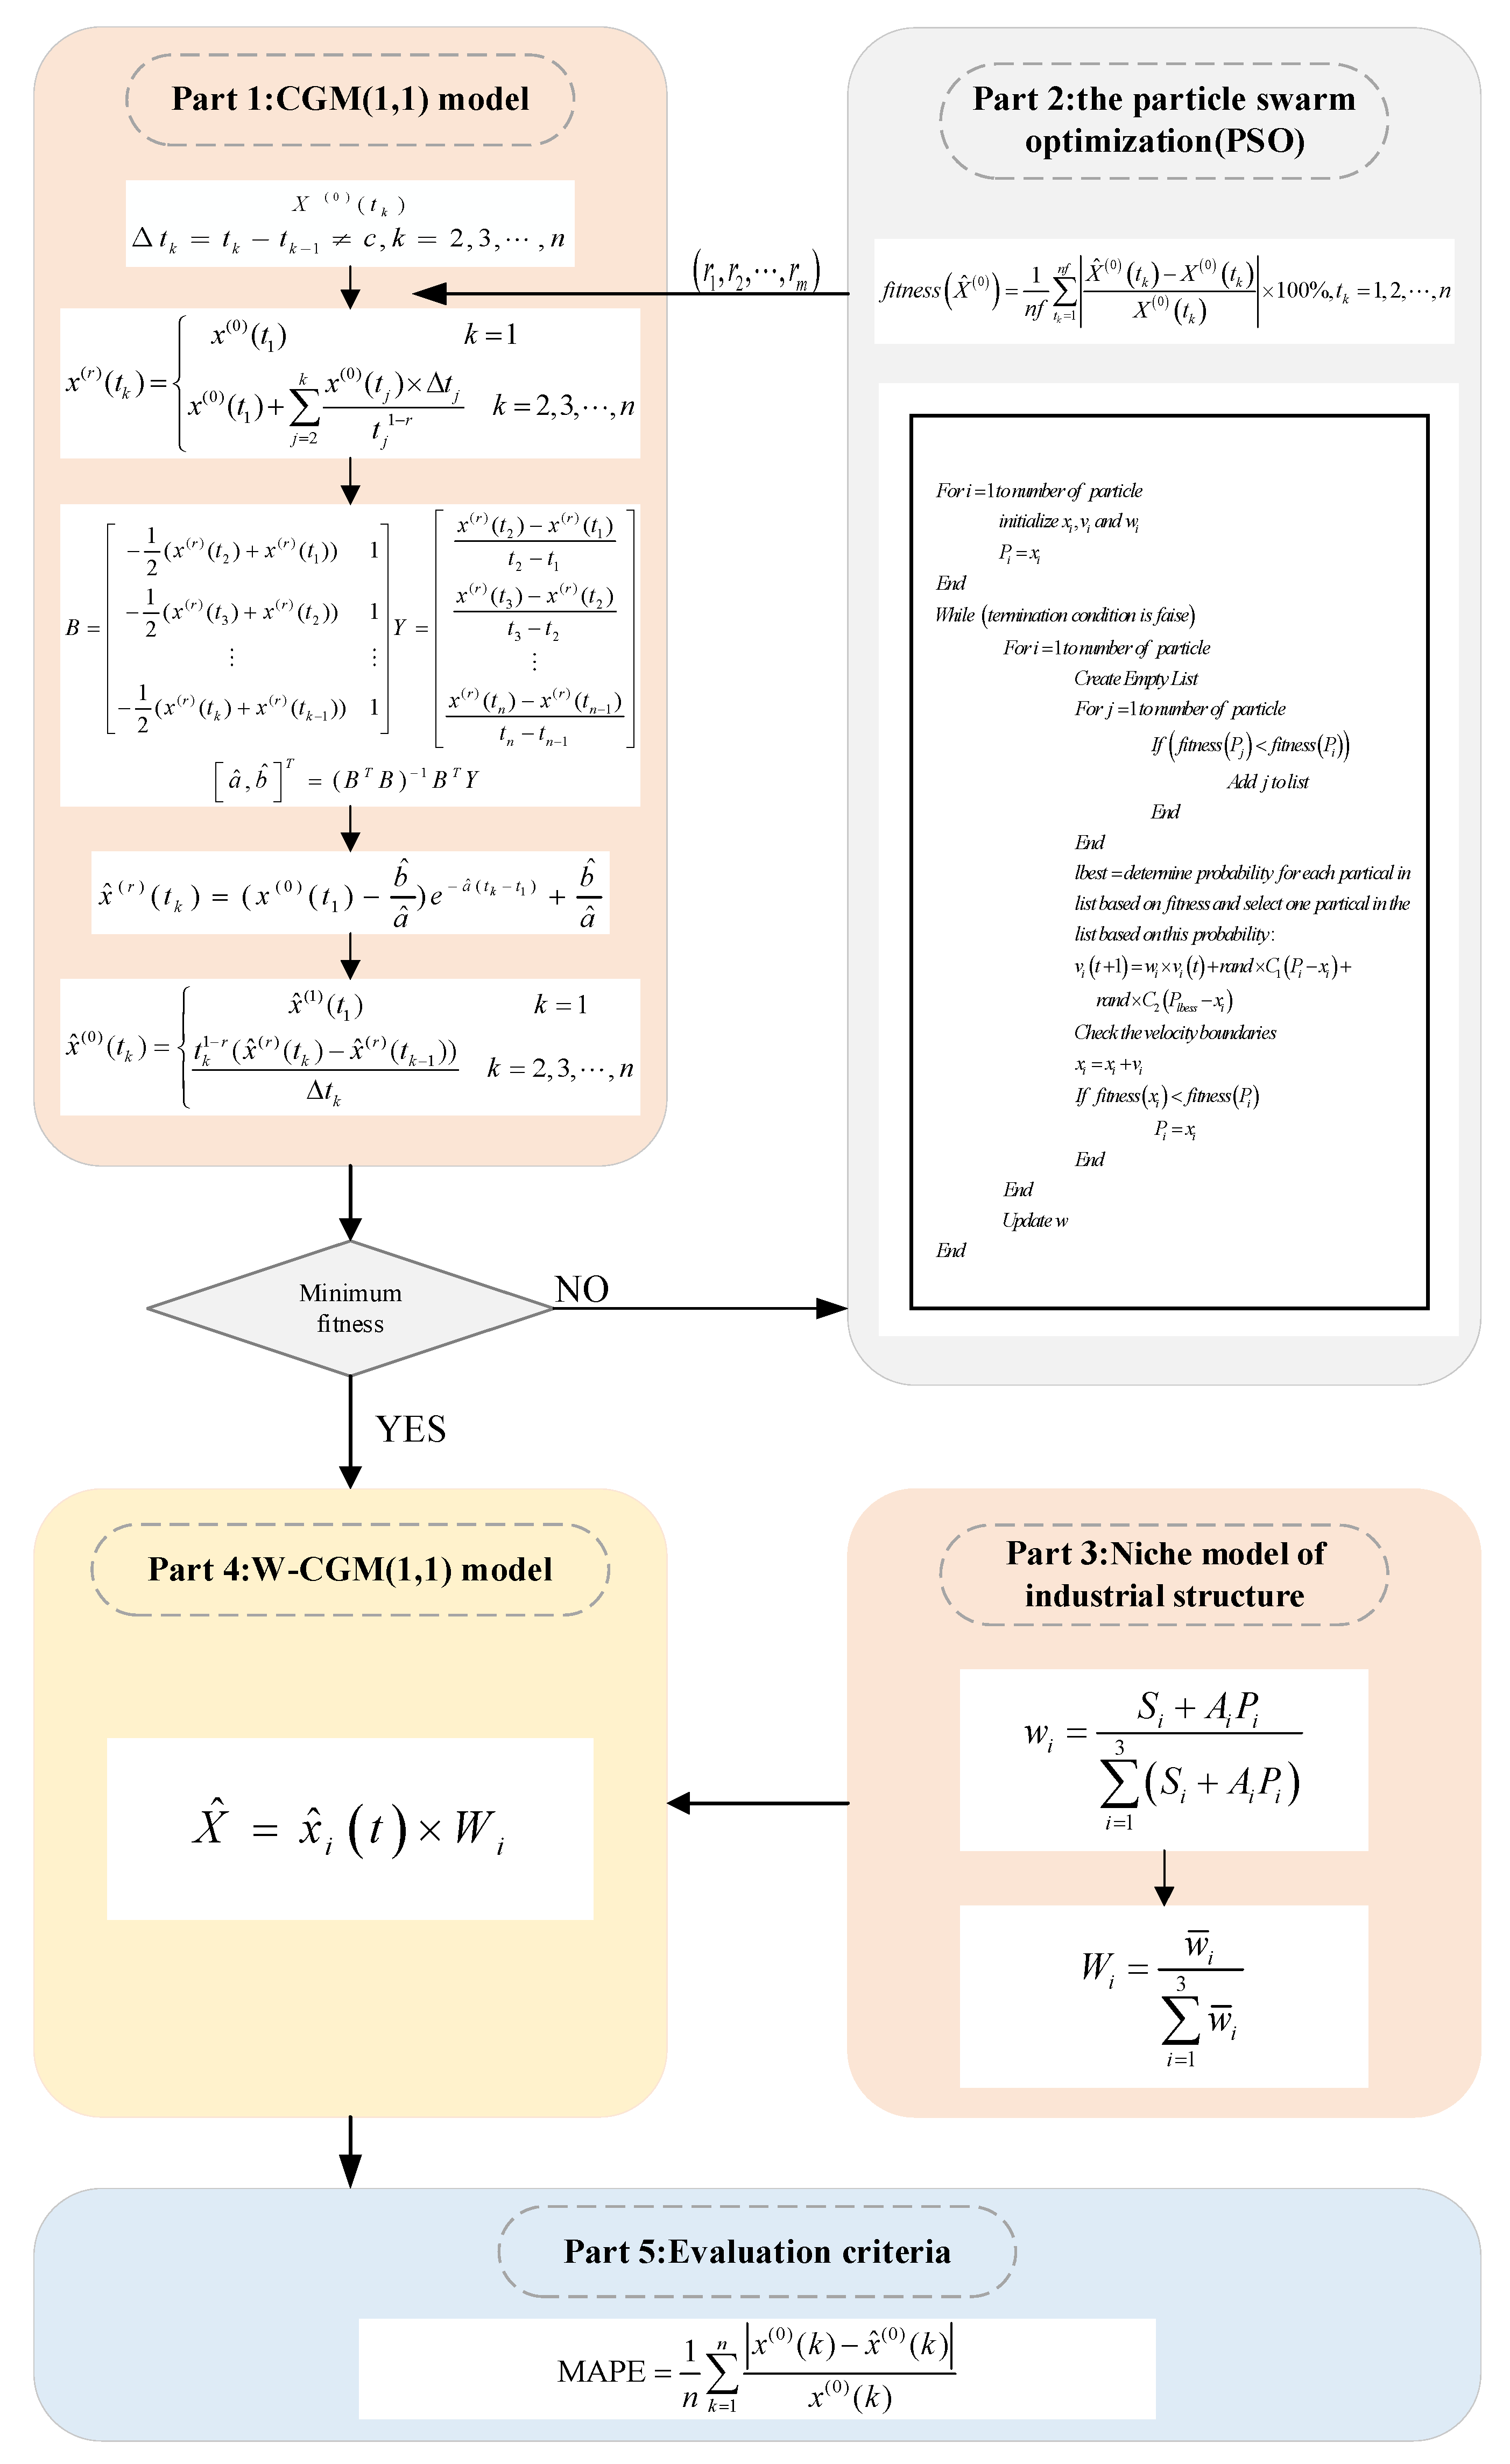
2.3. Calculation Process
These standardized data are used to predict water consumption in 31 regions and cities in China. The calculation process of the W-CGM(1,1) model is presented in Figure 2. Beijing is the capital of China and always represents the direction of China’s development. The calculation process of water consumption in Beijing is shown in Figure 2. The results can be used as a reference for other cities in China. In addition, the effectiveness of the model can be further demonstrated.
Taking the added value of the primary industry as an explanatory variable, the initial sequence is . Water consumption is the explained variable, and the initial sequence is .
Step 1 The is calculated.
Step 2 The optimal order is obtained by the particle swarm algorithm (PSO), and then the cumulative sequence is obtained.
Step 3 The non-equidistantly spaced generation sequence is
Step 4 The expression of and is
The least square method calculates the parameters and .
Step 5 Put the calculated parameters into Equation (8).
Step 6 The cumulative reduction sequence is
Putting the calculation result into Equation (10), the MAPE value is 1.23%.
Step 7 Calculate the added value of Beijing’s secondary industry from 2020 to 2025.
Step 8 The time response sequence of Beijing in the next 6 years is
Step 9 The forecast value of water consumption in Beijing from 2020 to 2025 is
Through calculation, the water consumption in Beijing from 2020 to 2025 under the influence of the tertiary industries is shown in Table 4.
The industrial niche of Beijing from 2014 to 2019 is calculated by Equation (12), and the results are shown in Table 5.
The data in Table 5 were used to calculate Beijing’s water consumption over the next 6 years, and the effects are detailed in Table 6. The forecasting results gained by the W-CGM(1,1) model were compared with other models with better prediction effects. The traditional grey prediction model (GM(1,1)), and the grey prediction model (FGM(1,1)) after fractional collection are used here. The results show the MAPE of the W-CGM(1,1) model is smaller, and the smaller error means a higher prediction accuracy. The prediction results of the GM(1,1) model and the FGM(1,1) model are consistent, showing that improving the model only by improving the cumulative calculation is not helpful for this research.
The W-CGM(1,1) model proposed in this study first uses a few data collected to predict water consumption according to the effects of different industries. Second, the industry niche model is used to measure the three major industries in the region, and to show the changes in the industrial structure from 2014 to 2019. Finally, using the industrial niche as the weight for the predicted water consumption under acting industrial reasons, the regional water consumption in the next 6 years was obtained. The W-CGM(1,1) model solves practical problems such as having less water consumption data, small data changes, and the role of influencing reasons. The following will directly use the W-CGM(1,1) model to analyze and predict the changes in industrial structure and water consumption in 31 regions of China.
3. Results and Discussion
3.1. Discussion on the Dynamics of the Industrial Niche
According to Equation (12), the niche of the industrial structure of 31 regions in China is calculated. The niche of the tertiary industry was found to be basically in a downward trend. Only seven regions (Tianjin, Jiangxi, Shanxi, Inner Mongolia, and the three provinces of Northeast China) have seen a slight rebound in the niche of the primary industry in 2019. The niche of the secondary industry in Tianjin, Jilin, and Heilongjiang rebounded slightly in 2019. The niche of the secondary industry in Hebei is showing an upward trend. Only six regions (Hebei, Tianjin, Heilongjiang, Anhui, Shandong and Qinghai) showed an uptrend in the niche of the tertiary industry.
The industrial structure of different regions in China is not identical. According to the industrial niche, 16 regions have undergone industrial transformation in recent years. They are Hebei, Jilin, Shanxi, Inner Mongolia Autonomous Region, Liaoning, Anhui, Jiangxi, Shandong, Henan, Hubei, Hunan, Guangxi, Sichuan, Qinghai, Ningxia and Xinjiang. Fujian and Shaanxi continue to take the secondary industry as the leading industry, while the tertiary industry in the remaining cities is relatively developed. With China’s economy developing, the most obvious feature of the evolving industrial structure is the steady decrease in the percentage of tertiary industry in the national economy [18]. For enhanced research, the average value of the industrial niche of 31 regions in China, from 2014 to 2019, will be calculated and classified according to the industry orientation, as shown in Table 7.
3.2. Discussion on Water Consumption
Water consumption in China is predicted by the W-CGM(1,1) model. The following will explore regional water consumption based on the leading industries. As a large agricultural country, about 70% of China’s water is used for agricultural development [19]. However, China’s is undergoing an industrialization and urbanization reform process. The population continues to grow, and the continuous increase in industrial and urban water consumption has caused a continuous decrease in agricultural water consumption [20]. The changes in water consumption mainly depend on developing secondary and tertiary industries. This will be analyzed based on the classification in Table 6.
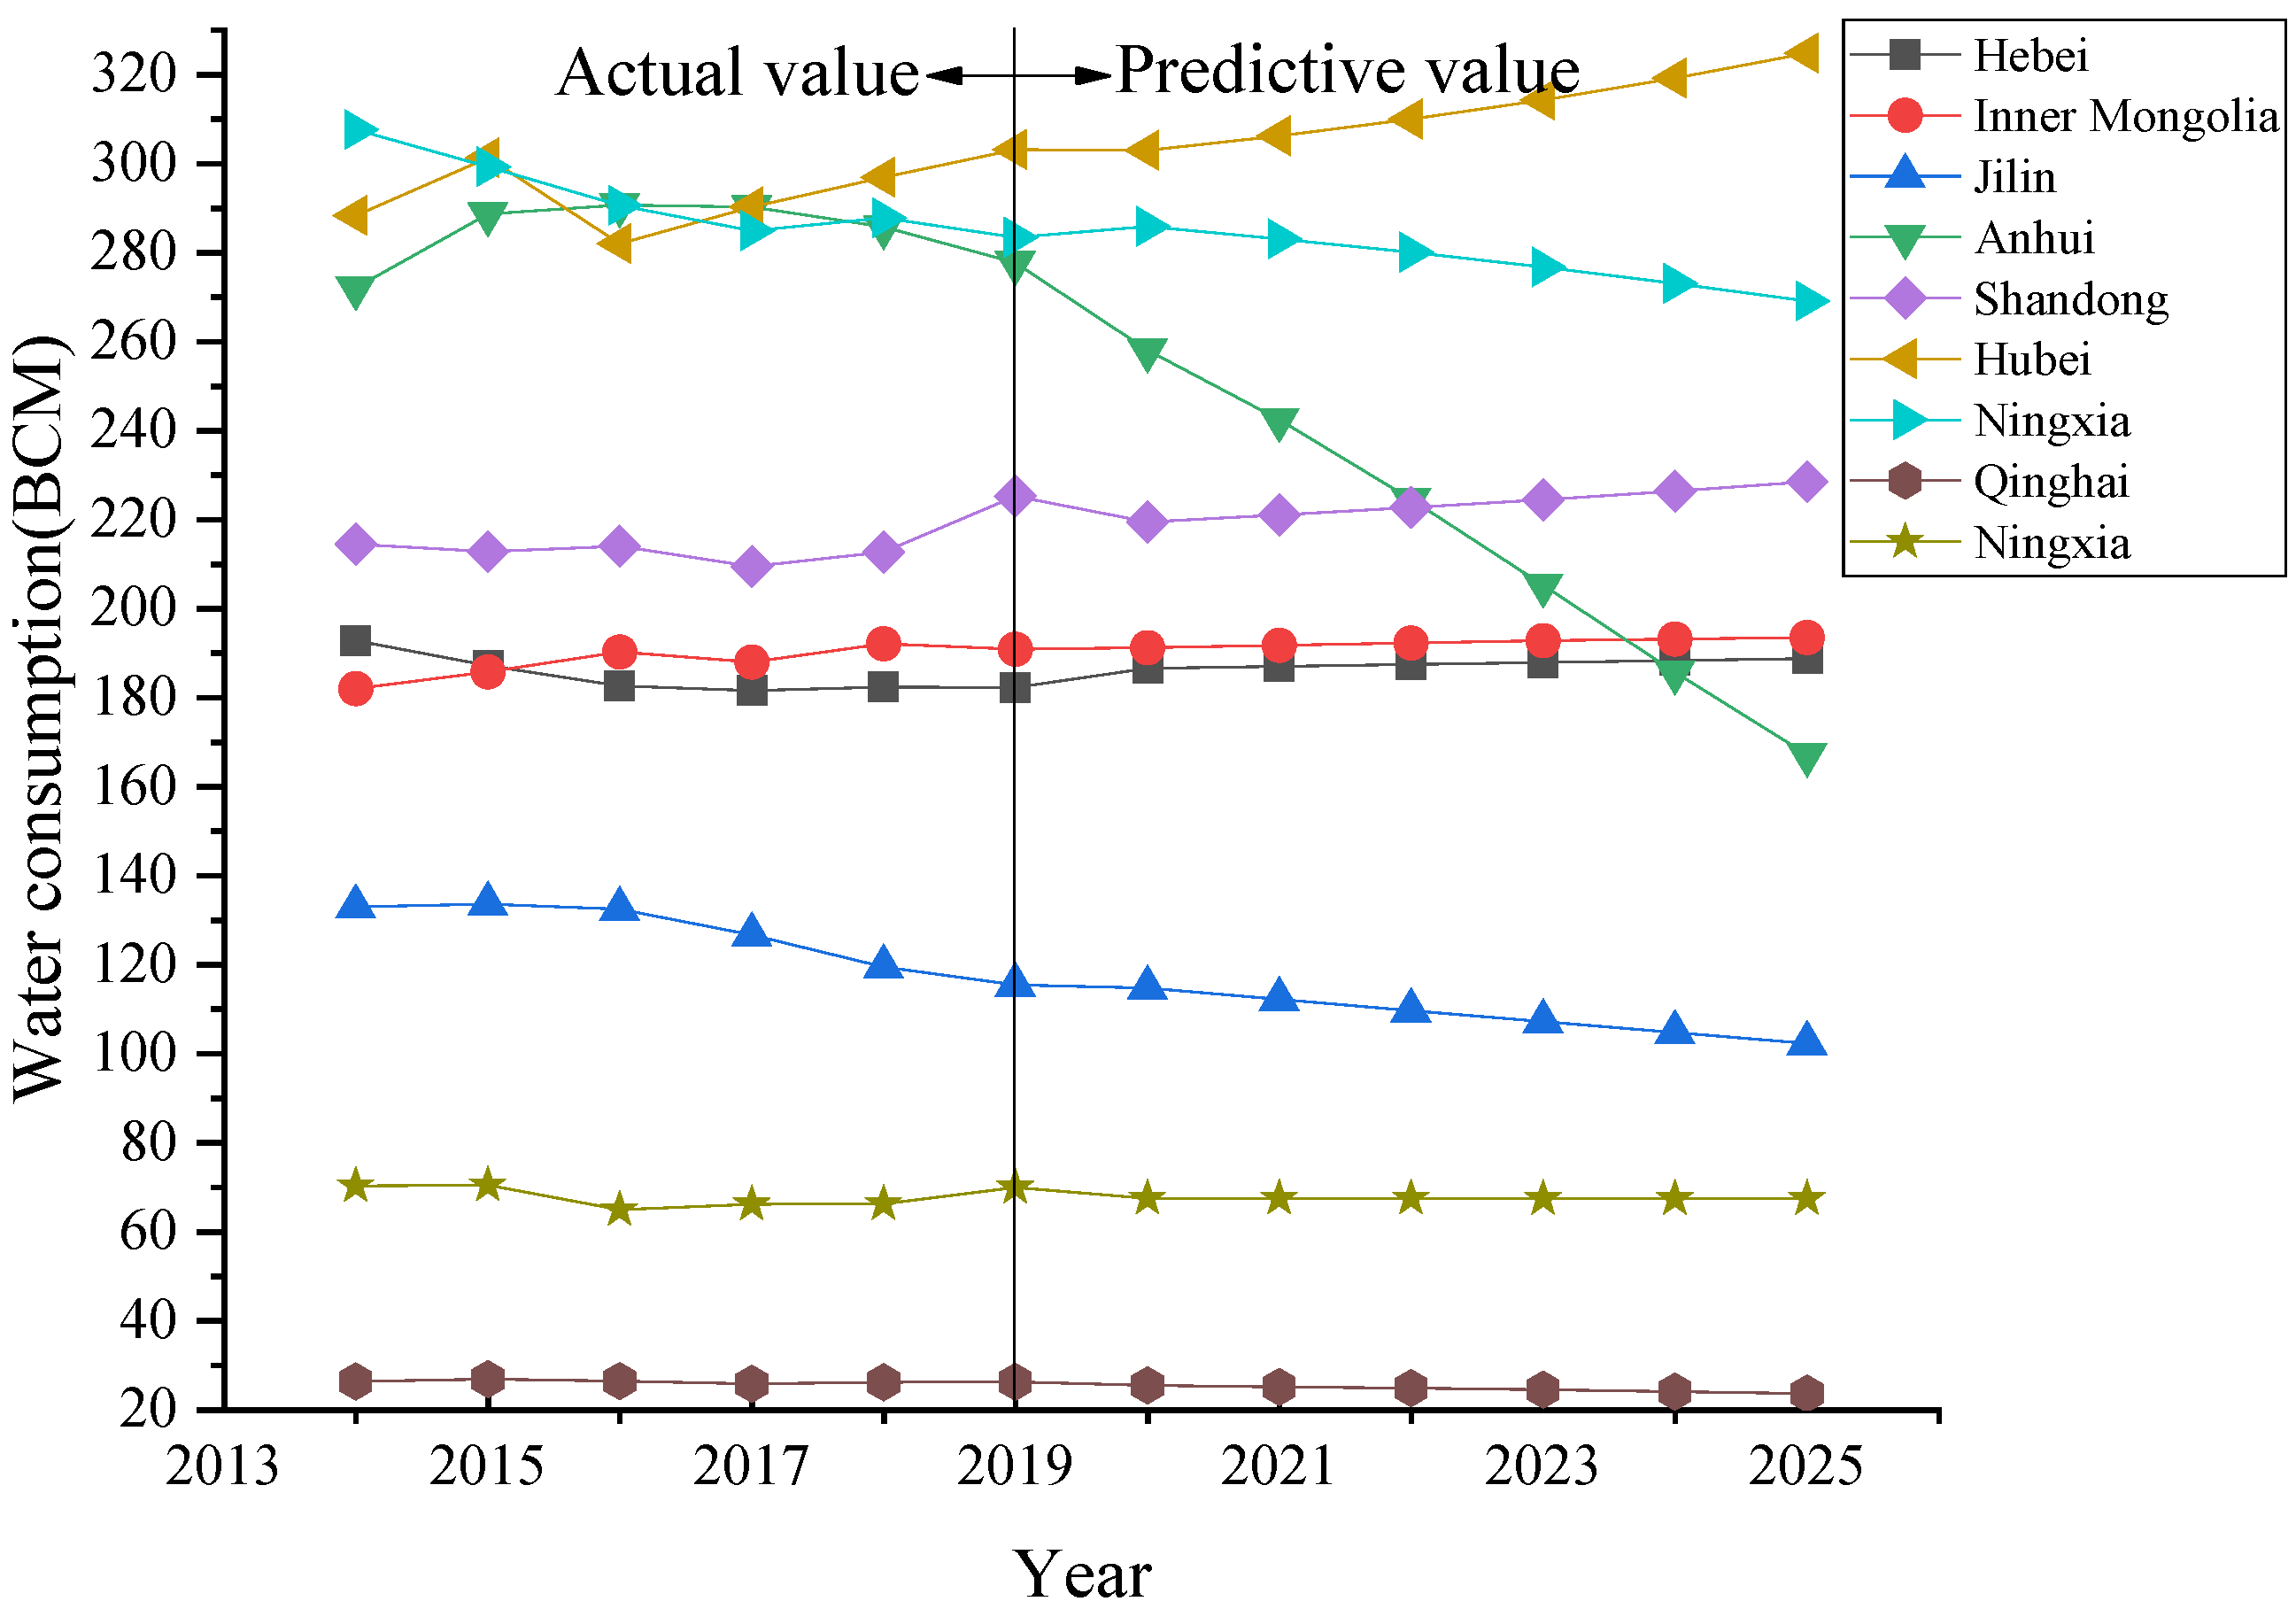
The predicted results of the area of water consumption led by secondary industries, and jointly led by the secondary and tertiary industries, are shown in Figure 3 and Figure 4. Regional water consumption shows a trend of declining and flattening. As early as 2010, researchers found that industrial water accounted for much of the total water consumption [21]. Therefore, industrial water saving has become a compulsory course to maintain water. Under the supervision of government departments, industrial enterprises have adopted methods such as the reuse of water resources and detailed treatment of sewage to save water, ensuring that the use of water resources is minimized while the industry continues to develop. This will also lead to the continuous development of the secondary industries in cities dominated by secondary industries, but there will be no significant increase in water consumption. Fujian and Anhui, respectively, issued Fujian Province Water Conservation Management Measures and Anhui Province Water Conservation Regulations to strictly control water consumption and achieved obvious results (http://slt.fujian.gov.cn 19 September 2021, http://www.bengbu.gov.cn 19 September 2021). Therefore, the water consumption of the two provinces has continued to decline significantly since 2016.
Figure 5 shows the results of regional water consumption led by the tertiary industries. Regional water consumption will remain flat over the next six years. Water consumption in Guangdong, Heilongjiang, Sichuan and Zhejiang will decline, while water consumption in Jiangsu will show an upward trend. The proportion of tertiary industries of the total national economy has gradually increased, which is the certain result of developing social productivity and the standard of social progress [22]. The rapid growth of the industrial scale is the decisive reason for the growth of water demand in tertiary industries. The high water use in the tertiary industries is mainly from the accommodation and catering industry [23]. However, COVID-19 has swept the world and will have a serious impact on China’s tourism and catering industries, and will slow down the water consumption of the tertiary industries.
4. Conclusions
This is a study that combines niche theory and grey theory to calculate water consumption in various regions of China undergoing changes in industrial structure. This study uses the W-CGM(1,1) model to analyze industrial changes in China from 2014 to 2019, and forecast the change in water consumption in 31 regions of China over the next 6 years. The W-CGM(1,1) model makes good use of a few industries and the water consumption data collected, and predicts water consumption as an influencing reason. In addition, calculating the industrial niches shows the industrial structure changes in China from 2014 to 2019 in 31 regions. According to the weights of industry niches, the water consumption for various reasons is weighted and, finally, the water consumption over the next 6 years is obtained. The result is not just a single datum on the amount of water used in the future, but it details the water used under industrial action, which is not achieved by other single and combined models.
Under the situation of limited water, the adjustment of industrial structure is conducive to the recognition of sustainable financial development. According to the calculation results of the W-CGM(1,1) model, most regions in China are undergoing or have completed industrial structure transformation. There is no significant change in the predicted water consumption over the next 6 years, compared with the past. The booming Chinese industry has resulted in a serious waste of water resources. Resulting industrial water-saving measures have slowed or reduced the growth of industrial water consumption. In addition, China’s service industry progress is the sure result of modernization, which will inevitably increase water consumption. However, the outbreak of COVID-19 has made growth in China’s tertiary sector even slower. Therefore, there is no crucial increment in the predicted water consumption under the influence of the three major industry types. The research conclusions therefore support China’s aim to establish themselves as a water-saving country. Through industrial structure adjustment, two suggestions are put forward for the best use of incoming water: (1) Continuation of industrial adjustment and gradual industrial water-saving. To achieve economic development under the existing water availability, modern service industries such as the financial industry should be vigorously developed. (2) Timely adjustment of the regional industrial layout and economic development planning to address the shortage of water, environmental degradation, and other modernization problems. It is difficult to rely on a single area to solve this problem on its own. It is necessary to coordinate the entire Chinese region to consider the allocation of industries, population and resources, to promote China to form an economic circle with an overall coordinated development.
Author Contributions
Methodology, X.P.; formal analysis, X.P. and K.C.; data curation, X.P.; writing—original draft preparation, X.P.; writing—review and editing, L.W. and K.C. All authors have read and agreed to the published version of the manuscript.
Funding
This research was funded by the National Natural Science Foundation of China (U20A20316), Young talent support scheme of Hebei Province (360-0803-YBN-7U2C), the key research project in humanity and social science of the Hebei Education Department (ZD202211), and the Natural Science Foundation of Hebei Province (E2020402074).
Institutional Review Board Statement
Not applicable.
Informed Consent Statement
Not applicable.
Data Availability Statement
The data presented in this study are openly available in the China Statistical Yearbook.
Conflicts of Interest
The authors declare no conflict of interest.
References
- Zitian, C.; Heng, X. Combination prediction of water use structure in Hebei Province based on component data. Pract. Underst. Math. 2019, 49, 192–198. [Google Scholar]
- Shaofeng, J.; Shifeng, Z.; Hong, Y.; Jun, X. The relationship between industrial water use and economic development: The water Kuznets curve. J. Nat. Resour. 2004, 2004, 279–284. [Google Scholar]
- Qifeng, Z.; Xiaosi, T.; Peng, Z. Prediction and Analysis of Economic Development on Water Resources Demand. J. Hubei Second. Norm. Univ. 2020, 37, 56–59. [Google Scholar]
- Ge, W.; Changlai, X.; Zhiwei, Q.; Xiujuan, L.; Fanao, M.; Ying, S. Water Resource Carrying Capacity Based on Water Demand Prediction in Chang-Ji Economic Circle. Water 2020, 13, 16. [Google Scholar]
- Bo, Z.; Yezheng, L.; Feifei, Z. Annual Water Consumption Forecast of Hefei Based on ARIMA Model. Acad. J. Comput. Inf. Sci. 2021, 4, 3. [Google Scholar]
- Leon, L.P.; Chaplot, B.; Solomon, A. Water consumption forecasting using soft computing—A case study, Trinidad and Tobago. Water Supply 2020, 20, 3576–3584. [Google Scholar] [CrossRef]
- Xuan, L.; Longcang, S.; Chengpeng, L.; Zhonghua, Z.; Jiang, G. Analysis and prediction of water use structure in Jining City. Hydropower Energy Sci. 2017, 35, 26–29. [Google Scholar]
- Guancheng, G.; Shuming, L.; Yipeng, W.; Junyu, L.; Ren, Z.; Xiaoyun, Z. Short-Term Water Demand Forecast Based on Deep Learning Method. J. Water Resour. Plan. Manag. 2018, 144, 04018076. [Google Scholar]
- Zanfei, A.; Menapace, A.; Granata, F.; Gargano, R.; Frisinghelli, M.; Righetti, M. An Ensemble Neural Network Model to Forecast Drinking Water Consumption. J. Water Resour. Plan. Manag. 2022, 148, 04022014. [Google Scholar] [CrossRef]
- Chuang, M.; Daiqi, Z.; Ye, Z. Prediction method of water resources demand based on BP neural network based on improved whale algorithm. Comput. Sci. 2020, 47, 486–490. [Google Scholar]
- Julia, K.A.; Bruno, M.B.; Manuel, H.; Edevar, L.; Lubienska, R.; Joaquín, I. Committee Machines for Hourly Water Demand Forecasting in Water Supply Systems. Math. Probl. Eng. 2019, 2019, 9765468. [Google Scholar]
- Xenochristou, M.; Kapelan, Z. An ensemble stacked model with bias correction for improved water demand forecasting. Urban Water J. 2020, 17, 212–223. [Google Scholar] [CrossRef]
- Salah, L.Z.; Khalid, H.; Saleem, E.; Nabeel, S.S.A.; Hussein, A.; Sadik, K.G. A novel methodology to predict monthly municipal water demand based on weather variables scenario. J. King Saud Univ. Eng. Sci. 2020, 34, 163–169. [Google Scholar]
- Liping, Z.; Jun, X.; Zhifang, H. Analysis of China’s water resources status and water resources security. Yangtze River Basin Resour. Environ. 2009, 18, 116–120. [Google Scholar]
- Haozhe, Y.; Lijuan, L.; Jiuyi, L. Research on the construction of risk assessment model for water resources carrying capacity in Beijing-Tianjin-Hebei. Geogr. Res. 2021, 40, 2623–2637. [Google Scholar]
- Xingjiao, S.; Yunli, Q.; Zhouwang, A.; Yaqi, L.; Xingyin, Y.; Qinzhao, R.; Jianwei, Z. Dynamic evolution analysis of water use structure and industrial structure in Anyang City based on ecological niche. Water Resour. Prot. 2021, 37, 79–85. [Google Scholar]
- Gang, W.; Songling, Z.; Pengyun, Z.; Qingcheng, C. Discussion on the definition of niche and the improvement of the measurement formula of niche overlap. J. Ecol. 1984, 1984, 119–127. [Google Scholar]
- Ocampo, C.B.; Guzmán, R.L.; Moreno, M.; Castro, M.D.M.; Valderrama-Ardila, C.; Alexander, N. Integration of Phlebotomine Ecological Niche Modelling, and Mapping of Cutaneous Leishmaniasis Surveillance Data, to Identify Areas at Risk of Under-Estimation. Acta Trop. 2021, 224, 106122. [Google Scholar] [CrossRef]
- Kolanowska, M.; Rewicz, A.; Baranow, P. Ecological niche modeling of the pantropical orchid Polystachya concreta (Orchidaceae) and its response to climate change. Sci. Rep. 2020, 10, 14801. [Google Scholar] [CrossRef]
- Zhihong, H.; Zengchuan, D.; Tao, Z.; Wei, X.; Xinxin, C.; Xiaoqi, G. Eco-friendly reservoir group scheduling model. J. Hohai Univ. 2020, 48, 202–208. [Google Scholar]
- Xiaoshen, Z.; Haibo, W.; Wenchuan, W. Water resources prediction based on improved grey model. People’s Yellow River 2011, 33, 46–47. [Google Scholar]
- HaiNi, D.; ShuHong, M.; Bing, S. Prediction of urban domestic water demand based on grey GM(1,N) self-memory model. Hydropower Energy Sci. 2010, 28, 19–20. [Google Scholar]
- Pengcheng, Z.; Weijiang, Z.; Jun, L.; Jianning, S. Prediction of water consumption per 10,000 yuan GDP in Ningxia based on grey system theory. Anhui Agric. Sci. 2011, 39, 384–385. [Google Scholar]
- Zhengran, Q.; Lifeng, W.; Zizhao, Y. Prediction of Water Consumption in 31 Provinces of China Based on FGM(1,1) Model. CLEAN Soil Air Water 2022, 50, 2200052. [Google Scholar]
- Xiangmei, M.; Leping, T.; Chen, Y.; Lifeng, W. Forecast of annual water consumption in 31 regions of China considering GDP and population. Sustain. Prod. Consum. 2021, 27, 713–736. [Google Scholar] [CrossRef]
- Zhicun, X.; Lianyi, L.; Lifeng, W. Forecasting the carbon dioxide emissions in 53 countries and regions using a non-equigap grey model. Environ. Sci. Pollut. Res. Int. 2020, 28, 15659–15672. [Google Scholar]
Figure 1.
Geographical location.

Figure 2.
The forecasting process of water consumption.

Figure 3.
Water consumption in secondary industry dominated regions.

Figure 4.
Water consumption in secondary and tertiary industry dominated regions.

Figure 5.
Water consumption in tertiary industry dominated regions.


Table 1.
Study regions.
| 1 | Beijing | 12 | Anhui | 23 | Sichuan |
| 2 | Tianjin | 13 | Fujian | 24 | Guizhou |
| 3 | Hebei | 14 | Jiangxi | 25 | Yunnan |
| 4 | Shanxi | 15 | Shandong | 26 | Tibet |
| 5 | Inner Mongolia | 16 | Henan | 27 | Shaanxi |
| 6 | Liaoning | 17 | Hubei | 28 | Gansu |
| 7 | Jilin | 18 | Hunan | 29 | Qinghai |
| 8 | Heilongjiang | 19 | Guangdong | 30 | Ningxia |
| 9 | Shanghai | 20 | Guangxi | 31 | Xinjiang |
| 10 | Jiangsu | 21 | Hainan | ||
| 11 | Zhejiang | 22 | Chongqing |
Table 2.
Type of data.
| Influencing Factors | Time (Year) | Unit |
|---|---|---|
| The added value of primary industry | 2014–2019 | Hundred million yuan |
| The added value of secondary industry | 2014–2019 | Hundred million yuan |
| The added value of tertiary industry | 2014–2019 | Hundred million yuan |
Table 3.
Test criteria for the forecasting model.
| MAPE | Prediction Accuracy |
|---|---|
| <10% | Higher |
| 10–20% | Better |
| 20–50% | Reasonable |
| >50% | Weaker |
Table 4.
Beijing’s water consumption under the influence of different industries from 2020 to 2025.
| Year | Water Consumption (BCM) | Water Consumption (BCM) | Water Consumption (BCM) |
|---|---|---|---|
| 2020 | 41.03 | 41.26 | 42.06 |
| 2021 | 41.63 | 41.96 | 42.86 |
| 2022 | 42.19 | 42.70 | 43.65 |
| 2023 | 42.72 | 43.48 | 44.44 |
| 2024 | 43.22 | 44.32 | 45.23 |
| 2025 | 43.70 | 45.22 | 46.00 |
Table 5.
Beijing’s industrial niche from 2014 to 2019.
| Year | First Industry Niche | Second Industry Niche | Tertiary Industry Niche |
|---|---|---|---|
| 2014 | 0.007449 | 0.213064 | 0.779488 |
| 2015 | 0.005677 | 0.183924 | 0.742222 |
| 2016 | 0.004325 | 0.164773 | 0.686324 |
| 2017 | 0.00347 | 0.153513 | 0.650384 |
| 2018 | 0.003019 | 0.143672 | 0.624628 |
| 2019 | 0.002301 | 0.115662 | 0.597884 |
| 0.005164 | 0.191785 | 0.803051 |
Table 6.
Water consumption in Beijing from 2020 to 2025.
| Year | Water Consumption (BCM) | |||
|---|---|---|---|---|
| Actual Value | Fitted Value | |||
| W-CGM(1,1) | GM(1,1) | FGM(1,1) | ||
| 2020 | 37.5 | 37.50 | 37.50 | 37.50 |
| 2021 | 38.2 | 38.04 | 38.00 | 38.00 |
| 2022 | 38.8 | 38.77 | 38.74 | 38.74 |
| 2023 | 39.5 | 39.44 | 39.48 | 39.48 |
| 2024 | 39.3 | 40.06 | 40.25 | 40.25 |
| 2025 | 41.7 | 41.20 | 41.02 | 41.02 |
| MAPE | 0.0104% | 0.9502% | 0.9502% | |
| 2020 | 41.90 | 41.81 | 41.81 | |
| 2021 | 42.68 | 42.62 | 42.62 | |
| 2022 | 43.46 | 43.44 | 43.44 | |
| 2023 | 44.25 | 44.28 | 44.28 | |
| 2024 | 45.04 | 45.14 | 45.14 | |
| 2025 | 45.84 | 46.01 | 46.01 | |
Table 7.
Regions classified by industry orientation.
| Category | Region |
|---|---|
| Secondary industry dominance | Fujian, Jiangxi, Henan, Shaanxi |
| Tertiary industry dominance | Beijing, Tianjin, Shanxi, Liaoning, Heilongjiang, Shanghai, Jiangsu, Zhejiang, Hunan, Guangdong, Hainan, Chongqing, Sichuan, Guizhou, Yunnan, Tibet, Gansu, Xinjiang |
| Secondary and tertiary industry dominance | Hebei, Inner Mongolia, Jilin, Anhui, Shandong, Hubei, Guangxi, Qinghai, Ningxia |
Publisher’s Note: MDPI stays neutral with regard to jurisdictional claims in published maps and institutional affiliations. |
© 2022 by the authors. Licensee MDPI, Basel, Switzerland. This article is an open access article distributed under the terms and conditions of the Creative Commons Attribution (CC BY) license (https://creativecommons.org/licenses/by/4.0/).
Share and Cite
MDPI and ACS Style
Pan, X.; Cai, K.; Wu, L. Using a Grey Niche Model to Predict the Water Consumption in 31 Regions of China. Water 2022, 14, 1883. https://doi.org/10.3390/w14121883
AMA Style
Pan X, Cai K, Wu L. Using a Grey Niche Model to Predict the Water Consumption in 31 Regions of China. Water. 2022; 14(12):1883. https://doi.org/10.3390/w14121883
Chicago/Turabian StylePan, Xiaoying, Kai Cai, and Lifeng Wu. 2022. "Using a Grey Niche Model to Predict the Water Consumption in 31 Regions of China" Water 14, no. 12: 1883. https://doi.org/10.3390/w14121883
Note that from the first issue of 2016, this journal uses article numbers instead of page numbers. See further details here.