
Side-Stream Phosphorus Recovery in Activated Sludge Processes


1
BIOMATH, Department of Data Analysis and Mathematical Modeling, Ghent University, Coupure Links 653, 9000 Ghent, Belgium
2
Department of Civil Engineering and Architecture, University of Pavia, 27100 Pavia, Italy
3
Department of Chemistry, University of Pavia, 27100 Pavia, Italy
*
Author to whom correspondence should be addressed.
Water 2022, 14(12), 1861; https://doi.org/10.3390/w14121861
Submission received: 8 May 2022
/
Revised: 7 June 2022
/
Accepted: 8 June 2022
/
Published: 9 June 2022
(This article belongs to the Section Wastewater Treatment and Reuse)
Abstract
:Precipitation of mineral phosphates from wastewater treatment processes is an excellent method for phosphorus recovery, leading to the formation of compounds with high fertilizing value. Conventionally, P-precipitation processes are mostly applied to supernatant of anaerobic sludge digestates, due to their high P and N residual contents. This study concerns P-recovery in a pilot-scale side-stream reactor from aerobic (activated sludge) wastewater liquor. The effect of process retention time and pH was determined using sodium hydroxide and calcium hydroxide as alternative pH buffer reagents, in both synthetic and real wastewater. Equilibrium mass balance calculations were first applied to estimate the theoretical final composition of P-precipitates under different process conditions; then, actual precipitation experiments were carried out with synthetic wastewater to define optimal process operating parameters in controlled conditions. Results showed that phosphorus precipitation was affected mainly by solution pH and did not significantly depend on the reactor’s retention time. These findings were validated by operating the process with real wastewater: on average, 61.2% and 90.4% phosphorus precipitation (recovery) were achieved at pH = 8.5 and 9.0 under a controlled Mg:NH4:P molar ratio of 5:5:1, using sodium hydroxide as acidity buffer. The main fraction of final precipitates consisted of calcium phosphate compounds, while struvite, bobierrite and calcite showed up in smaller proportions. It was also shown that dosage of calcium hydroxide for pH adjustment, without any other chemicals for molar ratios adjustment of the solution, has great potential for P recovery in the form of a calcium phosphate-rich precipitate, usable for fertilizer, with 75.6% phosphorus removal in mineral form at pH = 8.5. The process is much less costly to operate than struvite precipitation, and more energetically sustainable. This scheme could be ideally suited for application in facilities operating under an enhanced phosphorus removal process scheme.
1. Introduction
Concern about high nutrient (N and P) concentrations and their effects, consistently observed in natural water bodies [1,2] has raised attention towards the search for new efficient technologies for their removal from wastewater [3,4,5,6]. This issue is particularly critical in “sensitive areas” where more stringent nutrient removal regulations are enforced [7]. On the other hand, the increasing trend of fertilizer use for food production due to growing global population needs and the realization that the extraction of nutrients for fertilizers production is energetically demanding and (at least as far as P is concerned) globally limited, have emphasized the need for developing new, sustainable, and circular economy-compliant technologies for their recovery [8,9,10]. The most significant leaks in the anthropically modified phosphorous cycle are due to erosion and fertilizers leaching from agricultural soils, and dispersal of animal and food waste, all of which have intrinsic negative environmental impacts. Although essential for food production, in the final analysis only about 16% of mined phosphorous ends up in the human diet, and then in excreta. Although small, if even this fraction could be recovered from wastewater, rather than being simply eliminated from effluents, this would still be a small but significant step towards greater sustainability of the P cycle. Recent paradigms of urban wastewater management are geared towards conservation, recovery and sustainability, postulating that valuable resources (including water, nutrients and energy) should be recovered from the urban water cycle wherever possible [11,12,13,14]. This implies that even when P removal from wastewater is mandated for environmental protection purposes, focus should be placed on recovery, rather than mere removal strategies [15].
The most common approach for P recovery is chemical precipitation in mineral form, mainly as struvite or calcium phosphate [16,17]. Struvite (MgNH4PO4·6H2O) is a white crystalline mineral, also considered a potential problem in wastewater treatment facilities because of its spontaneous precipitation in pumps and pipes, often causing costly clogging and operational malfunctions [18]. However, due to its composition, high in nutrients, and its low solubility, struvite is also an ideal fertilizer when precipitated and collected in controlled mode [19,20]. Its precipitation is affected by chemical and physical factors such as solution pH, Mg:NH4:P molar ratios, initial solute P concentration, hydrodynamics and retention time [21,22,23,24]. The most critical factor affecting its precipitation, however, is the presence in solution of competitive ions, particularly calcium. Calcium may react with phosphate and carbonate ions, precipitating different calcium phosphate or carbonate (calcite) forms. Amorphous calcium phosphate (ACP) is the most likely form of calcium phosphate that could precipitate in these conditions [25,26,27], and can be further transformed into more stable forms, such as tricalcium phosphate (TCP) and hydroxyapatite (HAP), after prolonged retention. Although often, according to current practice, the main purpose of P recovery is to obtain a struvite mineral as pure as possible, ACP could also be effectively used in the fertilizer industry, thanks to its high P content [28,29].
Struvite precipitation from anaerobically digested sludge, where P and ammonia contents are usually sufficiently high for an efficient process, has been widely investigated [6,16,30]. Commercial P-recovery technologies, e.g., Ostara® (www.ostara.com (accessed on 13 March 2022)) and Struvia™ (www.veoliawatertechnologies.com (accessed on 13 March 2022)), which are intended to operate on anaerobically digested liquor, are currently available, operating in facilities worldwide. Anaerobic sludge digestion in fact is currently a very common option for wastewater residuals processing with simultaneous recovery of energy and materials [10], more so than anaerobic wastewater treatment that, although potentially attractive, still shows some practical applicability limitations, due to sewage dilution and temperature [31,32,33].
Some studies suggest the possibility of precipitating usable mineral P from aerobic liquor [34,35,36]. Typically, influent P concentration to a wastewater treatment facility may reach up to 10 mg/L, not sufficiently high to achieve effective, sustainable and significant struvite precipitation. Nonetheless, with an appropriate process design, the presence of polyphosphate accumulating organisms (PAOs) will lead to high P release under anaerobic conditions, followed by luxury uptake by the same microorganisms in a subsequent aerobic zone. This constitutes the basis for the Enhanced Biological Phosphorous Removal process (EBPR) [3,37]: the release of P into solution during one anaerobic step of the process creates conditions suitable for sustaining enhanced mineral phosphorous precipitation.
Previous studies focused on investigation of struvite precipitation based on lab-scale batch experiments with tests conducted at different operating conditions (variable pH and Mg:NH4:P molar ratios) [24]. Extensive analysis of obtained precipitates assessed the composition of solid phases according to process conditions, showing precipitation feasibility of struvite and calcium phosphates. Precipitation from aerobic liquor at laboratory scale was also tested by reproducing a bench-scale EBPR configuration to assess the feasibility of the possible combination of this process with P precipitation [37]. This work studies the operation of a continuous, small-scale reactor for P recovery from aerobic wastewater liquor, under real operating conditions. Preliminary bench scale experiments were conducted to assess process sensitivity to different operating parameters; then, a pH controlled pilot reactor was operated with both synthetic and real aerobic wastewater liquor and an approach, combining mass balance and chemical equilibrium modeling, was used to extensively analyze precipitates’ composition, and their potential applicability for agricultural use.
2. Materials and Methods
For the purpose of this study, a two-stage approach was adopted. The first stage was carried out in a strictly controlled laboratory setting, operating under aerobic conditions with synthetic wastewater, to determine the best combination of process parameters affecting the precipitation process, with a side stream reactor assembled specifically for this purpose. This initial stage had the goal of assessing the performance of a semi-continuous operation process, under constant monitoring and controlled conditions. In the second stage, the reactor, placed on the grounds of a conventional, activated sludge treatment plant, was operated with aerobic liquor drawn from the biological process line. This phase had the purpose to validate under real conditions the results previously obtained.
2.1. Aerobic Mixed Liquor Characteristics
A synthetic solution was prepared to reproduce the average observed ionic composition of the facility’s actual aerobic liquor, as summarized in Table 1. Only the parameters most relevant for P precipitation, as determined in a previous study [26], are reported, and they were replicated in the synthetic solution. The P concentration reported in Table 1, higher than the influent’s, replicates the effect of P release under simulated EBPR operations, as explained in Section 3.5, dealing with the tests on real wastewater. To prepare the solution, stoichiometric doses of MgCl2·6H2O, NH4Cl, KH2PO4, CaCl2·2H2O, MgSO4·7H2O, Na3PO4 were added to tap water to mimic aerobic mixed liquor. Solution alkalinity was adjusted to the desired level using NaHCO3, initial pH was adjusted to 7.6. The synthetic liquor represented with sufficient precision the actual liquor’s average composition, apart from the organic parameters, which were considered not relevant for purposes of P-precipitation at this stage.
2.2. Pilot Reactor
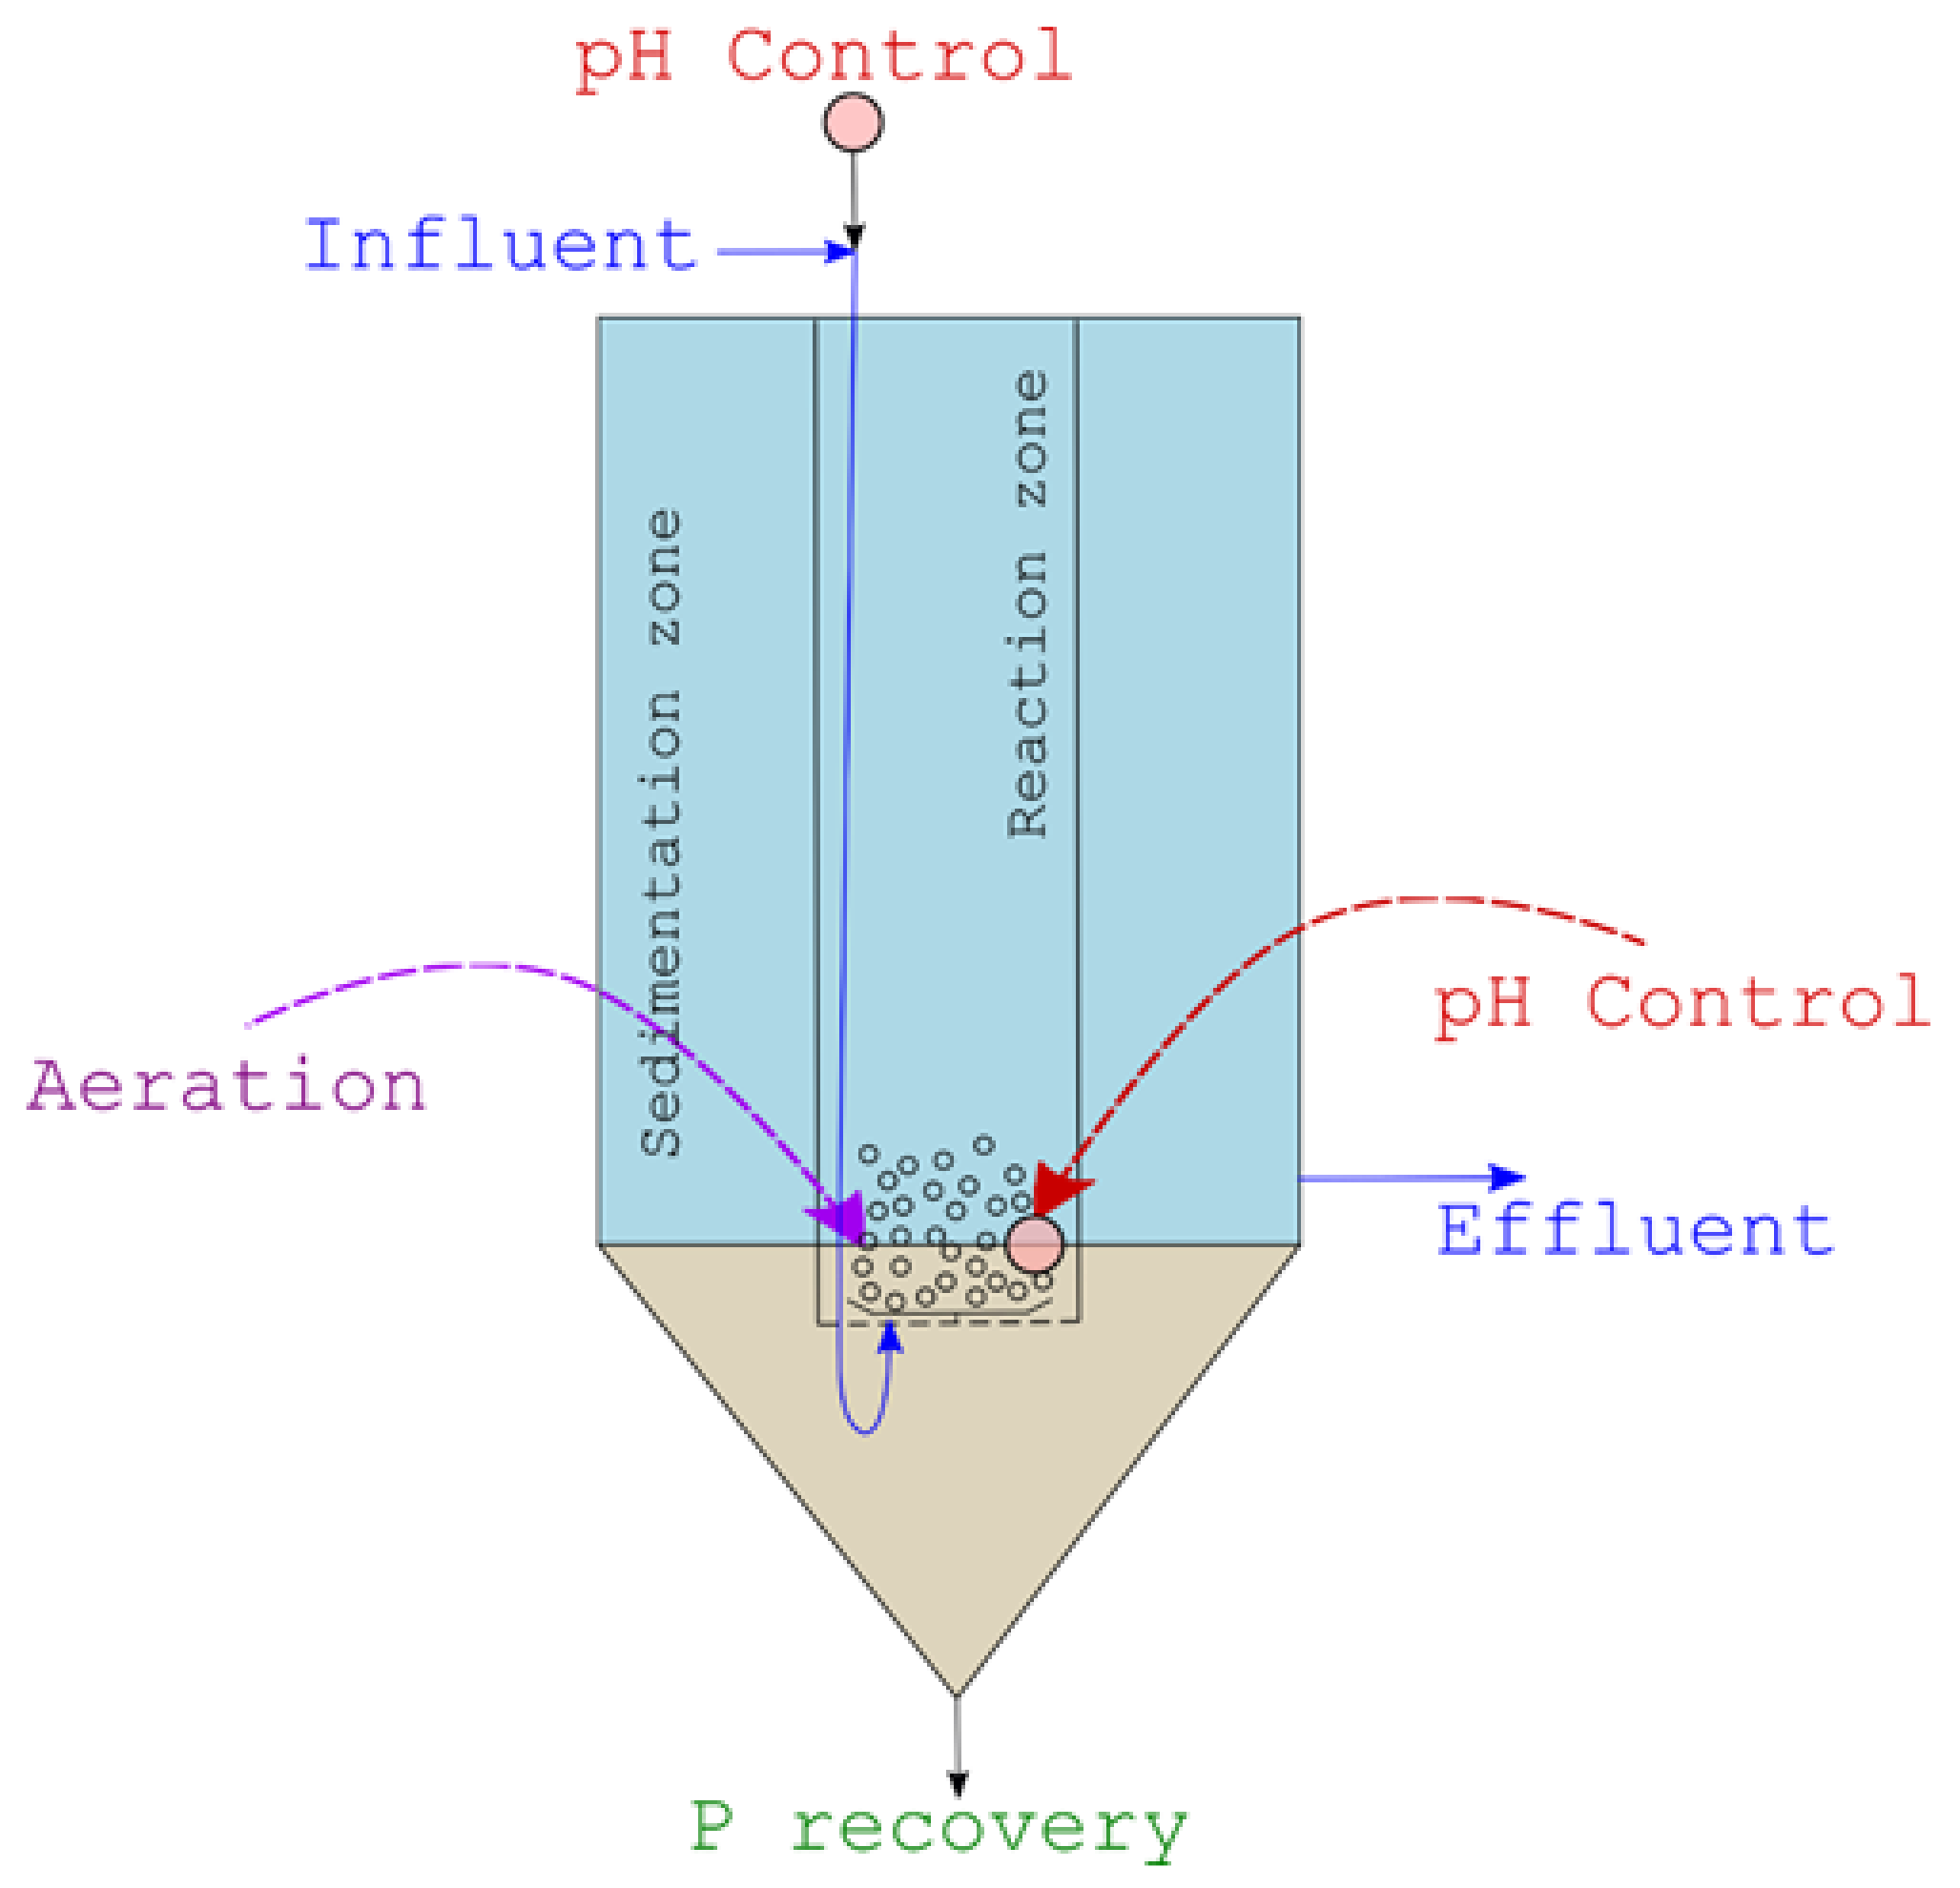
The reactor, with working volume of 120 L (total volume 200 L), consists of: a main cylindrical clarification volume, an inner aerated coaxial reaction chamber with bubble mixing, and a bottom sedimentation volume (Figure 1). Influent is continually introduced into the inner reaction chamber after the initial dosage of a pH control reagent. pH is continuously monitored at the inlet and in the mid-section of the reaction chamber. Aeration is provided to this section through a bottom diffuser, to maintain mixing and avoid premature settling of particles to the bottom clarifier, as these will serve as agglomeration nuclei for P-mineral crystals’ growth.
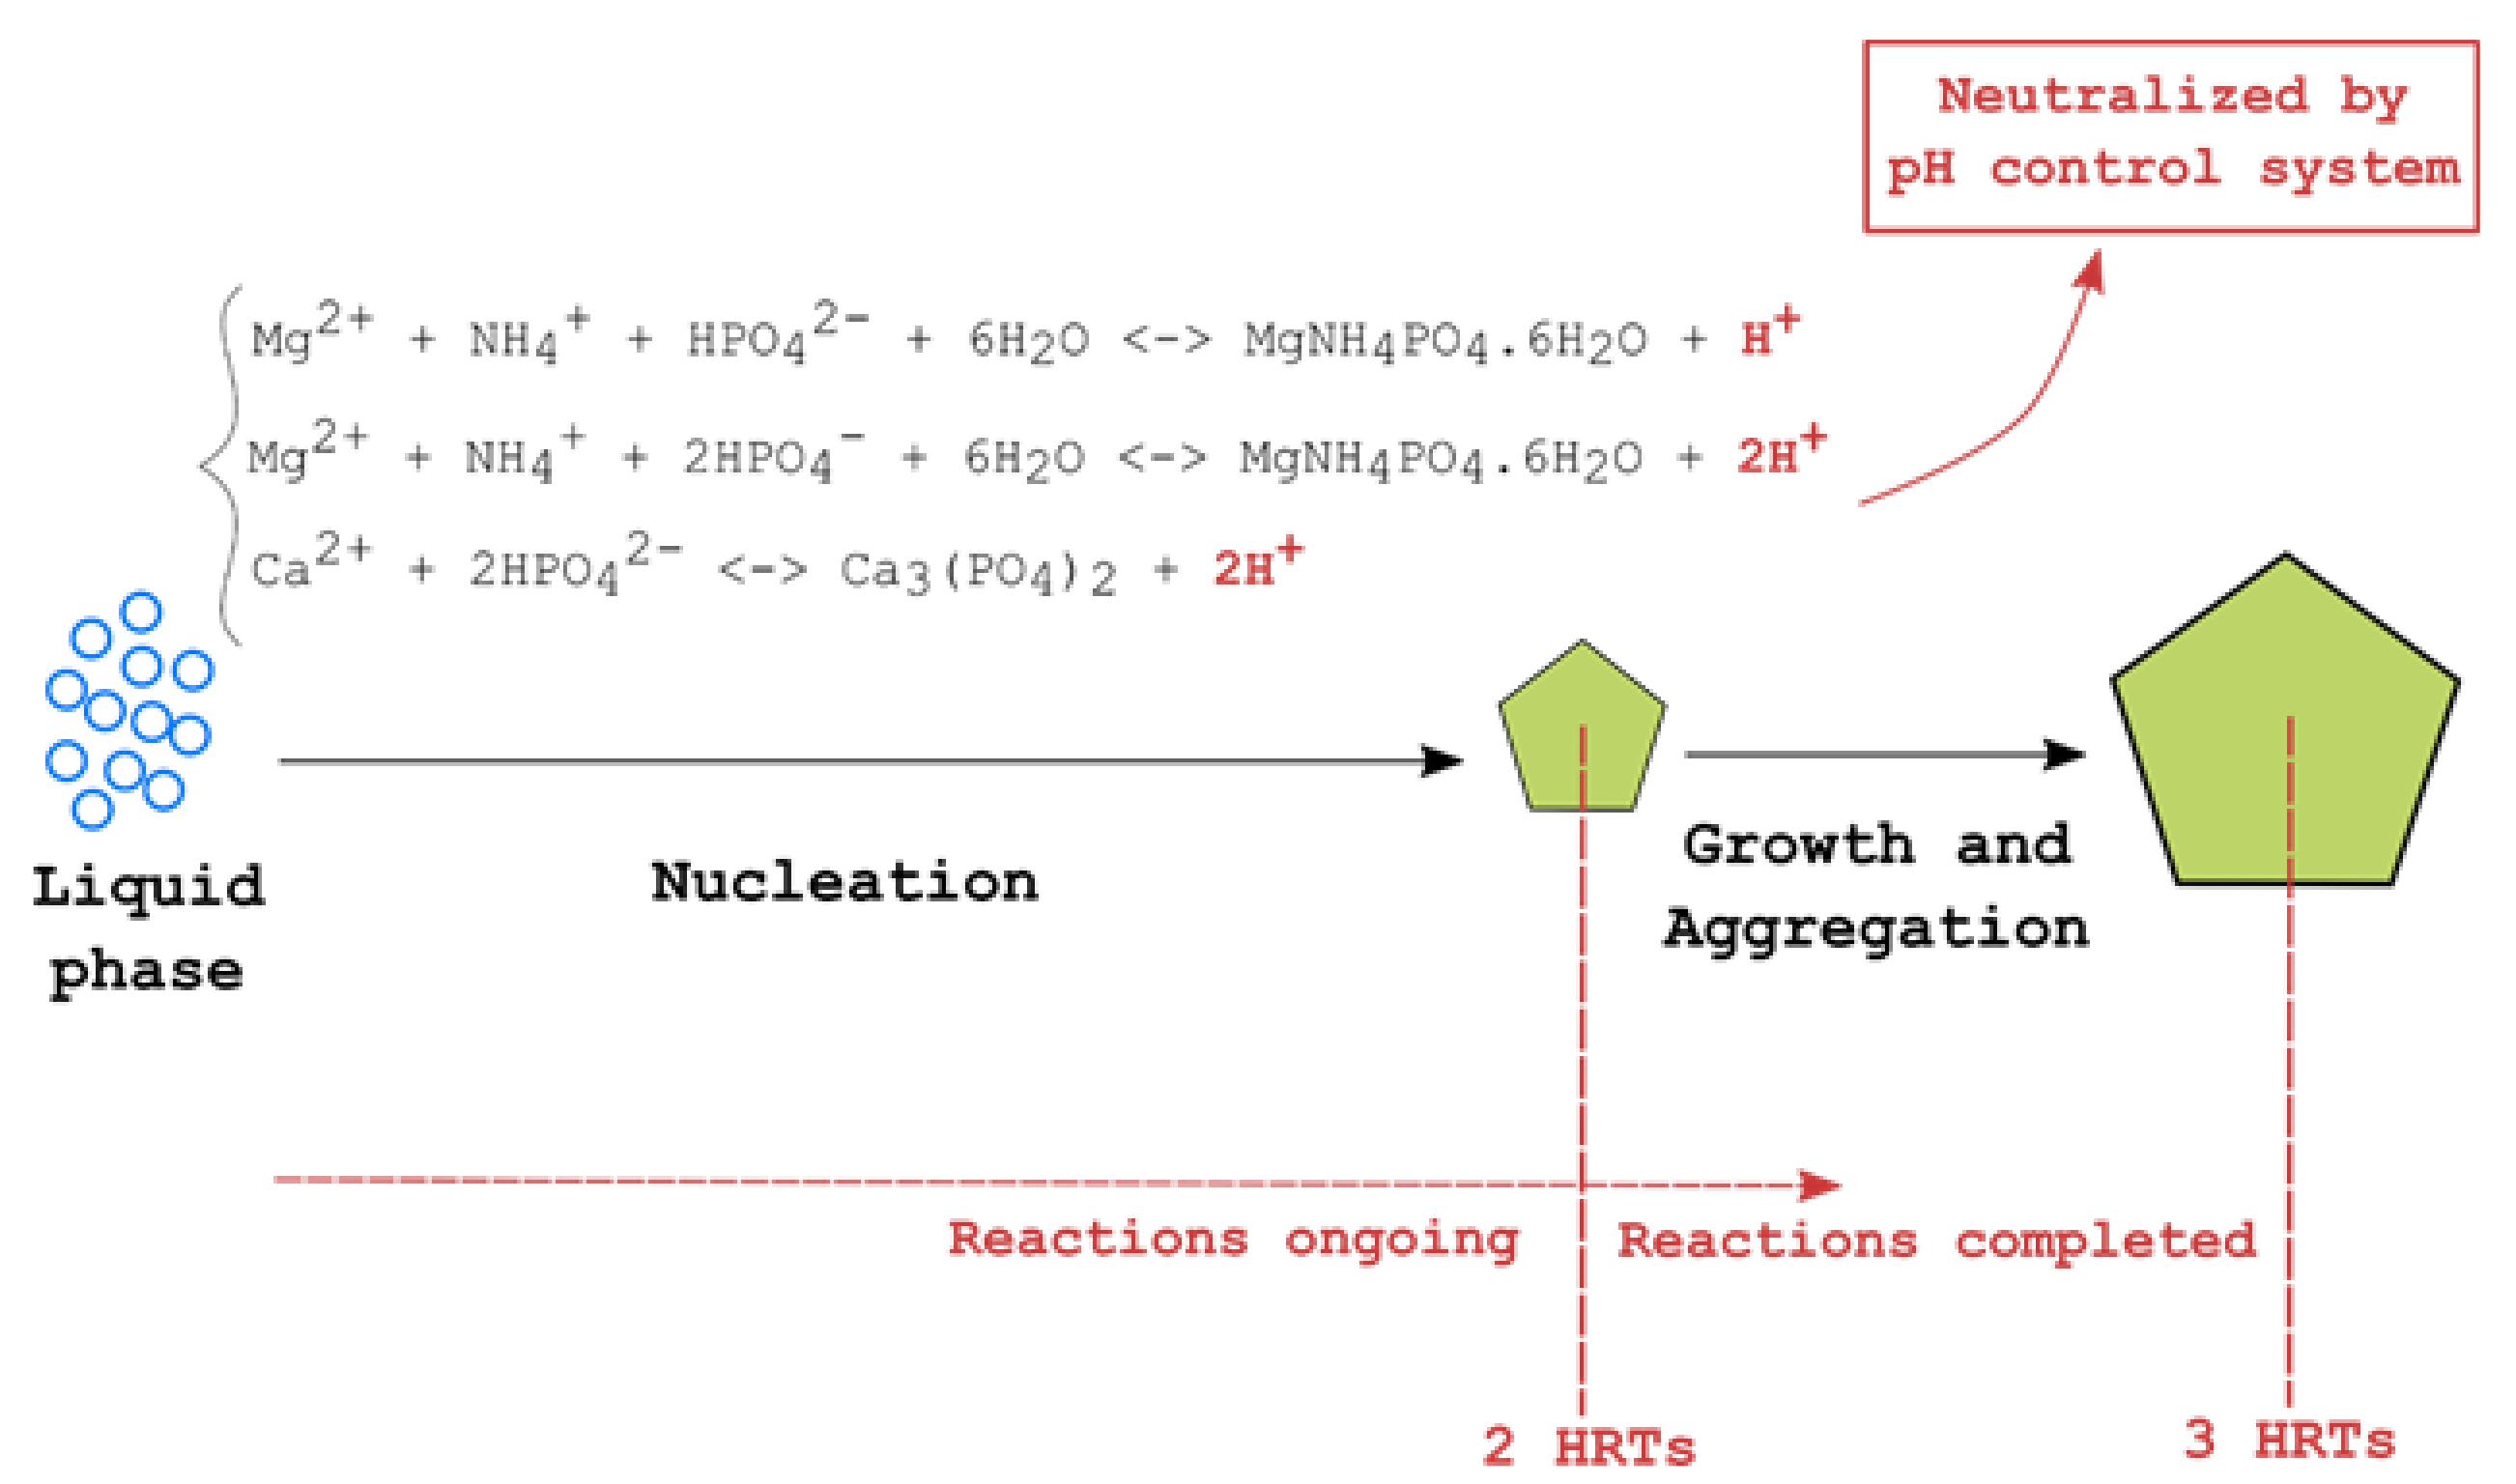
In the first stage tests (synthetic wastewater), influent flowrates are adjusted, in turn, to 4, 2 and 1 L/min, setting the reactor’s hydraulic retention times (HRTs) at 30, 60 and 120 min, respectively. During each experiment, influent is pumped at the selected rate to the top section of the inner reactor chamber, where a NaOH, 5 M solution (or, alternatively, Ca (OH)2, as explained later) is stoichiometrically dosed to basify the solution to the desired pH (8.5 or 9.0, respectively), as described in Section 2.4. pH control is needed as its value strongly influences the equilibrium of precipitation reactions (1)–(4):
At the same time when these reactions occur, with onset of the crystallization process, the solution also undergoes progressive acidification according to reactions (5)–(7):
Therefore, pH must be monitored and constantly adjusted, responding to ongoing changes, by an online feedback system (described in Section 2.4), placed within the reactor. pH monitoring also allows quantitative measurement of the progress of the above reactions.
2.3. Instrumentation and Analytics
Buffer solution is dosed to the influent section of the reactor in each test condition, using a chemically-resistant diaphragm pump STEPDOS FEM 08 (KNF FLODOS AG, Sursee, CH); secondary pH control within the reaction chamber is operated with a BT100N peristaltic pump (Shenchen Pumps, China). pH is monitored at two locations (see Figure 1) using analog pH sensors SEN0161 (DFROBOT online store www.dfrobot.com, (accessed on 13 March 2022)) connected to a house built and programmed Arduino™ based control system (https://www.arduino.cc/ (accessed on 13 March 2022)).
Phosphorus determinations are conducted by UV-Vis spectroscopy (Spectroquant PHARO 100, MERCK, Darmstadt, Germany) based on EPA 365.3 method [38]. Analysis of precipitates is conducted using Fourier Transform Spectroscopy (FTIR) (Perkin Elmer 1600 series, Waltham, OH, USA), Thermal gravimetric analysis (TGA) (Mettler Toledo TGA 1 STARe System, Columbus, OH, USA), X-ray Diffraction (XRD) (Bruker D5005, Billerica, MA, USA), Inductively Coupled Plasma-Atomic Emission Spectroscopy (ICP-AES) (Perkin Elmer Avio 500 ICP-OES, Waltham, OH, USA) and Elemental Analysis (Perkin Elmer 2400 CHNS/O Series II, Waltham, OH, USA).
2.4. pH Control
As showed in a previous study [24], one of the most critical parameters for optimized precipitation of phosphorus compounds is pH. This is also one of the most complex to control, due to its nonlinear variation dynamics, affected by multiple factors. Continuous pH measurements at two locations within the reactor are taken by probes, analogically connected to an automated control system. pH at the inlet of the reactor is controlled with a continuous flow of buffer solution, to set the desired value selected for the specific experiment (8.5 or 9.0, respectively). The pH inside the reaction zone, however, constantly changes due to the ongoing reactions (5–7), which release H+ ions into the solution. A PID-Time Proportional control system has been designed, programmed and implemented on an Arduino™ board (Arduino™ is a commercial, general-purpose open-source hardware and software ‘ecosystem’, widely used for custom applications) to control the pH within the reaction chamber. In practice, time proportional control converts a continuous variable (i.e., pH) to a discrete output variable (i.e., pump on/off time). The typical PID control equation is expressed in integral form:
where Ti and Td represent integral time and derivative time, respectively.
2.5. Experimental Design
Experiments were conducted (Stage 1) considering different possible combinations of process operating parameters pH and HRT. Table 2 summarizes the experimental runs with the corresponding parameters used. In the initial part of this stage, all experiments (nos. 1–6 in Table 2) were carried out using Mg:NH4:P molar solution ratio of 5:5:1, according to the best results observed in previous lab-scale studies [24]. In a second phase, further experiments were carried out using NaOH (experiment no. 7), or Ca (OH)2 (experiments nos. 8 and 9) as pH buffers, without adjustment of those ratios, thus avoiding costly dosage of either Mg and NH4+. Each experiment has a total duration of 3 HRTs, in excess of the 2 HRTs previously determined as the minimum time lag necessary to complete nucleation of crystals in a pH-controlled environment, reaching steady state conditions (Figure 2) [24]. Phosphorus concentration in the reaction chamber’s solution is measured every 7.5 min during the 30-min HRT test, and every 15 min for the 60 and 120-min HRTs tests. Bottom suspension in the clarification volume is periodically checked to estimate crystal growth, with filtration on 2.5 µm Whatman filters followed by slow (room temperature) drying. Precipitate samples are collected and tested at the end of each experiment.
In the second stage of the study, the reactor is fed with real wastewater, according to the most favorable process conditions observed during Phase 1 (i.e., according to experiments nos. 4, 7, 8, 9 from Table 2), to confirm previous results under real-life conditions. Wastewater influent COD was measured in the range 261–353 mg/L, TN in the range 25–38 mg/L and TP in the range 6.8–9.2 mg/L.
While some mineral P precipitation would be possible even at these low observed concentrations [35], in order to achieve significant recovery P liquor concentration ought to be higher than that. Due to peculiar operating conditions, attributed to the presence in the influent of high volatile fatty acids (VFA) level caused by in-sewer wastewater fermentation during the warm season (when the study took place), sufficient presence and activity of phosphorus accumulating organisms (PAOs) in the biological process’ microbiome was observed. PAOs, the key microorganisms at the basis of the enhanced biological phosphorus removal process (EBPR) incorporate P in excess of strict biological requirements under aerobic conditions, and release it in anaerobic conditions [41]. This phenomenon, observed in the warmer period at the facility involved in the tests, sometimes allows to dispose of chemical P precipitation requirements to fulfil in full or in part the phosphorus discharge permit (although the facility is not explicitly designed according to an EBPR process scheme, but according to the Modified Ludzack–Ettinger scheme).
In order to closely simulate EBPR process conditions, anaerobic pre-conditioning is applied to the aerobic mixed liquor from the biological process in an intermediate retention tank, as described by Tykesson and Jansen [42]. The resulting P release by PAOs allowed to achieve mixed liquor concentration of up to 43 mg/L dissolved P. Aerobic liquor pumped from the aerobic tank, maintained in a closed, stirred vessel (HRT 2.5 h) is pre-screened by a 30 µm wedge wire screen prior to introduction into the precipitation reactor, in order to eliminate excessive biological solids’ interference with the crystallization process. Conditions were otherwise identical to those adopted during the synthetic liquor experiments.
2.6. Chemical Equilibrium Modeling
In a previous study [24], chemical equilibrium modeling using the aqueous geochemical simulation program PHREEQC [43], supported by a specifically modified reaction database to account for phosphorus-containing minerals, was conducted to calculate the possible P precipitation reactions’ saturation index (SI). SI is a numerical indicator that a specific mineral compound could actually precipitate from solution under given chemical conditions: higher positive SI values indicate a higher theoretical likelihood of precipitation of a specific compound.
PHREEQC simulations were carried out anew under the current experiments’ specific conditions. All solid phases that could theoretically precipitate under selected operating conditions were considered; however, the expected prevalent phases were assumed to be struvite, calcium phosphate compounds and calcite, as well as Mg-P compounds.
3. Results
3.1. Performance of the pH Control System
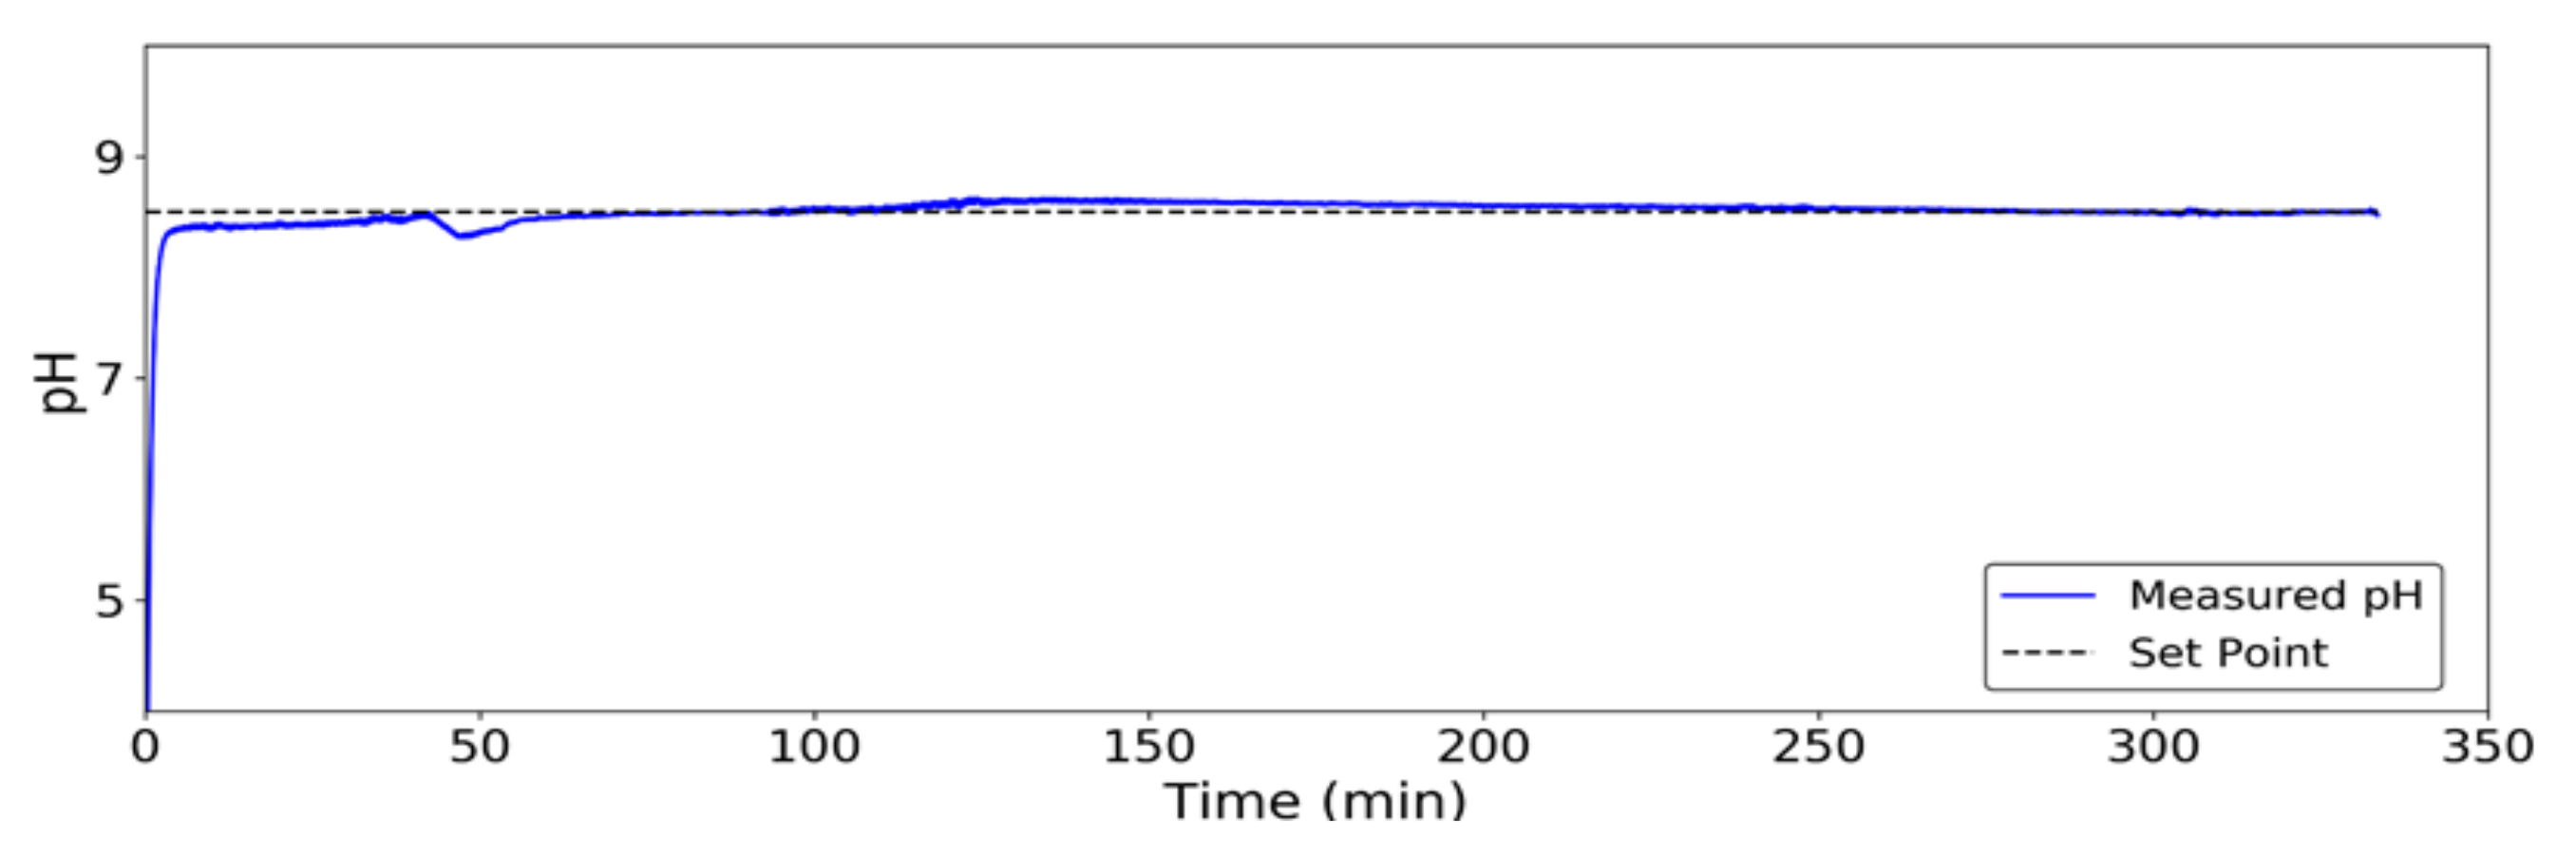
Figure 3 shows the continuously controlled pH value in the reaction chamber lower measurement point in test 1 (Table 2), compared to the desired set point (pH = 8.5) as a result of the pH control system’s continuous buffer addition. Small initial fluctuations may be due, apart from small convergence errors of the system, to the presence of air bubbles from the bottom diffuser around the pH probe. The pH control system proves thus to be suitable for continuous online use.
3.2. Determination of Mineral Precipitation Likelihood
Calculation of probable mineral precipitates’ SI’s by chemical equilibrium modeling is performed in a wider pH value range than foreseen for the actual planned experiments (pH from 8 to 9.5, at a 0.25 step increment), to evaluate the index variability. Table 3 shows the calculated SI values for all the possible P-containing solid phases and examined conditions. Struvite shows positive SI at all pH levels, in accordance with the literature [21]. Out of all possible calcium phosphate compounds, ACP and HAP also show high positive SI at all pH values. Dicalcium phosphate dihydrate (DCPD) (CaHPO4·2H2O) SI is positive in the pH range 8–8.25, negative afterwards, indicating unlikelihood of precipitation at high pH values. Dicalcium phosphate (DCP) (CaHPO4) shows positive SI up to pH = 9.
Based on these simulated results, the likelihood of P mineral precipitation in the selected test conditions (pH = 8.5 and 9.0) is assumed to be high for HAP, ACP, bobierrite, magnesite, calcite, struvite and DCP (in that order), and unlikely for the remaining compounds. It is important to mention that high calculated SI values do not necessarily mean that higher precipitation will actually occur: this, in fact, is highly dependent on actual operating conditions, and needs confirmation by experimental and analytical methods.
These findings are in line with those of other studies [27,44]. Struvite, the mainstream P-recovery mineral form, shows lower precipitation likelihood than other “useful” P forms; struvite analogues K-struvite (MgKPO4·6H2O) and Na-struvite (MgNaPO4·7H2O) indicate no theoretical possibility of precipitation, due to negative calculated SI values. These considerations will be of importance in the subsequent interpretation of experimental results.
3.3. Synthetic Wastewater P-Recovery Tests
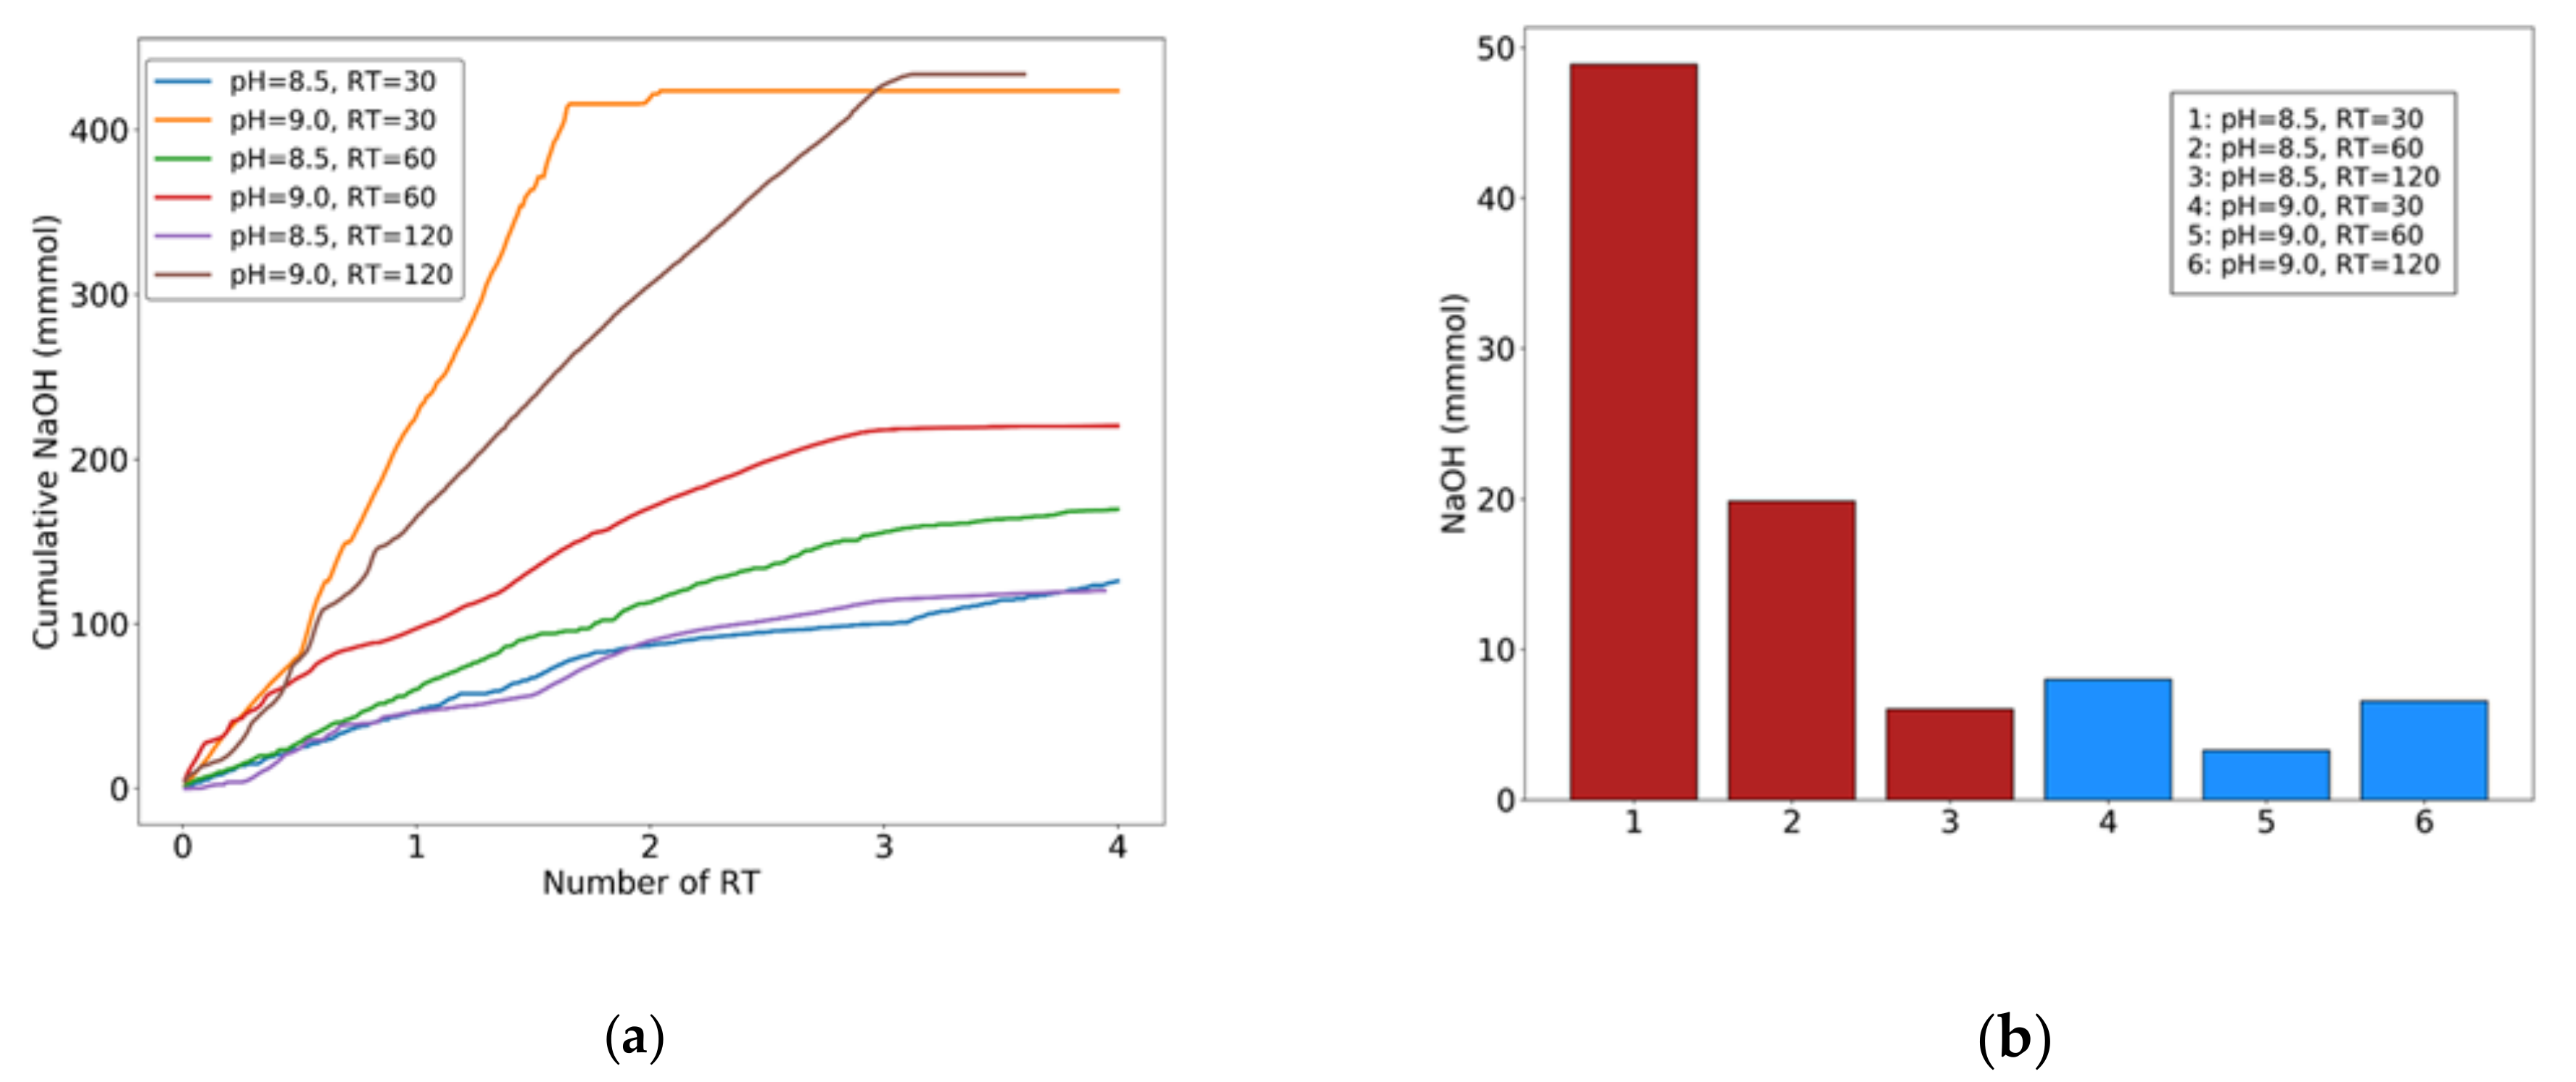
Each experiment was conducted under continuous flow for a duration of four reactor’s HRTs. Figure 4a, shows cumulative NaOH aliquots (mmols) added to the reactor for pH control in experiments 1–6. In experiments 3–4 (HRT = 60 min) the cumulate line stabilizes approximately after three HRTs, indicating that the system has reached steady state equilibrium as far as reactions (5–7) are concerned. In experiments 1 and 2 (HRT = 30 min), however, NaOH addition by the PID system continues well past 3 HRTs, indicating that 30 min HRT is not sufficient for all the above reactions to complete. Comparing the total amount of NaOH required for process completion after 3 HRTs (Figure 4b) between experiments 1, 2 (HRT = 30 min) and 3, 4 (HRT = 60 min) a noticeable difference can be seen. This is visible to a lesser degree in experiments 5, 6 (HRT = 120 min). Higher NaOH consumption at lower HRT means the precipitation reactions (5–7) have not reached equilibrium, yet. The difference is negligible in experiments 5, 6 (HRT = 120 min), and more clearly visible at pH = 9.0, indicating that a greater degree of reaction completion is reached at higher HRTs. In general, with the exception of experiment 6 (HRT = 120 min, pH = 9.0), the process is accelerated by higher pH levels (Figure 4a). Based on these results, it may be concluded that HRT of around 60 min should be sufficient for all precipitation to be completed.
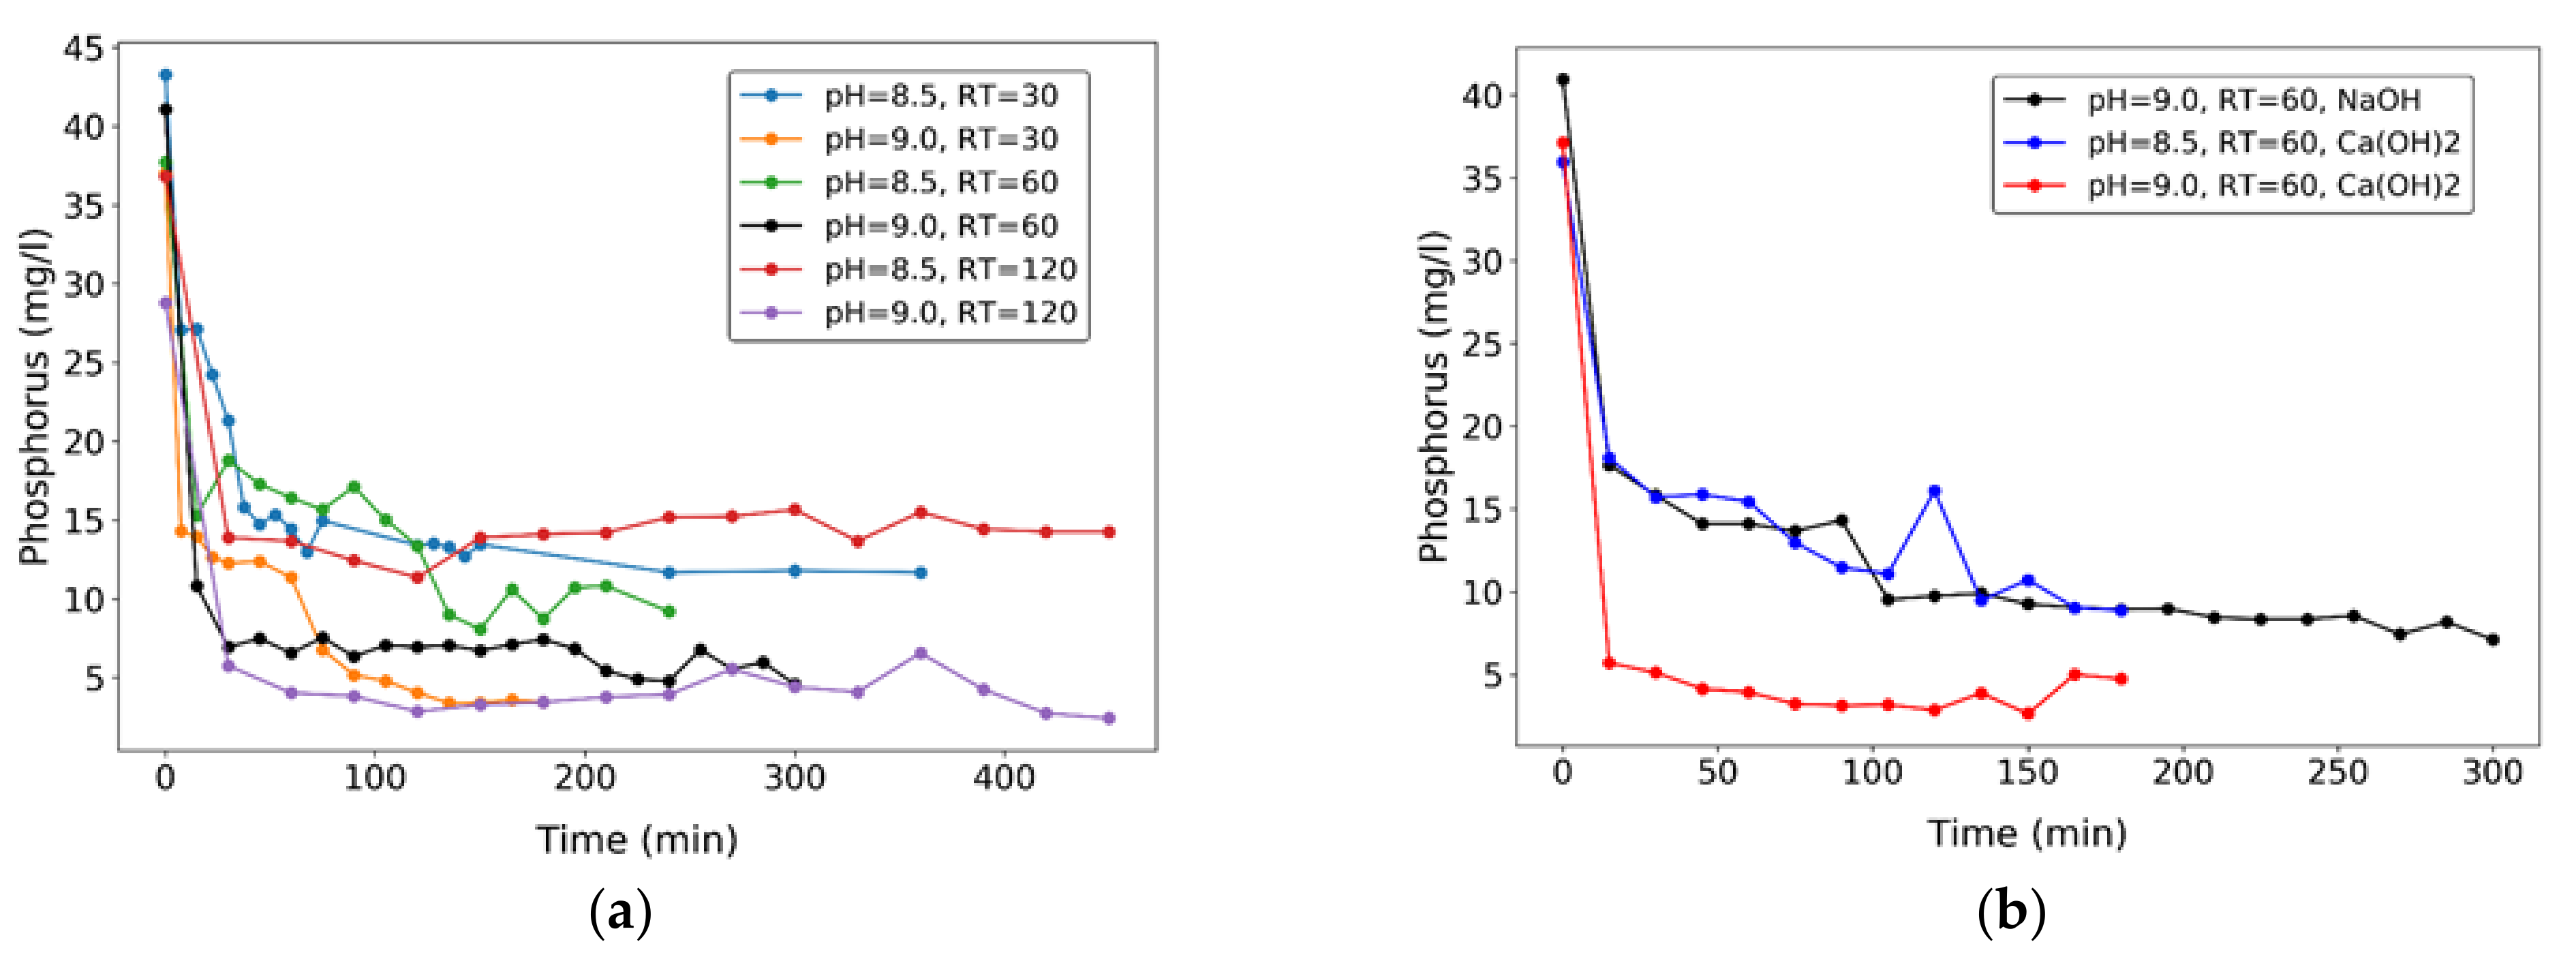
The most important effect of pH is observed on overall P removal yields. Figure 5 shows solute phosphorus concentration vs. time for all experiments: concentration decreases rapidly at the onset of the reaction, and then reaches a nearly stable value, indicating that P removal is mainly related to the system’s pH, and not much dependent on the elapsed time of the reaction (or reactor’s HRT). This indicates that P is removed rapidly through crystallization reactions, but afterwards it takes time for precipitates to grow in size and settle. This can be seen both in experiments 1–6 (Figure 5a) and 7–9 (Figure 5b), the former under addition of stoichiometric chemicals (Mg and ammonia salts) addition, the latter without.
With Mg and ammonia salts addition (for struvite formation), P removal is higher at pH = 9 (Figure 5a), but this requires higher NaOH dosage to the system, which is expensive. On average, 61.2% and 90.4% P removal were achieved for pH = 8.5 and 9.0, respectively, in experiments under controlled Mg:NH4:P = 5:5:1 solute molar ratio. Without the chemicals addition, 82.6% removal was achieved using NaOH to control pH at 9.0 (Figure 5b). Using Ca(OH)2 as alternative pH buffer at pH = 8.5 and 9.0, without addition of Mg and ammonia salts (with final precipitates other than struvite), removals of 75.3% and 87.2% were obtained, respectively. This may be a significant advantage in full scale applications of the process, since the cost of Ca(OH)2 is much lower (by about tenfold) than that of NaOH. Oscillations of P concentration that can be seen in some cases during experiments, for example at around 120 min in the experiment with Ca(OH)2 at pH = 8.5 and RT = 60, could be attributed to the dissolution of some of the phosphate minerals and the consequent P release, in addition to occasional measurement error.
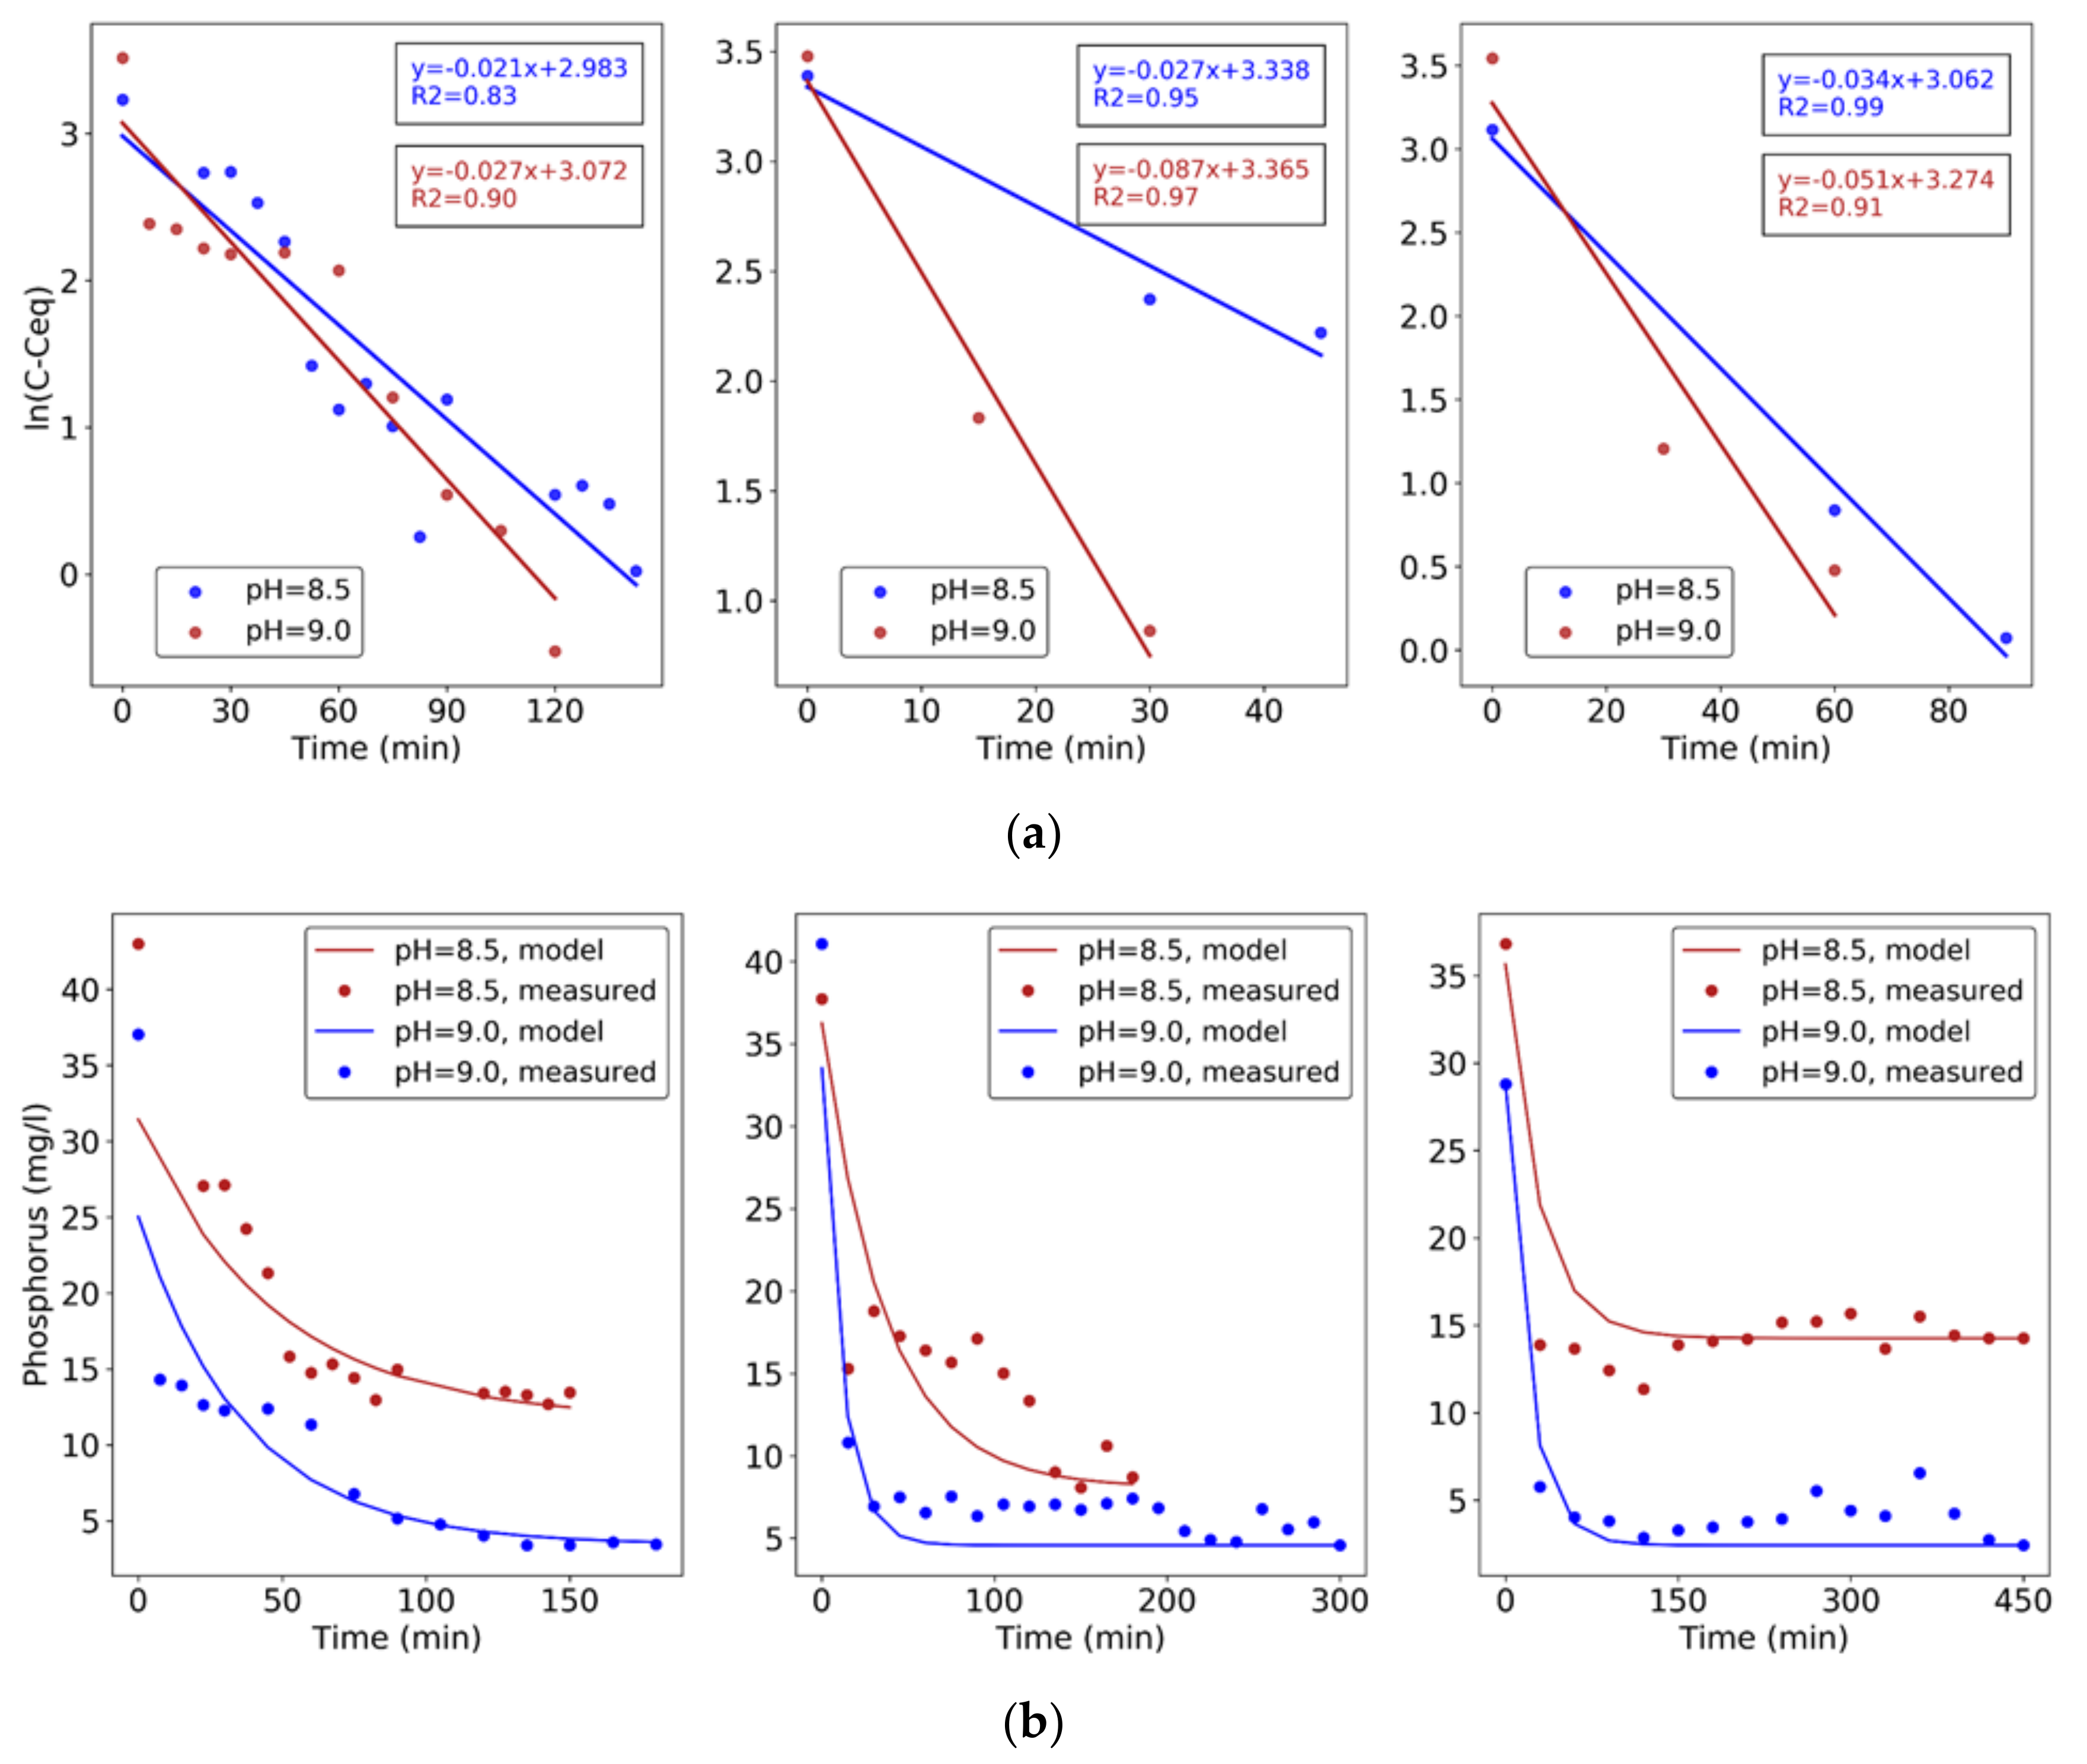
A first-order kinetic model was fitted to obtain the constant rates of the P removal reaction (Equations (9) and (10)) in experiments 1–6:
where C0 is the initial P concentration, Ceq is the P concentration at equilibrium (steady state) condition, C is the P concentration at time t, and k the reaction’s kinetic constant.
Results of kinetic model fitting show the effect of HRT and pH on P removal rates (Table 4). These increase with HRT and, for the same HRT, with pH, as resulting from the slope of the plots of ln(C − Ceq) versus time (Figure 6). This effect is due to the nucleation rate increase with pH increase, causing more surface area to be available for crystal growth [17]. This analysis confirms that the optimal process conditions with NaOH buffer and chemical addition are HRT = 60 min and pH = 9.0, when the fastest removal is achieved.
3.4. Precipitates Analysis
Precipitates collected from all synthetic solution experiments were subject to full characterization with FTIR, TGA, XRD, ICP and elemental analysis.
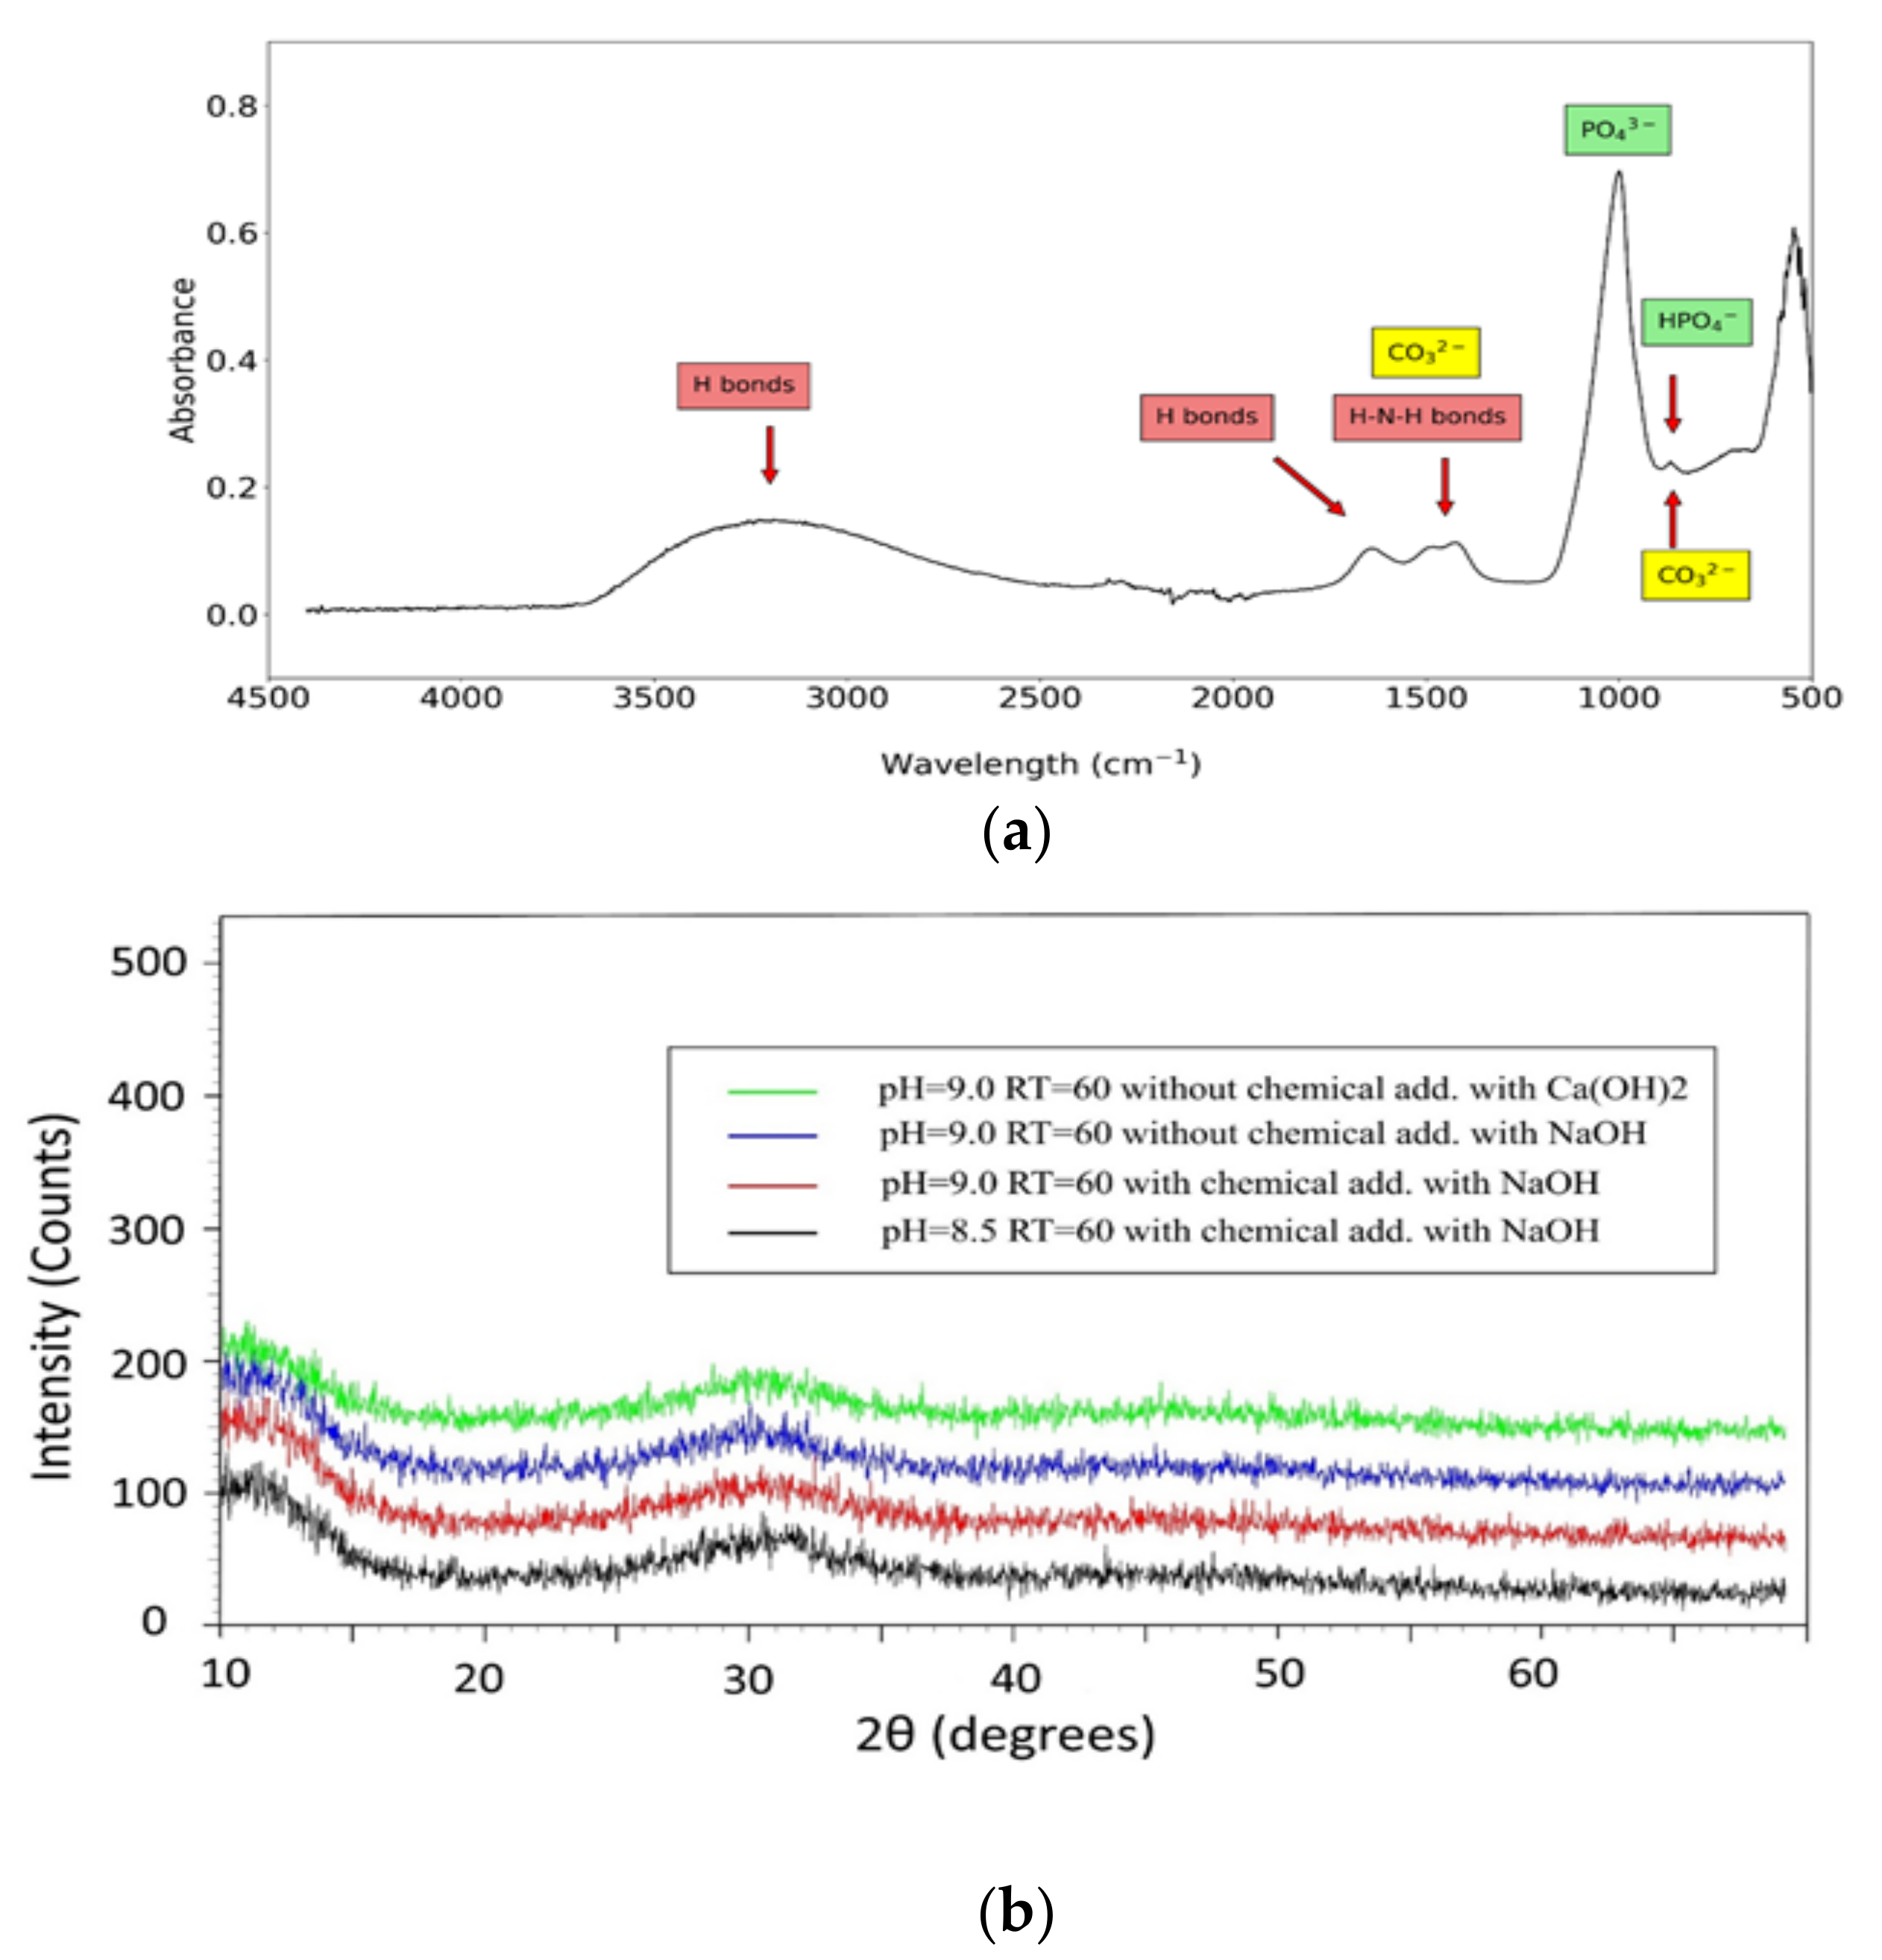
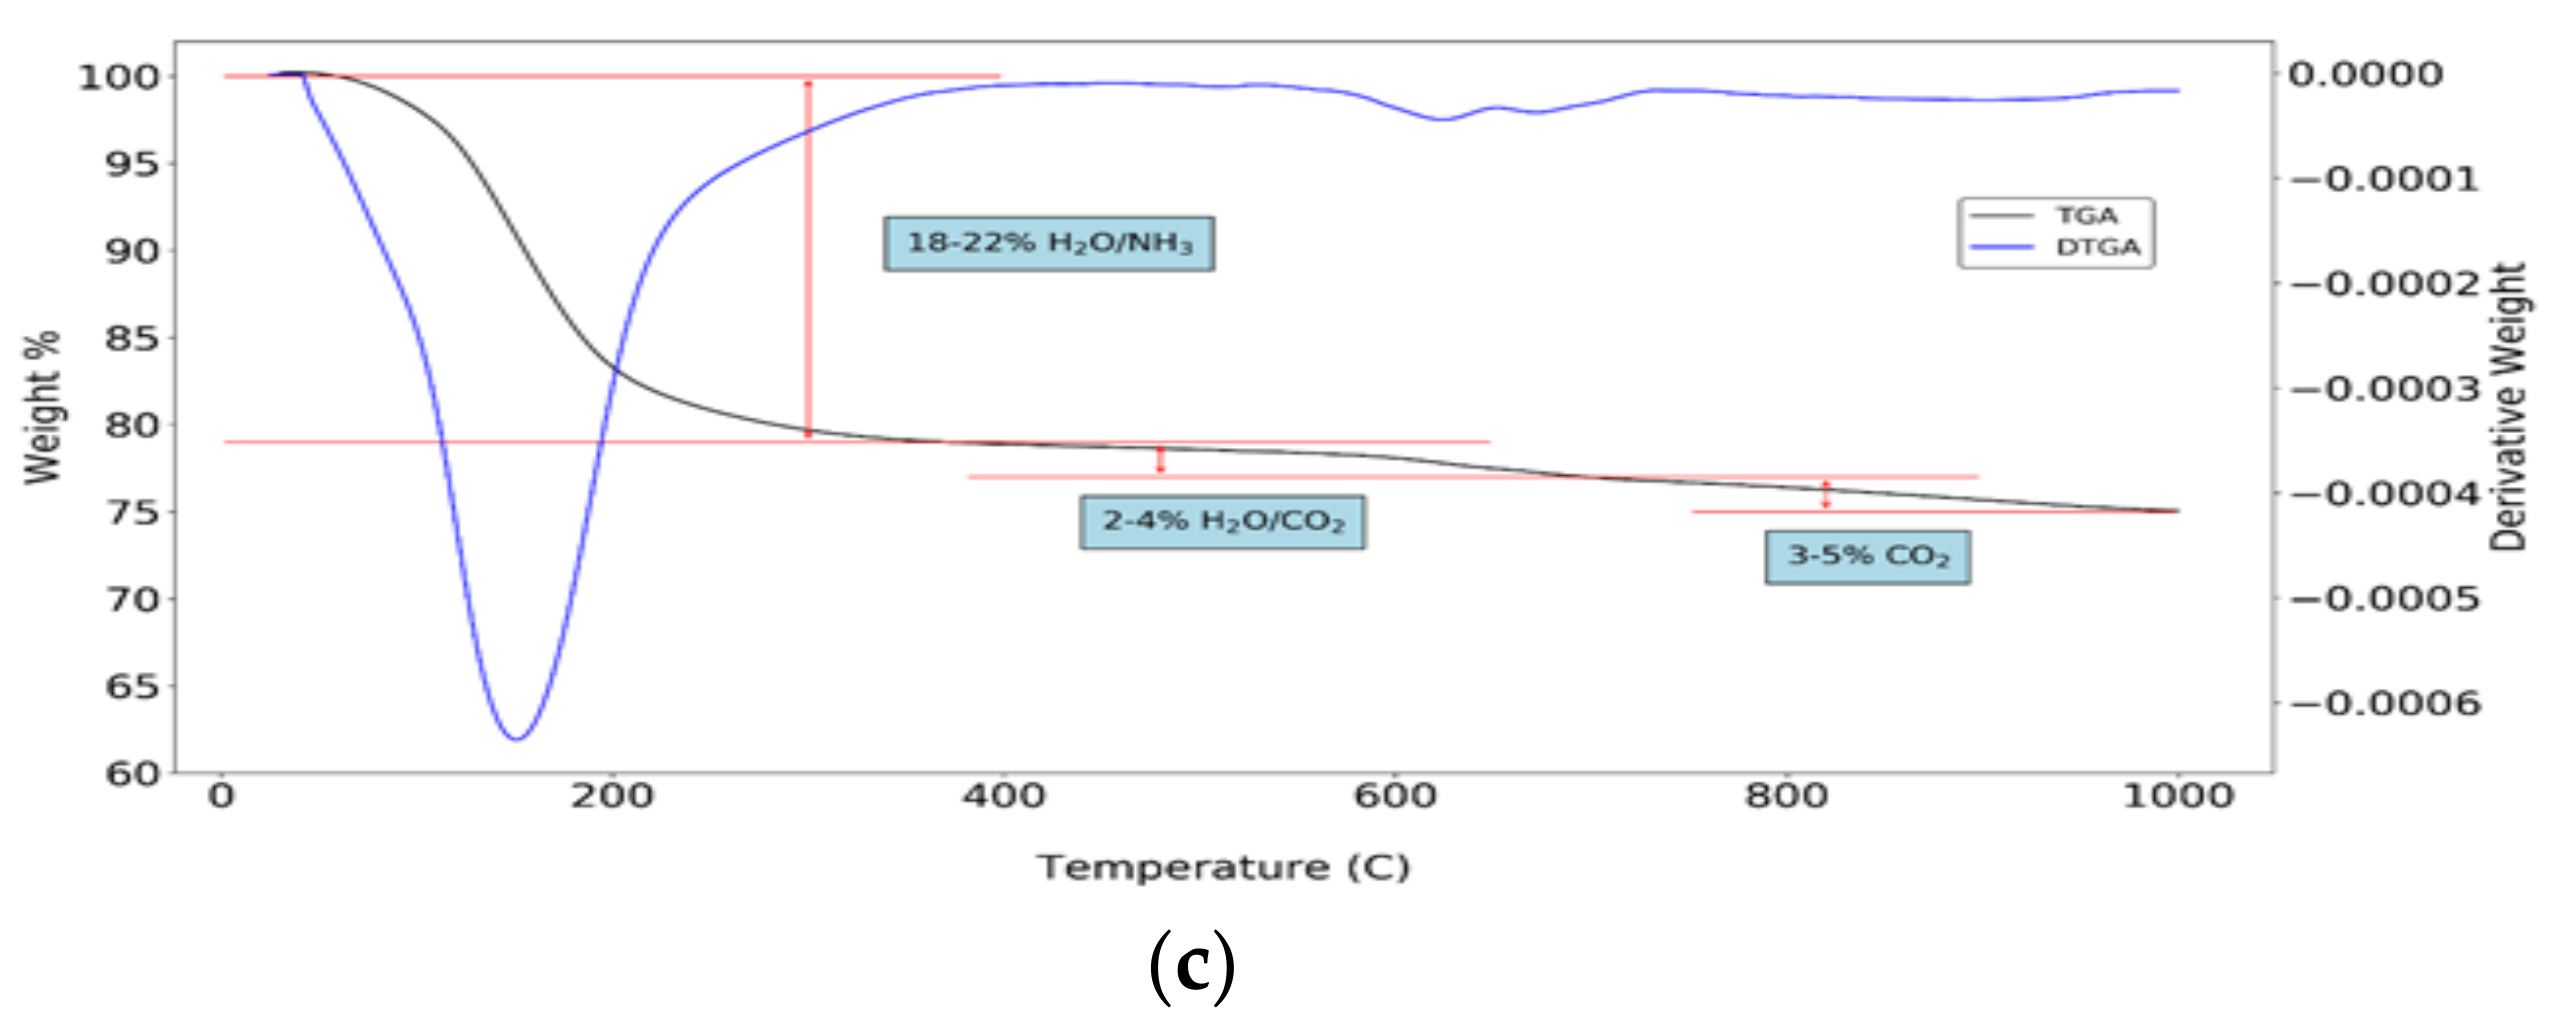
FTIR showed similar spectra for all experiments (Figure 7a, shows those for experiment 4). Contrary to initial assumptions, but in accordance with subsequent chemical modeling, FTIR analysis gave no direct evidence of the presence of struvite. Correlated peaks of phosphate groups and H-bonds [45] were visible around 1000–1100 cm−1 and 3400–3500 cm−1, respectively. The latter peak is related to the presence of water in the precipitates, while observed peaks in the range 1200 to 2000 cm−1 could not be ascribed with certainty to this mineral. Two peaks at around 1400–1500 cm−1 could be related either to the H-N-H bond in struvite or to the carbonate group resulting from precipitation of calcite, while the other peak at around 1650 cm−1 could be associated to ACP. The peak at around 900 cm−1 is typical of the HPO42− group but could also be related to carbonates [46].
This result is not in accordance with previous lab-scale findings, in which direct evidence of struvite precipitation was observed for experiments at Mg:NH4:P = 5:5:1 molar ratio from real wastewater [24]. A possible explanation could be the presence of ACP precipitation inhibitors in real wastewater liquor, not contained in the synthetic solution [47]. In addition, previous experiments [24] were carried out in batch mode, at much longer HRT (18–24 h), giving struvite ample time to grow and precipitate in significant amounts, contrary to the present continuous flow, low HRT experiments, more closely resembling actual operating conditions.
XRD precipitate analyses (Figure 7b, relative to experiments 3, 4, 7 and 9) show a similar, specific pattern with a broad peak around 30°, associated to the amorphous phase in ACP [48]. Specific peaks of struvite are not visible in XRD patterns. Furthermore, TGA (Figure 7c, shown for experiment 4) of precipitates shows a weight loss at around 150 °C, corresponding, on average, to 18–22% of what could be attributed to reversible removal of adsorbed water molecules. This could also be related, however, to the loss of NH3 caused by the presence of struvite in precipitates [49]. Two minor weight losses (2–4% and 3–5%, respectively) are visible at 300–500 °C and 700–800 °C. The latter could be mainly due to presence of calcite (Equation (11)), the former could be related to irreversible water removal, confirming CaHPO4 precipitation (Equation (12)) [49,50].
ICP and elemental analysis reveal the ionic composition of obtained precipitates. Based on their C, N and P content, the amounts of present PO43−, NH4+, CO32− groups can be calculated (Table 5), considering that these are the only possible ionic forms containing those elements in these conditions. Water content is calculated considering total hydrogen content and subtracting the content of NH4+. Results show low error levels for total precipitate estimates in most experiments.
Since struvite is the only possible precipitate compound containing NH4+, any amount of this ion found must correspond strictly to this mineral form. Based on stoichiometric ratios observed in struvite (Mg:NH4:PO4 = 1:1:1), equivalent amounts of these moles are needed; furthermore, there are 6 moles of water in a mole of struvite that will be subtracted from total water content. Similar chemical mass balance procedure was followed for the other groups. CO32− content, for example, can be related to both calcite and magnesite; however, magnesite, notwithstanding the high calculated SI value, precipitates significantly only at pH > 9.5. Therefore, CO32− in these conditions could be associated with, and hence is subtracted from, the Ca2+ precipitate.
The case for the PO43− group, however, is more complicated. The model suggests that different calcium phosphate compounds such as ACP, DCP and HAP, as well as Mg-based compounds such as bobierrite, could precipitate. The detected amount of Ca2+, after subtracting the fraction associated to calcite, can therefore be related to calcium phosphate compounds. Precipitation of HAP is kinetically unlikely under the chosen operating conditions, despite having positive SI, since ACP and DCP forms precipitate first, and their transformation to the HAP form is very slow [27]. In fact, in FTIR spectra, the typical sharp peak of OH− associated to HAP, expected at around 3500 cm−1, is not visible in any of the precipitates, suggesting the absence of this mineral. FTIR, on the other hand, confirmed the presence of the HPO42− group, with its associated peak at around 900 cm−1 quite evident in the observed spectrum (Figure 7a) confirming the presence of DCP precipitates.
At this point, it is difficult to determine how much of the remaining Ca2+ could be related to DCP, and how much to ACP. An estimation may be attempted by subtracting the remaining Ca2+ related to Ca-P forms from total PO43− content, assuming that all of it is related to ACP, in Ca3(PO4)2 form. This assumption will be further discussed later on.
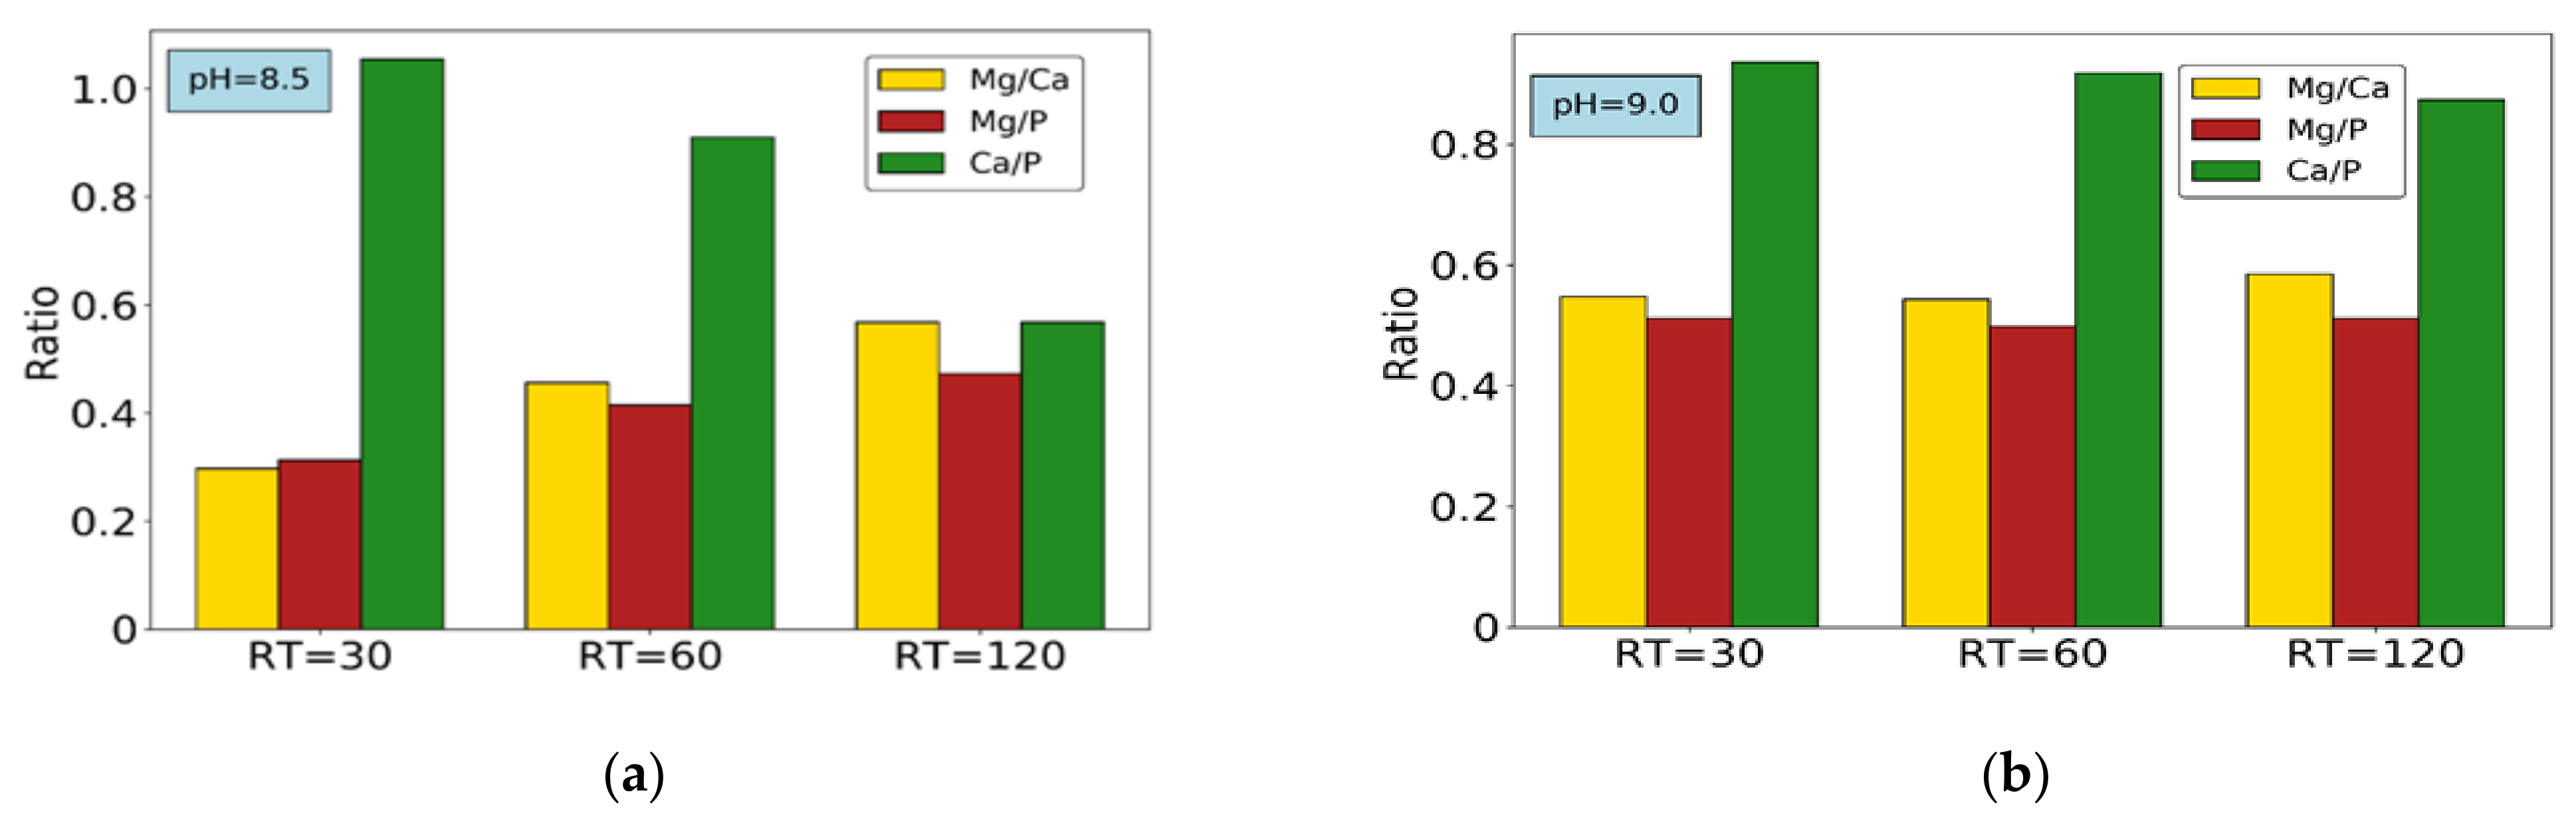
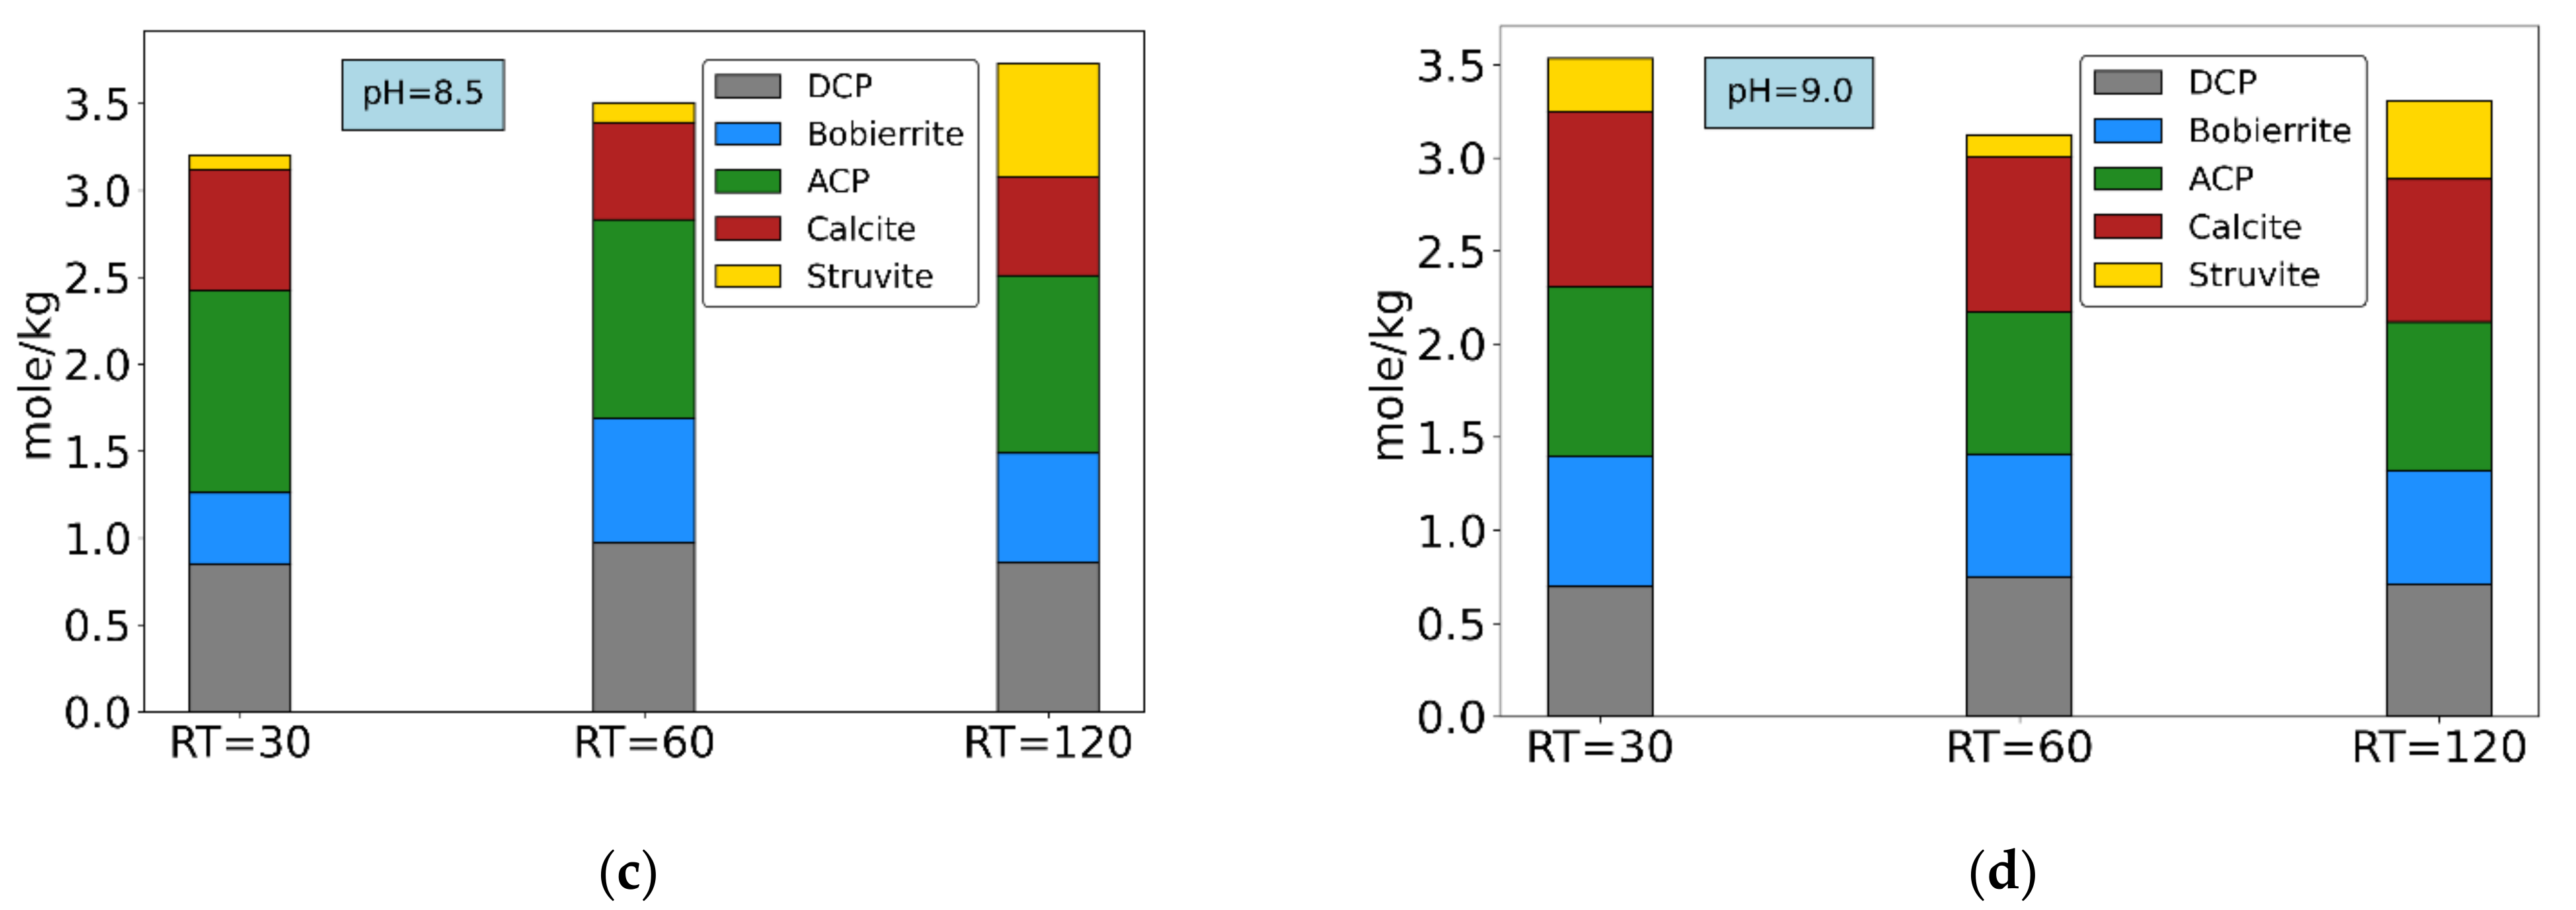
Finally, the remaining Mg2+ content, after accounting for struvite formation, must necessarily be related to bobierrite (the only other Mg-P compound with positive SI according to chemical calculations). Taking into consideration bobierrite’s formula Mg3(PO4)2·8H2O, and stoichiometrically subtracting any Mg2+ content from total phosphate and water contents, the remaining precipitates must contain only phosphate and water. A residual PO43− content confirms the presence of the HPO42− group, and therefore of DCP precipitation. This invalidates the previous assumption considering only ACP formation from Ca2+. Considering this PO43− amount to be in DCP form, and consequently adjusting the Ca2+ balance, all precipitates’ compositions can finally be calculated. Figure 8 shows final ionic ratios and composition of final precipitates for all experiments under NaOH addition (tests 1–6).
Figure 8a shows that at pH = 8.5 the Ca/P ratio decreases with increasing HRT, while Mg/P and Mg/Ca ratios increase. The same occurs at pH = 9.0, but to a lesser extent (Figure 8b). Figure 8c,d shows the composition of final precipitates based on the mass balance calculations for experiments 1–6. At pH = 8.5 (Figure 8c), increase in struvite and a slight decrease in ACP content occurs with HRT increase. The explanation could be due to a precipitation lag of struvite compared to calcium phosphates, caused by slower reaction kinetics [23,45]. Clearly, 30-min HRT is not sufficient for significant struvite precipitation, as previously observed. At pH = 9.0 (Figure 8d), however, this pattern is not so evident.
The possible reason for this could be that, at the lower pH, ionic concentrations in solution are still relatively high because of lower SI values (Table 3), leading to shorter times needed to reach equilibrium. Moreover, moving from pH = 8.5 to 9.0, SI values for Ca-P forms increase considerably more than struvite’s, leading to lower precipitation of the latter compared to the former. In all cases, the main fraction of precipitate consists of ACP and DCP. Studies suggest that, in alkaline conditions, HPO42− could be incorporated within ACP, and would not exist as a separate DCP solid phase [51]. In addition, the SI value of DCP is much lower than ACP’s, and consequently a considerable amount of Ca-P precipitation could in fact occur as ACP [44].
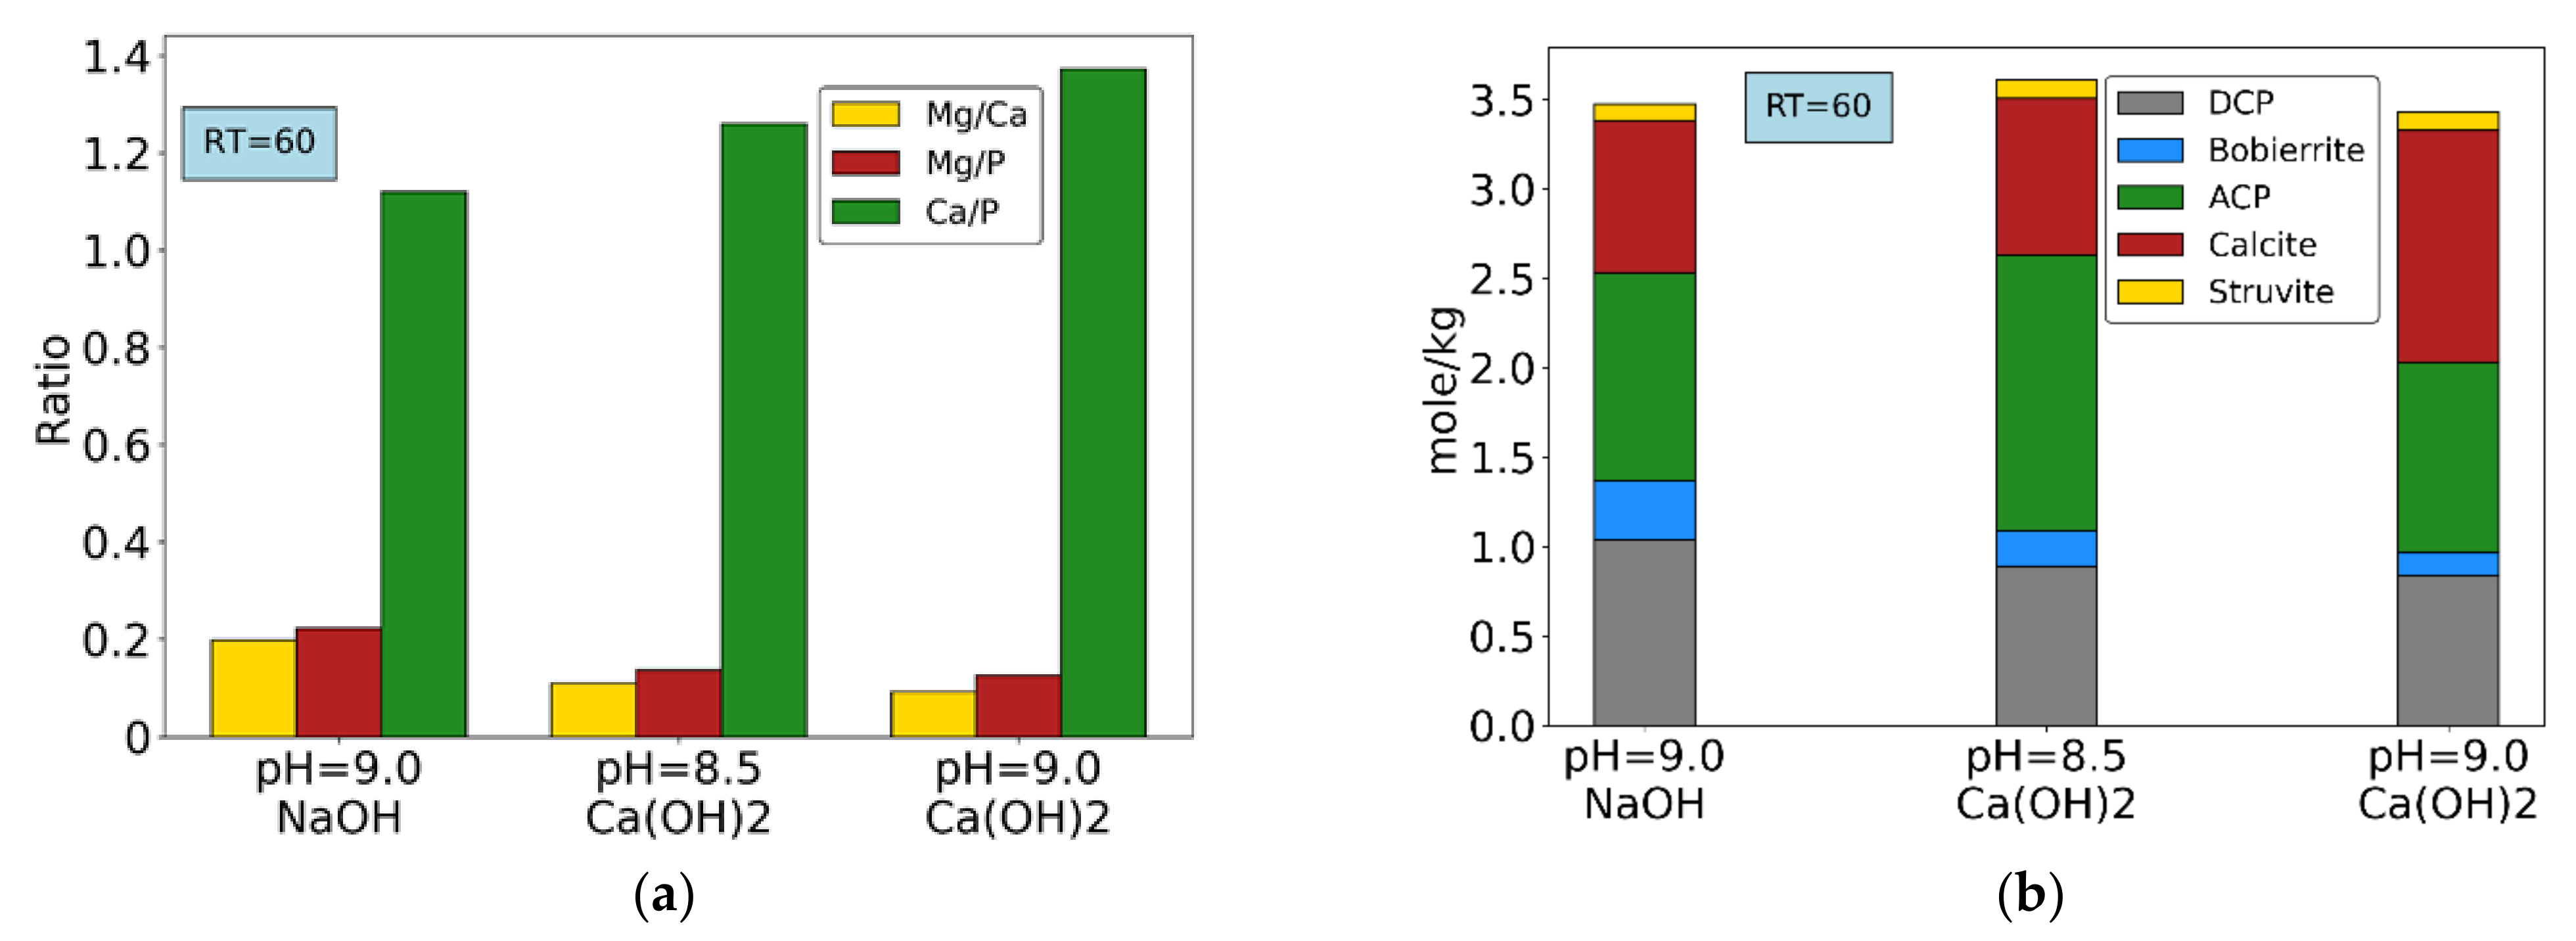
Figure 9 shows molar ratios and composition of final precipitates for the experiments conducted without chemical addition (7, 8 and 9), only using NaOH or Ca(OH)2 as pH buffers, at HRT = 60 min. Results show significantly limited struvite precipitation due to low Mg/Ca ratios in solution in all conditions, in line with other studies [52,53]. At pH = 9.0, addition of Ca(OH)2 leads to higher calcite precipitation, a situation not favorable for the final composition of the precipitates. However, with the same buffer agent at pH = 8.5, ACP formation increases both compared to the previous case and to NaOH-driven conditions, without increasing or decreasing calcite precipitation. In addition, bobierrite precipitation is slightly higher at pH = 8.5 compared to pH = 9.0 when using Ca(OH)2. It can therefore be concluded that the use of Ca(OH)2 to control pH at 8.5 yields a more favorable combination of precipitates, in term of useful P recovery, compared to the use of NaOH or Ca(OH)2 at pH = 9.0.
3.5. Second Stage: Process Application with Real Wastewater
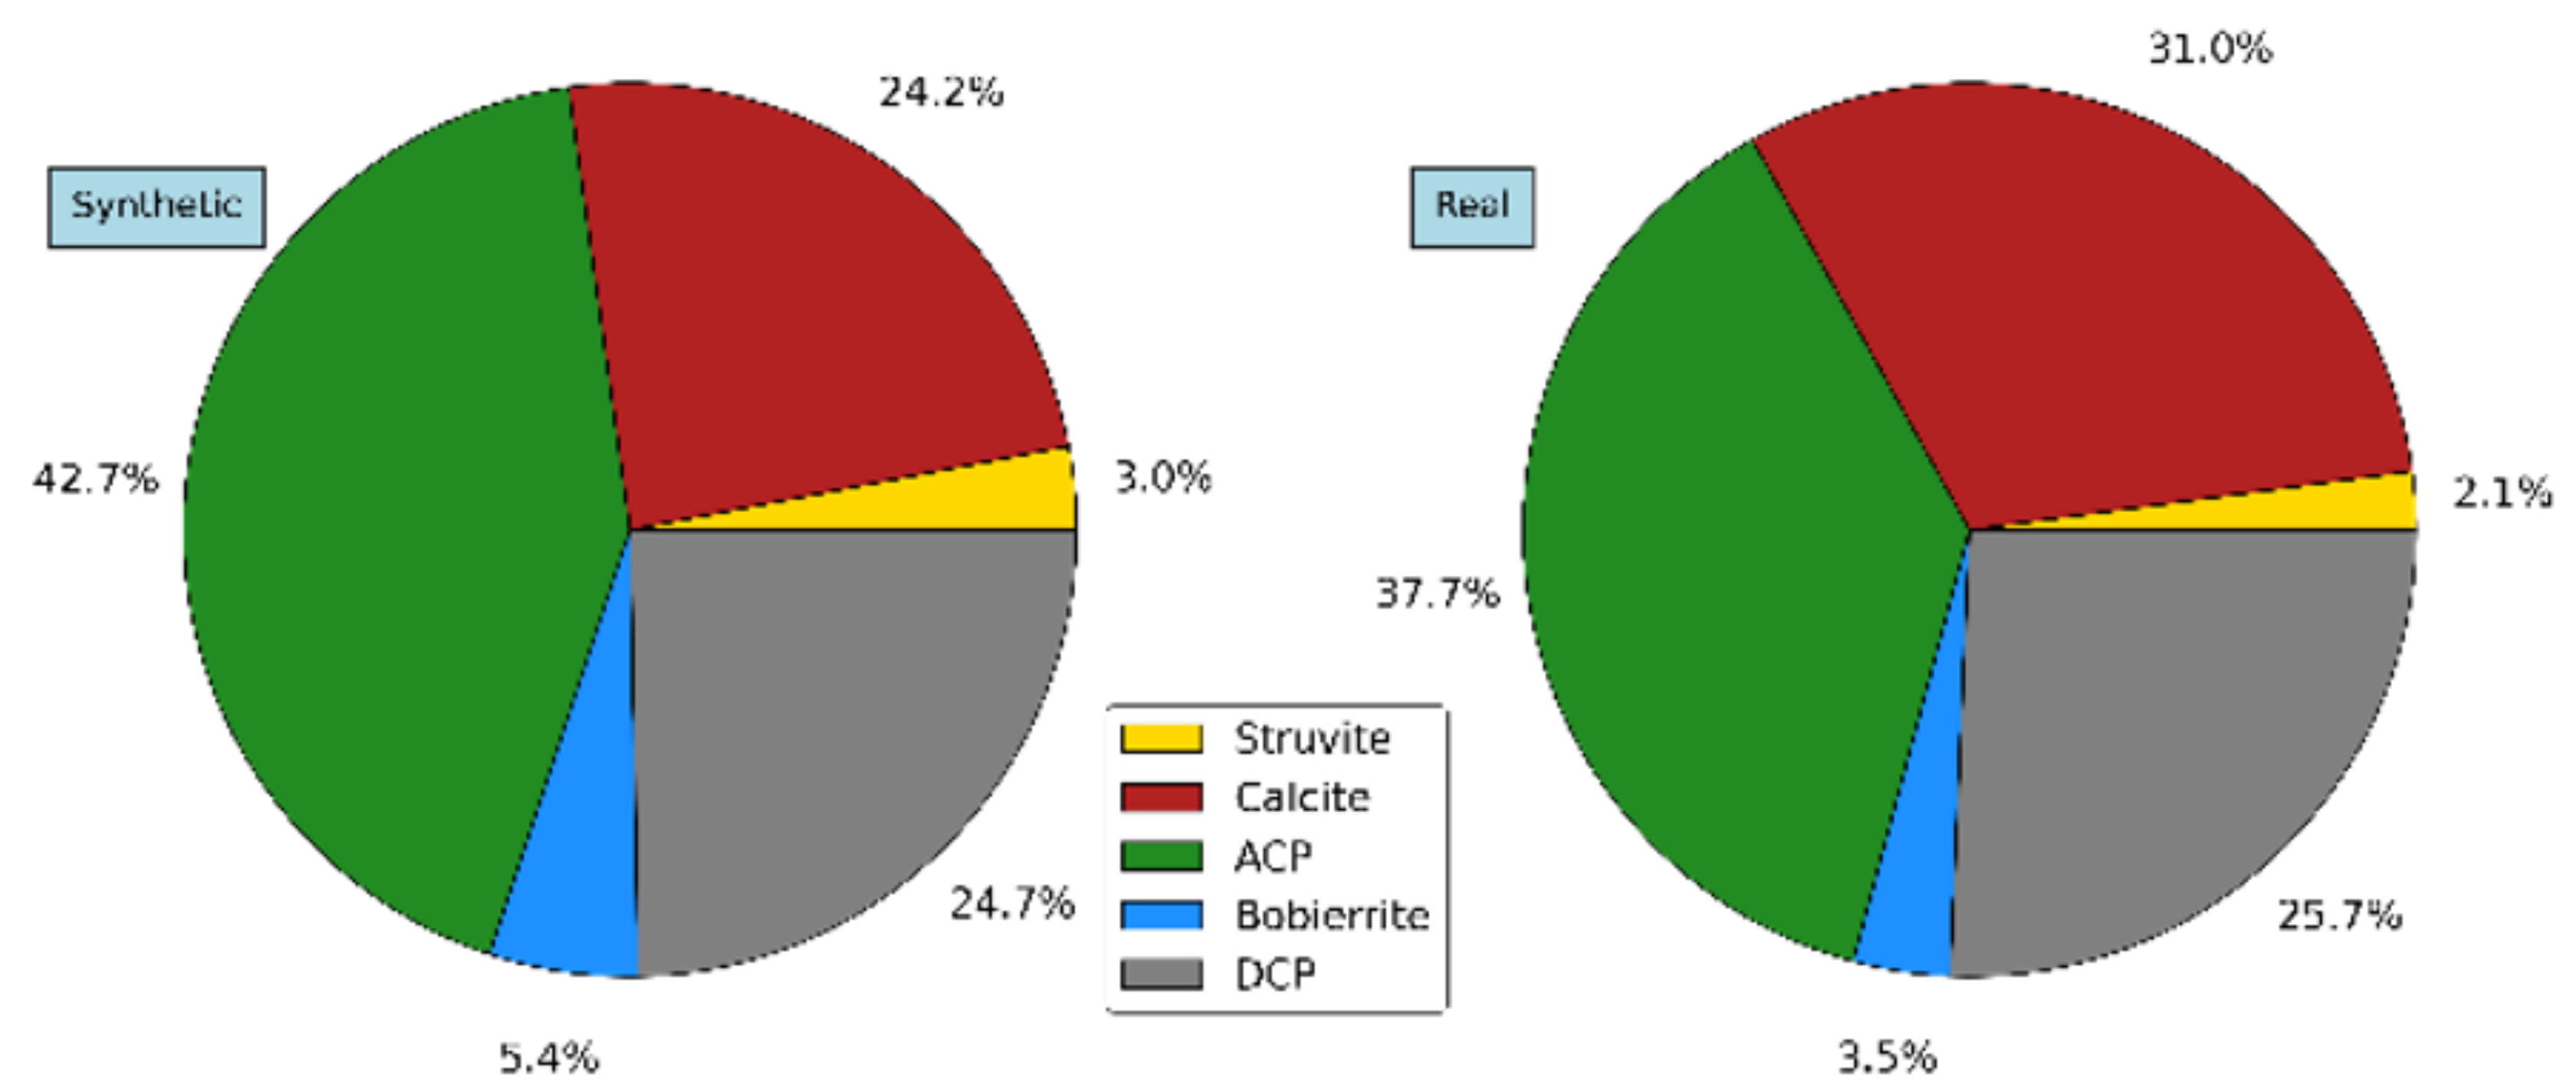
Based on the outcomes observed so far under synthetic wastewater operating conditions, the second stage of the study aimed at their validation under a more realistic operative situation. The reactor was operated with real wastewater under the most favorable conditions for P recovery identified in stage 1, i.e., those represented by experiment no. 8 (pH = 8.5 buffered with Ca(OH)2 only, no Mg and ammonia addition). The precipitate was characterized according to the procedures described in Section 3.4. The content of each ionic group in the final precipitates obtained with real wastewater operation is compared with the results of experiment 8 (Table 6). Precipitates show less ammonium and phosphate content but contain higher carbonate groups. This leads to higher calcite precipitation rather than calcium phosphate compounds. The possible explanation for this could be the presence of inhibitors for calcium phosphate precipitation in real wastewater compared to the synthetic one. Humic Acid (HA) as one of the main fractions of dissolved organic matter in wastewater could have inhibitory effect on the precipitation of phosphate groups [54,55].
Nonetheless, as seen from Figure 10, showing the main precipitates in both operating conditions, this final test substantially confirmed the previous results. Use of Ca(OH)2 for pH buffering without costly magnesium and ammonia addition to the mixed liquor leads to a process with 70–80% P removal and a final precipitate containing 70% nutrient-rich valuable compounds. This is a feasible scenario for effective recovery of valuable P precipitates from aerobic wastewater treatment processes where the presence of PAO microorganisms could leads to P release in the anaerobic zone of an A/O unit sequence.
4. Discussion
When attempting P recovery by struvite precipitation from aerobic liquor, significant Mg2+ and NH4+ addition would be needed to achieve a suitable stoichiometric balance in the solution: an optimal Mg:NH4:P = 5:5:1 solute molar ratio was determined by chemical equilibrium modelling under tested conditions. The needed quantities of added chemicals are much higher than those required for struvite precipitation from anaerobic digestate supernatant, richer in ammonium, to which the process is normally applied [56], and could constitute a significant added cost, estimated at about 0.25 €/m3 under similar study conditions [57]. Therefore, attempting to obtain pure struvite recovery from aerobic liquor, no matter how high the dissolved P-concentration, might not be the most economically advantageous and sustainable course of action. Ca-P rich precipitate, a valuable form of recovered P mineral, however, could be obtained from aerobic liquor without any chemical addition, substituting the more common, but expensive, NaOH buffer agent for pH with the much cheaper Ca(OH)2 [57]. This could be an effective method of phosphorus recovery, since the main final product, ACP, has great fertilization potential, either directly or indirectly as a raw material for fertilizers. ACP in fact has high P content and low solubility, high P uptake potential and plant availability, particularly in acidic soil conditions [28,58]. Based on earlier bench-scale tests, the cost of ACP recovery using Ca(OH)2 for pH adjustment under similar process conditions was estimated in the order of 0.003–0.006 €/m3 wastewater treated, that is, two orders of magnitude lower than under a struvite recovery option [57].
Under real conditions, the tested process achieved specific P-recovery efficiencies (i.e., P-recovery as a fraction of solute-P) of around 80%. The present study exploited peculiar characteristics of the treatment facility, where PAOs presence was observed, but could be easily implemented in a full EBPR-based wastewater treatment plant [37]. Mineral precipitation from wastewater liquor without EBPR would be only partially effective for P recovery and may not meet discharge requirements due to low dissolved P levels in the absence of anaerobic release. While an EBPR process scheme would be advantageous, a non-EPBR approach could be applied, in principle, to any facility. A similar process applied to aerobically digested sludge filtrates from small treatment facilities in Florida (USA), without EBPR, was reported to have achieved 41–61% P recovery without Mg salts addition [35].
The results obtained compare favorably with current P-salts precipitation processes, normally achieving an average 80% P-removal with ferric chloride dosage, resulting in a precipitate that is not directly reusable [59,60]. Mineral precipitation from EBPR mixed liquor would not only be effective to recover P-minerals but would meet discharge requirements without generating phosphorus salts of burdensome handling.
5. Conclusions
A pilot scale reactor for continuous phosphorus recovery from aerobic liquor was implemented and operated under various conditions. Initially, the experimental setup considered struvite precipitation as ideal objective. Based on aerobic liquor characteristics, a Mg:NH4:P = 5:5:1 molar ratio in solution was identified as potentially yielding the best results. Experiments with a synthetic solution reproducing the ionic content of the real facility wastewater were conducted to fine-tune the process, and to identify the composition of final precipitates obtained in different operating conditions.
Validation of the process with real wastewater achieved successful continuous precipitation of useful P minerals (mostly ACP) at pH = 8.5, with the sole addition of Ca(OH)2 for pH control. This entails operating process costs that are much lower than in the case of P recovery in struvite form (0.003–0.006 €/m3 of treated wastewater compared to 0.2 €/m3 for struvite). It can be concluded that P precipitation from aerobic liquor, normally considered not to have significant struvite recovery potential due to low P and ammonia contents, could be a feasible approach when added to EBPR process schemes, to sustainably recover P in usable fertilizer forms.
Author Contributions
Conceptualization, S.D. and A.G.C.; methodology, S.D. and D.C. (Daniele Cecconet); validation, S.D. and D.C. (Doretta Capsoni); analysis, S.D. and D.C. (Doretta Capsoni); investigation, S.D. and D.C. (Daniele Cecconet); resources, A.G.C.; data curation, D.C. (Daniele Cecconet); writing—original draft preparation, S.D. and D.C. (Daniele Cecconet); writing—review and editing, A.G.C. All authors have read and agreed to the published version of the manuscript.
Funding
This study was partly supported by a research grant from the CARIPLO Foundation, Milan, Italy (grant number 2014–0582) to the University of Pavia, Department of Civil Engineering & Architecture (Capodaglio).
Institutional Review Board Statement
Not applicable.
Informed Consent Statement
Not applicable.
Data Availability Statement
Data supporting reported results can be requested from the corresponding author.
Conflicts of Interest
The authors declare no conflict of interest.
References
- Copetti, D.; Valsecchi, L.; Capodaglio, A.G.; Tartari, G. Direct measurement of nutrient concentrations in freshwaters with a miniaturized analytical probe: Evaluation and validation. Environ. Monit. Assess 2017, 189, 144. [Google Scholar] [CrossRef] [PubMed]
- Lewis, W.M.; Wurtsbaugh, W.A.; Paerl, H.W. Rationale for Control of Anthropogenic Nitrogen and Phosphorus to Reduce Eutrophication of Inland Waters. Environ. Sci. Technol. 2011, 45, 10300–10305. [Google Scholar] [CrossRef] [PubMed]
- Barnard, J. A review of biological phosphorus removal in the activated sludge process. Water SA 1976, 2, 136–144. [Google Scholar]
- Capodaglio, A.G.; Hlavínek, P.; Raboni, M. Physico-chemical technologies for nitrogen removal from wastewaters: A review. Rev. Ambiente Agua 2015, 10, 481–498. [Google Scholar]
- Capodaglio, A.G.; Hlavínek, P.; Raboni, M. Advances in wastewater nitrogen removal by biological processes: State of the art review. Rev. Ambiente Agua 2016, 11, 250–267. [Google Scholar] [CrossRef] [Green Version]
- Ghosh, S.; Lobanov, S.; Lo, V.K. An overview of technologies to recover phosphorus as struvite from wastewater: Advantages and shortcomings. Environ. Sci. Pollut. Res. 2019, 26, 19063–19077. [Google Scholar] [CrossRef]
- EEC. Council Directive 91/271/EEC, Concerning Urban Waste-Water Treatment. Off. J. Eur. Communities 1991, 34, 40. Available online: https://eurlex.europa.eu/legalcontent/EN/TXT/PDF/?uri=CELEX:31991L0271&from=EN (accessed on 20 November 2021).
- Daneshgar, S.; Callegari, A.; Capodaglio, A.G.; Vaccari, D. The Potential Phosphorus Crisis: Resource Conservation and Possible Escape Technologies: A Review. Resources 2018, 7, 37. [Google Scholar] [CrossRef] [Green Version]
- Monetti, J.; Ledezma, P.; Freguia, S. Optimised operational parameters for improved nutrient recovery from hydrolysed urine by bio-electroconcentration. Separ. Purific. Technol. 2021, 27915, 119793. [Google Scholar] [CrossRef]
- Capodaglio, A.G.; Olsson, G. Energy Issues in Sustainable Urban Wastewater Management: Use, Demand Reduction and Recovery in the Urban Water Cycle. Sustainability 2020, 12, 266. [Google Scholar] [CrossRef] [Green Version]
- Capodaglio, A.G.; Bolognesi, S.; Cecconet, D. Sustainable, decentralized sanitation and reuse with hybrid nature-based systems. Water 2021, 13, 1583. [Google Scholar] [CrossRef]
- Capodaglio, A.G.; Callegari, A.; Cecconet, D.; Molognoni, D. Sustainability of decentralized wastewater treatment technologies. Water Pract. Technol. 2017, 12, 463–477. [Google Scholar] [CrossRef]
- Novotny, V. Integrated Sustainable Urban Water, Energy, and Solids Management: Achieving Triple Net-Zero Adverse Impact Goals and Resiliency of Future Communities; Wiley: Hoboken, NJ, USA, 2020. [Google Scholar]
- Mainardis, M.; Cecconet, D.; Moretti, A.; Callegari, A.; Goi, D.; Freguia, S.; Capodaglio, A.G. Wastewater fertigation in agriculture: Issues and opportunities for improved water management and circular economy. Environ. Pollut. 2022, 296, 118755. [Google Scholar] [CrossRef]
- Larriba, O.; Rovira-Cal, E.; Juznic-Zonta, Z.; Guisasola, A.; Baeza, J.A. Evaluation of the integration of P recovery, polyhydroxyalkanoate production and short cut nitrogen removal in a mainstream wastewater treatment process. Water Res. 2020, 172, 115474. [Google Scholar] [CrossRef]
- Desmidt, E.; Ghyselbrecht, K.; Zhang, Y.; Pinoy, L.; Van Der Bruggen, B.; Verstraete, W.; Meesschaert, B. Global phosphorus scarcity and full-scale P-recovery techniques: A review. Crit. Rev. Environ. Sci. Technol. 2015, 45, 336–384. [Google Scholar] [CrossRef]
- Morse, G.K.; Brett, S.W.; Guy, J.A.; Lester, J.N. Phosphorus removal and recovery technologies. Sci. Total Environ. 1998, 212, 69–81. [Google Scholar] [CrossRef]
- Parsons, S.A.; Doyle, D. Struvite scale formation and control. Water Sci. Technol. 2004, 49, 177–182. [Google Scholar] [CrossRef]
- Le Corre, K.S.; Valsami-Jones, E.; Hobbs, P.; Parsons, S.A. Phosphorus Recovery from Wastewater by Struvite Crystallization: A Review. Crit. Rev. Environ. Sci. Technol. 2009, 39, 433–477. [Google Scholar] [CrossRef] [Green Version]
- Rahaman, M.S.; Mavinic, D.S.; Meikleham, A.; Ellis, N. Modeling phosphorus removal and recovery from anaerobic digester supernatant through struvite crystallization in a fluidized bed reactor. Water Res. 2014, 51, 1–10. [Google Scholar] [CrossRef]
- Doyle, J.D.; Parsons, S.A. Struvite formation, control and recovery. Water Res. 2002, 36, 3925–3940. [Google Scholar] [CrossRef]
- Jaffer, Y.; Clark, T.A.; Pearce, P.; Parsons, S.A. Potential phosphorus recovery by struvite formation. Water Res. 2002, 36, 1834–1842. [Google Scholar] [CrossRef]
- Nelson, N.O.; Mikkelsen, R.L.; Hesterberg, D.L. Struvite precipitation in anaerobic swine lagoon liquid: Effect of pH and Mg:P ratio and determination of rate constant. Bioresour. Technol. 2003, 89, 229–236. [Google Scholar] [CrossRef]
- Daneshgar, S.; Buttafava, A.; Capsoni, D.; Callegari, A.; Capodaglio, A.G. Impact of pH and Ionic Molar Ratios on Phosphorous Forms Precipitation and Recovery from Different Wastewater Sludges. Resources 2018, 7, 71. [Google Scholar] [CrossRef] [Green Version]
- Çelen, I.; Buchanan, J.R.; Burns, R.T.; Bruce Robinson, R.; Raj Raman, D. Using a chemical equilibrium model to predict amendments required to precipitate phosphorus as struvite in liquid swine manure. Water Res. 2007, 41, 1689–1696. [Google Scholar] [CrossRef]
- Daneshgar, S.; Buttafava, A.; Callegari, A.; Capodaglio, A.G. Simulations and laboratory tests for assessing phosphorus recovery efficiency from sewage sludge. Resources 2018, 7, 54. [Google Scholar] [CrossRef] [Green Version]
- Musvoto, E.V.; Wentzel, M.C.M.; Ekama, G.A.M. Integrated Chemical-Physical Processes Modelling II. Simulating Aeration Treatment of Anaerobic Digester Supernatants. Water Res. 2000, 34, 1868–1880. [Google Scholar] [CrossRef]
- Muster, T.H.; Douglas, G.B.; Sherman, N.; Seeber, A.; Wright, N.; Guzukara, Y. Towards effective phosphorus recycling from wastewater: Quantity and quality. Chemosphere 2013, 91, 676–684. [Google Scholar] [CrossRef]
- Johnston, A.E.; Richards, I.R. Effectiveness of different precipitated phosphate as phosphorus source for plants. Soil Use Manag. 2003, 19, 45–49. [Google Scholar] [CrossRef]
- Egle, L.; Rechberger, H.; Krampe, J.; Zessner, M. Phosphorus recovery from municipal wastewater: An integrated comparative technological, environmental and economic assessment of P recovery technologies. Sci. Total Environ. 2016, 571, 522–542. [Google Scholar] [CrossRef] [Green Version]
- Zeeman, G.; Kujawa, K.; de Mes, T.; Hernandez, L.; de Graaf, M.; Abu-Ghunmi, L.; Mels, A.; Meulman, B.; Temmink, H.; Buisman, C.; et al. Anaerobic treatment as a core technology for energy, nutrients and water recovery from source-separated domestic waste(water). Water Sci. Technol. 2008, 57, 1207–1212. [Google Scholar] [CrossRef] [Green Version]
- Cecconet, D.; Callegari, A.; Capodaglio, A.G. UASB Performance and Perspectives in Urban Wastewater Treatment at Sub-Mesophilic Operating Temperature. Water 2022, 14, 115. [Google Scholar] [CrossRef]
- Cecconet, D.; Mainardis, M.; Callegari, A.; Capodaglio, A.G. Psychrophilic treatment of municipal wastewater with a combined UASB/ASD system, and perspectives for improving urban WWTP sustainability. Chemosphere 2022, 297, 134228. [Google Scholar] [CrossRef]
- Daneshgar, S.; Vanrolleghem, P.A.; Vaneeckhaute, C.; Buttafava, A.; Capodaglio, A.G. Optimization of P compounds recovery from aerobic sludge by chemical modeling and response surface methodology combination. Sci. Total Environ. 2019, 668, 668–677. [Google Scholar] [CrossRef]
- Hallas, J.F.; Mackowiak, C.L.; Wilkie, A.C.; Harris, W.G. Struvite Phosphorus Recovery from Aerobically Digested Municipal Wastewater. Sustainability 2019, 11, 376. [Google Scholar] [CrossRef] [Green Version]
- Levin, G.; Shapiro, J. Metabolic uptake of phosphorus by wastewater organisms. J. Water Pollut. Control Fed. 1965, 37, 800–821. [Google Scholar]
- Tomei, M.C.; Stazi, V.; Daneshgar, S.; Capodaglio, A.G. Holistic Approach to Phosphorus Recovery from Urban Wastewater: Enhanced Biological Removal Combined with Precipitation. Sustainability 2020, 12, 575. [Google Scholar] [CrossRef] [Green Version]
- EPA. Method 365.3: Phosphorus, All Forms (Colorimetric, Ascorbic Acid, Two Reagent), United States Environmental Protection Agency. 1978. Available online: https://www.epa.gov/sites/production/files/2015-08/.../method_365-3_1978.pdf (accessed on 15 February 2016).
- Astrom, K.; Hagglund, T. PID Controllers: Theory, Design, and Tuning, 2nd ed.; Instrument Society of America: Research Triangle, NC, USA, 1995. [Google Scholar]
- Ziegler, J.G.; Nichols, N.B. Optimum settings for automatic controllers. Trans. ASME 1942, 64, 759–768. [Google Scholar] [CrossRef]
- Comeau, Y.; Rabionwitz, B.; Hall, K.J.; Oldham, W.K. Phosphate Release and Uptake in Enhanced Biological Phosphorus Removal from Wastewater. J. Water Pollut. Control Fed. 1987, 59, 707–715. [Google Scholar]
- Tykesson, E.; Jansen, J.L.C. Evaluation of laboratory batch tests for enhanced biological phosphorus removal. Vatten 2005, 61, 43–50. [Google Scholar]
- USGS. User’s Guide to PHREEQC (Version 2): A Computer Program for Speciation, Batch-Reaction, One-Dimensional Transport, and Inverse Geochemical Calculations. Water-Resour. Investig. Rep. 1999, 99, 312. [Google Scholar]
- Liu, X.; Wang, J. Impact of calcium on struvite crystallization in the wastewater and its competition with magnesium. Chem. Eng. 2019, 378, 122121. [Google Scholar] [CrossRef]
- Soptrajanov, B.; Stefov, V.; Lutz, H.D.; Engelen, B. Infrared and Raman Spectra of Magnesium Ammonium Phosphate Hexahydrate (struvite) and its Isomorphous Analogues. Spectrosc. Emerg. Mater. 2004, 165, 299–308. [Google Scholar]
- Berzina-Cimdina, L.; Borodajenko, N. Research of Calcium Phosphates Using Fourier Transform Infrared Spectroscopy. In Infrared Spectroscopy—Materials Science, Engineering and Technology; Theophile Theophanides: London, UK, 2012; pp. 123–148. [Google Scholar]
- Lei, Y.; Song, B.; Saakes, M.; van der Weijden, R.D.; Buisman, C.J.N. Interaction of calcium, phosphorus and natural organic matter in electrochemical recovery of phosphate. Water Res. 2018, 142, 10–17. [Google Scholar] [CrossRef]
- Lam, E.; Gu, Q.; Swedlund, P.J.; Marchesseau, S.; Hemar, Y. X-ray diffraction investigation of amorphous calcium phosphate and hydroxyapatite under ultra-high hydrostatic pressure. Int. J. Min. Met. Mater. 2015, 22, 1225–1231. [Google Scholar] [CrossRef]
- Tõnsuaadu, K.; Gross, K.A.; Pluduma, L.; Veiderma, M. A review on the thermal stability of calcium apatites. J. Therm. Anal. Calorim 2012, 110, 647–659. [Google Scholar] [CrossRef]
- Vecstaudza, J.; Gasik, M.; Locs, J. Amorphous calcium phosphate materials: Formation, structure and thermal behavior. J. Eur. Ceram. 2019, 39, 1642–1649. [Google Scholar] [CrossRef]
- Dorozhkin, S.V. Amorphous calcium (ortho)phosphates. Acta Biomater. 2010, 6, 4457–4475. [Google Scholar] [CrossRef]
- Lee, S.H.; Yoo, B.H.; Kim, S.K.; Lim, S.J.; Kim, J.Y.; Kim, T.H. Enhancement of struvite purity by re-dissolution of calcium ions in synthetic wastewaters. J. Hazard. Mater. 2013, 261, 29–37. [Google Scholar] [CrossRef]
- Lee, S.H.; Kumar, R.; Jeon, B.H. Struvite precipitation under changing ionic conditions in synthetic wastewater: Experiment and modeling. J. Colloid Interface Sci. 2016, 474, 93–102. [Google Scholar] [CrossRef]
- Wei, L.; Hong, T.; Liu, H.; Chen, T. The effect of sodium alginate on struvite crystallization in aqueous solution: A kinetics study. J. Cryst. Growth 2017, 473, 60–65. [Google Scholar] [CrossRef]
- Wei, L.; Hong, T.; Cui, K.; Chen, T.; Zhou, Y.; Zhao, Y.; Yin, Y.; Wang, J.; Zhang, Q. Probing the effect of humic acid on the nucleation and growth kinetics of struvite by constant composition technique. Chem. Eng. 2019, 378, 122130. [Google Scholar] [CrossRef]
- Zeng, F.; Zhao, Q.; Jin, W.; Liu, Y.; Wang, K.; Lee, D.J. Struvite precipitation from anaerobic sludge supernatant and mixed fresh/stale human urine. Chem. Eng. 2018, 344, 254–261. [Google Scholar] [CrossRef]
- Daneshgar, S.; Buttafava, A.; Callegari, A.; Capodaglio, A.G. Economic and energetic assessment of different phosphorus recovery options from aerobic sludge. J. Clean. Prod. 2019, 223, 729–738. [Google Scholar] [CrossRef]
- Romer, W.; Steingrobe, B. Fertilizer effect of phosphorus recycling products. Sustainability 2018, 10, 1166. [Google Scholar] [CrossRef] [Green Version]
- Likosova, E.M.; Keller, J.; Poussade, Y.; Freguia, S. A novel electrochemical process for the recovery and recycling of ferric chloride from precipitation sludge. Water Res. 2014, 51, 96–103. [Google Scholar] [CrossRef] [PubMed] [Green Version]
- Kato, F.; Kitakoji, H.; Oshita, K.; Takaoka, M.; Takeda, N.; Matsumoto, T. Extraction efficiency of phosphate from pre-coagulated sludge with NaHS. Water Sci. Technol. 2006, 54, 119–129. [Google Scholar] [CrossRef] [Green Version]
Figure 1.
Scheme of the experimental reactor.

Figure 2.
Mechanism of nucleation, growth and aggregation of crystals.

Figure 3.
pH control by PID-Time Proportional control during test 1.

Figure 4.
(a) Cumulative NaOH added for pH control with respect to HRT. (b): NaOH added to the reactor after 3 retention times. RT: retention times.
Figure 4.
(a) Cumulative NaOH added for pH control with respect to HRT. (b): NaOH added to the reactor after 3 retention times. RT: retention times.

Figure 5.
Phosphorus concentration trend with time.: (a) with NaOH buffer and chemical addition. (b) NaOH or Ca(OH)2 buffer, without Mg and ammonia addition.
Figure 5.
Phosphorus concentration trend with time.: (a) with NaOH buffer and chemical addition. (b) NaOH or Ca(OH)2 buffer, without Mg and ammonia addition.

Figure 6.
Kinetic models of P removal.: (a)log plots, HRT 30, 60 and 120 min. (Left to right). (b) data plots, HRT 30, 60 and 120 min. (Left to right).
Figure 6.
Kinetic models of P removal.: (a)log plots, HRT 30, 60 and 120 min. (Left to right). (b) data plots, HRT 30, 60 and 120 min. (Left to right).

Figure 7.
(a) FTIR (top). (b) XRD (center) and (c) TGA (bottom) analyses of precipitate samples.


Figure 8.
Molar ratios of main components: (a) pH = 8.5. (b) pH = 9.0; final precipitates’ composition: (c) pH = 8.5 and (d) pH = 9.0. Experiments 1–6.
Figure 8.
Molar ratios of main components: (a) pH = 8.5. (b) pH = 9.0; final precipitates’ composition: (c) pH = 8.5 and (d) pH = 9.0. Experiments 1–6.


Figure 9.
Experiments without chemical addition (only pH buffer reagents): (a) Molar ratios of main components. (b) final precipitates composition.
Figure 9.
Experiments without chemical addition (only pH buffer reagents): (a) Molar ratios of main components. (b) final precipitates composition.

Figure 10.
Composition of final precipitates with synthetic (left) and real (right) wastewater.


Table 1.
Average observed ionic composition of real mixed liquor.
| Ion | Concentration (mg/L) |
|---|---|
| Ca2+ | 101 |
| Mg2+ | 26.4 |
| P | 40.0 * |
| NH4+ | 32.6 |
* after anaerobic conditioning and P release from biomass.
Table 2.
Summary of experiments conducted.
| Run No. | pH | HRT (min) | pH Buffer | Chemical Addition (Mg, NH4) |
|---|---|---|---|---|
| 1 | 8.5 | 30 | NaOH | Yes |
| 2 | 9.0 | 30 | NaOH | Yes |
| 3 | 8.5 | 60 | NaOH | Yes |
| 4 | 9.0 | 60 | NaOH | Yes |
| 5 | 8.5 | 120 | NaOH | Yes |
| 6 | 9.0 | 120 | NaOH | Yes |
| 7 | 9.0 | 60 | NaOH | No |
| 8 | 8.5 | 60 | Ca(OH)2 | No |
| 9 | 9.0 | 60 | Ca(OH)2 | No |
Table 3.
PHREEQC calculated SI values for different P-containing solid phases.
| Struvite | ACP | DCP | DCPD | HAP | Calcite | Magnesite | Bobierrite | Newberyte | K-Struvite | Na-Struvite | |
|---|---|---|---|---|---|---|---|---|---|---|---|
| 8 | 0.26 | 1.79 | 0.36 | 0.08 | 13.66 | 0.79 | 0.89 | 1.58 | −12.75 | −1.83 | −1.37 |
| 8.25 | 0.46 | 2.21 | 0.32 | 0.04 | 14.53 | 0.99 | 1.08 | 2 | −12.78 | −1.62 | −1.16 |
| 8.5 | 0.61 | 2.57 | 0.25 | −0.03 | 15.32 | 1.16 | 1.25 | 2.37 | −12.85 | −1.44 | −0.98 |
| 8.75 | 0.72 | 2.87 | 0.15 | −0.13 | 16.02 | 1.27 | 1.37 | 2.66 | −12.95 | −1.29 | −0.83 |
| 9 | 0.77 | 3.09 | 0.01 | −0.27 | 16.61 | 1.3 | 1.4 | 2.89 | −13.09 | −1.17 | −0.71 |
| 9.25 | 0.75 | 3.27 | −0.16 | −0.44 | 17.12 | 1.18 | 1.26 | 3.05 | −13.26 | −1.09 | −0.63 |
| 9.5 | 0.66 | 3.4 | −0.35 | −0.63 | 17.58 | 0.19 | 0.27 | 3.16 | −13.46 | −1.04 | −0.58 |
Table 4.
Phosphorus removal rate constants.
| HRT (min) | pH | k (h−1) |
|---|---|---|
| 30 | 8.5 | 1.28 |
| 9.0 | 1.62 | |
| 60 | 8.5 | 1.63 |
| 9.0 | 5.23 | |
| 120 | 8.5 | 2.06 |
| 9.0 | 3.07 |
Table 5.
Composition of final precipitates in terms of ionic groups.
| Experiment | ||||||||||
|---|---|---|---|---|---|---|---|---|---|---|
| Unit | 1 | 2 | 3 | 4 | 5 | 6 | 7 | 8 | 9 | |
| K+ | g/kg | 0.61 | 0.21 | 0.33 | 0.26 | 0.59 | 0.49 | 0.33 | 0.32 | 0.25 |
| PO43− | g/kg | 443.06 | 453.79 | 518.18 | 400.13 | 512.05 | 420.06 | 456.86 | 481.39 | 367.94 |
| NH4+ | g/kg | 5.15 | 1.55 | 2.06 | 2.19 | 11.85 | 7.60 | 1.67 | 1.93 | 1.80 |
| H2O | g/kg | 292.69 | 271.29 | 272.94 | 278.94 | 293.61 | 300.31 | 231.71 | 199.91 | 215.37 |
| CO32− | g/kg | 56.46 | 41.47 | 33.47 | 49.96 | 33.97 | 45.97 | 50.96 | 52.46 | 77.94 |
| Mg2+ | g/kg | 58.00 | 36.40 | 55.00 | 51.00 | 62.00 | 55.00 | 26.00 | 17.00 | 12.00 |
| Ca2+ | g/kg | 175.00 | 202.00 | 199.00 | 155.00 | 180.00 | 155.00 | 216.00 | 256.00 | 213.00 |
| Total | g | 1030.96 | 1006.71 | 1080.99 | 937.49 | 1094.08 | 984.43 | 983.53 | 1009.01 | 888.30 |
| Error | % | 3.1+ | 0.7+ | 8.1+ | 6.3− | 9.4+ | 1.6− | 1.6− | 0.9+ | 11.2− |
Table 6.
Final precipitates comparison for real and synthetic wastewater operation.
| Unit | Synthetic ww | Real ww | |
|---|---|---|---|
| K+ | g/kg | 0.32 | 0.28 |
| PO43− | g/kg | 481.39 | 436.43 |
| NH4+ | g/kg | 1.93 | 1.36 |
| H2O | g/kg | 199.91 | 184.92 |
| CO32− | g/kg | 52.46 | 67.13 |
| Mg2+ | g/kg | 17.00 | 11.05 |
| Ca2+ | g/kg | 256.00 | 245.61 |
| Total | g | 1009.01 | 946.81 |
| Error | % | 0.9+ | 5.3− |
Publisher’s Note: MDPI stays neutral with regard to jurisdictional claims in published maps and institutional affiliations. |
© 2022 by the authors. Licensee MDPI, Basel, Switzerland. This article is an open access article distributed under the terms and conditions of the Creative Commons Attribution (CC BY) license (https://creativecommons.org/licenses/by/4.0/).
Share and Cite
MDPI and ACS Style
Daneshgar, S.; Cecconet, D.; Capsoni, D.; Capodaglio, A.G. Side-Stream Phosphorus Recovery in Activated Sludge Processes. Water 2022, 14, 1861. https://doi.org/10.3390/w14121861
AMA Style
Daneshgar S, Cecconet D, Capsoni D, Capodaglio AG. Side-Stream Phosphorus Recovery in Activated Sludge Processes. Water. 2022; 14(12):1861. https://doi.org/10.3390/w14121861
Chicago/Turabian StyleDaneshgar, Saba, Daniele Cecconet, Doretta Capsoni, and Andrea G. Capodaglio. 2022. "Side-Stream Phosphorus Recovery in Activated Sludge Processes" Water 14, no. 12: 1861. https://doi.org/10.3390/w14121861
Note that from the first issue of 2016, this journal uses article numbers instead of page numbers. See further details here.