
Turbidity and Estimated Phosphorus Retention in a Reconnected Lake Erie Coastal Wetland


1
Cooperative Institute for Great Lakes Research, The University of Michigan, 440 Church Street, Ann Arbor, MI 48109-1041, USA
2
Great Lakes Science Center, U.S. Geological Survey, 1451 Green Road, Ann Arbor, MI 48105-2807, USA
*
Author to whom correspondence should be addressed.
Water 2022, 14(12), 1853; https://doi.org/10.3390/w14121853
Submission received: 15 April 2022
/
Revised: 19 May 2022
/
Accepted: 6 June 2022
/
Published: 9 June 2022
(This article belongs to the Section Water Quality and Contamination)
Abstract
:Nearly all of the wetlands in the coastal zone of Lake Erie have been degraded or destroyed since the 1860s, and most of those that remain are separated from their watersheds by earthen dikes. Hydrologic isolation of these wetlands disrupts ecosystem benefits typical to Great Lakes coastal wetlands, particularly the ability to trap sediments and retain nutrients when inundated by runoff and lake water. High-frequency measurements of turbidity and discharge were taken in 2013 and 2014 to observe turbidity and water flow dynamics to estimate total phosphorus flux of a hydrologically reconnected diked wetland pool in the Crane Creek-Lake Erie wetland complex. Modeled estimates suggest the reconnected pool retained 8% of the total phosphorus loading in 2013 and 10% in 2014, which included short periods of phosphorus export to Lake Erie. Water flowing out of the wetland generally had lower turbidity than inflowing water, but flux in and out of the pool varied seasonally and was linked to changes in lake-levels, seiche dynamics, and weather conditions. More frequent storms, higher winds, and stronger seiches in the spring and fall created turbidity patterns that suggest more phosphorus retention than in summer or winter. Estimates suggest that phosphorus was released during the summer when higher lake levels and the absence of frequent storms, larger short-term seiche oscillations, and potentially soil oxygen availability were driving flux dynamics. This study demonstrated that reestablishing lake hydrology through reconnection of wetland pools can reduce loading and alter timing of delivery of total phosphorus to Lake Erie.
1. Introduction
Great Lakes coastal wetlands were historically an important linkage between uplands and open waters [1,2,3]. Once part of the extensive Great Black Swamp wetland system, more than 96% of the coastal wetlands of Western Lake Erie have been drained and filled since the 1860s to provide land for agriculture [1]. Most of the remaining coastal wetlands have been hydrologically isolated by earthen dikes and managed to provide habitat for migratory birds [4]. Benefits of wetlands, such as flood protection, providing reproductive fish habitat, and nutrient and sediment retention are disrupted due to hydrological isolation [4,5]. The small fraction of coastal wetlands that remain connected to tributaries are degraded due to increased sediment and nutrient loads, particularly phosphorus, from non-point source agricultural runoff through ditches, fragmentation by dikes, and invasive species [1,6,7].
Wetlands that remain connected to their watersheds in Western Lake Erie receive most tributary loading during storm runoff events [2,6] but are also subject to irregular inundation of lake water as water-levels change through time [8]. Wind-driven tide-like periods of water-level oscillation known as seiches are frequent on Lake Erie and are drivers of water and nutrient exchanges between Great Lakes and their coastal wetlands [2,6,9,10]. Herdendorf [1] notes that a seiche can raise or lower the lake level on the western shoreline of Lake Erie as much as 2 m in a day. Annual and seasonal Lake Erie water-level fluctuations, in addition to wind-driven seiches, create a system in a near constant state of water-level flux [9,11]. Overlapping mechanisms of surface runoff and constant irregular water-level fluctuations combined with its basin characteristics (shallow depth, East-West orientation) make Lake Erie coastal wetlands highly dynamic, complex systems.
Turbidity can be a concern for resource managers because it impacts habitat for plant and fish communities, and pollutants may be bound to particles causing turbid conditions. High turbidity limits light penetration, which can reduce photosynthesis at depth [12]. In the lower Great Lakes, submergent macrophyte community composition is often reduced in highly turbid conditions compared to higher-quality wetlands [13]. The light limitation from turbidity may alter fish predator prey interactions in addition to impacts on foraging and reproductive habitats [14]. Pollutants are often bound to fine particles that cause turbidity, and in some cases these may be toxic metals or nutrients that can enhance eutrophic conditions [15]. Total phosphorus, in particular, is generally positively correlated with turbidity [16,17], and the mobility of phosphorus from sediments can be influenced by the availability of oxygen [18,19,20].
Historically, excess point source phosphorus contributed to overproduction of phytoplankton in Lake Erie and degradation of water-quality conditions including anoxia, fish kills, and beaches fouled by decaying algal mats [21,22]. Phosphorus is often monitored in lakes because it often is the limiting nutrient for algal growth. Abatement programs starting in the 1970s successfully reduced phosphorus entering Lake Erie from point sources, such as industrial effluents and sewage treatment plants [23]. Non-point source phosphorus particularly in surface runoff, however, remains problematic [24], in part because it can be bound to sediments or stay in a form readily available to algae. Dissolved inorganic phosphorus, for example, is more readily utilized by primary producers whereas organic and particulate (sediment bound) forms are more refractory [15] and abundant in Great Lakes coastal wetlands [25]. The Great Lakes Restoration Initiative, the largest U.S. investment in the Great Lakes in two decades, included nutrient reductions to coastal waters of the Great Lakes as one of its focus areas [26,27,28]. In addition, provisions in the Great Lakes Water Quality Agreement, a bi-national commitment to restore the waters of the Great Lakes, include development of phosphorus reduction strategies and implementation programs to reduce phosphorus loadings from point and non-point sources [29]. The ability of coastal wetlands to reduce or delay phosphorus inputs to nearshore areas is of particular interest because of frequent harmful algal blooms in the western basin. In August 2014, an extensive Microcystis bloom in Maumee Bay contaminated the drinking water of >500,000 people [30], and the August 2015 bloom was the largest to date [31].
Restoration of natural hydrological regimes to coastal wetland habitats is important to improve water quality and restore environmental integrity of ecosystems in each of the Great Lakes basins [26]. Simulation models by Mitsch and Wang [32] indicated that restoring hydrologic connectivity to diked marshes in Lake Erie’s Sandusky Bay (Ohio) had the potential to reduce phosphorus loading from an upstream watershed. Similarly, Baustian et al. [17] demonstrated that a restored coastal wetland could locally reduce phosphorus loading rates to Lake Erie, thus both improving habitat for fish and wildlife and incrementally limiting source nutrients for harmful algal blooms.
Hydrologically reconnecting an isolated wetland to the Lake Erie watershed will reestablish lake-driven hydrology to the system, may affect nutrient cycling, and can potentially improve Great Lakes water quality by providing a means for taking advantage of the reconnected wetland’s ability to trap and process sediment-bound nutrients (e.g., some forms of phosphorus). To assess hydrologic restoration effects, this study examined turbidity and water movement dynamics in and out of a diked wetland pool that was hydrologically reconnected to the Crane Creek-Lake Erie coastal complex. Instrumentation was used to collect high frequency measurements of turbidity and discharge to evaluate changes associated with hydrologic reconnection and estimate flux of total phosphorus within the system. Turbidity and total phosphorus are typically highly correlated because both are associated with suspended particulates [16], a relationship that is well known for the study system [17]. The objectives of this study were to (1) determine how reestablishment of lake-driven hydrology influenced turbidity dynamics and (2) examine how turbidity can inform the potential for phosphorus retention in a hydrologically reconnected diked wetland pool.
2. Methods
2.1. Study Area
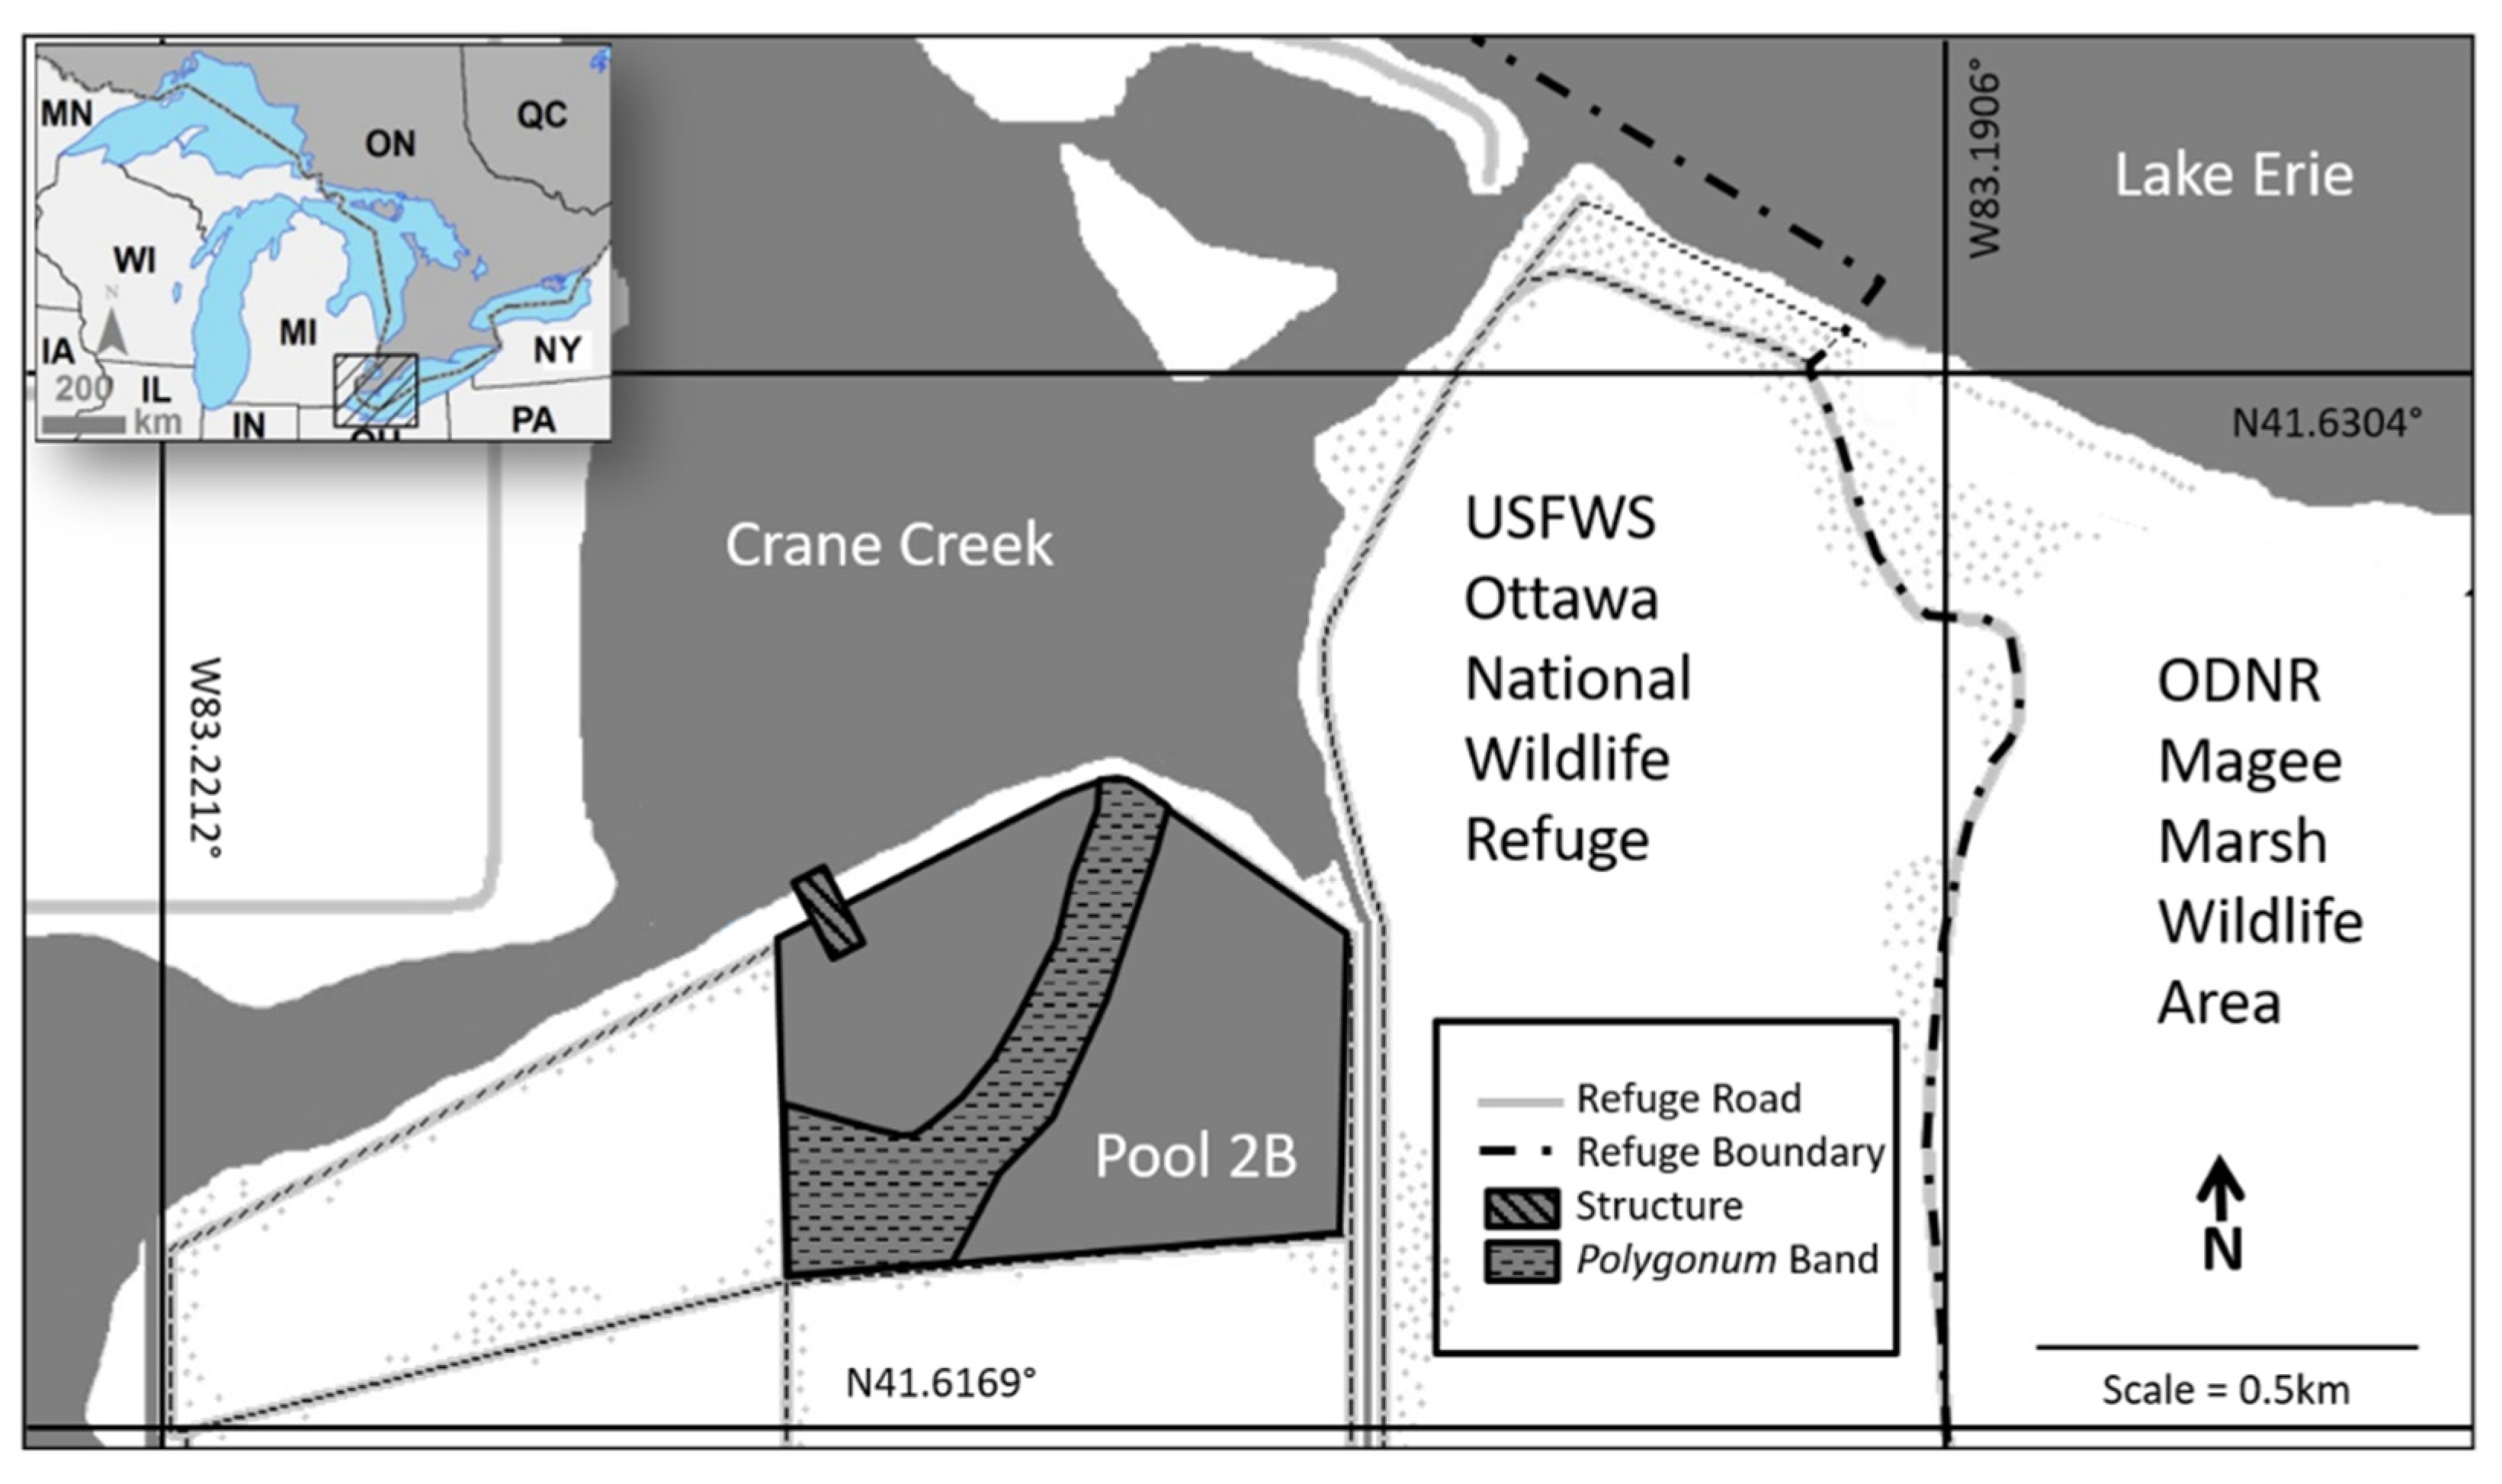
Crane Creek drains a 143 km2 watershed in northwest Ohio, forms a drowned-river mouth wetland complex in the U.S. Fish and Wildlife Service (USFWS) Ottawa National Wildlife Refuge (ONWR), and is a tributary to Lake Erie through a permanent channel (Figure 1). This wetland complex consists of a series of diked wetland pools that was hydrologically isolated from Lake Erie and historically managed for waterfowl and other migratory birds. A 0.41-km2 diked wetland pool (Pool 2B) adjacent to the drowned-river mouth section of Crane Creek was constructed in the 1940s using earthen dikes. Pumps and gravity flow were used to control water levels to achieve management objectives. The Pool 2B wetland was hydrologically reconnected to Crane Creek in March 2011 by construction of a water-control structure (referred to hereafter as the structure) consisting of two side-by-side, 1.2 m diameter culverts linking the pool to Crane Creek (Figure 1). The structure reestablished the surface-water connection between the wetland pool and the Crane Creek-Lake Erie complex to allow unrestricted flow of water in and out of the pool. The opening in the dike is about 1.5 km from Lake Erie and effectively opened the wetland pool to direct influence of water-level fluctuation of the Lake and waters from the Crane Creek-Lake Erie mixing zone. Within the pool a dense band of Polygonum amphibium L. (water smartweed) was present that restricted water movement into the southeast portion of the pool (Figure 1), and the pool did not have an internal dike system. As a result, approximately 10 ha of the pool actively exchanged water during seiche events and was used for retention calculations. USFWS managers left the gates on the structure open for the duration of the study.
2.2. Measurement of Turbidity and Discharge
Turbidity and water discharge (volume over time) were measured on the pool side of the structure channel to assess impacts of hydrological reconnection on turbidity and water movements between the reconnected Pool 2B wetland and Crane Creek. Turbidity is a measure of the amount of light scattered by particles present in water and was reported in NTU (nephelometric turbidity units). A YSI 6920 V2 multi-parameter sonde with a 6136 optical turbidity sensor (YSI Inc., Yellow Springs, OH, USA) was used to measure turbidity. Bi-directional discharge (in or out of the reconnected wetland, in m3/s) was measured using a Teledyne-RDI (Poway, CA, USA) vertical acoustic doppler current profiler (vADCP). Both instruments were installed in late September 2012 and recorded measurements at 15-min intervals. The instruments were serviced (i.e., batteries changed, calibrated, and cleaned) and data retrieved at roughly monthly intervals, except during the winter when instruments were under ice.
Turbidity dynamics can inform phosphorus behavior in response to the reconnection with lake-based hydrology. To facilitate high frequency estimates of total phosphorus (TP), we used a linear model (Equation (1)) developed for this site by Baustian et al. [17], that related in situ measurements of turbidity to total phosphorus concentration.
TP (mg/L) = 0.0009 × Turbidity + 0.0554 (p < 0.0001; r2 = 0.84)
The model was developed using over 60 samples analyzed for TP and paired with turbidity measurements in the same location where sensors were placed for this study [17]. To calculate estimates of TP flux (in kg) moving to or from the wetland, estimates of TP concentration (using turbidity measurements in the model above) were multiplied by discharge data from the vADCP and time (15 min) before being scaled to kilograms. Volume was calculated by multiplying discharge by time (15 min). Although soluble reactive and other forms of phosphorus are included in total phosphorus calculations, we did not estimate subcomponents of the total phosphorus load individually.
Measured and estimated parameters were grouped into four seasons that roughly correspond to seasonal trends of lake-level and wind speed typically experienced in the region. Spring included 4 March to 16 June, summer included 17 June to 7 September, fall included 8 September to 30 November, and winter included 1 January to 3 March and 1 December to 31 December (both within the same year). Outliers in discharge and turbidity measurements were identified using Tukey’s interquartile range method [33]. Small data gaps (<3 h) were filled using linear interpolation from neighboring values [34]. Data gaps in discharge from mid-June to mid-August 2014 occurred because the vADCP was removed from the structure for service. Larger gaps (approximately 2–4 weeks) in the data were due to intermittent sensor malfunction, programming issues, or battery failure. Total phosphorus flux estimates were made from a total of 44 weeks (15 weeks in spring, 12 weeks in summer, 8 weeks in fall and, 9 weeks in winter) in 2013 and 31 weeks (11 weeks in spring, 4 weeks in summer, 12 weeks in fall, and 4 weeks in winter) in 2014.
Discharge, turbidity, and estimated TP concentration were separated by flow direction and aggregated as weekly averages. Since estimates of mean weekly TP concentration are based on turbidity, the ratio of estimated TP in/TP out was used to present a clearer picture of how it differed with flow direction. Ratios greater than one indicate estimated TP concentrations were higher during flow into Pool 2B. Conversely, a ratio less than one indicates estimated concentrations of water flowing out were higher. Weekly flux of both water volume and estimated TP (kg) were calculated by subtracting the weekly quantities during inflow from outflow. Seasonal mean flux was calculated by averaging the weekly difference in mean flux over each season. Measured parameters (weekly volume, daily lake level range, mean daily wind speed, and total phosphorus (kg)) were analyzed using one-way ANOVA with multiple comparisons to identify differences between seasons. Annual lake levels for each year were compared using Kruskal–Wallis H-test. Turbidity, discharge, and estimated TP concentration were analyzed using a two-way ANOVA to identify how these parameters differ with flow direction within seasons. ANOVAs were used to analyze these data because of their robustness to normality violations [35].
2.3. System-Scale Conditions
Effects of seasonal lake-level change, seiche-driven lake-level fluctuations, and weather conditions on phosphorus retention/release in the wetland system were evaluated by examining wind speed and Lake Erie water-level data from the nearest lake-level station at Toledo, OH (Station: 9063085). Hourly water-surface elevation (International Great Lakes Datum of 1985; IGLD85) and wind speed data were downloaded from the National Oceanic and Atmospheric Administration (http://tidesandcurrents.noaa.gov, accessed on 1 December 2017) for from 1 January 2013 to 31 December 2014. Daily means for both wind speed and water-level were calculated from hourly values. Daily lake-level range was calculated as the difference between the maximum and minimum lake level for each day.
3. Results
3.1. Discharge, Turbidity, and Estimates of Total Phosphorus Concentrations
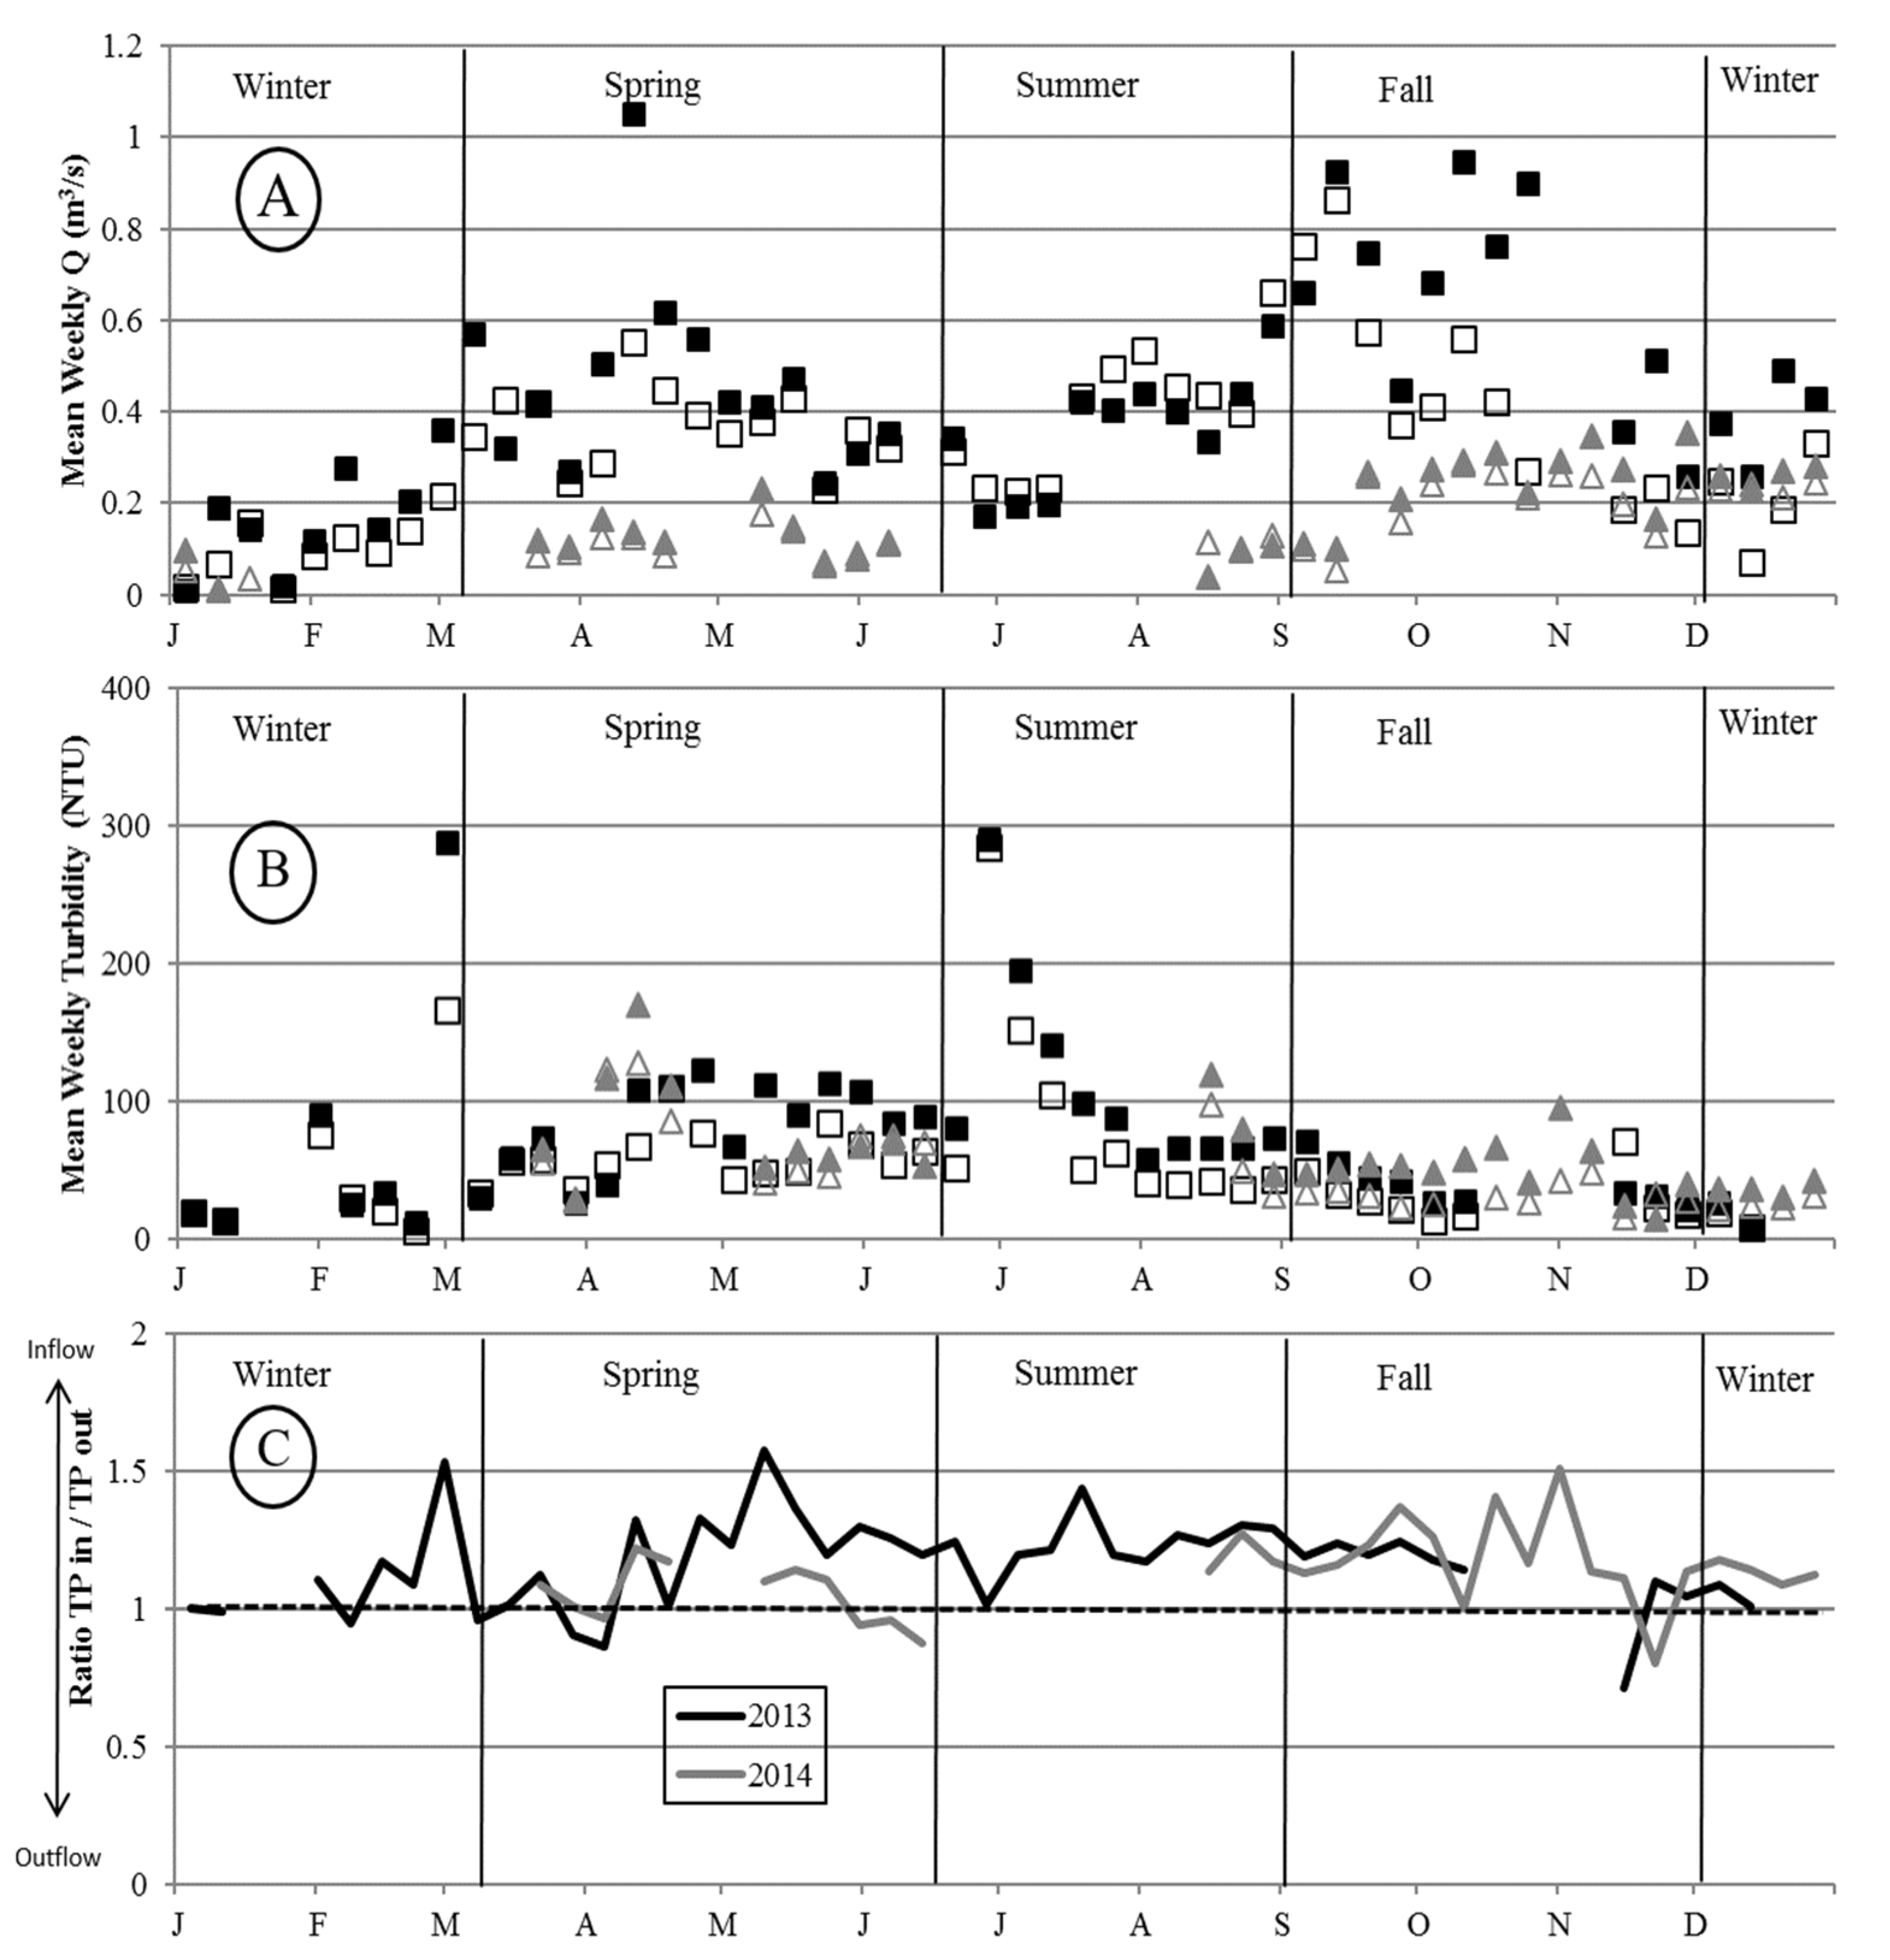
Discharge (Q, m3/s) was variable through time, particularly in the spring and fall, and generally higher (but not significantly) during inflow except during the summer in both years (Figure 2A). Discharge into the wetland was the same as discharge out of the wetland within each season in 2013 (two-way ANOVA, F(3,90) = 2.89, p = 0.039) and 2014 (two-way ANOVA, F(3,58) = 0.12, p = 0.95), except during fall 2013. Turbidity was generally high, variable, and ranged from 6 to 285 NTU. It varied seasonally, with higher turbidity in spring and summer than in fall and winter during both years (Figure 2B). However, higher turbidity did not appear to correspond with higher discharge (Figure 2). Mean weekly turbidity tended to be higher during inflow than outflow (Figure 2B) but did not differ significantly within each season (two-way ANOVA, 2013 F(3,80) = 0.13, p = 0.94; 2014 F(3,54) = 0.19, p = 0.89). Among seasons, turbidity was 18 to 32% lower during outflow than inflow in 2013 and 7 to 31% lower in 2014.
In most weeks, estimated TP concentration (mg/L) was higher during inflow (i.e., TP in/TP out was >1) when water from the watershed was pushing into the wetland than during outflow after it was stored in the wetland for a period of time (Figure 2C). Estimates of TP concentration were not significantly different within season in 2013 (twoway ANOVA, F(3,80) = 0.13, p = 0.94) or 2014 (two-way ANOVA, F(3,54) = 0.19, p = 0.90).
3.2. Water Volume and Estimated TP Flux
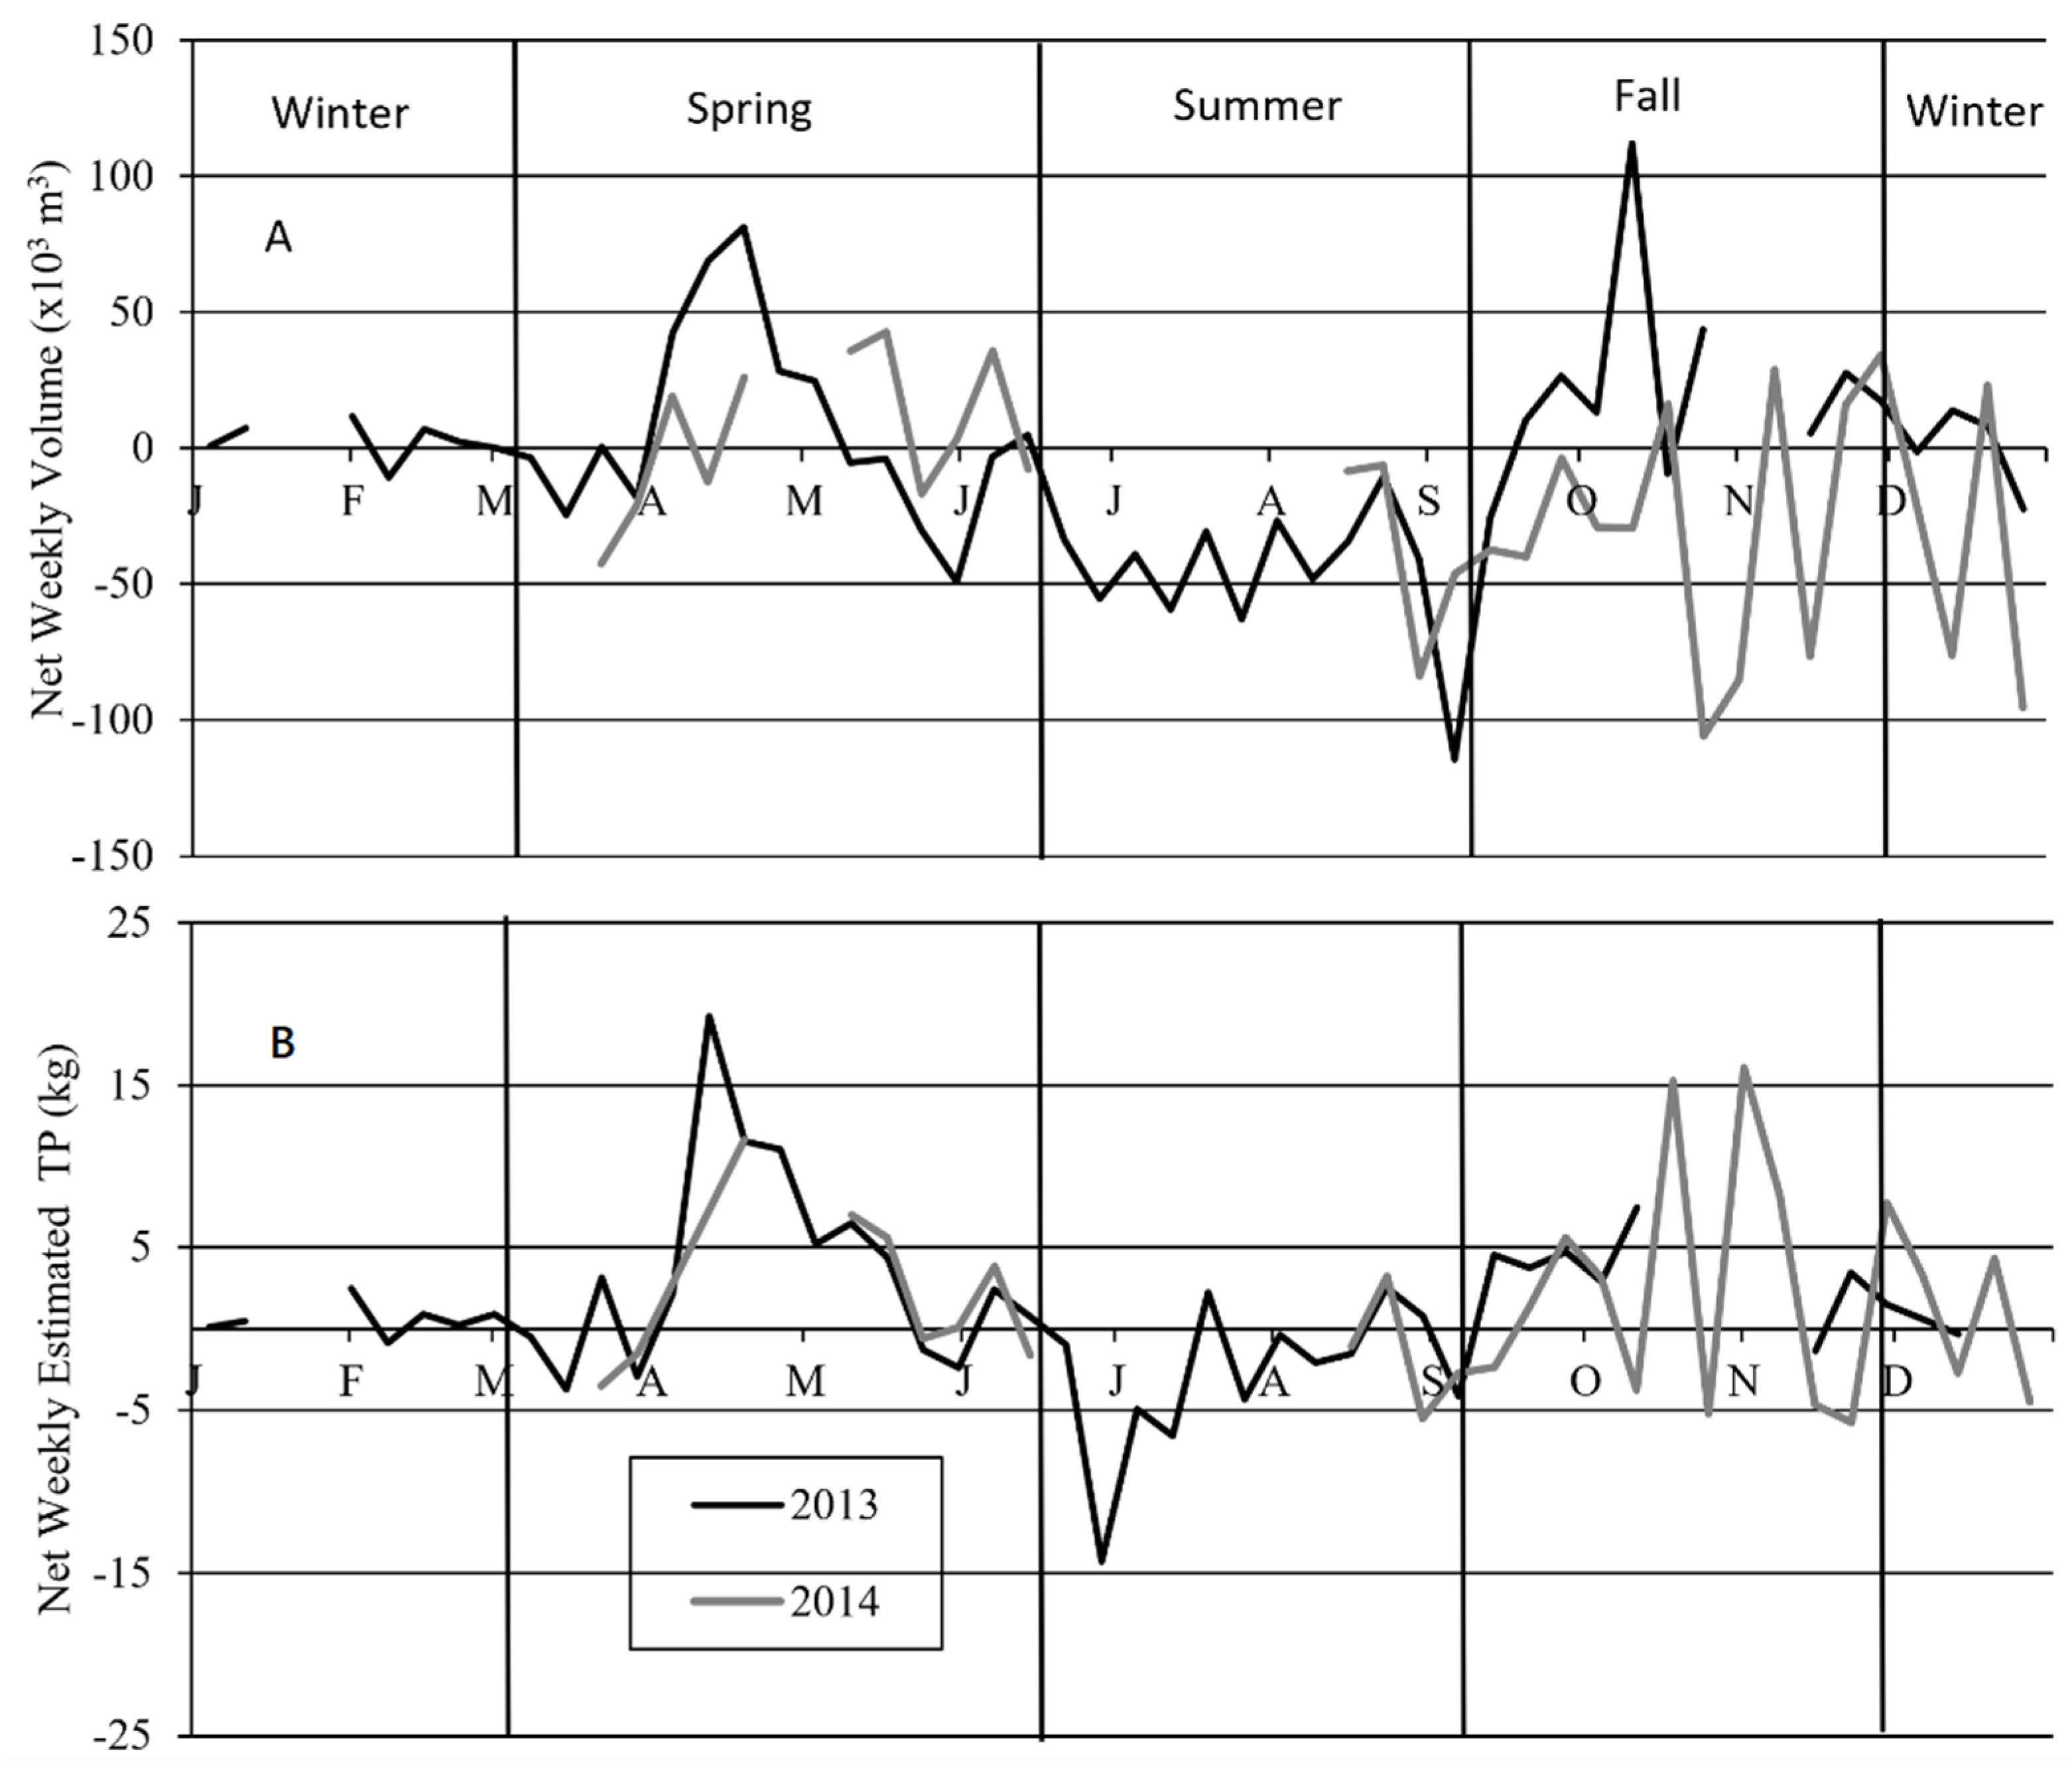
Net volume (103 m3) (the difference of the summed weekly volume during inflow and outflow) was variable through time and tended to differ seasonally (Figure 3A). In both years of this study, summer was the only season where, week to week, more water moved out of the reconnected pool than in (Figure 3A). Weekly mean volume in 2013 varied significantly between seasons (one-way ANOVA, F(3,34) = 13.50, p < 0.001), and summer was significantly lower than both spring and fall (Table 1). The more storm-prone spring and fall 2013 each had 7 weeks when more water flowed into the pool than out of the pool. Spring was the only period in 2014 where we observed net water flux into the pool. Water flux in fall of 2014 was highly variable, swinging between inflow and outflow for much of the phase (Figure 3A). However, spring and summer were not significantly different from each other. In 2014, weekly mean volume was not significantly different between seasons (one-way ANOVA, F(3,24) = 2.67, p = 0.09). Overall, the net annual water flux out of the pool was 204 × 103 m3 in 2013 and 531 × 103 m3 in 2014 (Table 1).
Overall, the turbidity-based estimates of TP suggest that more was retained than discharged in both 2013 and 2014 (Table 1). Further, more estimated TP was retained in the pool in 2014 (~61 kg) than in 2013 (~52 kg) during this study, even though fewer weeks were sampled in 2014 (31 weeks) than 2013 (44 weeks). Although variable among seasons, they all had weeks of net retention and net release (Figure 3B). Weekly average estimated TP (kg) flux in 2013 was not significantly different between spring and fall, but both were significantly higher than during the summer and winter was not different from any of the seasons (one-way ANOVA, F(3,32) = 6.20, p = 0.005) (Table 1). In 2013, 55 kg and 27 kg of TP were estimated to have been retained in the reconnected pool in spring and fall, respectively, while 34 kg were released from the pool in summer. Spring in 2013 retained the most estimated TP during the study period (55 kg) and was 20–30 kg greater than the other seasons that retained TP. In 2014, weekly mean estimated TP was not significantly different between seasons (one-way ANOVA, F(3,24) = 0.87, p = 0.43). Similar to 2013, estimated TP in 2014 was retained in spring (31 kg) and fall (36 kg) but was released during summer (6 kg).
3.3. System-Scale Conditions
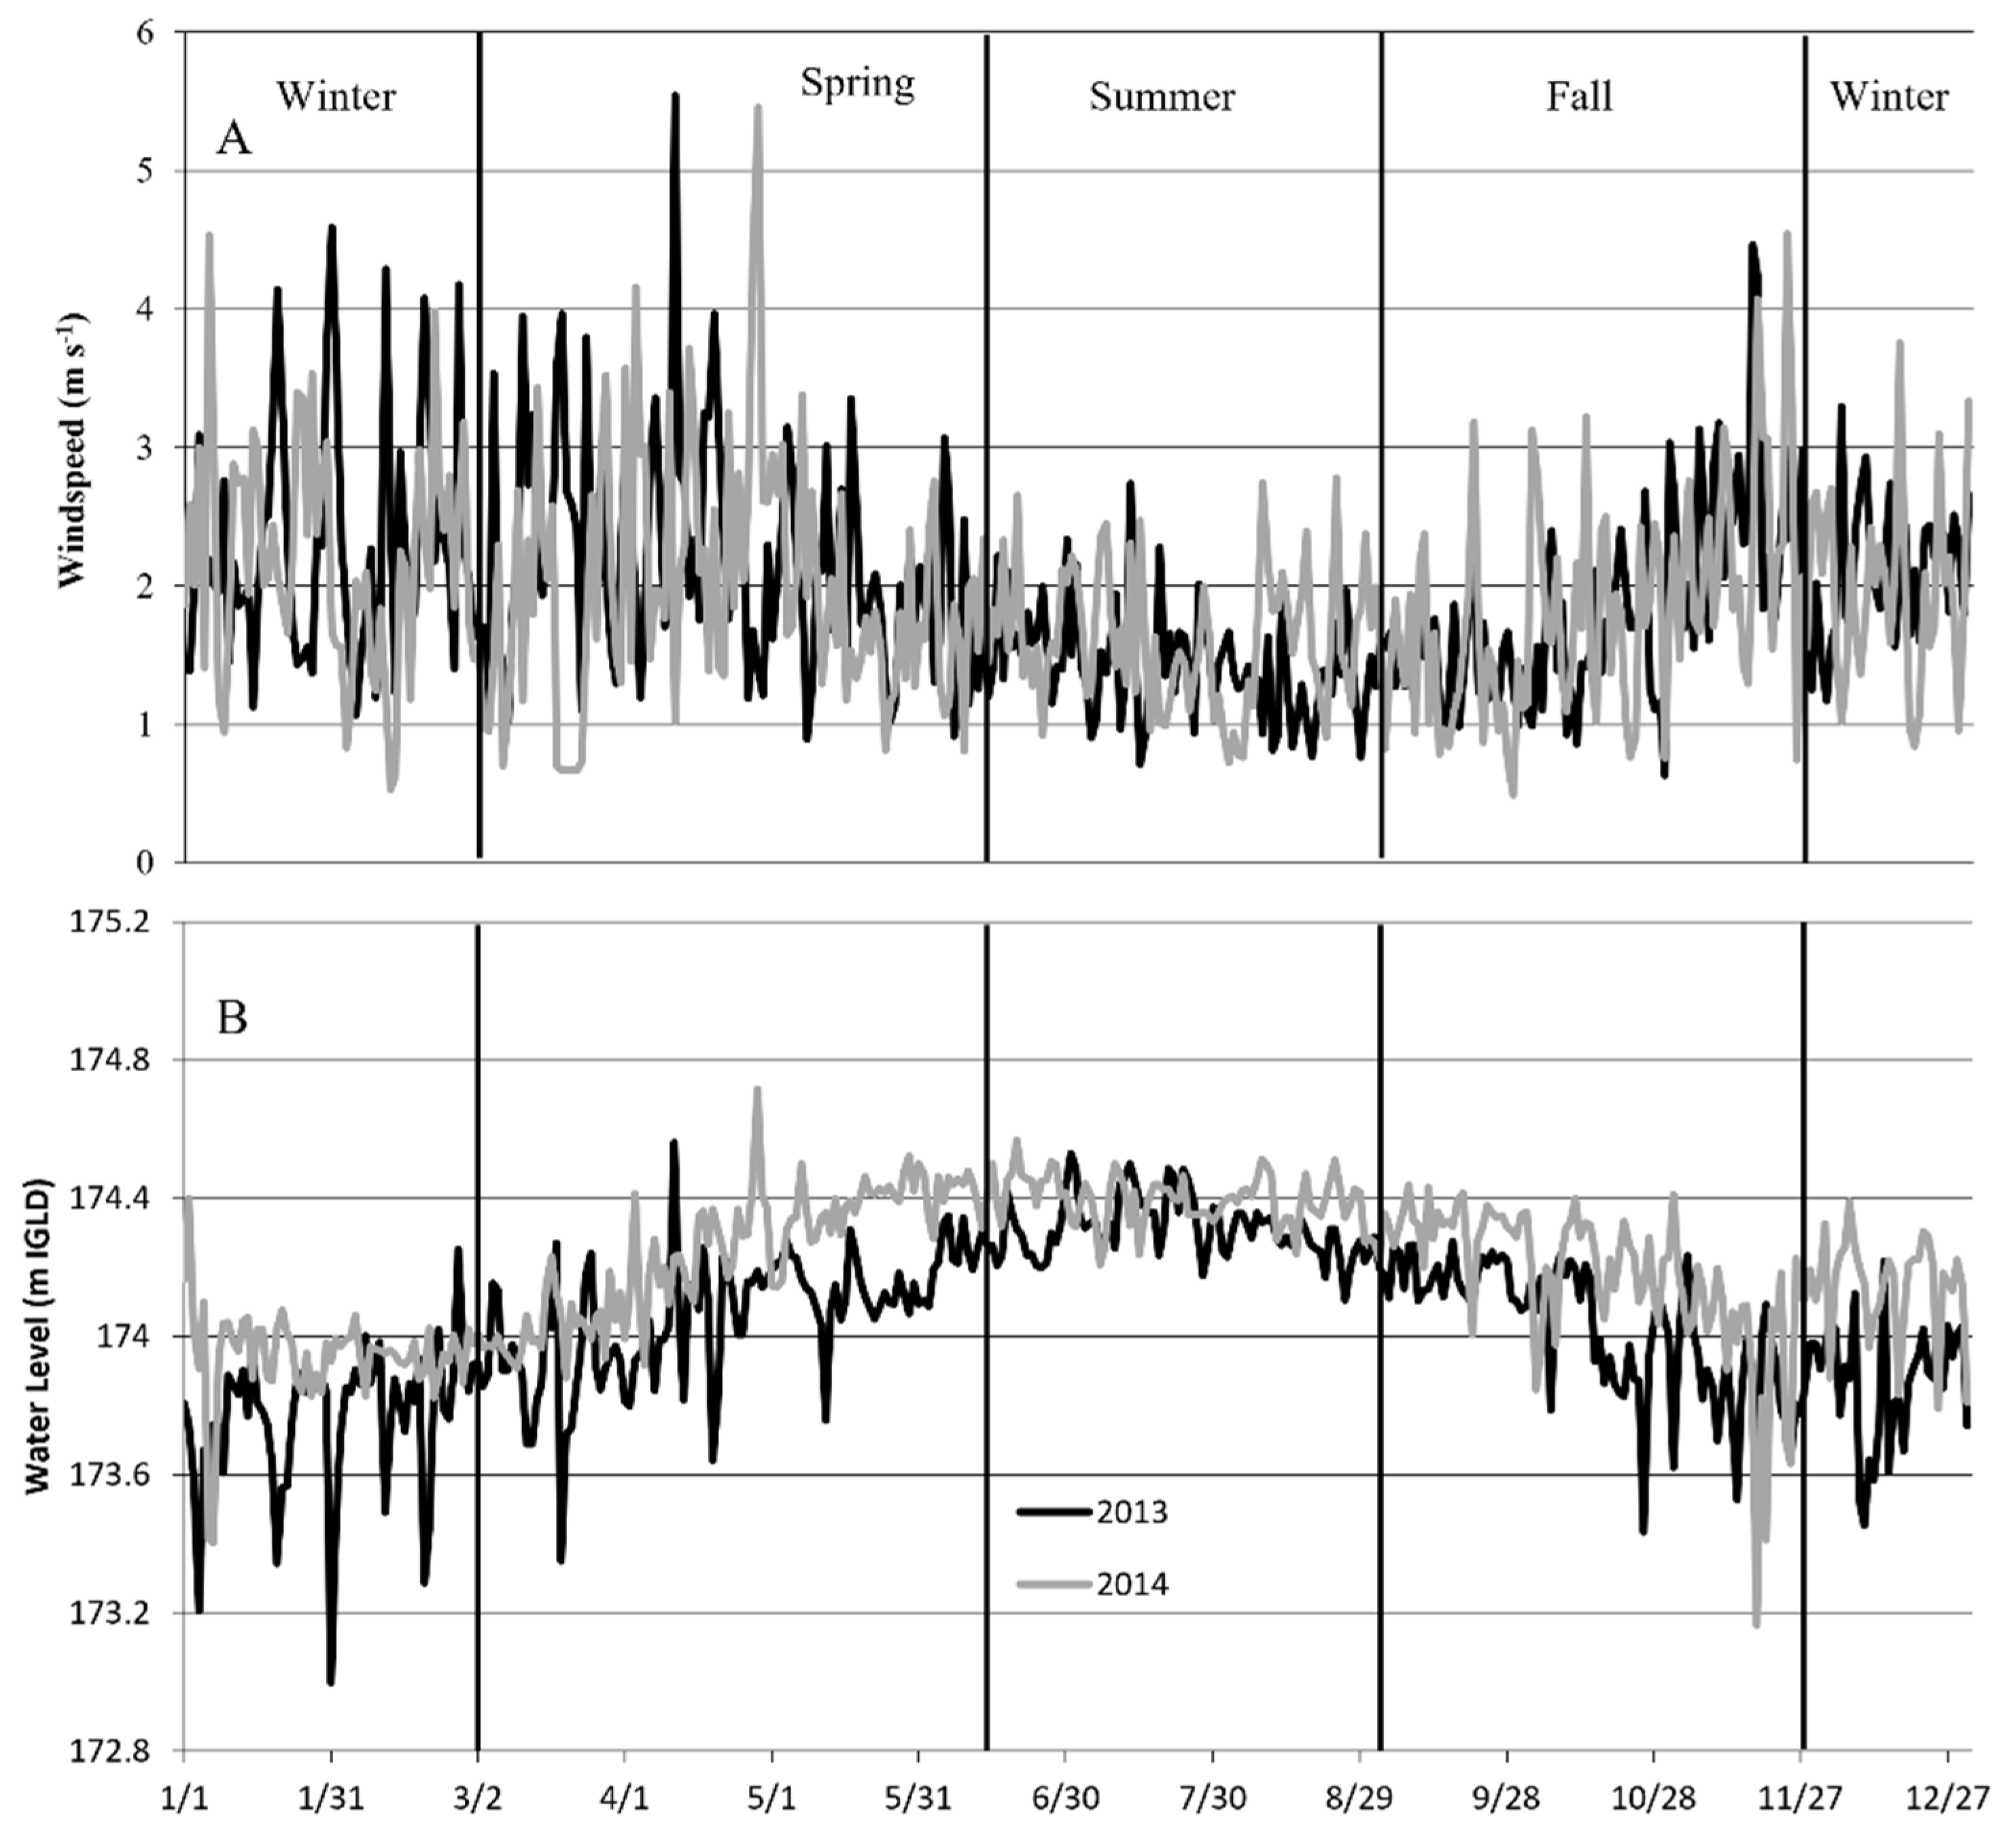
Collectively, wind speed and lake level indicate that spring and fall were seasons where seasonal lake-level changes and weekly lake-level range were larger and winds were stronger. Wind speed tended to be lowest in the summer in both years (Figure 4A). Weekly mean wind speed, in 2013 was significantly lower during summer compared to the other seasons (one-way ANOVA, F(3,51) = 12.86, p < 0.001), while in 2014, weekly wind speed was significantly lower than summer in the spring and winter only (one-way ANOVA, F(3,51) = 4.15, p < 0.01) (Table 2). Lake level and lake-level fluctuation (range) varied seasonally (Figure 4B) over the course of both years in this study and were typical for Lake Erie. Lake level was significantly higher in summer than both spring and fall in 2013 (Kruskal–Wallis H-test H(3) = 36.71, p < 0.001), but monthly lake levels increased quicker in 2014 before dropping significantly between summer and fall (Kruskal–Wallis H-test H(3) = 28.03, p < 0.001) (Table 2). Lake-level range in fall was only significantly greater than summer in 2013 (one-way ANOVA, F(3,51) = 5.72, p < 0.002) but in 2014, range in the fall season was significantly higher than spring (one-way ANOVA, F(3,51) = 2.85, p < 0.047) (Table 2).
4. Discussion
The restored coastal wetland at Crane Creek retained nearly 53 kg (8% of loading) of estimated total phosphorus in 2013 and 61 kg (10% of loading) in 2014. We estimate that small amounts of total phosphorus were exported during the summer when wind-driven seiche activity was limited, more water flowed out of the pool, and phosphorus was mobilized from anoxic wetland sediments. Conversely, pulses of highly turbid water entering the wetland were more frequent and of larger magnitude during the spring and fall months, which coincided with the maximum retention of total phosphorus. The patterns of TP retention/release in the wetland appeared as four seasonal periods that differed from one another in several ways, thus offering wetland managers more options when making management decisions for reconnected coastal wetlands.
Seasonal weather conditions can influence turbidity and nutrient flux to and from Great Lakes coastal wetlands [9]. In our study, discharge influenced by seiche-driven lake-level fluctuation was the most influential driver in how turbidity and sediment-bound nutrients (particularly phosphorus) moved between Crane Creek and the reconnected Pool 2B wetland and ultimately determined when the system might retain or release phosphorus. Winds in this region are predominantly south westerly [1], and stronger winds tend to induce a larger set-up of a seiche as surface water is pushed to the windward side of the Lake. As winds slacken, the water rebounds, raising lake levels on the opposite shore and forcing lake water into tributaries and connected wetlands [6]. Typically, the spring and fall in western Lake Erie are times where winds are higher (Figure 4A) and lead to larger seiches [36] than in the summer when winds tend to be less intense. Larger magnitude seiches mean a greater volume of water intruding from Lake Erie or from backed up tributaries draining agricultural watersheds can be driven into protected coastal wetlands. Although the residence time of the water often is less than a few days, the lower energy wetlands allow suspended sediments to settle out. The seiche-driven water interacts with wetland plants and sediments before flowing back into the main basin of the lake, often with lower turbidity than the source water [17]. Conversely, smaller magnitude seiches observed in the calm summer months occurred during the high-water summer months before the lake-wide water levels are starting to decline to their seasonal low in winter (Figure 4B). During this period, there was an overall greater volume of water in the reconnected wetland, and we measured more water leaving the wetland than entering. Turbidity was still lower leaving the wetland in the summer, but the overall greater volume of water flowing out of the wetland resulted in periodic export of estimated total phosphorus out of the wetland (Table 1, Figure 2). Our data suggest that lake-level changes rather than short-term fluctuations due to seiches appear to drive total phosphorus flux dynamics when larger magnitude seiches are absent [9,17].
In addition to water-level fluctuations, the wetland type and level of connectivity can influence nutrient flux dynamics. Our study site at the Ottawa National Wildlife Refuge was reconnected to Crane Creek and Lake Erie through a single water-control structure, which means that it operates more like an embayment wetland as water pulses in and out. This study estimated that total phosphorus retention per hectare in the reconnected Pool 2B wetland (~5 kg/ha) was much lower than estimates made at other wetlands on Lake Erie. Old Woman Creek (OWC, east of Huron, Ohio), was estimated to retain ~28 kg/ha in 1989–1990 [37]. Unlike the reconnected diked wetland in Crane Creek, OWC is a relatively unmodified flow through wetland that intercepts nearly all of the water from upstream [37]. Nutrient-rich water coming from the watershed has the opportunity to flow through wetland and low-energy backwater areas that allow sediment to settle out of the water before it reaches Lake Erie [2]. Generally, at low flow periods in the summer, the water has a much longer residence time in the system when the mouth of the creek is blocked by a barrier beach, [6,37]. Although all of the water flowing down Old Woman Creek has the opportunity to interact with the coastal wetland, embayment wetlands such as the reconnected Pool 2B only interact with the portion of the parent water body that pulses in and out of the wetland through time [7]. That pulsing can both limit the proportion of the wetland that can retain suspended sediments and dissolved nutrients and shorten the residence time in the wetland, thus limiting the retention of TP per hectare of wetland.
The results of this study characterized turbidity dynamics and produced estimates of how a reconnected coastal wetland retained and exported total phosphorus over a two-year period, but it also revealed a number of opportunities for additional research. Recent water levels in the Great Lakes have hit near record highs. The annual water levels for Lake Erie during this study were near the long-term mean, so additional study when lake levels are extremely high or low will help characterize the full range of TP flux dynamics in the wetland. We would expect more retention if storm events increase the frequency of large seiche events, but additional study is needed to characterize the impacts of changes to loading from storm-driven watershed runoff events and explore long-term nutrient saturation levels. Further examination of water mixing within the wetland could inform how much of the wetland is actively contributing to sediment retention and how increasing flow within and flow through the wetland can impact nutrient retention patterns. Given the relatively short duration of this study and the variability of seiche activity, longer term study of this and comparable systems would provide further insight into how phosphorus retention might change through time. This study did not measure conditions during extreme high or low lake levels, storms with especially strong seiche set-up, sustained heavy rains, or large-scale harmful algal blooms. These events could alter the patterns that we observed. Lastly, this study did not account for the different fractions of phosphorus, particularly soluble reactive phosphorus that can be remobilized from sediments during hypoxic conditions [18,19,20], therefore additional studies are needed to understand those dynamics.
5. Conclusions
This study demonstrated that hydrological reconnection of a diked wetland pool to increase coastal wetland habitat has potential to reduce turbidity, and by extension total phosphorus loading to Lake Erie and change when that phosphorus is delivered to the lake. Further, this study illustrated the importance of seiche activity in driving turbidity patterns and nutrient flux in and out of a reconnected wetland. Installation of water-control structures through dikes can restore ecosystem services to once hydrologically isolated wetlands, including opening additional spawning habitat for fish [4] and restoring lake hydrology to the system to benefit plant assemblages [38]. Reconnecting additional wetland pools to lake-driven hydrology could further reduce phosphorus inputs to Lake Erie by increasing the amount of turbid nutrient-rich water that can enter these areas, creating a low-energy environment for sediments to settle out, and stimulating nutrient retention. Hydrologic reconnection can also change the timing of delivery of phosphorus to the lake by diverting larger pulses associated with spring runoff and fall rainstorms. Rather than being deposited directly into the lake, nutrients mobilized by spring floods are retained by the wetland before a portion is remobilized during the summer.
Author Contributions
Conceptualization, K.P.K.; data curation, G.S.C., M.R.E., K.P.K.; formal analysis, G.S.C., M.R.E., K.P.K.; funding acquisition, K.P.K.; investigation, G.S.C., K.P.K., M.R.E.; methodology, K.P.K., M.R.E., G.S.C.; project administration, K.P.K.; supervision, K.P.K., M.R.E.; visualization, G.S.C., K.P.K., M.R.E.; writing—original draft, G.S.C., M.R.E., K.P.K.; writing—review and editing, K.P.K., G.S.C., M.R.E. All authors have read and agreed to the published version of the manuscript.
Funding
Financial support from the U.S. Geological Survey and the Great Lakes Restoration Initiative allowed the research team to complete this project.
Institutional Review Board Statement
Not applicable.
Informed Consent Statement
Not applicable.
Data Availability Statement
Carter, G.S., Kowalski, K.P., and Eggleston, M.R., 2019, Total phosphorus and water flux at a restored hydrologic connection at Ottawa National Wildlife Refuge in 2013 and 2014: U.S. Geological Survey data release, https://doi.org/10.5066/F71V5C3B (accessed on 11 October 2019).
Acknowledgments
We thank USFWS ONWR manager Jason Lewis for permission to access refuge property during this project and staff for assistance with field data collection. We appreciated the help of USGS staff and numerous technicians, including Joe Baustian, Alex Czayka, and Sean Green who assisted with installation and maintenance of instrumentation. Any use of trade, product, or firm names is for descriptive purposes only and does not imply endorsement by the U. S. Government.
Conflicts of Interest
The authors declare no conflict of interest.
References
- Herdendorf, C.E. The Ecology of Lake Erie Coastal Marshes: A Community Profile; Biological Report; US Fish & Wildlife Service: Washington, DC, USA, 1987; p. 85. [Google Scholar]
- Heath, R.T. Nutrient Dynamics in Great Lakes Coastal Wetlands: Future Directions. J. Great Lakes Res. 1992, 18, 590–602. [Google Scholar] [CrossRef]
- Keough, J.R.; Thompson, T.A.; Guntenspergen, G.R.; Wilcox, D.A. Hydrogeomorphic factors and ecosystem responses in coastal wetlands of the Great Lakes. Wetlands 1999, 19, 821–834. [Google Scholar] [CrossRef]
- Thacher, T.D.; Pludowski, P.; Shaw, N.J.; Mughal, M.Z.; Munns, C.F.; Högler, W. Nutritional rickets in immigrant and refugee children. Public Health Rev. 2016, 37, 3. [Google Scholar] [CrossRef] [PubMed] [Green Version]
- Sierszen, M.E.; Morrice, J.A.; Trebitz, A.S.; Hoffman, J.C. A review of selected ecosystem services provided by coastal wetlands of the Laurentian Great Lakes. Aquat. Ecosyst. Health Manag. 2012, 15, 92–106. [Google Scholar] [CrossRef]
- Mitsch, W.J.; Reeder, B.C. Nutrient and hydrologic budgets of a great lakes coastal freshwater wetland during a drought year. Wetl. Ecol. Manag. 1992, 1, 211–222. [Google Scholar] [CrossRef]
- Campbell, L.W.; Gavin, C. The Marshes of Southwestern Lake Erie; Ohio University Press: Athens, OH, USA, 1995. [Google Scholar]
- Bouchard, V. Export of Organic Matter from a Coastal Freshwater Wetland to Lake Erie: An Extension of the Outwelling Hypothesis. Aquat. Ecol. 2006, 41, 1–7. [Google Scholar] [CrossRef]
- Bedford, K.W. The Physical Effects of the Great Lakes on Tributaries and Wetlands. J. Great Lakes Res. 1992, 18, 571–589. [Google Scholar] [CrossRef]
- Trebitz, A.S. Characterizing Seiche and Tide-driven Daily Water Level Fluctuations Affecting Coastal Ecosystems of the Great Lakes. J. Great Lakes Res. 2006, 32, 102–116. [Google Scholar] [CrossRef]
- Morrice, J.A.; Trebitz, A.S.; Kelly, J.R.; Sierszen, M.E.; Cotter, A.M.; Hollenhorst, T. Determining Sources of Water to Great Lakes Coastal Wetlands: A Classification Approach. Wetlands 2011, 31, 1199–1213. [Google Scholar] [CrossRef]
- Grobbelaar, J.U. Turbidity. In Encyclopedia of Inland Waters; Likens, G., Ed.; Academic Press: Oxford, UK, 2009; pp. 699–704. [Google Scholar]
- Lougheed, V.L.; Crosbie, B.; Chow-Fraser, P. Primary determinants of macrophyte community structure in 62 marshes across the Great Lakes basin: Latitude, land use, and water quality effects. Can. J. Fish. Aquat. Sci. 2001, 58, 1603–1612. [Google Scholar] [CrossRef]
- Trebitz, A.S.; Brazner, J.C.; Cotter, A.M.; Knuth, M.L.; Morrice, J.A.; Peterson, G.S.; Sierszen, M.E.; Thompson, J.A.; Kelly, J.R. Water Quality in Great Lakes Coastal Wetlands: Basin-wide Patterns and Responses to an Anthropogenic Disturbance Gradient. J. Great Lakes Res. 2007, 33, 67–85. [Google Scholar] [CrossRef]
- Reddy, K.; Kadlec, R.H.; Flaig, E.; Gale, P.M. Phosphorus Retention in Streams and Wetlands: A Review. Crit. Rev. Environ. Sci. Technol. 1999, 29, 83–146. [Google Scholar] [CrossRef]
- Jones, A.S.; Stevens, D.K.; Horsburgh, J.S.; Mesner, N.O. Surrogate Measures for Providing High Frequency Estimates of Total Suspended Solids and Total Phosphorus Concentrations1. JAWRA J. Am. Water Resour. Assoc. 2010, 47, 239–253. [Google Scholar] [CrossRef] [Green Version]
- Baustian, J.J.; Kowalski, K.P.; Czayka, A. Using Turbidity Measurements to Estimate Total Phosphorus and Sediment Flux in a Great Lakes Coastal Wetland. Wetlands 2018, 38, 1059–1065. [Google Scholar] [CrossRef]
- Moore, P.A.; Reddy, K.R.; Graetz, D.A. Water quality-nutrient transformations in sediments as influenced by oxygen supply. J. Environ. Qual. 1992, 21, 387–393. [Google Scholar] [CrossRef]
- Osaka, K.; Yokoyama, R.; Ishibashi, T.; Goto, N. Effect of dissolved oxygen on nitrogen and phosphorus fluxes from lake sediments and their thresholds based on incubation using a simple and stable dissolved oxygen control method. Limnol. Oceanogr. Methods 2021, 20, 1–14. [Google Scholar] [CrossRef]
- Liikanen, A.; Murtoniemi, T.; Tanskanen, H.; Väisänen, T.; Martikainen, P.J. Effects of temperature and oxygenavailability on greenhouse gas and nutrient dynamics in sediment of a eutrophic mid-boreal lake. Biogeochemistry 2002, 59, 269–286. [Google Scholar] [CrossRef]
- Snodgrass, W.J. Analysis of Models and Measurements for Sediment Oxygen Demand in Lake Erie. J. Great Lakes Res. 1987, 13, 738–756. [Google Scholar] [CrossRef]
- Dolan, D.M.; McGunagle, K.P. Lake Erie Total Phosphorus Loading Analysis and Update: 1996–2002. J. Great Lakes Res. 2005, 31, 11–22. [Google Scholar] [CrossRef]
- Matisoff, G.; Ciborowski, J.J. Lake Erie Trophic Status Collaborative Study. J. Great Lakes Res. 2005, 31, 1–10. [Google Scholar] [CrossRef]
- Chapra, S.C.; Dolan, D.M. Great Lakes total phosphorus revisited: 2. Mass balance modeling. J. Great Lakes Res. 2012, 38, 741–754. [Google Scholar] [CrossRef]
- Chow-Fraser, P. Seasonal, Interannual, and Spatial Variability in the Concentrations of Total Suspended Solids in a Degraded Coastal Wetland of Lake Ontario. J. Great Lakes Res. 1999, 25, 799–813. [Google Scholar] [CrossRef]
- Great Lakes Restoration Initiative, Great Lakes Restoration Initiative Action Plan I. 2010. Available online: https://www.glri.us/sites/default/files/glri_actionplan.pdf (accessed on 12 April 2022).
- Great Lakes Restoration Initiative, Great Lakes Restoration Initiative Action Plan II. 2014. Available online: https://www.glri.us/sites/default/files/glri-action-plan-2.pdf (accessed on 12 April 2022).
- Great Lakes Restoration Initiative, Great Lakes Restoration Initiative Action Plan III. 2019. Available online: https://www.epa.gov/sites/production/files/2019-10/documents/glri-action-plan-3-201910-30pp.pdf (accessed on 12 April 2022).
- Great Lakes Water Quality Agreement. 2012. Available online: https://www.epa.gov/glwqa (accessed on 12 April 2022).
- Arenschield, L. Toledo bearing full brunt of Lake Erie algae bloom, in The Columbus Dispatch. 2014. Available online: https://web.archive.org/web/20220412173601/https://www.dispatch.com/story/news/environment/2014/08/04/toledo-bearing-full-brunt-lake/23922451007/ (accessed on 12 April 2022).
- Stumpf, R.; Wynne, T. Experimental Lake Erie Bloom Bulletin. Bulletin 27; 2015. Available online: https://www.nodc.noaa.gov/archive/arc0189/0242277/1.1/data/0-data/2015/bulletin/bulletin_2015-027.pdf (accessed on 23 October 2020).
- Mitsch, W.J.; Wang, N. Large-scale coastal wetland restoration on the Laurentian Great Lakes: Determining the potential for water quality improvement. Ecol. Eng. 2000, 15, 267–282. [Google Scholar] [CrossRef]
- Tukey, J. Exploratory Data Analysis; Addison-Wesley: Boston, MA, USA, 1977. [Google Scholar]
- Morgan-King, T.L.; Schoellhamer, D.H. Suspended-Sediment Flux and Retention in a Backwater Tidal Slough Complex near the Landward Boundary of an Estuary. Estuaries Coasts 2012, 36, 300–318. [Google Scholar] [CrossRef]
- Miller, R.G.J. Beyond ANOVA, Basics of Applied Statistics; John Wiley & Sons: New York, NY, USA, 1986. [Google Scholar]
- Irish, S.M.; Platzman, G.W. An investigation of the meteorological conditions associated with extreme wind tides on lake erie. Mon. Weather rev. 1962, 90, 39–47. [Google Scholar] [CrossRef] [Green Version]
- Krieger, K.A. Effectiveness of a coastal wetland in reducing pollution of a Laurentian Great Lake: Hydrology, sediment, and nutrients. Wetlands 2003, 23, 778–791. [Google Scholar] [CrossRef]
- Wilcox, D.A.; Whillans, T.H. Techniques for restoration of disturbed coastal wetlands of the Great Lakes. Wetlands 1999, 19, 835–857. [Google Scholar] [CrossRef]
Figure 1.
Map of the drowned-river mouth area of Crane Creek at Lake Erie, Pool 2B wetland (reconnected area, outlined in black) and water-control structure. Inset indicates location of study area near Lake Erie. Adapted from a map by U.S. Fish and Wildlife Service.
Figure 1.
Map of the drowned-river mouth area of Crane Creek at Lake Erie, Pool 2B wetland (reconnected area, outlined in black) and water-control structure. Inset indicates location of study area near Lake Erie. Adapted from a map by U.S. Fish and Wildlife Service.

Figure 2.
(A) Mean weekly discharge (Q, m3/s), (B) mean weekly turbidity (NTU), and (C) ratio (in/out) of mean weekly estimated total phosphorus (TP) concentration (mg/L), in □2013 and △2014 for outflow from the wetland to the creek; and ■2013 and ▲2014 inflow from the creek; at the water-control structure between Crane Creek and Pool 2B, on the Ottawa National Wildlife Refuge, Oak Harbor, OH. See text for date ranges of seasons. Ratios greater than one indicate rates were higher during flow into the pool. Ratios less than one indicate rates were higher during out flow.

Figure 3.
Net flux (difference between inflow and outflow) for (A) water volume (×1000 m3) and (B) weekly estimated total phosphorus (TP) (kg) between the Pool 2B wetland and Crane Creek for 2013 and 2014 at the Ottawa Wildlife Refuge, Oak Harbor, OH. Positive values indicate flux into the pool, and negative values flux out of the pool.

Figure 4.
Lake Erie mean daily (A) wind speed (m/s) and (B) water level (m above IGLD85) at Toledo, OH. See text for date ranges of seasons. Lake-level data were downloaded from http://tidesandcurrents.noaa.gov/ (Station no. 9063085) accessed 1 December 2017.
Figure 4.
Lake Erie mean daily (A) wind speed (m/s) and (B) water level (m above IGLD85) at Toledo, OH. See text for date ranges of seasons. Lake-level data were downloaded from http://tidesandcurrents.noaa.gov/ (Station no. 9063085) accessed 1 December 2017.


Table 1.
Number of weeks sampled (n), Net (difference between inflow and outflow), weekly seasonal mean, and standard error of the mean (SE) for estimated total phosphorus (TP, kg) and water volume (×103 m3) fluxes, for the four seasons (see text for description) at the Pool 2B wetland, Ottawa NWR, Oak Harbor, OH. Positive values indicate flux into the pool and negative values indicate flux out. See text for date ranges of seasons. Superscripts indicate which seasons are significantly different from each other (sp is spring, su is summer, f is fall, and w is winter), within a year one-way ANOVA (p-value < 0.05). There were no differences between seasons in 2014 for estimated TP or volume.
| Estimated TP (kg) | Volume (103 m3) | ||||||||
|---|---|---|---|---|---|---|---|---|---|
| Year | Season | N | Net | Mean | SE | N | Net | Mean | SE |
| 2013 | Spring | 15 | 54.67 | 3.69 su | 1.49 | 14 | 108.62 | 7.56 su | 8.97 |
| Summer | 12 | −33.89 | −2.82 sp,f | 1.27 | 12 | −555.69 | −46.23 sp,f,w | 7.13 | |
| Fall | 8 | 26.85 | 3.36 su | 0.85 | 10 | 221.27 | 22.06 su | 11.18 | |
| Winter | 9 | 4.49 | 0.45 | 0.33 | 13 | −7.7 | 1.54 su | 3.27 | |
| Total | 44 | 52.11 | 1.2 | 1.29 | 49 | −233.49 | −4.25 | 13.45 | |
| 2014 | Spring | 11 | 31.02 | 2.82 | 1.35 | 11 | 62.77 | 4.83 | 6.82 |
| Summer | 4 | −6.05 | −1.53 | 1.59 | 4 | −145.67 | −11.91 | 7.17 | |
| Fall | 12 | 35.69 | 2.97 | 2.13 | 12 | −308.43 | −25.89 | 12.76 | |
| Winter | 4 | 0.42 | 0.11 | 1.89 | 7 | −140.81 | −20.12 | 16.95 | |
| Total | 31 | 61.08 | 1.97 | 1.68 | 34 | −532.14 | −15.64 | 14.52 | |
Table 2.
Number of weeks sampled (n), mean weekly wind speed (m/s), median weekly Lake Erie water level, mean lake level range (m, above IGLD85) at Toledo OH., for the four seasons from 2013 and 2014. Superscripts indicate which seasons are significantly different from each other (sp is spring, su is summer, f is fall, and w is winter), within a year, one-way ANOVA (p-value < 0.05) for range and wind speed and Kruskal–Wallis H-test (p-value < 0.05) for median level. See text for date ranges of seasons. Data for wind speed and lake level were downloaded from http://tidesandcurrents.noaa.gov/ (Station no. 9063085) accessed 1 December 2017.
| Median Level (m) | Mean Level Range (m) | Mean Wind Speed (m/s) | |||||||
|---|---|---|---|---|---|---|---|---|---|
| Year | Season | N | Stat | N | Stat | SE | N | Stat | SE |
| 2013 | Spring | 16 | 174.01 su,w | 16 | 0.34 | 0.03 | 16 | 4.24 su | 0.2 |
| Summer | 12 | 174.32 sp,f,w | 12 | 0.26 w | 0.01 | 12 | 2.78 sp,f,w | 0.09 | |
| Fall | 12 | 173.98 su,w | 12 | 0.38 | 0.04 | 12 | 3.56 su | 0.28 | |
| Winter | 12 | 173.8 sp,su,f | 12 | 0.48 su | 0.04 | 12 | 4.31 su | 0.16 | |
| 2014 | Spring | 16 | 174.29 w | 16 | 0.28 | 0.03 | 16 | 4.07 su | 0.23 |
| Summer | 12 | 174.39 f,w | 12 | 0.29 | 0.01 | 12 | 3.16 sp,w | 0.16 | |
| Fall | 12 | 174.18 su,w | 12 | 0.4 | 0.05 | 12 | 3.66 | 0.25 | |
| Winter | 12 | 173.97 sp,f | 12 | 0.32 | 0.03 | 12 | 4.00 su | 0.2 | |
Publisher’s Note: MDPI stays neutral with regard to jurisdictional claims in published maps and institutional affiliations. |
© 2022 by the authors. Licensee MDPI, Basel, Switzerland. This article is an open access article distributed under the terms and conditions of the Creative Commons Attribution (CC BY) license (https://creativecommons.org/licenses/by/4.0/).
Share and Cite
MDPI and ACS Style
Carter, G.S.; Kowalski, K.P.; Eggleston, M.R. Turbidity and Estimated Phosphorus Retention in a Reconnected Lake Erie Coastal Wetland. Water 2022, 14, 1853. https://doi.org/10.3390/w14121853
AMA Style
Carter GS, Kowalski KP, Eggleston MR. Turbidity and Estimated Phosphorus Retention in a Reconnected Lake Erie Coastal Wetland. Water. 2022; 14(12):1853. https://doi.org/10.3390/w14121853
Chicago/Turabian StyleCarter, Glenn S., Kurt P. Kowalski, and Michael R. Eggleston. 2022. "Turbidity and Estimated Phosphorus Retention in a Reconnected Lake Erie Coastal Wetland" Water 14, no. 12: 1853. https://doi.org/10.3390/w14121853
Note that from the first issue of 2016, this journal uses article numbers instead of page numbers. See further details here.