
Effects of Hybrid-Type Artificial Groundwater Recharge and Underground Barrier in a Small Basin


1
Department of Disaster Prevention, Graduate School of Daejeon University, Daejeon 34520, Korea
2
Department of Construction Safety and Disaster Prevention, Daejeon University, Daejeon 34520, Korea
*
Author to whom correspondence should be addressed.
Water 2022, 14(12), 1849; https://doi.org/10.3390/w14121849
Submission received: 6 May 2022
/
Revised: 2 June 2022
/
Accepted: 3 June 2022
/
Published: 8 June 2022
(This article belongs to the Special Issue Drought and Groundwater Development)
Abstract
:Climate change is exacerbating water shortages in upstream basins in the Korean peninsula that lack agricultural water supply systems. The basin investigated in this study requires an extra 208 m3·d−1 of agricultural water during May (the busiest month for agriculture). The purpose of this study was to assess a hybrid-artificial recharge and circulation system, which was composed of a hybrid-recharge source and re-infiltration of pumped water in the field, and to estimate yield capacity by a field injection test and a numerical model. Injecting pretreated stream water for 42 d increased groundwater levels in the recharge basin. Water budget analysis in MODFLOW simulations revealed that injecting water increased groundwater levels as well as stream discharge due to the terrain’s gentle slope. To prevent downstream discharge and maintain groundwater levels after injection, we assumed the installation of an underground barrier at the basin outlet in the model, following which changes in groundwater levels and water balance were simulated. Water level was persistently maintained after a ~31-cm water level rise, and 590 m3·d−1 of water could be supplied from the collector well, which can ease water shortages. Therefore, it is necessary to develop structures to prevent recharged water escape when artificially recharging groundwater in small upstream basins. In upstream areas where reservoirs or water supply conduits are unfeasible, artificial recharge systems could solve water shortages.
1. Introduction
Climate change is causing severe droughts in many countries and, as such, is having major impacts on the economy, human society, and the environment. In recent decades, changes in the duration, frequency, and severity of droughts combined with low precipitation levels have resulted in water issues. The Korean peninsula has been experiencing droughts every four to six years, with extreme droughts occurring between 2014 and 2015.
Many countries use groundwater as their main source of domestic and agricultural water [1,2]. Thus, recent increases in water demand are leading to increased usage of groundwater. Additionally, drought events are becoming more extreme, meaning that the sustainability of groundwater is becoming an important concern.
In recent decades, Korea has utilized groundwater using wells as the primary means of securing water in the event of a drought. The country has 1.64 million wells that provide 2.9 billion m3 of domestic, industrial, and agricultural water per year [3].
Artificial groundwater recharge can contribute to sustainable groundwater management by increasing groundwater levels. Therefore, this approach can mitigate severe droughts by ensuring a sufficient water supply. Artificial groundwater recharge is currently promoted as a solution to water shortages in many countries as one of many tools used to manage water resources. However, its application is sometimes limited by technical and socioeconomic factors. The benefits of artificial recharge have been clearly demonstrated because aquifers can store large volumes of water. Numerous schemes exist to recharge groundwater; they can be broadly grouped into the following categories: spreading methods, open wells, drilled wells, riverbank filtration, sand dams, and rainwater harvesting. The effectiveness of an artificial recharge system is governed by several factors: hydrology, geography, geology, hydrogeology, source water availability, water quality, management issues, environmental effect, water policy, regulation, socioeconomic factors, and institution.
Many researchers have studied the effectiveness of artificial groundwater recharge using field tests and numerical models [4,5,6,7,8,9,10,11]. Abraham and Mohan studied the effects of different recharge structures, namely, check dams and percolation ponds, in India; they revealed that combining these methods could increase groundwater levels more effectively than using individual structures [12]. Meanwhile, Chitsazan and Movahedian used the MODFLOW code of GMS software to assess the artificial recharge effect in Gotvand Plain, Iran. They found that it positively affected the aquifer [13]. Shi et al. studied changes in groundwater quantity, quality, land subsidence rate, and aquifer thermal energy storage after long-term artificial recharge in Shanghai [14]. Akhter and Hossain predicted that groundwater levels would decrease to approximately −120 m in Dhaka City after 20 years but could be maintained at −70 m following the injection of a quantity of water equal to that of the abstraction [15]. Sashikkumar et al. studied the effect of artificial recharge using an integrated Geographic Information System (GIS) approach combined with MODFLOW numerical groundwater modeling techniques for the watershed of the Kodaganar river basin in Tamil Nadu [16]. They revealed that the groundwater volume could be increased by 15–38% by conducting artificial recharge using several kinds of artificial recharge methods; the major methods included percolation ponds and check dams. Meanwhile, Xu et al. revealed that the efficiency of artificial groundwater recharge was affected by the infiltration basin location and recharge density using the Finite Element subsurface FLOW (FEFLOW) system [17]. Mohammadzadeh-Habili and Khalili investigated how artificial recharge effects could be increased by changing the structure of recharge dams using numerical modeling; they suggested the excavation of vertical sidewall pits inside the reservoirs of recharge dams could improve artificial groundwater recharge [18].
The current study aimed to evaluate the effects of an artificial groundwater recharge facility installed in a small upstream basin in Korea, based on a numerical model and field test data. Furthermore, this study aimed to evaluate the need for installing an underground barrier at the outlet of the basin to ensure a stable water supply in a drought region. Finally, this study evaluated how the artificial recharge system combined with an underground barrier can store enough water in the unconsolidated aquifer by preventing water loss to the outside of the basin.
2. Materials and Methods
2.1. Study Site
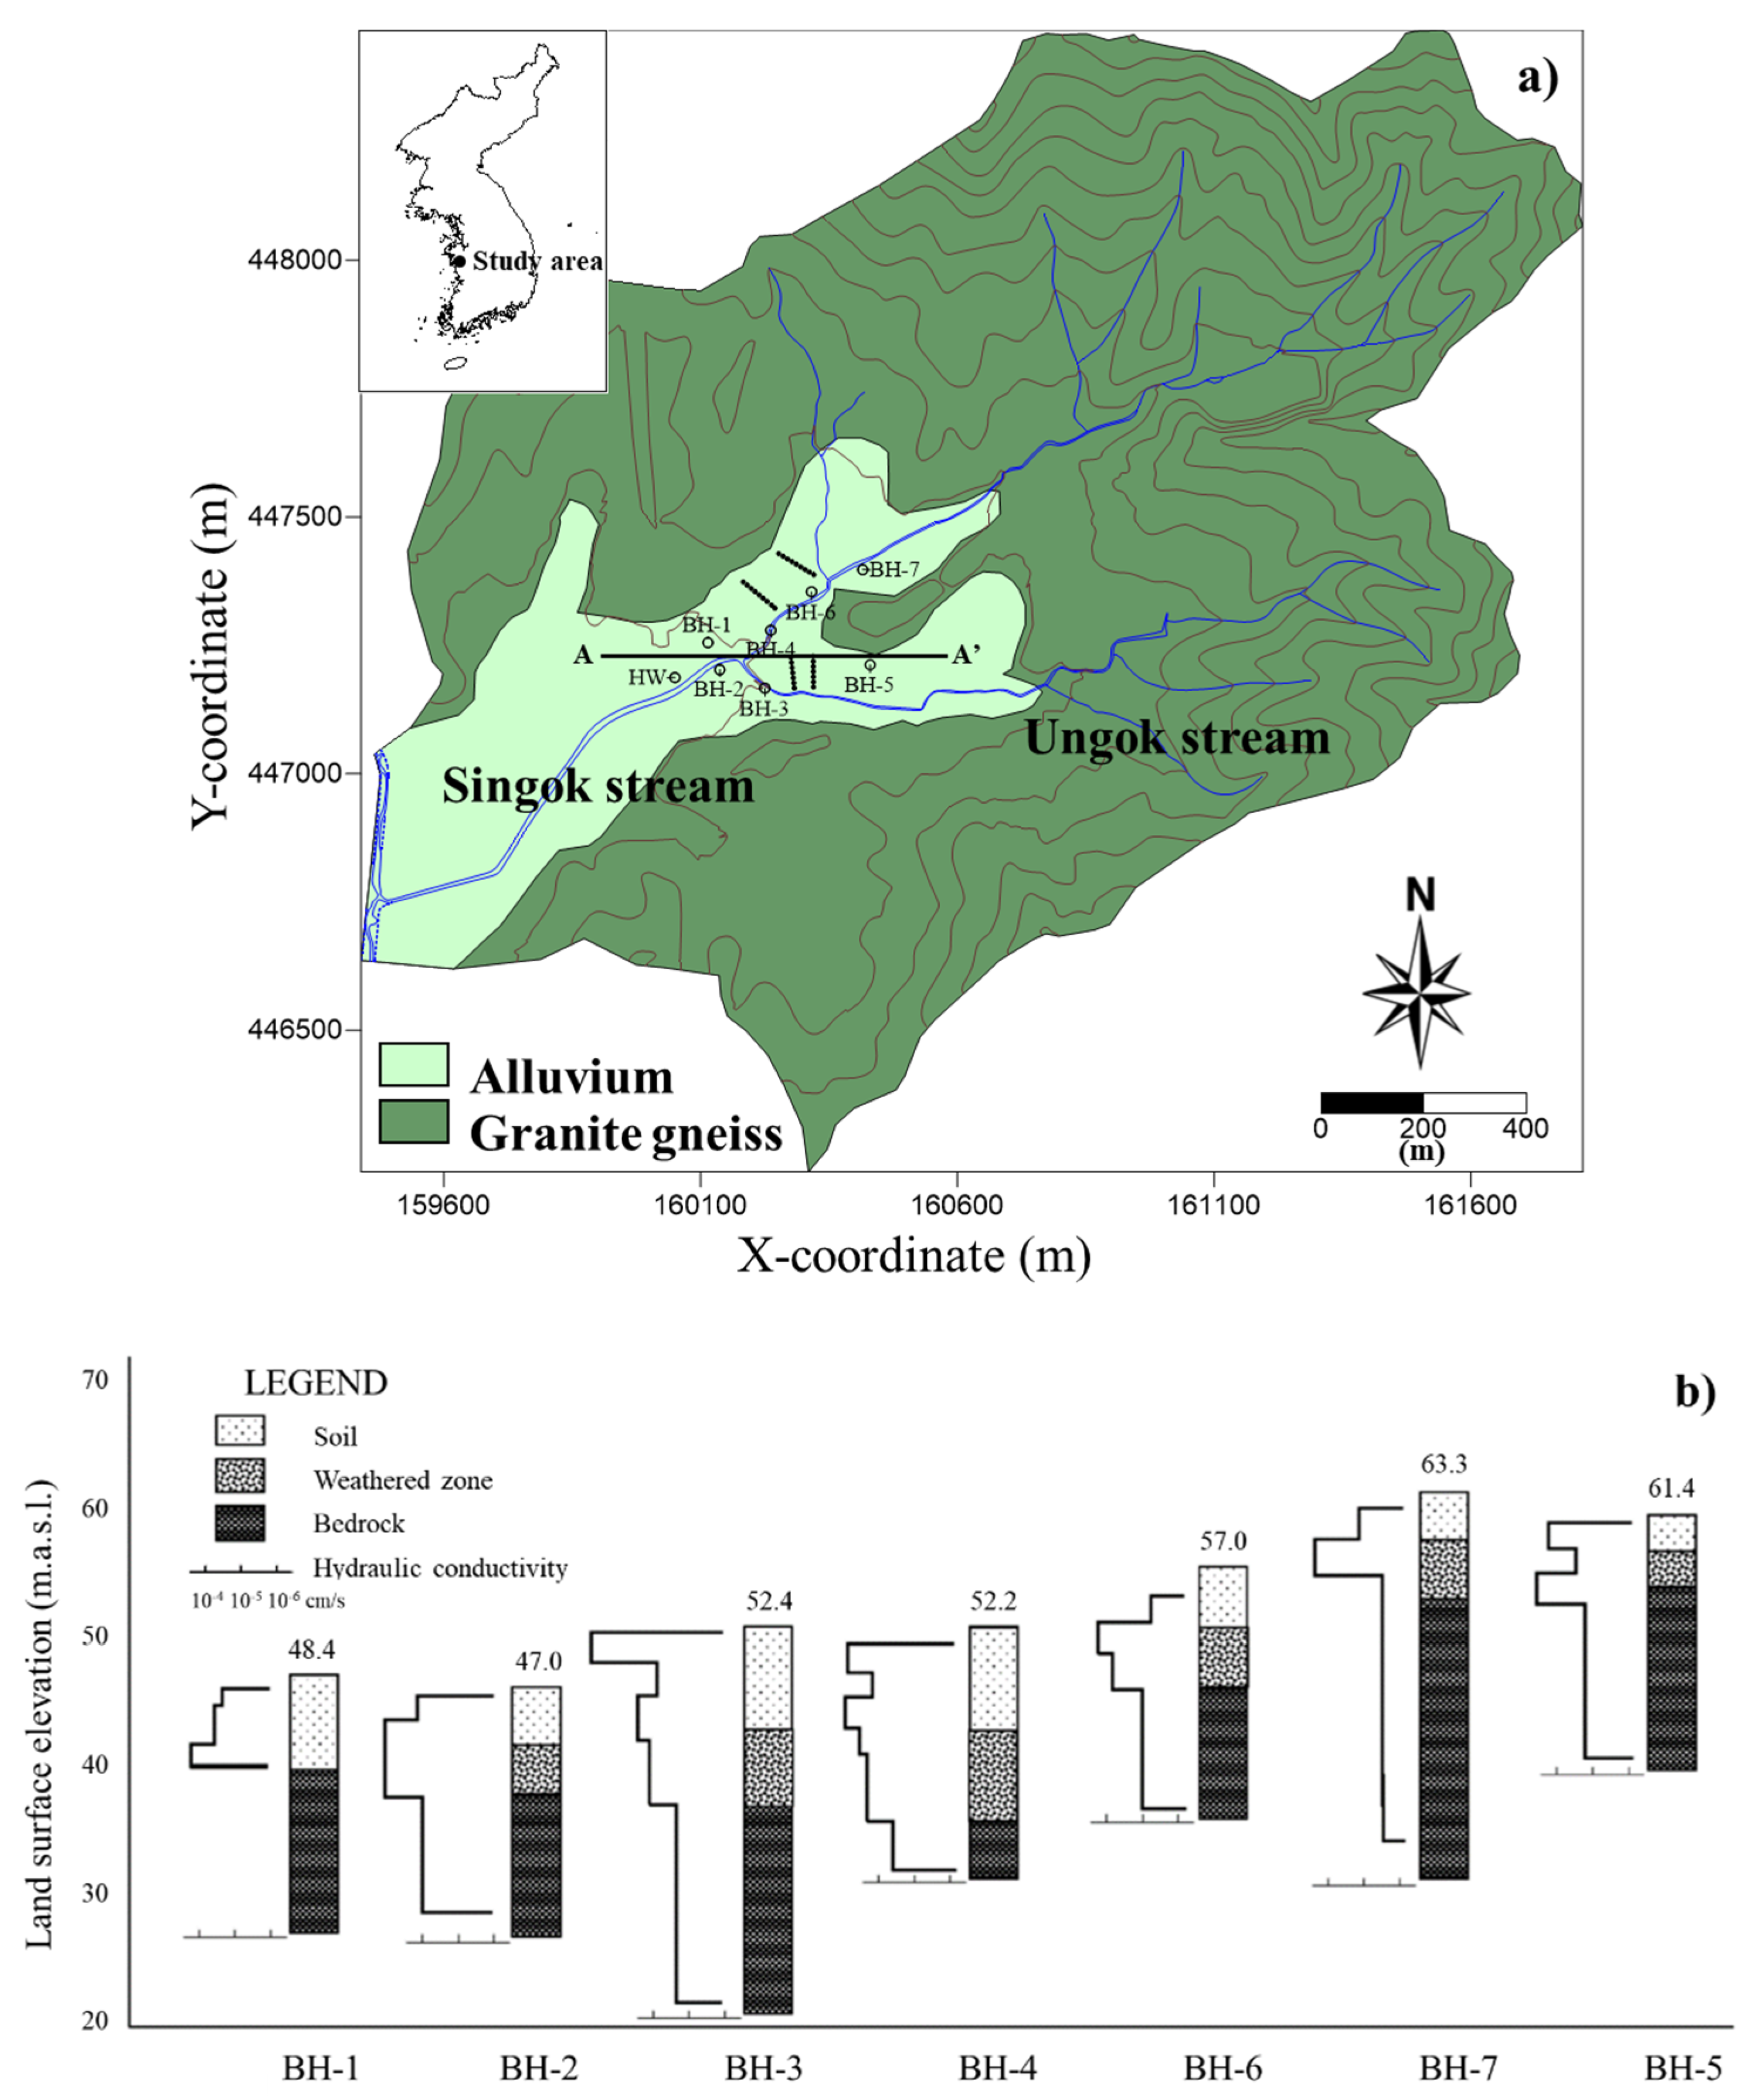
This study was conducted in Ungok-maeul, Galsan-myeon, Hongseong-gun, Chungcheongnam-do, which is located in the mid-west region of Korea (Figure 1a). This region suffered from a severe agricultural drought in 2015. The most-upstream basin of this watershed experiences frequent water shortages during the busy farming season in spring, and it mostly relies on groundwater during the dry season due to the lack of surface water. The basin area is ~2.5 km2, and the stream flows from the mountainous area in the east to the flat area in the west. The strata of the study area consisted of Quaternary alluvial and Precambrian granitic gneiss. The alluvial layer is composed mostly of sand, clay, and silt and is mainly distributed to the west of the study area and along the Singok Stream with a thickness of approximately 10 m (Figure 1b).
2.2. Water Shortage at the Study Area
In general, drought is caused by abnormal climate (a long period of time during which no rain falls), but it may also appear every several years due to abnormally low rainfall in an area where a water supply system is not effective. Many upstream areas in Korea have a weak water supply system and are easily exposed to drought during irrigational season. Water balance analysis was performed in a previous study, by assuming that there was little rainfall during the dry season (from January to June) [19]. As per the analysis, no water shortages occurred in April, as rice farming mainly started at the end of April. In May, when agricultural activities began in earnest, however, there was a water shortage of ~208 m3 of water per day, as the existing facilities (wells) could only supply 9423 m3 of water, which is significantly less than the maximum demand of 15,870 m3 (512 m3·d−1; Table 1). June was not considered in this study as water shortages are generally alleviated by rainfall during this month. The upper part of the saturation zone can store approximately 959–1040 m3 of water per day from April to May; hence, it was estimated that extra water could be supplied by securing a source of artificial groundwater recharge.
2.3. Hybrid-Type Artificial Recharge and Circulation System
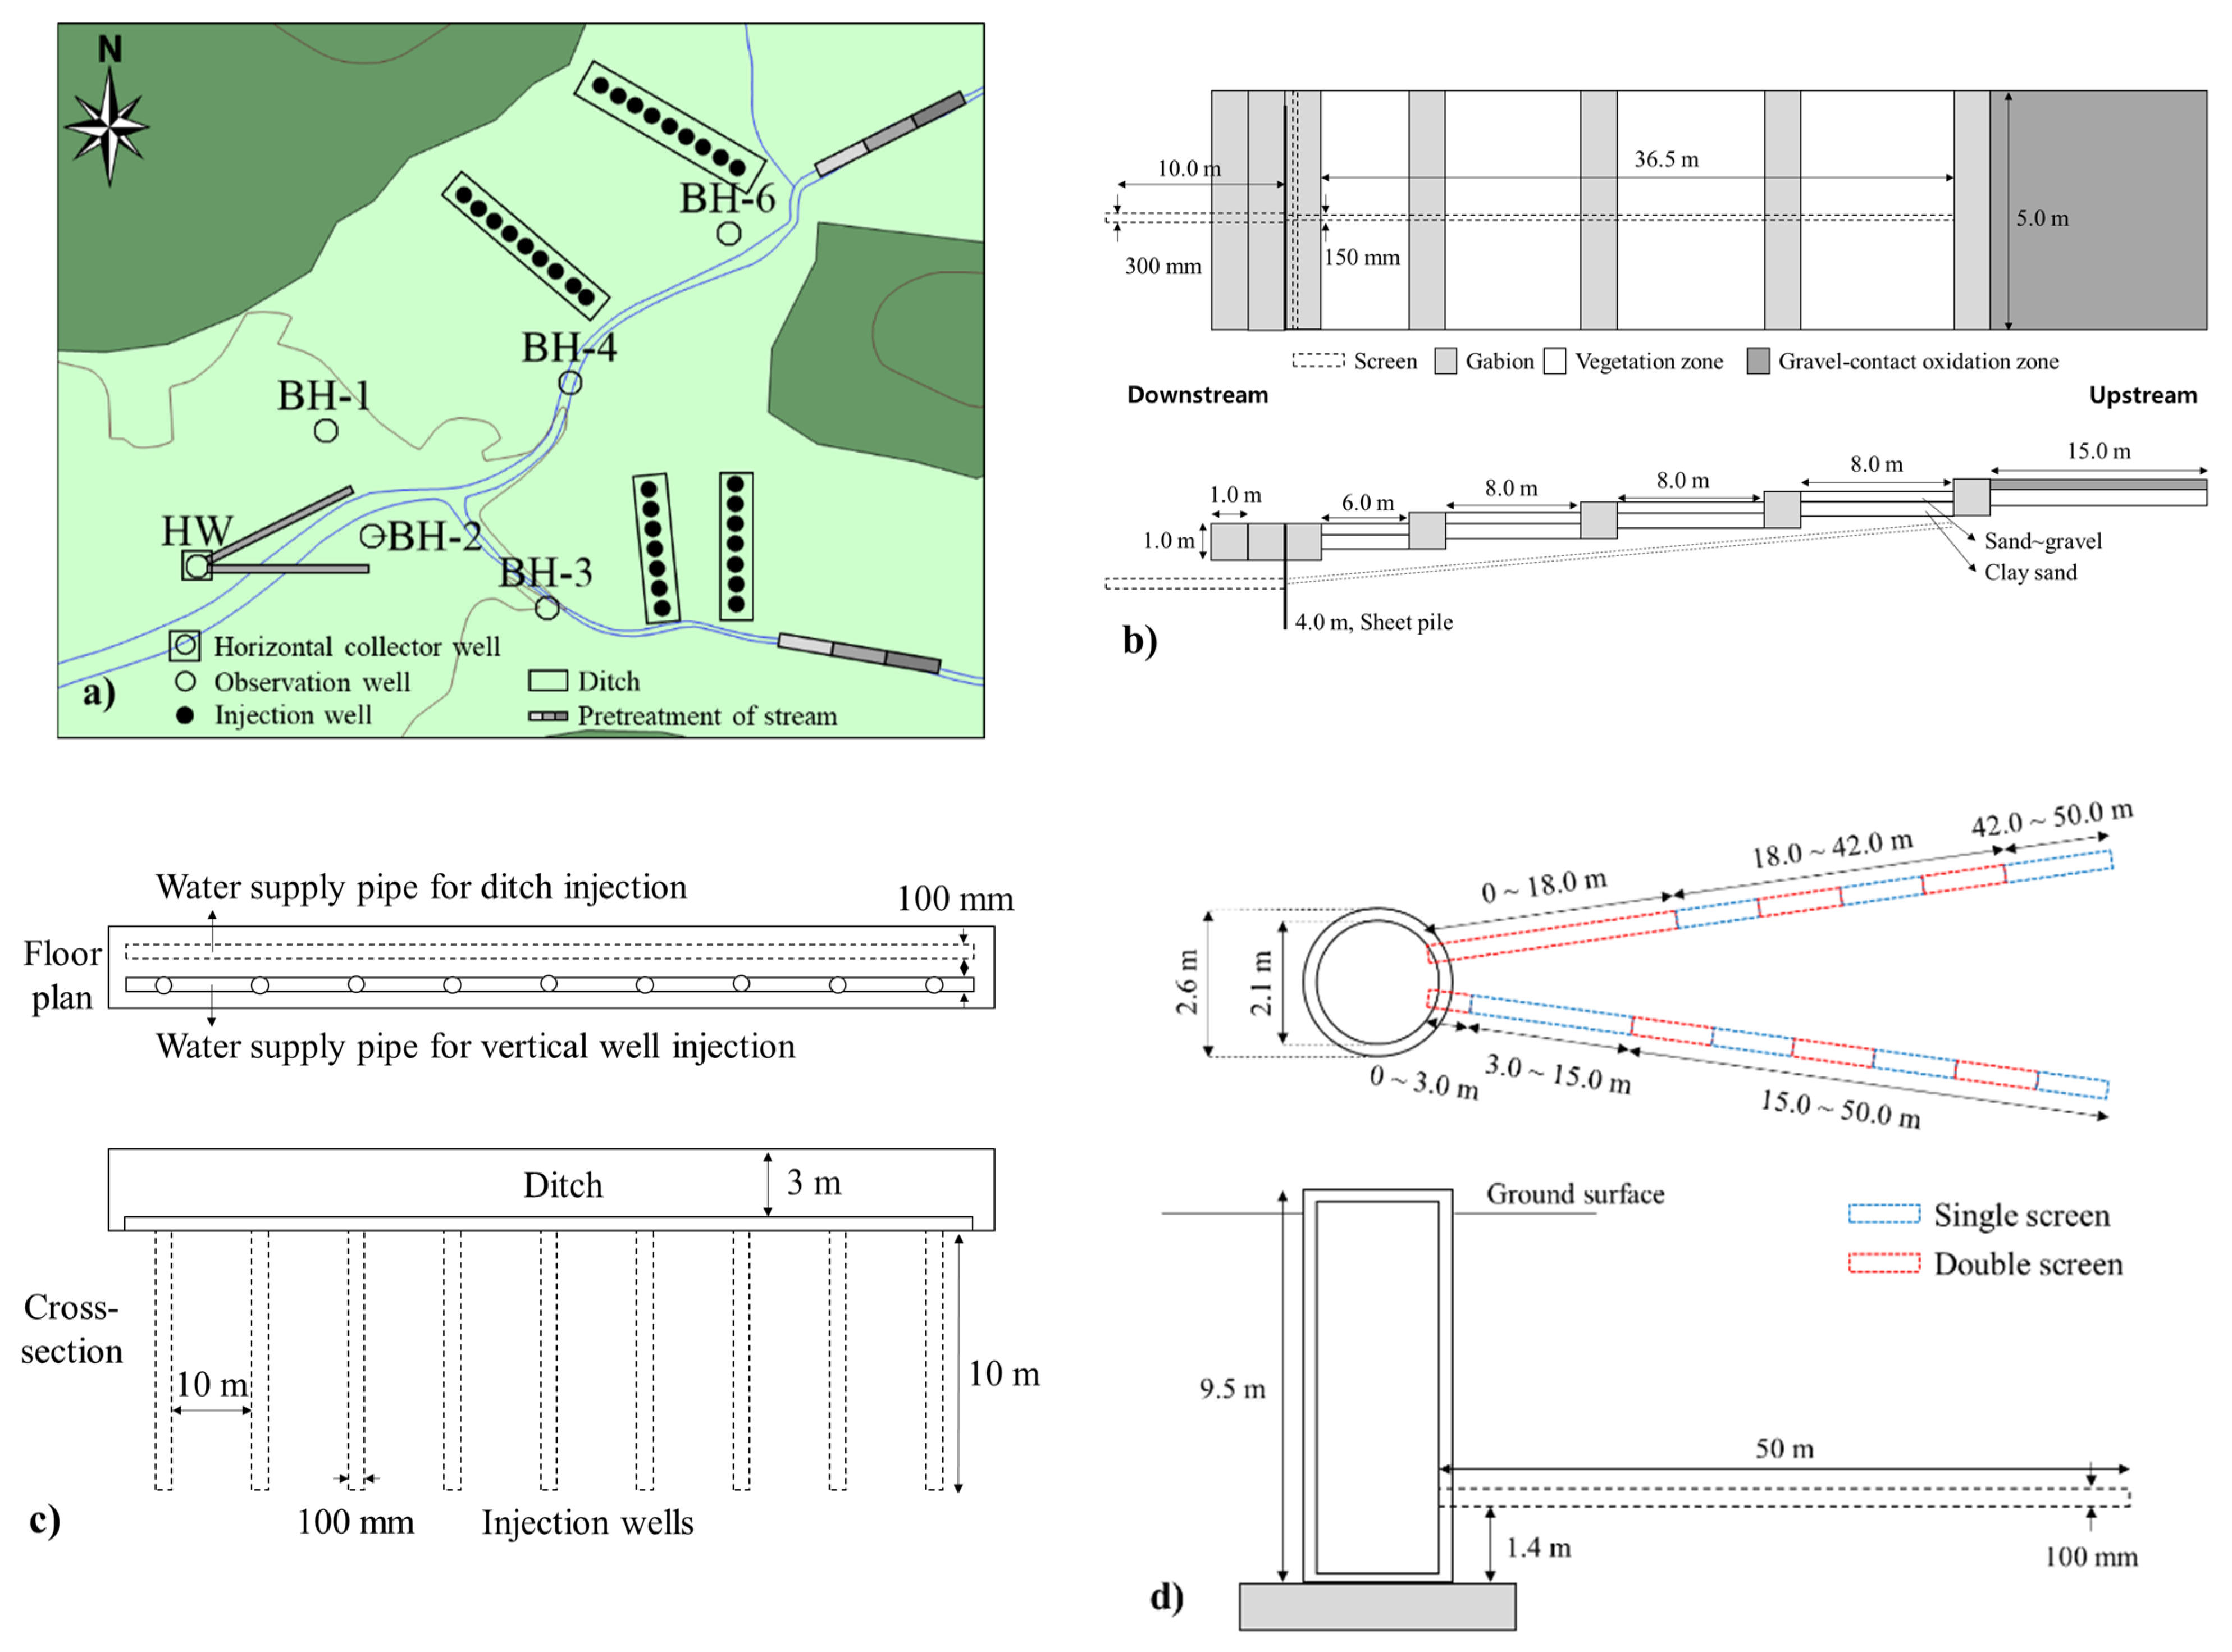
Considering that the research area is a small upstream basin, a new method was reviewed for artificial groundwater recharge. A hybrid-type artificial recharge and circulation system for groundwater was applied to diversify and reuse sources of groundwater recharge (Figure 2a). Using stream water as an artificial recharge source may have been challenging due to the small size of the stream and its depletion during the dry season. Therefore, the base flow and deep groundwater were considered as further sources of groundwater recharge. The deep bedrock water was located at a depth of several hundred meters and had little hydraulic interaction with the alluvial groundwater. Thus, even small amounts (several to tens of m3) could be used as an artificial recharge source and added to the unconsolidated layer. The circulation system ensured that following the artificial recharge of groundwater, water withdrawn downstream was supplied to farmland, naturally re-infiltrated, and then withdrawn from the downstream well again. As such, this system aimed to ensure that all water resources throughout the small basin could be stored for a long time without any water escaping (as much as possible).
To maintain the high quality of the injected source water, water quality pretreatment devices were installed in two sections. From upstream to downstream, the pretreatment device consisted of a gravel oxidation section, a vegetation water treatment section, a gravel section, and a gabion section (Figure 2b).
Artificial recharge technology was applied combined with ditches and wells to boost the effect of adding groundwater recharge sources. Four recharge lines were built in the north and south of the study area: two 100 m-long ditch lines including nine injection wells in the north and two 70 m-long ditch lines including seven injection wells in the south (Figure 2c). The widths and depths of the ditches were approximately 3 and 3.5 m, respectively, and the size of the gravel section was 20–75 mm. Smaller gravel layers were used at the deeper bottom. The depths and diameters of the injection wells were 10 and 100 mm, respectively.
A collector well with two horizontal pipes was installed at the downstream recharge section to ensure a secure water supply. The horizontal pipes were 50 m long, with a diameter of 100 mm. A collector well was also installed 20 m from the river; it had a caisson with a diameter of 2.1 m and a depth of 9.5 m (Figure 2d). Water withdrawn from the collector well was transferred to a water tank upstream of the basin through a 100 mm pipe and then supplied to the farmland through natural flow.
2.4. Field Test and Numerical Modeling
Field injection test and numerical modeling using Visual MODFLOW (Version 4.6) were carried out to evaluate the effect of artificial recharge and diagnose the need to install an underground barrier. The accuracy of the model was verified by comparing the results of the field injection test with the results of the numerical model. This model was used to predict the synergistic effect of the groundwater level and the stability of water intake when installing an underground barrier wall, and ultimately evaluate whether the water shortage in the study area can be resolved through artificial recharge.
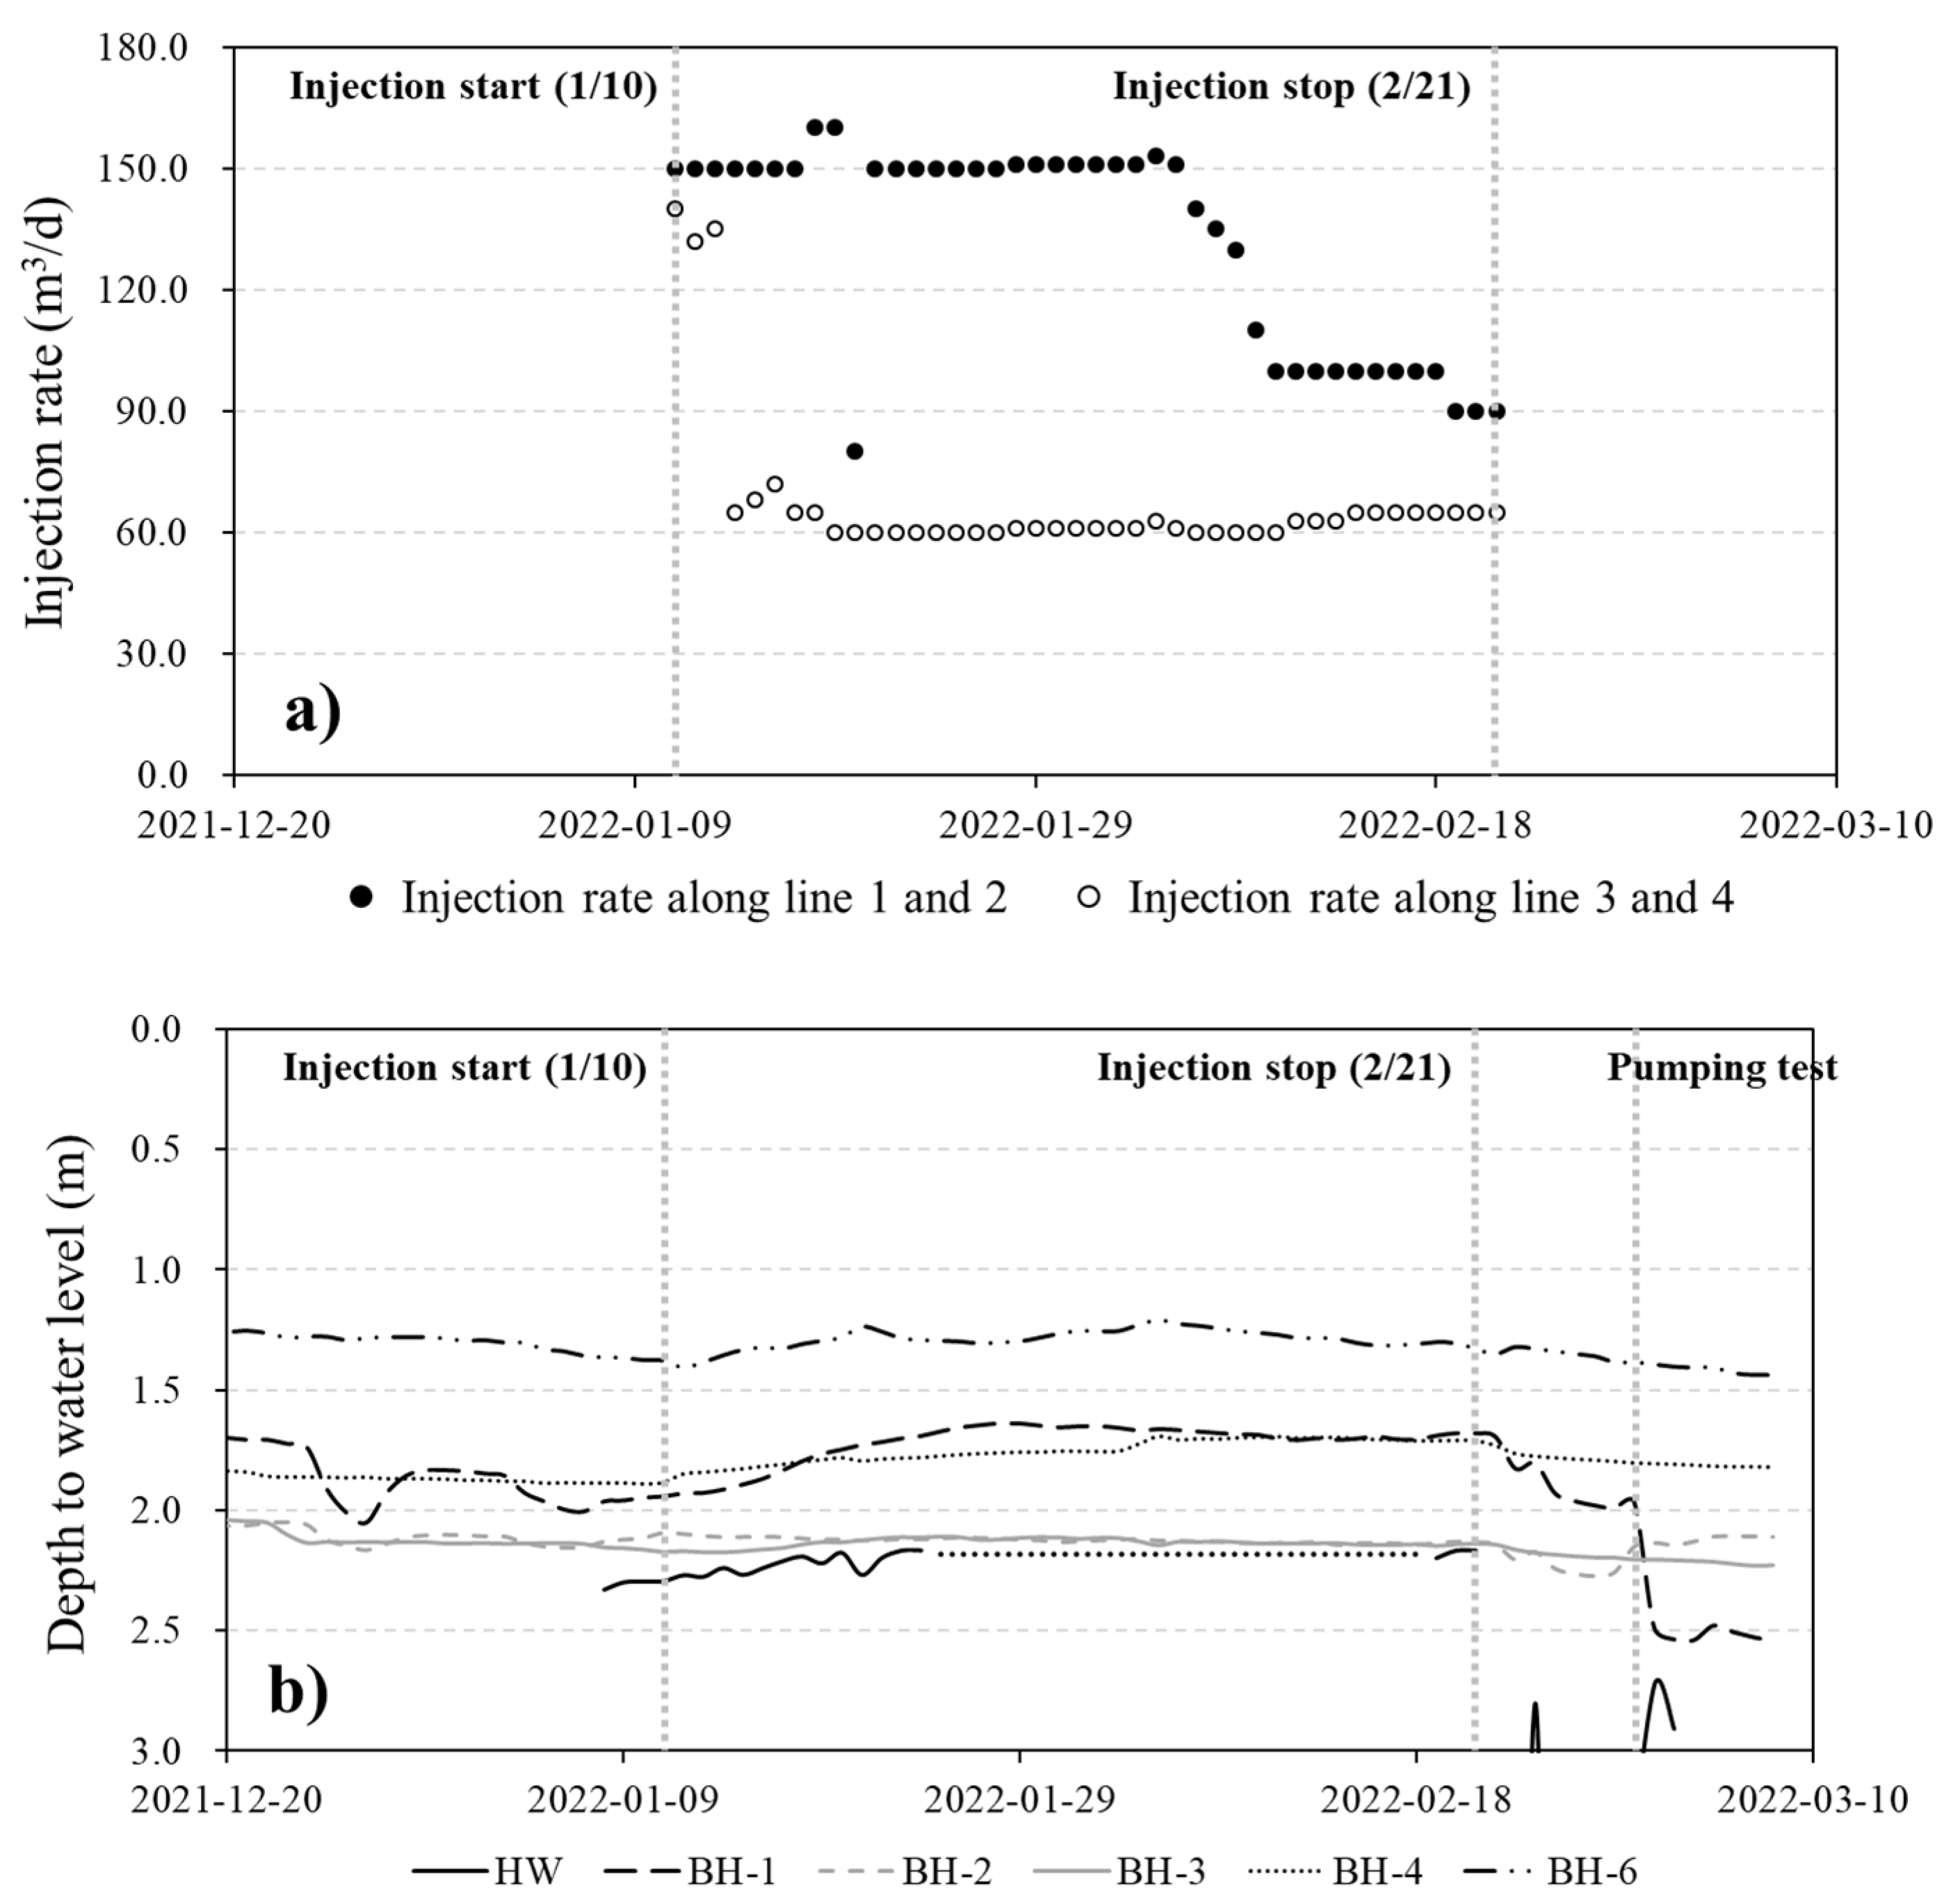
Artificial recharge was conducted at the four recharge lines for 42 d from 10 January to 21 February 2022. The total injection rate of water added was 150–210 m3·d−1, which included 90–150 m3·d−1 from two lines in the north and ~60 m3·d−1 from two lines in the south (Figure 3a). During this period, the groundwater level and water quality were measured at five groundwater observation wells in the basin, and changes after injection were analyzed (see Figure 2a).
In addition to the field test, the groundwater flow and changes in groundwater levels and water balance caused by artificial recharge were examined using Visual MODFLOW (flow engine: MODFLOW-NTW). The topography, strata distribution, groundwater level distribution, hydraulic conductivity, river and streamflow characteristics, pumping well distribution, and groundwater usage were investigated through field investigations and indoor experiments; numerical modeling was then performed after establishing a conceptual model.
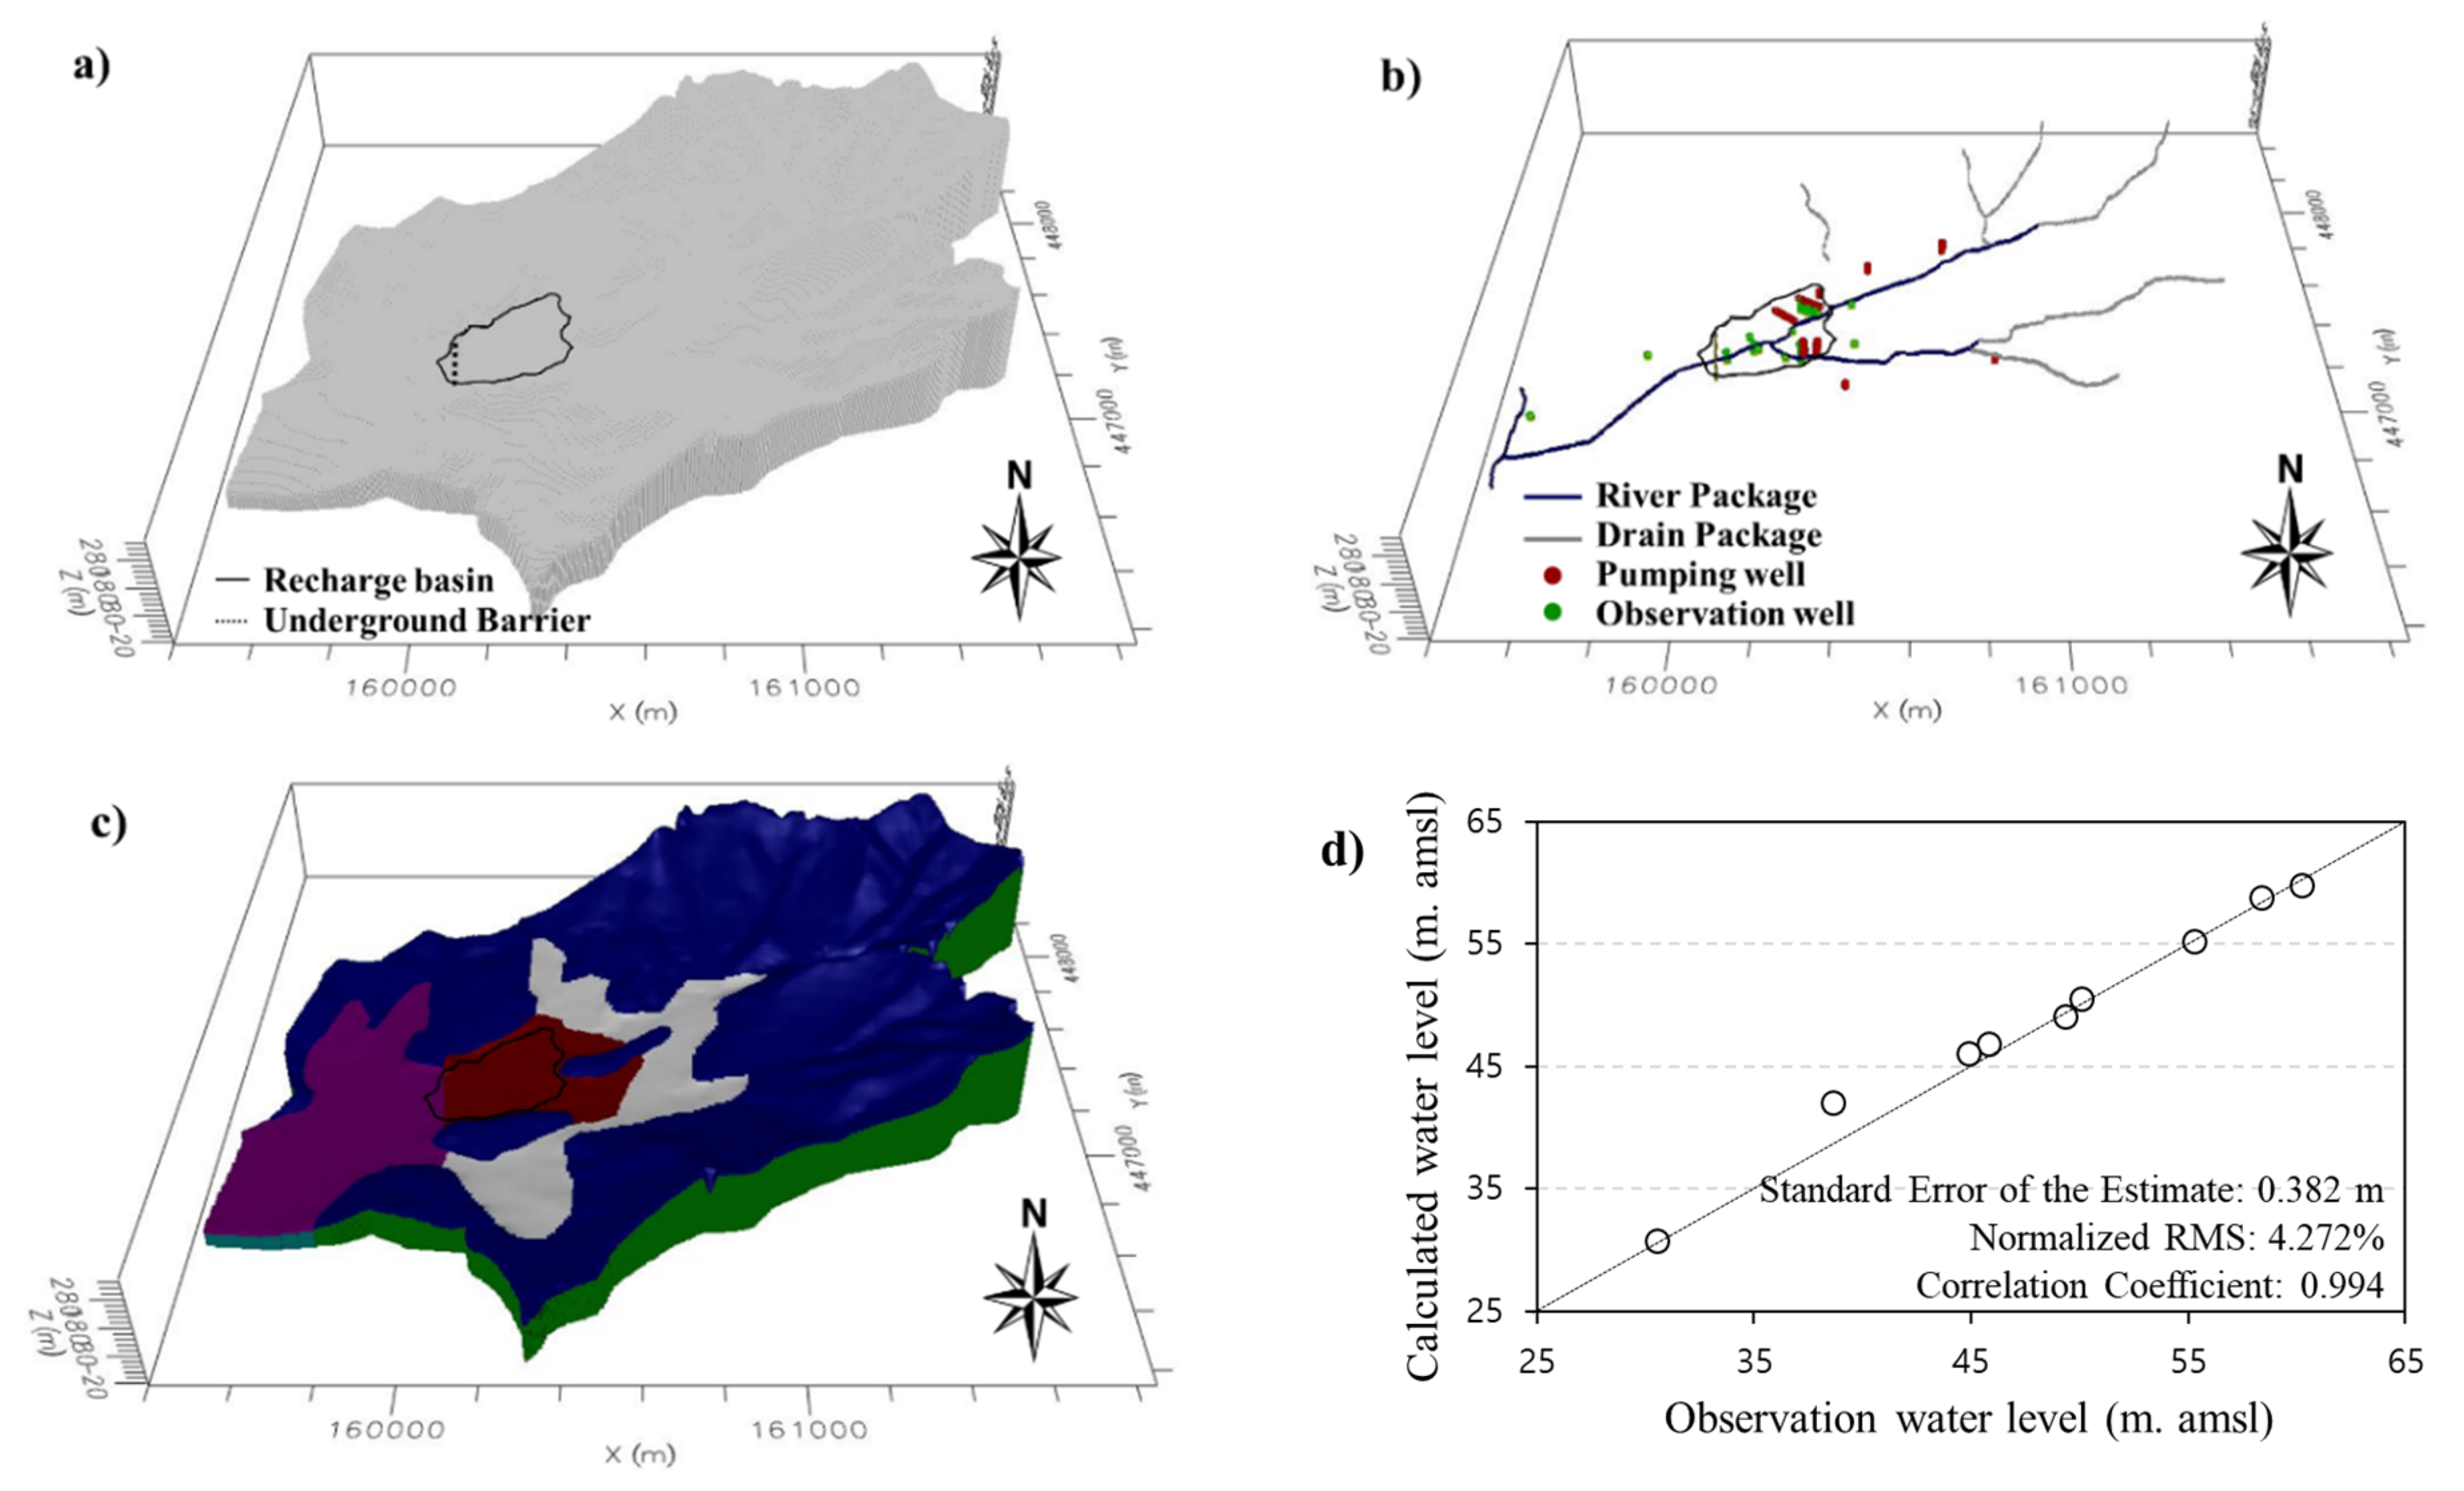
The study area of the numerical model consisted of 5 m × 5 m grids of 490 columns and 470 rows (Figure 4a). The mountainous areas in the north, east, and south were set as no-flow boundaries, and the north–south flowing river in the west and east–west stream in the study area were defined as river boundaries, of which conductance ranged from 0 m2·d−1 at the uppermost to 50 m2·d−1 at the lowermost. Additionally, the branches of the east–west stream were set as a drain package with a drain conductance of 3 m2·d−1, as the bedrock was exposed at the bottom of the stream (Figure 4b).
During modeling, strata are usually divided into the alluvial layer, weathered zone, and bedrock layer (from top to bottom). The alluvial layer and the weathering zone were considered as one layer as they showed similar hydraulic conductivity in the survey area. In addition, using the excavation data of the observation well, the upper part was composed of an unconsolidated layer, and the lower part was made of bedrock at 12 m below the surface. The distribution of the unconsolidated layer was estimated based on field drilling data (9 wells) in the area around the stream passing through the center of the study area. Hydraulic conductivity was calculated by soil particle analysis results and field pumping tests, respectively. Soil particle analysis was performed on a total of 14 samples, and the pumping test was conducted in one well. The values considered for the unconsolidated and bedrock layers in the modeling were 1.27 × 10⁻⁵ to 1.04 × 10⁻² and 2.47 × 10⁻⁶ to 1.31 × 10⁻⁵ cm·s−1, respectively (Figure 4c). The flow rate of the stream was calculated using the water level measured at the V-notch, and the groundwater level was automatically measured every hour at nine groundwater observation wells. After calculating the groundwater recharge rate at the points of the groundwater observation network distributed across the country by the “water table fluctuation” method, which calculates the groundwater recharge rate based on the fluctuation range of the groundwater level, an artificial neural network model for the relationship with the characteristic factors of each point was developed. This made it possible to estimate the groundwater recharge rate in the unmeasured area [20]. Subsequently, the average natural groundwater recharge rate in the study area was calculated to be 12.8%, and 130 mm·y−1 after applying the 10-year average rainfall.
A steady-state flow model was performed under the above conditions, and model calibration was conducted by repeatedly measuring the fitness of the actual and predicted groundwater levels using the trial-and-error method.
3. Results
3.1. Artificial Recharge Field Test
Regarding changes in groundwater levels after injection, BH-6, BH-4, BH-3, and BH-2, which were adjacent to the stream, showed several cm of groundwater level rise, while BH-1 (located at the center of the basin) experienced ~30 cm of water level rise (see Figure 3b). In addition, larger rises were observed closer to the injection lines, showing more rapid changes in groundwater levels. The maximum value was recorded 12 d after injection in BH-6, whereas BH-1 showed the largest groundwater level rise approximately 18 d later. These results show that, during the injection period, the groundwater level did not increase rapidly; instead, it remained relatively constant. In the downstream horizontal wells, the change began several days after injection, resulting in a water level rise of ~13 cm. The local anisotropy of the strata seems to have been the reason for BH-1 showing a higher groundwater level rise than other sites. Low hydraulic conductivity at BH-1, which was estimated by the grain size analysis of soil samples, caused this anisotropy. BH-1 had a hydraulic conductivity of 1.03 × 10⁻⁴ cm·s−1, which was 5–10 fold smaller than the surrounding areas; this seems to have caused the observed differences in water level rise following water injection.
The fact that the groundwater level remained constant without a significant rise despite the continued injection indicates that some of the injected water was discharged back into the stream. When injections from all lines were stopped, the groundwater levels returned to the original natural water level for approximately 15 d.
As the study site was upstream of a basin where groundwater was discharged down a gentle slope, the increase in groundwater levels during artificial recharge was not significant, and it was difficult to store the injected water for a long time. Nevertheless, the increase in groundwater levels resulting from artificial groundwater recharge could likely satisfy water demand during the busy farming season by increasing the water volume being withdrawn from the collector well, though it could be hard to maintain the water supply during a period of prolonged drought. Therefore, it is necessary to develop a plan to increase the retention period of injected groundwater while maintaining water added from the collector well.
3.2. Numerical Modeling of Artificial Recharge Effects
Groundwater levels were adjusted step-by-step to produce the best fit model by calibrating the geologic layer distribution and hydraulic conductivity, which were relatively unclear factors in a steady-state model of Visual MODFLOW. The steady-state model solver used the Newton formulation, and the solver option used COMPLEX, which is used for a model consisting of one or more non-pressure layers representing complex geological and surface–groundwater interactions [21]. The steady-state flow model achieved a correlation coefficient between the calculated and actual water levels of 0.994, with a standard error of 0.38 m, which was achieved by the calibration process via trial and error to minimize some measure of goodness of fit between two values (see Figure 4d). It was assumed that this error was due to limited data on the hydraulic conductivities and the uncertainty of pumping amount of existing wells.
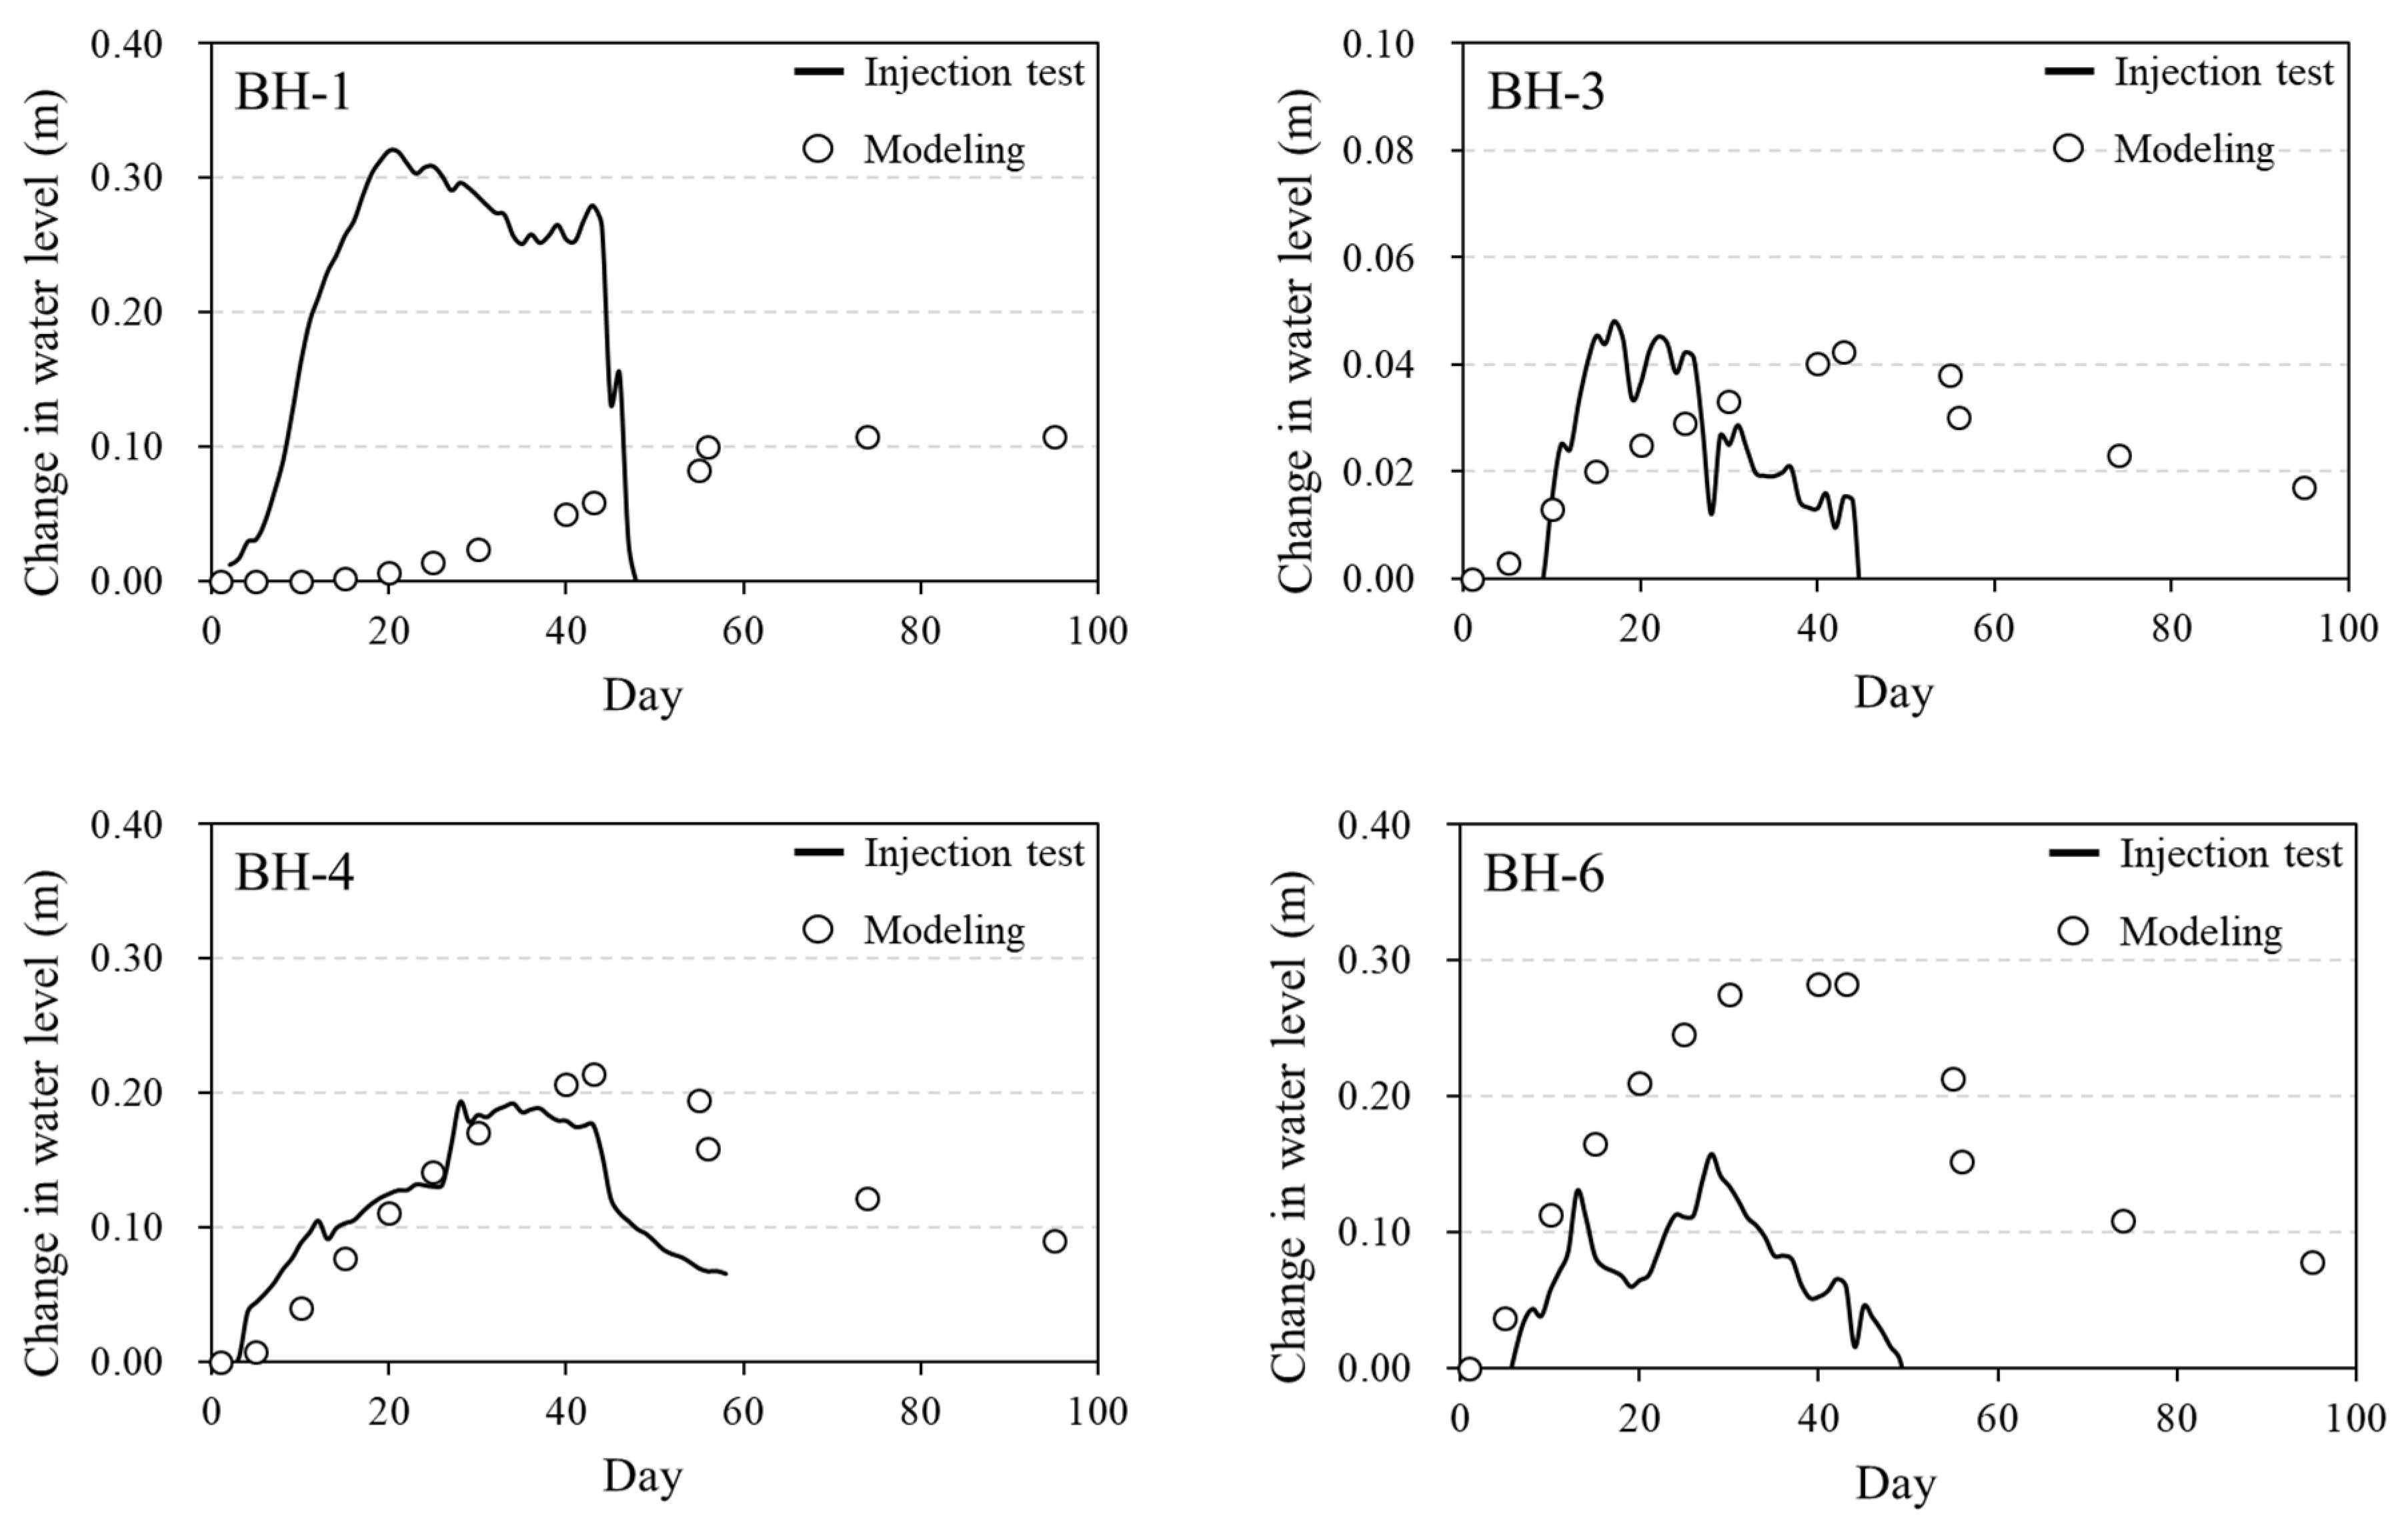
To estimate the change in groundwater levels after injecting water for 42 d, transient flow model was run by reflecting the actual injection conditions at the site. As a result, observation sites BH-6 and BH-4 showed maximum groundwater level rises of 28.3 and 21.4 cm, respectively (Table 2). Regarding the time series changes after injection, BH-3, BH-4, and BH-6 showed similar groundwater level fluctuations during the injection test in the field, verifying the fitness of the numerical model (Figure 5). At BH-1, where hydraulic conductivity was relatively low, a difference was found between the actual and modeled fluctuations; this occurred because the numerical model did not accurately reflect the partial anisotropy of the hydraulic conductivity at this location. Overall, the modeled time series changes were similar to the actual observations, indicating that the simulation was relatively successful. The model predictions revealed that continuous injection led to a gradual rise in the groundwater levels while stopping injections resulted in a slow decrease in water levels over dozens of days. Based on this numerical model, the changes in water balance in the recharge basin were measured following the artificial recharge.
Meanwhile, the effects of long-term injection were compared under steady-state conditions (no injection) and without underground barrier. The retention caused by injection in the recharge area increased by 98 m3·d−1, while discharge into the stream occurred simultaneously at a rate of 80 m3·d−1 (Figure 6). This implies that the injected water did not stay in the recharge basin for a long time and was released into the stream. This contributed to the observed increase in stream flow, explaining the relatively slow groundwater level rise compared to the amount of water added. Therefore, installation of the horizontal pipe of the collector well through the lower layer of the stream bed would increase the total pumping rate by adding the indirect withdrawal of stream water, as designed above (see Figure 2a).
3.3. Effects of Underground Barrier and Water Circulation
To minimize the loss of injected water downstream and secure a stable water supply to the horizontal wells, the changes in water levels and water balance were simulated after installing a low permeability barrier at the downstream outlet. It was assumed that a 200-m-long low permeability barrier was installed deep in the bedrock and that the hydraulic conductivity of the barrier was 2 × 10⁻⁶ cm·s−1 (i.e., smaller than that of the bedrock).
If 500 m3·d−1 of water was supplied from the collector well to ~50,000 m2 of farmland, it was equivalent to supplying 10 mm·d−1 of water per 1 m2. Additionally, 12.8% (1.28 mm·d−1) of this amount was considered to be re-injected through the farmland and it was reflected in the numerical model. Therefore, the changes in groundwater levels and water balance were estimated using the numerical model by assuming that this re-injection was maintained for 30 d, that is, assuming that 38.4 mm of total extra recharge occurred for 30 d after Day 31 of the first injection.
When only the installation of underground barrier was considered, the groundwater levels increased by 35.8 cm in BH-6 and 24.6 cm in BH-4. However, when re-injection in the farmland was considered, the predicted water level rises increased to 36.3 and 25.3 cm, respectively (Table 2). In particular, as significant water level increases near the river contributed to the modeled rise in stream flow, the water supply from the horizontal wells located at the bottom of the river was expected to increase.
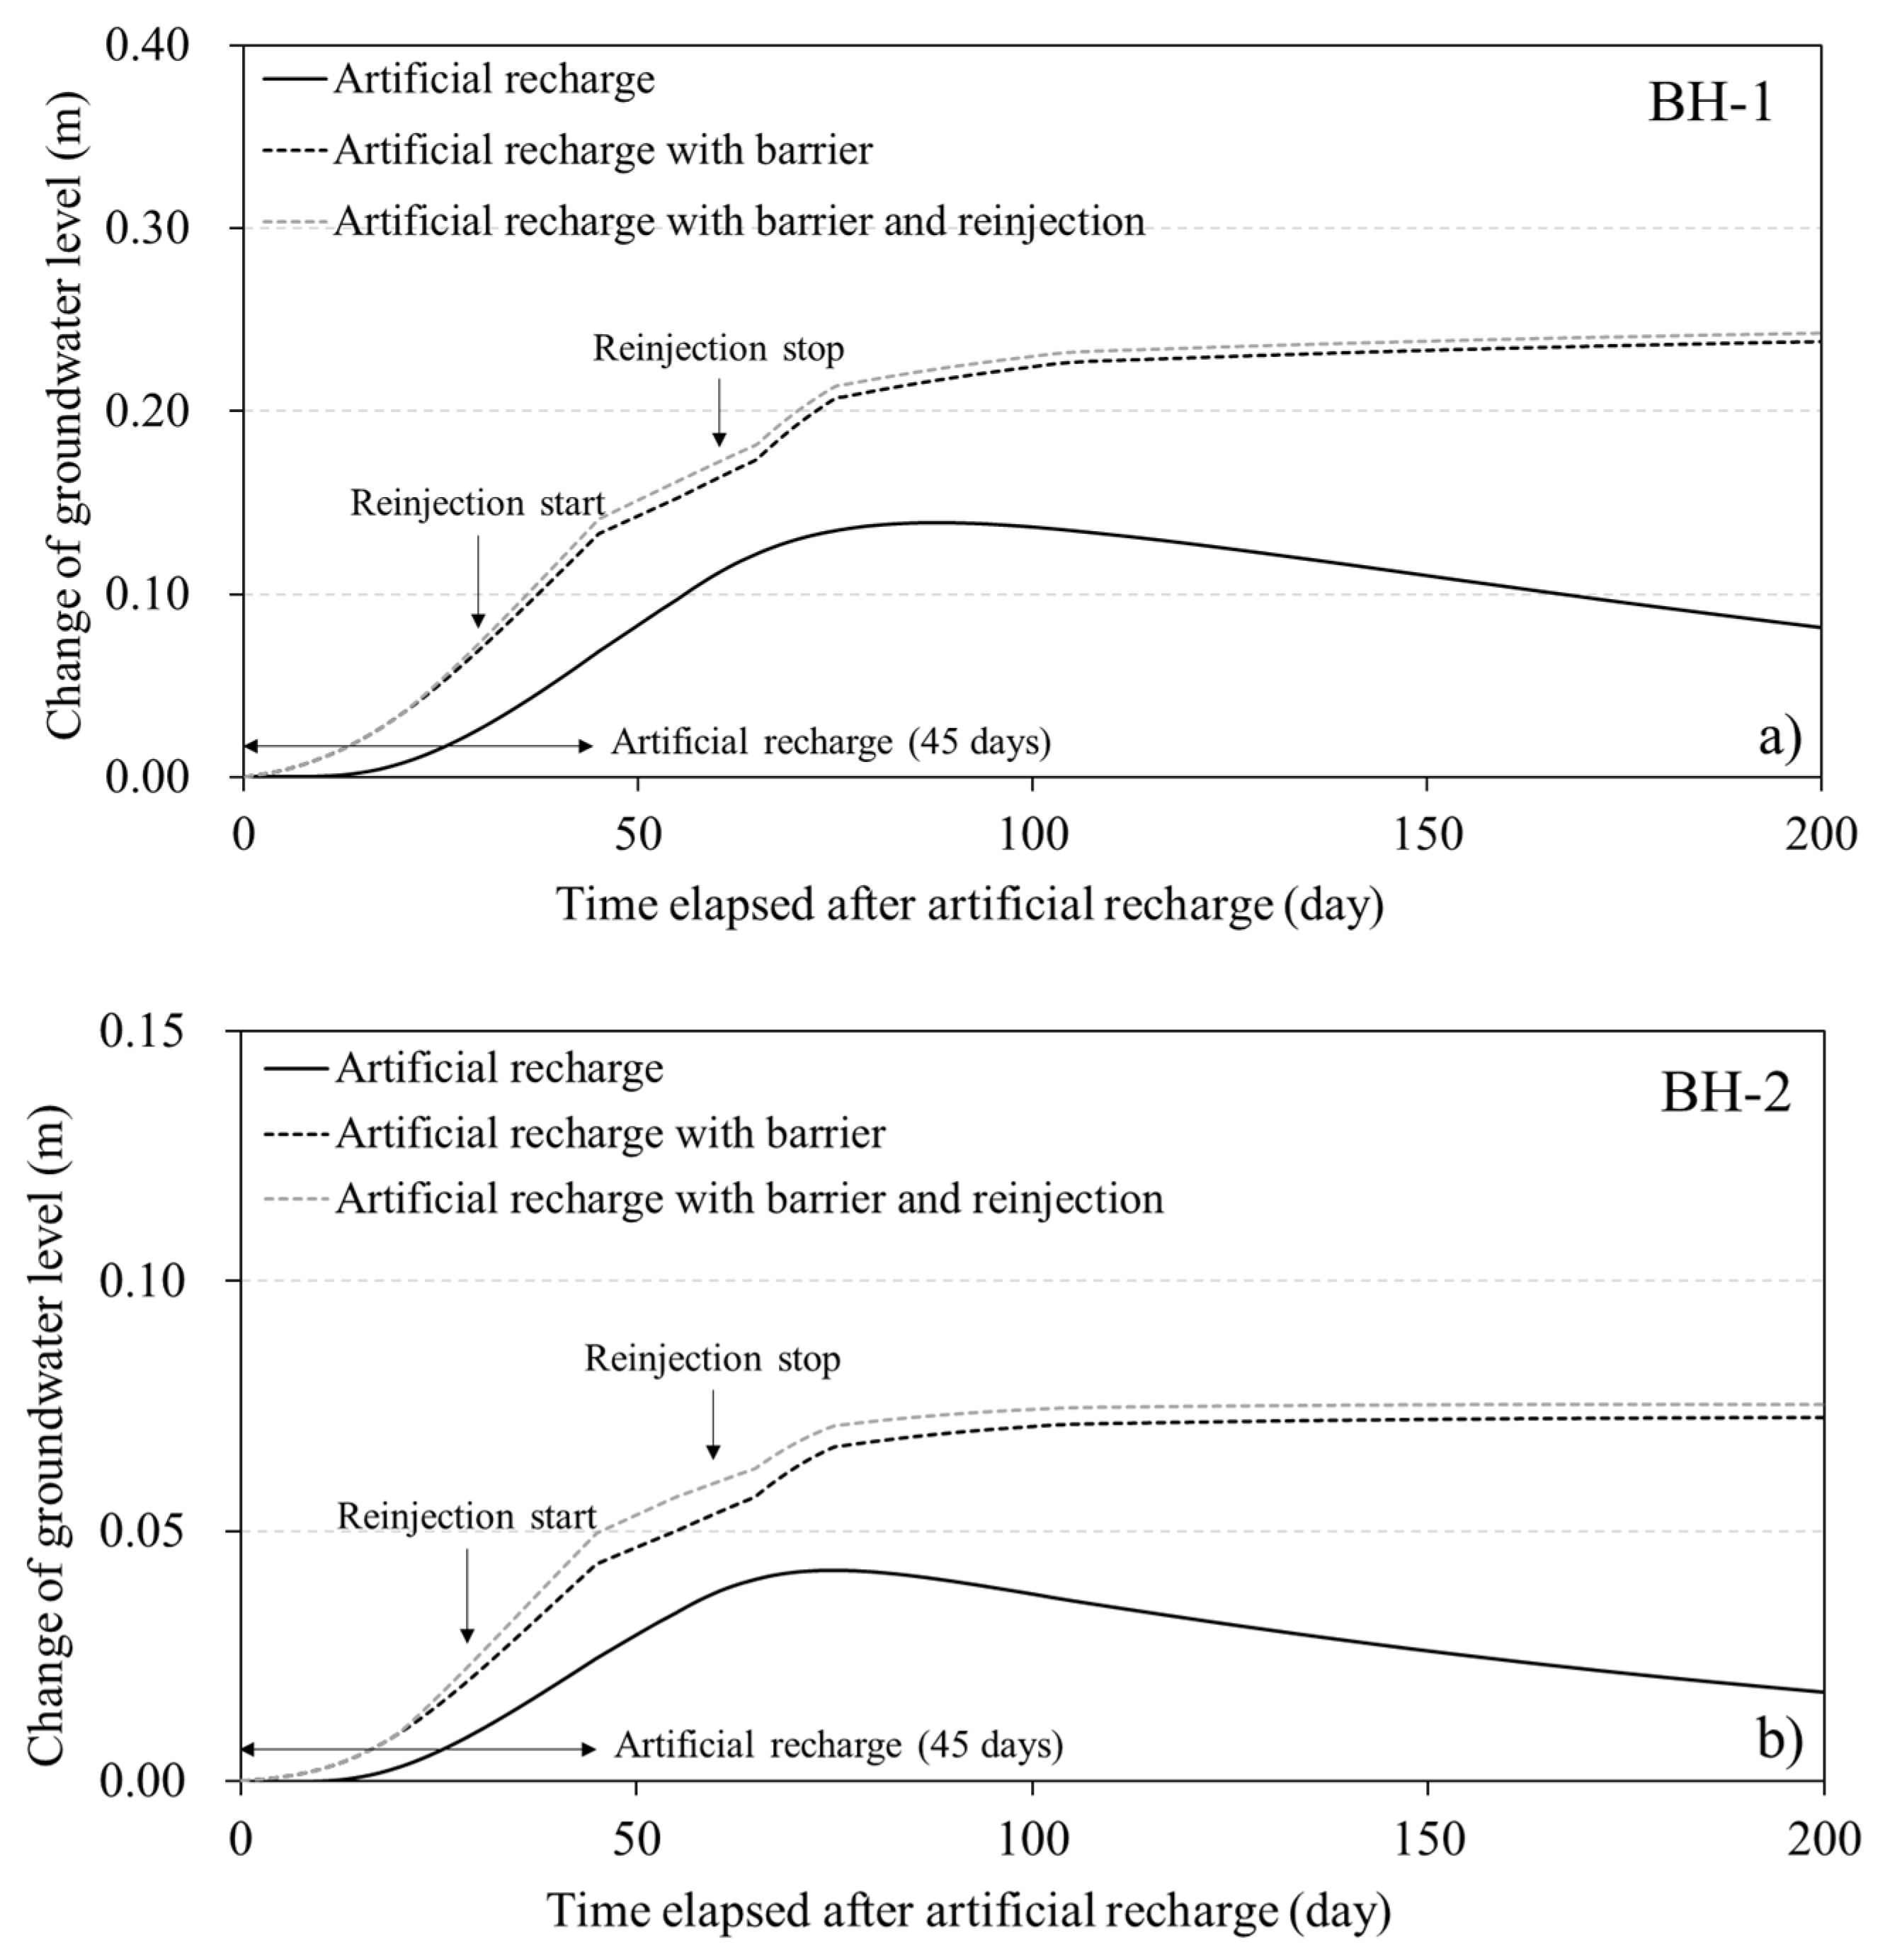
The elevated groundwater levels were maintained for a long time or even increased when underground barrier was installed or when re-injection occurred. This indicates that the horizontal wells provided a more stable water supply (Figure 7a,b). A clear change was also found in the water balance; compared to artificial recharge without barrier, adding the barrier and re-injection increased the stream flowrate and groundwater storage by 31 and 16 m3·d−1, respectively (see Figure 6).
3.4. Estimation of Groundwater Yield at Horizontal Collector Well
As mentioned above, a collector well with two horizontal pipes was installed at the bottom of the unconsolidated layer to secure as much groundwater as possible, and horizontal pipes were designed to pass through the lower layer of the stream bed. The amount of water withdrawn from the collector well near the river was estimated using the following equation [22]:
In Equations (1) and (2), Q indicates the amount of withdrawn water (m3·d−1), k is the hydraulic conductivity of the aquifer (m·d−1), is the thickness of the aquifer (m), is the drop in the water level (m), b is the distance from the stream channel to the well (m), is the equivalent radius of the collector well (considered as a large vertical well [m]), n is the number of the horizontal pipes, and L is the average length (m) from the center of the well to the end of the horizontal pipe.
To calculate the water intake of the horizontal collector well, we considered a 3-m drop in the water level, which is approximately 50% of the natural head, hydraulic conductivity of 2.53 m·d−1, and average value of BH-1 and BH-2 points (Table 3).
In this case, the hydraulic conductivity according to a previous study, “hydraulic conductivity of artificial aquifer recharge attenuated with time power function and was smaller than the hydraulic conductivity of pumping. When the quantity of water recharge per unit time was smaller, the attenuation of hydraulic conductivity was slower [23]”. The possibility of change in hydraulic conductivity exists in artificial recharge areas depending on the characteristics of alluvial layers, injection cycle, interval, and clogging occurrence. This research facility was installed in December 2021 and is currently under trial operation, so it is necessary to derive the characteristics of this change in the operation process over the next few years.
Under the condition that artificial groundwater recharge cannot be carried out, the water intake of the horizontal well was estimated to be approximately 535 m3·d−1. However, when artificial recharge and underground walls are applied, they could cause an additional drop in water level by approximately 30 cm (average of water level rises for BH-4 and BH-6), thereby resulting in a total water level drop of 3.3 m; the water intake of the horizontal collector well at this time becomes approximately 588 m3·d−1. Furthermore, in the case of artificial recharge and re-injection through underground walls and agricultural land, a total water level drop of 3.31 m is possible, and a water intake of 590 m3·d−1 is secured.
In Table 3, the methods by Babac and Babac (2009) need an assumption that nearby stream level should be constant and water is continuously supplied from the stream. However, the actual stream level in the study area decreases in the dry season and this assumption is not satisfied. The step-drawdown pumping test with 7 steps at the collector well has been done for 700 min before artificial recharge and has shown that the safe yield is approximately 345 m3·d−1. However, long-term artificial recharge produced an increase in stream discharge as well as groundwater level, thereby satisfying the above assumption.
This volume would likely be sufficient to meet the daily demand of 512 m3·d−1 in May, and could completely overcome the existing facilities’ shortfall (208 m3·d−1) (see Table 1). Although recharging the supplied water did not lead to a sharp increase in the amount of withdrawn water, it helped to stabilize the water supply by maintaining the increased groundwater level; this effect was also boosted by the installation of the barrier.
4. Discussion
Artificial groundwater recharge is a method of storing water in the subsurface for use later when necessary; this approach can be implemented in dry areas. Korea has an average annual rainfall of ~1300 mm, and hence is not at risk of a water crisis in terms of its total water resources. However, some upstream watersheds that are not properly equipped with water supply systems, such as the present study area, can suffer water shortages during the dry, busy farming season. As water shortages in such areas result in a water shortfall, it is necessary to develop a solution.
As upstream watersheds have rapid discharge regarding both surface water and groundwater, a solution should be introduced to minimize the escape of water outside of the watershed. In the research area, a hybrid-type artificial recharge and circulation system for groundwater, differs from conventional artificial recharge systems, was applied. The applied system increased the total amount of water resources by 1.5 fold compared to before recharge. In addition, it supplied a more stable water supply by releasing water from horizontal wells installed at the lower zone of the stream bed.
The depth at which water is collected from the pretreatment system is essential; here, no stream water was released during the severe dry period, and the base flow, was instead supplied from the bottom of the stream. Therefore, a deeper water collection system was required based on the depth of the alluvial layer at the bottom of the stream. Thus, more water could be collected, leading to a higher water injection volume. As injected water rapidly flowed downstream due to the slope of the ground, it was also important to determine the right location for the collector well. By locating the horizontal pipe where the injected groundwater accumulates (thereby raising the water level) and at the lower zone of the stream bed, more water could be supplied due to the drop in the water level that occurred during pumping.
In general, groundwater dams store groundwater through the construction of underground barriers in flat areas. However, in areas with gentle slopes, such as the study site, it is difficult for an underground barrier to serve as an efficient groundwater dam. Therefore, if a groundwater dam is installed on a slope where groundwater is released relatively quickly, it is hard to secure a sufficient amount of groundwater, as the storage volume upstream of the dam will likely not be significant. Therefore, it will be necessary to minimize water loss downstream by combining artificial groundwater recharge with the construction of underground barrier. It will be also necessary to ensure that the supplied water is re-injected into the recharge basin to achieve a sustainable water supply.
5. Conclusions
In this study, on-site experiments and numerical modeling were employed to explore the effects of an artificial groundwater recharge system using an underground barrier to secure water in a small basin upstream within a watershed that experiences frequent droughts. The water demand in May in the study area was significant (512 m3·d−1); hence, various techniques could be used to secure water sources, such as constructing a reservoir, obtaining a water supply from outside the watershed, and drilling wells into the bedrock. However, these solutions were not realistic for the study area due to their expensive costs and the insufficient groundwater yield from the bedrock. As such, introducing an artificial recharge system, combined with underground barrier, could solve water shortages within the watershed; this approach can store more water in the alluvial layer and allow more water to re-drain into the river in a small basin. Therefore, the total quantity of water within the basin increases while water loss is minimized, which indicates direct rapid surface runoff out of the basin. This system can be effective upstream where conventional supply methods such as reservoirs cannot be introduced. In the future, if an artificial recharge and water pumping scenario is constructed in consideration of a drought period, whether water can be secured within the basin itself can be assessed.
As water discharged into the river will quickly flow out of the basin (if it is not interrupted), it can be regarded as water loss. Accordingly, a plan should be developed to minimize or utilize water loss. Using the streamflow and base flow in the dry season as a source of artificial recharge and storing them in the aquifer can delay discharge out of the basin. Installing underground barrier at the outlet of the basin to increase retention capacity can also help to stabilize the water supply. In this study, introducing a barrier and artificial recharge in the target area at the same time enabled ~590 m3·d−1 of water withdrawal from the collector well, which could help to solve existing water shortage problems.
In the Korean peninsula, where faults and joints have developed as a result of several tectonic movements, the sediment layer and weathered zone are both relatively well developed in small upstream basins along these structures. Therefore, once the water retention capacity of the permeable strata has been identified through geological investigations, hybrid-type systems for the artificial recharge and circulation of groundwater could likely be applied in many areas to solve water shortage problems. Water shortages in mid-latitude regions are generally caused by a temporary imbalance between water supply and demand, unlike those in dry desert areas. Therefore, an effective solution would be to not only to build a reservoir, but also implement a system that secures water within the basin through artificial recharge.
Author Contributions
Conceptualization, G.-B.K.; writing—review and editing, M.-R.C. and G.-B.K.; resources and data curation, M.-R.C. and G.-B.K.; visualization, M.-R.C.; supervision, G.-B.K.; funding acquisition, G.-B.K. All authors have read and agreed to the published version of the manuscript.
Funding
This research was funded by the Korea Ministry of the Environment (MOE) and the Korea Environmental Industry & Technology Institute (KEITI) through the “Demand Responsive Water Supply Service Program (#146523)”.
Data Availability Statement
Not applicable.
Conflicts of Interest
The authors declare no conflict of interest.
References
- Shah, T. Climate change and groundwater: India’s opportunities for mitigation and adaptation. Environ. Res. Lett. 2009, 4, 035005. [Google Scholar] [CrossRef]
- Margat, J.; Gun, J. Groundwater around the World: A Geographic Synopsis; CRC Press/Balkema: Rotterdam, The Netherlands, 2013; p. 341. [Google Scholar]
- Ministry of Environment. 2021 Groundwater Annual Report; Ministry of Environment: Sejong, Korea, 2021; p. 389.
- Bouwer, H.; Back, J.T.; Oliver, J.M. Predicting infiltration and ground-water mounds for artificial recharge. J. Hydrol. Eng. 1999, 4, 350–357. [Google Scholar] [CrossRef]
- Gale, I.; Neumann, I.; Calow, R.; Moench, M. The Effectiveness of Artificial Recharge of Groundwater: A Review; British Geological Survey: Nottingham, UK, 2002; p. 60. [Google Scholar]
- Taheri, A.; Zare, M. Groundwater artificial recharge assessment in Kangavar Basin, a semi-arid region in the western part of Iran. Afr. J. Agric. Res. 2011, 6, 4370–4384. [Google Scholar]
- Alrehaili, A.M.; Tahir Hussein, M. Use of remote sensing, GIS and groundwater monitoring to estimate artificial groundwater recharge in Riyadh, Saudi Arabia. Arab. J. Geosci. 2012, 5, 1367–1377. [Google Scholar] [CrossRef]
- Ahirwar, S.; Malik, M.S.; Ahirwar, R.; Shukla, J.P. Identification of suitable sites and structures for artificial groundwater recharge for sustainable groundwater resource development and management. Groundw. Sustain. Dev. 2020, 11, 100388. [Google Scholar] [CrossRef]
- Abraham, M.; Priyadarshini; Manikannan, K. Numerical modeling for groundwater recharge. In Groundwater Resources Development and Planning in the Semi-Arid Region; Pande, C.B., Moharir, K.N., Eds.; Springer: Cham, Switzerland, 2021; pp. 165–177. [Google Scholar]
- Hassan, W.H.; Nile, B.K.; Mahdi, K.; Wesseling, J.; Ritsema, C. A Feasibility Assessment of Potential Artificial Recharge for Increasing Agricultural Areas in the Kerbala Desert in Iraq Using Numerical Groundwater Modeling. Water 2021, 13, 3167. [Google Scholar]
- Tao, Z.C.; Cui, Z.N.; Yu, J.Q.; Khayatnezhad, M. Finite Difference Modelings of Groundwater Flow for Constructing Artificial Recharge Structures. Iran. J. Sci. Technol. Trans. Civ. Eng. 2022, 46, 1503–1514. [Google Scholar] [CrossRef]
- Abraham, M.; Mohan, S. Effectiveness of artificial recharge structures in enhancing groundwater storage: A case study. Indian J. Sci. Technol. 2015, 8, 1–10. [Google Scholar]
- Chitsazan, M.; Movahedian, A. Evaluation of artificial recharge on groundwater using MODFLOW model (case study: Gotvand plain-Iran). J. Geosci. Environ. Prot. 2015, 3, 122–132. [Google Scholar] [CrossRef] [Green Version]
- Shi, X.; Jiang, S.; Xu, H.; Jiang, F.; He, Z.; Wu, J. The effects of artificial recharge of groundwater on controlling land subsidence and its influence on groundwater quality and aquifer energy storage in Shanghai, China. Environ. Earth Sci. 2016, 75, 195. [Google Scholar] [CrossRef]
- Akhter, S.; Hossain, S. Groundwater modeling of Dhaka city and surrounding areas and evaluation of the effect of artificial recharge to aquifers. World J. Res. Rev. 2017, 5, 54–60. [Google Scholar]
- Sashikkumar, M.C.; Selvam, S.; Kalyanasundaram, V.L.; Johnny, J.C. GIS based groundwater modeling study to assess the effect of artificial recharge: A case study from Kodaganar river basin, Dindigul district. Tamil Nadu. J. Geol. Soc. India 2017, 89, 57–64. [Google Scholar] [CrossRef]
- Xu, Y.; Shu, L.; Zhang, Y.; Wu, P.; Eshete, A.A.; Mabedi, E.C. Physical experiment and numerical simulation of the artificial recharge effect on groundwater reservoir. Water 2017, 9, 908. [Google Scholar] [CrossRef] [Green Version]
- Mohammadzadeh-Habili, J.; Khalili, D. Assessment of artificial recharge dams and improvement of their groundwater-recharge capacity. J. Hydrol. Eng. 2020, 25, 04020011. [Google Scholar] [CrossRef]
- Kim, G.B.; Hwang, C.I.; Choi, M.R. Assessment of the need and potential for groundwater artificial recharge based on the water supply, water demand, and aquifer properties in a water shortage region of South Korea. Environ. Earth Sci. 2021, 80, 115. [Google Scholar] [CrossRef]
- Kim, G.B.; Hwang, C.I.; Shin, H.J.; Choi, M.R. Applicability of groundwater recharge rate estimation method based on artificial neural networks in unmeasured area. J. Geol. Soc. Korea 2019, 55, 693–701. [Google Scholar] [CrossRef]
- Hunt, R.; Feinstein, D. MODFLOW-NTW: Robust handling of dry cells using a Newton formulation of MODFLOW-2005. Ground Water 2012, 50, 659–663. [Google Scholar] [CrossRef]
- Babac, D.; Babac, P. Wells with horizontal drains. In Theory, Practice, Calculation Examples; Balby International: Belgrade, Serbia, 2009; p. 530. [Google Scholar]
- Dong, Y.; Zhao, P.; Zhou, W. Effect of artificial aquifer recharge on hydraulic conductivity using single injection well. In Proceedings of the 2011 International Symposium on Water Resource and Environmental Protection (ISWREP2011), Xi’an, China, 20–22 May 2011; pp. 2115–2117. [Google Scholar]
Figure 1.
(a) Location of the study area and (b) geologic cross section along A–A’ [19].
Figure 1.
(a) Location of the study area and (b) geologic cross section along A–A’ [19].

Figure 2.
(a) Location of hybrid-type artificial recharge system in the study area. (b) pretreatment system of stream water. (c) the combined artificial recharge structure of ditch and multiple wells and (d) collector well: a caisson with two horizontal wells.
Figure 2.
(a) Location of hybrid-type artificial recharge system in the study area. (b) pretreatment system of stream water. (c) the combined artificial recharge structure of ditch and multiple wells and (d) collector well: a caisson with two horizontal wells.

Figure 3.
(a) Groundwater injection rate along recharge lines and (b) groundwater level at the monitoring wells during artificial recharge period.
Figure 3.
(a) Groundwater injection rate along recharge lines and (b) groundwater level at the monitoring wells during artificial recharge period.

Figure 4.
Steady-state model construction and calibration result: (a) grid composition of the model, (b) stream and wells, (c) distribution of hydraulic conductivity and (d) comparison between actual and predicted groundwater levels.
Figure 4.
Steady-state model construction and calibration result: (a) grid composition of the model, (b) stream and wells, (c) distribution of hydraulic conductivity and (d) comparison between actual and predicted groundwater levels.

Figure 5.
Comparison of actual and predicted groundwater levels after artificial recharge.

Figure 6.
Result of water budget of three cases for the artificial recharge basin by using a numerical model: steady-state condition without artificial recharge, after 45 days recharge without underground barrier, after 45 days recharge with underground barrier, and after 45 days recharge with underground barrier and reinjection: (a) outflow rate, (b) inflow rate.

Figure 7.
Prediction of groundwater level rise at two monitoring wells after artificial recharge: (a) BH-1, (b) BH-2.
Figure 7.
Prediction of groundwater level rise at two monitoring wells after artificial recharge: (a) BH-1, (b) BH-2.


Table 1.
Analysis of water shortage from January to June in the study area (modified from [19]).
Table 1.
Analysis of water shortage from January to June in the study area (modified from [19]).
| Period | Main Demand Period and Dry Season (m3/Month) | Total (m3/6 Month) | ||||||
|---|---|---|---|---|---|---|---|---|
| Month | 1 | 2 | 3 | 4 | 5 | 6 | ||
| Demand analysis | Water demand | 527 | 476 | 527 | 1690 | 9857 | 37,665 | 50,742 |
| (a) Domestic | 527 | 476 | 527 | 510 | 527 | 510 | 3077 | |
| (b) Rice farming | 0 | 0 | 0 | 1150 | 8480 | 33,920 | 43,550 | |
| (c) Dry field farming | 0 | 0 | 0 | 30 | 850 | 3235 | 4115 | |
| Maximum water demand 1 | 527 | 476 | 527 | 2010 | 14,427 | 51,110 | 69,077 | |
| (a) Domestic | 527 | 476 | 527 | 510 | 527 | 510 | 3077 | |
| (b) Rice farming | 0 | 0 | 0 | 1300 | 11,200 | 41,000 | 53,500 | |
| (c) Dry field farming | 0 | 0 | 0 | 200 | 2700 | 9600 | 12,500 | |
| Maximum demand with safety factor 2 | 580 | 524 | 580 | 2211 | 15,870 | 56,221 | 75,985 | |
| Supply analysis | Present water supply capability of wells | 572 | 445 | 428 | 5184 | 9423 | 8842 | 24,894 |
| (a) Domestic wells | 572 | 445 | 428 | 410 | 480 | 538 | 2873 | |
| (b) Agricultural wells | - | - | - | 4774 | 8944 | 8304 | 22,021 | |
| Shortage analysis 3 | −7 | −79 | −152 | 2973 | −6446 | −47,379 | −51,090 | |
1 The maximum water demand is the maximum value of the monthly demand for each purpose from 2007 to 2016; 2 a safety factor of 10% is applied; and 3 shortage = maximum demand with the safety factor—present water supply capability of wells.
Table 2.
Prediction of groundwater level rise due to artificial recharge and underground barrier by using a numerical model.
Table 2.
Prediction of groundwater level rise due to artificial recharge and underground barrier by using a numerical model.
| Water Level Rise (m) | HW | BH-6 | BH-4 | BH-3 | BH-2 | BH-1 |
|---|---|---|---|---|---|---|
| Artificial recharge | 0.021 | 0.283 | 0.214 | 0.042 | 0.023 | 0.059 |
| Artificial recharge with underground barrier | 0.033 | 0.358 | 0.246 | 0.044 | 0.043 | 0.133 |
| Artificial recharge and re-injection with underground barrier | 0.035 | 0.363 | 0.253 | 0.049 | 0.052 | 0.144 |
Table 3.
Result of yield estimation at the horizontal collector well by Babac and Babac (2009) and pumping test.
Table 3.
Result of yield estimation at the horizontal collector well by Babac and Babac (2009) and pumping test.
| Condition | k (m·d−1) | Ta (m) | b (m) | n | L (m) | Re (m) | Drawdown (m) | Yield Estimation (m3·d−1) | Method |
|---|---|---|---|---|---|---|---|---|---|
| Before recharge | 2.1 | 345 | Step-drawdown pumping test | ||||||
| 2.53 | 12 | 20 | 2 | 51 | 13.72 | 3 | 535 | Babac and Babac, 2009 [22] | |
| After artificial recharge with underground barrier | 2.53 | 12 | 20 | 2 | 51 | 13.72 | 3.3 | 588 | |
| After artificial recharge with underground barrier and reinjection | 2.53 | 12 | 20 | 2 | 51 | 13.72 | 3.31 | 590 |
Publisher’s Note: MDPI stays neutral with regard to jurisdictional claims in published maps and institutional affiliations. |
© 2022 by the authors. Licensee MDPI, Basel, Switzerland. This article is an open access article distributed under the terms and conditions of the Creative Commons Attribution (CC BY) license (https://creativecommons.org/licenses/by/4.0/).
Share and Cite
MDPI and ACS Style
Choi, M.-R.; Kim, G.-B. Effects of Hybrid-Type Artificial Groundwater Recharge and Underground Barrier in a Small Basin. Water 2022, 14, 1849. https://doi.org/10.3390/w14121849
AMA Style
Choi M-R, Kim G-B. Effects of Hybrid-Type Artificial Groundwater Recharge and Underground Barrier in a Small Basin. Water. 2022; 14(12):1849. https://doi.org/10.3390/w14121849
Chicago/Turabian StyleChoi, Myoung-Rak, and Gyoo-Bum Kim. 2022. "Effects of Hybrid-Type Artificial Groundwater Recharge and Underground Barrier in a Small Basin" Water 14, no. 12: 1849. https://doi.org/10.3390/w14121849
Note that from the first issue of 2016, this journal uses article numbers instead of page numbers. See further details here.